Page 1
SYSTEM FOR MEASURING AND LOGGING ELECTROMAGNETIC FREQUENCY SPECTRA WITH SOFTWARE DEFINED RADIOJulius Petersson
Department of Signals and Systems
Chalmers University of Technology
Gothenburg, Sweden 2016
Page 2
System for measuring and logging electromagnetic frequency spectra with software defined radio
© JULIUS PETERSSON, 2016
Department of Signals and Systems
Chalmers University of Technology
SE-412 96 Göteborg
Sweden
+46 (0)31-772 1000
All Illustrations are made by Julius Petersson
Screenshots from the GNU Radio Companion are distributed under the terms of the GNU General
Public License
Department of Signals and Systems
Göteborg, Sweden
Page 3
Acknowledgements
This degree project was completed in cooperation with Chalmers, Altran and Volvo PV. I would like
to thank and express my gratitude to the people who supported me during the project.
Special thanks goes to:
• Kimmo Luomala at Altran for being my advisor and contact person at Volvo PV and
supplying me with the idea of the project, hardware and technical support.
• Björn Bergqvist, Johnny Larsson and Leif Kindberg at Volvo PV for technical support and
bringing me with them on the IEEE EMCS symposium at FOI.
• Göran Hult for being my advisor at Chalmers.
• Manne Stenberg at Chalmers for being my examiner.
• The GNU Radio team for developing and distributing the open source software used in the
project.
Page 4
Abstract
Electromagnetic compatibility is an ever growing field due to the increasing integration and
reliance on electronics and wireless communication. Today, almost no band in the frequency
spectrum is unoccupied and there is a need to measure the characteristics of the spectrum in the
real world to be able to specify, design and test new electrical systems in a relevant way.
In this project we explore the usage of software defined radio as an inexpensive mobile logging
electromagnetic spectrum analyzer and its application against unintentional and deliberate
electromagnetic interference in a wide frequency band from DC to 6 GHz. The deployed system is
based on a universal software radio peripheral from Ettus Research and a small general purpose
computer with wireless transmission of spectrum data over WAN and battery backup for complete,
stand alone, operation.
Keywords: Software defined radio, Electromagnetic Compatibility, Spectrum Analysis, GNU Radio
Page 5
Table of contents
1 Introduction....................................................................................................................................................................... 1
1.1 Background................................................................................................................................................................. 1
1.2 Purpose....................................................................................................................................................................... 1
1.3 Limitations...................................................................................................................................................................2
1.4 Definitions................................................................................................................................................................... 2
2 Electromagnetic compatibility........................................................................................................................................... 3
2.1 Electromagnetic interference......................................................................................................................................3
2.2 Automotive EMC......................................................................................................................................................... 4
2.3 Antennas..................................................................................................................................................................... 5
3 Software defined radio...................................................................................................................................................... 6
3.1 Hardware.....................................................................................................................................................................6
3.2 GNU Radio...................................................................................................................................................................8
3.3 Spectrum analysis..................................................................................................................................................... 11
3.4 Measuring the electric field...................................................................................................................................... 12
4 Method............................................................................................................................................................................ 13
4.1 Software stack setup................................................................................................................................................. 13
4.2 Frequency analysis with GNU Radio......................................................................................................................... 13
4.3 Custom spectrum sink block..................................................................................................................................... 14
4.4 Verification, calibration and testing.......................................................................................................................... 16
4.5 Data analysis..............................................................................................................................................................16
5 Results..............................................................................................................................................................................17
5.1 Calibration................................................................................................................................................................. 17
5.2 Spectrum characterisation........................................................................................................................................ 18
5.3 Power consumption.................................................................................................................................................. 20
5.4 Field test....................................................................................................................................................................20
6 Discussion and conclusions..............................................................................................................................................22
7 Future development........................................................................................................................................................ 23
7.1 New hardware...........................................................................................................................................................23
8 References....................................................................................................................................................................... 24
9 Appendix.......................................................................................................................................................................... 25
9.1 Source code for the custom data sink in GNU Radio................................................................................................ 25
9.2 Excerpt of code to render maps with OpenStreetMap and ggplot2 in R................................................................. 27
Page 6
1 Introduction
1.1 Background
Software defined radio has created an opportunity to rapidly develop and deploy reconfigurable
measurement systems for engineers. Instead of having a few expensive systems that has to be
shared between multiple engineers in an organization each engineer can have a universal software
radio peripheral and reconfigure the system as needed. These tools can include comb generators,
spectrum analyzers, digital radio simulators and more.
Due to the modular nature of the SDR stack, the tools can be upgraded with new RF front ends as
they develop with minimal changes in software.
In automotive EMC testing, these tools are getting more and more interesting as the need for field
testing increases with harsher regulations and increasing integration of electronics in the vehicle
and its surroundings.
1.2 Purpose
The purpose of the project is to design and implement a reasonably accurate inexpensive mobile
logging spectrum analyzer with software defined radio for use in EMC testing and generate graphs
and maps for data analysis. The system should have the following features:
1.2.1 Frequency range
The system should be able to handle arbitrarily wide spectrums from DC to 6 GHz.
1.2.2 Logging over time
Logging electromagnetic spectra over time will, for example, allow the engineer to measure
changes over the course of a day to compare the signal power when societal activities change such
as people being at work, or using less electronics during night.
1.2.3 Logging over space
Log and analyze how the signal power changes in different environments and ranges from external
signal sources. This can be used to, for example, specify reception testing cases in the development
of radio receivers.
Page 1
Page 7
1.3 Limitations
The project is limited to analyzing and logging static broadcasts and other signals that are present
during an extended period of time.
1.4 Definitions
• ADC – Analog to Digital Converter
• EMC – Electromagnetic Compatibility
• EMI – Electromagnetic Interference
• FFT – Fast Fourier Transform
• GPS – Global Positioning System
• RF – Radio Frequency
• RX - Receive
• IF – Intermediate Frequency
• LO – Local Oscillator
• SDR – Software Defined Radio
• TX - Transmit
• USRP – Universal Software Radio Peripheral
Page 2
Page 8
2 Electromagnetic compatibility
The increasingly prevalent use of electronics in our society has made it necessary to take
precautions to ensure the continued operation of circuits and systems in a shared environment.
Modern electronics, with smaller circuits operating at higher frequencies and with tighter
tolerances leading to a higher susceptibility to noise has made electromagnetic compatibility an
important sector in the development of electrical systems.
“Electromagnetic compatibility (EMC) is the ability of an electronic system to (1) function
properly in its intended electromagnetic environment and (2) not be a source of pollution to
that electromagnetic environment“[1]
EMC is a heavily regulated field and products placed on the market or taken in service must be
certified to comply with current limitations on electromagnetic susceptibility and emission. In the
European Union, EMC is currently regulated under Directive 2014/30/EU (EMC Directive).
The tools used to measure electromagnetic fields are generally expensive and not suitable for non-
attended use or high volume field measurements. To solve this problem, engineers are looking into
using inexpensive reconfigurable software defined radios to create measuring systems that can be
used and deployed in environments otherwise limited. The deployment of such systems would
increase the amount of real world data on electromagnetic radiation and could help with the
objectification of new standards and emission requirements.
2.1 Electromagnetic interference
Electromagnetic interference (EMI) is the disruptive transmission of electromagnetic energy
between electric components or systems due to radiative and/or conductive coupling. EMI can
lead to the degradation of performance or even complete failure of components and is therefore
important to take into consideration when designing electronic systems.
There are numerous of counter measures applied against EMI. Conductive EMI can be mitigated by
proper grounding, filters and/or ferrites, while shielding is used to protect against radiative
interference.
Page 3
Page 9
2.2 Automotive EMC
As in most industries, more and more electronics are integrated in automotive solutions as
technology and governmental regulations advance. Tighter regulations of fuel efficiency has lead to
automakers increasing the use of electronic engine controls to reduce fuel consumption and higher
demand of infotainment systems by customers are both examples of systems that increase the
emission and susceptibility of electromagnetic radiation. Other sources of EMI in an automotive
setting include cell phone towers, broadcast signals, RADAR systems and high current electric
propulsion. Vehicle electronics must be designed for high reliability. Low cost, long development
times and high volumes mean that EMI has to be considered as early as possible in the design
process[2].
Page 4
Page 10
2.3 Antennas
The antenna is the main tool used in practical EMC testing. Antennas used in EMC are designed
with high bandwidth as the primary parameter. Gain and voltage standing wave ratio, important in
telecommunication, are of secondary importance. Biconical antennas are example of an antenna
type which is used in EMC testing.
2.3.1 Antenna factor
The goal with EMC testing is to measure the absolute electric field present at the antenna. The
antenna factor is a parameter associated with the antenna used to correlate the voltage level at
the antenna terminals to the electric field and is expressed as
where
AF = antenna factor [m-1]
E = electric field at the antenna [V/m]
V = voltage at antenna terminals [V]
The antenna factor can be derived as a function of the antenna’s gain and is therefore highly
dependent on the frequency of the electric field.[3]
Figure 1: Antenna factor for Schwarzbeck SBA 9113
Page 5
05
1015202530354045
Swarzbeck SBA 9113
Frequency (Hz)
AF
(d
B/m
)
Page 11
3 Software defined radio
Software defined radio (SDR) is an overarching term for communication systems where large parts
are implemented in software digital signal processing instead of hardware components. The
technology has been enabled by the rapid development in analog-to-digital converters and
processing power. SDR has the advantage that a single general purpose radio can be used for
multiple tasks and have the application specific implementation defined in software which is easier
to develop and maintain.
A common SDR system is comprised of a RF front end, an analog-to-digital converter, a bus
interface such as USB and a software stack running on a general purpose computer.
3.1 Hardware
The general concept of the SDR hardware is to translate the voltage signal on the antenna
terminals between the analog and the digital domains. The theoretical implementation would
simply be an analog-to-digital converter (ADC) for receiving and a digital-to-analog converter (DAC)
for transmitting. In reality however, the hardware is limited by a number of parameters such as the
sampling rate of the converters, the bandwidth of the serial bus delivering the data to the
computer and the low input voltage of the signal.
Figure 2: Direct-conversion transceiver block diagram
Page 6
90°
Q
I
RX LO
ADC
ADC
90°
Q
I
TX LO
DAC
DAC
Dat
a in
terf
ace
RX
TX
Page 12
Modern telecommunications span the frequencies from a couple of kHz up to several GHz, way
beyond what inexpensive converters handle. To work around this, most SDR hardware use a
variable-frequency oscillator, mixers and filters to tune the signal to a specific baseband. The
drawback of this solution is that the SDR is limited to look at only one, comparatively narrow,
frequency range at the same time. Transceivers with a high frequency range needed in software
defined radio are often based on direct-conversion instead of a superheterodyne design. The
direct-conversion transceiver directly converts the RF signal from and to the DC baseband directly,
skipping the extra step where a superheterodyne transceiver would convert the signal to an
intermediate frequency. Direct-conversion has several advantages in a SDR context. Problems with
image rejection inherent in a superheterodyne design are not present with direct conversion. This
means that the complexity of the analog circuitry is reduced and can more easily be designed for a
large range of frequencies. The main problems with direct-conversion is leakage of the local
oscillator to the DC-bin and phase mismatch between the I and Q path which leads to a faulty
representation of the spectrum[4].
3.1.1 Ettus research B210 USRP
The RF harware used in the project is a B210 USRP from Ettus research is based on the Analog
Devices AD9361 RFIC. The chip is originally designed for use in 3G and 4G base stations[5]. Ettus
distributes drivers which include a USRP Source signal block as an interface between the hardware
and GNU Radio’s flow graph.
Table 1: Parameters for the Ettus research B210
IF bandwidth 56 MHz
RF frequency range 70 MHz to 6 GHz
Page 7
Page 13
3.2 GNU Radio
GNU Radio is an open source software framework for software defined radio development on
general purpose computers. The system is based on the data flow programming paradigm with
individual standard processing blocks which can be used to implement radio transmission and
reception. The signal processing flow graphs can be defined with the included GNU Radio
Companion, a visual environment useful for rapid prototyping, or included as a library in
programming languages such as Python, Ruby or C. Regardless of chosen method of
implementation, the flow graph is run as highly optimized native threads directly on the hardware
and is independent of the performance of the language it self.
GNU Radio is distributed with a large library of signal processing block which are sufficient to
develop most radio applications and are built on a stable and peer reviewed codebase. The library
is also easily expandable with custom blocks written in Python or C if extra functionality is needed.
3.2.1 Flow graph and blocks
A flow graph is a mathematical directional graph in which data flows between nodes connected by
an ordered set of vertices. In GNU Radio, these nodes are called blocks. The blocks are connected
to each other by different kinds of ports. Blocks with only output ports or only input ports are
called sources and sinks respectively and are often used as an interface between hardware and the
rest of the signal chain or synthesized signals.
Figure 3: Simple flow graph in GNU Radio Companion which generates a 440 Hz sine wave and
emits the signal with an audio sink.
Page 8
Page 14
3.2.2 Custom blocks
To enable the expansion of GNU Radio functionality the system is shipped with an API to use
general purpose programming languages such as Python to define custom blocks. In Python the
blocks are constructed as a single class extending one of GNU Radio’s block types. The block type is
needed for the scheduler to know how the number of consumed and emitted samples relate to
each other.
• Synchronous (1:1) – . The block emit exactly one item for each consumed item.
• Decimation (N:1) – The block consumes a fixed number of items for each emitted item.
• Interpolation (1:N) – The block outputs a fixed number of items for each consumed item.
• General/Basic (M:M) – No relation between input and output.
To define a Synchronous block that multiplies the consumed item with a constant value, one could write
class multiply_py_ff(gr.sync_block):
"""
This block multiplies incoming items with a constant multiple
"""
The class constructor defines the input and output signature of the block as well as handling the
definition of parameters. In this case, the block has two 32-bit float ports, one for input and one
for output and a parameter for the multiplier.
def __init__(self, multiple):
gr.sync_block.__init__(self,
name = "multiply_py_ff",
in_sig = [numpy.float32],
out_sig = [numpy.float32])
self.multiple = multiple
Page 9
Page 15
Lastly a work function is defined, this is the function which GNU Radio calls when a prepending
block has items for the block to consume or if a succeeding block need the block to emit items. The
input_items parameter is a reference to a multidimensional list containing a number of items to
be consumed by the block grouped by input port. The output_items parameter is a reference to
the list where the emitted items should be placed. The body of the function handle the signal
processing, in this case a simple multiplication between the consumed item and the multiplier.
Lastly the function is expected to return the number of items consumed to tell the scheduler how
much data has been processed this function call.
def work(self, input_items, output_items):
in0 = input_items[0]
out = output_items[0]
out[:] = in0*self.multiple
return len(output_items[0])
Custom blocks can also be used to wrap flow graphs in a single block, this is called a hierarchical
block[6].
Page 10
Page 16
3.2.3 Stream tags and message passing
While the main data stream is great for ensuring that samples and bits are processed correctly it
has a limited capacity to send control and meta data. In addition to the main data stream GNU
Radio therefore has implemented two mechanisms to send messages and tags between blocks.
Messages are asynchronous data used to broadcast information from a block to the entire flow
graph, but are not guaranteed to arrive with a specific sample or a specific time.
Stream tags are synchronous with and sent parallel to the main data stream. Tags are a good way
to send meta data on specific samples. For example, the UHD source block generate tags that
inform other blocks on the time, sample rate and frequency at the time of sampling. Tags can be
read in the work function of a custom block. In this case a the frequency of the sample emitted by
the USRP Source Block is read[7].
nread = self.nitems_read(0)
tags = self.get_tags_in_range(0, nread, nread + len(input_items[0]))
for tag in tags:
if (pmt.symbol_to_string(tag.key) == "rx_freq"):
rx_freq = pmt.to_double(tag.value)
3.3 Spectrum analysis
Spectrum analysis is the measurement of the magnitude of an input signal versus the frequency of
said signal. The technique is based on the fact that an arbitrary signal can be represented as a
series of sinusoids as shown by Joseph Fourier in 1822.
A spectrum analyzer can be implemented in a number of ways.
A swept-tuned frequency analyzer down-converts a part of the signal to the center frequency of a
narrow band-pass filter by sweeping the local oscillator over a selected frequency range. The signal
amplitude over the filter would then correspond to the amplitude of the signal at the current
oscillator frequency. The down side of this technique is that well defined analog filters are hard
and expensive to construct.
A FFT-based frequency analyzer uses a digital-to-analog converter and the Fast Fourier Transform
to calculate the frequency components of the signals numerically. The FFT-based frequency
analyzer is limited by the sample rate of the digital-to-analog converter.
Page 11
Page 17
A Hybrid-FFT combines the two techniques using a local oscillator to down-convert a baseband to
a lower intermediate frequency and then converting the signal to the digital domain for frequency
analysis with an FFT. This has the frequency range advantage of the swept-tuned analyzer but at
the same time being able to exploit the advantages of digital filtering.[8]
3.3.1 Fast Fourier Transform
The Discreet Fourier Transform is the numerical analogy of the continuous Fourier Transform. The
transform allow machines that work with time- and band-limited signals, such as computers, to
compute the corresponding frequency components of a given signal. The DFT is an incredibly
important algorithm and has been called “the most important numerical algorithm of our lifetime".
The DFT algorithm computes the frequency component for a single frequency. For large number of
samples N the naive implementation of calculating each component by itself and adding them
together. By utilizing the technique of divide and conquer and splitting up the samples into two
groups recursively the complexity can be shown to be reduced significally This reduction of
complexity is called the Cooley–Tukey FFT algorithm and is the most common implementation of
the Fast Fourier Transform.
To improve the signal-amplitude-to-noise ratio of the analyzed spectrum, it is useful to average
multiple Fourier transforms with a technique called incoherent averaging. The averaging is to be
performed on the magnitude of the spectrum, after the phase information has been removed. This
is necessary because the time of sampling is not synchronized with the incoming signal and phase
differences would alter the averaged spectrum[9].
3.4 Measuring the electric field
What differs EMC measurements from telecommunication is the interest in the absolute value of
the electromagnetic field. The data provided to the software by the USRP is unit-less and not
calibrated against an absolute value at the RF input. The attenuation and linearity of the peripheral
is not defined for neither the RF part nor the IF part of the board. The raw data is therefore
unsuitable to use directly as a measurement of the electric field and data needs to be externally
calibrated.
Page 12
Page 18
4 Method
The goal of the project is to implement a Hybrid-FFT spectrum analyzer with SDR hardware and
GNU Radio and evaluate the precision and viability of its usage in EMC testing.
4.1 Software stack setup
4.1.1 GNU Radio
GNU Radio is available and kept up to date in the standard Ubuntu Linux software distribution.
Ubuntu has a built in package manager and the software can be installed with a simple command
run as the “root”-user in the shell.
# apt-get install gnuradio
4.1.2 USRP Drivers
The drivers for the USRP are available from the Ubuntu repositories but are in active development
and not kept up to date with upstream sources. It is recommended to install the drivers from Ettus
own repository that can be included as a Personal Package Archive (PPA) in Ubuntu.
# add-apt-repository ppa:ettusresearch/uhd# apt-get update# apt-get install libuhd-dev libuhd003 uhd-host
4.2 Frequency analysis with GNU Radio
The signal processing is implemented with GNU Radio’s flow graph to ensure high bandwidth and
signal integrity. The signal chain is comprised of the UHD drivers usrp_source block which emit
samples from the SDR hardware connected to the logpwrfft_c block which calculates the
logarithmic power FFT of the signal. The resulting spectrum data is the connected to a custom sink
block which perform data logging and control the frequency of the local oscillator.
Figure 4: Flow chart for signal propagation
Page 13
Page 19
4.3 Custom spectrum sink block
To implement a Hybrid-FFT spectrum analyzer it is necessary to change the tuning frequency of the
USRP after a sufficient number of spectrum frames have been sampled. A custom sink block is
needed to implement this functionality.
The block is instantiated with the configured frequency ranges which is to be logged, how often
the spectra should be logged, how they should be averaged and in how the spectrum should be
compensated to ensure absolute calibration. During capturing, the block is keeping track of which
frequencies that should be logged and in what order.
The work function is called whenever the scheduler has new spectra for the sink to consume.
When a new spectrum is delivered from the logpwrfft_c block, the sink checks the rx_freq tag
delivered in parallel to the spectrum if it corresponds with what the sink expects. If the frequency
differs, the sink sends a request to change the frequency of the USRP with a priority queue to the
main program.
If the RX frequency is correct then the sink keep the spectra in a buffer for averaging. When the
averaging is done, the sink adds the specified precalculated calibration spectrum and retunes to
the next spectrum in the range.
When all spectra in the range are done, the buffer is copied and sent with a priority queue to a
separate thread for logging to file.
Page 14
Page 20
Figure 5: Spectrum Sink work function flow chart
Page 15
Page 21
4.4 Verification, calibration and testing
The system is verified and calibrated by comparing the measured spectra with a calibrated
spectrum analyzer. The difference between the spectrum analyzer and the USRP is used as a
calibration file in the logging software and is interpolated and applied to the frequency bins
present in the current spectrum.
4.5 Data analysis
The data from the program is logged as the signal power at the SMA input in dBm together with
the time and date and position when the spectrum was sampled. With the logged data, charts and
maps can effectively be automatically generated with the programming language R and selected
libraries. Map backgrounds can be downloaded from the open source project OpenStreetMap with
functionality from the R library with the same name and the plot library ggplot2. The automation
of data analysis and report generation is a necessity with the large datasets expected from
specified usage.
Page 16
Page 22
5 Results
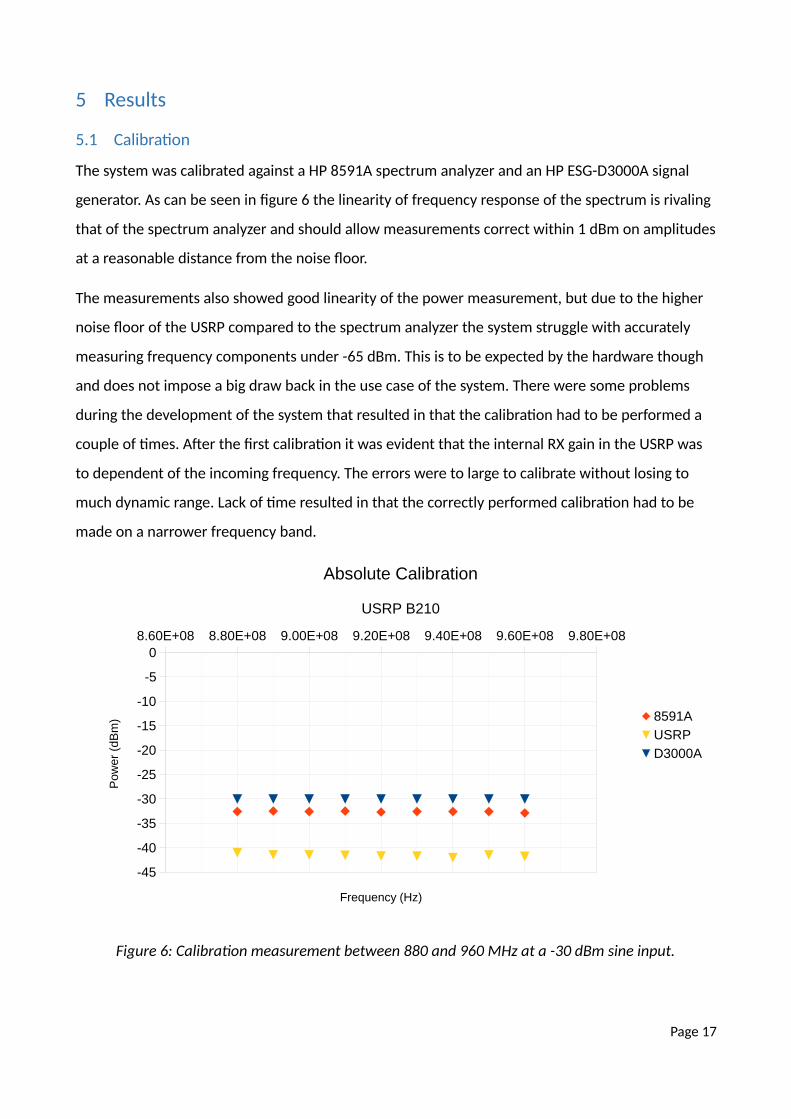
5.1 Calibration
The system was calibrated against a HP 8591A spectrum analyzer and an HP ESG-D3000A signal
generator. As can be seen in figure 6 the linearity of frequency response of the spectrum is rivaling
that of the spectrum analyzer and should allow measurements correct within 1 dBm on amplitudes
at a reasonable distance from the noise floor.
The measurements also showed good linearity of the power measurement, but due to the higher
noise floor of the USRP compared to the spectrum analyzer the system struggle with accurately
measuring frequency components under -65 dBm. This is to be expected by the hardware though
and does not impose a big draw back in the use case of the system. There were some problems
during the development of the system that resulted in that the calibration had to be performed a
couple of times. After the first calibration it was evident that the internal RX gain in the USRP was
to dependent of the incoming frequency. The errors were to large to calibrate without losing to
much dynamic range. Lack of time resulted in that the correctly performed calibration had to be
made on a narrower frequency band.
Figure 6: Calibration measurement between 880 and 960 MHz at a -30 dBm sine input.
Page 17
8.60E+08 8.80E+08 9.00E+08 9.20E+08 9.40E+08 9.60E+08 9.80E+08
-45
-40
-35
-30
-25
-20
-15
-10
-5
0
Absolute Calibration
USRP B210
8591A
USRP
D3000A
Frequency (Hz)
Pow
er (
dBm
)
Page 23
5.2 Spectrum characterisation
The characterisation is in general good. LO leak trough is minimal and does not influence the
measurement in a significant way.
However, there are some issues with high energy signals between 1 and 2 GHz, as seen in figure 7a
& 7b, whose cause is not yet fully understood. It could be an effect of a defect in the USRP or
inaccuracies in the RFIC or board design. It could also be so that it is a bug in the software. In any
way, further investigation is needed.
Table 2: Input frequencies and resulting significant components.
Input frequency Measured significant components
1 GHz 1 GHz
1.5 GHz 104 MHz, 232 MHz & 1.5 GHz
1.75 GHz 170 MHz, 182 MHz & 1.75 GHz
2 GHz 656 MHz & 2 GHz
2.5 GHz 2.5 GHz
These emerging inaccuracies in the measured spectrum are important to consider when using the
system to characterize spectrums under 700 MHz and additional filtering or a strategic choice of
antenna is necessary for an adequate measurement.
Page 18
Page 24
Figure 7a: Correct characterisation of sine function input at 2.5 GHz
Figure 7b: Problematic characterisation of sine function input at 1.5 GHz
Page 19
Page 25
5.3 Power consumption
The power consumption of the complete system while running was measured to 16 W. A battery
pack with the capacity of 1 kWh should in theory enable an independent running time of about 60
hours.
5.4 Field test
The system was tested on Volvo PV premises at the frequency range of 870MHz – 978 MHz which
is populated by the GSM-900 band. The USRP was connected to a Schwarzbeck SBA 9113 antenna
which has a known antenna factor over the range.
The field test shows that it is possible to measure a clear difference in the field strength around
buildings and further away in areas covered by forest.
The maximum total field strength was measured to 104 dB(uV/m) directly NW of PV-Huset and the
minimum to 60 dB(uV/m) outside the anechoic chamber in the northern parts of the premises.
Figure 8: Spectral density at maximum measured field strength during field testing.
Page 20
Page 26
Figure 9: Measured total electric field strength at 870 - 978 MHz
Page 21
Page 27
6 Discussion and conclusions
The usage of the USRP as a spectrum analyzer has shown itself to be a viable alternative to
expensive tools in some use cases. The USRP is obviously not as exact as the more specialized tools
and has a higher noise floor which affect the measurement of low amplitude signals.
The development tools distributed by GNU Radio are excellent and provide a more than enough
tool chest for approaching problems with software defined radio. That is not to say that the
development of the software in this project went without any issues. It was found that GNU Radio
lacks in form of error handling, often resolving to print errors in stdout or just delivering empty
data packets instead of properly exposing the errors in the API. Because of this, more time than
was planned was spent with struggling to keeping the system stable and ensuring that the logged
data was consistent and correct. This affected the project in that less time than what might have
been desired was spent on validating the logged spectra against proper measuring equipment and
determine parameters such as dynamic range and signal-to-noise ratio for the system as well as
finishing the system as a deployable product with a case, UPS and batteries. These safe guards also
resulted in a slightly decreased performance of the system regarding the time spent acquiring the
spectrum.
All in all the project was a great introduction to modern signal processing and software defined
radio and the integration of different components in a complete system.
Page 22
Page 28
7 Future development
The limitations USB present in bandwidth and stability could be alleviated by offloading some of
the signal processing to the field programmable gate array (FPGA) located on the USRP board.
FPGAs excel in computations easily run in parallel which is the case with the FFT and in handling
large amounts of data. By doing the computations on the FPGA and sending the time insensitive
calculated spectrums over the bus, less bandwidth is needed and the system’s robustness would
be increased greatly.
The system is today limited to measuring and logging continuous broadcast signals due to the
averaging and decimation of spectrum data. It would be useful to use the same technology to tune
in to a specific baseband and log the occurrence of high signal transients that are missed with the
current implementation.
7.1 New hardware
As the entire signal processing chain is performed in software on the NUC a SDR board featuring a
newly developed and more advanced chip for tuning and receiving would be able to be used as a
drop in replacement to the USRP used by the system today with minimal work.
Lime Microsystems, which is the developer of the LMS6002D featured in the BladeRF board has a
new chip in production. The LMS7002M expands the frequency range down to 100 kHz which
would be very useful for measuring electromagnetic radiation in the kilometer band. Lime
Microsystems also have announced a new RFIC (LMS8001M) which claims to span the range from
100 kHz to 12 GHz with a bandwidth of 120 MHz.
The rapid advancements in transceivers and the modularity of the systems really show the extreme
possibilities that software defined radio present to engineers today and in the future.
Page 23
Page 29
8 References
[1] H. W. Ott, “Electromagnetic Compatibility Engineering”, Rev. ed, Hoboken, NJ: Wiley, pp. 4.
[2] digikey.se, “A primer on Automotive EMC for Non-EMC Engineers”, 2013. [Online].
Available: http://www.digikey.se/Web%20Export/Supplier%20Content/laird-emi-903/pdf/laird-
emi-automotive-emc.pdf.
[3] J. D. M. Osburn, “EMC Antenna Parameters and Their Relationships”, ITEM, 1997.
[4] B. Razavi, “Design Considerations for Direct-Conversion Receivers”, IEEE Transactions on
Circuits and Systems II: Analog and Digital Signal Processing, VOL 44 NO 6, 1997
[5] Analog Devices, "RF Agile Transceiver," AD9361 Datasheet, 2013.
[6] gnuradio.org, “Working with GNU Radio in Python”, 2016. [Online]. Available:
http://gnuradio.org/redmine/projects/gnuradio/wiki/Guided_Tutorial_GNU_Radio_in_Python.
[Accessed: 10- Mar- 2016]
[7] gnuradio.org, “API Reference: Stream Tags”, 2016. [Online]. Available:
http://gnuradio.org/doc/doxygen/page_stream_tags.html. [Accessed: 04- Apr- 2016]
[8] testandmeasurementtips.com, “Basics of spectrum analyzers”, 2016. [Online]. Available:
http://www.testandmeasurementtips.com/new-articles/basics-of-spectrum-analyzers/.
[Accessed: 14- Mar- 2016]
[9] R. G. Lyons, Understanding Digital Signal Processing, 1st ed. Upper Saddle River, NJ: Prentice
Hall PTR, pp. 327–330.
Page 24
Page 30
9 Appendix
9.1 Source code for the custom data sink in GNU Radio
class SpectrumSink(gr.sync_block):
def __init__(self, fft_size, sample_rate, capture_rate, spectra, render_queue, center_frequency_queue,
logger_queue):
self.fft_size = fft_size
gr.sync_block.__init__(self, "spectrum_sink",
in_sig = [(numpy.float32, self.fft_size)],
out_sig = None)
self.capture_rate = capture_rate
self.spectra = spectra
self.render_queue = render_queue
self.center_frequency_queue = center_frequency_queue
self.logger_queue = logger_queue
self.rx_freq = 0
self.current_frame = 0
self.current_spectrum = 0
self.current_window = 0
self.avg_count = 20
self.avg_alpha = 0.1
self.retuning = False
self.capturing = [False]*len(spectra)
self.buffer = [0]*len(spectra[0].frequencies)
for window in range(len(self.buffer)):
self.buffer[window] = [0]*spectra[0].number_of_bins
self.last_capture = time.time()
self.bin_margin = (self.fft_size - self.spectra[0].number_of_bins)/2
def work(self, input_items, output_items):
in0 = input_items[0]
out0 = input_items[0]
num_input_items = len(in0)
num_output_items = len(out0)
x = 0
spec = in0[x]
if (not self.capturing and time.time() > self.last_capture+(1.0/self.capture_rate)):
self.capturing = True
self.last_capture = time.time()
if (self.capturing):
# Read tags
nread = self.nitems_read(0)
tags = self.get_tags_in_range(0, nread, nread+num_input_items)
for tag in tags:
if (pmt.symbol_to_string(tag.key) == "rx_freq"):
self.rx_freq = int(round(pmt.to_double(tag.value)))
Page 25
Page 31
if (self.rx_freq != self.spectra[self.current_spectrum].frequencies[self.current_window]):
# Wait for spectrum of correct center frequency
if (not self.retuning):
self.retuning = True
self.center_frequency_queue.put(
self.spectra[self.current_spectrum].frequencies[self.current_window]
)
else: # Work frame
self.retuning = False
shifted = numpy.concatenate((spec[len(spec)/2:], spec[0:len(spec)/2]))
# Remove bins from front and back where heavy aliasing occurs.
if (self.bin_margin != 0): # Breaks if bin_margin is 0
cut_spec = shifted[self.bin_margin:-self.bin_margin]
if len(cut_spec[numpy.where(cut_spec < -230)] != 0):
# Sometimes GNU Radio throws the FFT of zeroes samples, just throw them away and do over
return num_input_items
if (self.current_frame == 0):
self.buffer[self.current_window] = list(cut_spec)
else:
for i in range(len(self.buffer[self.current_window])): # Do averaging
self.buffer[self.current_window][i] = (1.0 -
self.avg_alpha)*self.buffer[self.current_window][i] +
self.avg_alpha*cut_spec[i]
self.current_frame = self.current_frame + 1
if (self.current_frame == self.avg_count): # Averaging done
# Add RF compensation
self.buffer[self.current_window] = map(add, self.buffer[self.current_window],
self.spectra[self.current_spectrum].rf_compensation[self.current_window])
self.current_frame = 0
self.current_window = self.current_window + 1
if (self.current_window == len(self.spectra[self.current_spectrum].frequencies)):
# Windows done
meta = {}
s = [self.current_spectrum, copy.deepcopy(self.buffer), meta]
self.render_queue.put(s)
self.logger_queue.put(s)
self.current_window = 0
print "Spectrum [{}] done, took {} seconds".format(self.spectra[self.current_spectrum].id,
time.time() - self.last_capture)
self.current_spectrum = self.current_spectrum + 1
if (self.current_spectrum == len(self.spectra)): # Spectra done
self.current_spectrum = 0
self.capturing = False
self.buffer = [0]*len(self.spectra[self.current_spectrum].frequencies)
for window in range(len(self.buffer)):
self.buffer[window] = [0]*self.spectra[self.current_spectrum].number_of_bins
return num_input_items
Page 26
Page 32
9.2 Excerpt of code to render maps with OpenStreetMap and ggplot2 in R
library("OpenStreetMap")library("matrixStats")library("sp")library("ggplot2")
data_comp = read.csv(file = "compensation.csv", head = TRUE, sep = ",")f_comp = approxfun(as.numeric(data_comp[,"frequency"]),
as.numeric(data_comp[,"compensation"]), method = "linear", rule = 2)
data_af = read.csv(file = "afschwartz.csv", head = TRUE, sep = ",")f_af = approxfun(as.numeric(data_af[,"frequency"]),
as.numeric(data_af[,"af"]), method = "linear", rule = 2)
data = read.csv(file = "Mobil_20160516_135709.csv", head = TRUE, sep = ",")
measured_frequencies = as.numeric(substr(colnames(data)[-3:0], 2, nchar(col-names(data)[-3:0])))
png(filename = "map.png", width = 1024, height = 1024)
map = openmap(get_upper_left_coordinate(as.numeric(data[,"lat"]), as.numeric(data[,"lon"])), get_lower_right_coordinate(as.numeric(data[,"lat"]), as.numeric(data[,"lon"])), minNumTiles = 16, type = "osm")
sl = SpatialLines(list(Lines(Line(cbind(as.numeric(data[,"lon"]), as.numeric(data[,"lat"]))), ID="a")),
proj4string = CRS("+proj=longlat +datum=WGS84 +ellps=WGS84 +towgs84=0,0,0"))
sl_merc = spTransform(sl, CRS("+proj=merc +a=6378137 +b=6378137 +lat_ts=0.0+lon_0=0.0 +x_0=0.0 +y_0=0 +k=1.0 +units=m +nadgrids=@null +no_defs"))
# E = raw + internal_correction + dBm2dBuV + AF E = as.matrix(data[, -(1:3)]) + f_comp(measured_frequencies) + 106.98 + f_af(measured_frequencies)
powerSum = rowLogSumExps(E)
sl_merc_df = SpatialLinesDataFrame(sl_merc, data.frame(ID = c("a")), match.ID = F)
powerPalette = colorRampPalette(c("grey", "red"))colour = powerPalette(10)[as.numeric(cut(powerSum, breaks = 10))]theme_set(theme_gray(base_size = 18))
autoplot(map) +geom_path(data = sl_merc_df, linejoin = "round", size = 2, aes(group = 1,
x = long, y = lat, colour = powerSum)) +scale_colour_gradient("E (dBuV/m)",limits=c(min(powerSum), max(powerSum)),
low="blue", high="red")
Page 27