14
System Planning & Site Evaluation October 14, 2005 Jonathan Clemens Independent Renewable Energy Consultant
| Date post: | 29-Dec-2015 |
| Category: |
Documents |
| Upload: | karen-boyd |
| View: | 218 times |
| Download: | 0 times |
System Planning& Site Evaluation
October 14, 2005
Jonathan ClemensIndependent Renewable Energy Consultant
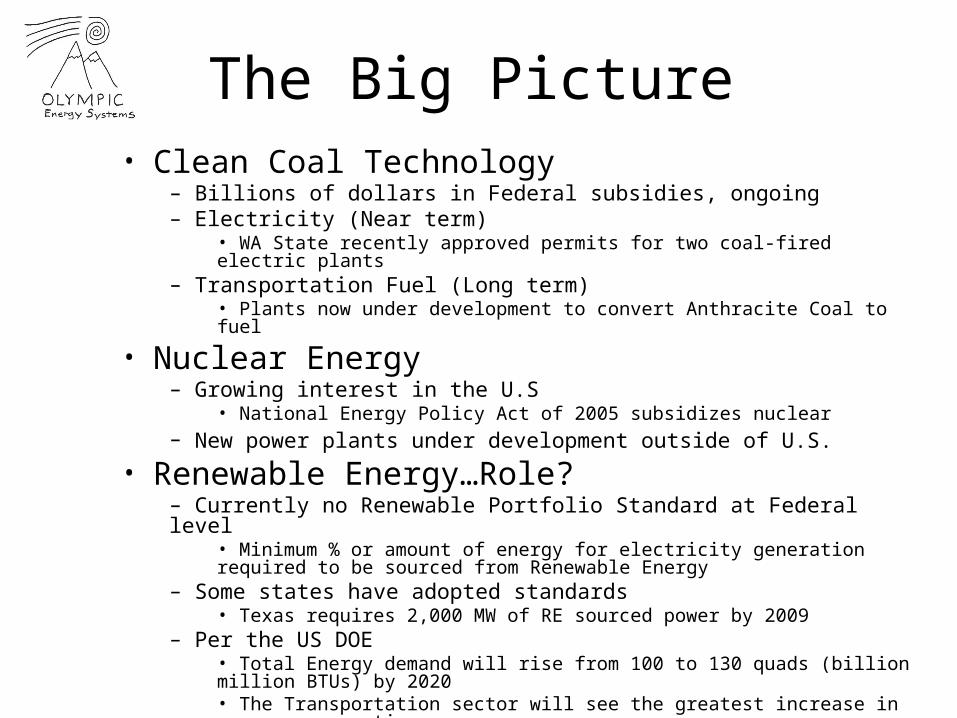
The Big Picture• Clean Coal Technology
– Billions of dollars in Federal subsidies, ongoing– Electricity (Near term)
• WA State recently approved permits for two coal-fired electric plants– Transportation Fuel (Long term)
• Plants now under development to convert Anthracite Coal to fuel
• Nuclear Energy– Growing interest in the U.S
• National Energy Policy Act of 2005 subsidizes nuclear– New power plants under development outside of U.S.
• Renewable Energy…Role?– Currently no Renewable Portfolio Standard at Federal level
• Minimum % or amount of energy for electricity generation required to be sourced from Renewable Energy
– Some states have adopted standards• Texas requires 2,000 MW of RE sourced power by 2009
– Per the US DOE• Total Energy demand will rise from 100 to 130 quads (billion million BTUs) by 2020• The Transportation sector will see the greatest increase in energy consumption• The growth in conventional energy consumption will EXCEED new RE generation
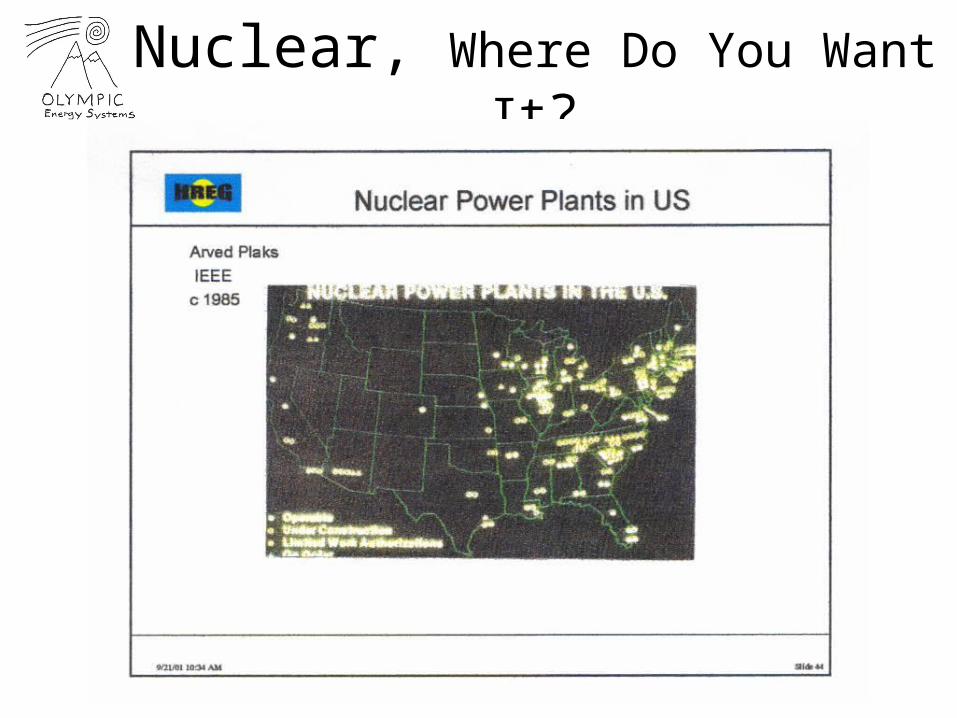
Nuclear, Where Do You Want It?
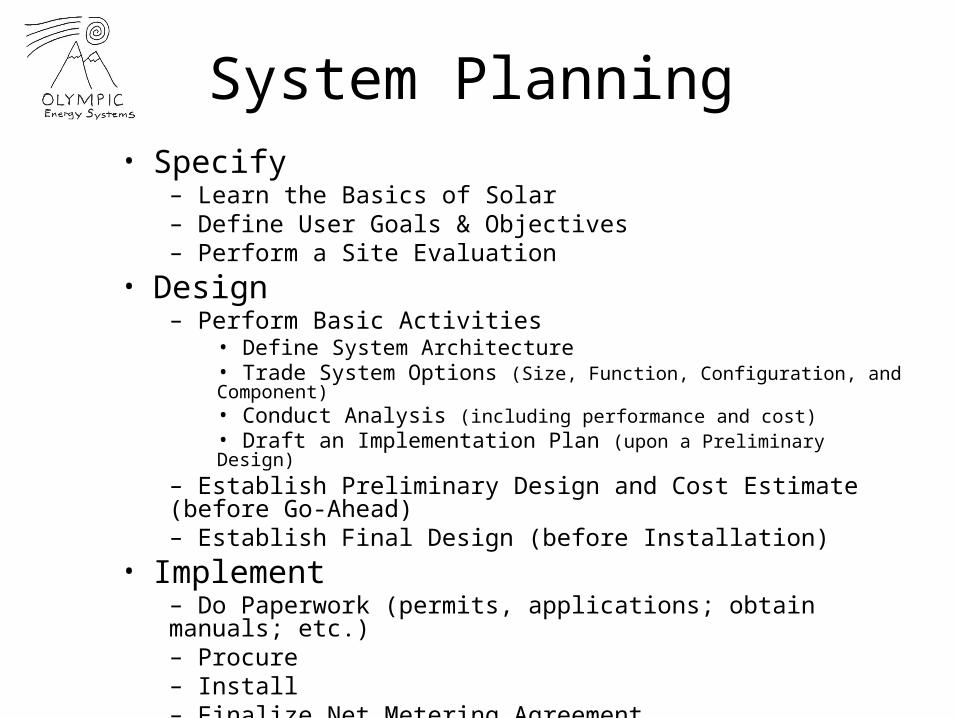
System Planning• Specify
– Learn the Basics of Solar– Define User Goals & Objectives– Perform a Site Evaluation
• Design– Perform Basic Activities
• Define System Architecture• Trade System Options (Size, Function, Configuration, and Component)• Conduct Analysis (including performance and cost)• Draft an Implementation Plan (upon a Preliminary Design)
– Establish Preliminary Design and Cost Estimate (before Go-Ahead)– Establish Final Design (before Installation)
• Implement– Do Paperwork (permits, applications; obtain manuals; etc.)– Procure– Install– Finalize Net Metering Agreement– Apply for incentive payments
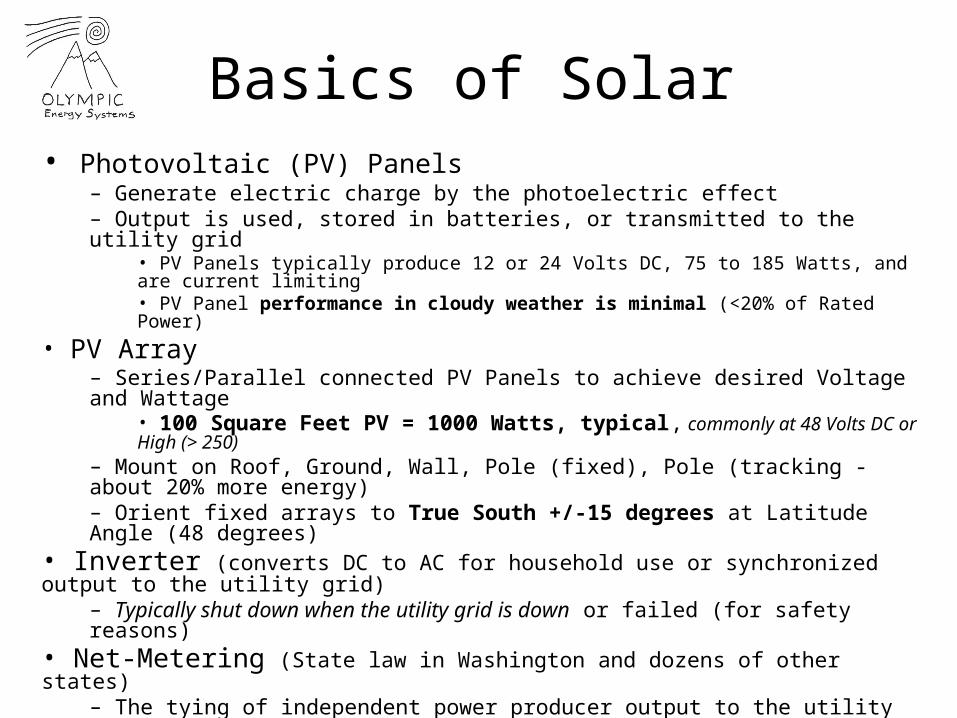
Basics of Solar• Photovoltaic (PV) Panels
– Generate electric charge by the photoelectric effect– Output is used, stored in batteries, or transmitted to the utility grid
• PV Panels typically produce 12 or 24 Volts DC, 75 to 185 Watts, and are current limiting• PV Panel performance in cloudy weather is minimal (<20% of Rated Power)
• PV Array– Series/Parallel connected PV Panels to achieve desired Voltage and Wattage
• 100 Square Feet PV = 1000 Watts, typical, commonly at 48 Volts DC or High (> 250)– Mount on Roof, Ground, Wall, Pole (fixed), Pole (tracking - about 20% more energy)– Orient fixed arrays to True South +/-15 degrees at Latitude Angle (48 degrees)
• Inverter (converts DC to AC for household use or synchronized output to the utility grid)– Typically shut down when the utility grid is down or failed (for safety reasons)
• Net-Metering (State law in Washington and dozens of other states)– The tying of independent power producer output to the utility grid to acquire credit for on-site energy production; 1000 Watt array = 1500 KWh/year, typical in PNW
• Available Incentives– Utility rebates (PSE $450 per 1 KW)– Utility production payments ($0.18 - $0.54 per KWh)– Green Tags (from NW Solar Co-Op at $0.10 per KWh)– Federal tax credits (30% of system cost; capped at $2,000 for residential)– Tax exemptions (WA State Sales Tax exemption for solar)
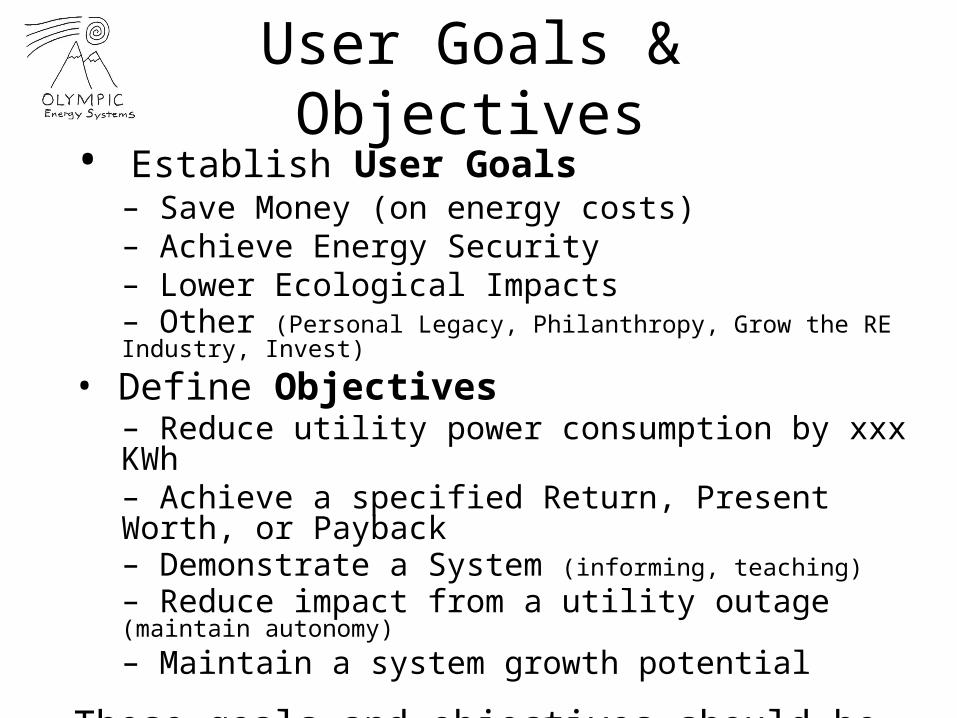
User Goals & Objectives• Establish User Goals
– Save Money (on energy costs)– Achieve Energy Security– Lower Ecological Impacts– Other (Personal Legacy, Philanthropy, Grow the RE Industry, Invest)
• Define Objectives– Reduce utility power consumption by xxx KWh– Achieve a specified Return, Present Worth, or Payback– Demonstrate a System (informing, teaching)
– Reduce impact from a utility outage (maintain autonomy)
– Maintain a system growth potential
These goals and objectives should be established before designing a solar energy system.
Economics
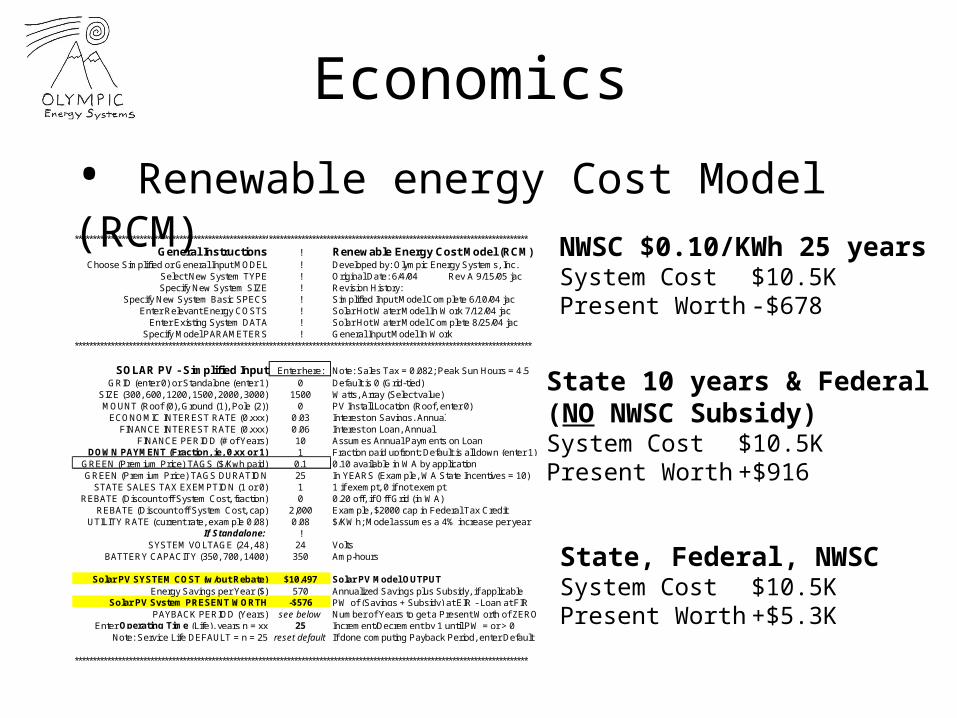
• Renewable energy Cost Model (RCM)*************************************************************************************************************************************************************************************
General Instructions ! Renewable Energy Cost Model (RCM)Choose Simplified or General Input MODEL ! Developed by: Olympic Energy Systems, Inc.
Select New System TYPE ! Original Date: 6/4/04 Rev A 9/15/05 jacSpecify New System SIZE ! Revision History:
Specify New System Basic SPECS ! Simplified Input Model Complete 6/10/04 jacEnter Relevant Energy COSTS ! Solar Hot Water Model In Work 7/12/04 jac
Enter Existing System DATA ! Solar Hot Water Model Complete 8/25/04 jacSpecify Model PARAMETERS ! General Input Model In Work
**************************************************************************************************************************************************************************************
SOLAR PV - Simplified Input Enter here: Note: Sales Tax = 0.082; Peak Sun Hours = 4.5GRID (enter 0) or Standalone (enter 1) 0 Default is 0 (Grid-tied)
SIZE (300, 600, 1200, 1500, 2000, 3000) 1500 Watts, Array (Select value)MOUNT (Roof (0), Ground (1), Pole (2)) 0 PV Install Location (Roof, enter 0)
ECONOMIC INTEREST RATE (0.xxx) 0.03 Interest on Savings, AnnualFINANCE INTEREST RATE (0.xxx) 0.06 Interest on Loan, Annual
FINANCE PERIOD (# of Years) 10 Assumes Annual Payments on LoanDOWN PAYMENT (Fraction, ie, 0.xx or 1) 1 Fraction paid upfront; Default is all down (enter 1)
GREEN (Premium Price) TAGS ($/Kwh paid) 0.1 0.10 available in WA by applicationGREEN (Premium Price) TAGS DURATION 25 In YEARS (Example, WA State Incentives = 10)
STATE SALES TAX EXEMPTION (1 or 0) 1 1 if exempt, 0 if not exemptREBATE (Discount off System Cost, fraction) 0 0.20 off, if Off Grid (in WA)
REBATE (Discount off System Cost, cap) 2,000 Example, $2000 cap in Federal Tax CreditUTILITY RATE (current rate, example 0.08) 0.08 $/KWh; Model assumes a 4% increase per year
If Standalone: !SYSTEM VOLTAGE (24, 48) 24 Volts
BATTERY CAPACITY (350, 700, 1400) 350 Amp-hours
Solar PV SYSTEM COST (w/out Rebate) $10,497 Solar PV Model OUTPUTEnergy Savings per Year ($) 570 Annualized Savings plus Subsidy, if applicable
Solar PV System PRESENT WORTH -$576 PW of (Savings + Subsidy) at EIR - Loan at FIRPAYBACK PERIOD (Years) see below Number of Years to get a Present Worth of ZERO
Enter Operating Time (Life), years n = xx 25 Increment/Decrement by 1 until PW = or > 0Note: Service Life DEFAULT = n = 25 reset default If done computing Payback Period, enter Default
************************************************************************************************************************************************************************************
NWSC $0.10/KWh 25 yearsSystem Cost $10.5KPresent Worth -$678
State 10 years & Federal(NO NWSC Subsidy)System Cost $10.5KPresent Worth +$916
State, Federal, NWSCSystem Cost $10.5KPresent Worth +$5.3K
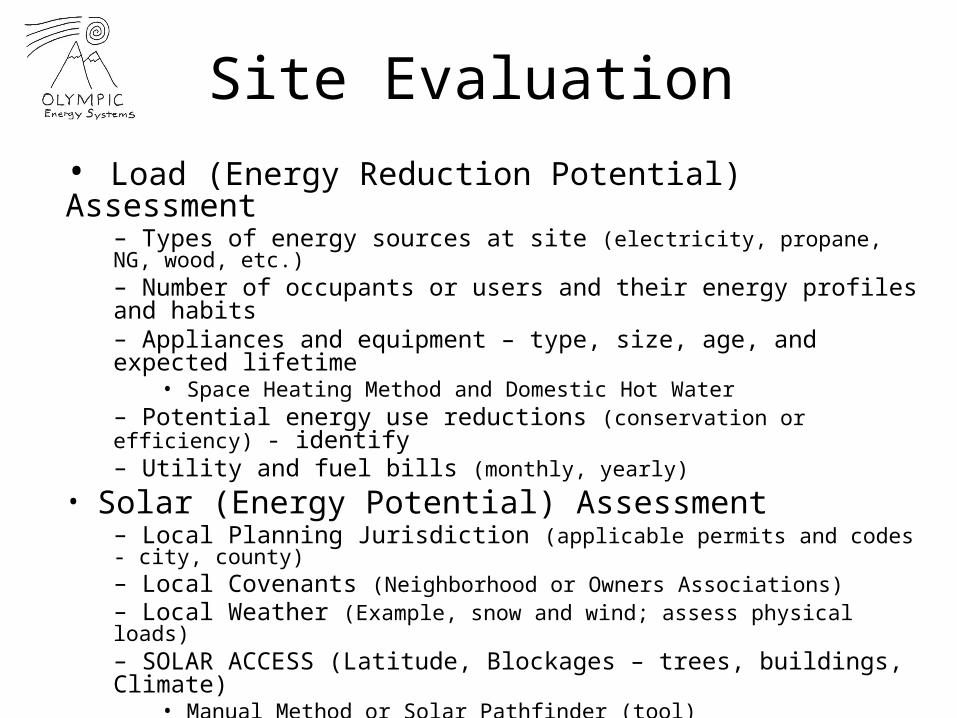
Site Evaluation
• Load (Energy Reduction Potential) Assessment– Types of energy sources at site (electricity, propane, NG, wood, etc.)– Number of occupants or users and their energy profiles and habits– Appliances and equipment – type, size, age, and expected lifetime
• Space Heating Method and Domestic Hot Water– Potential energy use reductions (conservation or efficiency) - identify– Utility and fuel bills (monthly, yearly)
• Solar (Energy Potential) Assessment– Local Planning Jurisdiction (applicable permits and codes - city, county)– Local Covenants (Neighborhood or Owners Associations)– Local Weather (Example, snow and wind; assess physical loads)– SOLAR ACCESS (Latitude, Blockages – trees, buildings, Climate)
• Manual Method or Solar Pathfinder (tool)• Peak Sun Hours per Day (annualized): 3 to 3.5 Seattle, 3.5 to 4 NOP, 5 CA)
– Collector mounting options (considering space and south facing)– Type and condition of mounting surfaces (particularly the roof)– Future site conditions (tree growth, area development plans, re-roofing)
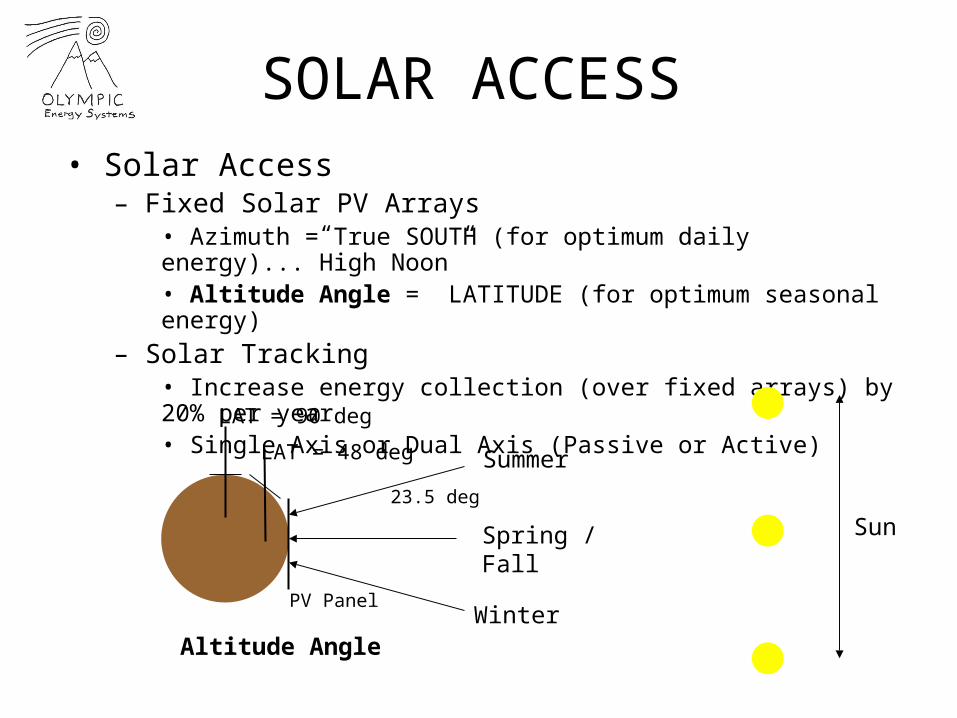
SOLAR ACCESS• Solar Access
– Fixed Solar PV Arrays• Azimuth = True SOUTH (for optimum daily energy)...”High Noon”• Altitude Angle = LATITUDE (for optimum seasonal energy)
– Solar Tracking• Increase energy collection (over fixed arrays) by 20% per year• Single Axis or Dual Axis (Passive or Active)
Summer
Winter
Spring / Fall
Altitude Angle
LAT = 90 deg
LAT = 48 deg
PV Panel
Sun23.5 deg
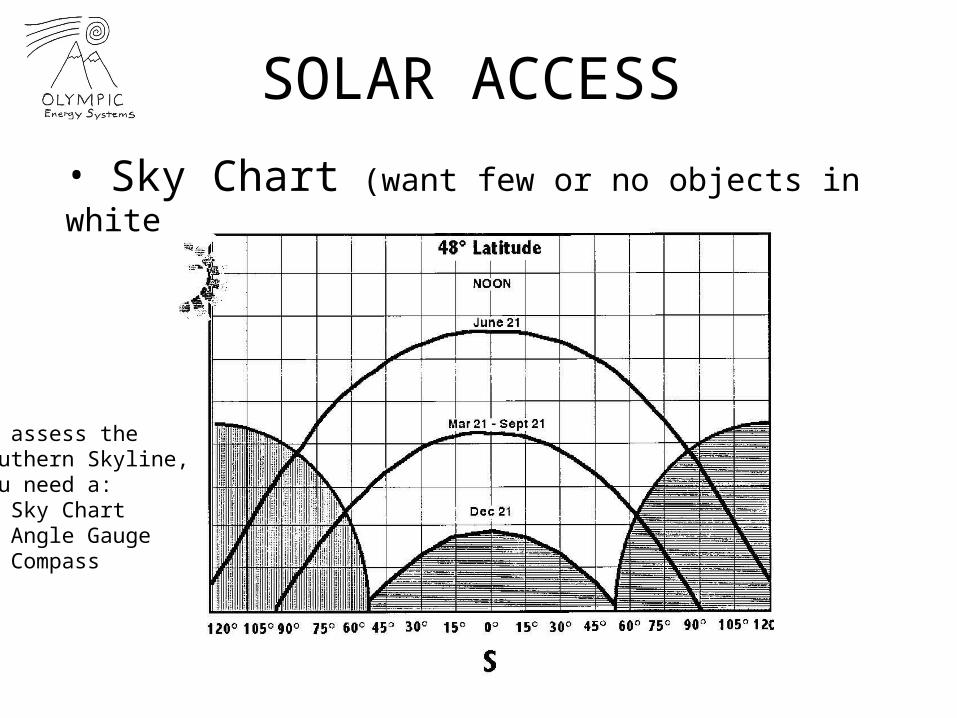
SOLAR ACCESS
• Sky Chart (want few or no objects in white areas)
To assess theSouthern Skyline,you need a: Sky Chart Angle Gauge Compass
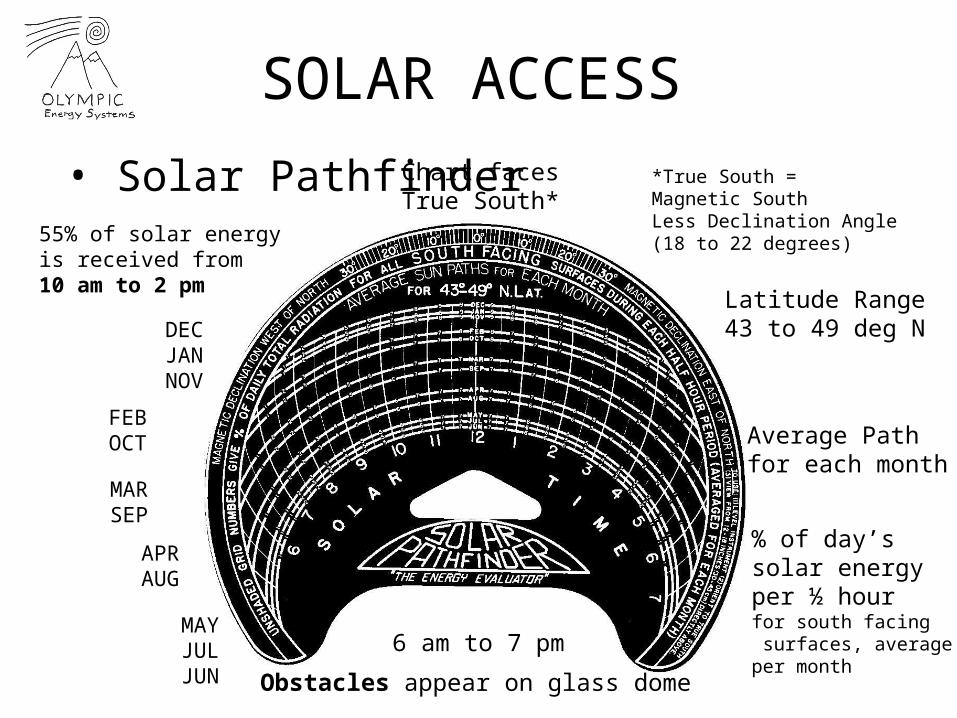
SOLAR ACCESS
• Solar Pathfinder
Average Pathfor each month
Latitude Range43 to 49 deg N
% of day’ssolar energyper ½ hourfor south facing surfaces, averageper month
Chart facesTrue South*
6 am to 7 pm
DECJANNOV
FEBOCT
MARSEP
APRAUG
MAYJULJUN
*True South = Magnetic SouthLess Declination Angle(18 to 22 degrees)55% of solar energy
is received from10 am to 2 pm
Obstacles appear on glass dome
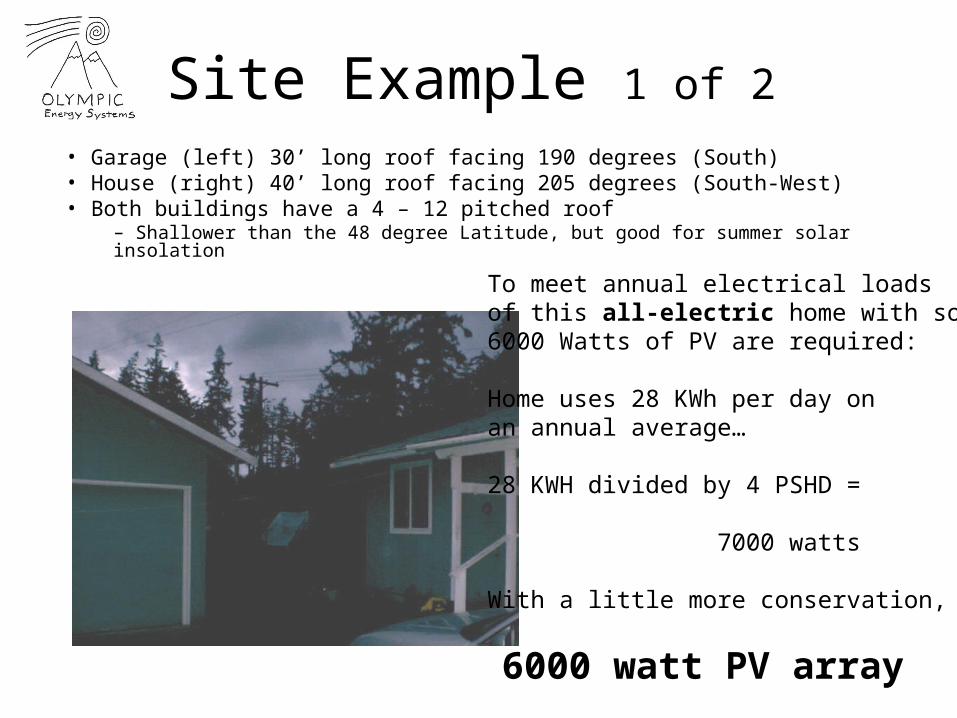
Site Example 1 of 2
• Garage (left) 30’ long roof facing 190 degrees (South)• House (right) 40’ long roof facing 205 degrees (South-West)• Both buildings have a 4 – 12 pitched roof
– Shallower than the 48 degree Latitude, but good for summer solar insolation
To meet annual electrical loadsof this all-electric home with solar,6000 Watts of PV are required:
Home uses 28 KWh per day onan annual average…
28 KWH divided by 4 PSHD =
7000 watts
With a little more conservation,
6000 watt PV array
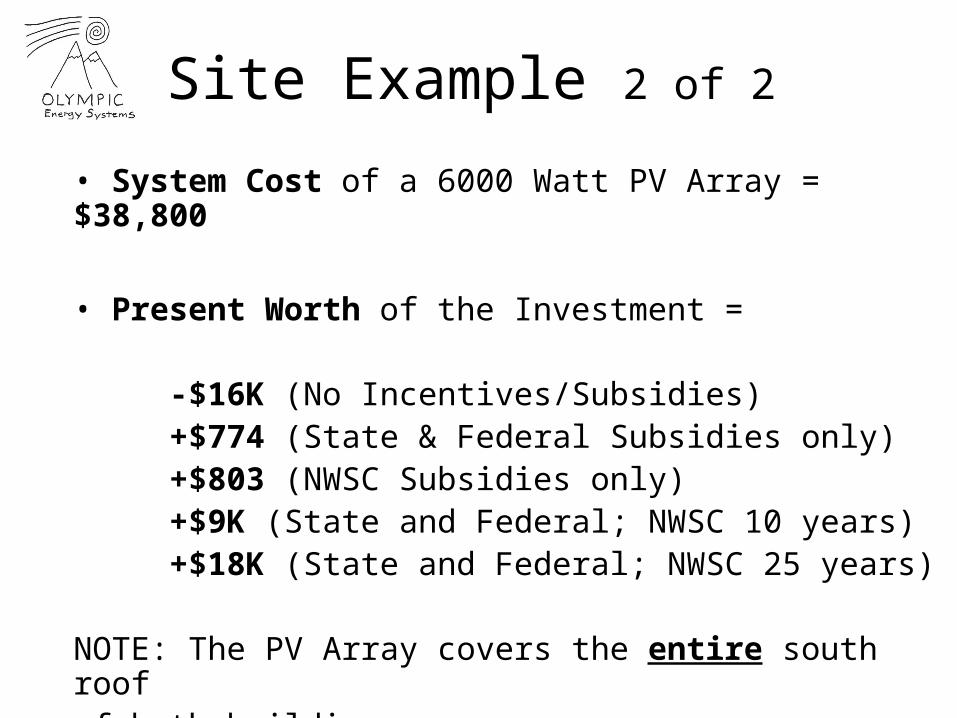
Site Example 2 of 2
• System Cost of a 6000 Watt PV Array = $38,800
• Present Worth of the Investment =
-$16K (No Incentives/Subsidies)+$774 (State & Federal Subsidies only)+$803 (NWSC Subsidies only)+$9K (State and Federal; NWSC 10 years)+$18K (State and Federal; NWSC 25 years)
NOTE: The PV Array covers the entire south roofof both buildings.
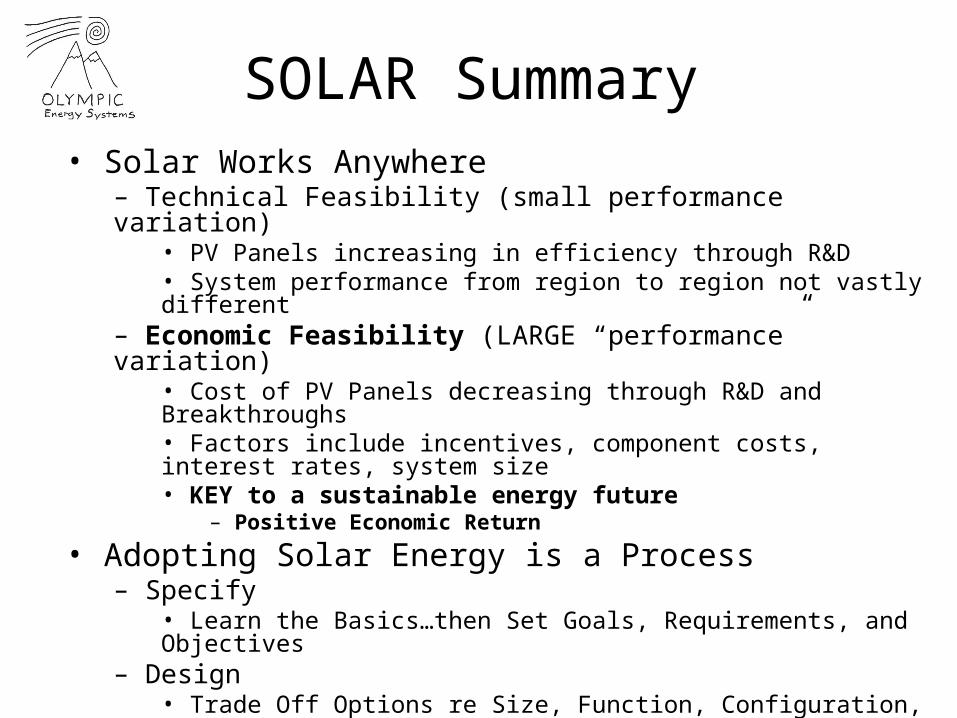
SOLAR Summary• Solar Works Anywhere
– Technical Feasibility (small performance variation)• PV Panels increasing in efficiency through R&D• System performance from region to region not vastly different
– Economic Feasibility (LARGE “performance” variation)• Cost of PV Panels decreasing through R&D and Breakthroughs• Factors include incentives, component costs, interest rates, system size• KEY to a sustainable energy future
– Positive Economic Return
• Adopting Solar Energy is a Process– Specify
• Learn the Basics…then Set Goals, Requirements, and Objectives– Design
• Trade Off Options re Size, Function, Configuration, Components– Implement
• Prepare Paperwork, Procure, Install• Finalize Net Metering Agreement• Regularly apply for Incentive payments


