DOI: 10.1126/scitranslmed.3002564 , 108ra113 (2011); 3 Sci Transl Med , et al. Andrew H. Beck Features Associated with Survival Systematic Analysis of Breast Cancer Morphology Uncovers Stromal Editor's Summary new biological aspects of cancer tissue. brain with an unbiased image processing system can extract more information from microcopy images and discover human tended to have more inflammatory cells in the stroma (picked up as dark areas by the software). Replacing the epithelial cells infiltrating the stroma, which resulted in high-risk stromal matrix variability scores. These patients also cancer itself but were from the adjacent stromal tissue. Women with worse outcomes tended to have thin cords of An unexpected finding was that the features that were the best predictors of patient survival were not from the with overall survival. status. In another, completely independent group of women from Vancouver, the C-Path score was also associated other measures of cancer severity including pathology grade, estrogen receptor status, tumor size, and lymph node samples so it could learn the difference. The C-Path score yielded information above and beyond that from many hand-marked part of cancer diagnosis, took a bit of extra work: The authors needed to provide the software with some among the very large set of measurements of the image. Classifying the tissue as epithelial or stromal, an important predefined by a pathologist as being relevant to cancer; instead, the software itself found the cancer-related features samples from patients who had died sooner. The key aspect of this analysis was that these features were not from patients in the Netherlands. From more than 6000 features, the software found a set that were associated with With an image analysis protocol they termed C-Path, the authors set their program loose on a set of samples features that strongly predicted breast cancer outcome in both training and validation samples. instructing it to find quantitative aspects of breast cancer tissue that predict prognosis. The software located a set of created an automated pathologist by replacing the human brain with sophisticated image processing software and . have et al most places for prognosis and treatment of cancer, despite its variability and often unreliability. Now, Beck features (tubules, atypical nuclei, and mitosis) against the tissue. This decades-old scoring system is still standard in processing? A pathologist reading a cancer biopsy slide matches his or her brain's memory of certain cancer-related as they are interpreted by the human brain. But what if we could program a computer to do the secondary How is a camera different from the human eye? Only the eye's images undergo extensive secondary processing An Automated Pathologist Reads Cancer Biopsies http://stm.sciencemag.org/content/3/108/108ra113.full.html can be found at: and other services, including high-resolution figures, A complete electronic version of this article http://stm.sciencemag.org/content/suppl/2011/11/07/3.108.108ra113.DC1.html can be found in the online version of this article at: Supplementary Material http://stm.sciencemag.org/content/scitransmed/3/108/108fs8.full.html can be found online at: Related Resources for this article http://www.sciencemag.org/about/permissions.dtl in whole or in part can be found at: article permission to reproduce this of this article or about obtaining reprints Information about obtaining is a registered trademark of AAAS. Science Translational Medicine rights reserved. The title NW, Washington, DC 20005. Copyright 2011 by the American Association for the Advancement of Science; all last week in December, by the American Association for the Advancement of Science, 1200 New York Avenue (print ISSN 1946-6234; online ISSN 1946-6242) is published weekly, except the Science Translational Medicine on November 17, 2011 stm.sciencemag.org Downloaded from
Transcript
DOI: 10.1126/scitranslmed.3002564, 108ra113 (2011);3 Sci Transl Med
, et al.Andrew H. BeckFeatures Associated with SurvivalSystematic Analysis of Breast Cancer Morphology Uncovers Stromal
Editor's Summary
new biological aspects of cancer tissue.brain with an unbiased image processing system can extract more information from microcopy images and discover
humantended to have more inflammatory cells in the stroma (picked up as dark areas by the software). Replacing the epithelial cells infiltrating the stroma, which resulted in high-risk stromal matrix variability scores. These patients alsocancer itself but were from the adjacent stromal tissue. Women with worse outcomes tended to have thin cords of
An unexpected finding was that the features that were the best predictors of patient survival were not from the
with overall survival.status. In another, completely independent group of women from Vancouver, the C-Path score was also associated other measures of cancer severity including pathology grade, estrogen receptor status, tumor size, and lymph nodesamples so it could learn the difference. The C-Path score yielded information above and beyond that from many
hand-markedpart of cancer diagnosis, took a bit of extra work: The authors needed to provide the software with some among the very large set of measurements of the image. Classifying the tissue as epithelial or stromal, an importantpredefined by a pathologist as being relevant to cancer; instead, the software itself found the cancer-related features samples from patients who had died sooner. The key aspect of this analysis was that these features were notfrom patients in the Netherlands. From more than 6000 features, the software found a set that were associated with
With an image analysis protocol they termed C-Path, the authors set their program loose on a set of samples
features that strongly predicted breast cancer outcome in both training and validation samples.instructing it to find quantitative aspects of breast cancer tissue that predict prognosis. The software located a set ofcreated an automated pathologist by replacing the human brain with sophisticated image processing software and
. haveet almost places for prognosis and treatment of cancer, despite its variability and often unreliability. Now, Beck features (tubules, atypical nuclei, and mitosis) against the tissue. This decades-old scoring system is still standard in processing? A pathologist reading a cancer biopsy slide matches his or her brain's memory of certain cancer-relatedas they are interpreted by the human brain. But what if we could program a computer to do the secondary
How is a camera different from the human eye? Only the eye's images undergo extensive secondary processing
An Automated Pathologist Reads Cancer Biopsies
http://stm.sciencemag.org/content/3/108/108ra113.full.htmlcan be found at:
and other services, including high-resolution figures,A complete electronic version of this article
http://stm.sciencemag.org/content/suppl/2011/11/07/3.108.108ra113.DC1.html can be found in the online version of this article at: Supplementary Material
http://stm.sciencemag.org/content/scitransmed/3/108/108fs8.full.html can be found online at:Related Resources for this article
http://www.sciencemag.org/about/permissions.dtl in whole or in part can be found at: article
permission to reproduce this of this article or about obtaining reprintsInformation about obtaining
is a registered trademark of AAAS. Science Translational Medicinerights reserved. The title NW, Washington, DC 20005. Copyright 2011 by the American Association for the Advancement of Science; alllast week in December, by the American Association for the Advancement of Science, 1200 New York Avenue
(print ISSN 1946-6234; online ISSN 1946-6242) is published weekly, except theScience Translational Medicine
Systematic Analysis of Breast Cancer MorphologyUncovers Stromal Features Associated with SurvivalAndrew H. Beck,1,2* Ankur R. Sangoi,1,3 Samuel Leung,4 Robert J. Marinelli,5 Torsten O. Nielsen,4
Marc J. van de Vijver,6 Robert B. West,1 Matt van de Rijn,1 Daphne Koller7†
on
Nov
embe
r 17
, 201
1or
g
The morphological interpretation of histologic sections forms the basis of diagnosis and prognostication forcancer. In the diagnosis of carcinomas, pathologists perform a semiquantitative analysis of a small set of mor-phological features to determine the cancer’s histologic grade. Physicians use histologic grade to inform theirassessment of a carcinoma’s aggressiveness and a patient’s prognosis. Nevertheless, the determination of gradein breast cancer examines only a small set of morphological features of breast cancer epithelial cells, which hasbeen largely unchanged since the 1920s. A comprehensive analysis of automatically quantitated morphologicalfeatures could identify characteristics of prognostic relevance and provide an accurate and reproducible meansfor assessing prognosis from microscopic image data. We developed the C-Path (Computational Pathologist)system to measure a rich quantitative feature set from the breast cancer epithelium and stroma (6642 features),including both standard morphometric descriptors of image objects and higher-level contextual, relational, andglobal image features. These measurements were used to construct a prognostic model. We applied the C-Pathsystem to microscopic images from two independent cohorts of breast cancer patients [from the NetherlandsCancer Institute (NKI) cohort, n = 248, and the Vancouver General Hospital (VGH) cohort, n = 328]. The prognosticmodel score generated by our system was strongly associated with overall survival in both the NKI and the VGHcohorts (both log-rank P ≤ 0.001). This association was independent of clinical, pathological, and molecular factors.Three stromal features were significantly associated with survival, and this association was stronger than theassociation of survival with epithelial characteristics in the model. These findings implicate stromal morpho-logic structure as a previously unrecognized prognostic determinant for breast cancer.
ag.
stm
.sci
ence
mD
ownl
oade
d fr
om
INTRODUCTION
In the mid-19th century, it was first appreciated that the process ofcarcinogenesis produces characteristic morphologic changes in can-cer cells (1). Patey and Scarff showed in 1928 (2) that three histologicfeatures—tubule formation, epithelial nuclear atypia, and epithelialmitotic activity—could each be scored qualitatively, and the assessmentscould be combined to stratify breast cancer patients into three groupsthat showed significant survival differences. This semiquantitative mor-phological scoring scheme has been refined over the years (3–5) butstill remains the standard technique for histologic grading in invasivebreast cancer. Although considerable effort has been devoted recentlyto molecular profiling for assessment of prognosis and prediction oftreatment response in cancer (6, 7), microscopic image assessment isstill the most commonly available (and in some places in the world,the only) tool that is financially and logistically feasible.
Although the three epithelial features scored in current grading sys-tems are useful in assessing cancer prognosis, valuable prognosticinformation can also be derived from other factors, including proper-ties of the cancer stroma such as its molecular characteristics (8–15)
1Department of Pathology, Stanford University School of Medicine, Stanford, CA 94305,USA. 2Biomedical Informatics Training Program, Stanford University School of Medicine,Stanford, CA 94305, USA. 3Department of Pathology, El Camino Hospital, MountainView, CA 94040, USA. 4Genetic Pathology Evaluation Centre, University of British Co-lumbia, Vancouver, British Columbia V6H 3Z6, Canada. 5Department of Biochemistry,Stanford University, Stanford, CA 94305, USA. 6Department of Pathology, AcademicMedical Center, Meibergdreef 9, 1105AZ Amsterdam, Netherlands. 7Department of Com-puter Science, Stanford University, Stanford, CA 94305, USA.*Present address: Department of Pathology, Beth Israel Deaconess Medical Center,Harvard Medical School, Boston, MA 02115, USA.†To whom correspondence should be addressed. E-mail: [email protected]
www.ScienceT
and morphological features [such as stromal fibrotic focus, a scar-like area in the center of a carcinoma (16)]. Thus, we sought to de-velop a high-accuracy, image-based predictor to identify new clinicallypredictive morphologic phenotypes of breast cancers, thereby pro-viding new insights into the biological factors driving breast cancerprogression.
The development of such a system could also address other prob-lems relevant to the clinical treatment of breast cancer. A limitationto the current grading system is that there is considerable variabilityin histologic grading among pathologists (17), with potentially neg-ative consequences for determining treatment. An automated systemcould provide an objective method for predicting patient prognosisdirectly from image data. Moreover, once established, this systemcould be used in breast cancer clinical trials to provide an accurate,objective means for assessing breast cancer morphologic character-istics, allowing objective stratification of breast cancer patients on thebasis of morphologic criteria and facilitating the discovery of mor-phologic features associated with response to specific therapeuticagents.
RESULTS
Experimental design overviewWe developed the Computational Pathologist (C-Path), a machinelearning–based method for automatically analyzing cancer imagesand predicting prognosis. To construct and evaluate the model, weacquired hematoxylin and eosin (H&E)–stained histological imagesfrom breast cancer tissue microarrays (TMAs) (figs. S4 and S5). The
ranslationalMedicine.org 9 November 2011 Vol 3 Issue 108 108ra113 1
TMAs contain 0.6-mm-diameter cores (medianof two cores per case) that represent only a smallsample of the full tumor. We acquired data fromtwo separate and independent cohorts: Nether-lands Cancer Institute (NKI; 248 patients) andVancouver General Hospital (VGH; 328 patients).
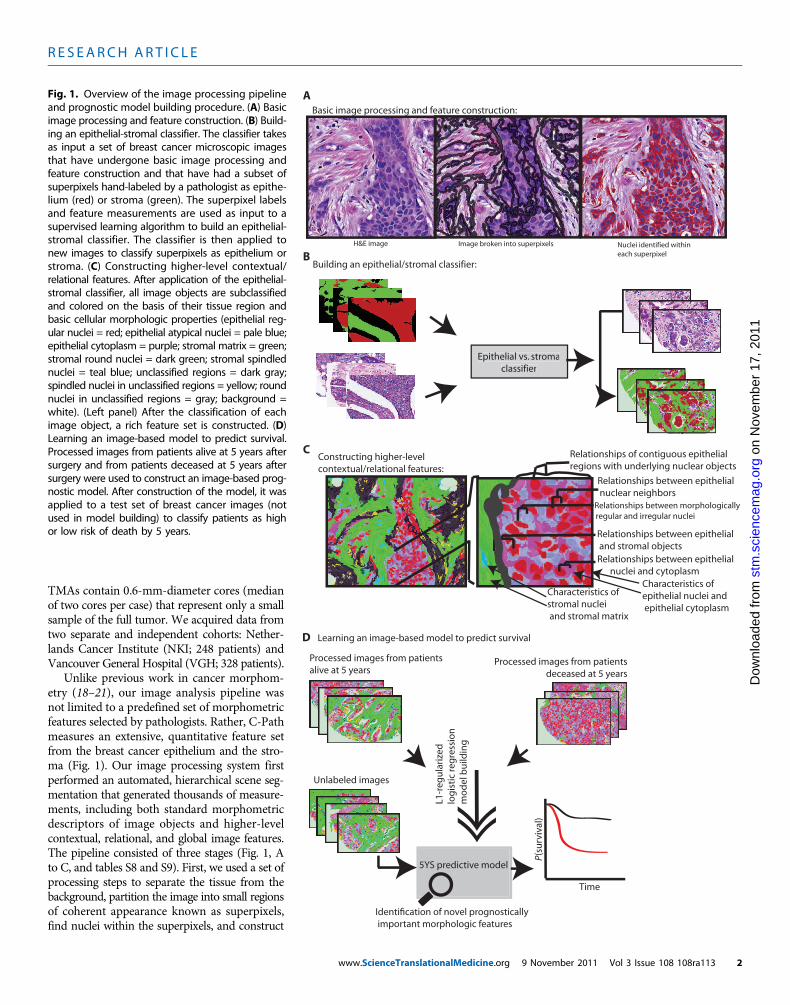
Unlike previous work in cancer morphom-etry (18–21), our image analysis pipeline wasnot limited to a predefined set of morphometricfeatures selected by pathologists. Rather, C-Pathmeasures an extensive, quantitative feature setfrom the breast cancer epithelium and the stro-ma (Fig. 1). Our image processing system firstperformed an automated, hierarchical scene seg-mentation that generated thousands of measure-ments, including both standard morphometricdescriptors of image objects and higher-levelcontextual, relational, and global image features.The pipeline consisted of three stages (Fig. 1, Ato C, and tables S8 and S9). First, we used a set ofprocessing steps to separate the tissue from thebackground, partition the image into small regionsof coherent appearance known as superpixels,find nuclei within the superpixels, and construct
Relationships between epithelial nuclear neighbors
Relationships between morphologically regular and irregular nuclei
Relationships between epithelial and stromal objectsRelationships between epithelial nuclei and cytoplasm
Characteristics of stromal nuclei and stromal matrix
Characteristics of epithelial nuclei and epithelial cytoplasm
Building an epithelial/stromal classifier:
Epithelial vs. stromaclassifier
Epithelial vs. stromaclassifier
B
Basic image processing and feature construction:
H&E image Image broken into superpixels Nuclei identified withineach superpixel
A
Relationships of contiguous epithelial regions with underlying nuclear objects
Learning an image-based model to predict survival
Processed images from patients alive at 5 years
Processed images from patients deceased at 5 years
L1-r
egu
lari
zed
log
isti
c re
gre
ssio
nm
od
el b
uild
ing
5YS predictive model
Unlabeled images
Time
P(su
rviv
al)
C
D
Identification of novel prognostically important morphologic features
Fig. 1. Overview of the image processing pipelineand prognostic model building procedure. (A) Basic
image processing and feature construction. (B) Build-ing an epithelial-stromal classifier. The classifier takesas input a set of breast cancer microscopic imagesthat have undergone basic image processing andfeature construction and that have had a subset ofsuperpixels hand-labeled by a pathologist as epithe-lium (red) or stroma (green). The superpixel labelsand feature measurements are used as input to asupervised learning algorithm to build an epithelial-stromal classifier. The classifier is then applied tonew images to classify superpixels as epithelium orstroma. (C) Constructing higher-level contextual/relational features. After application of the epithelial-stromal classifier, all image objects are subclassifiedand colored on the basis of their tissue region andbasic cellular morphologic properties (epithelial reg-ular nuclei = red; epithelial atypical nuclei = pale blue;epithelial cytoplasm = purple; stromal matrix = green;stromal round nuclei = dark green; stromal spindlednuclei = teal blue; unclassified regions = dark gray;spindled nuclei in unclassified regions = yellow; roundnuclei in unclassified regions = gray; background =white). (Left panel) After the classification of eachimage object, a rich feature set is constructed. (D)Learning an image-based model to predict survival.Processed images from patients alive at 5 years aftersurgery and from patients deceased at 5 years aftersurgery were used to construct an image-based prog-nostic model. After construction of the model, it wasapplied to a test set of breast cancer images (notused in model building) to classify patients as highor low risk of death by 5 years.
www.ScienceTranslationalMedicine.org 9 November 2011 Vol 3 Issue 108 108ra113 2
nuclear and cytoplasmic features within the superpixels (Fig. 1A). With-in each superpixel, we measured the intensity, texture, size, and shapeof the superpixel and its neighbors. Second, to produce more biolog-ically meaningful features, we classified superpixels as epithelium orstroma (Fig. 1B). We use a machine learning approach (L1-regularizedlogistic regression), in which we hand-labeled superpixels from 158 im-ages (107 NKI and 51 VGH) and used those to train the epithelium/stroma classifier. The resulting classifier comprises 31 features (Sup-plementary Material, tables S4 and S5, and figs. S6 to S10) and achievesa classification accuracy of 89% on held-out data. To construct ourfinal set of features to be used in the prognostic model, we first recom-puted the values of the basic features separately within the epitheliumand stroma. We subclassified nuclei as “typical” or “atypical” and ob-tained object measurements from contiguous epithelial and stromalregions, as well as from epithelial nuclei, epithelial atypical nuclei, epi-thelial cytoplasm, stromal round nuclei, stromal spindled nuclei, stro-mal matrix, and unclassified objects. We computed a range of relationalfeatures (Fig. 1C) that capture the global structure of the sample and thespatial relationships among its different components, such as meandistance from epithelial nucleus to stromal nucleus, mean distanceof atypical epithelial nucleus to typical epithelial nucleus, or distancebetween stromal regions (Supplementary Material, tables S6 and S7,and figs. S9 and S10). Overall, this resulted in a set of 6642 featuresper image. For patients with multiple TMA images (208 of 248 NKIpatients; 192 of 328 VGH patients), these statistics were summarizedas their mean across the images (Supplementary Material).
The NKI images were used to build an image feature–based prognos-tic model to predict the binary outcome of 5-year survival (5YS model)(Fig. 1D) using L1-regularized logistic regression, implemented in theR package glmnet (22). Model performance on the NKI data set wasassessed by eightfold cross-validation, where the data set is split into
www.ScienceT
about eight equal folds, and in each fold, the model was built withseven of the folds (up to 217 cases) and evaluated on the held-out fold.For each instance in the data set, we determined the C-Path modelresult when that instance was held out during cross-validation, whichallowed this prediction to be used for evaluating model performanceon unseen data. This procedure is known as “prevalidation” (23). Tofurther assess performance of the model, we trained the prognosticmodel on the full NKI data set and tested the model on the VGHdata set (see Materials and Methods and Supplementary Material).We excluded from this analysis the 42 VGH cases that had been usedin training the epithelial-stromal classifier.
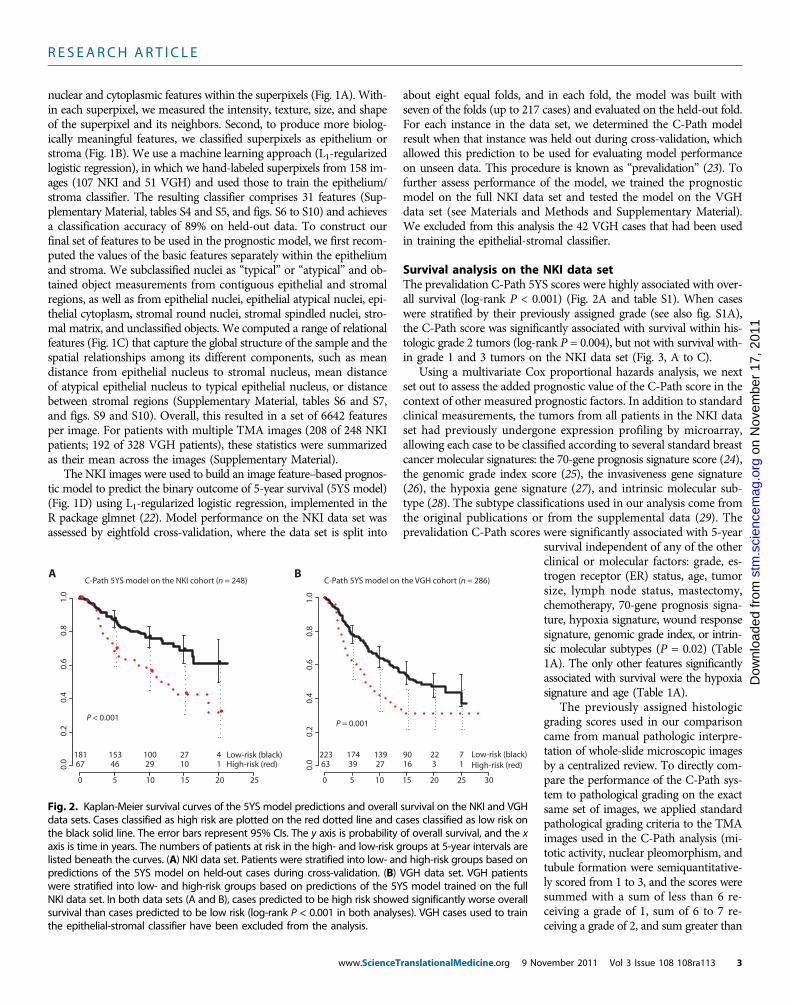
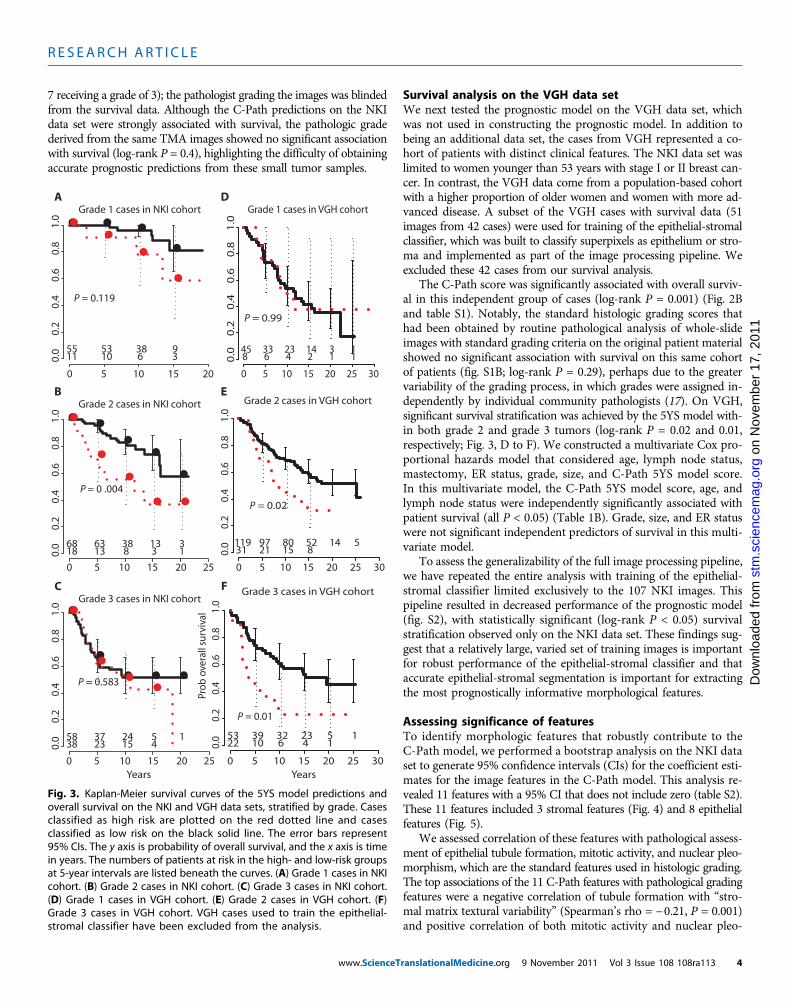
Survival analysis on the NKI data setThe prevalidation C-Path 5YS scores were highly associated with over-all survival (log-rank P < 0.001) (Fig. 2A and table S1). When caseswere stratified by their previously assigned grade (see also fig. S1A),the C-Path score was significantly associated with survival within his-tologic grade 2 tumors (log-rank P = 0.004), but not with survival with-in grade 1 and 3 tumors on the NKI data set (Fig. 3, A to C).
Using a multivariate Cox proportional hazards analysis, we nextset out to assess the added prognostic value of the C-Path score in thecontext of other measured prognostic factors. In addition to standardclinical measurements, the tumors from all patients in the NKI dataset had previously undergone expression profiling by microarray,allowing each case to be classified according to several standard breastcancer molecular signatures: the 70-gene prognosis signature score (24),the genomic grade index score (25), the invasiveness gene signature(26), the hypoxia gene signature (27), and intrinsic molecular sub-type (28). The subtype classifications used in our analysis come fromthe original publications or from the supplemental data (29). Theprevalidation C-Path scores were significantly associated with 5-year
ranslationalMedicine.org 9 No
stm
.sc
Dow
nloa
ded
from
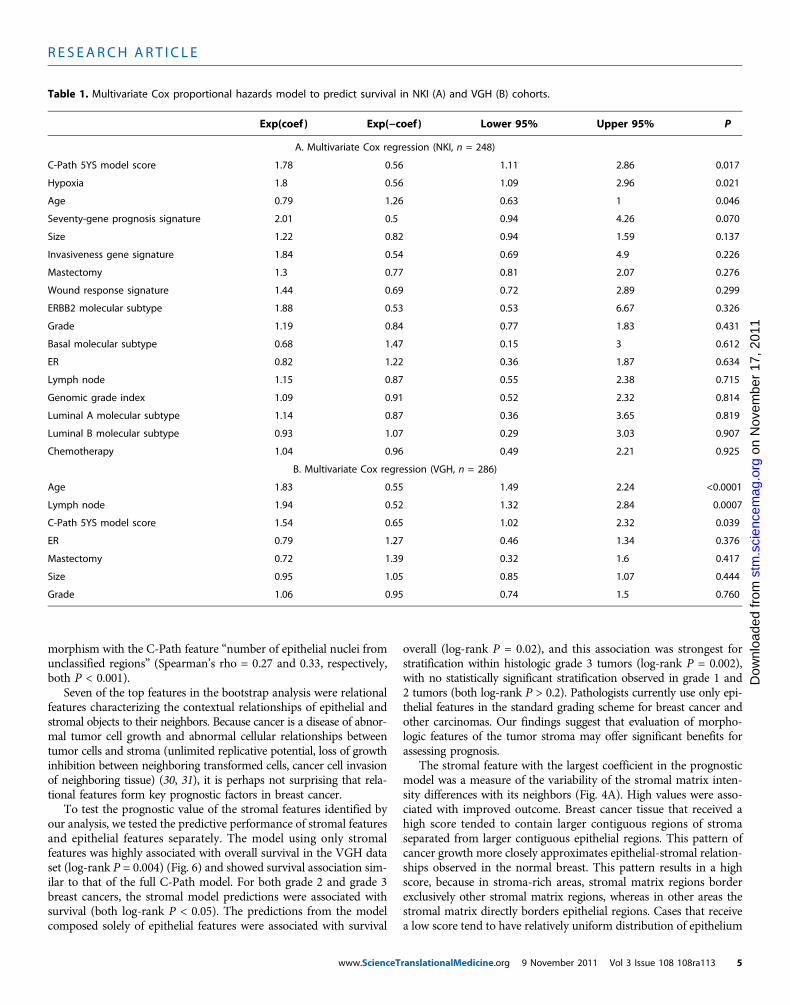
survival independent of any of the otherclinical or molecular factors: grade, es-trogen receptor (ER) status, age, tumorsize, lymph node status, mastectomy,chemotherapy, 70-gene prognosis signa-ture, hypoxia signature, wound responsesignature, genomic grade index, or intrin-sic molecular subtypes (P = 0.02) (Table1A). The only other features significantlyassociated with survival were the hypoxiasignature and age (Table 1A).
The previously assigned histologicgrading scores used in our comparisoncame from manual pathologic interpre-tation of whole-slide microscopic imagesby a centralized review. To directly com-pare the performance of the C-Path sys-tem to pathological grading on the exactsame set of images, we applied standardpathological grading criteria to the TMAimages used in the C-Path analysis (mi-totic activity, nuclear pleomorphism, andtubule formation were semiquantitative-ly scored from 1 to 3, and the scores weresummed with a sum of less than 6 re-ceiving a grade of 1, sum of 6 to 7 re-ceiving a grade of 2, and sum greater than
Fig. 2. Kaplan-Meier survival curves of the 5YS model predictions and overall survival on the NKI and VGHdata sets. Cases classified as high risk are plotted on the red dotted line and cases classified as low risk onthe black solid line. The error bars represent 95% CIs. The y axis is probability of overall survival, and the xaxis is time in years. The numbers of patients at risk in the high- and low-risk groups at 5-year intervals arelisted beneath the curves. (A) NKI data set. Patients were stratified into low- and high-risk groups based onpredictions of the 5YS model on held-out cases during cross-validation. (B) VGH data set. VGH patientswere stratified into low- and high-risk groups based on predictions of the 5YS model trained on the fullNKI data set. In both data sets (A and B), cases predicted to be high risk showed significantly worse overallsurvival than cases predicted to be low risk (log-rank P < 0.001 in both analyses). VGH cases used to trainthe epithelial-stromal classifier have been excluded from the analysis.
7 receiving a grade of 3); the pathologist grading the images was blindedfrom the survival data. Although the C-Path predictions on the NKIdata set were strongly associated with survival, the pathologic gradederived from the same TMA images showed no significant associationwith survival (log-rank P = 0.4), highlighting the difficulty of obtainingaccurate prognostic predictions from these small tumor samples.
www.ScienceT
on
Nov
embe
r 17
, 201
1st
m.s
cien
cem
ag.o
rgD
ownl
oade
d fr
om
Survival analysis on the VGH data setWe next tested the prognostic model on the VGH data set, whichwas not used in constructing the prognostic model. In addition tobeing an additional data set, the cases from VGH represented a co-hort of patients with distinct clinical features. The NKI data set waslimited to women younger than 53 years with stage I or II breast can-cer. In contrast, the VGH data come from a population-based cohortwith a higher proportion of older women and women with more ad-vanced disease. A subset of the VGH cases with survival data (51images from 42 cases) were used for training of the epithelial-stromalclassifier, which was built to classify superpixels as epithelium or stro-ma and implemented as part of the image processing pipeline. Weexcluded these 42 cases from our survival analysis.
The C-Path score was significantly associated with overall surviv-al in this independent group of cases (log-rank P = 0.001) (Fig. 2Band table S1). Notably, the standard histologic grading scores thathad been obtained by routine pathological analysis of whole-slideimages with standard grading criteria on the original patient materialshowed no significant association with survival on this same cohortof patients (fig. S1B; log-rank P = 0.29), perhaps due to the greatervariability of the grading process, in which grades were assigned in-dependently by individual community pathologists (17). On VGH,significant survival stratification was achieved by the 5YS model with-in both grade 2 and grade 3 tumors (log-rank P = 0.02 and 0.01,respectively; Fig. 3, D to F). We constructed a multivariate Cox pro-portional hazards model that considered age, lymph node status,mastectomy, ER status, grade, size, and C-Path 5YS model score.In this multivariate model, the C-Path 5YS model score, age, andlymph node status were independently significantly associated withpatient survival (all P < 0.05) (Table 1B). Grade, size, and ER statuswere not significant independent predictors of survival in this multi-variate model.
To assess the generalizability of the full image processing pipeline,we have repeated the entire analysis with training of the epithelial-stromal classifier limited exclusively to the 107 NKI images. Thispipeline resulted in decreased performance of the prognostic model(fig. S2), with statistically significant (log-rank P < 0.05) survivalstratification observed only on the NKI data set. These findings sug-gest that a relatively large, varied set of training images is importantfor robust performance of the epithelial-stromal classifier and thataccurate epithelial-stromal segmentation is important for extractingthe most prognostically informative morphological features.
Assessing significance of featuresTo identify morphologic features that robustly contribute to theC-Path model, we performed a bootstrap analysis on the NKI dataset to generate 95% confidence intervals (CIs) for the coefficient esti-mates for the image features in the C-Path model. This analysis re-vealed 11 features with a 95% CI that does not include zero (table S2).These 11 features included 3 stromal features (Fig. 4) and 8 epithelialfeatures (Fig. 5).
We assessed correlation of these features with pathological assess-ment of epithelial tubule formation, mitotic activity, and nuclear pleo-morphism, which are the standard features used in histologic grading.The top associations of the 11 C-Path features with pathological gradingfeatures were a negative correlation of tubule formation with “stro-mal matrix textural variability” (Spearman’s rho = −0.21, P = 0.001)and positive correlation of both mitotic activity and nuclear pleo-
0 5 10 15 20
0.0
0.2
0.4
0.6
0.8
1.0
55 53 38 911 10 6 3
Grade 1 cases in NKI cohort
0 5 10 15 20 25
0.0
0.2
0.4
0.6
0.8
1.0
68 63 38 13 318 13 8 3 1
Grade 2 cases in NKI cohort
0 5 10 15 20 25
0.0
0.2
0.4
0.6
0.8
1.0
58 37 24 5 138 23 15 4
Grade 3 cases in NKI cohort
P = 0.119
P = 0 .004
P = 0.583
A
B
C
D
E
F
0 5 10 15 20 25 30
0.0
0.2
0.4
0.6
0.8
1.0
45 33 23 14 3 18 6 4 2 1 1
Grade 1 cases in VGH cohort
0 5 10 15 20 25 30
0.0
0.2
0.4
0.6
0.8
1.0
119 97 80 52 14 531 21 15 8
Grade 2 cases in VGH cohort
P = 0.99
P = 0.02
YearsYears
Prob
ove
rall
surv
ival
0 5 10 15 20 25 30
0.0
0.2
0.4
0.6
0.8
1.0
53 39 32 23 5 122 10 6 4 1
Grade 3 cases in VGH cohort
P = 0.01
Fig. 3. Kaplan-Meier survival curves of the 5YS model predictions andoverall survival on the NKI and VGH data sets, stratified by grade. Cases
classified as high risk are plotted on the red dotted line and casesclassified as low risk on the black solid line. The error bars represent95% CIs. The y axis is probability of overall survival, and the x axis is timein years. The numbers of patients at risk in the high- and low-risk groupsat 5-year intervals are listed beneath the curves. (A) Grade 1 cases in NKIcohort. (B) Grade 2 cases in NKI cohort. (C) Grade 3 cases in NKI cohort.(D) Grade 1 cases in VGH cohort. (E) Grade 2 cases in VGH cohort. (F)Grade 3 cases in VGH cohort. VGH cases used to train the epithelial-stromal classifier have been excluded from the analysis.
ranslationalMedicine.org 9 November 2011 Vol 3 Issue 108 108ra113 4
morphism with the C-Path feature “number of epithelial nuclei fromunclassified regions” (Spearman’s rho = 0.27 and 0.33, respectively,both P < 0.001).
Seven of the top features in the bootstrap analysis were relationalfeatures characterizing the contextual relationships of epithelial andstromal objects to their neighbors. Because cancer is a disease of abnor-mal tumor cell growth and abnormal cellular relationships betweentumor cells and stroma (unlimited replicative potential, loss of growthinhibition between neighboring transformed cells, cancer cell invasionof neighboring tissue) (30, 31), it is perhaps not surprising that rela-tional features form key prognostic factors in breast cancer.
To test the prognostic value of the stromal features identified byour analysis, we tested the predictive performance of stromal featuresand epithelial features separately. The model using only stromalfeatures was highly associated with overall survival in the VGH dataset (log-rank P = 0.004) (Fig. 6) and showed survival association sim-ilar to that of the full C-Path model. For both grade 2 and grade 3breast cancers, the stromal model predictions were associated withsurvival (both log-rank P < 0.05). The predictions from the modelcomposed solely of epithelial features were associated with survival
www.ScienceT
overall (log-rank P = 0.02), and this association was strongest forstratification within histologic grade 3 tumors (log-rank P = 0.002),with no statistically significant stratification observed in grade 1 and2 tumors (both log-rank P > 0.2). Pathologists currently use only epi-thelial features in the standard grading scheme for breast cancer andother carcinomas. Our findings suggest that evaluation of morpho-logic features of the tumor stroma may offer significant benefits forassessing prognosis.
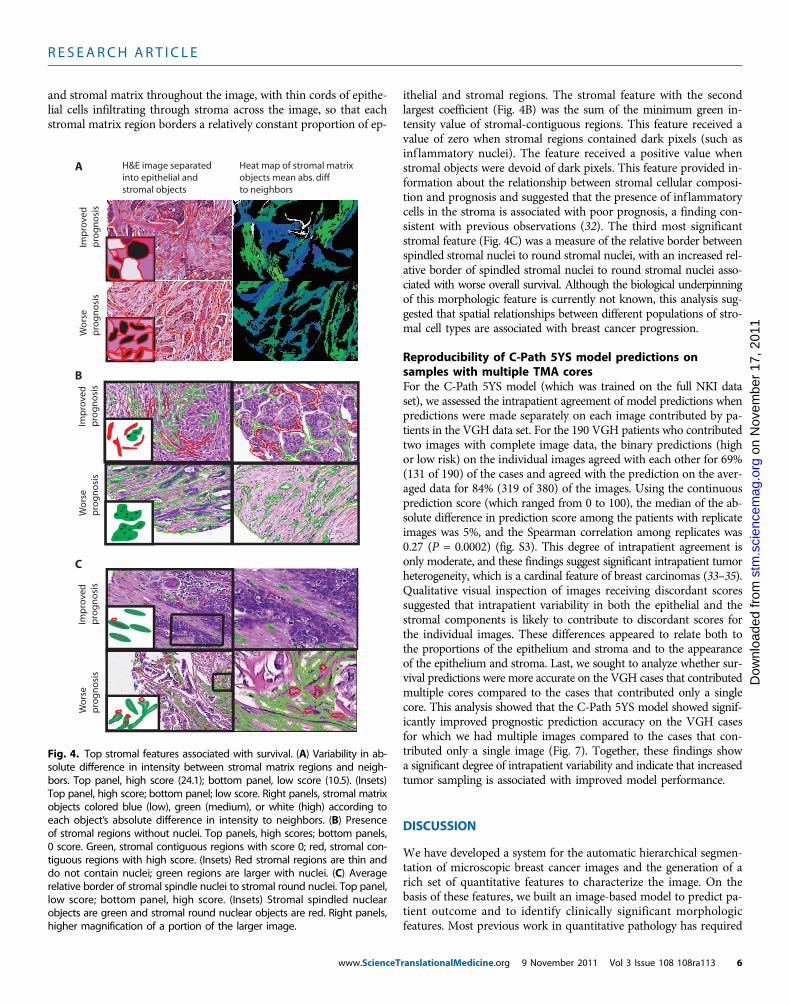
The stromal feature with the largest coefficient in the prognosticmodel was a measure of the variability of the stromal matrix inten-sity differences with its neighbors (Fig. 4A). High values were asso-ciated with improved outcome. Breast cancer tissue that received ahigh score tended to contain larger contiguous regions of stromaseparated from larger contiguous epithelial regions. This pattern ofcancer growth more closely approximates epithelial-stromal relation-ships observed in the normal breast. This pattern results in a highscore, because in stroma-rich areas, stromal matrix regions borderexclusively other stromal matrix regions, whereas in other areas thestromal matrix directly borders epithelial regions. Cases that receivea low score tend to have relatively uniform distribution of epithelium
Table 1. Multivariate Cox proportional hazards model to predict survival in NKI (A) and VGH (B) cohorts.
and stromal matrix throughout the image, with thin cords of epithe-lial cells infiltrating through stroma across the image, so that eachstromal matrix region borders a relatively constant proportion of ep-
www.ScienceT
on
Nov
embe
r 17
, 201
1st
m.s
cien
cem
ag.o
rgD
ownl
oade
d fr
om
ithelial and stromal regions. The stromal feature with the secondlargest coefficient (Fig. 4B) was the sum of the minimum green in-tensity value of stromal-contiguous regions. This feature received avalue of zero when stromal regions contained dark pixels (such asinf lammatory nuclei). The feature received a positive value whenstromal objects were devoid of dark pixels. This feature provided in-formation about the relationship between stromal cellular composi-tion and prognosis and suggested that the presence of inf lammatorycells in the stroma is associated with poor prognosis, a finding con-sistent with previous observations (32). The third most significantstromal feature (Fig. 4C) was a measure of the relative border betweenspindled stromal nuclei to round stromal nuclei, with an increased rel-ative border of spindled stromal nuclei to round stromal nuclei asso-ciated with worse overall survival. Although the biological underpinningof this morphologic feature is currently not known, this analysis sug-gested that spatial relationships between different populations of stro-mal cell types are associated with breast cancer progression.
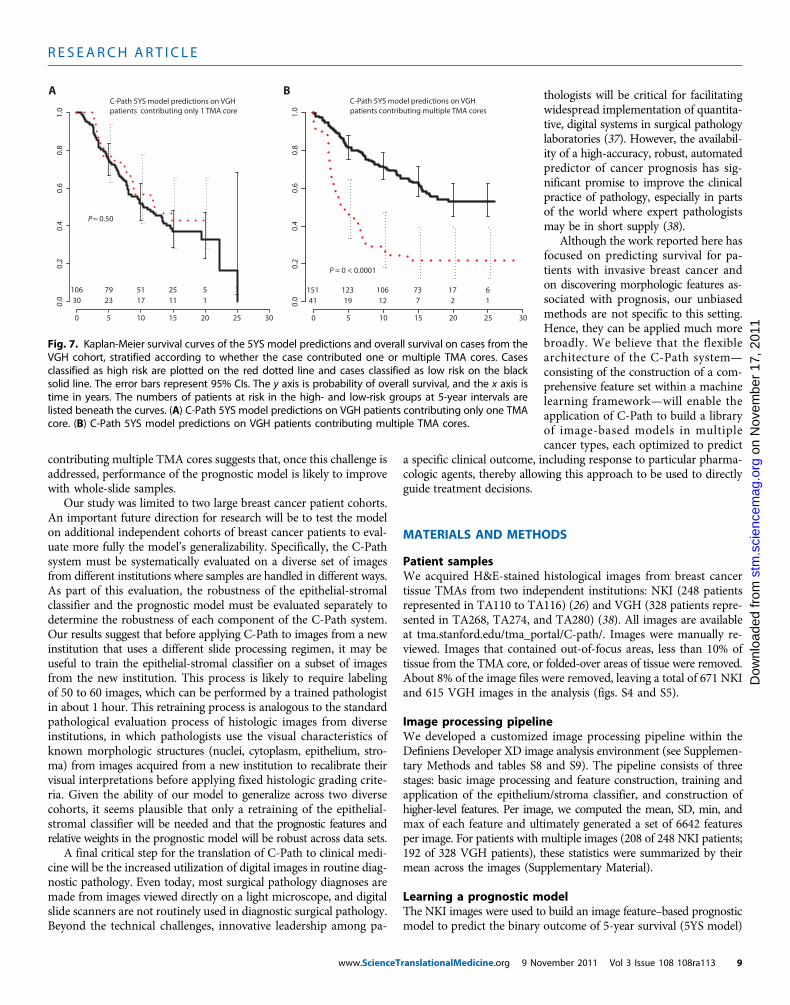
Reproducibility of C-Path 5YS model predictions onsamples with multiple TMA coresFor the C-Path 5YS model (which was trained on the full NKI dataset), we assessed the intrapatient agreement of model predictions whenpredictions were made separately on each image contributed by pa-tients in the VGH data set. For the 190 VGH patients who contributedtwo images with complete image data, the binary predictions (highor low risk) on the individual images agreed with each other for 69%(131 of 190) of the cases and agreed with the prediction on the aver-aged data for 84% (319 of 380) of the images. Using the continuousprediction score (which ranged from 0 to 100), the median of the ab-solute difference in prediction score among the patients with replicateimages was 5%, and the Spearman correlation among replicates was0.27 (P = 0.0002) (fig. S3). This degree of intrapatient agreement isonly moderate, and these findings suggest significant intrapatient tumorheterogeneity, which is a cardinal feature of breast carcinomas (33–35).Qualitative visual inspection of images receiving discordant scoressuggested that intrapatient variability in both the epithelial and thestromal components is likely to contribute to discordant scores forthe individual images. These differences appeared to relate both tothe proportions of the epithelium and stroma and to the appearanceof the epithelium and stroma. Last, we sought to analyze whether sur-vival predictions were more accurate on the VGH cases that contributedmultiple cores compared to the cases that contributed only a singlecore. This analysis showed that the C-Path 5YS model showed signif-icantly improved prognostic prediction accuracy on the VGH casesfor which we had multiple images compared to the cases that con-tributed only a single image (Fig. 7). Together, these findings showa significant degree of intrapatient variability and indicate that increasedtumor sampling is associated with improved model performance.
DISCUSSION
We have developed a system for the automatic hierarchical segmen-tation of microscopic breast cancer images and the generation of arich set of quantitative features to characterize the image. On thebasis of these features, we built an image-based model to predict pa-tient outcome and to identify clinically significant morphologicfeatures. Most previous work in quantitative pathology has required
Heat map of stromal matrixobjects mean abs. diffto neighbors
Fig. 4. Top stromal features associated with survival. (A) Variability in ab-solute difference in intensity between stromal matrix regions and neigh-bors. Top panel, high score (24.1); bottom panel, low score (10.5). (Insets)Top panel, high score; bottom panel; low score. Right panels, stromal matrixobjects colored blue (low), green (medium), or white (high) according toeach object’s absolute difference in intensity to neighbors. (B) Presenceof stromal regions without nuclei. Top panels, high scores; bottom panels,0 score. Green, stromal contiguous regions with score 0; red, stromal con-tiguous regions with high score. (Insets) Red stromal regions are thin anddo not contain nuclei; green regions are larger with nuclei. (C) Averagerelative border of stromal spindle nuclei to stromal round nuclei. Top panel,low score; bottom panel, high score. (Insets) Stromal spindled nuclearobjects are green and stromal round nuclear objects are red. Right panels,higher magnification of a portion of the larger image.
ranslationalMedicine.org 9 November 2011 Vol 3 Issue 108 108ra113 6
laborious image object identification by skilled pathologists, followedby the measurement of a small number of expert predefined features,primarily characterizing epithelial nuclear characteristics, such assize, color, and texture (21, 36). In contrast, after initial filtering of im-ages to ensure high-quality TMA images and training of the C-Pathmodels using expert-derived image annotations (epithelium andstroma labels to build the epithelial-stromal classifier and survivaltime and survival status to build the prognostic model), our imageanalysis system is automated with no manual steps, which greatly in-creases its scalability. Additionally, in contrast to previous approaches,our system measures thousands of morphologic descriptors of diverse
www.ScienceT
elements of the microscopic cancer image, including many relationalfeatures from both the cancer epithelium and the stroma, allowingidentification of prognostic features whose significance was not pre-viously recognized.
Using our system, we built an image-based prognostic model onthe NKI data set and showed that in this patient cohort the modelwas a strong predictor of survival and provided significant additionalprognostic information to clinical, molecular, and pathological prog-nostic factors in a multivariate model. We also demonstrated that theimage-based prognostic model, built using the NKI data set, is a strongprognostic factor on another, independent data set with very different
on
Nov
embe
r 17
, 201
1st
m.s
cien
cem
ag.o
rgD
ownl
oade
d fr
om
SD of the ratio of the pixel intensity SD to the mean intensity for pixels within a ring of the center of epithelial nuclei
A
The sum of the number of unclassified objects
SD of the maximum blue pixel value for atypical epithelial nuclei
Maximum distance between atypical epithelial nuclei
B
C
DMaximum value of the minimum green pixel intensity value inepithelial contiguous regions
Minimum elliptic fit of epithelial contiguous regions
SD of distance between epithelial cytoplasmic and nuclear objects
Average border between epithelial cytoplasmic objects
E
F
G
H
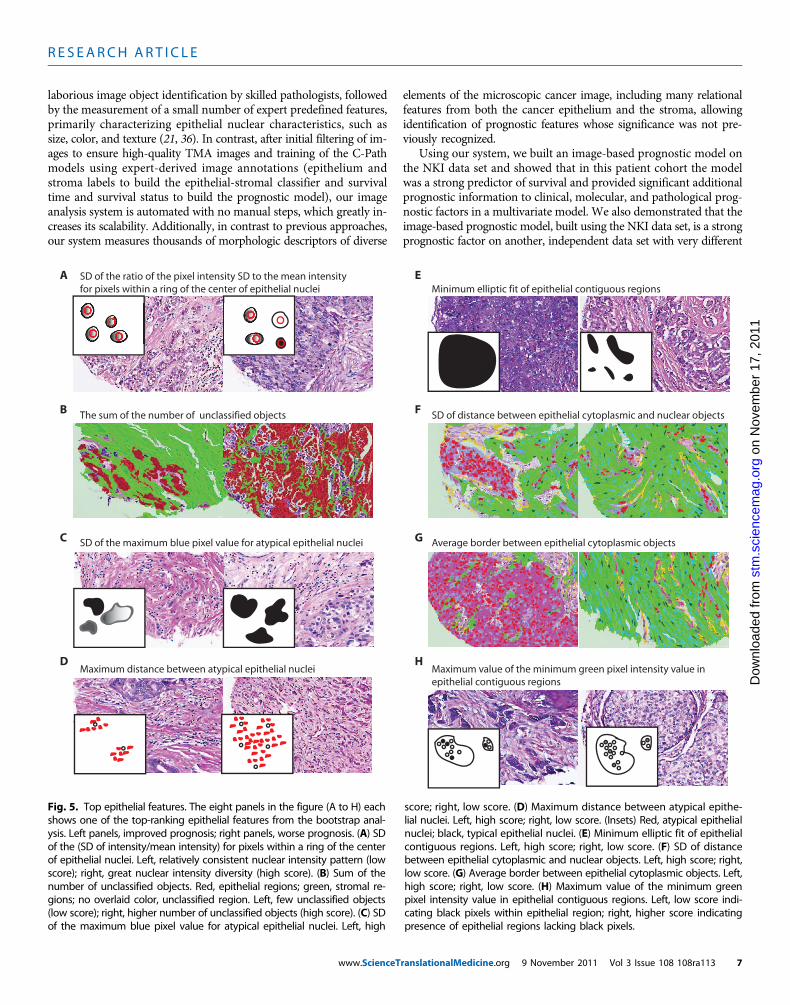
Fig. 5. Top epithelial features. The eight panels in the figure (A to H) eachshows one of the top-ranking epithelial features from the bootstrap anal-ysis. Left panels, improved prognosis; right panels, worse prognosis. (A) SDof the (SD of intensity/mean intensity) for pixels within a ring of the centerof epithelial nuclei. Left, relatively consistent nuclear intensity pattern (lowscore); right, great nuclear intensity diversity (high score). (B) Sum of thenumber of unclassified objects. Red, epithelial regions; green, stromal re-gions; no overlaid color, unclassified region. Left, few unclassified objects(low score); right, higher number of unclassified objects (high score). (C) SDof the maximum blue pixel value for atypical epithelial nuclei. Left, high
score; right, low score. (D) Maximum distance between atypical epithe-lial nuclei. Left, high score; right, low score. (Insets) Red, atypical epithelialnuclei; black, typical epithelial nuclei. (E) Minimum elliptic fit of epithelialcontiguous regions. Left, high score; right, low score. (F) SD of distancebetween epithelial cytoplasmic and nuclear objects. Left, high score; right,low score. (G) Average border between epithelial cytoplasmic objects. Left,high score; right, low score. (H) Maximum value of the minimum greenpixel intensity value in epithelial contiguous regions. Left, low score indi-cating black pixels within epithelial region; right, higher score indicatingpresence of epithelial regions lacking black pixels.
ranslationalMedicine.org 9 November 2011 Vol 3 Issue 108 108ra113 7
characteristics (VGH). These findings suggest that the C-Path modelmight be adapted to provide an objective, quantitative tool for histo-logic grading of invasive breast cancer in clinical practice.
A key goal of our project was to use an unbiased data-driven ap-proach to discover prognostically significant morphologic features inbreast cancer. This discovery-based approach has been widely usedin analysis of genomic data, but not yet in the study of cancer mor-phology from microscopic images of patient samples. Microscopicimages of cancer samples represent a rich source of biological infor-mation, because this level of resolution facilitates the detailed quan-titative assessment of cancer cells’ relationships with each other, withnormal cells, and with the tumor microenvironment, all of which rep-resent key “hallmarks of cancer” (31).
Of the top 11 features that were most robustly associated withsurvival in a bootstrap analysis, 8 were from the epithelium and 3were from the stroma. A prognostic model built on only the threestromal features was a stronger predictor of patient outcome thanone built from the epithelial features and is equally as predictiveas the model built from all features. These stromal features includeda measure of stromal inflammation, a process that has previouslybeen implicated in breast cancer progression (32), as well as sev-eral stromal morphologic features whose prognostic significance inbreast cancer has not previously been studied. Despite the grow-ing recognition of stromal molecular characteristics and the tumormicroenvironment in the regulation of carcinogenesis (8–14), sincethe grading of breast cancer began in the early 20th century, gradingcriteria have consisted entirely of epithelial features. Our analysissuggests that stromal morphologic structure is an important prog-nostic factor in breast cancer. Understanding the molecular basisfor the prognostically significant stromal morphologic phenotypesuncovered in our analysis will be informative.
Our study has several limitations, which will need to be addressedbefore translation of the C-Path system for use in clinical medicine.First, it will be necessary to establish the effectiveness of the systemon whole-slide images. All images used in our study came frombreast cancer TMA images. Each TMA image captures only a minuteportion of the full tumor volume, which is much smaller than themultiple whole-slide images used in routine diagnostic pathology.This fact is both a strength and a limitation of this study. On theone hand, our work demonstrates the ability to apply image analysistools within a machine learning framework to build a powerful micro-scopic image–based prognostic model from very small samples ofa tumor. This suggests that C-Path may prove useful for deriving prog-nostically important information from small tumor biopsy speci-mens. On the other hand, it is likely that we could have derived amore powerful prognostic model by analyzing whole-slide images,because these might allow the generation of additional higher-levelfeatures (such as measurements of tumor heterogeneity) and mightfacilitate more robust model performance because we would be sum-marizing our features over a much larger area of the tumor. Our im-age processing and machine learning pipeline is not specific to theuse of TMA images and could be adapted and retrained with a dataset of whole-slide images. Whole-slide images will require either man-ual or automated identification of breast cancer, because these largerimages typically contain regions of both cancer and normal surround-ing breast tissue. The TMA-based system did not require this step,because the TMA cores tend to sample exclusively areas of breastcancer. Nevertheless, the method’s higher performance on patients
0 5 10 15Years
15Years
15Years
20 25 30
0.0
0.2
0.4
0.6
0.8
1.0
164 133 108 68 15 5122 80 58 38 10 3
0
5 10 20 25 30
0.0
0.2
0.4
0.6
0.8
1.0
217 167 131 83 17 669 46 35 23 8 2
P = 0.02
0 5 10 20 25 30
0.0
0.2
0.4
0.6
0.8
1.0
228 179 143 90 18 658 34 23 16 7 2
P = 0.003
0
A
B
Three stromal features on VGH
Eight epithelial features on VGH
C Combined epithelial and stromal feaures on VGH
P = 0.004
Fig. 6. Kaplan-Meier survival curves of prognostic models built in anal-ysis on VGH data set limited to top features identified on NKI data set.Cases classified as high risk are plotted on the red dotted line, and casesclassified as low risk on the black solid line. The error bars represent 95%CIs. The y axis is probability of overall survival, and the x axis is time inyears. The numbers of patients at risk in the high- and low-risk groups at5-year intervals are listed beneath the curves. (A) Prognostic model builtwith three top stromal features. (B) Prognostic model built with eighttop epithelial features. (C) Prognostic model built with top epithelialand stromal features.
ranslationalMedicine.org 9 November 2011 Vol 3 Issue 108 108ra113 8
contributing multiple TMA cores suggests that, once this challenge isaddressed, performance of the prognostic model is likely to improvewith whole-slide samples.
Our study was limited to two large breast cancer patient cohorts.An important future direction for research will be to test the modelon additional independent cohorts of breast cancer patients to eval-uate more fully the model’s generalizability. Specifically, the C-Pathsystem must be systematically evaluated on a diverse set of imagesfrom different institutions where samples are handled in different ways.As part of this evaluation, the robustness of the epithelial-stromalclassifier and the prognostic model must be evaluated separately todetermine the robustness of each component of the C-Path system.Our results suggest that before applying C-Path to images from a newinstitution that uses a different slide processing regimen, it may beuseful to train the epithelial-stromal classifier on a subset of imagesfrom the new institution. This process is likely to require labelingof 50 to 60 images, which can be performed by a trained pathologistin about 1 hour. This retraining process is analogous to the standardpathological evaluation process of histologic images from diverseinstitutions, in which pathologists use the visual characteristics ofknown morphologic structures (nuclei, cytoplasm, epithelium, stro-ma) from images acquired from a new institution to recalibrate theirvisual interpretations before applying fixed histologic grading crite-ria. Given the ability of our model to generalize across two diversecohorts, it seems plausible that only a retraining of the epithelial-stromal classifier will be needed and that the prognostic features andrelative weights in the prognostic model will be robust across data sets.
A final critical step for the translation of C-Path to clinical medi-cine will be the increased utilization of digital images in routine diag-nostic pathology. Even today, most surgical pathology diagnoses aremade from images viewed directly on a light microscope, and digitalslide scanners are not routinely used in diagnostic surgical pathology.Beyond the technical challenges, innovative leadership among pa-
www.ScienceTranslationalMedicine.org 9 No
thologists will be critical for facilitatingwidespread implementation of quantita-tive, digital systems in surgical pathologylaboratories (37). However, the availabil-ity of a high-accuracy, robust, automatedpredictor of cancer prognosis has sig-nificant promise to improve the clinicalpractice of pathology, especially in partsof the world where expert pathologistsmay be in short supply (38).
Although the work reported here hasfocused on predicting survival for pa-tients with invasive breast cancer andon discovering morphologic features as-sociated with prognosis, our unbiasedmethods are not specific to this setting.Hence, they can be applied much morebroadly. We believe that the flexiblearchitecture of the C-Path system—consisting of the construction of a com-prehensive feature set within a machinelearning framework—will enable theapplication of C-Path to build a libraryof image-based models in multiplecancer types, each optimized to predict
a specific clinical outcome, including response to particular pharma-cologic agents, thereby allowing this approach to be used to directlyguide treatment decisions.
MATERIALS AND METHODS
Patient samplesWe acquired H&E-stained histological images from breast cancertissue TMAs from two independent institutions: NKI (248 patientsrepresented in TA110 to TA116) (26) and VGH (328 patients repre-sented in TA268, TA274, and TA280) (38). All images are availableat tma.stanford.edu/tma_portal/C-path/. Images were manually re-viewed. Images that contained out-of-focus areas, less than 10% oftissue from the TMA core, or folded-over areas of tissue were removed.About 8% of the image files were removed, leaving a total of 671 NKIand 615 VGH images in the analysis (figs. S4 and S5).
Image processing pipelineWe developed a customized image processing pipeline within theDefiniens Developer XD image analysis environment (see Supplemen-tary Methods and tables S8 and S9). The pipeline consists of threestages: basic image processing and feature construction, training andapplication of the epithelium/stroma classifier, and construction ofhigher-level features. Per image, we computed the mean, SD, min, andmax of each feature and ultimately generated a set of 6642 featuresper image. For patients with multiple images (208 of 248 NKI patients;192 of 328 VGH patients), these statistics were summarized by theirmean across the images (Supplementary Material).
Learning a prognostic modelThe NKI images were used to build an image feature–based prognosticmodel to predict the binary outcome of 5-year survival (5YS model)
C-Path 5YS model predictions on VGHpatients contributing multiple TMA cores
C-Path 5YS model predictions on VGHpatients contributing only 1 TMA core
A B
0 5 10 15 20 25 30
0.0
0.2
0.4
0.6
0.8
1.0
151 123 106 73 17 641 19 12 7 2 1
P = 0 < 0.0001
0 5 10 15 20 25 30
0.0
0.2
0.4
0.6
0.8
1.0
106 79 51 25 5 130 23 17 11 1
P = 0.50
Fig. 7. Kaplan-Meier survival curves of the 5YS model predictions and overall survival on cases from theVGH cohort, stratified according to whether the case contributed one or multiple TMA cores. Casesclassified as high risk are plotted on the red dotted line and cases classified as low risk on the blacksolid line. The error bars represent 95% CIs. The y axis is probability of overall survival, and the x axis istime in years. The numbers of patients at risk in the high- and low-risk groups at 5-year intervals arelisted beneath the curves. (A) C-Path 5YS model predictions on VGH patients contributing only one TMAcore. (B) C-Path 5YS model predictions on VGH patients contributing multiple TMA cores.
(table S3). To focus the model on the most relevant features, we usedL1-regularized logistic regression, implemented in the R package glmnet(22). Model performance on the NKI data set was assessed by eight-fold cross-validation; in each fold, the model was built using up to 217cases of the NKI data set and evaluated on the held-out set of 31 cases.If a case from the training set was censored before 5 years (7 of 248cases), the case was excluded from the training set. The l parameterthat controls the sparsity of the model was tuned at each fold by leave-one-out cross-validation on the training cases for that fold. Duringeach fold, the value of l was chosen that minimized the binomial de-viance on the held-out training cases. The logistic regression modelcomputes a probability of 5-year survival. To stratify patients intolow- and high-risk groups, we selected the cut point whose stratifica-tion maximized the statistical significance of the difference in overallsurvival between the high- and the low-risk groups on the trainingcases, as indicated by the log-rank test statistic. The model and cutpoint were then applied to the held-out cases, so that all held-outcases received a binary classification. To assess the statistical signifi-cance of the survival stratification observed between cases predictedto be low risk versus high risk, we computed a log-rank P value usingthe survdiff function in the R package survival. To assess the statisticalsignificance of feature coefficients in multivariate Cox proportionalmodels, we assessed each feature’s Wald statistic and associated P valueusing the function coxph in the R package survival.
To assess the robustness of the logistic regression coefficients, weperformed a bootstrap analysis on the NKI data set, implementedwith the “boot” package in R (39). On the basis of this analysis, foreach of the 6642 features, we obtained a 95% CI for the feature’s co-efficient estimate. To assess the performance of the model on the VGHdata set, we trained the prognostic model on the full NKI data set andtested the model on the VGH data set, excluding the 42 VGH casesthat had been used for training the epithelial stromal classifier.
Additional description of methods used in the analysis is providedin the Supplementary Materials and Methods.
SUPPLEMENTARY MATERIALwww.sciencetranslationalmedicine.org/cgi/content/full/3/108/108ra113/DC1Materials and MethodsFig. S1. Histologic grade and overall survival.Fig. S2. Model predictions when epithelial-stromal classifier training was limited to 107 imagesfrom NKI data set.Fig. S3. Reproducibility analysis of 5YS model performance on breast cancers with replicatecores in the VGH data set.Table S1. Univariate survival analysis.Table S2. Top features in 5YS model from bootstrap analysis.Table S3. Full 5YS model and full list of image features.Table S4. Epithelial-stromal classifier.Table S5. Data table to generate epithelial-stromal classifier.Table S6. Full image feature data set (values averaged per patient and scaled).Table S7. Full raw image feature data set (raw values for each individual image).Table S8. Definiens rule set to extract features from each superpixel.Table S9. Definiens rule set to apply epi-stroma classifier and generate feature set.
REFERENCES AND NOTES1. J. Müller, C. West, On the Nature and Structural Characteristics of Cancer, and of Those Morbid
Growths Which May Be Confounded with It (Sherwood, Gilbert, and Piper, London, 1840).2. D. H. Patey, R. W. Scarff, The position of histology in the prognosis of carcinoma of the
breast. Lancet 211, 801–804 (1928).3. H. J. Bloom, W. W. Richardson, Histological grading and prognosis in breast cancer; a
study of 1409 cases of which 359 have been followed for 15 years. Br. J. Cancer 11,359–377 (1957).
www.ScienceTra
4. V. Le Doussal, M. Tubiana-Hulin, S. Friedman, K. Hacene, F. Spyratos, M. Brunet, Prognosticvalue of histologic grade nuclear components of Scarff-Bloom-Richardson (SBR). Animproved score modification based on a multivariate analysis of 1262 invasive ductalbreast carcinomas. Cancer 64, 1914–1921 (1989).
5. C. W. Elston, I. O. Ellis, Pathological prognostic factors in breast cancer. I. The value of histo-logical grade in breast cancer: Experience from a large study with long-term follow-up.Histopathology 19, 403–410 (1991).
6. C. Sotiriou, M. J. Piccart, Taking gene-expression profiling to the clinic: When will molecularsignatures become relevant to patient care? Nat. Rev. Cancer 7, 545–553 (2007).
7. J. S. Reis-Filho, B. Weigelt, D. Fumagalli, C. Sotiriou, Molecular profiling: Moving away fromtumor philately. Sci. Transl. Med. 2, 47ps43 (2010).
8. M. J. Bissell, D. Radisky, Putting tumours in context. Nat. Rev. Cancer 1, 46–54 (2001).9. B. S. Wiseman, Z. Werb, Stromal effects on mammary gland development and breast
cancer. Science 296, 1046–1049 (2002).10. R. B. West, D. S. Nuyten, S. Subramanian, T. O. Nielsen, C. L. Corless, B. P. Rubin, K. Montgomery,
S. Zhu, R. Patel, T. Hernandez-Boussard, J. R. Goldblum, P. O. Brown, M. van de Vijver,M. van de Rijn, Determination of stromal signatures in breast carcinoma. PLoS Biol. 3,e187 (2005).
11. A. H. Beck, I. Espinosa, C. B. Gilks, M. van de Rijn, R. B. West, The fibromatosis signa-ture defines a robust stromal response in breast carcinoma. Lab. Invest. 88, 591–601(2008).
12. A. Bergamaschi, E. Tagliabue, T. Sørlie, B. Naume, T. Triulzi, R. Orlandi, H. G. Russnes,J. M. Nesland, R. Tammi, P. Auvinen, V. M. Kosma, S. Ménard, A. L. Børresen-Dale, Extra-cellular matrix signature identifies breast cancer subgroups with different clinical outcome.J. Pathol. 214, 357–367 (2008).
13. A. E. Karnoub, A. B. Dash, A. P. Vo, A. Sullivan, M. W. Brooks, G. W. Bell, A. L. Richardson,K. Polyak, R. Tubo, R. A. Weinberg, Mesenchymal stem cells within tumour stroma promotebreast cancer metastasis. Nature 449, 557–563 (2007).
14. G. Finak, N. Bertos, F. Pepin, S. Sadekova, M. Souleimanova, H. Zhao, H. Chen, G. Omeroglu,S. Meterissian, A. Omeroglu, M. Hallett, M. Park, Stromal gene expression predicts clinicaloutcome in breast cancer. Nat. Med. 14, 518–527 (2008).
15. G. Bianchini, Y. Qi, R. H. Alvarez, T. Iwamoto, C. Coutant, N. K. Ibrahim, V. Valero,M. Cristofanilli, M. C. Green, L. Radvanyi, C. Hatzis, G. N. Hortobagyi, F. Andre, L. Gianni,W. F. Symmans, L. Pusztai, Molecular anatomy of breast cancer stroma and its prognosticvalue in estrogen receptor-positive and -negative cancers. J. Clin. Oncol. 28, 4316–4323(2010).
16. G. G. Van den Eynden, C. G. Colpaert, A. Couvelard, F. Pezzella, L. Y. Dirix, P. B. Vermeulen,E. A. Van Marck, T. Hasebe, A fibrotic focus is a prognostic factor and a surrogate markerfor hypoxia and (lymph)angiogenesis in breast cancer: Review of the literature andproposal on the criteria of evaluation. Histopathology 51, 440–451 (2007).
17. T. R. Fanshawe, A. G. Lynch, I. O. Ellis, A. R. Green, R. Hanka, Assessing agreement betweenmultiple raters with missing rating information, applied to breast cancer tumour grading.PLoS One 3, e2925 (2008).
18. J. P. Baak, P. H. Kurver, S. de Graaf, M. E. Boon, Morphometry for prognosis prediction inbreast cancer. Lancet 2, 315 (1981).
19. C. Cordon-Cardo, A. Kotsianti, D. A. Verbel, M. Teverovskiy, P. Capodieci, S. Hamann,Y. Jeffers, M. Clayton, F. Elkhettabi, F. M. Khan, M. Sapir, V. Bayer-Zubek, Y. Vengrenyuk,S. Fogarsi, O. Saidi, V. E. Reuter, H. I. Scher, M. W. Kattan, F. J. Bianco, T. M. Wheeler,G. E. Ayala, P. T. Scardino, M. J. Donovan, Improved prediction of prostate cancer recur-rence through systems pathology. J. Clin. Invest. 117, 1876–1883 (2007).
20. M. J. Donovan, S. Hamann, M. Clayton, F. M. Khan, M. Sapir, V. Bayer-Zubek, G. Fernandez,R. Mesa-Tejada, M. Teverovskiy, V. E. Reuter, P. T. Scardino, C. Cordon-Cardo, Systemspathology approach for the prediction of prostate cancer progression after radicalprostatectomy. J. Clin. Oncol. 26, 3923–3929 (2008).
21. A. H. Beck, M. B. Resnick, K. C. Drumea, E. Sabo, Quantitative Image Analysis for theClassification of Epithelial Neoplasia in Image Analysis in Medical Microscopy and Pathology,H. S. Wu, A. Einstein, Eds. (Research Signpost, Kerala, India, 2007).
22. J. Friedman, T. Hastie, R. Tibshirani, Regularization paths for generalized linear models viacoordinate descent. J. Stat. Softw. 33, 1–22 (2010).
23. R. J. Tibshirani, B. Efron, Pre-validation and inference in microarrays. Stat. Appl. Genet.Mol. Biol. 1, Article1 (2002).
24. M. J. van de Vijver, Y. D. He, L. J. van’t Veer, H. Dai, A. A. Hart, D. W. Voskuil, G. J. Schreiber,J. L. Peterse, C. Roberts, M. J. Marton, M. Parrish, D. Atsma, A. Witteveen, A. Glas,L. Delahaye, T. van der Velde, H. Bartelink, S. Rodenhuis, E. T. Rutgers, S. H. Friend,R. Bernards, A gene-expression signature as a predictor of survival in breast cancer.N. Engl. J. Med. 347, 1999–2009 (2002).
25. C. Sotiriou, P. Wirapati, S. Loi, A. Harris, S. Fox, J. Smeds, H. Nordgren, P. Farmer, V. Praz,B. Haibe-Kains, C. Desmedt, D. Larsimont, F. Cardoso, H. Peterse, D. Nuyten, M. Buyse,M. J. Van de Vijver, J. Bergh, M. Piccart, M. Delorenzi, Gene expression profiling inbreast cancer: Understanding the molecular basis of histologic grade to improveprognosis. J. Natl. Cancer Inst. 98, 262–272 (2006).
nslationalMedicine.org 9 November 2011 Vol 3 Issue 108 108ra113 10
26. R. Liu, X. Wang, G. Y. Chen, P. Dalerba, A. Gurney, T. Hoey, G. Sherlock, J. Lewicki, K. Shedden,M. F. Clarke, The prognostic role of a gene signature from tumorigenic breast-cancercells. N. Engl. J. Med. 356, 217–226 (2007).
27. J. T. Chi, Z. Wang, D. S. Nuyten, E. H. Rodriguez, M. E. Schaner, A. Salim, Y. Wang,G. B. Kristensen, A. Helland, A. L. Børresen-Dale, A. Giaccia, M. T. Longaker, T. Hastie,G. P. Yang, M. J. van de Vijver, P. O. Brown, Gene expression programs in response tohypoxia: Cell type specificity and prognostic significance in human cancers. PLoS Med.3, e47 (2006).
28. T. Sørlie, C. M. Perou, R. Tibshirani, T. Aas, S. Geisler, H. Johnsen, T. Hastie, M. B. Eisen,M. van de Rijn, S. S. Jeffrey, T. Thorsen, H. Quist, J. C. Matese, P. O. Brown, D. Botstein,P. Eystein Lønning, A. L. Børresen-Dale, Gene expression patterns of breast carcinomasdistinguish tumor subclasses with clinical implications. Proc. Natl. Acad. Sci. U.S.A. 98,10869–10874 (2001).
29. D. S. Nuyten, T. Hastie, J. T. Chi, H. Y. Chang, M. J. van de Vijver, Combining biological geneexpression signatures in predicting outcome in breast cancer: An alternative to supervisedclassification. Eur. J. Cancer 44, 2319–2329 (2008).
30. D. Hanahan, R. A. Weinberg, The hallmarks of cancer. Cell 100, 57–70 (2000).31. D. Hanahan, R. A. Weinberg, Hallmarks of cancer: The next generation. Cell 144, 646–674
(2011).32. W. Tan, W. Zhang, A. Strasner, S. Grivennikov, J. Q. Cheng, R. M. Hoffman, M. Karin, Tumour-
infiltrating regulatory T cells stimulate mammary cancer metastasis through RANKL-RANKsignalling. Nature 470, 548–553 (2011).
33. S. P. Shah, R. D. Morin, J. Khattra, L. Prentice, T. Pugh, A. Burleigh, A. Delaney, K. Gelmon,R. Guliany, J. Senz, C. Steidl, R. A. Holt, S. Jones, M. Sun, G. Leung, R. Moore, T. Severson,G. A. Taylor, A. E. Teschendorff, K. Tse, G. Turashvili, R. Varhol, R. L. Warren, P. Watson,Y. Zhao, C. Caldas, D. Huntsman, M. Hirst, M. A. Marra, S. Aparicio, Mutational evolutionin a lobular breast tumour profiled at single nucleotide resolution. Nature 461, 809–813 (2009).
34. L. Ding, M. J. Ellis, S. Li, D. E. Larson, K. Chen, J. W. Wallis, C. C. Harris, M. D. McLellan,R. S. Fulton, L. L. Fulton, R. M. Abbott, J. Hoog, D. J. Dooling, D. C. Koboldt, H. Schmidt,J. Kalicki, Q. Zhang, L. Chen, L. Lin, M. C. Wendl, J. F. McMichael, V. J. Magrini, L. Cook,S. D. McGrath, T. L. Vickery, E. Appelbaum, K. Deschryver, S. Davies, T. Guintoli, L. Lin,R. Crowder, Y. Tao, J. E. Snider, S. M. Smith, A. F. Dukes, G. E. Sanderson, C. S. Pohl,K. D. Delehaunty, C. C. Fronick, K. A. Pape, J. S. Reed, J. S. Robinson, J. S. Hodges,W. Schierding, N. D. Dees, D. Shen, D. P. Locke, M. E. Wiechert, J. M. Eldred, J. B. Peck,
www.ScienceTra
B. J. Oberkfell, J. T. Lolofie, F. Du, A. E. Hawkins, M. D. O’Laughlin, K. E. Bernard,M. Cunningham, G. Elliott, M. D. Mason, D. M. Thompson Jr., J. L. Ivanovich, P. J. Goodfellow,C. M. Perou, G. M. Weinstock, R. Aft, M. Watson, T. J. Ley, R. K. Wilson, E. R. Mardis,Genome remodelling in a basal-like breast cancer metastasis and xenograft. Nature464, 999–1005 (2010).
35. A. Marusyk, K. Polyak, Tumor heterogeneity: Causes and consequences. Biochim.Biophys. Acta 1805, 105–117 (2010).
36. L. Mulrane, E. Rexhepaj, S. Penney, J. J. Callanan, W. M. Gallagher, Automated imageanalysis in histopathology: A valuable tool in medical diagnostics. Expert Rev. Mol. Diagn.8, 707–725 (2008).
37. J. P. Baak, The framework of pathology: Good laboratory practice by quantitative andmolecular methods. J. Pathol. 198, 277–283 (2002).
38. C. L. Hitchcock, The future of telepathology for the developing world. Arch. Pathol.Lab. Med. 135, 211–214 (2011).
39. A. C. Davison, D. V. Hinkley, Bootstrap Methods and Their Applications (Cambridge Univ.Press, Cambridge, UK, 1997).
40. Funding: A.H.B. is an Advanced Residency Training at Stanford fellow and is the recipientof a Residents Research Grant from the College of American Pathologists. This project wasfunded by the Stanford University Department of Pathology and by the Stanford Univer-sity Bio-X Interdisciplinary Initiatives Program. Author contributions: A.H.B., D.K., R.B.W.,and M.v.d.R. conceived the study. A.H.B. and D.K. designed the methods and performedthe analysis. A.R.S. contributed histopathological analysis of images. S.L., R.J.M., T.O.N., andM.J.v.d.V. contributed images and image annotation data. All authors contributed to prep-aration of the manuscript. Competing interests: The authors declare that they have nocompeting interests. Data availability: Image files used in this analysis are available attma.stanford.edu/tma_portal/C-path/.
Submitted 25 April 2011Accepted 21 October 2011Published 9 November 201110.1126/scitranslmed.3002564
Citation: A. H. Beck, A. R. Sangoi, S. Leung, R. J. Marinelli, T. O. Nielsen, M. J. van de Vijver,R. B. West, M. van de Rijn, D. Koller, Systematic analysis of breast cancer morphology uncoversstromal features associated with survival. Sci. Transl. Med. 3, 108ra113 (2011).
e
nslationalMedicine.org 9 November 2011 Vol 3 Issue 108 108ra113 11