BUSINESS.NASDAQ.COM/DORSEY-WRIGHT DORSEY WRIGHT Systematic Relative Strength Portfolios Solutions Rooted in The Law of Supply and Demand WHY RELATIVE STRENGTH? / With each passing year, global financial markets offer more and more choices to investors. More choice can be good, if investors have a logical framework to analyze this broad universe of securities. We all know that the financial markets offer ample quantities of both risk and return. In fact, it is because of the risk that the return is possible. We believe financial markets continue to provide the best available opportunities for investors to build and preserve longterm wealth. However, to capitalize on the opportunities in the financial markets, an investor should have a systematic investment strategy. Our Relative Strength portfolios offer just such a systematic approach to investing. Relative strength is the investment factor upon which each of our portfolios is built. We rely on relative strength to manage portfolios because of its adaptive nature and its longterm track record. Relative strength is simple in concept, yet powerful in application. Relative strength is simply the comparison of price performance within a universe of securities. Analyzing securities by their relative strength provides a way to identify the current leaders. It is those market leaders that we want to own. Relative strength also allows us to identify the laggards. Successful investing also requires avoiding big losers. We believe relative strength is equally good at identifying long-term winners and losers. Relative strength analysis is not confined just to the financial markets. If I gave you a list of the 100 best golfers worldwide and asked you to pick who you thought would be in the top 10 at the end of the next quarter, who would you pick? My guess is you would pick the current top ten to be in the top three months from now. Even if I asked you to pick the ones who would be in the top ten after one year, you would probably pick the current top ten. At the end of the contest some would have fallen out and some would have moved up, but the majority would still be in the top ten. It relates to Newton’s Law of motion, which suggests that objects that are in motion tend to stay in motion until an extended force acts upon them. So, in the financial world this means that stocks that have good fundamentals, in a market that in general is supporting higher prices, tend to continue to do well. Golfers who have good fundamentals, are in good shape, and at the top of their game, tend to continue to do well. Buy the winners. Aggressive / Core / Growth / International / Global Macro / Balanced / Tactical Fixed Income
Transcript
BUSINESS.NASDAQ.COM/DORSEY-WRIGHT
DORSEY WRIGHT
Systematic Relative Strength PortfoliosSolutions Rooted in The Law of Supply and Demand
WHY RELATIVE STRENGTH? /With each passing year, global financial markets offer more and more choices to investors. More choice can be good, if investors have a logical framework to analyze this broad universe of securities. We all know that the financial markets offer ample quantities of both risk and return. In fact, it is because of the risk that the return is possible. We believe financial markets continue to provide the best available opportunities for investors to build and preserve longterm wealth. However, to capitalize on the opportunities in the financial markets, an investor should have a systematic investment strategy. Our Relative Strength portfolios offer just such a systematic approach to investing. Relative strength is the investment factor upon which each of our portfolios is built.
We rely on relative strength to manage portfolios because of its adaptive nature and its longterm track record. Relative strength is simple in concept, yet powerful in application. Relative strength is simply the comparison of price performance within a universe of securities. Analyzing securities by their relative strength provides a way to identify the current leaders. It is those market leaders that we want to own. Relative strength also allows us to identify the laggards. Successful investing also requires avoiding big losers. We believe relative strength is equally good at identifying long-term winners and losers. Relative strength analysis is not confined just to the financial markets. If I gave you a list of the 100 best golfers worldwide and asked you to pick who you thought would be in the top 10 at the end of the next quarter, who would you pick? My guess is you would pick the current top ten to be in the top three months from now. Even if I asked you to pick the ones who would be in the top ten after one year, you would probably pick the current top ten. At the end of the contest some would have fallen out and some would have moved up, but the majority would still be in the top ten. It relates to Newton’s Law of motion, which suggests that objects that are in motion tend to stay in motion until an extended force acts upon them. So, in the financial world this means that stocks that have good fundamentals, in a market that in general is supporting higher prices, tend to continue to do well. Golfers who have good fundamentals, are in good shape, and at the top of their game, tend to continue to do well.
Buy the winners.
Aggressive / Core / Growth / International / Global Macro / Balanced / Tactical Fixed Income
This Mid and Large Cap U.S. equity strategy seeks to achieve long-term capital appreciation. It invests in securities that demonstrate powerful relative strength characteristics and requires that the securities maintain strong relative strength in order to remain in the portfolio.
Core:
This Mid and Large Cap U.S. equity strategy seeks to achieve long-term capital appreciation. This portfolio invests in securities that demonstrate powerful relative strength characteristics and requires that the securities maintain strong relative strength in order to remain in the portfolio. This strategy tends to have lower turnover and higher tax efficiency than our Aggressive strategy.
Growth:
This Mid and Large Cap U.S. equity strategy seeks to achieve long-term capital appreciation with some degree of risk mitigation. This portfolio invests in securities that demonstrate powerful relative strength characteristics and requires that the securities maintain strong relative strength in order to remain in the portfolio. This portfolio also has an equity exposure overlay that, when activated, allows the account to hold up to 50% cash if necessary.
International:
This All-Cap International equity strategy seeks to achieve long-term capital appreciation through a portfolio of international companies in both developed and emerging markets. This portfolio invests in those securities with powerful relative strength characteristics and requires that the securities maintain strong relative strength in order to remain in the portfolio. Exposure to international markets is achieved through American Depository Receipts (ADRs).
Global Macro:
This global tactical asset allocation strategy seeks to achieve meaningful risk diversification and investment returns. The strategy invests across multiple asset classes: Domestic Equities (long & inverse), International Equities (long & inverse), Fixed Income, Real Estate, Currencies, and Commodities. Exposure to each of these areas is achieved through exchange-traded funds (ETFs).
Balanced:
This strategy includes equities from our Core strategy (see above) and high-quality U.S. fixed income in approximately a 60% equity / 40% fixed income mix. This strategy seeks to provide long-term capital appreciation and income with moderate volatility.
Tactical Fixed Income:
This strategy seeks to provide current income and strong risk-adjusted fixed income returns. The strategy invests across multiple sectors of the fixed income market: U.S. government bonds, investment grade corporate bonds, high yield bonds, Treasury inflation protected securities (TIPS), convertible bonds, and international bonds. Exposure to each of these areas is achieved through exchange-traded funds (ETFs).
The following chart is based on Dorsey Wright’s opinion of the likely relationship between volatility and return relationships between each of the different strategies over a long period of time. Actual results may differ from these expectations. Greater volatility may result in greater gains and greater losses.
ABOUT US /Nasdaq Dorsey Wright is a registered investment advisory firm with offices in Richmond, Virginia and Pasadena, California. Since 1987, Dorsey Wright has been a leading advisor to financial professionals globally. In 2015, Dorsey Wright was acquired by Nasdaq, Inc.
Dorsey Wright’s expertise, and the cornerstone of our firm’s investment approach, is technical analysis. We use Point & Figure Charting, Relative Strength Analysis, and numerous other tools to analyze market data and deliver actionable insights. These tools cut through the clutter of day-to-day market action, identifying meaningful patterns in daily share price movements.
Dorsey Wright offers comprehensive investment research and analysis through our Global Technical Research Platform and various models and indexes, which apply our expertise in Relative Strength to separately managed accounts, mutual funds, exchange traded funds and other financial products.
JOHN LEWIS, CMT / Senior Portfolio ManagerIn this role, Mr. Lewis is responsible for the investment strategies used in various different indices and models.
Since joining Dorsey Wright in 2002, Mr. Lewis has developed strategies for the firm’s Systematic Relative Strength series of separate accounts, the Technical Leaders Index methodology, global asset allocation strategies, and multiple series of UITs. His work is technically driven and focuses on relative strength and momentum as the main factors in the investment process.
One of the foremost experts on relative strength investing, Mr. Lewis has authored several original research papers on the subject. He is a Chartered Market Technician (CMT) and a member of the Market Technician’s Association and the American Association of Professional Technical Analysts.
Mr. Lewis earned an M.B.A. in Finance from the University of Southern California and a B.A. from the University of San Diego. He began his career in the investment industry in 1994. He is married and has two children.
ANDY HYER, CFP®, CIMA®, CMT / Client Portfolio ManagerA member of the portfolio management team at Dorsey Wright and is responsible for sales and service of investment strategies across Dorsey Wright’s funds, ETFs and SMA accounts.
Since joining Dorsey Wright in 2004, he has authored original research on the subject of technical analysis and speaks and writes regularly on the topic of momentum investing. He is a CERTIFIED FINANCIAL PLANNER, Certified Investment Management Analyst, and a Chartered Market Technician.
He enjoys running and biking. He is married and has five children. He holds a B.S. from Utah State University with a dual degree in Finance and Economics.
CHARLIE COLEMAN / Associate Portfolio ManagerCharlie joined Dorsey Wright in November 2016. He began his career with Holly Street Wealth Advisors in Pasadena, CA. As one of the founding team members, Charlie worked to build out the operations, technology, and marketing material of the firm. He is currently studying for the CMT and is a holder of the series 65.
In his spare time Charlie enjoys cooking and running. He is married with one child. He graduated from the University of California at Fullerton in 2012 with a major in American Studies with a focus in business and minor in Entrepreneurship.
The Chartered Market Technician® (CMT) Certification Program requires candidates to demonstrate proficiency in a broad range of topics in the field of Technical Analysis and is administered by The Market Technician Association. The Certified Investment Management Analyst Certification Program® (CIMA) requires candidates to integrate a complex body of investment knowledge and is administered by The Investment Management Consultants Association. The CERTIFIED FINANCIAL PLANNERTM certification (CFP) requires candidates to integrate a complex body of financial planning knowledge and is administered by The CFP Board.
STRATEGY DESCRIPTION /The Dorsey Wright Systematic RS Aggressive strategy invests in securities that, in our opinion, demonstrate favorable relative strength characteristics from a universe of U.S. Mid & Large Cap equities. The strategy holds approximately 25 securities and remains fully invested for maximum equity participation. The strategy has an industry overlay designed to overweight sectors with the greatest relative strength. The strategy is diversified across multiple sectors and industries.
The Systematic RS Aggressive strategy is constructed pursuant to Dorsey Wright’s proprietary sector ranking and stock rotation methodology.
This strategy is uniquely positioned from an investment opportunity perspective because it is not limited by style (value or growth) or investment capitalization (mid or large). Rather, the Systematic Relative Strength Aggressive strategy is allowed the flexibility to seek out the strongest trends wherever they may be found within the universe of U.S. Mid & Large Cap equities.
OBJECTIVE /Seeks to achieve long-term capital appreciation
MINIMUM INVESTMENT /$100,000
Annual Performance1 (%)
AGGRESSIVE (GROSS) AGGRESSIVE (NET) S&P 500
20052 26.03 24.96 7.21
2006 5.42 3.46 15.80
2007 34.85 32.69 5.49
2008 -46.88 -48.11 -37.00
2009 10.99 8.82 26.46
2011 28.02 25.65 15.07
2011 -6.45 -8.33 2.12
2012 16.23 14.22 15.98
2013 27.47 25.33 32.42
2014 8.70 6.77 13.69
2015 8.78 7.14 1.41
2016 16.57 14.64 11.98
20173 5.10 4.70 6.07
1See Important Disclosures in Appendix A; 2Inception 3/31/2005; 3Updated through 3/31/2017, performance is preliminary; Gross performance does not include the deduction of fees, expenses, and other transaction costs which will over time have a material impact on investment performance.
Strategy and Benchmark Performance History1 (%)
YTD 1 YEAR 3 YEAR 5 YEAR 10 YEAR
Aggressive (Gross) 5.10 25.15 11.68 14.11 6.26
Aggressive (Net) 4.70 23.15 9.87 12.22 4.35
S&P 500 6.07 17.20 10.38 13.31 7.51
SRS Aggressive vs. S&P 500 (Apr 2005 - Mar 2017
Past performance is no guarantee of future results.
The performance represented in this brochure is based on monthly performance of the Systematic Relative Strength Aggressive Model. Net
performance shown is total return net of management fees, commissions, and expenses for all Dorsey Wright managed accounts, managed
for each complete quarter for each objective, regardless of levels of fixed income and cash in each account. The advisory fees are described
in Part 2A of the adviser’s Form ADV. The starting values on 3/31/2005 are assigned an arbitrary value of 100 and statement portfolios are
revalued on a trade date basis on the last day of each quarter. All returns since inception of actual Accounts are compared against the S&P 500
Index. The S&P 500 is a stock market index based on the market capitalizations of 500 leading companies publicly traded in the U.S. stock
market, as defined by Standard & Poor’s. A list of all holdings over the past 12 months is available upon request. The performance information
is based on data supplied by the Manager or from statistical services, reports, or other sources which the Manager believes are reliable.
Definition of statistical terms:
Performance: Net annualized performance.
Volatility: Annualized standard deviation. Standard deviation shows how much variation or dispersion exists from the average value.
Beta: A measure of systematic or market-related risk.
Alpha: A measure of non-market return associated with the portfolio. See Modern Portfolio Theory for more information.
Correlation: Compresses covariance into a range of +/- 1. A negative correlation indicates an inverse relationship whereas a positive correlation is indicative of a direct relationship.
Annual turnover: An annualized measure of the percentage of the portfolio that was traded.
FOR MORE INFORMATION /Dorsey Wright Money Management Registered Investment Advisor
ABOUT DORSEY WRIGHT /Dorsey Wright (DW), a Nasdaq company, has been a leading provider of technical research to financial professionals for over 25 years. Our comprehensive research platform is a complete technical analysis solution – from broad market insights, to portfolio management tools and investment models, to Point and Figure charts on over 80,000 securities and indicators worldwide.
Dorsey, Wright & Associates, LLC, a Nasdaq Company, is a registered investment advisory firm. Past performance does not guarantee future results. In all securities
trading, there is a potential for loss as well as profit. It should not be assumed that recommendations made in the future will be profitable or will equal the
performance as shown. Investors should have long-term financial objectives when working with Dorsey Wright. The relative strength strategy is NOT a guarantee.
There may be times where all investments and strategies are unfavorable and depreciate in value. Relative Strength is a measure of price momentum based on
historical price activity. Relative Strength is not predictive and there is no assurance that forecasts based on relative strength can be relied upon. The information
contained herein has been prepared without regard to any particular investor’s investment objectives, financial situation, and needs. Accordingly, investors should
not act on any recommendation (express or implied) or information in this material without obtaining specific advice from their financial advisors and should
not rely on information herein as the primary basis for their investment decisions. Information contained herein is based on data obtained from recognized
statistical services, issuer reports or communications, or other sources believed to be reliable (“information providers”). However, such information has not been
verified by DWA or the information provider and DWA and the information providers make no representations or warranties or take any responsibility as to
the accuracy or completeness of any recommendation or information contained herein. DWA and the information provider accept no liability to the recipient
whatsoever whether in contract, in tort, for negligence, or otherwise for any direct, indirect, consequential, or special loss of any kind arising out of the use of this
document or its contents or of the recipient relying on any such recommendation or information (except insofar as any statutory liability cannot be excluded). Any
statements nonfactual in nature constitute only current opinions, which are subject to change without notice. Neither the information nor any opinion expressed
shall constitute an offer to sell or a solicitation or an offer to buy any securities, commodities or exchange traded products. This document does not purport to be
complete description of the securities or commodities, markets or developments to which reference is made.
STRATEGY DESCRIPTION /The Dorsey Wright Systematic RS Core strategy invests in securities that, in our opinion, demonstrate favorable relative strength characteristics from a universe of U.S. Mid & Large Cap equities. The strategy holds approximately 25 securities and remains fully invested for maximum equity participation. The strategy has an industry overlay designed to overweight sectors with the greatest relative strength. The strategy is diversified across multiple sectors and industries. This strategy has historically tended to have lower turnover and higher tax efficiency than our Aggressive strategy.
The Systematic RS Core strategy is constructed pursuant to Dorsey Wright’s proprietary sector ranking and stock rotation methodology.
This strategy is uniquely positioned from an investment opportunity perspective because it is not limited by style (value or growth) or investment capitalization (mid or large). Rather, the Systematic Relative Strength Core strategy is allowed the flexibility to seek out the strongest trends wherever they may be found within the universe of U.S. Mid & Large Cap equities.
OBJECTIVE /Seeks to achieve long-term capital appreciation
MINIMUM INVESTMENT /$100,000
Annual Performance1 (%)
CORE (GROSS) CORE (NET) S&P 500
20052 17.55 16.55 7.21
2006 10.56 8.45 15.80
2007 22.94 21.05 5.49
2008 -48.59 -49.67 -37.00
2009 16.60 14.47 26.46
2010 25.80 23.73 15.07
2011 3.28 1.50 2.12
2012 12.00 10.22 15.98
2013 39.08 36.95 32.42
2014 14.28 12.45 13.69
2015 7.42 5.69 1.41
2016 10.04 8.22 11.98
20173 1.78 1.35 6.07
1See Important Disclosures in Appendix B; 2Inception 3/31/2005; 3Updated through 3/31/2017, performance is preliminary; Gross performance does not include the deduction of fees, expenses, and other transaction costs which will over time have a material impact on investment performance.
Strategy and Benchmark Performance History1 (%)
YTD 1 YEAR 3 YEAR 5 YEAR 10 YEAR
Core (Gross) 1.78 10.78 9.11 14.24 6.61
Core (Net) 1.35 8.95 7.33 12.41 4.83
S&P 500 6.07 17.20 10.38 13.31 7.51
SRS Core vs. S&P 500 (Apr 2005 - Mar 2017)
Past performance is no guarantee of future results.
The performance represented in this brochure is based on monthly performance of the Systematic Relative Strength Core Model. Net performance
shown is total return net of management fees, commissions, and expenses for all Dorsey Wright managed accounts, managed for each complete
quarter for each objective, regardless of levels of fixed income and cash in each account. The advisory fees are described in Part 2A of the adviser’s
Form ADV. The starting values on 3/31/2005 are assigned an arbitrary value of 100 and statement portfolios are revalued on a trade date basis on
the last day of each quarter. All returns since inception of actual Accounts are compared against the S&P 500 Index. The S&P 500 is a stock market
index based on the market capitalizations of 500 leading companies publicly traded in the U.S. stock market, as defined by Standard & Poor’s. A list
of all holdings over the past 12 months is available upon request. The performance information is based on data supplied by the Manager or from
statistical services, reports, or other sources which the Manager believes are reliable.
Definition of statistical terms:
Performance: Net annualized performance.
Volatility: Annualized standard deviation. Standard deviation shows how much variation or dispersion exists from the average value.
Beta: A measure of systematic or market-related risk.
Alpha: A measure of non-market return associated with the portfolio. See Modern Portfolio Theory for more information.
Correlation: Compresses covariance into a range of +/- 1. A negative correlation indicates an inverse relationship whereas a positive correlation is indicative of a direct relationship.
Annual turnover: An annualized measure of the percentage of the portfolio that was traded.
FOR MORE INFORMATION /Dorsey Wright Money Management Registered Investment Advisor
ABOUT DORSEY WRIGHT /Dorsey Wright (DW), a Nasdaq company, has been a leading provider of technical research to financial professionals for over 25 years. Our comprehensive research platform is a complete technical analysis solution – from broad market insights, to portfolio management tools and investment models, to Point and Figure charts on over 80,000 securities and indicators worldwide.
Dorsey, Wright & Associates, LLC, a Nasdaq Company, is a registered investment advisory firm. Past performance does not guarantee future results. In all securities
trading, there is a potential for loss as well as profit. It should not be assumed that recommendations made in the future will be profitable or will equal the
performance as shown. Investors should have long-term financial objectives when working with Dorsey Wright. The relative strength strategy is NOT a guarantee.
There may be times where all investments and strategies are unfavorable and depreciate in value. Relative Strength is a measure of price momentum based on
historical price activity. Relative Strength is not predictive and there is no assurance that forecasts based on relative strength can be relied upon. The information
contained herein has been prepared without regard to any particular investor’s investment objectives, financial situation, and needs. Accordingly, investors should
not act on any recommendation (express or implied) or information in this material without obtaining specific advice from their financial advisors and should
not rely on information herein as the primary basis for their investment decisions. Information contained herein is based on data obtained from recognized
statistical services, issuer reports or communications, or other sources believed to be reliable (“information providers”). However, such information has not been
verified by DWA or the information provider and DWA and the information providers make no representations or warranties or take any responsibility as to
the accuracy or completeness of any recommendation or information contained herein. DWA and the information provider accept no liability to the recipient
whatsoever whether in contract, in tort, for negligence, or otherwise for any direct, indirect, consequential, or special loss of any kind arising out of the use of this
document or its contents or of the recipient relying on any such recommendation or information (except insofar as any statutory liability cannot be excluded). Any
statements nonfactual in nature constitute only current opinions, which are subject to change without notice. Neither the information nor any opinion expressed
shall constitute an offer to sell or a solicitation or an offer to buy any securities, commodities or exchange traded products. This document does not purport to be
complete description of the securities or commodities, markets or developments to which reference is made.
STRATEGY DESCRIPTION /The Dorsey Wright Systematic RS Growth strategy invests in securities that, in our opinion, demonstrate favorable relative strength characteristics from a universe of U.S. Mid & Large Cap equities. The strategy holds approximately 25 securities when fully invested. The strategy also employs an exposure overlay that, when activated, causes sales to go to cash and are not reinvested until indicated. The strategy will hold up to 50% cash if necessary. The strategy has an industry overlay designed to overweight sectors with the greatest relative strength. The strategy is diversified across multiple sectors and industries.
The Systematic RS Growth strategy is constructed pursuant to Dorsey Wright’s proprietary sector ranking and stock rotation methodology.
This strategy is uniquely positioned from an investment opportunity perspective because it is not limited by style (value or growth) or investment capitalization (mid or large). Rather, the Systematic Relative Strength Growth strategy is allowed the flexibility to seek out strong trends wherever they may be found within the universe of U.S. Mid & Large Cap equities.
OBJECTIVE /Seeks to achieve long-term capital appreciation with some degree of risk mitigation.
MINIMUM INVESTMENT /$100,000
Annual Performance1 (%)
GROWTH (GROSS) GROWTH (NET) S&P 500
2007 28.14 26.41 5.49
2008 -31.92 -33.09 -37.00
2009 8.01 6.26 26.46
2010 28.87 27.05 15.07
2011 -1.65 -3.25 2.12
2012 14.31 12.59 15.98
2013 33.75 31.85 32.42
2014 13.99 12.18 13.69
2015 7.73 5.83 1.41
2016 4.97 3.35 11.98
20172 7.70 7.31 6.07
1See Important Disclosures in Appendix C; 2Updated through 3/31/2017, performance is preliminary; Gross performance does not include the deduction of fees, expenses, and other transaction costs which will over time have a material impact on investment performance.
Strategy and Benchmark Performance History1 (%)
YTD 1 YEAR 3 YEAR 5 YEAR 10 YEAR
Growth (Gross) 7.70 14.63 10.45 13.97 9.72
Growth (Net) 7.31 12.89 8.66 12.19 8.02
S&P 500 6.07 17.20 10.38 13.31 7.51
SRS Growth vs. S&P 500 (Jan 2007 - Mar 2017)
Past performance is no guarantee of future results.
Sector Allocation as of 31 Mar 17 (%) based on assets
STEP 1 - Sector ModelOur sector overlay, based on relative strength, proposes the weight in each sector and industry group.
STEP 2 - Stock ModelOur universe of Mid & Large Cap stocks with sufficient liquidity is ranked by our proprietary relative strength model.
STEP 3 - Portfolio ConstructionCurrent portfolio allocations are compared against our model weightings & holdings to identify needed changes.
STEP 4 - Sell DisciplineStops for each position are based on our proprietary relative strength rankings. Positions are only replaced if indicated by our exposure overlay. Account will hold up to 50% cash if necessary.
PROCESS /
Sector Model
Model proposes the weight of 10 Macro Sectors and
65 Industry Groups
Stock Model
Universe screened for sufficient liquidity and ranked
by relative strength
Portfolio Construction
Rigorous qualitative review of suggested model changes
Sell Discipline
Stops for each position based on relative strength ranking.
Positions only replaced if indicated by exposure overlay.
9 %
1 6 %
8 %
3 %4 %
2 4 %
4 %
9 %
2 3 %
Consumer Cyclical FinancialBasic Materials EnergyConsumer Non Cyclical IndustrialUtilities HealthcareTech
The performance represented in this brochure is based on monthly performance of the Systematic Relative Strength Growth Model. Net performance shown is total return net of management fees, commissions, and expenses for all Dorsey Wright managed accounts, managed for each complete quarter for each objective, regardless of levels of fixed income and cash in each account. The advisory fees are described in Part 2A of the adviser’s Form ADV. The starting values on 12/31/2006 are assigned an arbitrary value of 100 and statement portfolios are revalued on a trade date basis on the last day of each quarter. All returns since inception of actual Accounts are compared against the S&P 500 Index. The S&P 500 is a stock market index based on the market capitalizations of 500 leading companies publicly traded in the U.S. stock market, as defined by Standard & Poor’s. A list of all holdings over the past 12 months is available upon request. The performance information is based on data supplied by the Manager or from statistical services, reports, or
other sources which the Manager believes are reliable.
Definition of statistical terms:
Performance: Net annualized performance.
Volatility: Annualized standard deviation. Standard deviation shows how much variation or dispersion exists from the average value.
Beta: A measure of systematic or market-related risk.
Alpha: A measure of non-market return associated with the portfolio. See Modern Portfolio Theory for more information.
Correlation: Compresses covariance into a range of +/- 1. A negative correlation indicates an inverse relationship whereas a positive correlation is indicative of a direct relationship.
Annual turnover: An annualized measure of the percentage of the portfolio that was traded.
GROWTH (GROSS) GROWTH (NET) S&P 500 TR
1995 16.40% 14.90% 37.58%
1996 9.32% 7.61% 22.96%
1997 13.26% 11.00% 33.26%
1998 19.08% 17.03% 28.58%
1999 34.10% 31.97% 21.04%
2000 -5.99% -7.58% -9.10%
2001 -5.70% -7.13% -11.89%
2002 -15.98% -17.33% -22.10%
2003 20.24% 18.84% 28.68%
2004 5.36% 3.75% 10.88%
2005 12.90% 11.14% 4.91%
2006 -0.99% -2.58% 15.80%
The inception for this strategy was 12/31/1994. However, the strategy underwent a material change that was complete on 12/31/2006. The material changes
included adding an exposure overlay and a systematic stock selection process. The track record prior to the material change in investment process:
FOR MORE INFORMATION /Dorsey Wright Money Management Registered Investment Advisor
Dorsey, Wright & Associates, LLC, a Nasdaq Company, is a registered investment advisory firm. Past performance does not guarantee future results. In all securities trading, there is a potential for loss as well as profit. It should not be assumed that recommendations made in the future will be profitable or will equal the performance as shown. Investors should have long-term financial objectives when working with Dorsey Wright. The relative strength strategy is NOT a guarantee. There may be times where all investments and strategies are unfavorable and depreciate in value. Relative Strength is a measure of price momentum based on historical price activity. Relative Strength is not predictive and there is no assurance that forecasts based on relative strength can be relied upon. The information contained herein has been prepared without regard to any particular investor’s investment objectives, financial situation, and needs. Accordingly, investors should not act on any recommendation (express or implied) or information in this material without obtaining specific advice from their financial advisors and should not rely on information herein as the primary basis for their investment decisions. Information contained herein is based on data obtained from recognized statistical services, issuer reports or communications, or other sources believed to be reliable (“information providers”). However, such information has not been verified by DWA or the information provider and DWA and the information providers make no representations or warranties or take any responsibility as to the accuracy or completeness of any recommendation or information contained herein. DWA and the information provider accept no liability to the recipient whatsoever whether in contract, in tort, for negligence, or otherwise for any direct, indirect, consequential, or special loss of any kind arising out of the use of this document or its contents or of the recipient relying on any such recommendation or information (except insofar as any statutory liability cannot be excluded). Any statements nonfactual in nature constitute only current opinions, which are subject to change without notice. Neither the information nor any opinion expressed shall constitute an offer to sell or a solicitation or an offer to buy any securities, commodities or exchange traded products. This document does not purport to be complete description of the securities or commodities, markets or developments to which reference is made.
STRATEGY DESCRIPTION /The Dorsey Wright Systematic RS Balanced strategy invests in securities with, in our opinion, powerful relative strength characteristics from a universe of U.S. Mid & Large Cap equities and investment grade U.S. fixed income. The strategy holds approximately 25 securities and remains fully invested for maximum equity participation. The strategy has an industry overlay designed to overweight sectors with the greatest relative strength. The strategy is diversified across multiple sectors and industries. Approximately 60% of the portfolio is the Systematic RS Core model and 40% is fixed income. The fixed income component often helps to lower the volatility of the overall portfolio.
The Systematic RS Balanced strategy is constructed pursuant to Dorsey Wright’s proprietary sector ranking and stock rotation methodology.
This strategy is uniquely positioned from an investment opportunity perspective because it is not limited by style (value or growth) or investment capitalization (mid or large). Rather, the Systematic Relative Strength Balanced strategy is allowed the flexibility to seek out the strongest trends wherever they may be found within the defined investment universe.
OBJECTIVE /Seeks to achieve long-term capital appreciation and income
MINIMUM INVESTMENT /$100,000
Annual Performance1 (%)
BALANCED (GROSS) BALANCED (NET) COMBINED INDEX4
20052 6.09 5.42 3.44
2006 7.66 6.11 11.12
2007 17.18 15.53 6.22
2008 -27.70 -28.61 -22.06
2009 4.57 3.45 18.39
2010 18.11 16.81 12.14
2011 8.17 6.76 4.70
2012 8.59 7.74 11.30
2013 20.85 19.54 17.59
2014 12.49 11.43 10.59
2015 5.29 4.31 1.29
2016 7.25 6.24 8.29
20173 1.57 1.31 3.95
1See Important Disclosures in Appendix D; 2Inception 6/30/2005; 3Updated through 03/31/2017, performance is preliminary; 4Combined Index is 60% S&P 500 Total Return Index and 40% Barclays Aggregate Bond Index; Gross performance does not include the deduction of fees, expenses, and other transaction costs which will over time have a material impact on investment performance.
Strategy and Benchmark Performance History1 (%)
YTD 1 YEAR 3 YEAR 5 YEAR 10 YEAR
Balanced (Gross) 1.57 6.56 7.20 10.02 6.15
Balanced (Net) 1.31 5.53 6.20 8.96 5.02
Combined Index 3.95 10.25 7.36 8.94 6.51
SRS Balanced vs. Combined Index (Jul 2005 - Mar 2017)
Past performance is no guarantee of future results.
$80
$100
$120
$140
$160
$180
$200
$220
$240
Jun-05
Jun-06
Jun-07
Jun-08
Jun-09
Jun-10
Jun-11
Jun-12
Jun-13
Jun-14
Jun-15
Jun-16
SRS Balanced (Gross) SRS Balanced (Net) Combined Index
The performance represented in this brochure is based on monthly performance of the Systematic Relative Strength Balanced Model. Net performance shown is total return net of management fees, commissions, and expenses for all Dorsey, Wright & Associates managed accounts, managed for each complete quarter for each objective, regardless of levels of fixed income and cash in each account. The advisory fees are described in Part 2A of the adviser’s Form ADV. The starting values on 6/30/2005 are assigned an arbitrary value of 100 and statement portfolios are revalued on a trade date basis on the last day of each quarter. All returns since inception of actual Accounts are compared against the Combined Index, which is 60% S&P 500 Total Return Index and 40% Barclays Aggregate Bond Index. The S&P 500 is a stock market index based on the market capitalizations of 500 leading companies publicly traded in the U.S. stock market, as defined by Standard & Poor’s. The Barclays Aggregate Bond Index is a broad base index,, maintained by Barclays Capital, and is used to represent investment grade bonds being traded in the United States. A list of all holdings over the past 12 months is available upon request. The performance information is based on data supplied by the Manager or from statistical services, reports, or other sources which the Manager believes are reliable.
Definition of statistical terms:
Performance: Net annualized performance.
Volatility: Annualized standard deviation. Standard deviation shows how much variation or dispersion exists from the average value.
Beta: A measure of systematic or market-related risk.
Alpha: A measure of non-market return associated with the portfolio. See Modern Portfolio Theory for more information.
Correlation: Compresses covariance into a range of +/- 1. A negative correlation indicates an inverse relationship whereas a positive correlation is indicative of a direct relationship.
Annual turnover: An annualized measure of the percentage of the portfolio that was traded.
FOR MORE INFORMATION /Dorsey Wright Money Management Registered Investment Advisor
ABOUT DORSEY WRIGHT /Dorsey Wright (DW), a Nasdaq company, has been a leading provider of technical research to financial professionals for over 25 years. Our comprehensive research platform is a complete technical analysis solution – from broad market insights, to portfolio management tools and investment models, to Point and Figure charts on over 80,000 securities and indicators worldwide.
Dorsey, Wright & Associates, LLC, a Nasdaq Company, is a registered investment advisory firm. Past performance does not guarantee future results. In all securities trading, there is a potential for loss as well as profit. It should not be assumed that recommendations made in the future will be profitable or will equal the performance as shown. Investors should have long-term financial objectives when working with Dorsey Wright. The relative strength strategy is NOT a guarantee. There may be times where all investments and strategies are unfavorable and depreciate in value. Relative Strength is a measure of price momentum based on historical price activity. Relative Strength is not predictive and there is no assurance that forecasts based on relative strength can be relied upon.The information contained herein has been prepared without regard to any particular investor’s investment objectives, financial situation, and needs. Accordingly, investors should not act on any recommendation (express or implied) or information in this material without obtaining specific advice from their financial advisors and should not rely on information herein as the primary basis for their investment. Each investor should carefully consider the investment objectives, risks and expenses of any Exchange-Traded Fund ("ETF") prior to investing. Before investing in an ETF investors should obtain and carefully read the relevant prospectus and documents the issuer has filed with the SEC. ETFs may result in the layering of fees as ETFs impose their own advisory and other fees. To obtain more complete information about the product the documents are publicly available for free via EDGAR on the SEC website (http:// www.sec.gov) The information contained herein has been prepared without regard to any particular investor’s investment objectives, financial situation, and needs. Accordingly, investors should not act on any recommendation (express or implied) or information in this material without obtaining specific advice from their financial advisors and should not rely on information herein as the primary basis for their investment decisions. Information contained herein is based on data obtained from recognized statistical services, issuer reports or communications, or other sources believed to be reliable (“information providers”). However, such information has not been verified by DWA or the information provider and DWA and the information providers make no representations or warranties or take any responsibility as to the accuracy or completeness of any recommendation or information contained herein. DWA and the information provider accept no liability to the recipient whatsoever whether in contract, in tort, for negligence, or otherwise for any direct, indirect, consequential, or special loss of any kind arising out of the use of this document or its contents or of the recipient relying on any such recommendation or information (except insofar as any statutory liability cannot be excluded). Any statements nonfactual in nature constitute only current opinions, which are subject to change without notice. Neither the information nor any opinion expressed shall constitute an offer to sell or a solicitation or an offer to buy any securities, commodities or exchange traded products. This document does not purport to be complete description of the securities or commodities, markets or developments to which reference is made.
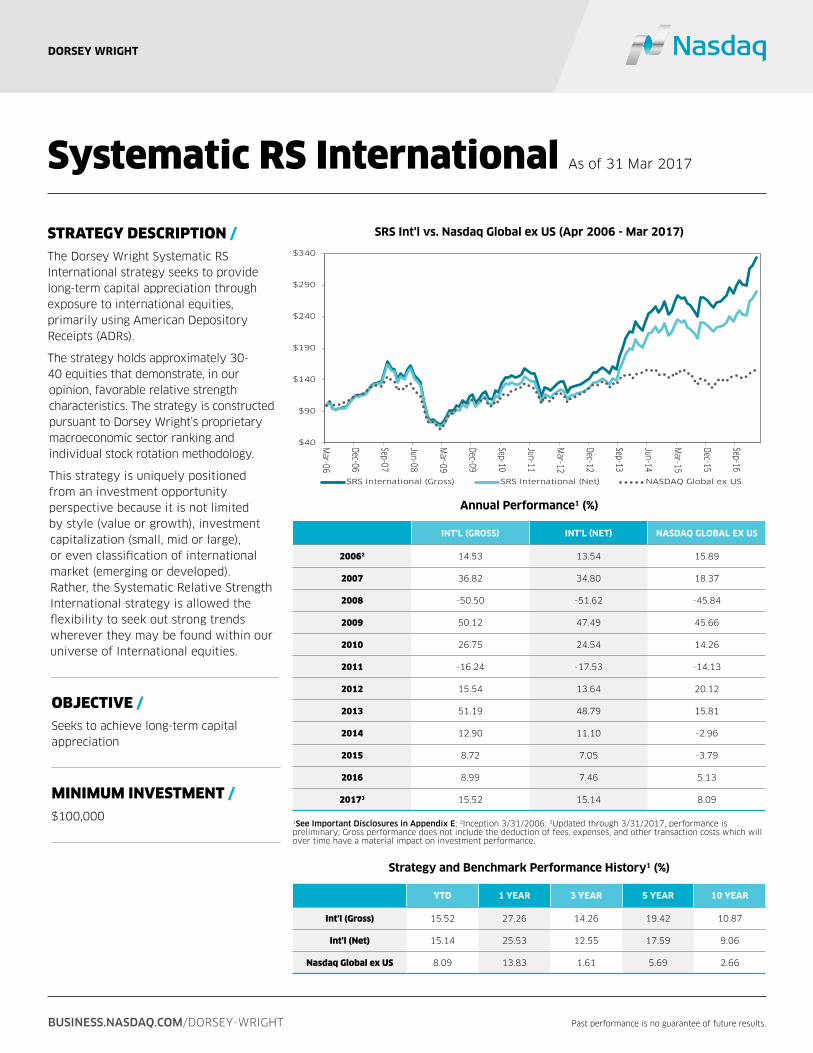
STRATEGY DESCRIPTION /The Dorsey Wright Systematic RS International strategy seeks to provide long-term capital appreciation through exposure to international equities, primarily using American Depository Receipts (ADRs).
The strategy holds approximately 30- 40 equities that demonstrate, in our opinion, favorable relative strength characteristics. The strategy is constructed pursuant to Dorsey Wright’s proprietary macroeconomic sector ranking and individual stock rotation methodology.
This strategy is uniquely positioned from an investment opportunity perspective because it is not limited by style (value or growth), investment capitalization (small, mid or large), or even classification of international market (emerging or developed). Rather, the Systematic Relative Strength International strategy is allowed the flexibility to seek out strong trends wherever they may be found within our universe of International equities.
OBJECTIVE /Seeks to achieve long-term capital appreciation
MINIMUM INVESTMENT /$100,000
Annual Performance1 (%)
INT'L (GROSS) INT'L (NET) NASDAQ GLOBAL EX US
20062 14.53 13.54 15.89
2007 36.82 34.80 18.37
2008 -50.50 -51.62 -45.84
2009 50.12 47.49 45.66
2010 26.75 24.54 14.26
2011 -16.24 -17.53 -14.13
2012 15.54 13.64 20.12
2013 51.19 48.79 15.81
2014 12.90 11.10 -2.96
2015 8.72 7.05 -3.79
2016 8.99 7.46 5.13
20173 15.52 15.14 8.09
1See Important Disclosures in Appendix E; 2Inception 3/31/2006; 3Updated through 3/31/2017, performance is preliminary; Gross performance does not include the deduction of fees, expenses, and other transaction costs which will over time have a material impact on investment performance.
Strategy and Benchmark Performance History1 (%)
YTD 1 YEAR 3 YEAR 5 YEAR 10 YEAR
Int'l (Gross) 15.52 27.26 14.26 19.42 10.87
Int'l (Net) 15.14 25.53 12.55 17.59 9.06
Nasdaq Global ex US 8.09 13.83 1.61 5.69 2.66
SRS Int'l vs. Nasdaq Global ex US (Apr 2006 - Mar 2017)
Past performance is no guarantee of future results.
$40
$90
$140
$190
$240
$290
$340
Mar-06
Dec-06
Sep-07
Jun-08
Mar-09
Dec-09
Sep-10
Jun-11
Mar-12
Dec-12
Sep-13
Jun-14
Mar-15
Dec-15
Sep-16
SRS International (Gross) SRS International (Net) NASDAQ Global ex US
Historical PerformanceDorsey, Wright Systematic Relative Strength International Strategy
The performance represented in this brochure is based on monthly performance of the Systematic Relative Strength International Model. Net performance shown is total return net of management fees, commissions, and expenses for all Dorsey Wright managed accounts, managed for each complete quarter for each objective, regardless of levels of fixed income and cash in each account. The advisory fees are described in Part 2A of the adviser’s Form ADV. The starting values on 3/31/2006 are assigned an arbitrary value of 100 and statement portfolios are revalued on a trade date basis on the last day of each quarter. All returns since inception of actual Accounts are compared against the NASDAQ Global ex US Index. The NASDAQ Global ex US Index Total Return Index is a stock market index that is designed to measure the equity market performance of global markets outside of the United States and is maintained by Nasdaq. A list of all holdings over the past 12 months is available upon request. The performance information is based on data supplied by the Manager or from statistical services, reports, or other sources which the Manager believes are reliable.
Definition of statistical terms:
Performance: Net annualized performance.
Volatility: Annualized standard deviation. Standard deviation shows how much variation or dispersion exists from the average value.
Beta: A measure of systematic or market-related risk.
Alpha: A measure of non-market return associated with the portfolio. See Modern Portfolio Theory for more information.
Correlation: Compresses covariance into a range of +/- 1. A negative correlation indicates an inverse relationship whereas a positive correlation is indicative of a direct relationship.
Annual turnover: An annualized measure of the percentage of the portfolio that was traded.
FOR MORE INFORMATION /Dorsey Wright Money Management Registered Investment Advisor
ABOUT DORSEY WRIGHT /Dorsey Wright (DW), a Nasdaq company, has been a leading provider of technical research to financial professionals for over 25 years. Our comprehensive research platform is a complete technical analysis solution – from broad market insights, to portfolio management tools and investment models, to Point and Figure charts on over 80,000 securities and indicators worldwide.
Dorsey, Wright & Associates, LLC, a Nasdaq Company, is a registered investment advisory firm. Past performance does not guarantee future results. In all securities trading, there is a potential for loss as well as profit. It should not be assumed that recommendations made in the future will be profitable or will equal the performance as shown. Investors should have long-term financial objectives when working with Dorsey Wright. The relative strength strategy is NOT a guarantee. There may be times where all investments and strategies are unfavorable and depreciate in value. Relative Strength is a measure of price momentum based on historical price activity. Relative Strength is not predictive and there is no assurance that forecasts based on relative strength can be relied upon. The information contained herein has been prepared without regard to any particular investor’s investment objectives, financial situation, and needs. Accordingly, investors should not act on any recommendation (express or implied) or information in this material without obtaining specific advice from their financial advisors and should not rely on information herein as the primary basis for their investment decisions. Information contained herein is based on data obtained from recognized statistical services, issuer reports or communications, or other sources believed to be reliable (“information providers”). However, such information has not been verified by DWA or the information provider and DWA and the information providers make no representations or warranties or take any responsibility as to the accuracy or completeness of any recommendation or information contained herein. DWA and the information provider accept no liability to the recipient whatsoever whether in contract, in tort, for negligence, or otherwise for any direct, indirect, consequential, or special loss of any kind arising out of the use of this document or its contents or of the recipient relying on any such recommendation or information (except insofar as any statutory liability cannot be excluded). Any statements nonfactual in nature constitute only current opinions, which are subject to change without notice. Neither the information nor any opinion expressed shall constitute an offer to sell or a solicitation or an offer to buy any securities, commodities or exchange traded products. This document does not purport to be complete description of the securities or commodities, markets or developments to which reference is made.
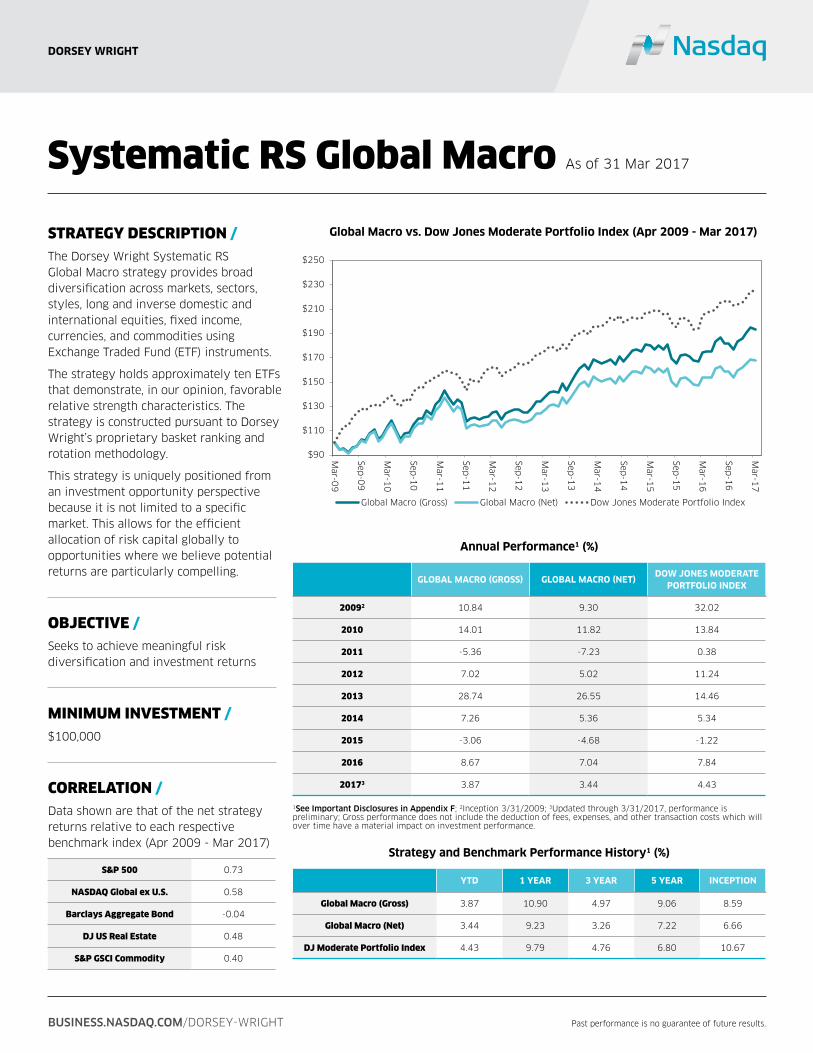
STRATEGY DESCRIPTION /The Dorsey Wright Systematic RS Global Macro strategy provides broad diversification across markets, sectors, styles, long and inverse domestic and international equities, fixed income, currencies, and commodities using Exchange Traded Fund (ETF) instruments.
The strategy holds approximately ten ETFs that demonstrate, in our opinion, favorable relative strength characteristics. The strategy is constructed pursuant to Dorsey Wright’s proprietary basket ranking and rotation methodology.
This strategy is uniquely positioned from an investment opportunity perspective because it is not limited to a specific market. This allows for the efficient allocation of risk capital globally to opportunities where we believe potential returns are particularly compelling.
OBJECTIVE /Seeks to achieve meaningful risk diversification and investment returns
MINIMUM INVESTMENT /$100,000
CORRELATION /Data shown are that of the net strategy returns relative to each respective benchmark index (Apr 2009 - Mar 2017)
S&P 500 0.73
NASDAQ Global ex U.S. 0.58
Barclays Aggregate Bond -0.04
DJ US Real Estate 0.48
S&P GSCI Commodity 0.40
Annual Performance1 (%)
GLOBAL MACRO (GROSS) GLOBAL MACRO (NET)DOW JONES MODERATE
PORTFOLIO INDEX
20092 10.84 9.30 32.02
2010 14.01 11.82 13.84
2011 -5.36 -7.23 0.38
2012 7.02 5.02 11.24
2013 28.74 26.55 14.46
2014 7.26 5.36 5.34
2015 -3.06 -4.68 -1.22
2016 8.67 7.04 7.84
20173 3.87 3.44 4.43
1See Important Disclosures in Appendix F; 2Inception 3/31/2009; 3Updated through 3/31/2017, performance is preliminary; Gross performance does not include the deduction of fees, expenses, and other transaction costs which will over time have a material impact on investment performance.
Strategy and Benchmark Performance History1 (%)
YTD 1 YEAR 3 YEAR 5 YEAR INCEPTION
Global Macro (Gross) 3.87 10.90 4.97 9.06 8.59
Global Macro (Net) 3.44 9.23 3.26 7.22 6.66
DJ Moderate Portfolio Index 4.43 9.79 4.76 6.80 10.67
Global Macro vs. Dow Jones Moderate Portfolio Index (Apr 2009 - Mar 2017)
Past performance is no guarantee of future results.
$90
$110
$130
$150
$170
$190
$210
$230
$250
Mar-0
9
Sep-0
9
Mar-1
0
Sep-1
0
Mar-1
1
Sep-1
1
Mar-1
2
Sep-1
2
Mar-1
3
Sep-1
3
Mar-1
4
Sep-1
4
Mar-1
5
Sep-1
5
Mar-1
6
Sep-1
6
Mar-1
7
Global Macro (Gross) Global Macro (Net) Dow Jones Moderate Portfolio Index
Sector Allocation as of 31 Mar 17 (%) based on assets
STEP 1 - ETF BasketsOur unique basket ranking and rotation methodology, based on relative strength, allows the portfolio to be concentrated in what we believe to be the strongest areas.
PROCESS /
STEP 2 - Individual ETFsOur universe of ETFs is ranked by our proprietary relative strength model.
STEP 3 - Portfolio Construction10 high relative strength ETFs are slotted into the portfolio.
STEP 4 - Sell DisciplineStops for each position are based on our proprietary relative strength rankings.
ETF Baskets
Model proposes the weight of multiple ETF baskets
Individual ETFs
Universe ranked by relative strength
Portfolio Construction
Rigorous qualitative review of suggested model changes
Sell Discipline
Stops for each position based on relative strength ranking
DIVERSIFICATION ACROSS MARKET SEGMENTS /The following table highlights historical leadership changes for various market segments and the net performance of Dorsey Wright’s Systematic RS Global Macro Strategy. The information provided here is intended to be general in nature to illustrate the variation among market segments. 1See Important Disclosures in Appendix F; 2Updated through 3/31/2017
Global Macro = Dorsey Wright’s
Systematic
RS Global Macro Strategy (Net)
Real Estate = Dow Jones U.S. Real Estate
Total Return Index
Bonds = Barclays Aggregate Bond Total
Return Index
Commodities = S&P GSCI Commodity
Total
Return Index
Int’l Equities = NASDAQ Global ex US
Index
S&P 500 = S&P 500 Total Return Index
DJ Mod = Dow Jones Moderate
Portfolio Index
Investors cannot invest directly in an index.
Indexes have no fees.
FLEXIBLE ASSET ALLOCATIONS /The following chart highlights historical asset allocation exposure for the Global Macro portfolio.
U.S. EQUITIES INT'L EQUITIES INVERSE EQUITIES CURRENCIES COMMODITIES REAL ESTATE FIXED INCOME
Minimum 0% O% 0% 0% 0% 0% 0%
Maximum 100% 60% 30% 30% 30% 30% 100%
ASSET CLASS EXPOSURE RANGES /The following table highlights the asset class exposure ranges for each asset class in the Global Macro portfolio. There may be deviations outside the bands based on market fluctuations.
Source: Bloomberg, Dow Jones Indexes, Standard & Poor’s, MSCI Barra, and Reuters calculated by Dorsey Wright & Associates. Performance displayed represents past performance, which is no guarantee of future results. The index returns assume reinvestment of all dividends but do not reflect any management fees, transaction costs or expenses. The benchmark indices are unmanaged and may not be available for direct investment.
0%
10%
20%
30%
40%
50%
60%
70%
80%
90%
100%
Apr-0
9
Jul-0
9
Oct-0
9
Jan-1
0
Apr-1
0
Jul-1
0
Oct-1
0
Jan-1
1
Apr-1
1
Jul-1
1
Oct-1
1
Jan-1
2
Apr-1
2
Jul-1
2
Oct-1
2
Jan-1
3
Apr-1
3
Jul-1
3
Oct-1
3
Jan-1
4
Apr-1
4
Jul-1
4
Oct-1
4
Jan-1
5
Apr-1
5
Jul-1
5
Oct-1
5
Jan-1
6
Apr-1
6
Jul-1
6
Oct-1
6
Jan-1
7
Global M acr o - Histor ical A llocations
U.S. Equity Inverse Equities Commodity Currency Int'l Equity Real Estate Fixed Income
Historical PerformanceDorsey, Wright Systematic Relative Strength Global Macro Strategy
The performance represented in this brochure is based on monthly performance of the Systematic Relative Strength Global Macro Model. Net performance shown is total return net of management fees, commissions, and expenses for all Dorsey, Wright & Associates managed accounts, managed for each complete quarter for each objective, regardless of levels of fixed income and cash in each account. All returns since inception reflect reinvestment of dividends and other earnings. Returns of Accounts, since inception, are a composite of all Accounts of that style that were managed for the full quarter. All returns since inception of are compared against the Dow Jones Moderate Portfolio Index. The volatility of the Models and of actual Accounts may be different than the volatility of the Dow Jones Moderate Portfolio Index. The Dow Jones Moderate Portfolio Index is a global asset allocation benchmark. 60% of the benchmark is represented equally with nine Dow Jones equity indexes. 40% of the benchmark is represented with five Barclays Capital fixed income indexes. The S&P 500 is a stock market index based on the market capitalizations of 500 leading companies publicly traded in the U.S. stock market, as defined by Standard & Poor’s. The Barclays Aggregate Bond Index is a broad base index, maintained by Barclays Capital, and is used to represent investment grade bonds being traded in the United States. The NASDAQ Global ex US Total Return Index is a stock market index that is designed to measure the equity market performance of markets outside of the United States and is maintained by Nasdaq. The Dow Jones U.S. Real Estate Index invests in U.S. real estate stocks and real estate investment trusts (REITs). The S&P GSCI Commodity Index is a production weighted commodity index comprised of 24 commodities from all commodity sectors. Dorsey, Wright’s advisory fees are described in Part 2A of the adviser’s Form ADV.
Definition of statistical terms:
Performance: Net annualized performance.
Volatility: Annualized standard deviation. Standard deviation shows how much variation or dispersion exists from the average value.
Correlation: Compresses covariance into a range of +/- 1. A negative correlation indicates an inverse relationship whereas a positive correlation is indicative of a direct relationship.
FOR MORE INFORMATION /Dorsey Wright Money Management Registered Investment Advisor
ABOUT DORSEY WRIGHT /Dorsey Wright (DW), a Nasdaq company, has been a leading provider of technical research to financial professionals for over 25 years. Our comprehensive research platform is a complete technical analysis solution – from broad market insights, to portfolio management tools and investment models, to Point and Figure charts on over 80,000 securities and indicators worldwide.
Dorsey, Wright & Associates, LLC, a Nasdaq Company, is a registered investment advisory firm. Past performance does not guarantee future results. In all securities trading, there is a potential for loss as well as profit. It should not be assumed that recommendations made in the future will be profitable or will equal the performance as shown. Investors should have long-term financial objectives when working with Dorsey Wright. The relative strength strategy is NOT a guarantee. There may be times where all investments and strategies are unfavorable and depreciate in value. Relative Strength is a measure of price momentum based on historical price activity. Relative Strength is not predictive and there is no assurance that forecasts based on relative strength can be relied upon.The information contained herein has been prepared without regard to any particular investor’s investment objectives, financial situation, and needs. Accordingly, investors should not act on any recommendation (express or implied) or information in this material without obtaining specific advice from their financial advisors and should not rely on information herein as the primary basis for their investment. Each investor should carefully consider the investment objectives, risks and expenses of any Exchange-Traded Fund ("ETF") prior to investing. Before investing in an ETF investors should obtain and carefully read the relevant prospectus and documents the issuer has filed with the SEC. ETFs may result in the layering of fees as ETFs impose their own advisory and other fees. To obtain more complete information about the product the documents are publicly available for free via EDGAR on the SEC website (http:// www.sec.gov) The information contained herein has been prepared without regard to any particular investor’s investment objectives, financial situation, and needs. Accordingly, investors should not act on any recommendation (express or implied) or information in this material without obtaining specific advice from their financial advisors and should not rely on information herein as the primary basis for their investment decisions. Information contained herein is based on data obtained from recognized statistical services, issuer reports or communications, or other sources believed to be reliable (“information providers”). However, such information has not been verified by DWA or the information provider and DWA and the information providers make no representations or warranties or take any responsibility as to the accuracy or completeness of any recommendation or information contained herein. DWA and the information provider accept no liability to the recipient whatsoever whether in contract, in tort, for negligence, or otherwise for any direct, indirect, consequential, or special loss of any kind arising out of the use of this document or its contents or of the recipient relying on any such recommendation or information (except insofar as any statutory liability cannot be excluded). Any statements nonfactual in nature constitute only current opinions, which are subject to change without notice. Neither the information nor any opinion expressed shall constitute an offer to sell or a solicitation or an offer to buy any securities, commodities or exchange traded products. This document does not purport to be complete description of the securities or commodities, markets or developments to which reference is made.
STRATEGY DESCRIPTION /The strategy invests across multiple sectors of the fixed income market: U.S. government bonds, investment grade corporate bonds, high yield bonds, treasury inflation protected securities (TIPS), convertible bonds, and international bonds. Exposure to each of these areas is achieved through exchange-traded funds (ETFs).
Dorsey Wright employs a proprietary fixed income model that evaluates each ETF in the investment universe from a relative strength perspective. Those fixed income sectors exhibiting the strongest trends will be represented in the portfolio.
The strategy is also structured in a way that balances risk and reward. When fixed income markets are performing well, exposure will be tilted toward the sectors with the strongest trends. When markets are weak, exposure will be tilted more defensively. During risk-off environments, it is possible for the majority of the strategy to be invested in the US Treasury market.
OBJECTIVE /The Dorsey Wright Tactical Fixed Income strategy seeks to provide current income and strong risk-adjusted fixed income returns.
MINIMUM INVESTMENT /$100,000
Annual Performance1 (%)
TACTICAL FIXED INCOME (GROSS)
TACTICAL FIXED INCOME (NET)
BARCLAYS AGGREGATE BOND INDEX
20132 -2.85 -3.20 -1.90
2014 11.94 11.45 5.94
2015 -3.59 -4.04 0.57
2016 10.69 9.93 2.66
20173 1.62 1.41 0.82
1See Important Disclosures in Appendix E; 2Inception 3/31/2006; 3Updated through 3/31/2017, performance is preliminary; Gross performance does not include the deduction of fees, expenses, and other transaction costs which will over time have a material impact on investment performance.
Strategy and Benchmark Performance History1 (%)
YTD 1 YEAR 3 YEAR 5 YEAR INCEPTION
Tactical Fixed Income
(Gross)1.62 7.03 5.85 4.20
Tactical Fixed Income
(Net)1.41 6.26 5.26 3.64
Barclays Aggregate
Bond Index0.82 0.45 2.68 1.99
Tactical Fixed Income vs. Barclays Aggregate Bond Index (Apr 2013 - Mar 2017)
Past performance is no guarantee of future results.
$96
$98
$100
$102
$104
$106
$108
$110
$112
$114
$116
$118
$120
Mar-13
Jun-13
Sep-13
Dec-13
Mar-14
Jun-14
Sep-14
Dec-14
Mar-15
Jun-15
Sep-15
Dec-15
Mar-16
Jun-16
Sep-16
Dec-16
Mar-17
Tactical Fixed Income (Gross) Tactical Fixed Income (Net) Barclays Aggregate Bond Index
Historical PerformanceDorsey, Wright Tactical Fixed Income Strategy
All returns since inception reflect reinvestment of interest payments and other earnings. Returns are a composite of all Accounts of that style that were managed for the full quarter. All returns are compared against the Barclays Aggregate Bond total return index. The Barclays Aggregate Bond Index is a broad base index, maintained by Barclays Capital, and is used to represent investment grade bonds being traded in the United States. Dorsey, Wright’s advisory fees are described in Part 2A of the advisor’s Form ADV.
Definition of statistical terms:
Performance: Net annualized performance.
Distribution Yield: The annual yield an investor would receive if the most recent fund distribution stayed the same going forward. The yield represents a single distribution from the fund and does not represent the total return of the fund.
Volatility: Annualized standard deviation. Standard deviation shows how much variation or dispersion exists from the average value.
Correlation: Compresses covariance into a range of +/- 1. A negative correlation indicates an inverse relationship whereas a positive correlation is indicative of a direct relationship.
R-Squared: Is the ratio of the portfolio’s market-related (systematic) variance to its total variance. It gives the variation in one variable explained by another.
FOR MORE INFORMATION /Dorsey Wright Money Management Registered Investment Advisor
ABOUT DORSEY WRIGHT /Dorsey Wright (DW), a Nasdaq company, has been a leading provider of technical research to financial professionals for over 25 years. Our comprehensive research platform is a complete technical analysis solution – from broad market insights, to portfolio management tools and investment models, to Point and Figure charts on over 80,000 securities and indicators worldwide.
Dorsey, Wright & Associates, LLC, a Nasdaq Company, is a registered investment advisory firm. Past performance does not guarantee future results. In all securities trading, there is a potential for loss as well as profit. It should not be assumed that recommendations made in the future will be profitable or will equal the performance as shown. Investors should have long-term financial objectives when working with Dorsey Wright. The relative strength strategy is NOT a guarantee. There may be times where all investments and strategies are unfavorable and depreciate in value. Relative Strength is a measure of price momentum based on historical price activity. Relative Strength is not predictive and there is no assurance that forecasts based on relative strength can be relied upon.The information contained herein has been prepared without regard to any particular investor’s investment objectives, financial situation, and needs. Accordingly, investors should not act on any recommendation (express or implied) or information in this material without obtaining specific advice from their financial advisors and should not rely on information herein as the primary basis for their investment. Each investor should carefully consider the investment objectives, risks and expenses of any Exchange-Traded Fund ("ETF") prior to investing. Before investing in an ETF investors should obtain and carefully read the relevant prospectus and documents the issuer has filed with the SEC. ETFs may result in the layering of fees as ETFs impose their own advisory and other fees. To obtain more complete information about the product the documents are publicly available for free via EDGAR on the SEC website (http:// www.sec.gov) The information contained herein has been prepared without regard to any particular investor’s investment objectives, financial situation, and needs. Accordingly, investors should not act on any recommendation (express or implied) or information in this material without obtaining specific advice from their financial advisors and should not rely on information herein as the primary basis for their investment decisions. Information contained herein is based on data obtained from recognized statistical services, issuer reports or communications, or other sources believed to be reliable (“information providers”). However, such information has not been verified by DWA or the information provider and DWA and the information providers make no representations or warranties or take any responsibility as to the accuracy or completeness of any recommendation or information contained herein. DWA and the information provider accept no liability to the recipient whatsoever whether in contract, in tort, for negligence, or otherwise for any direct, indirect, consequential, or special loss of any kind arising out of the use of this document or its contents or of the recipient relying on any such recommendation or information (except insofar as any statutory liability cannot be excluded). Any statements nonfactual in nature constitute only current opinions, which are subject to change without notice. Neither the information nor any opinion expressed shall constitute an offer to sell or a solicitation or an offer to buy any securities, commodities or exchange traded products. This document does not purport to be complete description of the securities or commodities, markets or developments to which reference is made.