United States Office of Chemical Safety and Environmental Protection Agency Pollution Prevention Draft Risk Evaluation for Perchloroethylene (Ethene, 1,1,2,2-Tetrachloro) Systematic Review Supplemental File: Consumer and General Population Exposure Monitoring Data Extraction Tables CASRN: 127-18-4 April 2020, DRAFT 1 PEER REVIEW DRAFT. DO NOT CITE OR QUOTE.
Transcript
United States Office of Chemical Safety and Environmental Protection Agency Pollution Prevention
Draft Risk Evaluation for Perchloroethylene (Ethene, 1,1,2,2-Tetrachloro)
Systematic Review Supplemental File: Consumer and General Population Exposure
Monitoring Data Extraction Tables
CASRN: 127-18-4
April 2020, DRAFT
1
PEER REVIEW DRAFT. DO NOT CITE OR QUOTE.
Monitoring Data Extracted for Perc for Indoor Air, Personal Breathing Zone, Surface Water, and Wastewater
Country State/City/Region Site Year
No. of Samples
(Det. Freq.)
Detection Level
Concentration Reference (HERO ID)
Range Central Tendency
Standard Deviation HERO Citation
Data Eval. Score
Indoor Air (µg/m3) US Michigan (south-
east) Commercial/Public Office area of commercial buildings (n=4), including two art museums, a university building and a tire store/auto service. Stationary samples collected from breathing height.
2005-2008
5 (0.8) 0.002 ND to 39.7 8.02 (mean); 0.1 (median)
0.91 2214330 {Jia, 2010, 2214330}
High
US Detroit, MI area Residential Homes (n=126) with children with asthma
2009-2010
126 (0.91)
0.09 ND to 13.7 0.71 (mean); 0.26 (median)
-- 2443355 {Chin, 2014, 2443355}
High
US California (statewide)
Commercial/Public Furniture/hardware stores (n=8)
2011-2013
58 (0.48) 0.32 0.32 to 22.2 5.6 (mean); NR (median)
-- 2535652 {W. R. Chan, 2014, 2535652}
High
US California (statewide)
Commercial/Public Grocery stores (n=8)
2011-2013
76 (0.32) 0.32 0.32 to 5.9 1 (mean); NR (median)
-- 2535652 {W. R. Chan, 2014, 2535652}
High
US California (statewide)
Commercial/Public Apparel stores (n=2)
2011-2013
20 (0.3) 0.32 0.32 to NR 0.2 (mean); NR (median)
-- 2535652 {W. R. Chan, 2014, 2535652}
High
US Baltimore, MD Commercial/Public (Near Source: photocopy shop) Personal samples from breathing zone. One from each of the three printing centers.
2000 4 (1) NR 0.678 to 3.39 2.04 (mean); 1.36 (median)
4.75 1953674 {Stefaniak, 2000, 1953674}
High
US Baltimore, MD Commercial/Public (Near Source: photocopy shop) Area samples from
2000 17 (0.94) NR ND to 21.7 2.04 (mean); 1.36 (median)
-- 1953674 {Stefaniak, 2000, 1953674}
High
PEER REVIEW DRAFT. DO NOT CITE OR QUOTE.
Country State/City/Region Site Year
No. of Samples
(Det. Freq.)
Detection Level
Concentration Reference (HERO ID)
Range Central Tendency
Standard Deviation HERO Citation
Data Eval. Score
different locations within each of the three printing centers.
US Elizabeth, NJ; Houston, TX; and Los Angeles, CA
Residential Non-smoking households (n=310)
1999-2001
539 (NR) 0.21 NR 1.85 (mean); 0.82 (median)
7.29 2128575 {Su, 2013, 2128575}
Medium
US CA (five regions) Commercial/Public Commercial buildings (n= 37), 1 m from floor: Fleet service / Gas station convenience store, Dentist office / Healthcare facility, Grocery / Restaurant, Hair salon / Gym, Office, Miscellaneous, Retail
2011 40 (0.94) 0.22 ND to 118 NR (mean); NR (median); 0.18 (GM)
-- 1062239 {X. M. Wu, 2011, 1062239}
High
US Southeast Michigan
Residential Homes (n = 15) sampled in various locations in the home (upstairs, downstairs)
2005 15 (0.73) 0.07 NR to 4.4 0.6 (mean); NR (median)
-- 1065558 {Batterman, 2007, 1065558}
High
US Southeast Michigan
Residential Garages of residences (n = 15)
2005 15 (0.33) 0.07 NR to 1.6 0.3 (mean); NR (median)
1.7 1065558 {Batterman, 2007, 1065558}
High
US Boston, MA Residential Garage of residences
2004-2005
16 (0.81) 0.07 ND to NR 2.8 (mean); 0.3 (median)
3.4 1065844 {Dodson, 2008, 1065844}
High
US Boston, MA Residential Apartment hallway of residences
2004-2005
10 (0.9) 0.07 ND to NR 1.9 (mean); 0.8 (median)
0.92 1065844 {Dodson, 2008, 1065844}
High
US Boston, MA Residential Basement of residences
2004-2005
52 (0.98) 0.07 ND to NR 1.7 (mean); 0.5 (median)
3.1 1065844 {Dodson, 2008, 1065844}
High
US Boston, MA Residential 2004- 83 (0.92) 0.07 ND to NR 1.9 (mean); 0.2 1065844 {Dodson, 2008, High
PEER REVIEW DRAFT. DO NOT CITE OR QUOTE.
Country State/City/Region Site Year
No. of Samples
(Det. Freq.)
Detection Level
Concentration Reference (HERO ID)
Range Central Tendency
Standard Deviation HERO Citation
Data Eval. Score
Interior room of residences
2005 0.6 (median) 1065844}
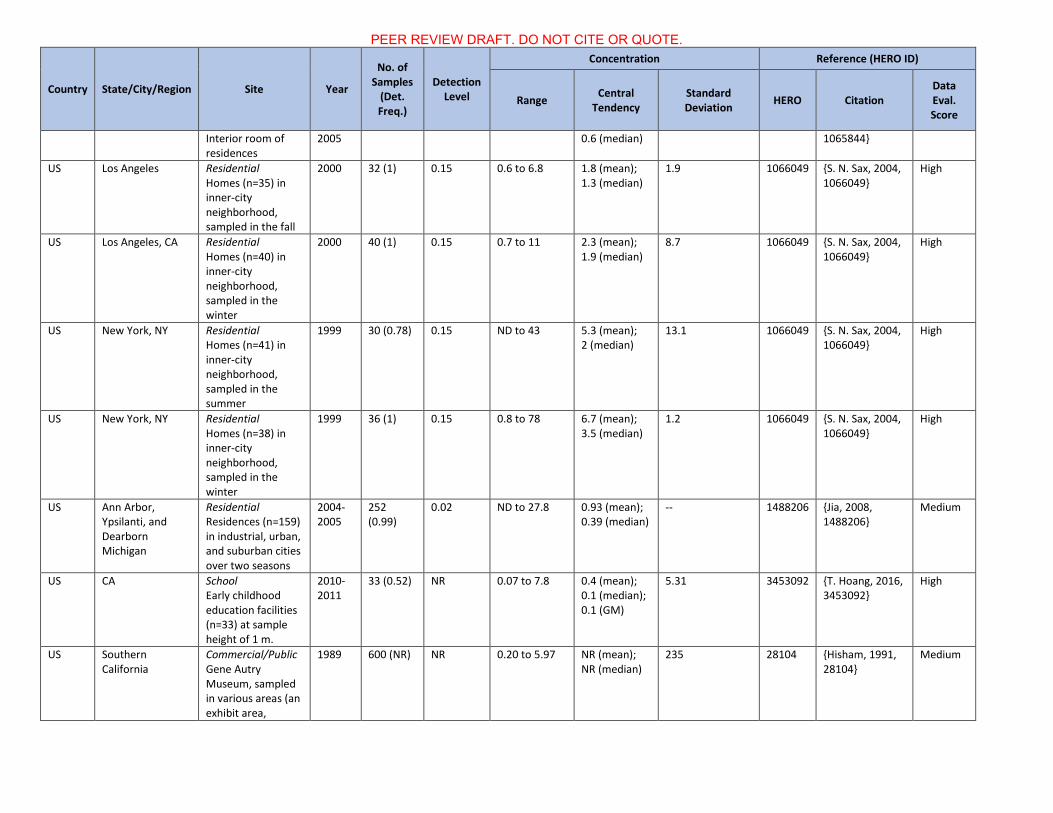
US Los Angeles Residential Homes (n=35) in inner-city neighborhood, sampled in the fall
Residential Residences (n=159) in industrial, urban, and suburban cities over two seasons
2004-2005
252 (0.99)
0.02 ND to 27.8 0.93 (mean); 0.39 (median)
-- 1488206 {Jia, 2008, 1488206}
Medium
US CA School Early childhood education facilities (n=33) at sample height of 1 m.
2010-2011
33 (0.52) NR 0.07 to 7.8 0.4 (mean); 0.1 (median); 0.1 (GM)
5.31 3453092 {T. Hoang, 2016, 3453092}
High
US Southern California
Commercial/Public Gene Autry Museum, sampled in various areas (an exhibit area,
1989 600 (NR) NR 0.20 to 5.97 NR (mean); NR (median)
235 28104 {Hisham, 1991, 28104}
Medium
PEER REVIEW DRAFT. DO NOT CITE OR QUOTE.
Country State/City/Region Site Year
No. of Samples
(Det. Freq.)
Detection Level
Concentration Reference (HERO ID)
Range Central Tendency
Standard Deviation HERO Citation
Data Eval. Score
hallway near truck delivery door, and conservation room)
US Southeast Chicago
Residential Urban homes (n=10) sampled over a 10-month period. Stationary samples were collected from the kitchen in the breathing zone.
1994-1995
48 (1) NR 0.54 to 13.1 2.61 (mean); 2.17 (median)
-- 31210 {M. R. Van Winkle, 2001, 31210}
High
US NR Commercial/Public (Near Source: printmaking) Printmaking art studio at a university (n =1). Mechanically vented second-floor studio, with area samples collected near a cleaning station and in the middle of the studio during a printmaking session.
2002 18 (<1) NR ND to NR 0.4 (mean); 0.18 (median)
1.2 49414 {Ryan, 2002, 49414}
High
US NR Commercial/Public Non-art related floor at a university, three floors above a printmaking floor with separate ventilation (n =1). Area samples collected from hallway.
2002 18 (<1) NR ND to NR 0.4 (mean); 0.18 (median)
8.1 49414 {Ryan, 2002, 49414}
High
US Washington, DC Coin Operated 1980 18 (1) NR 617 to 1357 882 (mean); -- 58127 {Howie, 1981, High
PEER REVIEW DRAFT. DO NOT CITE OR QUOTE.
Country State/City/Region Site Year
No. of Samples
(Det. Freq.)
Detection Level
Concentration Reference (HERO ID)
Range Central Tendency
Standard Deviation HERO Citation
Data Eval. Score
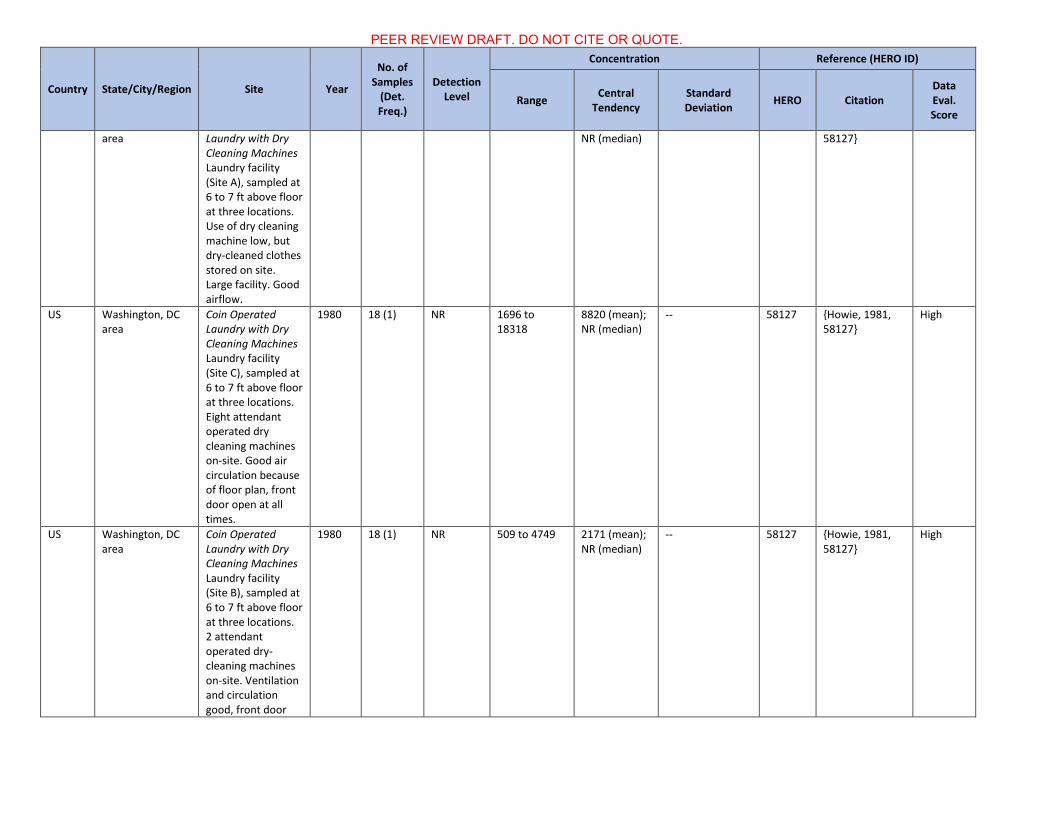
area Laundry with Dry Cleaning Machines Laundry facility (Site A), sampled at 6 to 7 ft above floor at three locations. Use of dry cleaning machine low, but dry-cleaned clothes stored on site. Large facility. Good airflow.
NR (median) 58127}
US Washington, DC area
Coin Operated Laundry with Dry Cleaning Machines Laundry facility (Site C), sampled at 6 to 7 ft above floor at three locations. Eight attendant operated dry cleaning machines on-site. Good air circulation because of floor plan, front door open at all times.
1980 18 (1) NR 1696 to 18318
8820 (mean); NR (median)
-- 58127 {Howie, 1981, 58127}
High
US Washington, DC area
Coin Operated Laundry with Dry Cleaning Machines Laundry facility (Site B), sampled at 6 to 7 ft above floor at three locations. 2 attendant operated dry-cleaning machines on-site. Ventilation and circulation good, front door
1980 18 (1) NR 509 to 4749 2171 (mean); NR (median)
-- 58127 {Howie, 1981, 58127}
High
PEER REVIEW DRAFT. DO NOT CITE OR QUOTE.
Country State/City/Region Site Year
No. of Samples
(Det. Freq.)
Detection Level
Concentration Reference (HERO ID)
Range Central Tendency
Standard Deviation HERO Citation
Data Eval. Score
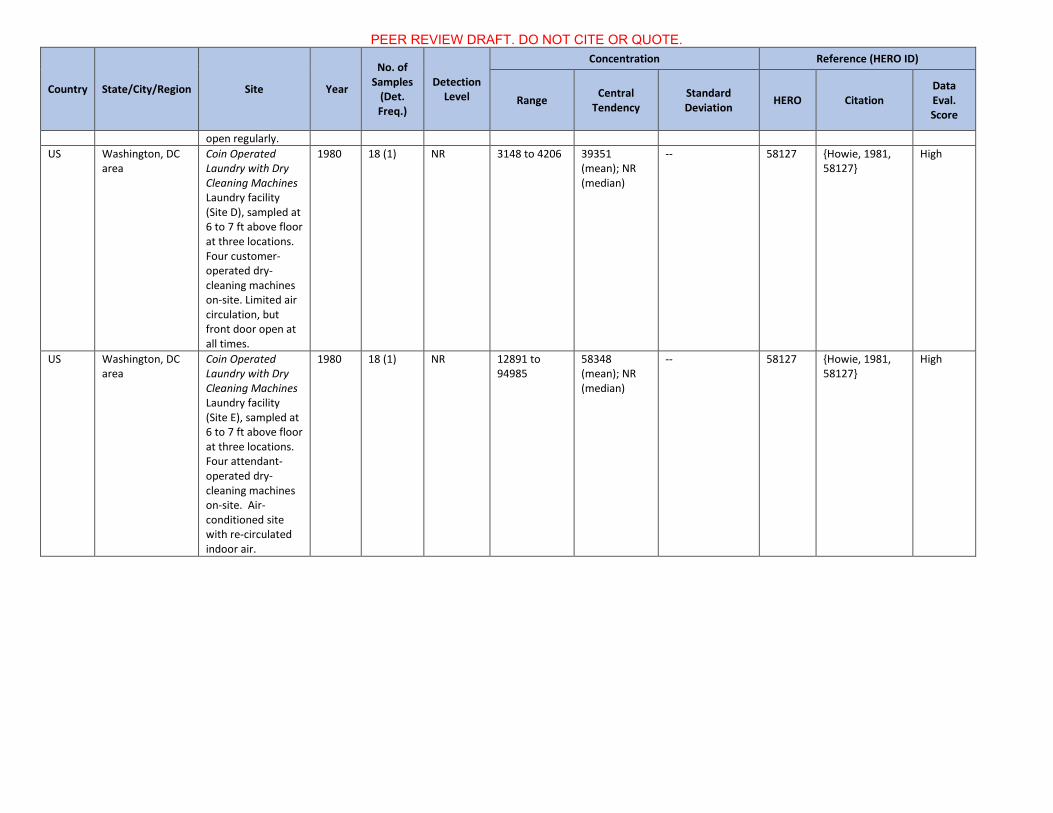
open regularly. US Washington, DC
area Coin Operated Laundry with Dry Cleaning Machines Laundry facility (Site D), sampled at 6 to 7 ft above floor at three locations. Four customer-operated dry-cleaning machines on-site. Limited air circulation, but front door open at all times.
1980 18 (1) NR 3148 to 4206 39351 (mean); NR (median)
-- 58127 {Howie, 1981, 58127}
High
US Washington, DC area
Coin Operated Laundry with Dry Cleaning Machines Laundry facility (Site E), sampled at 6 to 7 ft above floor at three locations. Four attendant-operated dry-cleaning machines on-site. Air-conditioned site with re-circulated indoor air.
1980 18 (1) NR 12891 to 94985
58348 (mean); NR (median)
-- 58127 {Howie, 1981, 58127}
High
PEER REVIEW DRAFT. DO NOT CITE OR QUOTE.
Country State/City/Region Site Year
No. of Samples
(Det. Freq.)
Detection Level
Concentration Reference (HERO ID)
Range Central Tendency
Standard Deviation HERO Citation
Data Eval. Score
US Washington, DC area
Coin Operated Laundry with Dry Cleaning Machines Laundry facility (Site F), sampled at 6 to 7 ft above floor at three locations. Eight attendant-operated dry cleaning machines on-site. Limited air circulation because of floor plan; front door open at all times.
US Minneapolis, MN School Indoors in five randomly selected classrooms in each school, during the spring.
2000 113 (0.86)
NR NR NR (mean); 0.3 (median)
-- 632310 {Adgate, 2004, 632310}
Medium
US Minneapolis, MN School Indoors in five randomly selected classrooms in each school, during the winter.
2000 113 (0.96)
NR NR NR (mean); 0.3 (median)
-- 632310 {Adgate, 2004, 632310}
Medium
US Minneapolis, MN Residential Indoors in the child's primary residence, during the spring.
2000 113 (0.95)
NR NR NR (mean); 0.4 (median)
-- 632310 {Adgate, 2004, 632310}
Medium
PEER REVIEW DRAFT. DO NOT CITE OR QUOTE.
Country State/City/Region Site Year
No. of Samples
(Det. Freq.)
Detection Level
Concentration Reference (HERO ID)
Range Central Tendency
Standard Deviation HERO Citation
Data Eval. Score
US Minneapolis, MN Residential Indoors in the child's primary residence, during the winter.
2000 113 (0.98)
NR NR NR (mean); 0.5 (median)
-- 632310 {Adgate, 2004, 632310}
Medium
MX Mexico City Metropolitan Area
Residential Homes
1998-1999
30 (1) NR NR to 43.6 5.5 (mean); 3 (median); 3.6 (GM)
-- 56224 {Serrano-Trespalacios, 2004, 56224}
High
CA NR Residential Homes (n=12), main floor
1986 12 (1) NR 1 to 171 28.1 (mean); NR (median)
-- 27974 {Chan, 1990, 27974}
Medium
CA NR Residential Homes (n=6), main floor
1987 6 (1) NR 2 to 18 6.2 (mean); NR (median)
-- 27974 {Chan, 1990, 27974}
Medium
IT NR Residential Control Homes - 25 private homes with individuals not occupationally exposed, but within the same district near the dry-cleaners' homes.
IT Modena Residential Households (n=29) with no association with dry cleaning establishments.
1992-1993
58 (NR) 1 1 to 56 NR (mean); 6 (median); 0.006 (GM)
3 74875 {Aggazzotti, 1994, 74875}
High
NL Ede and Rotterdam
Residential Suburban homes built post WWII, Inner-city homes built prior to WWII, and newer homes < 6 years old. Samples collected in living room.
1981-1982
319 (0.3) 2 ND to 205 NR (mean); 1 (median)
-- 22186 {Lebret, 1986, 22186}
Medium
FI NR Residential Normal houses (not "sick houses").
1995 50 (NR) NR ND to 5.65 0.46 (mean); 0.3 (median)
11 76241 {Kostiainen, 1995, 76241}
Medium
PEER REVIEW DRAFT. DO NOT CITE OR QUOTE.
Country State/City/Region Site Year
No. of Samples
(Det. Freq.)
Detection Level
Concentration Reference (HERO ID)
Range Central Tendency
Standard Deviation HERO Citation
Data Eval. Score
50 "Normal houses" in this study.
FI NR Residential "Sick houses" - houses in which people complained about the odor or they had symptoms, which resembled WHO's Sick Building Syndrome (headache, nausea, irritation of the eyes, mucous membranes, and the respiratory system, drowsiness, fatigue, and general malaise. 38 "sick houses" in this study.
1995 7 (NR) NR 0.19 to 29.8 4.86 (mean); 0.73 (median)
0.66 76241 {Kostiainen, 1995, 76241}
Medium
SG nation-wide School Child-care centers (n=104), sampled from middle of the classroom near the breathing zone of children (approximately 0.5–0.7 m)
2007 84 (0.72) 0.6 ND to 8.5 NR (mean); 0.3 (median)
-- 632758 {Zuraimi, 2008, 632758}
High
DE Hamburg area Vehicle (Near Source: dry-cleaning) Dry-cleaned down jacket placed into a car.
1990 3 (1) NR 9300 to 24800
NR (mean); NR (median)
-- 713690 {Gulyas, 1990, 713690}
Medium
PEER REVIEW DRAFT. DO NOT CITE OR QUOTE.
Country State/City/Region Site Year
No. of Samples
(Det. Freq.)
Detection Level
Concentration Reference (HERO ID)
Range Central Tendency
Standard Deviation HERO Citation
Data Eval. Score
SA Kuwait Residential Houses (n=20), sampled from living room
1998 226 (0.93)
0.26 ND to NR NR (mean); NR (median)
-- 1744157 {Bouhamra, 1999, 1744157}
Medium
FR nation-wide Residential Main dwellings(n=490), samples collected from bedroom.
2003-2005
490 (0.84)
0.4 ND to 72.1 NR (mean); 1.3 (median)
-- 733119 {Billionnet, 2011, 733119}
Medium
FR Paris area Residential Homes (n=196) of the PARIS birth cohort with sampling in the infant bedroom at 1, 6, 9, and 12 months old.. Annual levels averaged from hot and cold seasonal levels.
2003-2007
177 (1) 0.4 0.6 to 124.2 NR (mean); 2.3 (median); 2.8 (GM)
-- 2128839 {Roda, 2013, 2128839}
Medium
FR Paris area Residential Homes (n=196) of the PARIS birth cohort with sampling in the infant bedroom at 1, 6, 9, and 12 months old. Hot season levels.
2003-2008
177 (NR) 0.4 0.4 to 245 NR (mean); 2.1 (median); 2.4 (GM)
-- 2128839 {Roda, 2013, 2128839}
Medium
FR Paris area Residential Homes (n=196) of the PARIS birth cohort with sampling in the infant bedroom at 1, 6, 9, and 12 months old.. Cold season levels.
2003-2009
177 (1) 0.4 0.6 to 59.2 NR (mean); 2.4 (median); 2.8 (GM)
15.8 2128839 {Roda, 2013, 2128839}
Medium
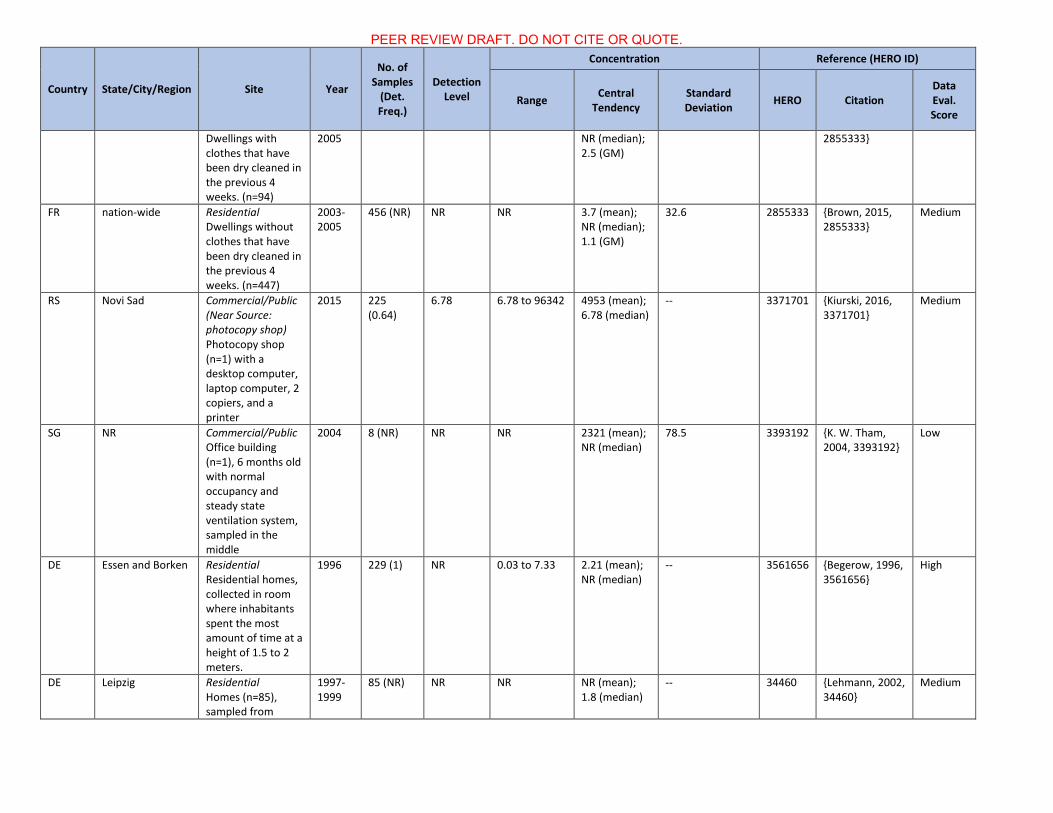
FR nation-wide Residential 2003- 98 (NR) NR NR 5.3 (mean); 10.6 2855333 {Brown, 2015, Medium
PEER REVIEW DRAFT. DO NOT CITE OR QUOTE.
Country State/City/Region Site Year
No. of Samples
(Det. Freq.)
Detection Level
Concentration Reference (HERO ID)
Range Central Tendency
Standard Deviation HERO Citation
Data Eval. Score
Dwellings with clothes that have been dry cleaned in the previous 4 weeks. (n=94)
2005 NR (median); 2.5 (GM)
2855333}
FR nation-wide Residential Dwellings without clothes that have been dry cleaned in the previous 4 weeks. (n=447)
2003-2005
456 (NR) NR NR 3.7 (mean); NR (median); 1.1 (GM)
32.6 2855333 {Brown, 2015, 2855333}
Medium
RS Novi Sad Commercial/Public (Near Source: photocopy shop) Photocopy shop (n=1) with a desktop computer, laptop computer, 2 copiers, and a printer
2015 225 (0.64)
6.78 6.78 to 96342 4953 (mean); 6.78 (median)
-- 3371701 {Kiurski, 2016, 3371701}
Medium
SG NR Commercial/Public Office building (n=1), 6 months old with normal occupancy and steady state ventilation system, sampled in the middle
2004 8 (NR) NR NR 2321 (mean); NR (median)
78.5 3393192 {K. W. Tham, 2004, 3393192}
Low
DE Essen and Borken Residential Residential homes, collected in room where inhabitants spent the most amount of time at a height of 1.5 to 2 meters.
1996 229 (1) NR 0.03 to 7.33 2.21 (mean); NR (median)
-- 3561656 {Begerow, 1996, 3561656}
High
DE Leipzig Residential Homes (n=85), sampled from
1997-1999
85 (NR) NR NR NR (mean); 1.8 (median)
-- 34460 {Lehmann, 2002, 34460}
Medium
PEER REVIEW DRAFT. DO NOT CITE OR QUOTE.
Country State/City/Region Site Year
No. of Samples
(Det. Freq.)
Detection Level
Concentration Reference (HERO ID)
Range Central Tendency
Standard Deviation HERO Citation
Data Eval. Score
bedroom of infants for 4 weeks after birth.
EU Sweden, Finland, Estonia, Lithuania, Belgium, UK, France, Austria, Germany, Poland, Slovakia, Czech Republic, Hungary, Romania, Bulgaria, Serbia, Bosnia and Herzegovina, Italy, Portugal, Malta, Greece, Cyprus, and Albania
School Kindergartens (n=25).
2014 25 (NR) NR ND to 6 1 (mean); 0.18 (median)
2 4440449 {Ec, 2014, 4440449}
High
EU Sweden, Finland, Estonia, Lithuania, Belgium, UK, France, Austria, Germany, Poland, Slovakia, Czech Republic, Hungary, Romania, Bulgaria, Serbia, Bosnia and Herzegovina, Italy, Portugal, Malta, Greece, Cyprus, and Albania
School Primary schools (n=300).
2014 300 (NR) NR ND to 81 1 (mean); 0.18 (median)
2 4440449 {Ec, 2014, 4440449}
High
PEER REVIEW DRAFT. DO NOT CITE OR QUOTE.
Country State/City/Region Site Year
No. of Samples
(Det. Freq.)
Detection Level
Concentration Reference (HERO ID)
Range Central Tendency
Standard Deviation HERO Citation
Data Eval. Score
EU Sweden, Finland, Estonia, Lithuania, Belgium, UK, France, Austria, Germany, Poland, Slovakia, Czech Republic, Hungary, Romania, Bulgaria, Serbia, Bosnia and Herzegovina, Italy, Portugal, Malta, Greece, Cyprus, and Albania
School Primary schools where teachers participated (n=106).
2014 106 (NR) NR ND to 31 1 (mean); 0.18 (median)
-- 4440449 {Ec, 2014, 4440449}
High
CN NR Commercial/Public Non-office premises (n=10) including one library, one social services center, two customer services centers, two shopping malls, two recreational building units, one reception area and one training center under renovation. 1.1 m above the floor level.
1995 238 (1) NR 0.358 to 71 4.24 (mean); NR (median); 2.42 (GM)
-- 3545469 {Amagai, 1999, 3545469}
Medium
Personal Breathing Zone (µg/m3) US IL, IN, OH, MI,
MN, WI (Great Lakes Region)
Residential Non-institutionalized persons residing in households in six states
1995-1997
386 (0.61)
NR ND to NR 31.9 (mean); 1.98 (median)
-- 14003 {Clayton, 1999, 14003}
High
US Columbus, OH Residential Non-smoking women (n=24) with non-smoking
1991 24 (NR) NR ND to 5.13 1.24 (mean); 0.7 (median)
1.46 22045 {Heavner, 1995, 22045}
Medium
PEER REVIEW DRAFT. DO NOT CITE OR QUOTE.
Country State/City/Region Site Year
No. of Samples
(Det. Freq.)
Detection Level
Concentration Reference (HERO ID)
Range Central Tendency
Standard Deviation HERO Citation
Data Eval. Score
husbands US Columbus, OH Residential
Non-smoking (n=25) women with smoking husbands
1991 25 (NR) NR ND to 3.78 0.89 (mean); 0.68 (median)
0.96 22045 {Heavner, 1995, 22045}
Medium
US NR Commercial/Public (Near Source: printmaking) 12 students and 1 faculty member in university art (printmaking) studio. Mechanically ventilated second-floor.
2002 90 (NR) NR ND to NR 0.7 (mean); 0.5 (median)
2.3 49414 {Ryan, 2002, 49414}
High
PEER REVIEW DRAFT. DO NOT CITE OR QUOTE.
Country State/City/Region Site Year
No. of Samples
(Det. Freq.)
Detection Level
Concentration Reference (HERO ID)
Range Central Tendency
Standard Deviation HERO Citation
Data Eval. Score
US NR General Personal VOC exposures of 851 adults, who were part of the NHANES study (no additional exclusion criteria), sampled via badge-type passive exposure monitors for 48–72 h. Additionally, participants were administered a short questionnaire regarding the length of time they wore their badge and 30 other questions on factors potentially related to VOC exposures, e.g., contact with dry cleaning, tobacco smoke and gasoline vapor over the past several days.
1999-2000
665 (0.69)
0.42 ND to 659 5.2 (mean); 0.7 (median); 1 (GM)
31.2 484177 {Jia, 2008, 484177}
High
US Minneapolis, MN Residential In personal breathing zones, during the winter.
2000 113 (1) NR NR 0.4 (median) -- 632310 {Adgate, 2004, 632310}
Medium
US Minneapolis, MN Residential In personal breathing zones, during the spring.
2000 113 (0.97)
NR NR 0.4 (median) -- 632310 {Adgate, 2004, 632310}
Medium
PEER REVIEW DRAFT. DO NOT CITE OR QUOTE.
Country State/City/Region Site Year
No. of Samples
(Det. Freq.)
Detection Level
Concentration Reference (HERO ID)
Range Central Tendency
Standard Deviation HERO Citation
Data Eval. Score
US Minneapolis-St. Paul, MN
General Adults, non-smoking (n=70) living in three neighborhoods: (inner-city/economically disadvantaged, blue-collar/near manufacturing plants, and affluent)
1999 333 (1) NR NR 27.8 (mean); 0.9 (median)
-- 730121 {Sexton, 2007, 730121}
High
US Elizabeth, NJ; Houston, TX; and Los Angeles, CA
General Adults (n=309) and children (n=118) from 310 non-smoking households.
US CA and NJ General Adults conducting normal daily activities
1981-1984
772 (NR) 0 NR 5.6 to 45 (mean)
-- 23081 {Wallace, 1986, 23081}
High
US NR Mixed Use NHANES study measured exposures on adults aged 20–59 years to TCE. Participants wore passive exposure monitors. Returned 2–3 days later at which time a short survey was administered regarding activities potentially related to exposures.
1999-2000
633 (0.686)
NR 0.1 to 659.1 0.7 (median); 1 (GM)
-- 2331366 {D’Souza, 2009, 2331366}
High
PEER REVIEW DRAFT. DO NOT CITE OR QUOTE.
Country State/City/Region Site Year
No. of Samples
(Det. Freq.)
Detection Level
Concentration Reference (HERO ID)
Range Central Tendency
Standard Deviation HERO Citation
Data Eval. Score
MX Mexico City Metropolitan Area
General General - different activity patterns: Three individuals from each family were selected to represent different activity patterns: a long commuter, another engaged in some activities outside the home during the day but with no routine long commutes, and one staying at or near the home most of the day
1998-1999
90 (1) NR NR to 84.4 5.9 (mean); 3.7 (median); 4.1 (GM)
9.9 56224 {Serrano-Trespalacios, 2004, 56224}
Low
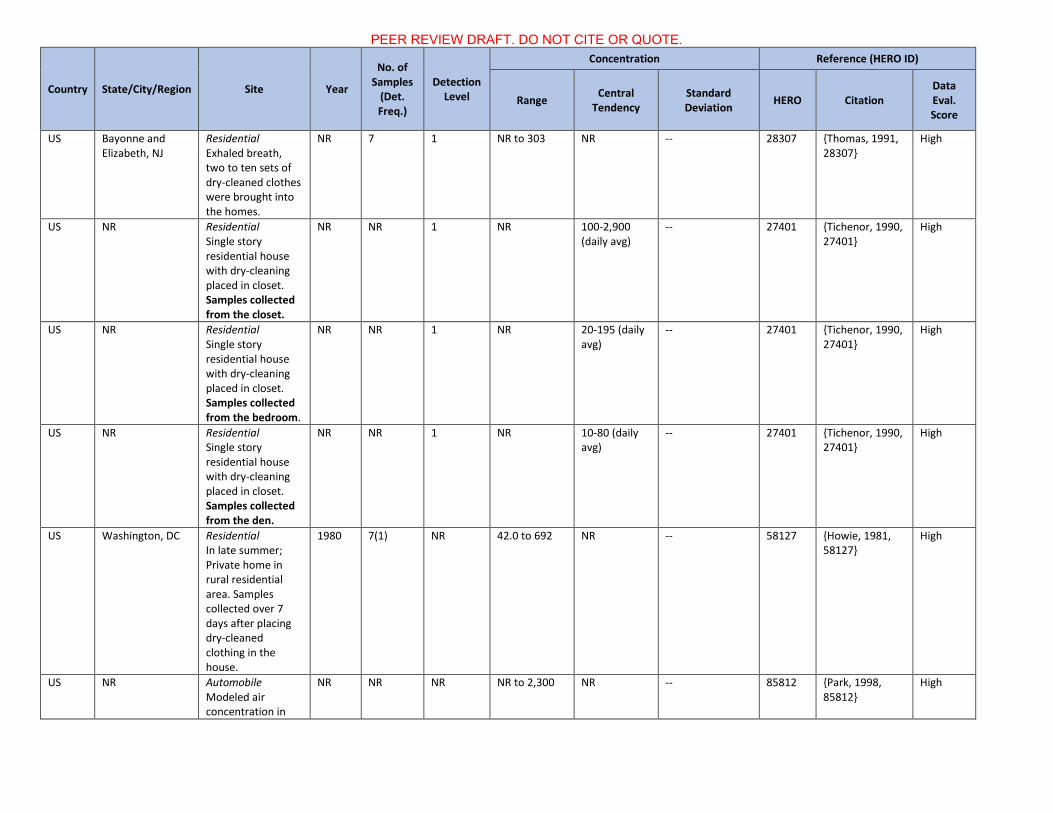
Indoor Air, Personal Breathing Zones, and Breath from Exposure Studies with Dry-Cleaned Textiles (µg/m3) US Bayonne and
Elizabeth, NJ Residential Indoor air of living rooms and bedrooms of nine homes with two to ten sets of dry-cleaned clothes were brought into the homes.
NR 18 NR NR to 297 NR -- 28307 {Thomas, 1991, 28307}
High
US Bayonne and Elizabeth, NJ
Residential Personal air two to ten sets of dry-cleaned clothes were brought into the homes.
NR 7 1 NR to 303 NR -- 28307 {Thomas, 1991, 28307}
High
PEER REVIEW DRAFT. DO NOT CITE OR QUOTE.
Country State/City/Region Site Year
No. of Samples
(Det. Freq.)
Detection Level
Concentration Reference (HERO ID)
Range Central Tendency
Standard Deviation HERO Citation
Data Eval. Score
US Bayonne and Elizabeth, NJ
Residential Exhaled breath, two to ten sets of dry-cleaned clothes were brought into the homes.
NR 7 1 NR to 303 NR -- 28307 {Thomas, 1991, 28307}
High
US NR Residential Single story residential house with dry-cleaning placed in closet. Samples collected from the closet.
NR NR 1 NR 100-2,900 (daily avg)
-- 27401 {Tichenor, 1990, 27401}
High
US NR Residential Single story residential house with dry-cleaning placed in closet. Samples collected from the bedroom.
NR NR 1 NR 20-195 (daily avg)
-- 27401 {Tichenor, 1990, 27401}
High
US NR Residential Single story residential house with dry-cleaning placed in closet. Samples collected from the den.
NR NR 1 NR 10-80 (daily avg)
-- 27401 {Tichenor, 1990, 27401}
High
US Washington, DC Residential In late summer; Private home in rural residential area. Samples collected over 7 days after placing dry-cleaned clothing in the house.
1980 7(1) NR 42.0 to 692 NR -- 58127 {Howie, 1981, 58127}
High
US NR Automobile Modeled air concentration in
NR NR NR NR to 2,300 NR -- 85812 {Park, 1998, 85812}
High
PEER REVIEW DRAFT. DO NOT CITE OR QUOTE.
Country State/City/Region Site Year
No. of Samples
(Det. Freq.)
Detection Level
Concentration Reference (HERO ID)
Range Central Tendency
Standard Deviation HERO Citation
Data Eval. Score
vehicle with dry-cleaned jacket.
DE NR Automobile Car with a dry-cleaned down jacket placed in the car.
1990 3(1) NR 9,300 to 24,800
NR -- 713690 {Gulyas, 1990, 713690}
Medium
CN Hong Kong Residential Home (Site A) with dry cleaned clothes in closet of urban 5th floor apartment bedroom.
1996 28 (1) NR 4.6 to 76 NR -- 3559311 {Chao, 1999, 3559311}
Medium
CN Hong Kong Residential Home (Site B) with dry cleaned clothes in closet of suburban 2nd floor apartment bedroom.
1996 28 (1) NR 21 to 494 NR -- 3559311 {Chao, 1999, 3559311}
Medium
CN Hong Kong Residential Home (Site C) with dry cleaned clothes in closet of urban 10th floor apartment bedroom.
1996 28 (1) NR 0.93 to 100 NR -- 3559311 {Chao, 1999, 3559311}
Medium
JP NR Residential Homes in Japan, dry cleaned clothes sampled in chest of drawers.
NR 9 (1) NR 2.9 to 326.6 NR -- 3563210 {Kawauchi, 1989, 3563210}
Medium
JP NR Residential Homes in Japan, dry cleaned clothes sampled in same room as chest of drawers.
NR 6 (1) NR 1.3 to 7.4 NR -- 3563210 {Kawauchi, 1989, 3563210}
Medium
Surface Water (µg/L) US Anchorage, AK Background 1998- 11 (0) 0.2 All ND ND NR 3975042 {Usgs, 2006, Medium
PEER REVIEW DRAFT. DO NOT CITE OR QUOTE.
Country State/City/Region Site Year
No. of Samples
(Det. Freq.)
Detection Level
Concentration Reference (HERO ID)
Range Central Tendency
Standard Deviation HERO Citation
Data Eval. Score
Chester Creek (6 urban sampling sites)
2001 3975042}
US Nation-wide Background Surface water for drinking water sources (rivers and reservoirs)
1999-2000
375 (0.008)
0.2 ND to 5.5 NR NR 3975046 {Usgs, 2003, 3975046}
Medium
US Nation-wide Surface water for drinking water sources (rivers and reservoirs)
1999-2000
375 (0.0027)
0.2 ND to 2.6 NR NR 3975046 {Usgs, 2003, 3975046}
Medium
US to CL NR Background Eastern Pacific Ocean (California, US to Valparaiso, Chile)
1979-1981
30 (0.90) 0.0001 ND to 0.0028 0.7 (mean); 0.0004 (median)
0.0007 29192 {Singh, 1983, 29192}
Medium
US to CL NR Eastern Pacific Ocean (California, US to Valparaiso, Chile)
1979-1981
30 (0.93) 0.0004 ND to 0.008 0.0031 (mean)
0.0032 29192 {Singh, 1983, 29192}
Medium
BR NR Background Santo Antonio da Patrulha, Tres Coroas, and Parobe in the Sinos River Basin; River samples collected from seven points on the three main rivers of the Sinos River Basin
2012-2013
60 (0.083)
NR ND to 0.8 0.03 (mean) NR 3489827 {Bianchi, 2017, 3489827}
Medium
BR NR Santo Antonio da Patrulha, Tres Coroas, and Parobe in the Sinos River Basin; River samples collected from seven points on the three main rivers of the Sinos River Basin
2012-2013
60 (0.72) NR ND to 0.0588 0.0019 (mean)
NR 3489827 {Bianchi, 2017, 3489827}
Medium
CN NR Background Yellow Sea and East China Sea (53
2011 53 (1.0) NR 0.00022 to 0.0051
0.0019 (mean)
NR 2128010 {He, 2013, 2128010}
High
PEER REVIEW DRAFT. DO NOT CITE OR QUOTE.
Country State/City/Region Site Year
No. of Samples
(Det. Freq.)
Detection Level
Concentration Reference (HERO ID)
Range Central Tendency
Standard Deviation HERO Citation
Data Eval. Score
stations) CN NR Background
Daliao River (n=20 sites), heavily industrialized
2011 20 (0.1) NR NR to 0.11 0.016 (mean) NR 3488897 {Ma, 2014, 3488897}
High
CN NR Background East China Sea; Seawater (41 stations)
2010 41 (1) NR 0.000065 to 0.0015
0.0004 (mean)
NR 1940132 {He, 2013, 1940132}
High
ES North-Western area Background River Duero (11 stations)
2007 11 (NR) NR NR to 0.09 0.01 (mean) NR 3501965 {Blanco, 2010, 3501965}
Medium
GB NR Background Irish Sea; Liverpool Bay and River Mersey (18 stations)
2006 18 (NR) 0.000025 ND to 0.0455 NR NR 2277377 {Bravo-Linares, 2007, 2277377}
Medium
RU NR Background Kalmykian Steppe; Rivers, springs, lakes, salt lakes (n=23); polluted and remote areas
PT Nation-wide Background sea, estuarine, river water and industrial effluents (46 water sample locations)
1999-2000
644 (0.20)
0.4 ND to 13 NR NR 659075 {Martinez, 2002, 659075}
Medium
BE NR Background Southern North Sea; Southern Bight, Belgian Continental Shel, the mouth of the Scheldt estuary, and the Channel (10 stations total)
1998-2000
47 (NR) NR NR to 0.28 0.023 (mean); 0.0015 (median)
NR 660096 {Huybrechts, 2005, 660096}
High
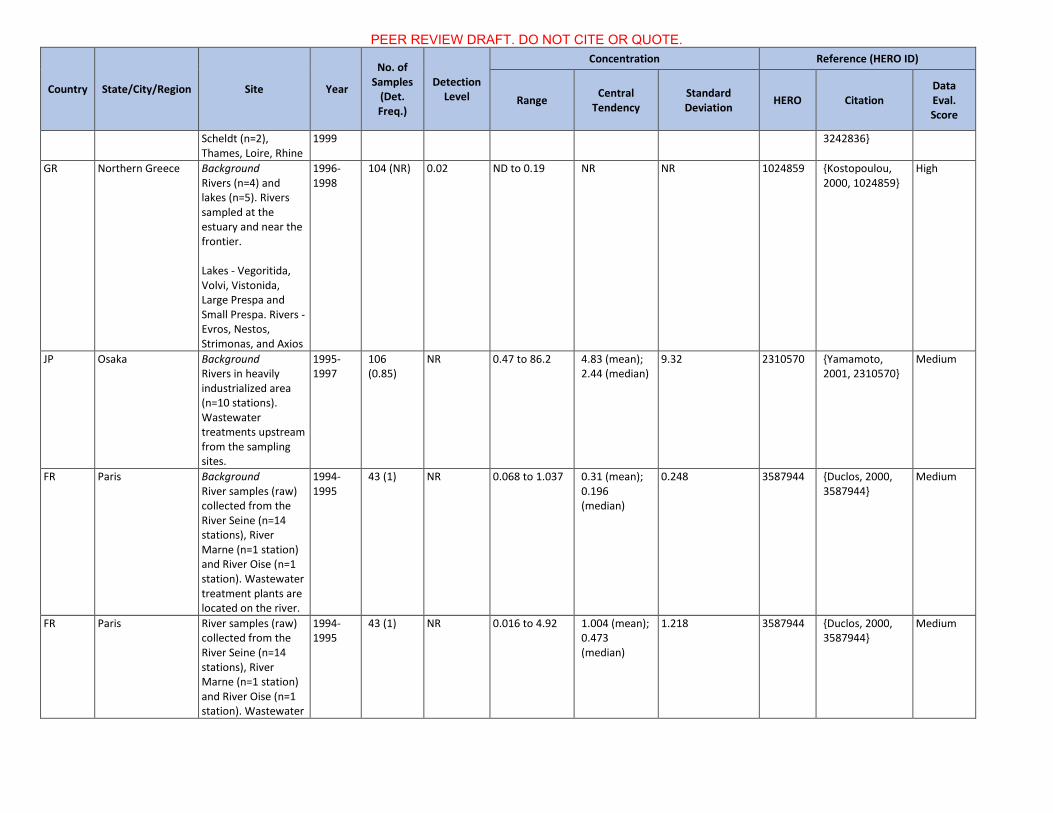
EU NR Background Estuaries of the Scheldt (n=2), Thames, Loire, Rhine
1997-1999
73 (NR) 0.000099 ND to 1.2 NR NR 3242836 {Christof, 2002, 3242836}
High
EU NR Estuaries of the 1997- 73 (1) NR 0.0003 to 4.98 NR NR 3242836 {Christof, 2002, High
PEER REVIEW DRAFT. DO NOT CITE OR QUOTE.
Country State/City/Region Site Year
No. of Samples
(Det. Freq.)
Detection Level
Concentration Reference (HERO ID)
Range Central Tendency
Standard Deviation HERO Citation
Data Eval. Score
Scheldt (n=2), Thames, Loire, Rhine
1999 3242836}
GR Northern Greece Background Rivers (n=4) and lakes (n=5). Rivers sampled at the estuary and near the frontier.
Lakes - Vegoritida, Volvi, Vistonida, Large Prespa and Small Prespa. Rivers - Evros, Nestos, Strimonas, and Axios
1996-1998
104 (NR) 0.02 ND to 0.19 NR NR 1024859 {Kostopoulou, 2000, 1024859}
High
JP Osaka Background Rivers in heavily industrialized area (n=10 stations). Wastewater treatments upstream from the sampling sites.
1995-1997
106 (0.85)
NR 0.47 to 86.2 4.83 (mean); 2.44 (median)
9.32 2310570 {Yamamoto, 2001, 2310570}
Medium
FR Paris Background River samples (raw) collected from the River Seine (n=14 stations), River Marne (n=1 station) and River Oise (n=1 station). Wastewater treatment plants are located on the river.
1994-1995
43 (1) NR 0.068 to 1.037 0.31 (mean); 0.196 (median)
0.248 3587944 {Duclos, 2000, 3587944}
Medium
FR Paris River samples (raw) collected from the River Seine (n=14 stations), River Marne (n=1 station) and River Oise (n=1 station). Wastewater
1994-1995
43 (1) NR 0.016 to 4.92 1.004 (mean); 0.473 (median)
1.218 3587944 {Duclos, 2000, 3587944}
Medium
PEER REVIEW DRAFT. DO NOT CITE OR QUOTE.
Country State/City/Region Site Year
No. of Samples
(Det. Freq.)
Detection Level
Concentration Reference (HERO ID)
Range Central Tendency
Standard Deviation HERO Citation
Data Eval. Score
treatment plants are located on the river.
JP Osaka Rivers and estuaries (30 sites) in industrialized city
1993-1995
136 (NR) NR NR to 134 1.7 (median) NR 645789 {Yamamoto, 1997, 645789}
High
BE NR Background Southern North Sea and Scheldt Estuary; Seven sites in the southern North Sea and Scheldt Estuary.
1994-1995
38 (NR) NR NR 0.00268 (median)
NR 644857 {Dewulf, 1998, 644857}
High
EU NR Background Mersey Estuary; Freshwater input collected from the Howley Weir.
1987-1989
5 (NR) NR NR 0.6 (mean); 0.6 (median)
NR 2802879 {Rogers, 1992, 2802879}
Medium
GR Thermaikos and Kavala, Northern Greece
Background Seawater collected from Thermaikos Gulf (6 stations; near large city and industrial area) and Kavala Gulf stations (4 stations; near small city and off-shore oil-wells).
1981-1982
10 (1) NR 0.00027 to 0.003
0.00131 (mean); 0.00116 (median)
0.00099 4149731 {Fytianos, 1985, 4149731}
Low
CH Background Background River Aare; River samples collected at River Aare.
1980-1981
12 (NR) NR NR 0.24 (mean) 0.12 3797825 {Schwarzenbach, 1983, 3797825}
Medium
CH Background Background River Glatt; River samples collected at River Glatt.
1979-1980
16 (NR) NR NR 0.6 (mean) 0.70 3797825 {Schwarzenbach, 1983, 3797825}
Medium
GB NR Background Estuaries, docks, channels, bays, and inshore (n=48)
1992 48 (0.44) NR 0.01 to 0.274 0.04491 (mean); 0.0125 (median)
0.0645 2803418 {Dawes, 1994, 2803418}
Medium
SE Stenungsund area Background Seawater (n=13
1988 52 (NR) NR NR 0.0025 (mean)
NR 658636 {Abrahamsson, 1989, 658636}
Medium
PEER REVIEW DRAFT. DO NOT CITE OR QUOTE.
Country State/City/Region Site Year
No. of Samples
(Det. Freq.)
Detection Level
Concentration Reference (HERO ID)
Range Central Tendency
Standard Deviation HERO Citation
Data Eval. Score
stations), sampled on two occasions (depths of 1-10 m) in area of petrochemical centre
GB NR Background and Near Facility (Ship Tanker Cleaning Operations) North Sea; North Sea: 32 sampling stations in the Thames, Humber, Tees, Forth, and Felixstowe (0 to 20 miles from shore) and the Central North Sea (distance from shore not provided). Tank cleaning operations at North Sea ports.
1984 6 (0.574) NR 18 to 168 136 (mean) NR 4149721 {Aggazzotti, 1986, 4149721}
Low
AQ NR Background Northern Victoria Land; Five lakes (Carezza Lake, Edmonson Point Lakes, Tarn Flat Lake, Inexpressible Island Lake and Gondwana Lake)
2011-2012
6 (1) NR 0.0056 to 0.0166
0.0097 (mean)
0.0038 2800175 {Insogna, 2014, 2800175}
High
AQ NR Background Ross Sea
1997-1998
48 (NR) NR 0.0002 to 0.071 0.02 (mean); 0.0056 (median)
0.023 2189687 {Zoccolillo, 2004, 2189687}
Medium
AQ NR Background Lakes at Tarn Flat and Edmonson Point; Two freshwater lakes
1998 4 (NR) NR 0.0023 to 0.0041
0.0032 (mean); 0.0031 (median)
0.0007 2189687 {Zoccolillo, 2004, 2189687}
Medium
PEER REVIEW DRAFT. DO NOT CITE OR QUOTE.
Country State/City/Region Site Year
No. of Samples
(Det. Freq.)
Detection Level
Concentration Reference (HERO ID)
Range Central Tendency
Standard Deviation HERO Citation
Data Eval. Score
AQ NR Background Lake water collected from 3 sites (Carezza Lake, Tarn Flat, Inexpressible Island at altitude m 100) and Ice water collected from 3 sites (Corner Glacier, Edmonson Point, Onyx River)
1988-1989
6 (NR) NR 0.0011 to 0.0099
NR NR 3544414 {Zoccolillo, 1994, 3544414}
Medium
AQ NR Background Lake water collected from 5 sites (Carezza Lake, Edmonson Point at altitude m 190, Tarn Flat, Inexpressible Island at altitude m 100 & altitude m 50) and Ice water collected from 3 sites (Corner Glacier, Inexpressible Island, Wood Bay)
1989-1990
8 (NR) NR 0.0014 to 0.0043
NR NR 3544414 {Zoccolillo, 1994, 3544414}
Medium
AQ NR Background Lake water collected from 5 sites (Carezza Lake, Edmonson Point at altitude m 190 & altitude m 20, Tarn Flat, Inexpressible Island at altitude m 100) and Sea water collected from 1 site (Icarus Field)
Study Info: The information provided includes the HERO ID and citation; country and year samples collected; number of samples and detection frequency.
Abbreviations: If a value was applicable, it is shown in this table as “—”; ND = not detected at the reported detection limit; GM = geometric mean; NR = not reported.
The following abbreviations are for countries/continents: AQ = Antarctica, BE = Belgium, BR = Brazil, CA = Canada, CH = Switzerland, CL = Chile, CN = China, DE = Germany, ES = Spain, EU = Europe, FI = Finland, FR = France, GB = Great Britain, GR = Greece, IT = Italy, JP = Japan, KR = Korea, MX = Mexico, NL = Netherlands, PT = Portugal, RS = Serbia, RU = Russia, SA = Saudi Arabia, SE = Sweden, SG = Singapore, US = United States.
Parameters: All statistics are shown as reported in the study. All minimum values determined to be less than the detection limit are shown in this table as “ND”. If a maximum value was not provided, the highest percentile available is shown (as indicated in parentheses); if a minimum value was not provided, the lowest percentile available is shown (as indicated in parentheses).