Page 1
Systematic study of the new Anopheles funestus-like species from
Malawi
Vezenegho Samuel Bumuh
„A thesis submitted to the Faculty of Health Science, University of the
Witwatersrand Johannesburg, in fulfilment of the requirements for the
degree of Doctor of Philosophy’
Johannesburg, 2012
Page 2
i
DECLARATION
I, Samuel Bumuh Vezenegho declare that this thesis is my own work. It is being submitted
for the degree of Doctor of Philosophy in the University of the Witwatersrand,
Johannesburg. It has not been submitted before for any degree or examination at this or any
other university.
…………………………………………… [Signature of candidate]
……23rd
……….Day of……April….2012
Page 3
ii
DEDICATION
I dedicate this thesis to our God and Lord. To my wife, Confidence and Son, Valery;
parents, Clement and Regina Bumuh, brothers and sister for their love and encouragement
Page 4
iii
PUBLICATION AND PRESENTATIONS:
Publication:
Vezenegho, S. B., Bass, C., Puinean, M., Williamson, M. S Field, L. M., Coetzee, M and
Koekemoer, L. L (2009). Development of multiplex real-time PCR assays for
identification of members of the Anopheles funestus species group. Malaria Journal 2009,
8:282 (Appendix VII)
Presentations:
Vezenegho S. B., Coetzee, M., and Koekemoer, L. L. Biological and behavioral
characterization of Anopheles funestus-like from Malawi. Parasitological Society of
Southern Africa Conference (PARSA) 10-13 July 2011
Vezenegho S. B., Bass. C., Williamson. M., Puinean. M., Koekemoer. L. L., Coetzee
M. and Field, L. Development of Anopheles funestus species identification. Rothamsted
Research UK. 14 July 2009.
Vezenegho S. B., Bass. C., Williamson. M., Puinean. M., Koekemoer. L. L., Coetzee
M. and Field, L. Development of multiplex real -time PCR assays for identification of
Anopheles funestus species group. Faculty of health science research day 22 September
2010
Vezenegho S. B., Bass. C., Williamson. M., Puinean. M., Koekemoer. L. L., Coetzee
M. and Field, L. Vector population monitoring tools and development of Anopheles
funestus species identification. Liverpool school of Tropical Medicine, Liverpool, UK. 10
July 2009.
Page 5
iv
ABSTRACT
Morphological similarity between malaria vectors and non-vectors occurring in sympatry
has serious consequences if the killer diseases have to be controlled. Malaria in Malawi is
transmitted by Anopheles gambiae, An. arabiensis and An. funestus. This vector diversity
is further complicated by the recently discovered An. funestus-like species which is
morphologically similar to An. funestus, and found in association with humans. Currently
there is no single assay available that differentiates An. funestus-like from the other African
members in the An. funestus group.
The objective of this study was to investigate the biology and behavior of the newly
discovered An. funestus-like species and its possible role in malaria transmission. This
information will assist in the implementation of vector control programs. In addition to
this, the study investigated the development of a DNA based assay to differentiate between
the members of the An. funestus group and to morphologically described An. funestus-like
species.
Anopheles mosquitoes were collected resting indoors and outdoors from Karonga in
Malawi. Specimens were identified morphologically and molecularly using chain reaction
PCR. Identified samples were analyzed by ELISA for blood meal source and Plasmodium
sporozoite infection. Anopheles funestus-like was morphologically compared with An.
funestus. Real time based PCR was developed and compared to the current multiplex or
allele-specific PCR (AS-PCR) assay for sensitivity and performance. The IGS region of
the rDNA gene was investigated for development of AS-PCR. Phylogenetic relationship of
mosquitoes was constructed from ITS2 and D3 sequences.
Page 6
v
Adult An. funestus mosquitoes (n = 391) were collected during April and September, 2010.
Karonga contributed 63.9% and Likoma Island 36.1%. Of the identified specimens (n =
347) An. funestus-like comprised 10.4%, An. rivulorum 31.7%, An. funestus 57.3% and An.
parensis 0.6%. Most of the An. funestus-like species were collected resting indoors 91.7%
(33/36) compared to outdoors 8.3% (3/36). The species was predominant during the dry
season 63.9% (23/36) compared to the wet season. A total of 19 An. funestus-like females
were analyzed for blood meal source. Mixed blood meal from goat and bovine was found
in 7 specimens and a single blood meal from goat in 3 specimens.. The rest of the An.
funestus-like was negative for blood meal. An overall dry season infection rate of An.
funestus-like species by Plasmodium vivax was 5% (1/20) in this study and 3.1% (2/64)
from samples collected in 2009 was found. However, the possibility of false positivity
could not be excluded and further study is urgently needed to investigate this. Real-time
PCR for the identification of members of the An. funestus group was found to be more
sensitive (0.02ng/µl) than AS-PCR (0.04ng/µl) and had performance comparable to AS-
PCR. AS-PCR developed from the intergenic spacer region of rDNA discriminates An.
funestus, An. rivulorum, An. vaneedeni and An. parensis.
Of all assays developed in this study, the hydrolysis probe assay is the most reliable assay
for identifying members in the An. funestus group. This study confirmed the existence of
An. funestus-like species in sympatry with An. funestus group members. An. funestus-like
was predominantly found resting indoors (endophilic) but preferring animal over human
blood (zoophilic). No consistent morphological characters were found to discriminate
between An. funestus and An. funestus-like based on morphological data, An. funestus-like
is very similar and closely related to An. funestus which is supported by phylogenetic
analysis. However, Restriction Fragment Length Polymorphism separates the two species.
Page 7
vi
ACKNOWLEDGEMENTS
First and foremost I am indebted to my supervisors, professors Maureen Coetzee and
Lizette Koekemoer who perceived the project. I am grateful for your expertise, kindness,
patience and thoughtful guidance throughout my PhD program. You gave me the
confidence to explore my research interest and taught me both consciously and
unconsciously how to become a good researcher. I am also thankful for the excellent
examples you both provided as successful women in science. Professors, without your
financial support and constant supervision, this project wouldn‟t have been a success story.
Dr. Chris Bass was so instrumental making me felt at home in Rothamsted Research,
United Kingdom. He didn‟t only take time to train me with real-time PCR technique but
could come to the lab during his sick leave just to give me more guidance. Doctor, I am
grateful and say thank you.
I want express my gratitude to Professor Richard Hunt for his patience in teaching me the
ecological aspects of medical entomology during our field trip to Karonga in Malawi and
laboratory mosquito rearing skills. The Karonga health department staffs are thanked for
their assistance during our stay in Karonga. The Karonga inhabitants were friendly and
allowed us to collect mosquitoes from their houses without which mosquito collections
would have been unsuccessful.
I need to thank my readers Dr Basil Brooke, Dr Riann Christian, Dr. Givemore Munhenga,
Micheal Osae and Oliver Wood, for their helpful comments and for taking off time from
your busy schedules to make sure this thesis is worth reading. I will like to convey my
gratitude to the following; Dr Gerald Kimbi, Dr. Givemore Munhenga, Dr. Alphonse
Page 8
vii
Neba, Dr. Joel Mouatcho, Dr. Godlove Enongene, Dr. Sylvester Matambo and Ms Hiba
Abdalla for their sharp sense of humour and encouragement which was always
appreciated. The rest of the staff and students of VCRU and Malaria Entomology Research
Unit are thanked for their invaluable support.
This work wouldn‟t have been possible without financial support. Thanks to Professor
Maureen Coetzee for funding from the National Research Foundation/Department of
Science and Technology (NRF/DST) Research Chair Initiative awarded to her. Thanks to
the University Witwatersrand for the Carnegie PhD bursary awarded to me.
At this stage I want to say thanks to my dad Toh Clement Bumuh, my mom Vuke Regina
Bumuh, my sister, brothers, my wife and son and Kedjom family in South Africa. You all
provided me with continuous encouragement and particularly my parents who instilled in
me the philosophy that education is the best tool to survive and that were there is a will
there is a way. These had driven me through from primary school (CBC Nkwen, Bamenda,
Cameroon) to University of Witwatersrand, Johannesburg, South Africa. Lastly, I thank
GOD for giving me a chance in life and making my dream come true.
Page 9
viii
TABLE OF CONTENT
DECLARATION i
DEDICATION ii
PUBLICATIONS AND PRESENTATION iii
ABSTRACT iv
ACKNOWLEDGEMENTS vi
TABLE OF CONTENT viii
LIST OF FIGURES xiv
LIST OF TABLES xvii
ABBREVIATION AND SYMBOLS xix
CHAPTER ONE
General introduction
1.1 Global malaria perspective 22
1.2 Malaria control 23
1.2.1 Malaria vectors control using insecticides 23
1.2.2 Biological control of malaria vectors 25
1.2.3 Other control methods 26
1.3 African malaria vectors 27
1.3.1 The Anopheles gambiae complex 27
1.3.2 The Anopheles funestus group 28
1.4 Systematics of the Anopheles funestus group 28
1.4.1 Anopheles funestus s.s 29
1.4.2 Anopheles rivulorum 31
1.4.3 Anopheles vaneedeni 32
1.4.4 Anopheles parensis 32
1.4.5 Anopheles leesoni 33
1.5 Anopheles funestus-like species 33
1.6 Identification of members of the Anopheles funestus group 34
Page 10
ix
1.6.1 Morphological identification 34
1.6.2. Cytogenetic analysis for species identification 36
1.6.3 Molecular species identification 36
1.7 New techniques for identifying of species complex 37
1.8 Species concepts 37
1.8.1 Biological or reproductive species concept 38
1.8.2 The recognition species concept 38
1.8.3 Phylogenetic species concept 39
1.8.4 Similarity species concepts / Morphological species concept 40
1.9 Research rationale 40
1.10 Aims 41
1.11 Specific objectives 41
CHAPTER TWO
Biological and behavioural characterization of Anopheles funestus group, including
Anopheles funestus-like species from Northern Malawi
2.1 Introduction 42
2.2 Aim and objectives 45
2.3 Materials and methods 45
2.3.1 Study area 45
2.3.2 Mosquito collection 47
2.3.3 Mosquito rearing 47
2.3. 4 Insecticide susceptibility tests 48
2.3.5 Mosquito laboratory processing 49
2.3.5.1 DNA extraction 49
2.3.5.2 Mosquito identification 49
2.3.5.3 Sporozoite infectivity rate detection by ELISA 49
2.3.5.4 Blood meal identification 50
2.3.5.5 Data analysis 51
2.4 Results 52
2.4.1 Mosquito collection 52
Page 11
x
2.4.2 Anopheles funestus group species identification 53
2.4.3 Insecticide susceptibility tests 57
2.4.4 Blood meal source identification 58
2.4.5 Plasmodium sporozoite infectivity rate by ELISA 61
2.4.5.1 Plasmodium vivax quantification 63
2.5 Discussion 64
2.5.1 Collection methods 64
2.5.2 Insecticide susceptibility tests 65
2.5.3 Blood meal analysis 66
2.5.4 Plasmodium sporozoite infection 67
2.6 Conclusion 68
CHAPTER THREE
Morphological description of Anopheles funestus-like from Malawi
3.1 Introduction 69
3.2 Materials and methods 70
3.2.1 Morphological measurements 70
3.2.1.1 Wing length measurement 71
3.2.1.2 Wing morphology and wing spot ratio 71
3.2.1.3 Palpal ratio 71
3.2.1.4 Leg morphology 72
3.2.2 Data analysis 72
3.3 Results 72
3.3.1 Wing length measurements 72
3.3.2 Wing morphology and wing spot ratio 74
3.3.2.1 Wing morphology 74
3.3.2.2 Wing spot ratio 77
3.3.3 Palp measurement and palp ratio determination 80
3.3.4 Scatter plot analysis of wing and palp spot ratio 84
3.3.5 Female leg morphology 85
3.4 Discussion 87
Page 12
xi
3.4.1 Wing length measurements 87
3.4.2 Wing morphology 88
3.4.3 Wing spot and palp ratios 88
3.4.4 Leg morphology 89
3.5 Conclusion 89
CHAPTER FOUR
Development of DNA-based molecular assays for the identification of Anopheles
funestus group members including An. funestus-like species
4.1 Introduction 91
4.1.1 Melt curve analysis 92
4.1.2 High resolution melt analysis 92
4.1.3 TaqMan assay or Hydrolysis probe assay 93
4.2 Structure of ribosomal DNA (rDNA) gene 94
4.3 Aim and objectives 95
4.4 Materials and methods 95
4.4.1 Development of real-time based PCR 97
4.4.1.1 Melt curve analysis 97
4.4.1.2 High resolution melt 98
4.4.1.3 Hydrolysis probe assay 98
4.4.2 Analytical sensitivity of hydrolysis probe and AS-PCR assays 100
4.4.3 Determination of assays performance in blind trial 101
4.4.4 Robustness and validation of hydrolysis probe assay 101
4.4.5 Development of new AS-PCR assay 102
4.4.5.1 Primers design for amplification of rDNA IGS region 102
4.4.5.2 Optimisation of PCR for the amplification of rDNA IGS region 103
4.4.5.3 Cloning, screening and sequencing of IGS PCR products 104
4.4.5.4 Analysis of IGS sequences for species-specific AS-PCR design 107
4.4.5.5 Optimisation of allele specific PCR based on the IGS region of an
rDNA gene
108
4.4.6 Restriction fragment length polymorphism of An. funestus-like and 109
Page 13
xii
An. funestus D3 PCR products
4.4.7 Phylogenetic relationship of Anopheles funestus-like and other
members of the An. funestus group
111
4.5 Results 111
4.5.1 Development of real-time based PCR 112
4.5.1.1 Melt curve analysis 112
4.5.1.2 High resolution melt 114
4.5.1.3 Hydrolysis probe assay 116
4.5.1.4 Analytical sensitivity of real-time assays and AS-PCR 118
4.5.1.5 Blind species identification trial 119
4.5.1.6 Validation of the hydrolysis probe assay 119
4.5.2 Development of allele-specific PCR assay on the rDNA IGS region 120
4.5.2.1 PCR amplification and sequence analysis of Anopheles species
rDNA IGS region
120
4.5.2.2 Multiplex AS-PCR based on rDNA IGS region of the rDNA 124
4.5.3 Amplification and sequencing of ITS2 and D3 regions of rDNA 125
4.5.3.1 Phylogenetic relationship of An. funestus-like with other members of
the An. funestus group based on ITS2 sequences
126
4.5.3.2 Restriction fragment length polymorphism of D3 PCR products 129
4.5.3.3 Phylogenetic relationship of An. funestus-like with other members of
the An. funestus group based on D3 sequences
131
4.6 Discussion 132
4.6.1 Development and optimisation of real-time PCR assays 132
4.6.1.1 Analytical sensitivity of hydrolysis probe and AS-PCR assays 135
4.6.1.2 Blind trial 135
4.6.1.3 Validation of the hydrolysis probe assay 136
4.6.2 AS-PCR development and validation 136
4.6.3 RFLP genotyping of An. funestus and An. funestus-like populations 137
4.6.4 Phylogenetic analysis 139
4.7 Conclusion 139
Page 14
xiii
CHAPTER FIVE
General Discussion and Conclusions
5.1 Discussion 141
5.1.1 Vector composition, distribution and insecticide susceptibility status 142
5.1.2 Feeding and resting behaviours 143
5.1.3 Plasmodium species infection 144
5.1.4 Morphological description of Anopheles funestus-like 144
5.1.5 Novel DNA based assays for Anopheles funestus group
identification
145
5.2 Recommendations for further research 146
5.3 Conclusion 148
APPENDICES
APPENDIX I Preparation of chemicals and solutions 149
APPENDIX II Standard laboratory methods 153
APPENDIX III Cattle kraal collection 162
APPENDIX IV Identified blood meal source 163
APPENDIX V Wing length raw data for An. funestus group 164
APPENDIX VI Ethical clearance waiver 165
APPENDIX VII Published manuscript 167
REFERENCES
169
Page 15
xiv
LIST OF FIGURES
CHAPTER ONE
Figure 1.1 Malaria-free and endemic countries in phases of control,
pre-elimination, elimination and prevention
23
Figure 1.2 Action sites of insecticides used for vector control 25
CHAPTER TWO
Figure 2.1 Map of Malawi showing sample collection sites 46
Figure 2.2 PCR gel showing identification of members of the
Anopheles funestus group
54
Figure 2.3 PCR gel showing amplification of Anopheles funestus group
ITS2 region of rDNA gene
54
Figure 2.4 Comparative analysis of seasonal predominance of
Anopheles funestus-like species
57
Figure 2.5 Mean proportional insecticide susceptibility of
Anopheles funestus Wovwe
58
Figure 2.6 Anopheles funestus-like blood meal identification by ELISA 60
Figure 2.7 Plasmodium vivax ELISA standard curve 63
CHAPTER THREE
Figure 3.1 Diagram showing wing of Anopheles funestus-like species 72
Figure 3.2 Distribution of wing length of Anopheles funestus and An.
funestus-like
73
Figure 3.3 Dorsal view of female An funestus right wing showing distinctive
morphological characters
74
Page 16
xv
Figure 3.4 Dorsal view of female An. frunestus-like right wing showing
merged fringe pale spots
76
Figure 3.5 Dorsal view of female An. funestus-like right wing showing wing
spots
77
Figure 3.6 Comparison of mean wing spot ratio for An. funestus s.s. and An.
funestus-like species
79
Figure 3.7 Scatter plot analysis of mean wing spot ratio for Anopheles
funestus s.s and An. funestus-like species
80
Figure 3.8 Anopheles funestus palps 80
Figure 3.9 Anopheles funestus-like palps 81
Figure 3.10 Comparison of mean palp spot ratio for An. funestus s.s and
An. funestus-like species
83
Figure 3.11 Scatter plot analysis of mean palp ratio for Anopheles funestus s.s
and An. funestus-like species
84
Figure 3.12 Segregation of female Anopheles funestus s.s and An. funestus-like
species by means ratios of wing spot and palp spot
85
Figure 3.13 Female Anopheles funestus tarsomere on fore, mid, and hind
legs with apical pale bands on joints
86
Figure 3.14 Female Anopheles funestus-like tarsomere on fore mid, and
hind legs with whitish spot on joints
86
CHAPTER FOUR
Figure 4.1 Schematic representation of a transcription unit of eukaryotic
rDNA
94
Figure 4.2 Design of hydrolysis probe assay for Anopheles funestus group
identification
19
Figure 4.3 Schematic diagram of partial IGS sequence alignment
with primer position
102
Figure 4.4 Identification of members of the Anopheles funestus group by melt
curve analysis
112
Figure 4.5 Average melting temperatures and standard deviation values for 113
Page 17
xvi
fives species in the An. funestus group
Figure 4.6 Identification of members of the Anopheles funestus group by high
resolution melt curve
115
Figure 4.7 Identification of members of the Anopheles funestus group by
hydrolysis probe assay
117
Figure 4.8 Analytical sensitivity of hydrolysis probe and AS-PCR assays 118
Figure 4.9 Agarose gels showing rDNA IGS generated PCR products
for Anopheles funestus group
121
Figure 4.10 Partial rDNA gene sequence (IGS region and I8S gene) for
Anopheles funestus group
122
Figure 4.11 Alignment of An. funestus group partial IGS sequences 123
Figure 4.12 Agarose gel of multiplex AS-PCR for the identification of
Anopheles funestus group species
125
Figure 4.13 Agarose gel showing An. funestus group ITS2 PCR products 126
Figure 4.14 Phylogenetic tree of the An. funestus group based on nucleotide
sequences of ITS2 rDNA gene
127
Figure 4.15 Anopheles funestus-like ITS2 sequences showing SNP 128
Figure 4.16 Agarose gel showing An. funestus group D3 PCR products 128
Figure 4.17 Agarose gel showing PCR-RFLP patterns for domain 3 (D3)
fragments for Anopheles funestus group species
130
Figure 4.18 Schematic representation of rDNA D3 Hpa II restriction mapping
for Anopheles funestus group
131
Figure 4.19 Phylogenetic tree of the An. funestus group based on nucleotide
sequences of domain 3 (D3) of the 28S unit of rDNA
132
Page 18
xvii
LIST OF TABLES
CHAPTER TWO
Table 2.1 Distribution of Anopheles funestus group collections 53
Table 2.2 Anopheles funestus group species identified from
wet season indoor and outdoor collections
55
Table 2.3 Anopheles funestus group species identified from dry season
indoor collections
56
Table 2.4 Blood source preference for members of the An. funestus group 59
Table 2.5 Detection of Plasmodium species infection by ELISA 62
CHAPTER THREE
Table 3.1 Comparative morphological characters for An. funestus and
An. funestus-like species
75
Table 3.2 Quantitative taxonomic character detailing the ratio between
combined lengths of 8th
and 10th
wing spots and length 9th
wing
spot in adult females of Anopeheles funestus-like and Anopheles
funestus species
78
Table 3.3 Quantitative taxonomic character detailing ratios between
combined lengths of 3rd
and 4th
palpal segment and length of 4th
segment in adult females of Anopeheles funestus-like and
Anopheles funestus species
82
Page 19
xviii
CHAPTER FOUR
Table 4.1 PCR primers and amplified product sizes for diagnostic test for the
Anopheles funestus group
96
Table 4.2 Primers and probes used in the identification of Anopheles
funestus group species by hydrolysis probe assay
100
Table 4.3 Primers used in the amplification of the partial IGS region of the
An. funestus group species
103
Table 4.4 Species specific primers for the identification of members of the
Anopheles funestus group
108
Table 4.5 Performance of four assays in the Anopheles funestus group
species identification blind trial
119
Table 4.6 Detailed results of re-identification of AS-PCR identified
An. funestus group samples by the hydrolysis probe assay
120
Table 4.7 Statistical data obtained after blast search for Anopheles funestus
group partial IGS sequences in the NCBI data base
122
Page 20
xix
ABBREVIATIONS AND SYMBOLS
Amp ampicillin
ATP adenosine triphosphate
ANOVA analysis of variance
AS-PCR allele specific polymerase chain reaction
BSA bovine serum albumin
BLAST basic logic alignment search tool
bp base pair
°C centigrade
CSP circumsporozoite protein
cm centimetre
CDC center for disease control
CV coefficient of variation
CI confidence interval
DDT diethyl diphenyl trichloroethane
ddH2O distilled deionized water
dH2O deionized water
dNTP deoxynucleotide triphosphate
DNA deoxyribonucleic acid
dsDNA double stranded deoxyribonucleic acid
rDNA ribosomal deoxyribonucleic acid
DNase deoxyribonuclease
E. coli Esherichia coli
EDTA ethylenediamine tetraacetate
ELISA enzyme limked immunosorbent assay
EST external transcribe spacer
et al and others
FANG Anopheles funestus from Angola
F1 first filial generation
Page 21
xx
hr hour
HBI human blood index
IPTG isopropyl-β-D-thiogalactopyranoside
IGS intergenic spacer
IRS indoor residual spraying
ITN insecticide treated net
ITS internal transcribe spacer
IUPAC international union of pure and applied chemistry
Ig G immunoglobulin G
kdr knockdown resistance
kb kilo bas
LB luria-broth
mA milliampere
µM micro molar concentration
µl microlitre
min minutes
mg milligram
ml millilitre
mm millimetre
mM millimolar
NaCl sodium chloride
NaOH sodium hydroxide
nm nanometer
ng nanogram
nM nanomole
NICD national institude for communicable diseases
NHLS national health laboratory service
NCBI national centre for biotechnology information
NTS non-transcribe spacer
OD optical density
% percentage
PBS phosphate buffered saline
PCR polymerase chain reaction
Page 22
xxi
p probability level
pf Plasmodium falciparum
pH potential of hydrogen
pg picogram
rpm revolution per minute
rRNA ribosomal ribonucleic acid
RFLP Restriction fragment length polymorphism
SDS sodium-dodecyl-sulfate
s seconds
S svedberg sedimentation unit
s.l sensu lato
s.s sensu stricto
SNP single nucleotide polymorphism
SD standard deviation
Taq Thermus aquaticus
Tris tris (hydroxymethyl) aminomethane
TW tween
USA United State of America
V volt
VCRU vector control reference unit
WHO World Health Organisation
Page 23
22
CHAPTER ONE
General Introduction
1.1 Global malaria perspective
Malaria is a life-threatening infectious disease in many tropical and subtropical areas and is
endemic in over 106 countries according to the World Health Organization (WHO, 2010)
(Figure 1.1). Globally, malaria accounts for 245 million clinical cases and 781,000 deaths
per year (WHO, 2010), 90% of these occurring in Africa. Children under the ages of five
and pregnant women are the most vulnerable risk group (WHO, 2005). Africa is most
affected by malaria and this can be attributed to numerous factors. Some of these include
civil unrest which interrupts control programs, resistance of malaria parasites to anti-
malaria drugs (WHO, 2004), resistance of mosquito vectors to chemical insecticides
(Hargreaves et al. 2000), vector abundance due to climate change (Mouchet et al. 1998),
migration of people and water management projects including dams for electricity,
agriculture and irrigation (Service, 1984).
Charles Laveran demonstrated that malaria is caused by a protozoan parasite belonging to
the phylum Apicomplexa and genus Plasmodium (Garnham, 1966). Five species of
plasmodia (P. falciparum, P. vivax, P. malariae, P. ovale and P. knowlesi) causes malaria
in human. Of these, P. falciparum causes the most severe infections and the highest
mortality in Africa (WHO, 2005). Plasmodium knowlesi has recently been found to infect
both humans and monkeys in Malaysia (Cox-singh et al., 2007). Certain anopheline
mosquitoes play an important role in vectoring malaria to humans and animals. One of the
Page 24
23
three principal African vectors of human malaria is Anopheles funestus (Gillies and De
Meillon, 1968). The other two are members the An. gambiae species complex, namely An.
arabiensis and An. gambiae sensu stricto. In addition to these, at least seven other minor
vectors are also involved in malaria transmission (Gillies and De Meillon, 1968).
Figure 1.1 Malaria-free countries and Malaria endemic countries in phases of control*,
pre-elimination, elimination and prevention (WHO 2008).
1.2 Malaria control
Early diagnosis and treatment of patients as well as controlling malaria vectors constitute
key measures in mitigation of the diseases and reducing both illness and death as well as
the socio-economic burden caused by malaria.
1.2.1 Malaria vector control using insecticides
According to the WHO, malaria vector control forms an important part of the global
malaria strategy and remains the most effective approach for the prevention of malaria
transmission (WHO, 2006). Chemical controls are most often used for vector control and
Page 25
24
include approximately 12 insecticides from four classes (organochlorines,
organophosphates, carbamates and pyrethroids) (WHO, 2001). The major insecticide based
strategies are indoor residual spraying (IRS) of dwellings and associated structures,
insecticide treated nets (ITNs) and larviciding. IRS has successfully reduced malaria cases
in many areas in Africa such as the recent control campaign on Bioko Island, Equatorial
Guinea (Kleinschmidt et al., 2006), and the decades long campaign in South Africa
(Hargreaves et al., 2000). Insecticide treated nets (ITNs) repel or kill mosquitoes (Lines,
1996). Categories of ITN include conventionally treated nets, (treated by dipping the net in
WHO recommended insecticides) and Long Lasting Insecticide Nets (LLINs) made in
factories using specially formulated netting with insecticide embedded within the fibres.
Only pyrethroids are recommended for treating nets (Zaim et al., 2000). Unfortunately,
wide spread resistance to pyrethroids threatens IRS and ITN applications (N‟Guessan et
al., 2007).
All of the recommended insecticides used for vector control target the central nervous
system of insects (Nauen, 2006). However, each insecticide class targets a different site as
demonstrated in Figure 1.2. Insecticides belonging to the organophosphate and carbamate
classes principally target the enzyme acetylcholinesterase (AChE), preventing normal
hydrolysis of the neurotransmitter acetylcholine in synaptic clefts (Hemingway et al.,
2004). Pyrethroids target the voltage gated sodium channel and disrupt the regulation of
sodium ion flux across neuron membranes (Brengues et al., 2003). DDT acts on the same
target site as pyrethroids (Brengues et al., 2003). The mode of action of DDT has not been
clearly established but it also disrupts the balance of sodium and potassium ions within the
nerve axon, such that normal nerve impulses are prevented (Whiteacre and Ware, 2004).
Page 26
25
Figure 1.2 Action sites of insecticides used for vector control. (Nauen, 2006)
1.2.2 Biological control of malaria vectors
Biological control encompasses the introduction of mosquito larval and pupal predators
(e.g. mosquito fish Gambusia affinis (Rose, 2001)), or entomopathogenic organisms such
as Bacillus thurigiensis var israelensis serotype H-14 (Bti) (Service, 1983) and
Metarhizium anisopliae and Beauveria bassiana (Chapman, 1974; Roberts and Hajek,
1992) into the breeding sites. Biological control is generally species specific and is more
environmentally friendly than chemical insecticide use (Mulla et al., 2003). It has been
used in African countries such as Burkina Faso (Skovmand and Sanogo, 1999) and the
Gambia (Majambere et al., 2006). Biological control methods, however, suffer from
difficulties associated with the colonization and management of the predators as well as
cost incurred with the frequent application of entomopathogenic organisms such as Bti.
Page 27
26
1.2.3 Other control methods
Genetic control of mosquitoes has garnered tremendous interest in the past two decades.
This has been triggered by the development of resistance to insecticides, environmental
concerns as well as the development of new technologies. One application of genetic
engineering is the transformation of a Plasmodium susceptible strain of mosquito, to one
refractory to Plasmodium infection (Beerntsen et al., 2000; Ito et al., 2002). This idea was
first employed when Aedes aegypti was genetically engineered to be refractory to dengue
virus. This was achieved using the Sindbis virus to express an antisense RNA molecule,
complimentary to a segment of the dengue virus genome (Olsson et al., 1996). However,
the observed expression was only transient and not heritable and the desired refractoriness
could not be driven into the wild population. Transformation was accomplished by using
transposable elements such as Minos and Mariner isolated from Drosophila hydei and D.
mauritiana respectively (Franz et al., 1991; Madhora et al., 1991). Refractory genes can
also be driven into the wild populations by using symbionts. This approach has been
achieved by incorporating anti pathogen genes into the genome or plasmids of symbionts
e.g. bacteria (Durvasula et al., 1997).
Currently, malaria vector control using the sterile insect technique (SIT) (Pates and Curtis,
2005) is being investigated. In this technique laboratory reared male mosquitoes,
conspecific and compatible with the target population, are sterilised with gamma-
irradiation or chemosterilants, e.g. cobalt-60 (Coleman and Alphey, 2004; Davidson, 1969)
and are then mass-released into the wild (Hassan et al., 2010; Helinski et al., 2008 ). There
they hopefully mate with wild females causing them to lay sterile eggs, eventually
suppressing the target population. However, this technique has not been used to effectively
control malaria to date (Hassan et al., 2010).
Page 28
27
Other control methods include source reduction which aims at eliminating mosquito vector
breeding sites. The disadvantage of source reduction is that the breeding sites of some
vector species are usually small, dispersed and transient, making complete coverage almost
impossible (Pates and Curtis, 2005).
1.3 African malaria vectors
Sir Ronald Ross, a British scientist working in India, found out that some species of
mosquitoes act as intermediate hosts for both human and bird malaria parasites (Garnham,
1966; Harrison, 1978). Further research revealed that the malaria parasite is transmitted
from human to human by various species of Anopheles mosquitoes which mainly feed
between sunset and sunrise (Gillies and De Meillon, 1968; WHO, 2005). In sub-Saharan
Africa, the major vectors are members of the Anopheles gambiae species complex and the
An. funestus species group.
1.3.1 The Anopheles gambiae complex
This complex consists of seven recognized sibling species which are morphologically
identical: An. gambiae Giles, An. arabiensis Patton, An. quadriannulatus Theobald species
A and B, An. merus Dönitz, An. melas Theobald and An. bwambae White (Gillies and
Coetzee 1987; Hunt et al., 1998). Anopheles gambiae s.s and An. arabiensis are the most
efficient vectors in the complex. Their efficiency is partly a result of their preference for
human blood meals and their ability to quickly adapt to environmental changes initiated by
human habitation and agriculture (Collins and Paskewitz, 1995). Anopheles merus, An.
melas and An. bwambae tend to be localised vectors. Anopheles merus and An. melas in
particular are not always implicated in malaria transmission where they occur. Both
species of An. quadriannulatus are non-vectors.
Page 29
28
1.3.2 The Anopheles funestus group
This group traditionally consisted of nine morphologically similar species (An. funestus s.s
Giles, An. rivulorum Leeson, An. leesoni Evans, An. vaneedeni Gillies and Coetzee, An.
parensis Gillies, An. confusus Evans and Leeson, An. aruni Sobti, An. fuscivenosus Leeson
and An. brucei Service) with some members distinguishable only at the early
developmental stages (Gillies and De Meillon, 1968; Gillies and Coetzee, 1987). Cohuet et
al. (2003) described a taxon based on biological, morphological and genetic characteristics
which are related to An. rivulorum and provisionally named it An. rivlorum-like. This
species is a non-vector and has been recorded in Cameroon and Burkina Faso. Spillings et
al. (2009) discovered yet another species in Malawi which is morphologically similar to
An. funestus and named it An. funestus-like. A detailed taxonomic description of each new
species and their phylogenetic relationship within the An. funestus group will be important
in terms of understanding their biology and could have implications for the design of
vector control strategies. The most efficient vector in the An. funestus group is An. funestus
s.s. (Gillies and De Meillon, 1968; Gillies and Coetzee, 1987).
1.4 Systematics of the Anopheles funestus group
Classification of this group was re-evaluated using morphological, chromosomal and
molecular data by Harbach (2004) due to similarities with the South-east Asian An.
minimus group. This resulted in a composite group referred to as the An. funestus group.
According to this classification the An. funestus group consists of five subgroups (An.
funestus and An. rivulorum from sub-Saharan Africa, An. minimus (including one African
species), An. aconitus and An. culicifacies) all from Southeast Asia. The An. funestus
subgroup consists of five species (An. aruni, An. confusus, An. funestus, An. parensis and
An. vaneedeni). The An. minimus subgroup consists of An. flavirostris, An. leesoni
Page 30
29
(African), An. fluviatilis complex and the An. minimus complex. The An. aconitus
subgroup consists of An. aconitus, An. filipinae, An. mangyanus, An. pampanai and An.
varuna. The An. culicifacies subgroup consists of the culicifacies complex, and lastly the
An. rivulorum subgroup consists of An. brucei, An. fuscivenosus, An. rivulorum and An.
rivulorum-like species (Harbach, 2004). Only the common species found in sub-Saharan
Africa will be briefly discussed below.
The development of cyptic species complexes amongst anopheline taxa has added a level
complexity to the understanding of malaria transmission patterns and the design of
effective vector control strategies. Despite years of research, the systematics of
anophelines has not being fully elucidated (Spillings et al., 2009). Whereas the population
genetics and systematics of the An. gambiae complex has received considerable attention,
the An. funestus group has received less attention in this regard despite its epidemiological
importance. This is primarily attributable to the technical difficulties associated with
identifying member species within the group, the general assumption that indoor resting
An. funestus sensu lato are inevitably An. funestus sensu stricto without the need for deeper
investigation, and technical difficulties with laboratory colonization of An. funestus group
members. Cytogenetic analyses and the later development of molecular systematics have
provided important insights into the species diversity of these mosquitoes.
1.4.1 Anopheles funestus s.s.
Anopheles funestus s.s., henceforth referred to as An. funestus, is one of the most efficient
human malaria vectors. It transmits P. falciparum with infection rates usually in the range
of 2-5% (Gillies and De Meillon, 1968). However, higher infection rates in An. funestus
have been recorded i.e. 11% (Temu et al. 2007); 22% (Gillies and De Meillon 1968); 5.4%
Page 31
30
(Hargreaves et al., 2000). A P. falciparum infection rate of 4.9% was recorded by in An.
funestus collected on Likoma Island, Malawi (Hunt et al. 2010). Anopheles funestus also
plays a role in transmitting pathogens such as bancroftian filariasis and O‟nyong-nyong
fever (Gillies and De Meillon, 1968).
Amongst the members of this group, An. funestus has the widest geographic distribution in
sub-Saharan Africa (Gillies and De Meillon 1968). Anopheles funestus prefers to breed in
bodies of clear water that are large and more or less permanent, containing vegetation in
the form of short grasses with little shading of the water surface. Rice growing areas have
been associated with An. funestus. Unusual breeding sites include wells, domestic water
containers and deeply sunken limestone streams all devoid of vegetation (Gillies and De
Meillon, 1968). Anopheles funestus larvae can stay submerged under water for long
periods (Gillies and De Meillon 1968).
Anopheles funestus adult females are highly anthropophilic (human feeding) and prefer to
blood-feed indoors (Gillies and De Meillon 1968). They mainly feed during the second
half of the night until early morning but will also feed during the day inside dark houses
(Gillies and De Meillon, 1968). After feeding they rest indoors rendering them especially
susceptible to control by IRS (Gillies and De Meillon, 1968). Little information is
available on the swarming activities of male An. funestus. However, Charlword et al.
(2003) observed swarms of male An. funestus within sandy clearings surrounding houses in
Mozambique.
Cytogenetic investigations have revealed a series of chromosomal inversion
polymorphisms in An. funestus s.s. populations in West, Central, South and East Africa.
Page 32
31
Based on the assortment, chromosomal linkages and relative frequencies of each
alternative inversion arrangement, five chromosomal forms of An. funestus s.s. have been
described in West Africa. In Burkina Faso, the Kiribina and Folonzo chromosomal forms
were described (Costantini et al., 1999). Three forms were identified in Senegal namely,
Skouvar, Wassadou and Dielmo (Lochouarn et al., 1998). The inversion polymorphism
arrangements in East and Southern African populations are similar to the Folonzo form.
However, mitochondrial polymorphisms using microsatellite DNA markers show three
distinct clusters of An. funestus in Southern Africa (Michel et al. 2005a,b). These clades
can be extrapolated to populations east of the Great Rift Valley (Tanzania, Malawi,
Mozambique and Madagascar), populations west of the Rift Valley (Nigeria, Mali, Burkina
Faso and Kenya) and populations in central Africa (Gabon and coastal Angola). Garros et
al. (2004) showed, by means of restriction fragment length polymorphism (RFLP),
intragenomic variation within An. funestus populations from sub-Saharan Africa. PCR
amplified D3 fragments of rDNA digested with the enzyme Msp I gave either an M, W or
MW type designation to each sample tested. Further genotyping by Koekemoer et al.
(2006) using RFLP showed that An. funestus specimens from the west and east sides of the
Rift Valley could be classified as either W-type or M-type respectively with the MW type
associating with the west side. Two additional types were also recorded: the Y-type from
Malawi and the Z-type from Angola, Ghana Malawi, and Zambia.
1.4.2 Anopheles rivulorum
Anopheles rivulorum is the second most widespread member in the group and is found
mainly in eastern and southern Africa. Its distribution ranges from Botswana to Ethiopia,
Mozambique, South Africa and Zimbabwe (Gillies and De Meillon, 1968; Gillies and
Coetzee, 1987). Localised occurrences in West Africa include Côte d‟Ivoire Mali, and
Page 33
32
northern Nigeria (Gillies and De Meillon, 1968). They feed mainly on animals (zoophilic)
although they will bite humans outdoors in the absence of animals. After feeding An.
rivulorum rest outdoors (exophilic) (Gillies and De Meillon, 1968). They have only once
been implicated in malaria transmission in Tanzania where they were found infected with
Plasmodium sporozoites (Wilkes et al., 1996).
1.4.3 Anopheles vaneedeni
Anopheles vaneedeni is known only from South Africa (Gillies and Coetzee, 1987). This
species was shown to be able to transmit P. falciparum in the laboratory when females
experimentally infected were found to be positive for oocysts in the stomach walls as well
as sporozoites in the salivary glands (De Meillon et al., 1977). No record is available for
Plasmodium infection of this species in nature. They are found breeding in habitats similar
to those of An. funestus. Female mosquitoes of this species bite humans outside houses in
the early hours of the night but they predominantly feed on cattle (Gillies and Coetzee,
1987). They rest in pit-shelters along with other species such as An. leesoni (De Meillon et
al., 1977).
1.4.4 Anopheles parensis
Anopheles parensis is mainly distributed in Eastern Africa from Kenya and Tanzania,
south to Swaziland and northern KwaZulu-Natal, South Africa. The larvae are found
breeding in permanent swamps and ponds among reeds and emerging vegetation. Unlike
its sibling species, it is scarce or absent in streams and moving water (Gillies and De
Meillon, 1968). Anopheles parensis has previously been collected resting indoors in Kenya
but was not infected with human malaria parasites (Gillies and Furlong, 1964). Kamau et
al. (2003) also collected them resting indoors and a small proportion (1.44%) was found to
Page 34
33
have taken human blood meals. This may imply that An. parensis has the potential to be a
minor vector even though there is no record of it been infected with P. falciparum (Gillies
and De Meillon, 1968).
1.4.5 Anopheles leesoni
Anopheles leesoni has been recorded from savanna regions of Eastern and Western Africa.
Its distribution ranges from Ethiopia, Kenya and Uganda to Mozambique and South Africa.
In West Africa, they have been found in Mali, Ivory Coast and northern Nigeria (Gillies
and De Meillon, 1968). Their larval habitat is similar to that of An. funestus but are usually
found at the edges of slow flowing streams (Gillies and De Meillon, 1968). The adults are
frequently collected in natural resting sites and are sometimes found inside houses. They
are presumed to be zoophilic and are not implicated in malaria transmission.
1.5 Anopheles funestus-like
The newly discovered An. funestus-like species from Malawi was found resting indoors
and has not to date been implicated in malaria transmission. By analysing molecular,
cytogentic and cross-mating data, Spillings et al. (2009) proved that An. funestus-like is a
distinct species. Its chromosomal banding patterns show a homosequential banding
arrangement with An. funestus but, interestingly, are fixed for the inverted arrangements of
the paracentric chromosomal inversions 3a, 3b, and 5a which are commonly polymorphic
in An. funestus. Hybrid progeny produced from crosses between An. funestus and An.
funestus-like showed consistent asynapsis between homologous chromosomes together
with mutation at the An. funestus primer binding site (3 base pair deletion and a T to C
transition) are both suggesting a genetic discontinuity between the parents (Spillings et al.,
2009). To date, very little information is known about the biology of this new species.
Page 35
34
1.6 Identification of members of the Anopheles funestus group
The members of this group are morphologically similar as adults but many can be
identified using characters from the aquatic stages. Cytogenetic methods have historically
been employed, but molecular methods are now commonly used.
1.6.1 Morphological identification
Morphological identification of members of the An. funestus group depends on analysis at
different life stages according to the taxonomic keys in Gillies and De Meillon (1968) and
Gillies and Coetzee (1987). It involves collecting wild adult females and inducing them to
lay eggs which are reared through to adults. This method is time consuming because the
early life stages of the life cycle can take 4-6 weeks for complete development. Rearing
larvae to adults is extremely difficult and if larvae die early, accurate identification is not
possible. The following summary of the morphological differences between members of
the An. funestus group is adapted from Gillies and De Meillon (1968) and Gillies and
Coetzee (1987).
A) Adults:
Male An. parensis differ from An. funestus in that it has small pale scales at the base of its
club in 90% of specimens. The presence of small patches of pale scale found at the apex of
the sixth vein of the females makes it different from the other members of the An. funestus
group except An. brucei. Anopheles vaneedeni tends to have very narrow pale bands at the
joints of the tarsomeres.
Page 36
35
B) Eggs:
Anopheles rivulorum eggs have a chorion with smaller size bosses than An. funestus.
Anopheles leesoni differs from the rest of the An. funestus group members in that the egg
chorion is unornamented with small and uniform size bosses. An. leesoni eggs have a frill
which occupies the full length of the egg. Anopheles confusus differs from An. funestus by
the presence of smaller sized bosses on the chorion. The eggs of An. aruni, An. parensis,
An. funestus and An. vanedeeni are morphologically indistinguishable while those of An.
brucei and An. fuscivenosus are undescribed.
C) Larvae:
Anopheles leesoni larvae differ from those of the rest of the An. funestus group by the
presence of paired metathoracic plates. The abdominal plate is similar to that of An.
confusus. Larvae of Anopheles aruni, An. parensis and An. vanedeeni are morphologically
indistinguishable. Anopheles rivulorum larvae differ from An. funestus in that: they have
sutural hairs which are branched from the base; the main abdominal plates are shallow and
are three to four and a half times deep as wide; the accessory plates range in number from
1-3; sternites are without belts of spicules.
D) Pupae:
The pupae of An. parensis and An. vaneedeni are indistinguishable from those of An.
funestus. Anopheles rivulorum pupae differ from those of the other members in that their
pupal paddle fringe is not extended along the posterior border.
Page 37
36
1.6.2 Cytogenetic analysis for species identification
Cytogenetic analysis as a method of species identification can be made by examination of
the giant polytene chromosomes found in the ovarian nurse cells of half-gravid adult
females (Coluzzi and Sabatini, 1967; Hunt, 1973). This method is based on the
identification of species specific chromosomal banding sequences. These differences arise
as a consequence of the divergent evolution of fixed chromosomal rearrangements
resulting from chromosomal inversions and translocations.
Green and Hunt (1980) and Green (1982) published polytene chromosome maps detailing
fixed inversion differences evident in the chromosomal banding patterns that allowed for
the species identification of some members of the An. funestus group. Two fixed inversions
on the X chromosome differentiate An. parensis from An. funestus but the banding patterns
of An. vaneedeni and An. funestus are homosequential (Green and Hunt, 1980). The
chromosomes of An. parensis differ from those of An. funestus and An. vaneedeni by a
single fixed polymorphic inversion on arm 3 (Green and Hunt, 1980). The chromosomal
map for An. leesoni is genetically distinct from that of An. rivulorum, An. confusus and An.
fuscivenosus and is closely related to the oriental An. minimus group (Green, 1982;
reviewed in Coetzee and Fontenille, 2004). Some disadvantages of this technique are that
only half gravid adult females can be used, a high level of expertise is required for
chromosomal banding pattern interpretation and the technique is labour intensive.
1.6.3 Molecular species identification
The DNA based Polymerase Chain Reaction-Restriction Fragment Length Polymorphism
(PCR-RFLP) method was first used by Koekemoer et al. (1998) to distinguish An. funestus
from An. vaneedeni. A year later PCR-single strand conformation polymorphism (PCR-
Page 38
37
SSCP) was used to distinguish An. funestus, An. rivulorum, An. leesoni and An. vaneedeni
but unfortunately did not distinguish between An. vaneedeni and An. parensis (Koekemoer
et al., 1999).
A multiplex-PCR assay is currently used to identify five members of the An. funestus
group: An. funestus, An. rivulorum, An. leesoni, An. vaneedeni and An. parensis
(Koekemoer et al., 2002). Briefly, this assay employs a universal forward primer and
species-specific reverse primers designed from the internal transcribed spacer region 2
(ITS2) of ribosomal DNA (rDNA). The PCR products produced are species-specific when
visualized on ethidium bromide stained agarose gels. Using this technique requires
electrophoresis of PCR products which is time consuming and involves using carcinogenic
ethidium bromide. This method, however, is relatively inexpensive.
1.7 New techniques for the identification of species-complexes
Real time PCR assays such as the TaqMan assay, henceforth referred to as the hydrolysis
probe assay, high resolution melts and melt curves are currently being used for identifying
species or for detecting particular mutations. Details on the molecular chemistry of each of
these techniques will be discussed briefly in Chapter 4.
1.8 Speciation concepts
The widely used hierarchical systematic scheme for classifying living organisms by
Carolus Linneaus was necessitated by an expansive biodiversity and a belief that the
scheme was immutable (Claridge et al., 1997). Although the scheme was seen to work well
for plants and animals, Linneaus did not explicitly define what constitutes a species. A
Page 39
38
number of different species concepts exist and continue to grow. The most widely used
species concepts are discussed below.
1.8.1 Biological or reproductive species concept
Early work of Dobzhansky (1935) and Mayr (1942) made them well known researchers in
the field of biological species concepts, emphasizing reproductive isolation. A species here
is a group of interbreeding natural populations that are reproductively isolated from other
groups (Mayr, 1996). The populations have acquired genetic changes, or „‟isolating
mechanisms‟‟ that prevent them from breeding and producing fertile offspring. The
isolating mechanisms can be morphological, genetic or behavioral features and are
categorized as either premating (prezygotic i.e. geographical, habitat, behaviour, temporal,
mechanical and gametic isolations) or postmating (postzygotic i.e. reduced hybrid
viability, reduced hybrid fertility and hybrid breakdown). This concept faced various forms
of criticism because of its severe limitations. It lacks universality as it is not applicable to
asexual organisms (Wheeler and Platnick, 2000) and to populations of organisms living in
allopatry (Mallet, 1995). However, this concept has some clear advantages. The status of a
species has very little to do with the observable differences that exist between populations.
It also presents biological and genetic meaning.
1.8.2 The recognition species concept
This concept was introduced well after the widely accepted biological species concept
(BSC). It was prompted by the difficulties in reconciling characteristics of mosquito
species evolution within the constraints of the BSC (Paterson, 1985). By this concept,
species are populations of individual biparental organisms which share a common
fertilization system. This model is based on the specific mate recognition system (SMRS)
Page 40
39
which are invariant suites of traits for efficient finding and recognition of mates (Paterson,
1993). A new species arises when a fertilization system adapts to a new habitat so as to
make sure effective fertilization is possible. SMRS ensures mating as well as preventing
hybridization with other species. The biological species concept was misleading according
to Paterson. He claimed firstly, that the term isolating mechanism used by
Dobzhansky/Mayr indicated that reproductive isolation was adaptive which is unlikely.
Secondly, that prezygotic compatibility, comprised of mating and fertilization signals, is
the reality underlying species. The advantages of the recognition species concepts include
the fact that SMRS is more easily observed than interbreeding in nature. Also, it deals with
what happens after speciation.
1.8.3 Phylogenetic species concept
Revolutionary developments in molecular biology techniques such as DNA sequencing
allowed for a novel definition of species. Classification is based on sequence
characterization. Various phylogenetic species concepts exist, some of which include those
of Simpson and Cracraft. According to Simpson (1951), a species is defined as a lineage
evolving separately from other lineages with its own unilateral evolutionary role and
tendency. Cracraft (1983) defined a species by this concept as the smallest diagnosable
cluster of individual organisms within which there is a pattern of ancestry and descent. The
advantage of this concept is that it is applicable to both sexually and asexually reproducing
organisms. The short-comings faced by this concept are: the characters to be used, the level
of divergence that will constitute a species and the fact that the concept does not address
the mechanism of speciation.
Page 41
40
1.8.4 Similarity species concept / Morphological species concept
This concept defined species based on overall similarity in anatomical characteristics as the
determining factor in discriminating species. In brief, species constitute a group of
individual organisms that are morphologically similar and are distinguishable from
individuals of another group (Claridge et al., 1997) as cited by (Rossello-Mora and
Amann, 2001). By this model, morphology is an expression of genetics. The advantage of
this concept is that morphological characters can be observed readily without handling or
harming the organism. The pitfalls of this concept are i) it relies on expert interpretation
and cannot explain the existence of sympatric species which are morphologically similar
and occur in the same habitat but are reproductively isolated, ii) it fails to address sexual
dimorphism and iii) cannot account for genetic polymorphisms not expressed as distinct
morphology. The concept is therefore prone to misidentification.
1.9 Research rationale
Socio-economic development in many African countries is hampered by the burden of
malaria. The effective control of malaria vectors requires accurate information in terms of
species vector incrimination and the management of insecticide resistance where it occurs
in malaria transmitting populations. Because the major African malaria vector species are
members of either the An. gambiae complex or the An. funestus group which include non-
vector species, accurate species identification is necessary for vector incrimination and for
the assignment to species of insecticide resistance phenotypes where detected. Species
identification relies on the application of appropriate species concepts and the development
of methodologies that allow for unambiguous species identification of unknown samples or
populations.
Page 42
41
The malaria vector and non-vector members of the An. funestus group are morphologically
similar to each other. Currently, there is no single molecular assay that can be used to
distinguish between the An. funestus group members including An. funestus-like in a single
reaction. The assay of Koekemoer et al. (2002) failed to identify the new An. funestus-like
species because of the presence, in An. funestus-like, of a three base pair deletion and a T
to C transition in the An. funestus specific primer site (Spillings et al., 2009). As a result,
the An. funestus specific primers cannot anneal to An. funestus-like DNA during
amplification.
1.10 Aims
The aim of this project was to develop a molecular assay that can be used to identify all
members of the An. funestus group, including An. funestus-like, in one reaction as well as
to provide additional information on the malaria vector status and general biology of An.
funestus-like.
1.11 Specific objectives:
i) To develop, test and evaluate new assays for species identification of members of the
An. funestus group (from field and insectary samples) including the new An. funestus-
like species from Malawi.
ii) Determine the malaria vector status, host preference, biting and resting behaviour of
An. funestus-like.
iii) Investigate the phylogenetic relationship between the An. funestus group and An.
funestus-like.
iv) To morphologically describe An. funestus-like.
Page 43
42
CHAPTER TWO
Biological and behavioural characterization of the Anopheles funestus
group, including Anopheles funestus-like, from northern Malawi
2.1 Introduction
Malawi (94,079 sq km) is a landlocked country in southeast Africa bordering on
Mozambique, Tanzania and Zambia. The eastern border is mostly occupied by Lake
Malawi and the country has a north-south rift valley which is flanked by mountains and
plateaus. The climate is sub-tropical with two distinct seasons: the rainy season from
November to May and a dry season from May to November
(www.infoplease.com/ipa/A0107747.html accessed 20 March 2011).
Like many other African countries, malaria remains the leading cause of mortality and
morbidity in Malawi where it is endemic. The Presidents Malaria Initiative: Malaria
Operational Plan-Malawi 2010 and 2011 best describe the impact and transmission of
malaria in Malawi. Below is a summary from this source. Of a population of 13.1 million,
97% are at risk of exposure to malaria. An estimated six million malaria cases were
reported in Malawi in 2006, accounting for 33% of outpatients. The major causative agent
is Plasmodium falciparum which accounts for approximately 98% of malaria infections
with the remaining 2% caused by P. malariae and P. ovale.
The main vectors of malaria in Malawi are Anopheles gambiae s.s, An. funestus s.s and An.
arabiensis. Although malaria is endemic and perennial in this country, higher transmission
Page 44
43
occurs along the shores of Lake Malawi and the lowlands of the Shire Valley. The peak
period for transmission follows immediately after the rainy season from October to April.
In terms of economic loss to the country, the disease accounts for a huge workforce deficit
of about 15-25 days per year. Also, 28% of annual income is spent on treating the disease.
Malaria prevention and treatment in Malawi includes case management and vector control.
Management of the disease depends on early diagnose and treatment. Malaria is diagnosed
by either microscopic or rapid diagnostic tests. As part of the global initiative to eradicate
malaria, chloroquine was widely used as the front-line therapy for P. falciparum in sub-
Saharan Africa. It was recommended for treating uncomplicated malaria in children below
five years in Malawi due to its availability, low cost and efficacy. Unfortunately its usage
was hampered by the development of resistance in P. falciparum. This resulted in a switch
in treatment in 2006. Artemisinin-based combined therapies (ACT) are currently the
recommended front-line treatment for uncomplicated malaria caused by P. falciparum.
Intermittent preventive treatment for pregnant women consists of the administration of
sulfadoxine-pyrimethamine (SP) which reduces anaemia in the mother and the unborn
child as well as the incidence of consequent low birth weight.
Malaria vectors are controlled mainly by indoor residual spraying and the use of
insecticide treated nets (Presidents‟ Malaria Initiative Operational Plan-Malawi 2010). In
Malawi, the National Malaria Control Programme (NMCP) recommended the pyrethroid
ICON-CS (Lambda-Cyhalothrin capsule suspension) for indoor residual spraying (IRS).
Currently, selected pilot areas including the Nkhotakota district are part of a feasibility
study to ascertain the operational, logistical and human resources requirements for malaria
vector control. Sixty percent of households in Malawi own one or more insecticide treated
Page 45
44
nets (ITNs), particularly long lasting insecticide nets (LLINs), and 55% of children under
the age of five as well as 49% of pregnant women utilize these nets which are distributed
for free. Pyrethroid resistance in An. funestus and An. arabiensis has recently been reported
from Malawi (Rehman et al. 2011).
Study rationale
Despite important advances in the use of chemotherapy to target malaria parasites,
knowledge of the behaviour and ecology of malaria vectors in Malawi is lacking. During
2007, the Vector Control Reference Unit (VCRU/NICD), Johannesburg, South Africa,
conducted a malaria survey on behalf of the Malawian Department of Health, to determine
the insecticide susceptibility status of malaria vectors in Karonga. Indoor resting
mosquitoes were collected and a proportion of these were morphologically identified as
members of the An. funestus group. They were preserved for further laboratory processing
at the VCRU. However, the routine molecular species identification assay of Koekemoer et
al. (2002) failed to identify many of these specimens to species level. It was subsequently
established that the bulk of the unidentified An. funestus group specimens represented a
thus far undescribed species within this group provisionally named An. funestus-like
(Spillings et al. 2009). Fifty four An. funestus-like specimens (collected during the dry
season) were tested for P. falciparum infection using an Enzyme Link Immunosorbent
Assay (ELISA) (Wirtz et al., 1998). None showed positive and their blood meal sources
were not determined (Spillings et al. 2009). Anopheles funestus-like thus currently carries
the status of a relatively rare non-vector species.
Page 46
45
2.2 Aim and objectives
The aim of this chapter was to further investigate the role, if any, of An. funestus-like in
malaria transmission in Karonga, Malawi. Specific objectives were:
2.2.1 To establish the host preference of An. funestus-like
2.2.2 To determine its vectorial capacity for other Plasmodium species
2.2.3 To determine its resting behaviour
2.3 Materials and Methods
2.3.1 Study area
The field component of this study was carried out in Karonga - a town in northern Malawi
- and Likoma Island on Lake Malawi. There are distinct wet and dry seasons at these
localities. Karonga has a mean annual rainfall of 1025mm (Kwapata et al., 2007). Six sites
in five villages were selected for specimen collection based on availability of breeding
sites. The villages in the North of Karonga include Mwenetete (two sites (9°48.257S;
53°52.161E and 9°47.635S; 33°52.342E)), Mwakabighili (9°49.65S; 33°52.33E),
Kwambwe (9°54.032S; 33°55.792E) and Mwampaghatwa, about 2 km North of
Mwenetete. In the South of Karonga, specimens were collected from Wovwe
(10°18.627S; 34°07.901E) Figure 2.1. Specimens from Likoma Island ((12º04S, 34º44E)
Hunt et al., 2010) were provided by Professor Richard Hunt.
Page 47
46
Figure 2.1 Map of Malawi adopted from Kazembe et al. (2006) showing Karonga town
and Likoma Island. The side map showing sample collection sites was obtained from
Google earth map (http://maps.google.co.za, accessed on 20 May 2011).
The primary economic activities in all villages where specimens were collected include
farming, fishing and general trading. Rice is mostly cultivated in the north, whilst maize
and tobacco farming is predominant in the south. Human dwellings were mainly
constructed using either brick or wood and mud (wattle and daub) with thatched roofs
without ceilings. Houses in the study area were unsprayed and there was an average of two
bed nets per house most of which were insecticide treated. Some inhabitants slept in sheds
as a consequence of an earth quake in the region. Domestic animals and livestock
including chickens, dogs and cattle are kept in close proximity to dwellings. Piped water,
health facilities and good drainage were absent in all villages. Home owners were
approached through regional malaria control leaders and an informed consent obtained
before the commencement of collections.
Page 48
47
2.3.2 Mosquito collections
Mosquitoes resting either inside houses or outdoors were collected using an aspirator.
Collections were done from 21 - 29 April and from 24 September - 8 October, 2010 in the
mornings (8:00 am to 12:00 pm) and afternoons (15:00 pm to 17:00 pm). Houses without
nets or those with untreated nets that were close to breeding sites were preferentially
sampled to maximize the collection. Outdoor sites searched included tree holes, empty
containers and animal shelters. Human landing catches and cattle kraal collections
(Appendix III) were performed in Kwambwe village late in the evenings. Collected
mosquitoes were immobilised using ethyl acetate and the gonotrophic state of each female
was recorded by observing their abdomens with a hand lens. Each mosquito was then
individually desiccated in a 0.2ml eppendorf tube containing silica gel (Fisher Scientific,
Fair Lawn, NJ) and kept under ambient conditions. A sub-set of the collected females were
stored alive, maintained on a 10% sugar solution and were transported to the Botha De
Meillon insectary, Vector Control Reference Unit (VCRU), Johannesburg, South Africa
for further analysis.
2.3.3 Mosquito rearing
The insectary was maintained at temperature of 25 ± 2°C and relative humidity of 75 ±
5%. A day/night cycle of 12 hours each including a dusk/dawn gradient of 45 minutes was
mimicked. Live wild-caught females from Karonga and Likoma Island were individually
placed in glass vials lined with moistened filter paper and were induced to lay eggs. The
eggs from each female were transferred to polythene plastic bowls (27cm x 16cm x 6.5cm)
1/3 filled with distilled water. Each family was reared separately. Emerging F1 larvae were
fed with a mixture of powdered dog biscuits (West‟s traditional crunching biscuit treats,
Martin and Martin, South Africa) and yeast (Vital Health Foods, South Africa) prepared at
Page 49
48
a ratio of 3:1. F1 adults were maintained on 10% sugar water for insecticide susceptibility
bioassays.
2.3.4 Insecticide susceptibility tests
Insecticide susceptibility tests were performed using the standard WHO protocol (WHO,
1998). Before test exposures were conducted, the efficacy of the insecticide papers was
tested by exposing samples of the insecticide susceptible An. funestus laboratory strain,
FANG. This colony originates from Angola and has been in colony since 2002. All papers
used in subsequent tests induced 100% mortality in the exposed FANG samples. Samples
of two to three day old non-blood fed F1 adults (mixture of males and females) were then
tested. For all tests, samples of 3-25 F1 progeny by family were transferred into a holding
tube. They were then transferred to an exposure tube lined with an insecticide impregnated
filter paper treated with a resistance diagnostic dose (4% DDT, 0.05% deltamethrin and
0.01% bendiocarb). The number of tubes used for exposure was DDT (2), deltamethrin (9)
and bendiocarb (7). Adjacent to each test, a control tube containing 25 mosquitoes (FANG)
were exposed to papers without insecticide. Following a one hour exposure, the number of
mosquitoes knocked down in each tube was recorded and all mosquitoes were transferred
back to their respective holding tubes and provided with a cotton pad soaked in a 10%
sucrose solution. Final mortality was recorded twenty four hours post-exposure. In
instances where the mortalities of the controls were between 5% and 20%, the mortalities
of the corresponding test samples were corrected using Abbot‟s formula (Abbott, 1925):
[(E-C) / (100-C)] X 100
E and C represent percentage mortality of mosquitoes in the exposure and control tests
respectively. If no mortality was observed in the control, the mortality data for the test
Page 50
49
samples were pooled. All susceptibility tests were performed at a temperature of 25 ± 2°C
and relative humidity of 75 ± 5%.
2.3.5 Mosquito laboratory processing
2.3.5.1 DNA extraction
The protocol described by Collins et al. (1987) detailed in Appendix IIA was used for
extracting DNA from the abdomens of single mosquitoes. Preparation of DNA extraction
solutions are given in Appendix IA.
2.3.5.2 Mosquito identification
Species-specific identification of all An. funestus group samples, including the mothers of
each family described above, was performed according to the cocktail PCR assay of
Koekemoer et al. (2002). Unidentified samples from this assay were subjected to PCR
identification according to Spillings et al. (2009) which is used for identification of An.
funestus-like. Those samples that did not produce PCR products in either assay were
sequenced and analysed for identification. Protocols are detailed in Appendix IIB and IIC.
2.3.5.3 Sporozoite infectivity rate detection by ELISA
To establish the vector status of the populations represented by the wild caught female
specimens, a sporozoite Enzyme-Linked Immunosorbent Assay (ELISA) that detects
circumsporozoite proteins (CSP) in the head and thorax of each specimen was performed
(Wirtz et al. 1992). The head and thorax of each An. funestus group female was separated
from the abdomen with the aid of a sterile blade and forceps and analysed. Positive
controls consisting of synthetic peptides for P. falciparum and P. vivax (Cat. No. Pf-PC
Page 51
50
and Pv-PC Washington DC, USA), supplied by Dr. R. Wirtz of the CDC Atlanta, USA,
were freshly prepared for each ELISA. Antibodies of the other Plasmodium species were
not available during this study and were therefore not used. Negative An. funestus controls,
consisting of seven insectary-reared unfed females (FANG), were processed in the same
manner as the test samples. To quantify the degree of infection in An. funestus-like ELISA-
positive specimens, a P. vivax positive control was serially diluted to 0pg/50µl (100, 50,
25, 12, 6, 3, 1.5 and 0) from 100pg/50µl in triplicate. The CSP-ELISA procedure was then
conducted after which a standard curve was plotted against which ELISA positives could
be compared and quantified. The prepared homogenates, if not used on the same day, were
stored at -70ºC until analysis. The preparation of the chemicals and solutions are given in
Appendix IC while the protocol for this assay is detailed in Appendix IID.
2.3.5.4 Blood meal identification
Blood meal identification was determined by the direct enzyme-linked immunosorbent
assay (ELISA) method of Beier et al. (1988) using field collected females identified as
„fed‟ following examination of the abdomen using a hand lens. The chemicals and
solutions for this assay are given in Appendix I D and a detailed protocol is provided in
Appendix II E. This assay employs anti-host immunoglobulin G (IgG) conjugates directed
against human, pig, dog, chicken, bovine and goat blood. The presence of all these animal
hosts was confirmed during the field collections. The abdomen of each female was
separated from the thorax using a sterile scalpel blade. Each abdomen was individually
placed in a labelled 1.5ml eppendorf microcentrifuge tube and homogenized. Negative
controls consisted of four unfed female An. funestus mosquitoes (FANG) which were
processed in the same way as the test samples. Positive controls included 1µl of host blood
diluted in 50µl PBS and were freshly prepared as needed. Blood for the positive controls
Page 52
51
was collected by trained staff at the Department of Agriculture, University of Pretoria,
South Africa.
2.3.5.5 Data analysis:
Resting behaviour:
Mosquitoes were regarded as “indoor resting” when caught resting inside houses and
“outdoors resting” when caught from cattle kraals.
Seasonality:
Anopheles funestus-like mean abundances for the wet and dry seasons were calculated as a
ratio of the total specimens collected per season to the total number of An. funestus-like
identified in the study.
Sporozoite infectivity rate:
Samples with optical densities greater than twice the average of the optical density of the
negative controls were considered positive for Plasmodium infection and were repeated for
confirmation (Wirtz et al., 1992). The percentage infectivity rate was then calculated by
mosquito species and Plasmodium species. The equation for the standard curve was used to
calculate the concentration of Plasmodium in infected An. funestus-like specimens.
Blood meal identification:
Samples were considered positive for a particular blood source if their absorbance values
exceeded the mean plus three times the standard deviation of the four negative controls
(Beier et al., 1988). The percentages of mosquitoes with human and animal (pig, dog,
Page 53
52
chicken, bovine and goat) blood were calculated. The blood source with the greatest
percentage was considered the main blood source.
2.4 Results
Owing to financial constraints only two field trips were conducted in the course of this
study. Specimens collected from 21- 29 April 2009 were termed wet season collections
because they were collected during the rainy season which was characterised by an
abundance of breeding sites. Those collected from 24 September - 8 October 2010 were
regarded as dry season collections.
2.4.1 Mosquito collections
A total of 391 adult Anopheles mosquitoes were collected from indoor and cattle kraal
collections from both localities. The bulk of the samples analysed were from Karonga
(63.9%, n = 250) and these comprised of wet season (48.4% n = 121) as well as dry season
(51.6% n = 129) collections (Table 2.1). In the Karonga wet season collections, indoor-
resting samples accounted for 87.6% of the sample while a small number (12.4%) were
collected outdoors. Dry season samples were predominantly comprised of indoor resting
mosquitoes (99.2%) whilst the rest were collected outdoors.
Page 54
53
Table 2.1 Distribution of Anopheles funestus group collections from Kironga and Likoma
Island.
Seasons Karonga (n = 250) Likoma
Island
(n =
141)
T
O
T
A
L
Collection sites
Mwakabighili
n (%)
Mwenetete
n (%)
Wovwe
n (%)
Kwambwe*
n (%)
Mwampaghatwa
n (%)
Wet 21(8) 20(7.6) 65(24.8)
15(5.7)
- 141(53.8)
262
(67)
Dry 25(19.4) 88(68) 1(0.8) 1(0.8) 14(10.9) - 129
(33)
46(11.8) 108(27.6)
66(16.9)
16(4)
14(3.6)
141(36) 391
* Specimens from this site were all cattle kraal collections, n = total sample collected, % =
percentage calculated from grand total
The Likoma Island samples were all collected during the wet season (n = 141) and were
mainly collected indoors. This area was not originally part of the study. However, with an
opportunity to visit this site, these collections were included to broaden the search for An.
funestus-like.
2.4.2 Anopheles funestus group species identification
Figure 2.2 shows species-specific PCR results for the identification of the An. funestus
group members including An. funestus-like.
Page 55
54
Figure 2.2 2.5% agarose gels stained with ethidium bromide showing PCR products
amplified using species-specific primers for Anopheles funestus group identification. A:
Lane 1: Molecular marker; Lanes 2 to 7: Controls, Lane 2: Negative control; Lane 3: An.
leesoni; Lane 4: An. parensis, Lane 5: An. rivulorum, Lane 6: An. vaneedeni, Lane 7: An.
funestus; Lanes 8-12: Test samples; B: Lane 1: Molecular marker; Lane 2: Negative
control; Lane 3: An. funestus-like positive control; Lanes 4 to 6: Test samples.
The ITS2-region of samples unidentified using either assay of Koekemoer et al. (2002) or
Spillings et al. (2009) were amplified and subsequently sequenced to allow for species
identification by analysing the sequences of the species specific primer sites. Figure 2.3
shows PCR products generated from the rDNA ITS2-region. Results obtained from
analysis of the ITS2-region of rDNA were included in Table 2.2.
Figure 2.3 A 2.5% agarose gel stained with ethidium bromide showing PCR amplification
of the ITS2-region of the rDNA gene. Lane 1: DNA marker; Lane 2: Negative control;
Lane 3: An. rivulorum (control), Lanes 4 to 9: test samples.
A
B
Page 56
55
Tables 2.2 and 2.3 show the distribution of An. funestus group members identified from the
wet and dry season collections respectively. A total of 349 (89.3%) of the collected
Anopheles mosquitoes were identified and 42 (10.7%) could not be identified. Anopheles
funestus was the predominant species collected indoors during the wet season and An.
rivulorum predominated indoors during the dry season. Within the An. funestus group, An.
rivulorum and An. funestus were the only species identified from the outdoor collections
(Kwambwe.
Table 2.2 Anopheles funestus group species identified from wet season indoor and outdoor
collections.
* Specimens from this site were all cattle kraal collections. n = number of samples
identified, % = percentage of identified sample
Collection site
Anopheles funestus group species
Total
n =224
An. funestus-like
n (%)
An. rivulorum
n (%)
An. funestus
n (%)
Mwakabighili 3 (20) 12 (80) - 15
Mwenetete 8 (42.1) 10 (52.6) 1 (5.3) 19
Wovwe - 3 (4.8) 60 (95.2) 63
*Kwambwe 2 (16.7) 9 (75) 1 (8.3) 12
Likoma Island - - 135 (100) 135
Total 13 34 197 224
Page 57
56
Table 2.3 Anopheles funestus group species identified from dry season indoor and
outdoor* collections.
* Specimens from this site were all cattle kraal collections. -: implies no sample and n:
number of sample. n = number of samples identified, % = percentage of sample.
Collection site
Anopheles funestus group
species
Total
n = 103
funestus-
like
n (%)
rivulorum
n (%)
funestus
n (%)
parensis
n (%)
Mwakabighili
3 (15)
17 (85)
-
-
20
Mwenetete
13 (19.1)
52 (76.5)
1 (1.5)
2 (2.9)
68
Wovwe
-
-
1 (100)
-
1
*Kwambwe
1 (100)
-
-
-
1
Mwampaghatwa
6 (46.2)
7 (53.8)
-
-
13
Total 23 76 2 2 103
Page 58
57
Figure 2.4 shows the variation in the number of An. funestus-like collected during the wet
and dry seasons per collection site. Anopheles funestus-like was consistently collected in
both seasons from Mwakabighili, Mwenetete and Kwambwe. Mwenetete was the most
productive site (n = 12) during the dry season. A larger proportion of An. funestus-like
(68.6%, n = 35) was collected during the dry season than the wet season (31.4%, n = 35).
For both seasons, the majority of mosquitoes were collected indoors except in Kwambwe
where all the mosquitoes were collected from a cattle kraal.
Figure 2.4 Comparative analysis of seasonal predominance of An. funestus-like in
Karonga. In Mwampaghatwa village, specimen collection was done only during the dry
season.
2.4.3 Insecticide susceptibility tests
Only the collections from Wovwe successfully produced sufficient F1 adult progeny (n =
272) for insecticide susceptibility tests. The progeny from females collected from the other
sites either died during the aquatic stages or the eggs failed to hatch. According to WHO
recommendations, 24 hour post exposure mortality of 98 – 100% indicates full
susceptibility, 80 - 97% suggests a possibility of resistance that needs to be confirmed and
0
5
10
15
20
25
Mwakabighili Mwenetete Kwambwe Mwampagatwa
Collection sites
Nu
mb
er
of
An
op
hele
s f
un
estu
s-l
ike
Wet season
Dry season
Page 59
58
less than 80% suggests resistance to the insecticide tested. Analysis based on these
indicators shows that An. funestus s.s from Wovwe is resistant to deltamethrin (72.2%
mortality) and bendiocarb (61.9% mortality), and is susceptible to DDT (98.1% mortality)
(Figure 2.5). None of the tested F1 specimens were An. funestus-like.
Figure 2.5 Mean proportional insecticide susceptibilities of Anopheles funestus from
Wovwe Karonga Malawi to deltamethrin, DDT and bendiocarb. The horizontal line at 80%
mortality indicates the cut off point below which the percentage mortality indicates
resistance. Error bars represent standard deviation
2.4.4 Blood meal source identification
A total of 117 blood engorged female Anopheles were analysed for their blood source. Of
these, only 54 samples (46.2%) tested positive for host blood. The detailed results of
appendix IV are summarised in Table 2.4. The combined species data show that single
human or animal blood meals constituted 3.7% (2/54) and 88.9% (48/54) respectively.
Mixed blood meals represented 7.4% (4/54) of the sample.
0
20
40
60
80
100
120
deltamethrin DDT bendiocarb
Insecticides
Perc
en
tag
e m
ort
ali
ty
deltamethrin
DDT
bendiocarb
Page 60
59
Table 2.4 Blood source preferences of members of the An. funestus group.
Anopheles
species
Total (n = 54)
Blood meal source
Mixed blood
(%) Human (%) Animal (%)
An. funestus-
like
10 - 10 (100) -
An. rivulorum 34 - 31 (91.2) 3 (8.8)
An. parensis 1 - 1 (100) -
An. funestus 9 2 (22.2) 6 (66.7) 1 (11.1)
Different combinations of mixed blood meals (MBM) were observed for each mosquito
species - Appendix IV. The number of MBM combinations by species was An. funestus 4,
An. rivulorum 5, and An. parensis 1. The dominant combination for most species is bovine
and goat.
A total of 21 female An. funestus-like mosquitoes collected during the dry and wet seasons
were analysed for their blood meal source (Figure 2.6). Ten of twenty one (47.6%) were
positive for animal blood and none for human blood. Seven specimens (70%) tested
positive for mixed blood from bovine and goat and only 3 (30%) for single blood meals
from goat.
Page 61
60
Figure 2.6 Results of ELISA against bovine and goat antibodies for blood meal
identification of blood-fed female An. funestus-like collected during the dry and wet
seasons from different sites in Karonga. „n‟ indicates number of samples analysed.
Collections were not performed during the wet season in Mwampaghatwa.
Human blood index (HBI)
Human blood indices detected from these collections were as follows. An. rivulorum
collected from Mwakabighili was 12.5%, An. rivulorum and An. funestus from Mwenetete
was (10% and 8.3%) and 100% respectively. For An. funestus from Wovwe, the HBI was
25. The HBI for An. funestus-like was zero - Appendix IV.
0
20
40
60
80
100
120
Wet season
(n=3)
Dry
season
(n=2)
Wet
season(n
=4)
Dry
season(n
=5)
Dry
season
(n=5)
Wet season
(n=1)
Dry
season
(n=1)
Mw akabighili Mw enetete Mw ampaghatw a Kw ambw e
Sample collection sites per season
Perc
en
tag
e o
f A
n. fu
nestu
s-l
ike w
ith
ho
st
blo
od
Single Goat blood
Mixed cow and goat blood
Blood source unidentified
Page 62
61
2.4.5 Plasmodium sporozoite infectivity rate
Of the five species of Anopheles screened for P. vivax and P. falciparum using
Circumsporozoite Protein (CSP)-ELISA, only An. funestus tested positive for P.
falciparum at a proportion of 5.9% (n = 134). Anopheles funestus-like was found to be
infected with P. vivax with an infection rate of 6.7% (n = 15) (Table 2.5). The infected An.
funestus-like samples were all from Mwenetete giving an infection rate for this species at
that locality of 20% (n = 5). All the other anopheline species were CSP negative (Table
2.5). Irrespective of seasons, an overall infection rate for An. funestus with P. falciparum in
this study was 4.4% (n = 181) and 4% (n = 25) for An. funestus-like infected with P. vivax.
As a consequence of the infection of An. funestus-like with P. vivax, 210 specimens
collected in 2008 from Karonga which showed negative for P. falciparum were
subsequently screened for P. vivax and an infection rate of 3.1% (n = 64) was obtained.
Confirmation of the positive infection of An. funestus-like with P. vivax using PCR
according to Snounou et al., (1993) proved unsuccessful.
Page 63
62
Table 2.5 Detection of Plasmodium species infection by ELISA
n = Total samples tested.
Sites
Season
Anopheles species
n
P. falciparum
P. vivax
Positive (n)
Infectivity rate
(%)
positive
Infectivity rate
(%)
Likoma
Island
Wet An. funestus 134 8 5.9 0 0
Karonga
Wet
An. funestus 45 0 0 0 0
An. rivulorum 29 0 0 0 0
An. funestus-like 10 0 0 0 0
Dry
An. funestus-like 15 0 0 1 6.7
An. rivulorum 50 0 0 0 0
An. funestus 2 0 0 0 0
An. parensis 1 0 0 0 0
Page 64
63
2.4.5.1 Plasmodium vivax Quantification
To determine the parasite load in infected Anopheles funestus-like, P. vivax infection was
quantified. The average of the absorbance values at each concentration of the serial dilution
was determined and a standard curve was constructed (Figure 2.7).
Figure 2.7 Plasmodium vivax ELISA assay standard curve. The equation for the best fit
polynomial that matches the graph for the test samples was obtained using Microsoft Excel
2003.
Three An. funestus-like specimens (one from this study (Table 2.5) and two from Spillings et
al., 2009 collections) were found to be positive for P. vivax using ELISA with absorbance
values of 0.182, 0.121, and 0.122. Because of the low values, extrapolation of the
corresponding P. vivax concentration from the standard curve proved difficult. However, an
equation for the standard curve was determined from which the corresponding P. vivax
concentrations of 2.468, 2.464 and 2.464 pg/50µl were obtained.
Page 65
64
2.5 Discussion
2.5.1 Collection methods
Anopheles funestus group mosquitoes were successfully collected indoors and from cattle
kraals in northern Malawi. Identification of such samples to species is critical because it
enables differentiation between those species that transmit malaria and those that do not. Apart
from An. funestus which is highly endophilic, An. rivulorum, An. leesoni and An. parensis can
also be found resting indoors (Gillies and De Meillon, 1968; Kamau et al., 2003-; Mouatcho et
al., 2007), negating the assumption that indoor-resting An. funestus group samples are most
likely An. funestus s.s. Anopheles funestus-like has previously been collected indoors from
Karonga (Spillings et al., 2009; Hunt personal communication), although attempts to collect
this species using the human landing catch method failed, suggesting that it is essentially
exophilic.
Based on morphological and molecular data, this study highlights the presence of four sibling
species in the An. funestus group in Karonga i.e. An. funestus, An. rivulorum, An. parensis and
An. funestus-like, while An. funestus was the only species collected on Likoma Island.
Previous studies conducted in the Karonga region reported the presence of An. rivulorum, An.
funestus-like (Spillings et al., 2009) and An. funestus (Chiphwanya J personal
communication). The additional presence of An. parensis is reported here, although in low
numbers. Anopheles rivulorum was predominant in Mwakabighili, Mwenetete and Kwambwe
whilst An. funestus predominated in Wovwe and Likoma Island based on data from the wet
and/or dry season collections. The predominance of An. rivulorum over An. funestus is
surprising as An. funestus has previously been associated with rice agro-ecology (Gillies and
Page 66
65
De Meillon, 1968). The predominance of An. funestus in Wovwe was expected as the breeding
sites there are conducive for this species.
Only 10.7% (n = 391) of collected An. funestus. s.l could not be identified to species using the
species-specific PCR of Koekemoer et al. (2002) and Spillings et al. (2009), even after two
attempts. This may be attributed to misidentification by human error, failure of the DNA
extraction process, the presence of inhibitors after DNA extraction, the presence of other
member species of the An. funestus group not detected by these assays or the degradation of
DNA due to storage problems.
2.5.2 Insecticide susceptibility test
Results from this study shows that An. funestus population from Wovwe are resistant to
deltamethrin and bendiocarb but fully susceptible to DDT. Although the underlying resistance
mechanisms in this population have yet to be evaluated, it is unlikely that knock-down
resistance (kdr) mutations are present because they normally confer resistance to pyrethroids
and DDT (Martinez-Torres et al., 1998; Dabire et al., 2009).
The detection of deltamethrin and bendiocarb resistance in An. funestus observed in Wovwe
tallies with previous reports from southern Africa. In Mozambique, Abilio et al. (2010)
reported resistance to the pyrethroid lambda cyhalothrin and bendiocarb in a population of An.
funestus from Mugeba and Majaua in Mozambique. Similarily, Hunt et al. (2010) recently
observed the same resistance profile in An. funestus from Likoma Island. The above resistance
scenario in southern Africa differs from that recorded in east Africa. In Uganda, Morgan et al.
(2010) reported susceptibility to bendiocarb and deltamethrin and suspected resistance to DDT
Page 67
66
in An. funestus. Results from this study, highlight the possible spread of resistant genes in An.
funestus populations from southern Africa. This emphasises the need to collaborate and
incorporate insecticide resistance management strategies in the various malaria control
programs within the region.
2.5.3 Blood meal analysis
The interpretation of the blood meal results obtained during this study should be handled with
caution. Relatively few samples from each species per season were analysed for their blood
meal sources, precluding a definitive conclusion on the feeding behaviours of each species.
Furthermore, a comparison of HBI between species cannot be reliably made.
All four An. funestus group members analysed for their blood sources showed a distinct
preference for animal blood over human blood. Anopheles funestus-like were positive for
bovine and goat blood, even though the majority of them were collected indoors. Similarly,
the other members of the An. funestus group fed predominantly on bovine and goat as well as
dog, chicken and pig, suggesting that these mosquitoes obtained their blood meals outdoors
from domestic animals and livestock before entering houses to rest. These feeding and resting
behaviours amongst member species of the An. funestus group have previously been recorded
(Kent and Norris, 2005), although this study describes for the first time the zoophilic and
endophilic behaviours of An. funestus-like. The HBI for indoor and outdoor collected An.
funestus-like were zero, further supporting evidence that this species is zoophilic and therefore
a non-vector of human malaria.
Page 68
67
A low median HBI of 10% was observed for all other member species of the An. funestus
group. This may be attributable to bed net usage, forcing mosquitoes to obtain blood from
domestic animals and livestock such as goats and cattle. The unidentified blood sources may
have been obtained from other animals such as horses, donkeys, birds and rats. This highlights
the need to include a wider variety of hosts for blood meal source determination as well as a
need for more sensitive assays such as the PCR methods described by Kent et al. (2007).
2.5.4 Plasmodium sporozoite infection
The most recent Plasmodium infectivity study in Karonga is described in Spillings et al.
(2009) from wet season collections. In their study, anopheline mosquitoes were screened only
for P. falciparum infection and all specimens tested negative. In this study, wet and dry season
collections together with homogenates from the 2008 collections were screened for P.
falciparum and P. vivax infection. The absence of P. falciparum infection in all tested
specimens from Karonga does not necessarily imply a total absence of malaria transmission
because of the presence of the major malaria vector An. funestus.
An important result from this study was the data showing infection of An. funestus-like with P.
vivax during the dry season. This observation appears to contradict other evidence showing
that An. funestus-like is entirely zoophilic (P. vivax is a human malaria). However, it is most
likely that the CSP-ELISA produced false positives as previously reported for other
anopheline species (Lochouarn and Fontenille, 1999; Koekemoer et al., 2001; Mouatcho et al.
2007). Alternatively, these data may imply that one or more of the domestic animal species
from which the An. funestus-like specimens were acquiring blood are reservoirs of P. vivax.
Page 69
68
This scenario is highly unlikely although it has previously been shown that squirrel monkeys
can incubate this parasite (Young et al., 1971). Repeated attempts using PCR to confirm the
sporozoite ELISA results were unsuccessful. This could be attributed not only to the limited
amount of CSP-positive homogenate available, but also to sample degeneration as a
consequence of repeated freezing and thawing. Further investigation into the infection of An.
funestus-like by P. vivax using a more sensitive technique such as real time PCR (Bass et al.,
2008), which employs Plasmodium parasite specific probes, is recommended.
2.6 Conclusion
The dynamics of malaria transmission in the Karonga region of northern Malawi are poorly
understood. Currently, the only formal vector control intervention there is the use of mosquito
nets most of which are untreated. Informative baseline surveys are therefore needed to
facilitate the design of a co-ordinated malaria control programme. In order to implement an
integrated vector management programme centred on IRS, a survey of the vector species
composition, the pattern of malaria transmission, the prevalence of Plasmodium infection in
implicated vector populations and the insecticide susceptibility status of target vector
populations is required.
Much of this information is provided in this study in which the presence of four species of the
An. funestus group (An. funestus, An. rivulorum, An. parensis and An. funestus-like) is
described. Evidence of insecticide resistance is presented for the major malaria vector An.
funestus in Karonga. Although An. funestus-like is shown to be zoophilic and mainly
endophilic, its vector status in terms of the transmission of P. vivax needs to be clarified.
Page 70
69
CHAPTER THREE
Morphological description of Anopheles funestus-like from Malawi
3.1 Introduction
Morphological identification is the first step in any field study and remains vital to any vector
control program. Since morphological keys developed by Gillies and De Meillon (1968) and
later updated by Gillies and Coetzee (1987), very few additional studies on the morphology of
malaria vectors has been done. The importance of correct morphological identification can
never be over-emphasized and incorrect identification can result in loss of valuable resources
both in the field and in the laboratory. Furthermore, this will impact on the recommendations
made for implementation of a control program or the maintenance of an existing vector control
program.
In 2007, mosquitoes were collected from Karonga in Malawi and morphologically identified
as belonging to the Anopheles funestus group. However, these specimens were subsequently
found to be a new species, named provisionally An. funestus-like (Spillings et al., 2009). It is
against this background that the morphological characterization of An. funestus-like was
undertaken to investigate if any morphological characteristics could be used to differentiate
between An. funestus-like and An. funestus s.s.
Page 71
70
3.2 Materials and Methods
Mosquitoes morphologically studied
Mosquitoes examined in this study were laboratory F1 progeny reared from wild caught gravid
females of An. funestus-like from Karonga in Malawi. Comparative specimens were An.
funestus s.s from Malawi and Madagascar. All the specimens were pinned and originated from
the VCRU Medical Entomology museum collection. The An. funestus-like specimens were
reared from 2007 collections while the An. funestus s.s samples from Malawi and Madagascar
were reared in 2010 and 1996 respectively. All specimens were reared in the Botha De
Meillon insectary of the NICD/NHLS Johannesburg, South Africa prior to pinning.
Anopheles species identification
The wild caught females from which the F1 progeny were obtained had previously been
identified morphologically as members of the An. funestus group using the keys of Gillies and
De Meillon (1968) and Gillies and Coetzee (1987). Further identification to species level was
performed according to the protocols of Koekemoer et al. (2002) for An. funestus and
Spillings et al. (2009) for An. funestus-like.
3.2.1 Morphological measurements
All measurements were done using a Wild Heerbrugg M5-71661 microscope containing a
micrometer eye piece and the following characteristics were examined and recorded in mm:
Wing length, wing spot ratio, palpal ratio and leg morphology.
Page 72
71
3.2.1.1 Wing length measurement
Ten families consisting of four to five females F1 progeny per family (n = 49) of wild caught
An. funestus-like and wild An. funestus s.s (n = 42) were used for wing measurements (Figure
3.1). The left forewing was measured from the base of the arculus to the apical margin at
X200 magnification. In cases where the left wing was damaged, it was replaced by the right
wing.
3.2.1.2 Wing morphology and wing spot ratio
Wing spot names and numbering were according to De Meillon et al. (1977). Wings for An.
funestus and An. funestus-like species were observed for the presence or absence of costal
spots, vein spots and fringe spots. Wing spots 8, 9 and 10 (Figure 3.5) were measured in both
species at X200 magnification. The wing spot ratio was calculated as:
Length of costa spot 8 + Length of costa spot 10
Length of costa spot 9
3.2.1.3 Palpal ratio
The palp of each female mosquito was mounted on a microscope and length of palp segments
III, IV (subapical dark band) and V (apical pale band) were measured at X200 magnification
(Figure 3.8 and 3.9). The palp ratio was determined according to De Meillon et al. (1977)
using the formula:
Palp ratio = Length of palp segment III + Length of palp segment V
Length of palp segment IV
Page 73
72
3.2.1.4 Leg morphology
The fore-, mid- and hind legs were mounted under an Olympus SZ2-ILST microscope. The
joints of the tarsomeres were observed for pale bands while the complete leg was observed for
any diagnostic character.
3.2.2 Data analysis
One way analysis of variance (ANOVA) was used to check for variance in morphological
character within and between members of each species. Pair wise comparison of means was
done using student-t- test. All statistical analysis was done using statistic 7 package.
3.3 Results:
3.3.1 Wing Length measurements
Figure 3.1 shows a representative wing of female Anopheles funestus-like indicating points
from which wing-length measurements were made.
Figure 3.1 The wing of Anopheles funestus-like species
Page 74
73
Results for mean wing length measurement are summarized in Figure 3.2.
Figure 3.2 Distribution of wing length of Anopheles funestus and An. funestus-like. Box and
whisker plot showing wing length mean in mm (bar in box), interquartile range (box), wing
length range (whiskers) for female An. funestus and An. funestus-like species.
Mosquito‟s wing length raw data were summarised using statistic 7 parkage (Appendix V) and
wa found to be normally distributed. Statistical analysis using ANOVA showed significant
difference in mean wing length between An. funestus-like, An. funestus from Madagascar and
Malawi (P = 0.0000, F = 80.55). After pair wise comparisons using student t- test, significant
difference in mean wing length was recorded for An. funestus s.s species from both countries
(p = 0.0000) and between each of the An. funestus species and An. funestus-like (p = 0.0000).
Page 75
74
3.3.2 Wing morphology and wing spot ratio
3.3.2.1 Wing morphology
Figure 3.3 shows wing morphological diagnostic characters that were investigated in An.
funestus and An. funestus-like species.
Figure 3.3 Female An. funestus left wing showing distinctive morphological characters. A and
B: costa black spots 3 and 4 respectively, C, fringe spots, D: Vein 3, E: Vein 2.2, F: Pale spot
on vein 5.1, G: Pre-sector pale spot (Gillies and Coetzee, 1987)
Table 3.1 shows wing morphological characters investigated for discrimination of An. funestus
and An. funestus-likes species.
Page 76
75
Table 3.1 Comparative morphological characters for An. funestus and An. funestus-like
species
Morphological
character
An. funestus s.s
(n = 22)
An. funestus-like
(n = 45)
Wing field Predominantly dark Predominantly pale
Costal black spot 3 and 4
Equally shaded 3 more shaded than 4
Spot 3 is broader Spot 3 is Narrower
Wing fringe spots 6 fringe spots 5 fringe spots
Distinct
Not distinct
Vein 5
Bifurcate ends on fringe
spots 5 and 6
Bifurcate ends on fringe
spots 4 and 5
Pre-sector pale spot Present in majority of
samples
Absent in all samples
Individual characters investigated within and between families were quantitatively analyzed.
The number of members in each family ranged from 3 to 5.
For wing field colour, all specimens of An. funestus were predominantly dark while An.
funestus-like was pale brownish in colour (Fig 3.4). For colour intensity of costal black spots 3
and 4, 95.4% (n = 22) of An. funestus analyzed had both spot equally dark and in one sample
(4.6%) spot 4 was darker. In all specimens of An. funestus-like analyzed for this character,
Page 77
76
costal black spot 3 was darker than spot 4. Spot 3 was 3 times broader than spot 4 in An.
funestus while it was 2 times broader in An. funestus-like.
Five distinct pale fringe spots were observed in 9% (n = 22) and six in 45.5% (n = 22) An.
funestus which also had fringe spots 1 to 3 merged in 13.6% (n = 22) specimens (Figure 3.4).
For An. funestus-like, 26.8 % (n = 45) individuals had 5 distinct fringe spots and in 6.7% (n =
45) specimens, fringe spots 4 and 5 were merged. The rest of the specimens for both species
had damaged fringes or were difficult to score.
Figure 3.4 Dorsal view of An. funestus right wing showing merged fringe pale spots 1 to 3
Analysis of the pale spot on wing vein 5.1 showed that 90.9% (n = 22) and 97.8% (n = 45)
were positive for this character in An. funestus and An. funestus-like species respectively.
Bifurcation of wing vein 5 terminated in fringe pale spots 4 and 5 in 4.5% (n = 22) and in
fringe spots 5 and 6 in 50% (n = 22) of An. funestus. In An. funestus-like, 33.3% (n = 45) had
this bifurcation terminating on fringe spots 5 and 6.
The pre-sector pale spot was present in 77.2% (n = 22) An. funestus and absent in the rest of
the samples. The same character was absent in all specimens of An. funestus-like.
Page 78
77
3.3.2.2 Wing spot ratio
Female wing costal spots used for the determination of wing spot ratio are represented Figure
3.5
Figure 3.5 Dorsal view of female An. funestus-like right wing showing wing spots 8 (pale), 9
(brown) and 10 (pale) measured at 40X magnification for calculation of wing spot ratio.
Table 3.2 show results for biometrical data recorded for adult female wing spot ratios of
species investigated.
Page 79
78
Table 3.2 Quantitative taxonomic character detailing the ratio between combined lengths of 8th
and 10th
wing spots and length 9th
wing spot in adult females of Anopheles funestus-like and Anopheles funestus species
An. species
/Country
Length No Observed range Mean 95%CI SD CV
An. funestus-like/Malawi
Wing segment 9 44 3.658-4.2670 3.9902 3.8969-4.0834 0.3067 7.6875
wing segments 8+ 10 44 2.72-4.3500 3.3293 3.2046-3.4540 0.4101 12.319
Wing spot ratio 44 0.638-1.1900 0.8402 0.7997-0.8807 0.1333 15.867
An. funestus /Madagascar
Wing segment 9 22 4.267-5.4860 4.7659 4.5679-4.9639 0.4466 9.3711
wing segments 8+ 10 22 3.048- 5.4860 4.3225 4.0229-4.6222 0.6758 15.634
Wing spot ratio 22 0.556-1.2860 0.9212 0.8312- 1.0112 0.2029 22.029
An. funestus /Malawi
Wing segment 9 20 2.4380-3.6580 3.5055 3.3232-3.6878 0.3896 11.114
wing segments 8+ 10 20 2.7210-3.8100 3.2931 3.1630-3.4232 0.2779 8.4384
Wing ratio 20 0.7440-1.3390 0.9555 0.8768-1.0341 0.168 17.581
Page 80
79
Comparison of the mean wing spot ratio for An. funestus-like and An. funestus from both
countries using ANOVA, showed that there is significant difference between the three (p
= 0.0194, F = 4.13). Pair wise comparison of mean wing spot ratio for An. funestus-like
and An. funestus from Malawi showed significant difference (p = 0.0045). There was no
significant difference between the mean spot ratio of An. funestus-like and An. funestus
from Madagascar (p = 0.0998) as well as between An. funestus samples from both
countries (p = 0.5567).
Since there was no statistical difference (p = 0.0150) in mean wing spot ratio data for An.
funestus from the two countries, the data were pooled for comparison with that of An.
funestus-like (Figure 3.6). Results obtained indicated a significant statistical difference
for both species (p = 0.0069).
Figure 3.6 Comparison of mean wing spot ratio for An. funestus s.s from Malawi and
Madagascar with that of An. funestus-like species. The bar in the column represents
standard error.
0.7
0.75
0.8
0.85
0.9
0.95
1
Mosquito species
Win
g s
po
t ra
tio
An. funestus-like
An. funestus
Page 81
80
Further analysis of distribution of the data shows that, 14.28% of the pooled An. funestus
could be separated from An. funestus-like. The percentage overlap using this character
was 93% (Figure 3.7).
Figure 3.7 Scatter plot analysis of mean wing spot ratio for Anopheles funestus s.s and
An. funestus-like species.
3.3.3 Palp measurement and palp ratio determination
The female palp of An. funestus and An. funestus-like analyzed in this study is presented
in Figure 3.8 and 3.9 which also show palpal bands measured.
Figure 3.8 Anopheles funestus palp showing A: segment 3; B: segment 4 and C: segment 5
C
0.000
0.200
0.400
0.600
0.800
1.000
1.200
1.400
1.600
0 10 20 30 40 50
Mumber of samples
Me
an
win
g s
po
t ra
tio
An. funestus
An. funestus-like
Page 82
81
Figure 3.9 Anopheles funestus-like species palp
Biometrical data recorded for adult female palp ratios for species under investigation are
presented in Table 3.1. Comparing the mean palpal ratios of An. funestus-like species and
An. funestus from Malawi and Madagascar using ANOVA, showed that there was a
significant difference between the three groups (p = 0.0000, F = 12.76). Pair wise
comparisons using two sample t test, showed a significant difference between An.
funestus-like and An. funestus from the two countries (p = 0.0000). However, no
significant difference between An. funestus samples from both countries (p = 0.2595) was
recorded.
Page 83
82
Table 3.3 Quantitative taxonomic character detailing ratios between combined lengths of 3rd
and 4th
palpal segment and length of 4th
segment in adult females of Anopeheles funestus-like and Anopheles funestus species
An.species
/Country
Length of segment No Observed range Mean 95%CI SD CV
An. funestus-like/Malawi
Length of palp segment 4 44 1.2190 - 3.0480 2.1197 2.0104 - 2.2290 0.3595 16.962
Length of palp segments 3+ 5 44 1.829 - 4.2670 3.0618 2.8853 - 3.2383 0.5805 18.96
Palp ratio 44 1.0000 - 2.3330 1.475 1.3712 - 1.5788 0.3413 23.143
An. funestus /Madagascar
Length of palp segment 4 22 1.829 - 3.6580 2.743 2.5429 - 2.9431 0.4513 16.453
Length of palp segments 3+ 5 22 2.438 - 3.6580 2.9648 2.7727 - 3.1569 0.4332 14.611
Palp ratio 22 0.667 - 1.6670 1.1129 0.9998 - 1.2261 0.2552 22.932
An. funestus /Malawi
Length of palp segment 4 20 1.8290 - 2.4380 2.2858 2.1591 - 2.4124 0.2706 11.837
Length of palp segments 3+ 5 20 1.8290 - 3.0480 2.7127 2.4961 - 2.9292 0.4628 17.06
Palp ratio 20 0.7500 - 1.6670 1.2 1.0894 - 1.3106 0.2364 19.689
Page 84
83
Data for mean palp ratios for An. funestus s.s species from both countries, were pooled for
comparison with the mean palp ratio for An. funestus-like (Figure 3.10). Statistical analysis
using the two sample t-test revealed a significant difference between the mean palp ratio
for An. funestus-like and the combined mean palp ratio for the An. funestus species (p =
0.0000).
Figure 3.10 Comparison of mean palp spot ratio for An. funestus s.s from Malawi and
Madagascar with that of An. funestus-like species. The bar in the column represents
standard error.
There was an overlap in the ranges of the palp index for An. funestus and An. funestus-like
(Figure 3.9). A palp index of less than 1 indicated An. funestus and an index greater than
1.7 indicated An. funestus-like. Combining the female An. funestus from Malawi and
Mozambique resulted in 19% (n = 42) distinctively identified. For An. funestus-like (n =
44) 13.6% could be distinctively identified using palp index. Percentage overlap for both
species was 83.7%.
0
0.2
0.4
0.6
0.8
1
1.2
1.4
1.6
1.8
Mosquito species
Me
an
pa
lp r
ati
o
An. funestus-like
An. funestus
Page 85
84
Figure 3.11 Scatter plot analysis of mean palp ratio for Anopheles funestus s.s and An.
funestus-like species.
3.3.4 Scatter plot analysis of wing spot against palp spot ratio
Scatter plot analysis to segregate An. funestus families from An. funestus-like is presented
in Figure 3.12. Results showed that 70% (n = 10) of An. funestus segregated from An.
funestus-like which showed a 66.7% (n = 9) segregation. A percentage overlap of 26% was
obtained when both species were considered.
0.000
0.500
1.000
1.500
2.000
2.500
0 10 20 30 40 50
Number of samples
Mean
palp
rati
o
An. funestus
An. funestus-like
Page 86
85
Figure 3.12 Segregation of adult female Anopheles funestus s.s and An. funestus-like
families by means of ratios of wing spots 8 + 10/9 and palp spots 3 + 5/4.
3.3.5 Female leg morphology
Female fore-, mid-, and hind tarsomeres for An. funestus and An. funestus-like analyzed for
leg appearance are shown in Figure 3.13 and Figure 3.14 respectively. Results of the
comparative analysis obtained using individuals of distinct progenies showed that in An.
funestus, the tarsomere bands are apical and pale in colour (Figure 3.13 A, B and C) where
as in An. funestus-like, the band are at the articulations of the tarsomeres and more whitish
(Figure 3.14 A, C and C). No variation was observed within progenies and between
families using this morphological character.
0.000
0.200
0.400
0.600
0.800
1.000
1.200
0.000 0.500 1.000 1.500 2.000
Ratio of palp spots 3+5/4
Rati
o o
f w
ing
sp
ots
8+
10/9
An. funestus like species
An. funestus species combined
p=0.893
Page 87
86
Figure 3.13 Female Anopheles funestus tarsomeres fore (A), mid (B) and hind (C) legs
with apical pale bands on joints
Figure 3.14 Female Anopheles funestus-like tarsomeres fore (A), mid (B) and hind (C)
legs with whitish spots on joints
Page 88
87
3.4 Discussion
Female characters deemed to be of greater taxonomic significance by De Meillon et al.
(1977) were investigated in this study in an attempt to morphologically discriminate An.
funestus-like from An. funestus. The specimens examined were all reared in the same
insectary under standard insectary conditions. Irrespective of the 11 year difference
between the F1 progeny at time of analysis, both species show similarity in the
morphological characters studied.
3.4.1 Wing length measurement
Statistically significant differences in mean wing lengths observed for each population of
mosquito facilitated their discrimination using this character. Wing length measurements
can be used to separate Anopheles funestus-like from An. funestus originating from
Madagascar. However, this character could only partially separate An. funestus-like and
An. funestus from Malawi or the two An. funestus populations. The wild females for An.
funestus-like and An. funestus from Malawi examined in this study were sympatric at
Wowve and were collected during similar seasons but at different times (2 year interval).
The natural environmental conditions for the parents and the insectary conditions for the
progeny were similar. This probably allowed both species of mosquitoes to be of the same
body size which has been shown by other investigators to correlate to wing length (Lyimo
and Takken, 1993). The fact that An. funestus from Madagascar could be completely
separated from An. funestus-like and only partially separated from An. funestus from
Malawi, may suggest that geographic location contributes to the difference observed or
might be due to larval diet when F1 progeny were reared.
Page 89
88
3.4.2 Wing morphology
Female Anopheles funestus wing colour has been described as predominantly dark by
Gillies and De Meillon (1968). In this study the wing colour for An. funestus-like was more
brownish and served as an identification character. Though the costal black spot 3 and 4
colour intensity has not been reported, this study showed that an over whelming majority
of the An. funestus females had both spots equally shaded. This feature was however
different in all specimens of An. funestus-like analyzed as the costal black spot 3 was
darker than costal spot 4. The wing fringe pale spots in An. funestus-like were indistinct
compared with the distinct spots in An. funestus.
3.4.3 Wing spot and palpal ratios
Separation of Anopheles funestus-like from An. funestus using wing spot ratio was
unsuccessful. All wing spot ratio values for An. funestus-like fell within the range of the
An. funestus wing spot ratio of. However, any An. funestus specimens with wing spot ratio
above 1.2 can be discriminated from An. funestus-like which had this value as it highest
wing spot ratio.
Palpal index remains a vital morphological character for discriminating species of
anophelines. It was employed by De Meillon and Evans (1935) to describe two
anophelines, An. cameroni and An. walravensi from South Africa. In this study, there was
no significant difference in the palp ratio between An. funestus from Malawi and
Madagascar. However, mean palp ratio was significantly different for An. funestus-like and
An. funestus but unfortunately produced a huge overlap of 83.5% for the values. This
leaves the use of palpa ratio unsuitable for discriminating these species.
Page 90
89
The simultaneous use of two characters to separate insect species is not new. Palp band
ratio and wing spot ratio have been shown to be highly discriminatory. It has been used to
separate Anopheles funestus from An. aruni? (now referred to as An. vaneedeni) without an
overlap between the two species (De Meillon et al., 1977). Though in this study such an
attempt failed to separate An. funestus-like from An. funestus, it did produce a more
reliable separation tool than using each of these ratios individually. The percentage overlap
resulting from this application was much lower compared to that obtained using other
characters. Overlap using this character was also observed on separating An. vaneedeni and
An. funestus by Gillies and Coetzee. (1987).
3.4.4 Leg morphology
The black leg colour for An. funestus and the brown colour for An. funestus-like were
discriminatory at a high degree and proved to be useful. A few samples could not be
analyzed as the legs were damaged. The pale spots on the joints of the legs looked to be a
promising character for separating these species.
The use of coloration of wing spots and legs is subjective and may not be useful in the field
where reference specimens would not be available for comparison of wild specimens.
Unfortunately, there was insufficient time to look for discriminating characters at larvae
stage for An. funestus-like.
3.5 Conclusion
Morphological discrimination of members of the Anopheles funestus group has been
difficult. This is attributed to the degree of overlap in morphological characters exhibited
within this group. The present study showed that a combination of characters is required to
Page 91
90
separate An. funestus from An. funestus-like. Scatter plot analysis of wing spot and palpal
ratios proved to be the most discriminatory method for these species. Because it was
sometimes difficult to ascertain observed differences in some samples, this study will
recommend the use of mosquitoes that has only been dead for an hour for morphological
studies on both species in combination with molecular identification tools developed by
Spillings et al. (2009).
Page 92
91
CHAPTER FOUR
Development of DNA-based molecular assays for the identification of
Anopheles funestus group members including An. funestus-like
4.1 Introduction
Members of the Anopheles funestus group are morphologically similar in their adult stage
(Gillies and De Meillion, 1968; Gillies and Coetzee, 1987), making identification of
species problematic. The difficulty in discriminating malaria vectors from non-vectors can
undermine vector control efforts. Historically, identification was performed by
morphological (Gillies and De Meillon, 1968; Gillies and Coetzee, 1987) and cytogenetic
methods (Green, 1982; Green and Hunt, 1980). Various constraints associated with these
techniques led to the search for novel identification methods. DNA-based molecular
approaches based on PCR have superseded the older identification methods over the last
decade (Koekemoer et al.,2002 and Bass et al., 2007b).
A „gold standard‟ Allele specific-Polymerase Chain Reaction (AS-PCR) protocol by
Koekemoer et al. (2002), which can be used to identify all five species in the An. funestus
group, failed to identify samples morphologically identified as An. funestus s.l, collected
resting indoors in Malawi. Following sequencing of the internal transcribed spacer 2
(ITS2) region of rDNA, cytogenetic evaluation of polytene chromosomes and
crossbreeding experiments, Spillings et al. (2009) showed that the unidentified specimens
are a new species which is provisionally named An. funestus-like. Efforts detailed in
Work has been published in Malaria Journal. See Appendix VII, page 167
Page 93
92
Spillings et al. (2009) to develop a multiplex PCR assay to discriminate An. funestus group
members from An. funestus-like based on the ITS2 regions proved difficult due to overlap
in diagnostic fragment (PCR product) size. These findings highlight the need for a better
identification assay which can identify all members of the An. funestus group including An.
funestus-like. High throughput real-time PCR techniques have recently been used for
species genotyping and brief descriptions of some of the commonly used methods are
presented below.
4.1.1 Melt Curve Analysis (MCA)
This technology uses SYBR Green I dye which intercalates into double stranded DNA
(dsDNA) produced after PCR (Lekanne et al., 2002). The resulting effect is 100 fold
increase in fluorescence when bound to the DNA than when it is unbound. Subjecting the
PCR products to increasing temperature results in denaturisation and hence a decrease in
fluorescence as the dye is released. Plotting a negative first derivative of the collected
fluorescence against temperature results in melt peaks with characteristic melting
temperatures (TM). The TM is highly dependent on factors such as GC content, length and
sequence of the amplicon. SYBR Green popularly used in MCA has some limitations.
These include its ability to bind to non-specific products, redistributing during melting,
inhibiting amplification at high concentration (Monis et al., 2005) and a preference for
DNA with high TM for binding (Giglio et al., 2003). In addition, it is also unable to detect
a difference in TM of 0.2 degrees between samples.
4.1.2 High Resolution Melt analysis (HRMA)
High resolution melting analysis can be used to discriminate between DNA fragments that
differ at sequence level. Firstly, PCR is used to amplify a region of interest in the presence
Page 94
93
of fluorescence dyes such as SYTO9. The dye intercalates in the PCR products and
produces fluorescence. A HRM analysis is then performed. HRM involves a stepwise
increase in temperature resulting in dissociation of dsDNA into single strands with a
decrease in fluorescence as the dye is released. The shape of the melt curve of fluorescence
against temperature is characteristic for a particular sample (Liew et al., 2004). This
technique has been used by Bass et al. (2007a) to detect both the West (L1014F) and East
(L1014S) African kdr mutations in An. gambiae.
4.1.3 TaqMan PCR (Hydrolysis probe assay)
This assay relies on the 5‟- 3‟ exonuclease activity of Taq DNA polymerase, which
degrades species-specific probes labelled with a reporter and a quencher dye during PCR
polymerization. The released reporter dye, when free from the quenching effect of the
quencher dye, produces fluorescence which is monitored in real-time (Lyamichev et al.,
1993). This technique has been successfully used to distinguish between the main malaria
vectors An. arabiensis and An. gambiae s.s from closely related non-vectors or minor
vectors (An. quadriannulatus, An. melas and An. merus) (Bass et al., 2007b). The
Hydrolysis probe assay is advantageous over the conventional PCR technique in that it is
fast, more efficient and safe. The disadvantages of this technique are that the probes and
the real-time equipment are very expensive. The rDNA gene has been of interest in
molecular diagnostics partly because it is present in hundreds of tandem repeats per cell
nucleus in multicellular organisms as well as bacteria.
4.2 Structure of ribosomal DNA (rDNA) gene
The ribosomal deoxyribonucleic acid (rDNA) genes in eukaryotes are transcribed to
ribosomal ribonucleic acid (rRNA). Ribosomal RNA constitutes the greatest portion of
Page 95
94
cellular RNA. To produce this large amount of rRNA, the rDNA gene is present in
multiple transcriptional units or tandem repeats separated from each other by non-
transcribed intergenic spacers (NTS) (Beckingham, 1982). Each repeat consists of 18S,
28S and 5.8S (S = Svedberg sedimentation value) and is separated from the next repeat by
two external transcribed spacers (ETS) and a non-transcribed spacer (NTS) Figure 4.1
(Hwang and Kim, 1999). Both the ETS and the NTS form the intergenic spacer (IGS) and
are highly variable. This makes the IGS a suitable candidate for designing species-specific
assays even though it is of great size compared to the smaller internal transcribed spacer
(ITS) region. The functions of the ETS and NTS regions are unclear (Van der Sande et al.,
1992). The 18S and 5.8S genes are separated by the ITS1 and the 5.8 and 28S by ITS2.
The ITS region has a high mutation rate compared to the coding regions and is therefore
useful for distinguishing closely related species. The 28S subunit varies in length
depending on organism due to contraction or expansion of variable joining sequences
located at 10-12 specific points. These sequences have been referred to as variable
divergent or D domains (Gonzalez et al., 1985).
Figure 4.1 Schematic representation of a transcription unit of eukaryotic rDNA with
tandem repeats of 18S, ITS1, 5.8S, ITS2, and 28S. (Modified from Hwang and Kim, 1999;
Hunter et al., 2007)
Page 96
95
4.3 Aim and objectives
Accurate identification of disease transmitting mosquitoes remains an integral part of any
effective vector control program. The aim of this study was to investigate the use of
multiplex PCR assays (real-time PCR-based assays and conventional PCR) for the
identification of members of the An. funestus group. The specific objectives were:
4.2.1 To design new species diagnostic assays including real-time PCR and Allele Specific
PCR (AS-PCR) for An. funestus group identification. The following real-time PCR assays
were investigated: Melt Curve Analysis, High Resolution Melt, TaqMan single nucleotide
polymorphism (SNP) genotyping (hydrolysis probe assay).
4.2.1 To investigate the development of an allele specific (AS)-PCR from the larger more
variable IGS region.
4.4 Materials and Methods
Mosquito samples, DNA extraction and quantification
Mosquito specimens collected from various localities in Ghana, Mozambique and South
Africa were used in this study. DNA for the initial optimization of each real-time assay
was extracted using either the Livak et al. (1984) or Collins et al. (1987) methods. For AS-
PCR based on the IGS sequence, DNA was extracted from mosquitoes collected from
Malawi using a DNA extraction prepGEMTM
insect kit (ZyGEM, New Zealand, PIN0050).
Detailed DNA extraction methods are provided in Appendix II A. All DNA concentrations
and qualities were determined by absorption at 260nm using a NanoDrop ND-1000
spectrophotometer (NanoDrop Technologies-Wilmington, USA). DNA samples with a
260/280 ratio greater than 1.7 were classified as pure DNA and those with a lower ratio
Page 97
96
were considered contaminated with proteins. Only pure DNA samples were used for
analysis.
Mosquito identification
Control mosquitoes were identified as belonging to the An. funestus group by using the
morphological keys of Gillies and Coetzee (1987). The mosquitoes were further identified
to species level using the assay of Koekemoer et al. (2002). Anopheles funestus-like were
identified using the protocol of Spillings et al. (2009). The methodologies for both
molecular identification methods are provided in Appendix II B and C. The species-
specific primers used in these assays produce diagnostic amplicons of distinct sizes Table
4.1.
Table 4.1 Polymerase chain reaction (PCR) primers and sizes of the amplified products for
a species-specific diagnostic test for the An. funestus group
Species Primers Primer sequence (5‟- 3‟) Product
size
An. funestus group UV TCT GAA CTG CAG GAC ACA T -
An. funestus FUN GCA TCG ATG GGT TAA TCA TG 500 bp
An. vaneedeni VAN TGT CGA CTT GGT AGC CGA AC 550 bp
An. funestus-like FUN-LIKE GTT TTC AAT TGA ATT CAC CAT T 440 bp
An. rivulorum RIV CAA GCC GTT CGA CCC TGA TT 400 bp
An. parensis PAR TGC GGT CCC AAG CTA GGT TC 250 bp
An. leesoni LEES TAC ACG GGC GCC ATG TAG TT 153 bp
Page 98
97
Real-time PCR assays were designed based on the ITS2 regions of ribosomal DNA gene
sequences. Sequences for different species of the An. funestus group, available from the
National Centre for Biotechnology Information (NCBI) data base, were obtained and
aligned using DNASTAR lasergene 7 MegAlign in order to design species-specific
primers and probes.
4.4.1 Development of real-time based PCR
Costing for real time assays consumables were calculated in 2009 and are given in US
dollar. Each of the assays requires 1 hour 30 minutes to perform.
4.4.1.1 Melt Curve Analysis assay
For this assay, the original primers of Koekemoer et al. (2002) were used except for the
VAN and FUN primers, specific for An. vaneedeni and An. funestus respectively, which
were replaced by VAN3 and FUN1 primers. Redesigning of the primers was necessary to
ensure that amplicons with distinct optimal melting temperatures were generated during
PCR. A 20µl PCR reaction mixture consisting of 1µl genomic DNA, 10µl SensiMixTM
(Quantace), 0.4µl SYBR Green 1 (Quantace) and 250nM of each primer (UV, FUN1,
LEES, VAN3, PAR and RIV) was prepared. PCR was performed using a Rotor-Gene 6000
(Corbett Research) thermal-cycler under the following cycling conditions: One cycle of
95ºC for 10 minutes followed by 40 cycles of 95ºC for 15 seconds, 55ºC for 30 seconds
and 72ºC for 30 seconds. The PCR products were immediately subjected to a melting step
of 72-95ºC rising by 1ºC and holding for 90 seconds for pre-melting for the first step and 5
seconds for each of the subsequent steps. Changes in the fluorescence of SYBR Green 1
during PCR and melt steps were acquired on the green channel of the PCR machine.
Page 99
98
4.4.1.2 High Resolution Melt (HRM) assay
HRM was performed using the primers of Koekemoer et al. (2002). The PCR reaction
(25µl) consisted of 12.5µl SensiMix HRM kit, 200nM of each primer, 1µl Eva Green dye
and 1µl genomic DNA. PCR was run in a Rotor-Gene 6000 under the following cycling
conditions: A cycle of 95ºC for 10 minutes, 40 cycles of 95ºC for 15 seconds, 56ºC for 30
seconds and 72ºC for 30 seconds. After PCR, the products formed were subjected to a
melting step, consisting of a 77-94ºC rise in 0.1ºC increments followed by holding for 90
seconds for pre-melting and a subsequent 2 seconds for each step. Changes in fluorescence
of Eva Green dye were monitored on the green channel during the PCR and melting phase.
4.4.1.3 Hydrolysis probe assay
Ribosomal DNA gene alignment produced species-specific sequences for the design of
species-specific probes. The alignment unfortunately failed to produce common regions for
the design of a universal forward and reverse primer. As a consequence, the universal and
species-specific primers of Koekemoer et al. (2002) were used except for the primers
specific for An. parensis and An. vaneedeni. The sequence over which both primers
annealed were between their corresponding species-specific probe annealing sites and the
universal primer‟s binding site. Conventionally, hydrolysis probe binding sites should be
located between the forward and reverse primers needed for amplification of a target
sequence. These primers were replaced by designing two new primers (new PAR and
VAN1 diagnostic for An. parensis and An. vaneedeni respectively) (Table 4.2).
Each species-specific probe was designed to anneal to a sequence between the universal
forward primer and a corresponding species-specific primer (Figure 4.2).
Page 100
99
Figure 4.2 Design of the hydrolysis probe assay for the identification of members of the
An. funestus group
Probes designed to anneal over sequences with two or less species-specific single
nucleotide polymorphisms (SNPs) were designed as minor groove binder (MGB) probes
(Applied Biosystems). MGB‟s increase the melting temperature between matched and mis-
matched probes (Afonina et al., 1997) and were designed using primer ExpressTM
Software
Version 2.0 (Applied Biosystems). Probes annealing over sequences with more than two
species-specific SNPs were manually designed and synthesised as dual-labelled probes by
Thermo Fisher Scientific or Biosearch Technology. Each probe was labelled at its 5‟ end
with a reporter dye and at the 3‟ end with a quencher dye (Table 4.2).
Page 101
100
Table 4.2 Primers and probes used in the identification of An. funestus group species using
the hydrolysis probe assay
Name Primer/
Probe
Reporter
dye
Sequence (5’-3’) Quencher
VAN1 Primer _ AAACCCCAAGATGTGCTCC _
New PAR Primer _ ATACTTGTGTGTGTGTGTATTTG _
RIV TM Probe Cy5 CTATGGCGAGACCCCGTCTAGTG BHQ2a
FUN TM Probe ROX CATGGGGAAATTCAATCGAAAACCTCT BHQ2a
PAR TM Probe VIC CGGAACCTAGCTTGG MGBNFQb
VAN TM Probe Quasar
706
CGTTGTGAAAAATGGAGATTCATTTGAAAA
CC
BHQ2a
LEES TM Probe 6-FARM CCGACCGATGTACA MGBNFQb
4.4.2 Analytical sensitivity of developed the hydrolysis probe assay compared to allele
specific PCR
The DNA concentrations of five species of mosquitoes (An. funestus, An. rivulorum, An.
parensis, An. leesoni and An. vaneedeni) were measured on a NanoDrop ND-1000
spectrophotometer and diluted to 20ng/µl. These were then serially diluted down to a 1 in 1
X 106 dilution. DNA (1µl) of the representative dilution was used as a template in AS-
PCR, MCA, HRM and hydrolysis probe assays. AS-PCR was performed according
Koekemoer et al. (2002) with minor modifications. The final reaction volume was changed
from 13.5µl to 14µl and ready made PCR master mix was used. The 14µl reaction volume
contained 6µl of ReddyMix PCR master mix (Thermo fisher scientific, UK) and 0.24µM
of each primer. The thermal cycling conditions were unchanged. For real-time PCR, the
reaction volumes and cycling conditions were as optimised. Analytical sensitivity was
defined as the lowest DNA concentration that displayed a detectable fluorescence which is
above the cycle threshold (Ct) for the hydrolysis probe assay. For AS-PCR, analytical
sensitivity was considered as the lowest DNA concentration with a diagnostic band
observable on an agarose gel.
Page 102
101
4.4.3 Determination of assay performances in a blind trial
The performance of the real-time assay and AS-PCR of Koekemoer et al. (2002) was
assessed in a blind trial by identifying samples whose identities were kept blind prior to the
test. Samples tested (n = 96) consisted of DNA from An. funestus (n = 26), An. parensis (n
= 23), An. rivulorum (n = 13), An. leesoni (n = 19), An. vaneedeni (n = 10), water (n = 1)
and Plasmodium species (n = 4). DNA samples were of variable quality and quantity. The
numbers of correct scores, failed reactions and miscored samples were recorded and
compared for each assay.
4.4.4 Robustness and validation of the hydrolysis probe assay
Genomic DNA samples extracted between the years 2001-2010 from mosquitoes from
different regions across Africa (Zambia, Malawi, South Africa, Congo and Mali) were
obtained from collections stored at -80ºC. These specimens, which had previously been
identified using the morphological keys of Gillies and De Meillon (1968) and the AS-PCR
protocol of Koekemoer et al. (2002) as belonging to the An. funestus group, were re-
identified using the hydrolysis probe assay. The percentage of samples with the same
identity from both assays was calculated.
Page 103
102
4.4.5 Development of New Allele Specific-PCR assays
4.4.5.1 Primer design for the amplification of the rDNA IGS region
To obtain sequence information of the IGS region for members of the An. funestus group,
known sequences of the 18S and 28S subunits of rDNA genes from insects closely related
to the An. funestus group were obtained from the NCBI website. The 18S sequences of
rRNA genes for Drosophila melanogaster (GI: 158246), An. gambiae (GI: 103421630),
Aedes aegypti (GI: 169930869) and Culex quinquefasciatus (GI: 66269563) were obtained
and aligned using DNASTAR lasergene 7 MegAlign. Primers were preferably designed
from regions with greatest sequence homology between two or more species. A 23-mer
reverse primer designated IGS Rev was designed from An. gambiae and C.
quinquefasciatus sequences and was positioned 80bp from the 5‟ end of the 18S gene
(Figure 4.3). The forward primer, IGS Forward 1, was designed 145bp downstream of the
3‟ end of the 28S gene of D. Melanogaster.
Figure 4.3 Schematic diagrams showing a partial rDNA gene with positions of primers
and alignment of the An. albimanus 18S gene with partial IGS sequence.
Page 104
103
The IGS sequence for An. funestus obtained after sequencing PCR products, generated
using the IGS Forward 1 and IGS-Rev primers, was aligned with the An. albimanus 18S
gene sequence. The 5‟ end of the An. albimanus 18S gene sequence overlapped by 102bp
with the An. funestus 18S sequence. A second reverse primer IGS Rev 2 was then designed
48bp from the An. albimanus 18S gene sequence. The last primer, IGS forward 4, was
designed from the An. fuenstus IGS region. Apart from the An. gambiae universal primer
(UN) of Scott et al. (1993), all other primers were designed with the aid of fermentas
REviewerTM
and synthesized by Inqaba biotec, South Africa. Details of primers are found
in Table 4.3.
Table 4.3 Primers used in the amplification of the partial IGS region of the An. funestus
group.
* Universal primer (UN), originally designed by Scott et al. (1993).
4.4.5.2 Optimization of PCR for the amplification of the rDNA IGS region
A 50µl PCR reaction consisted of the following: 1 X LA buffer (Takara biomedical group
Shiga Japan, Cat. No. KA3701DA), 0.4mM dNTPs, 0.5µM of each primer pair, 2.5U of
LA Taq DNA polymerase and 50-100ng genomic DNA. The MgCl2 concentration for
reactions in which DNA from An. funestus, An. leesoni, An. rivulorum and An. funestus-
Species Name of primer 5’-3’primer sequence TM (ºC)
An. funestus IGS Forward 1 TTC GAT CAC CTG ATG CCG C 62.00
IGS Rev TAC TGA GCC TTA TGC GGT TTC AC 62.77
An. vaneedeni
An. parensis
IGS Forward 4 CAC CTG ATG CCG CAG GTT G 64.48
IGS Rev 2 CTA CTT AGA CAT GCA TGG C 58.01
An. rivulorum UN* GTG TGC CCC TTC CTC GAT GT 58.3
IGS Rev TAC TGA GCC TTA TGC GGT TTC AC 62.77
Page 105
104
like was used as the template was 2mM while for An. parensis and An. vaneedeni, the
MgCl2 concentration was 3mM and 2.5mM respectively. The PCR cycling conditions were
as follows: 1 cycle initial denaturation at 94°C for 1 minute, 30 cycles of denaturation at
98°C for 5 seconds, annealing temperature (56°C for 30 seconds for An. funestus and An.
funestus-like, 38°C for 30 seconds for An. vaneedeni, and An. rivulorum; 46°C for 30
seconds for An. parensis), extension at 68°C for 15 seconds. This was followed by a final
extension at 72°C for 10 minutes. A no template control consisting of only PCR mix was
included for each reaction. The reverse and forward primer pair used in this assay to
amplify products in each species are provided next to the species in Table 4.3.
A volume of 10µl of PCR products was mixed with 3µl ficoll loading dye and loaded into
the wells of a 1% (W/V) SeaKom® LE agarose (Lonza, Rockland USA, 50004) 1 X TAE
(Tris acetic acid EDTA) gel pre-stained with 0.5µg/ml of ethidium bromide.
Electrophoresis of products was performed in a 1 X TAE buffer (Appendix I B ) using a
Bio-Rad PowerPac 300 power supply at 90V, 400mA for 50 minutes. Amplification
products were visualised with an ultraviolet (UV) transilluminator system (Vacutec, G-
BOX from Syngene) and the image captured. The amplicon sizes were estimated by
comparison to the standard band size of a 10Kb HyperLadder TM
I (Bioline, USA, BIO
33053).
4.4.5.3 Cloning, screening and sequencing of IGS products
The IGS PCR products generated were either gel purified using QIAquick gel extraction
kit (QIAGEN, South Africa, 28707) (Appendix II F) or directly used in a ligation reaction
(Appendix IIH). Ligation is the process whereby an insert (PCR product) is annealed into a
vector by phosphodiester bonds. Forming of the bond by joining the 3‟ hydroxyl and 5‟
Page 106
105
end of nucleic acids is controlled by the enzyme DNA ligase. The recombinant DNA
formed during ligation was used to transform JM109 chemical competent cells (Appendix
III).
Transformation is the introduction of plasmids into chemically competent cells. These cells
have been treated such that their membrane becomes permeable to the plasmids
(recombinant DNA). They were obtained from Lucigen, Middleton Cat. No 60107-2.
Ligation and transformation were performed using the pGEM-T Easy vector kit (Promega,
USA, A1360) following the manufacturer‟s instructions. The preparation of transformation
solutions are given in Appendix I E. Transformed competent cells were plated on luria
broth (LB) agar/ampicillin/IPTG/ X-gal plates (Appendix II I). The plates were incubated
at 37ºC overnight and white colonies were screened for inserts. Three controls (two
positive and one negative) were included during cloning. The first positive control, a
ligation control consisting of a known insert together with all ligation reagents and
competent cells was provided in the kit. The control template ligates into the pGEM-T
Easy vector and produces white colonies after transformation and incubation. The second
positive control was a transformation positive control for the determination of
transformation efficiency. It consisted of a closed super-coiled plasmid (pUC19 DNA) and
JM109 E. coli competent cells. This control should produce many white colonies after
plating. The negative control consisted of all ligation reagents except an insert and was
expected not to produce any colonies. It was used to identify contamination in the cloning
process.
Page 107
106
i) Screening of clones with insert by colony PCR
Screening was performed to determine whether the recombinant plasmids contained the
correct insert. Some 350 white clones were selected for screening from LB agar plates
(Appendix II G). Using a sterile yellow tip, colonies were scraped from the agar plate and
the tip stirred in 25µl PCR mix. The tip was also stirred in 500µl 50µg/ml AMP/LB
solutions in a 1.5ml eppendorf tube and incubated overnight at room temperature in a
Labcon shaking incubator (Labcon, South Africa, Model FSIE 5P08). Glycerol solution
was added to the culture to a final concentration of 30%, properly mixed and stored at -
70ºC for future analysis. The PCR mixture consisted of all reagents used to generate the
insert except for the primers which were replaced with 0.24µM each of SP6 and T7
primers specific for pGEM-T Easy vector.
The colony PCR cycling conditions consisted of an initial denaturation of 94°C for 2
minutes followed by 25 cycles of denaturation at 94°C for 30 seconds, annealing at 56.5ºC
for 30 seconds and 72°C extension for 30 seconds. A final extension was performed at
72°C for 10 minutes and the reaction held at 8°C until they were removed from the
thermo-cycler. A total volume of 3µl of the colony PCR product was mixed with 2µl ficoll
loading dye (Appendix IB) and analysed on a 1% TAE agarose gel as described
previously (section 4.4.5.2). The colony PCR product (10µl) with the correct insert was
sent for sequencing to Macrogene, (South Korea). Sequencing was done in both directions
using T7 and SP6 primers. At least two PCR products of the same size from different
clones originating from the same ligation and transformation reactions were sequenced to
confirm the identity of the insert.
Page 108
107
4.4.5.4 Analysis of IGS sequences for species-specific PCR design
Electropherograms and sequences for PCR products were obtained on the Macrogene
website (http://dna.macrogene.com) and manually edited using Chromas lite version 2.0.
PCR products in most cases were between 1500 and 3000bp, and only a read length of
900bp of sequencing data can reliably be obtained. The forward and reverse primer
sequence for each product was therefore analysed separately. The cloning vector sequence
was removed from the sequences and the portion of sequence belonging to the PCR
product was blasted in the NCBI website (http://blast.ncbi.nlm.nih.gov). Only reverse and
forward sequences that aligned with rDNA 18S or 28S genes respectively for anophelines,
or drosophila species and gave the highest percentage similarity were selected for analysis.
For each species, selected forward or reverse sequences were aligned together using
DNASTAR lasergene SeqMan 2007 version and a consensus sequenced generated. The
consensus sequences for reverse and forward sequences were aligned with An. albimanus
rDNA 18S and 28S gene sequences respectively. This allowed determination of the IGS
region that has been sequenced for each species. The IGS sequences obtained for different
species were aligned for species-specific primer design Table 4.4.
Page 109
108
Table 4.4 Species-specific primers for the identification of members of the Anopheles
funestus group.
Species Primers Primer sequence (5‟- 3‟) Product
size
An. funestus group UN18S-IGS-
Rev
TTACTGGTAGGATCAACCAG -
An. funestus FUNIGS GCTTGAGCCCCTGAATAAGGG 630bp
An. vaneedeni VANIGS CATAATACGAAGGCAGCGCTGTC 554bp
An. parensis PARIGS CAAGTGGAACCAATTGATAG 363bp
An. rivulorum RIVIGS GATAATAGGGACCCGGGAGC 213bp
4.4.5.5 Optimisation of Allele Specific PCR based on the IGS region of an rDNA gene
Each species-specific primer was used together with the universal primers (UN18S-IGS-
Rev) in a PCR and the reaction optimised for the formation of single PCR products. The
size of each product was confirmed by comparison with a standard DNA molecular ladder.
A multiplex PCR containing all the individual primers in a single reaction was optimised.
A 13.5µl volume of this reaction mixture consisted of 1 X Buffer, 0.23mM of each dNTP,
1.2mM MgCl2, 0.17µM of primer RIVIGS, 0.24µM each of primer UN18S-IGS-Rev,
FUNIGS, VANIGS and PARIGS, 0.5U Taq DNA polymerase and 1 µl DNA. The PCR
cycling conditions consisted of an initial denaturation of 94°C for 2 minutes followed by
35 cycles of denaturation at 94°C for 30 seconds, annealing at 55ºC for 30 seconds and a
72°C extension for 40 seconds. A final extension was performed at 72°C for 10 minutes.
PCR products (10µl) were mixed with 3µl ficoll loading dye and loaded into the wells of a
2.5% ethidium bromide stained agarose gel submerged in a 1 X TAE buffer. The first well
of the gel was loaded with GeneRularTM
100bp DNA ladder (Fermentas, USA, SM0242)
Page 110
109
from which PCR product sizes were determined. The second well was used as a negative
control and the rest of the wells were used for test samples. Electrophoresis of products
was performed using a Bio-Rad PowerPac 300 power supply at 110V, 400mA for 1hr: 30
minutes. Amplification products were visualised and images captured as previously
described (section 4.4.5.2).
The optimised AS-PCR was validated by re-identifying 114 DNA samples from Zambia,
Malawi, Mali, Mozambique, DRC, South Arica, Ghana and Uganda belonging to the An.
funestus group. The samples were previously identified as An. funestus (n = 97), An.
rivulorum (n = 39), An. parensis, An. vaneedeni and An. leeseoni using the protocol of
Koekemoer et al. (2001) and the hydrolysis probe assay developed in this study. The
percentage match in identity was calculated in order to validate the performance and
accuracy of this assay.
4.4.6 Restriction fragment length polymorphism of the Anopheles funestus-like and
An. funestus rDNA D3 region
The 28S domain 3 (D3) of rDNA for An. funestus and An. funestus-like was amplified and
analysed according to the protocol of Garros et al. (2004) with minor modifications.
Briefly, a 25µl reaction volume consisting of: 1 X reaction buffer, 1.5mM MgCl2, 1µM
each of D3A and D3B primers (Koekemoer et al., 1998), 0.2µM dNTPs, 2U Taq DNA
polymerase and 1µl DNA template. The PCR cycling conditions consisted of: 1 cycle
initial denaturation at 94ºC for 3 minutes; 30 cycles of denaturation at 94ºC for 30
seconds, annealing at 45ºC for 40 seconds, extension at 72ºC for 40 seconds and a final
extension of 72ºC for 10 minutes. A negative control to rule out experimental errors
consisted of all reagents except DNA. PCR product (5µl) was subjected to electrophoresis
Page 111
110
(100V, 400mA, for 1hr) on a 2.5% TAE agarose gel stained with ethidium bromide. The
gel was visualized and images captured as described in section 4.4.5.2. PCR product sizes
were determined by comparison to standard band sizes of a GeneRularTM
100bp DNA
ladder (Fermentas, USA, SM0242).
Digestion of PCR products was carried out in a 20µl reaction volume consisting of: 12.3µl
of sterilised distilled water, 2µl Buffer A, 0.2µl BSA, 5µl PCR amplified product and
0.25µl Hpa II restriction endonuclease. The buffer, BSA and enzyme were supplied by
Promega, USA (Cat. No. R6315). The digestion mixture was incubated at 37ºC for 2 hours
using a thermo-cycler. The digest (10µl) was mixed with 4µl ficoll loading dye and loaded
into the wells of a 3% TBA agarose gel stained with 0.5µg/ml ethidium bromide. The
loaded gel was then subjected to electrophoresis using a Bio-Rad Powerpac power supply
at 110V, 400mA for 1hour. Post electrophoresis, the remainder of the D3 PCR products
(10µl), representative of the PCR-RFLP patterns observed, were sequenced by Macrogene
(South Korea). In instances where the D3 PCR gave multiple products, the products were
cloned into pGEM-T Easy vectors (Appendix II H and I). Colony PCR was performed and
the products analysed on agarose gels as previously described in section 4.4.5.3 to confirm
the presence of the inserts. The colony PCR products for each fragment were then
sequenced. The Hpa II restriction sites on the sequences were determined and a restriction
map constructed for each RFLP type.
Page 112
111
4.4.7 Phylogenetic relationship of Anopheles funestus-like and other members of the
An. funestus group
The rDNA ITS2 region of An. funestus-like (n = 12), An. funestus (n = 14) and An.
parensis (n = 4) was amplified according to the protocol of Koekemoer et al. (2002) using
genomic DNA. The protocol was slightly modified. A 25µl volume of the PCR mixture
consisted of 1 X reaction buffer, 3mM MgCl2, 0.5µM each of ITS2A and ITS2B primers,
0.205mM of dNTPs, 1U Taq DNA polymerase and 50-100ng DNA template. The PCR
cycling conditions consisted of: 1 cycle initial denaturation at 94ºC for 2 minutes; 40
cycles of denaturation at 94ºC for 30 seconds, annealing at 50ºC for 30 seconds, extension
at 72ºC for 40 seconds and a final extension of 72ºC for 10 minutes. PCR product (5µl)
was analysed on a 2.5% TAE ethidium bromide stained agarose gel as described in section
4.3.2.4 (i). PCR products were sequenced in both directions using the ITS2A and ITS2B
primers by Macrogene (South Korea). The ITS2 and D3 sequences were aligned separately
using BioEdit and saved as a fasta file. The sequences were imported into MEGA 5 for
phylogenic analysis. To assess intraspecific variation within the An. funestus-like
population, the ITS2 sequences were compared with one another.
4.5 Results
Mosquito identification
Species re-identifications of each sample matched their corresponding previous
identifications. Figure 2.1 in chapter 2 shows diagnostic PCR products for the
identification of a set of An. funestus group samples. Anopheles funestus-like was not
successfully discriminated from the other members of the An. funestus group using real-
time based PCR and was therefore not included in results.
Page 113
112
4.5.1 Development of real-time based PCR
4.5.1.1 Melt Curve Analysis
The species characteristic melt curves produced by An. leesoni, An. vaneedeni, An.
rivulorun, An. parensis and An. funestus s.s. are shown in Figure 4.4 which was obtained
by plotting a negative first derivative of fluorescence against temperature. The negative
control produced a slight increase in fluorescence at late cycles during PCR optimisation
which was reduced by decreasing cycling number.
Figure 4.4 Identification of members of the An. funestus group by melt-curve real-time
PCR analysis. In this example five to seven specimens of An. rivulorum (red trace), An.
leesoni (blue trace), An. funestus (brown trace), An. parensis (green trace) and An.
vaneedeni (pink trace) were tested. A plot of negative first derivative of the collected
fluorescence against temperature results in melt peaks with characteristic melting
temperatures.
Attempts to include An. funestus-like in the MCA assay were unsuccessful. The melt curve
obtained for this species was indistinguishable from that of An. funestus. The redesigning
of primers did not produce a distinct melt curve for An. funestus-like, and this species was
excluded from the assay.
deg.
75 80 85 90 95
dF
/dT
30
25
20
15
10
5
0
Page 114
113
Variability of melting temperature in the Melt Curve assay
The average melting temperatures of 10 replicate PCR samples for each species subjected
to MCA are shown in Figure 4.5. Anopheles leesoni gave the lowest melting temperature
and An. rivulorum the highest. Melting temperature variation was observed within
replicates for all species except An. funestus where it was constant. Anopheles vaneedeni
showed the greatest variation with a minimum and maximum melting temperature of
84.5°C and 86.5°C respectively.
Figure 4.5 Average melting temperatures and standard deviations for fives species of the
An. funestus group.
Owing to difficulties encountered in differentiating An. vaneedeni from An. parensis and
An. funestus, this assay was not pursued further. Instead, high resolution melt was
investigated.
82
83
84
85
86
87
88
89
90
Anopheles funestus group
Me
ltin
g t
em
pe
ratu
re (
TM
) in
de
gre
es
An. leesoni
An. parensis
An. vaneedeni
An. funestus
An. rivulorum
Page 115
114
4.5.1.2 High Resolution Melt
Figure 4.6 shows a normalized plot as well as a difference plot generated from the
associated Rotor-Gene Software (version 1.7) for several representative specimens of each
species. The normalized plots (Figure 4.6 A) initial fluorescence signal for the pre-melt
stage was fixed at 100% and the final fluorescence at the post–melt stage at 0%. The
species specific curves of the normalized plot are not vastly distinct from each other.
Figure 4.6 (B) shows the normalized data using a difference plot. This alternative analysis
highlights the deviations between the selected genotype (An. vaneedeni) as the standard
and the other samples.
Anopheles funestus-like PCR products produced similar curves to that of An. vaneedeni
based on HRM analysis and was therefore excluded from the assay design. Similar to
MCA, the HRM method, in a blind trial, misidentified some samples including the
misidentification of water as An. funestus and An. rivulorum. The constraints imposed by
MCA and HRM motivated for the investigation of the hydrolysis probe assay which,
though expensive, is well known for its high specificity.
Page 116
115
Figure 4.6 Identification of members of the An. funestus group by High Resolution Melt
analysis. In this example, five to seven specimens of An. rivulorum (red trace), An. leesoni
(blue trace), An. funestus (brown trace), An. parensis (green trace) and An. vaneedeni (pink
trace) were tested. A) Normalised melt curve for different An. funestus group species. B)
Difference plot for samples as in (A) in which An. vaneedeni was selected as the reference
standard.
Page 117
116
4.5.1.3 Hydrolysis probe assay
The hydrolysis probes and primers for the multiplex assay designed in this study
effectively identified all the reference control templates of the five members of the An.
funestus group. A series of preliminary tests were performed for different concentrations of
primers (125nM to 250nM) and probes (100nM to 200nM). That combination of primer
and probe concentration giving optimal fluorescence and the smallest Ct value was
selected for the assay. Figure 4.7 shows an example of using this assay for the
identification of seven to ten samples of each species. Measured increases in the
fluorescence of Cy5 (probe RIV), 6FAM (LEES probe), ROX (FUN probe), VIC (PAR
probe) and Quasar 705 (VAN probe) respectively identified An. rivulorum, An. leesoni, An.
funestus s.s., An. parensis and An. vaneedeni specimens. Though no hybrid was included
here, an increase in two or more of the dyes would indicate a hybrid or a contaminated
sample.
Page 118
117
Figure 4.7 Identification of members of the An. funestus group using the multiplex
hydrolysis probe assay. Seven to ten specimens of An. rivulorun (red trace), An. leesoni (blue
trace), An. funestus (brown trace), An. parensis (green trace) and An. vaneedeni (pink trace)
were tested. (A) Cycling of the RIV probe (Cy5 labelled), (B) cycling of the LEES probe
(6FAM labelled), (C) cycling of the FUN probe (ROX labelled), (D) cycling of the PAR
probe (VIC labelled) and (E) cycling of the VAN probe (Quasar 705 labelled)
Page 119
118
4.5.1.4 Analytical sensitivity of real-time assays and AS-PCR
The sensitivity of real-time PCR and AS-PCR was evaluated using diluted samples from
each of the five species. Only the sensitivity of the hydrolysis probe assay was investigated
because it was the only assay that reliably discriminated between members of the An.
funestus group. The hydrolysis probe had template detection limits of 1 in 1000 dilution
representing 0.02ng DNA. The AS-PCR assay could only detect template up to a limit of 1
in 5 000 dilution, equivalent to 0.04ng of DNA (Figure 4.8).
Figure 4.8 Comparison of analytical sensitivity of real-time PCR and AS-PCR assays for
the detection of An. funestus 20ng/µl stock DNA serially diluted down to a 1 in 1 x 10⁶
dilution. A: Hydrolysis probe assay amplification plot showing concentration of detected
DNA. B: A 2.5% agarose electrophoretic gel stained with ethidium bromide showing An.
funestus AS-PCR single specific bands of 500bp detected DNA. Lane M: Marker; Lane 1:
Negative control (no template); Lane 2: 20 ng/µl; Lane 3: 2 ng/µl; Lane 4: 0.2 ng/µl; Lane
5: 0.04 ng/µl; Lane 6: 0.02 ng/µl; Lane 7: 0.004 ng/µl; Lane 8: 0.002 ng/µl.
Page 120
119
4.5.1.5 Blind species identification trial
Results obtained for four assays in the species identification blind trial are presented in
Table 4.5. These data indicate that AS-PCR followed by the hydrolysis probe assay
produced the highest scores. Misidentification of samples was associated with MCA and
HRM. All four assays failed to identify some samples.
Table 4.5 Performance of four assays in the Anopheles funestus group species
identification blind trial.
AS-PCR MCA HRM Hyrolysis probe
assay
Correct scores 90 84 88 89
Failed reactions 6 4 2 7
Misidentifications 0 8 6 0
4.5.1.6 Validation of the hydrolysis probe assay
The hydrolysis probe assay was the most reliable of the real-time assays for An. funestus
group species identifications and was therefore further investigated. The efficacy of this
assay for rapid screening of large numbers of field collected mosquitoes was assessed by
testing 427 stored DNA samples extracted from field collected mosquitoes. Comparative
results for specimens positively identified by the AS-PCR and hydrolysis probe assays are
presented in Table 4.6. These data indicate 90.4% (n = 427) concordance between the
hydrolysis probe assay and AS-PCR. A total of 9.6% specimens could not be identified
using the hydrolysis probe assay.
Page 121
120
Table 4.6 Detailed results of re-identification of AS-PCR identified An. funestus group
samples using the hydrolysis probe assay.
An. funestus species Number of samples Correct score Failed reaction
An. parensis 14 14 0
An. funestus 321 285 36
An. leesoni 13 8 5
An. vaneedeni 8 8 0
An. rivulorum 71 71 0
427 386 41
None of the real-time PCR assays investigated in this study successfully identified An.
funestus-like together with the other members of the An. funestus group in a single assay
based on the ITS region of rDNA. The IGS region was therefore investigated as an
alternative region from which a cost effective assay could be designed.
4.5.2 Development of Allele-specific PCR assay on the rDNA IGS region
4.5.2.1 Amplification and sequence analyses of Anopheles species rDNA IGS regions
Following PCR amplification of the IGS region, products by species of the An. funestus
group were resolved on a 1% agarose gel. Anopheles rivulorum gave a single product of
1000bp while the other species gave multiple products ranging from 1000 to above 10Kbp
(Figure 4.9).
A
Page 122
121
Figure 4.9 1% agarose gels stained with ethidium bromide showing rDNA IGS generated
PCR products. Lane M: DNA marker; Lane 1: No template negative control. A: (An.
funestus), B (An. rivulorum) and C (An. parensis): Lane 2 (A, B and C): PCR products, D
(An. vaneedeni) Lanes 2, 3 and 4: No amplification, lanes 5-7: PCR products.
i) Cloning and screening of clones
The transformation efficiency obtained during cloning ranged from 2.3 x 10⁷ cfu/µg to 2.9
x 108cfu/µg. A total of 350 colonies were screen for inserts by the colony PCR method. Of
these, 104 colonies had the inserts of interest based on the expected size of PCR product.
ii) IGS sequence analysis
Table 4.7 shows statistical data obtained after blast searches of IGS sequences from
various species of the An. funestus group in the NCBI data base. The IGS sequences
aligned continuously along the length of the sequence for An. funestus clone AF4
microsatellite (AF171034.1) and Aedes aegypti rDNA gene (gb/U65375.1). Due to high
variability in the IGS region, the query (sequence blasted in the data base) coverage by the
hit sequence (sequences submitted and available on the data base) was low, ranging from
6% to 13%. However, the 18S gene sequence produced a high match. The percentage
similarity between the query and the hits ranged from 98% to 100%. The second highest
hit was with An. albimanus (gb/L78065.1) for all sequence blasts. The E-values in Table
4.7 describe the likelihood of a sequence occurring in the data base by chance.
Page 123
122
Table 4.7 Statistical data obtained after blast searches of An. funestus group partial IGS
sequences in the NCBI data base.
A representative partial IGS sequence for An. vaneedeni is presented in Figure 4.10.
Figure 4.10 Partial rDNA gene sequence (IGS region and I8S gene) for An. vaneedeni
obtained from sequencing PCR products with reverse primers.
Alignment of the IGS consensus sequences for four species of the An. funestus group using
DNASTAR-MegAlign is shown in Figure 4.11. The consensus sequences were obtained
from reverse sequences. The portion of the alignment in the blue rectangular box is
homologous to the 5‟ end of the An. albimanus 18S gene sequence.
Query sequence Highest Hit QC E-value Max ID Max scores
An. funestus (1331bp) An. funestus 6% 4e-39
100% 172
An. parensis (545bp) Ae. aegypti 12% 2e-24
100% 122
An. rivulorum (686bp) An. funestus 13% 1e-37
98% 167
An. vaneedeni (588bp) Ae. aegypti 11% 2e-24
100% 122
Page 124
123
Figure 4.11 Alignment of An. funestus group partial IGS sequences. Sequences in the blue
box are identical to the sequence at the 5‟ end of the An. albimanus 18S rDNA gene.
Sequences in the red boxes indicate possible diagnostic species-specific primer sites for
each species. The universal primer is indicated on the consensus sequence.
Page 125
124
PCR products in clones sent for sequencing had sizes ranging from 1Kb to 4Kb.
Sequencing data obtained were between 545bp to 1300bp from reverse sequences.
Analyses of the forward sequences showed that not more than 200bp of sequence data
could be obtained from the IGS region for An. funestus-like. For the other species
investigated, even though sequencing data with read lengths ranging from 500bp to 700bp
were obtained, analyses indicated that the IGS region had not been sequenced.
4.5.2.2 Multiplex AS-PCR based on the IGS region of rDNA
The conserved 18S gene sequence (Figure 4.11) was used for designing a universal reverse
primer. Diagnostic species-specific primers are shown in red rectangle boxes (Figure 4.11)
and were designed from sequences with high variability compared with the other species.
The positions of primers were also chosen such that PCR products with discriminating
sizes are produced.
The optimisation of single AS-PCR for each species resulted in the production a single
diagnostic amplicon each for An. funestus (620bp), An. vaneedeni (550bp), An. parensis
(360bp) and An. rivulorum (200bp) as estimated from agarose gel migration. In the
multiplex PCR, An. funestus, An. rivulorum and An. vaneedeni produced the expected
products. Anopheles parensis however produced the diagnostic 360bp product in addition
to the An. vaneedeni 550bp product (Figure 4.12). A series of Multiplex AS-PCRs, in
which one of the species-specific primers was omitted from each, was set up to determine
the origin of the An. vaneedeni 550bp product. Data showed that in the absence of the An.
vaneedeni specific primer, the An. vaneedeni 550bp product is not formed (Figure 4.12).
Page 126
125
Figure 4.12 1% agarose gel stained with ethidium bromide showing AS-PCR products. A:
Multiplex AS-PCR for identification of An. funestus group species. Lane M: DNA marker;
Lane 1: No template negative control, Lane 2: An. funestus(620bp); Lane 3: An. rivulorum
(200bp), Lanes 4: An. vaneedeni (550bp), Lane 5: An. parensis (320bp diagnostic band and
550bp). B: Multiplex AS-PCR in which each species-specific primer has been omitted.
Lane M: DNA marker; Lane 1 No template negative control; Lane 2: All primers present;
Species-specific primers were absent for Lane 3: FUNIGS primer (An. funestus); Lane 4:
RIVIG (An. rivulorum); Lane 5: VANIGS (An. vaneedeni) and Lane 6: PARIGS (An.
parensis).
iii) Validation of the new AS-PCR
A total of 139 DNA samples belonging to the An. funestus group that had previously been
identified by the AS-PCR of Koekemoer et al. (2002) as well as the hydrolysis probe assay
developed in this study were assayed again using the new AS-PCR. The species identities
of 89.9% (n = 139) of the samples matched those previously obtained. The remainder (13
An. funestus and 1 An. leesoni) could not be identified using the new AS-PCR.
4.5.3 Amplification and sequencing of ITS2 and D3 regions of rDNA
i) ITS2 region of rDNA
Figure 4.13 shows ITS2 amplified products for An. funestus group species. The ITS2
products ranged in size from ≈500 to 850bp and single products were obtained for all
species investigated.
Page 127
126
Figure 4.13: 2.5% agarose gel stained with ethidium bromide for visualising An. funestus
group PCR products. For each gel, lanes 1 and 2 are molecular markers and no template
controls respectively. A: ITS2 products; lane 3: An. vaneedeni (850bp), lane 4: An. leesoni
(500bp), lane 5: An. pareensis (600bp), lane 6: An. rivulorum (500bp), lane 7: An. funestus
(850bp). B: Lanes 3 and 4 An. funestus-like ITS2 products (850bp)
4.5.3.1 Phylogenetic relationship of An. funestus-like with other members of the An.
funestus group based on ITS2 sequences
The phylogentic tree constructed using ITS2 sequences showed a clear clustering of the
individual species in the An. funestus group into six groups (Figure 4.14). Anopheles
funestus-like is more closely related to An. funestus s.s, than to the other members of the
An. funestus group.
1 2 3 4 5 6 7 8
Page 128
127
Figure 4.14 Phylogenetic tree of the An. funestus group based on nucleotide sequences of
the ITS2 region of rDNA (Neighbour joining construction). Funy or FunY= An. funestus
Type Y, FunMW = An. funestus Type MW, FunM = An. funestus Type M, Funlike 1 = An.
funestus-like Type 1, Funlike 2 = An. funestus-like Type 2, An. funITS2 = An. funestus
ITS2, An. vanITS2 = An. vaneedeni ITS2, PAR = An. parensis (36, 14 and 33 are sample
numbers), An. leesITS2 = An. leesoni ITS2, Riv = An. rivulorum (malaf or MALAF plus
number are species labels). An. gambiae ITS2 is used as an outgroup
Alignment of the ITS2 sequences of the An. funestus-like samples for intra-specific
variation investigation suggests that this population is divided into two groups based on
single nucleotide polymorphism (Figure 4.15) with a T/Y, A/T or G/A substitution. The
IUPAC nucleotide code Y (Figure 4.15) represents either a C (cytosine) or T (thymine).
Page 129
128
Figure 4.15 ClustalW alignment of An. funestus-like ITS2 sequences of rDNA using the
DNASTAR MegAlign method. Only portions with a SNP are shown.
ii) D3 region of rDNA
Amplification of the D3 region produced two PCR products for An. vaneedeni (≈400 and
350bp) and An. parensis (≈400 and 330bp) (Figure 4.16A). Anopheles funestus-like also
gave products of ≈400 and 350bp (Figure 4.16B).
Figure 4.16: 2.5% agarose gel stained with ethidium bromide for visualising An. funestus
group 28S ribosomal DNA D3 PCR products; Lanes 1 and 2 are for DNA molecular
markers and negative controls respectively. A: lane 3: An. funestus (≈400bp), lane 4: An.
vaneedeni (≈400bp and 350bp), lane 5: An. funestus-like (≈400bp), lane 6: An. rivulorum
(≈400bp), lane 7: An. parensis (≈400bp and 350bp), lane 8: An. leesoni (≈400bp). B: Lane
3 An. funestus-like D3 product (≈400bp and 350bp).
1 2 3 4 5 6 7 8
Page 130
129
Anopheles funestus-like D3 PCR products with double amplicons were cloned and
sequenced. Following blasting of the sequences for these fragments on the NCBI data base,
the sequence for the 350bp fragment failed to align with any anopheline sequences.
However, its complete length aligned with the 28S rRNA gene of Leishmania donovani
producing a 100% similarity (E-value = 7e171
). The 400bp fragment sequence aligned with
the rRNA 28S gene sequences of various anophelines including An. funestus.
4.5.3.2 Restriction fragment length polymorphism of D3 PCR products
A total of 225 specimens were analysed for RFLP genotypes. Data indicated two types of
digest pattern for the 30 An. funestus-likes samples investigated, called Type1 and Type 2.
The Type 1 pattern, which constituted 96.7% (n = 30) of the specimens, gave three
products with approximate sizes of 70, 150 and 160bp. Type 2 constituted 3.3% (n = 30) of
the specimens and gave a 110bp product in addition to the Type 1 multiple products
(Figure 4.17A).
Of the 196 An. funestus samples analysed, three Types of digest pattern were obtained
(Figure 4.17B). Their proportions were 53.06% (n = 196) Type Y (70bp, 150bp, 150bp and
310bp), 20.41% (n = 196) Type M (70bp and 310bp), and 26.02% (n = 196) Type MW
(70bp, 150bp, 160bp and 310bp).
Page 131
130
Figure 4.17 A 3% TAB ethidium bromide stained agarose gel showing polymerase chain
reaction-restriction fragment length polymorphism patterns for domain 3 (D3) fragments.
Lanes 1 and 2 in both gels are for DNA molecular markers and no template negative
controls respectively. A: Anopheles funestus-like Hpa II digestion product. Lane 3, Type 2
and lane 4, Type 1. B: Anopheles funestus s.s Hpa II digestion product. Lane 7, Type M;
Lane 19, Type Y; and Lane 21, Type MW.
The physical restriction map for the various RFLP-types is showed in Figure 4.18.
Analysis of the D3 sequences showed that Hpa II restriction sites (CCGG) ranged from 1
to 4. The first restriction site is 70bp from the 5‟ end for D3 products generated from all
mosquitos except in An. funestus-like Type 2 where it is 83bp. The sequences used for the
construction of the restriction map excluded the 40bp sequences for D3A (20bp) and D3B
(20bp) primers.
Page 132
131
Figure 4.18 Schematic representation of rDNA D3 Hpa II restriction mapping for different
restriction fragment length polymorphism types. The black bold lines represent DNA
strands with approximate sizes in base pair (bp) and the red vertical lines indicate the Hpa
II enzyme restriction sites. Each restriction site is 4bp and, together with the primer length,
was not considered when constructing the restriction map.
4.5.3.3 Phylogenetic relationship of An. funestus-like with other members of the An.
funestus group based on D3 sequences
The phylogenetic tree generated from D3 molecular data clusters the seven species
represented, into three groups (Figure 4.19). No difference was observed between An.
parensis, An. funestus-like and An. funestus which are all grouped in the same clade.
Page 133
132
Figure 4.19 Phylogenetic tree of the An. funestus group based on nucleotide sequences of
domain 3 (D3) of the 28S unit of rDNA (Neighbour joining construction). Par or PAR =
An. parensis, Funestus-like = An. funestus-like, Funestus = An. funestus, An. van D.seq =
An. vaneedeni D3 sequence, Rivulorum = An. rivulorum, Malaf/malaf plus numbers are
sample codes. An. gambiae D3 sequence represent outgroup.
4.6 Discussion
Anopheles funestus group species are morphologically similar. Therefore, unambiguous
discrimination between member species should be based on molecular PCR based
techniques, enabling differentiation between vector and non-vector species.
4.6.1 Development and optimization of real time PCR assays
Cost effectiveness of assays was the main criterion that was used to decide the sequence in
which assays were investigated. Melt curve analysis was first investigated because this
Page 134
133
assay employs only standard oligonucleotide primers, and no additional fluorescence
labelled probes were required. Furthermore, this assay only requires a single channel real-
time PCR machine which is less costly than a multichannel machine. The running cost per
sample using this assay was approximately US $0.65. The MCA was initially optimised
using the original primers of Koekemoer et al. (2002). It became immediately evident that
the assay could not accurately discriminate between An. vaneedeni, An. parensis and An.
funestus. This was because the amplicons from these species had similar GC content
causing a difference of only 0.5ºC in melting temperature between An. funestus and An.
vaneedeni and a 1ºC difference between An. vaneedeni and An. parensis. Redesigning the
species-specific primers for An. vaneedeni and An. funestus to generate amplicons with
different melting temperatures did not sufficiently resolve unambiguous differentiation
between these species. This assay could prove useful in Sub-Saharan Africa where An.
vaneedeni is absent in field collections which results in a clear gap in melting temperature
from amplicons generated from An. funestus and An. parensis. To date, An. vaneedeni has
only been described from Southern Africa Gillies and Coetzee, (1987). However, if An.
vaneedeni is unexpectedly present, this assay will lead to misidentification of this species.
Since MCA could not distinctly identify the small differences in melting temperature
between the amplicons for the three species, an assay based on HRM was developed. The
running cost for this assay is also low (US $0.65) as it only requires standard
oligonucleotide primers and a cheap intercalating dye. Unfortunately the cost of acquiring
a multichannel real-time machine is expensive. During optimisation, it was noted that there
was slight increase in the fluorescence of the dye in the negative controls during late
cycles. This was greatly reduced by decreasing the number of PCR cycles but ensuring that
Page 135
134
amplification of species diagnostic product reached the full plateau phase. HRM
successfully identified all five targeted species with some discrepancies.
To overcome the shortcomings of misidentification associated with both the MCA and
HRM assays, an assay based on hydrolysis probe genotyping was developed. The major
problems with this assay include the high initial cost of a real-time PCR machine (US$
35452 and above compared to US$7334 for a standard thermo-cycler at time of writing)
and expensive probes. Fortunately, the price of this machine is decreasing.
The hydrolysis probe assay was initially run for 40 cycles which unfortunately resulted in
low levels of non-specific amplification during the cycling of LEES (An. leesoni) and PAR
(An. parensis) specific probes. To eliminate this, the number of cycles was dropped to 35.
However, the fluorescent signal resulting from the binding of the VAN probe (An.
vaneedeni) was significantly lower compared to the relative fluorescence from the other
probes. Analysing the PCR product on agarose gel electrophoresis confirmed the presence
of a single amplicon diagnostic for An. vaneedeni. Replacing the fluorescent dye and/or
redesigning the probe failed to improve the fluorescent signal generated. However, even
with this low fluorescent signal, An. vaneedeni specimens were positively identified when
the auto-scale function of the Rotor-Gene software was used. In regions where An.
vaneedeni is absent in its distribution, the species-specific probe can be exempted from the
reaction mixture thereby reducing the running cost further. The problem is, in the event
that An. vaneedeni is present, it will not be identified and therefore a second assay will be
needed to screen for this species from the unidentified samples.
Page 136
135
The overlap observed in curves from An. funestus-like, An. funestus and An. vaneedeni
during optimisation of the MCA and HRM assays could be a consequence of PCR products
of similar size and GC content. Anopheles funestus-like was therefore excluded from both
assays. During the design of a hydrolysis probe assay to also indentify An. funestus-like, it
was observed that the ITS2 sequence for this species is highly similar to that of An.
funestus leaving no option for designing an An. funestus-like specific probe. Anopheles
funestus-like was excluded from this assay design as well.
4.6.1.1 Analytical sensitivity of assays
The hydrolysis probe assay developed in this study was more sensitive compared to the
conventional AS-PCR. This is similar to the results obtained by other researchers. Bass et
al. (2008) compared the sensitivity of a single PCR assay and a TaqMan (hydrolysis probe)
assay for detecting diluted DNA from four Plasmodium species (P. falciparum, P. vivax, P.
ovale and P. malariae). They found that the hydrolysis probe assay had a detection limit of
0.0002ng DNA for all four Plasmodium species compared to a 2ng - 0.004ng range for the
single PCR method. The high sensitivity associated with the hydrolysis probe assay can be
attributed to the species-specific probes and primers. As the hydrolysis probe assay is
expensive to run, the possibility of halving the reagent volumes was investigated. It was
found that the sensitivity remained comparable. Due to the high sensitivity of this method
it can be used in situations where DNA has degraded as a consequence of poor storage.
4.6.1.2 Blind trial
The performances of the three real-time PCR assays developed in this study together with
the AS-PCR of Koekemoer et al. (2002) were assessed. The hydrolysis probe assay was
the only assay amongst the real-time assays developed with a performance comparable to
Page 137
136
the gold standard AS-PCR which had a low failure rate compared to MCA and HRM. This
could be attributed to the double specificity of the assay as a consequence of the species-
specific probes and primers used. MCA had the highest number of misidentified samples
with misidentifications being recorded in An. funestus, An. vaneedeni and An. parensis
specimens. The PCR products generated from these species during MCA were of different
sizes but had similar melting temperatures. It is known that the melting temperature of an
amplicon depends on its GC content, sequence length as well as compositional variation in
the nucleotide bases. The GC content and the nucleotide composition for these species are
likely to be similar. This molecular observation highlights the close morphological
similarity between these species. It is recommended that DNA concentrations between
samples for MCA are standardised as variation in the starting templates affects melting
temperature. Standardization would require DNA quantification by gel electrophoresis or
spectrophotometer. Although this is an additional step and adds to the running cost of the
assay, it is likely to reduce misidentification. As with MCA, HRM misidentified a number
samples. This included misidentification of two water negative controls as An. funestus and
An. rivulorum, resulting in a potential background problem for the assay.
4.6.1.3 Validation of the hydrolysis probe assay
The high performance of the hydrolysis probe assay in this test confirmed its robustness
and sensitivity. It however failed to identify some samples. This could be due to
degradation of the template DNA.
4.6.2 AS-PCR development and validation
Partial IGS sequence was obtained from the 3‟ direction of the rDNA IGS region for four
species of the An. funestus group from which AS-PCR has been developed. The protocol
Page 138
137
allows for the identification of An. funestus, An. rivulorum, An. vaneedeni and An.
parensis. Sequence data for An. funestus-like obtained during sequencing was
approximately 200bp and was part of the 18S gene and not the targeted IGS region. There
was not enough time to sequence the IGS region of An. leesoni. Difficulties in obtaining
IGS sequence for An. funestus-like could be due to the presence of secondary structures in
the rDNA. As a consequence, both species could not be included in the multiplex PCR.
Although this study recommend the inclusion of An. funestus-like and An. leesoni, the
current protocol can be useful for species identification in areas where both species are
limited in their distribution. The 550bp product in the multiplex PCR for An. parensis is a
non-specific product generated by the VARIGS primer specific for An. vaneedeni. The
rDNA IGS region was not successfully sequenced from the 5‟ direction for the species
investigated. This is most likely due to the presence of secondary structures inhibiting
sequencing reaction.
The performance of the AS-PCR assay in identifying previously identified samples was
encouraging and indicates its potential for use in An. funestus group species identification.
Samples not identified by this assay could be as a result of degradation of the DNA.
4.6.3 RFLP genotyping of An. funestus and An. funestus-like populations
The use of PCR-RFLP for genotyping populations of anophelines is not new. This
technique was first developed by van Bortel et al. (2000) for genotyping Asian anophelines
of the An. minimus group and has subsequently been used by other researchers. In this
study, amplification of domain 3 (D3) of the 28S rDNA region gave two PCR products.
This is similar to results obtained by Garros et al. (2004) and Koekemoer et al. (1998). The
generated D3 products in this study digested with Hpa II endonuclease and resulted in the
Page 139
138
differentiation of An. funestus populations into three RFLP types (Y, M, MW). Similarly,
two RFLP Types (1 and 2) have been identified in An. funestus-like from Malawi. The
RFLP types M and MW found in this study correlate with previous reports of Type M in
Kenya and Madagascar as well as Type MW in Mozambique (Garros et al. 2004).
Koekemoer et al. (2006) also reported the presence of Type M in Kenya, Malawi and
Tanzania as well as Type MW in Mozambique, South Africa, Tanzania, Uganda and
Zambia. The RFLP type W of Garros et al. (2004) and Koekemoer et al. (2006) is similar
to An. funestus-like RFLP Type 2. The unique occurrence of RFLP type 2 in the An.
funestus-like Malawi population probably confirms the high degree of variation in the D3
region of 28S rDNA. The 350bp D3 products for An. funestus-like are most likely the
products of non-specific amplification.
The RFLP patterns observed in this study can be used to differentiate An. funestus from
An. funestus-like. However, RFLP may not be useful for the identification of An. parensis,
An. vaneedeni and An. funestus-like. In this study, the D3 products for An. vaneedeni and
An. parensis were not digested. However, after digesting similar products from both
species with MSp I, an isoschizomer to Hpa II, similar patterns were obtained to that of
Type 2 An. funestus-like (Garros et al. 2004). Employing this technique in regions where
all the species occur will probably lead to misidentification.
The restriction map obtained after analysing the D3 sequence of An. funestus with PCR-
RFLP Type Y pattern for the Hpa II restriction site was similar to that of Type M and not
Type MW as expected based on the RFLP pattern observed by agarsoe gel electrophoresis.
The likely explanation is that Type Y is a combination of the types M and MW with more
repeats of Type M than Type MW. Because the PCR products of Type M outnumber those
Page 140
139
of the Type MW, they are inadvertently preferentially sequenced instead of Type MW and
therefore produce a Type Y restriction map. However, on analysing the digestion products,
considering that more products are analysed on gel than used for sequencing, the resulting
restriction map is that of the PCR-RFLP Type MW with faint 152 and 155bp products.
Further research is recommended to establish the ratio of these two types (M and MW) in
the RFLP Type Y.
4.6.4 Phylogenetic analysis
The phylogenetic tree constructed using ITS2 data clearly discriminated An. funestus-like
from the other species of the An. funestus group. This was expected as the ITS region is
more variable than the D3 region. It is not surprising that An. funestus-like is most closely
related to An. funestus as the field collections of An. funestus-like were misidentified as An.
funestus. An attempt to root the ITS2 and D3 phylogenetic trees with the respective
sequences for An. gambiae failed to produce similar results to those obtained by Garros et
al. (2004). Although the exact reason is unknown, it is likely that the exclusion of a 15bp
fragment at the 5‟ and 3‟ ends of the ITS2 and D3 sequences for An. gambiae together with
those of the other species are responsible for the difference observed. This exclusion was
done to ensure that all sequences analysed were of the same length.
4.7 Conclusions
Of the three assays tested against the gold standard AS-PCR of (Koekemoer et al., 2002),
the hydrolysis probe assay was the most efficient for identification of members of the An.
funestus species group. Its performance was comparable to that of the AS-PCR and, like
the other real time assays, was more sensitive than the AS-PCR. Although this technique
Page 141
140
may not currently be affordable for resource-poor laboratories, the initial costs of the
required equipment are decreasing.
IGS sequence data for An. funestus-like and An. leesoni needs to be obtained so that probes
for these species can be included in the newly developed AS-PCR for identifying members
in the An. funestus group. The IGS region is much larger ( 4Kb) than the ITS2 ( 800bp)
(Collins et al. 1990) and will most likely provide the size variation needed to include An.
funestus-like in one multiplex assay.
The RFLP results obtained in this study show that this technique can be used to
discriminate An. funestus-like from An. funestus. Both species showed distinct digestion
patterns on an agarose gel. ITS2 sequence analyses together with RFLP results for An.
funestus-like suggest intraspecific variation within this population.
Phylogenetic analysis of the ITS2 region sequences for different species in the An. funestus
group showed that An. funestus-like is closely related to An. funestus and should clearly be
listed as a member of the An. funestus group. Phylogenetically, there is no difference
between the different An. funestus RFLP types as they were all in the same clade. Of the
two data sets investigated, the ITS2 region indicated a distinct clade which links An.
funestus-like with the other An. funestus group species and can also be used to distinguish
between An. funestus-like and An. funestus s.s.
Page 142
141
CHAPTER FIVE
General Discussion and Conclusion
5.1 Discussion
In Africa, malaria remains the number one killer disease (WHO, 2010) and the principal
vectors are mosquitoes belonging to the Anopheles gambiae complex and An. funestus
group (Gillies and De Meillon, 1968). The malaria vector and non-vector members of the
An. funestus group are highly similar morphologically (Gillies and De Meillon, 1968;
Gillies and Coetzee 1987) which is problematic because efficient identification of
anopheline species is of fundamental importance to sustainable malaria vector control. In
Malawi, malaria vector control has principally been based on the use of bed nets
(Presidents‟ Malaria Initiative Operational Plan-Malawi 2011). Prior to this study, the
Department of Health in Karonga, northern Malawi, was preparing for malaria vector
control using indoor residual spraying of insecticides. Success of these interventions relies
heavily on baseline information which encompasses mosquito species composition,
malaria vector incrimination, behaviour and susceptibility to insecticides of target
populations. Spillings et al. (2009) describe a new member of the An. funestus group
provisionally designated An. funestus-like from Karonga, expanding our knowledge of the
An. funestus group. The aim of this study was to systematically describe An. funestus-like
from the same location. To achieve this aim, specimens were collected from the field and
brought to the laboratory for molecular analysis. Museum specimens were used for
morphological studies.
Page 143
142
5.1.1 Vector composition, distribution and insecticide susceptibility status
Mosquitoes were collected from the field, morphologically sorted and molecularly
identified to species where necessary. The anopheline species composition was analysed
per collection site. F1 progeny successfully reared from field-caught adults were exposed to
a range of insecticides to determine their susceptibility status.
This study showed that four species of the An. funestus group (An. funestus, An. funestus-
like, An. rivulorum and An. parensis) occur in Karonga. These findings correlate with
previous studies. Spillings et al. (2009) recorded An. rivulorum and An. funestus-like in the
same area and the occurrence of An. funestus s.s in Malawi has previously been recorded
(Weeto et al., 2004; Chiphwanya, 2004). The collections described here include the first
record of An. parensis in Karonga. The distribution of these species varied between
seasons. Anopheles funestus s.s predominated over other species during the wet season
while An. rivulorum outnumbered the other species during the dry season. Anopheles
funestus-like were found to be more abundant in the dry season collections compared to the
wet season.
The sympatric occurrence of these morphologically similar species in Karonga and the
differences in their seasonal occurrence has implications for malaria vector control there.
Efficient and unambiguous identification tools are therefore needed to discriminate the
vector from the non-vector species before the implementation of a vector control program.
Accurate species identification under these circumstances allows for an appraisal of
insecticide susceptibility status by species, which in turn allows for the design of a suitable
insecticide based vector control intervention. This will avoid the waste of limited resources
by targeting non malaria transmitting mosquitoes. Data presented in this study suggest that
Page 144
143
vector control at Karonga should be intensified at the beginning of the wet season when
An. funestus are found in high numbers. Based on the insecticide susceptibility studies
conducted there to date, and from previous records from southern Africa (Hunt et al.,
2010; Abilio et al., 2010), pyrethroid and carbamate resistance seems to be spreading
across the region. There is need for detailed investigation on the underlying resistance
mechanisms in the populations from each country. This information will assist in coming
up with appropriate resistance management strategies. This study also recommend, the use
of DDT since results from this region have shown that An. funestus is still susceptible to
this insecticide.
5.1.2 Feeding and resting behaviours
Mosquito blood meal identification indicates the association between species and host
(blood source). To understand the ecology of An. funestus-like, identification of blood
sources was determined from field collected specimens using ELISA (Beier et al. 1988).
The percentages of mosquitoes with human or animal blood were determined. Anopheles
funestus-like were positive for animal blood only, indicating no tendency to feed on
humans.
An indication of the resting behaviour of An. funestus-like was obtained by comparing the
relative occurrence of this species in the indoor and outdoor collections. Anopheles
funestus-like tend to rest inside human dwellings after taking animal blood meal. Should
females of this species be incriminated as vectors of malaria, their resting behaviour will
render them vulnerable to indoor residual spraying.
Page 145
144
5.1.3 Plasmodium species infection
Field collected female mosquitoes were analysed for Plasmodium infection by means of
ELISA (Wirtz et al., 1992). Two species of the An. funestus group were infected with
Plasmodium. Anopheles funestus s.s from Likoma Island was infected with P. falciparum
at a rate of 5.9% In Karonga, P. vivax infection was only detected in An. funestus-like.
These infections were not confirmed using the more sensitive PCR technique
(Tassanakajon et al., 1993) so it is highly likely that these data are false. False positive
Plasmodium species infection has previously been reported in zoophilic mosquito species
across Africa (Lochouarn and Fontenille, 1999; Sylla et al., 2000; Koekemoer et al., 2001;
Bigoga et al., 2007; Mouatcho et al., 2007) which can have serious implications for vector
control. False sporozoite positives can cause an overestimation of the entomological
inoculation rate and incorrect vector incrimination, leading to a poorly informed vector
control strategy (Durnez et al., 2011).
5.1.4 Morphological description of An. funestus-like
Morphological identification is the first step in mosquito identification. Since An. funestus-
like was discovered resting indoors with An. funestus, it was suspected of being a vector.
There was therefore a need to morphologically describe An. funestus-like. Members of the
An. funestus group are morphologically similar to each other. In order to assess
morphological variation between An. funestus-like and its closest relative An. funestus, the
progeny of wild-caught females were reared under standard conditions for subsequent
morphometric measurements. In particular, wing length, wing morphology, wing spot
ratio, palp band ratio and leg morphology were investigated. From these measurements, a
plot of palp band ratio against wing spot ratio can tentatively be used to separate these
species. However, these ratio‟s do not unambiguously differentiate An. funestus-like from
Page 146
145
An. funestus although they can be used to completely differentiate An. funestus from An.
vaneedeni (An. aruni of De Meillon et al., 1977). The extent of morphological similarity
between An. funestus-like from An. funestus is therefore highlighted by the fact that none
of the characters investigated produced a clear separation between the two. Molecular
identification has frequently been used to supplement morphological methods to
discriminate members of the An. funestus group. This study therefore investigated different
molecular assays that can be used for discriminating members of the An. funestus group.
5.1.5 Novel DNA based assays for Anopheles funestus group identification
Member species of the An. funestus group are routinely identified using dichotomous
morphological identification keys and the AS-PCR method. Morphological identification
to species level within this group requires a high level of expertise which is not readily
available in most countries affected by malaria, added to this the mosquitoes species are
morphologically very similar. There is therefore a need to supplement morphological
identification of mosquito species with molecular methods. Currently, molecular methods
available could not distinguish all members of the group in a single assay (Spillings et al.,
2009). It was therefore decided to investigate several molecular methods in the hope of
designing a single assay for the routine identification of all six common An. funestus group
members (An. funestus, An. rivulorum, An. parensis, An. vaneedeni, An. leesoni and An.
funestus-like).
Three multiplex real-time PCR assays (MCA, HRM, and hydrolysis probe assays) based
on ITS2 sequences of rDNA that can be used to identify members in the An. funestus group
were designed and evaluated. For MCA and HRM, species-specific diagnostic PCR
products were melted in the presence of a dye. These resulted in species diagnostic melt
Page 147
146
curves. For the hydrolysis probe assay, species-specific probes were designed between a
universal forward primer and species-specific reverse primers. Hydrolysis of the probes
during PCR result in an increase in fluorescent unit of the probe. Of these real-time assays,
the hydrolysis probe assay showed a specificity comparable to that of AS-PCR and
increased sensitivity to low DNA template concentrations. This assay can therefore be used
to identify samples with low DNA concentrations thereby alleviating the extra cost
incurred when repeating samples as often happens with the AS-PCR method. Although a
separate assay is still required to differentiate An. funestus-like, the hydrolysis probe assay
is easy to perform, has a high throughput, is closed tube and requires no post PCR
processing which not only adds to cost but also requires the use of toxic ethidium bromide.
Also investigated was the design of a conventional PCR based on the IGS region of rDNA
as this region is larger and more variable. This region was partially sequenced for four
species (An. funestus, An. rivulorum, An. parensis, and An. vaneedeni). Diagnostic species-
specific primers (forward primers) and a universal reverse primer were designed from the
partial IGS sequences to produce a new AS-PCR assay. This new assay successfully
discriminates the four species. Unfortunately, PCR amplification and sequencing of the
IGS region for An. funestus-like and An. leesoni was not successful in this study due to
time constraints. However, it is recommended that these species are included in the IGS
AS-PCR for the identification of all six An. funestus group members in a single assay.
5.2 Recommendations for further research
In the course of interpreting the data collected in this study, a number of questions were
raised. These were not answered here because they are not directly linked to the original
Page 148
147
objectives of this study. Further investigations are recommended to fully characterize An.
funestus-like.
During this study only a few specimens of An. funestus-like were analyzed for blood meal
sources which were found to be of cow and/or goat. The majority of these specimens were
collected indoors in human dwellings. It will therefore be interesting to know if the
tendency toward complete zoophily will be supported by analysis of a larger sample. To
achieve this, a large sample of this species needs to be collected indoors and outdoors
using different collection methods across seasons. Future collected specimens should be
analyzed for host blood source using a more sensitive method such as PCR (Kent and
Norris, 2006).
This study showed that An. funestus was predominant during the wet season and An.
rivulorum during the dry season. Although P falciparum infected An. funestus were
detected only in samples from Likoma Island, malaria transmission is likely ongoing in
Karonga, as suggested by Chiphwanya (2004) who reported P. falciparum infection in An.
funestus with infection rates of 2.3% and 8.5% in Malawi. Follow-up investigations at
Karonga should help resolve the pattern of malaria transmission there.
Resistance to pyrethroid and bendiocarb insecticides was detected in An. funestus from
Wowve. Insecticide susceptibility data should also be collected from the other collection
sites.
Page 149
148
5.3 Conclusion
Spillings et al. (2009) identified An. funestus-like resting indoors together with An.
rivulorum in Karonga, Malawi, where little information is available concerning mosquito
species composition and the pattern of malaria transmission. Data presented here show that
four member species of the An. funestus group, including An. funestus-like, co-exist in
Karonga. Anopheles funestus-like is zoophilic, endophilic and its infectivity with P. vivax
requires confirmation. Species identification protocols for real-time and AS-PCR assays
have been developed. Of these, the hydrolysis probe assay shares a similar specificity to
that of the currently used AS-PCR assay but with a greater sensitivity. This study has
advanced existing knowledge for An. funestus-like in the field of vector control and has
equally provided an alternative and sensitive molecular identification method for
discriminating members in the An. funestus group.
Page 150
149
APPENDIX I
PREPARATION OF CHENICALS AND SOLUTIONS
A) DNA extraction solution (Collins et al., 1987)
8M KAc
Grinding buffer
0.08M NaCl
0.16M Sucrose
0.06M EDTA
0.5% SDS
0.1M Tris-HCl
TA (Tris EDTA) Buffer (Sambrook et al.,1989)
100ml 1M Tris (pH)
20ml 0.5M EDTA
Make up volume to 1L.
B) Preparation of PCR solutions Sambrook et al. (1989)
TAE (Tris Acetic EDTA) Buffer 50X (pH 8)
242g Tris base
37.2 g Na2 EDTA.2H2O
57.1M glycial acetic acid
Make up to 1 L
TBE (Tris-Borate EDTA) Buffer 5X (pH 8)
54g Tris base
27.5g boric acid
Page 151
150
3.722 g Na2 EDTA.2H2O
Make up to 1 L
Agarose gel
For a 2.5% agarose gel, dissolve 10g agarose in 400ml 1X TAE
For a 1% agarose gel, dissolve 1g agarose in 100ml 1 X TAE
The mixture was heated in a microwave oven until all the agarose had melted and
the solution had started to boil. The gel solution was allowed to cool to
approximately 55ºC. Four µl of a 0.5mg/ml ethidium bromide was added and
gently mixed into the gel by swirling. The gel was poured slowly into a gel rack
containing combs. Any air bubbles were removed immediately and the gel allowed
to solidify for 30 minutes. After the gel had completely solidified, the combs were
removed.
Ethidium bromide (EtBr)
Dissolve 10mg EtBr crystals in 1ml distilled H2O
Ficoll dye
50% sucrose
1ml 0.05M EDTA (pH7.0)
0.1% Bromophenol blue
10% ficoll
C) Preparation of sporozoite ELISA solutions (Wirtz et al., 1987)
Phosphate Buffer Saline (PBS) 10X
Blocking Buffer (BB) 1L
2.5g Casein
50ml 0.1N NaOH
Page 152
151
450ml 10X PBS
0.1ml Phenol red
Suspend casein in NaOH and boil. After casein has dissolved slowly add the PBS
and cool. Adjust the pH to 7-7.4 using HCl. Add phenol Red and store for one
week in fridge.
Grinding Buffer (BB-NP40)
50ml BB plus 250 µl NP-40. Five ml is enough for 100 samples. Store for one
week in fridge
Washing Buffer
Add 500µl Tween-20 to 1L 1X PBS. Mix well and store at 4ºC for one week
D) Preparation of blood meal ELISA solutions (Beir et al., 1988)
Phosphate buffered saline, p H 7.4. Store solution at 4 ºC
Boiled Casein, 0.5% (BC)
2.5g Casein
50ml 0.1 N NaOH
450ml PBS
0.05g Thimerosol
0.1ml Phenol red
Suspend the casein in the NaOH and bring it to boil. After the casein is dissolved,
slowly add PBS and allow the mixture to cool. Adjust the p H to 7.4 with HCl.
Added thimerosol and phenol red then mix well and store on shelf for a week.
Page 153
152
Wash Solution (PBS containing 0.5% Tween 20)
For a 500ml washing buffer, add 2.5ml Tween-20 to 497.5ml PBS. Mix well and
use the same day.
Enzyme Diluent (BC-Tween 20) 100ml
Add 0.025ml Tween 20 to 99.975ml 0.5%BC
E) Preparation of cloning solutions
IPTG stock solution 0.1M:
1.2g IPTG was weighted and water added to a final volume of 50ml. The solution
was mixed and filtered through a filter paper and stored at 4ºC.
X-gal 50mg/ml (Promega Madison WI USA)
LB medium:
10g Bacto® trypto, 5g Bacto® yeast extract and 5g NaCl was weighed out and
water added to a final volume of one liter. The solution was properly mixed and pH
adjusted to 7 with NaOH.
Page 154
153
APPENDIX II
STANDARD LABORATORY METHODS
A) DNA extraction protocols
Lavik et al., (1984)
The whole mosquito was homogenized in 0.1ml of 0.5% SDS/ 0.08M NaCl / 0.16M
sucrose/ 0.06M EDTA/ 0.I2 M Tris-HCl, pH 9, and incubated at 65ºC for 30 minutes. To
the homogenate 14ul 8M stock of potassium acetate was added and incubated on ice for 30
minutes. Debris and precipitated SDS and protein were removed by 10-min centrifugation
in a microcentrifuge. Nucleic acid from the supernatant was collected by adding 0.2ml of
ethanol, incubated for 2 minutes at room temperature and centrifuged for 5 minutes. The
pellets were washed twice with cold 70% ethanol, dried and dissolved in 40ul distilled
water.
Collins et al (1987)
The abdomen of a single mosquito was placed in a separate 1.5 ml microcentrifuge
tubeand homogenized in 100µl of grinding buffer (0.08M NaCl, 0.16M sucrose, 0.06M
EDTA, 0.5 % SDS, 0.1M Tris-Cl, pH 8.6). The homogenate was incubated at 70°C for 30
minutes. Potassium acetate (0.98 M) was added to the heated homogenate, mixed and
incubated on ice for 30 minutes. After incubation, room temperature centrifugation was
carried out for 15 minutes at 16060 x g. The supernatant was removed and pipetted in to a
clean microcentrifuge tube and the pellets discarded.
Page 155
154
Two volumes of 99.9% Ethanol compared to the volume of homogenate was added and the
solution gently mixed gently by inversion. In order to facilitate DNA precipitation, the tube
and contents were incubated overnight at -20°C prior centrifugation at 16060 x g for 35
minutes. The supernatant was removed and the DNA pellet was washed with one volume
(100µl) 70% ethanol prior to centrifugation for 10 minutes at 16060 x g. The pellets were
then air dried after removing the ethanol. The DNA pellets were resuspended in 100µl of 1
X TE buffer (0.1M Tris and 0.01M EDTA) and stored at -20°C.
DNA Extraction using prepGEMTM
Insect kit
A sterile forcep and scalpel was used to dissect insect body part (leg or wing). The body
part was placed inside a thin-welled PCR tube for extraction. Into the tube was added 35µl
of PCR grade water, 4µl 0f 10X buffer BLACK and 1µl prepGEMTM
. The sample was
crushed with a sterile pestle and incubated in a thermal cycler at 75ºC for 15 minutes and
95ºC for 5 minutes. The tube was briefly centrifuged at 16060x g and the supernatant used
directly for PCR.
B) Anopheles funestus group PCR protocol (Koekemoer et al., 2002)
A 13.5µl PCR reaction mixture 0.2ml microcentrifuge tube consisted of the following: 1 X
PCR reaction buffer (100mM Tris-HCl pH 8.3, 500mM KCl), 0.23mM dNTPs, 1.38mM
MgCl2, 0.24µM FUN, LEES, RIV, VAN, PAR and UV primers, 0.02U of Thermus
aquaticus (Taq) DNA polymerase enzyme (5U/µl) and 1µl DNA template. The buffer,
dNTP mix, MgCl2 and Taq supplied by Takara biomedicals group Shiga Japan Cat. No.
R001AM. The microcentrifuge tube was briefly vortexed for 2 seconds and the tube was
centrifuged for 10 seconds at 13,000 rpm. PCR was performed using a thermal cycler
(Primus 96, MWG Biotech) using the following cycling conditions: 94°C for 2 minutes
Page 156
155
initial denaturation, 35 cycles of 94°C for 30 seconds denaturation for melting of double-
stranded DNA, 50°C for 30 seconds annealing of specific primers, 72°C for 40 seconds
extension (polymerization) and a final auto extension at 72°C for 10 minutes. Ten
microliters of amplicons were mixed with 3µ ficoll loading dye and laoded into the wells
of a 2.5% ethidium bromide (10mg/ml) (Cat. No. 15585-011, GibcoBRL, UK) stained
agarose gel submerged in a 1X TAE buffer. The PCR products were subjected to
electrophoresis at 110V, 400m A for 1 hour 20 minutes or until proper separation of the
smaller fragments of the molecular weight marker had been achieved. Each gel contained
five positive controls drawn from known laboratory strain of Anopheles funestus, and
positively identified field specimens of An. leesoni, An. rivulorum, An. vaneedeni, and An.
pareensis. The negative control consisted of the PCR mix without DNA template. The
amplicons were visualized under ultra violet light of a Syngene G-box sydr4/115, gel
documentation system and image captured. Mosquitoes were identified by comparing the
sizes of their amplicons, to 4µl of a 1kilo base (kb) standard molecular weight
GeneRulerTM
DNA ladder (Fermentas, Canada Cat. No. SM0331) loaded on the first lane
of the gel. Positive controls were loaded after the marker, followed by the negative control
and then the samples.
C) Anopheles funestus species protocol (Spilling et al., 2009)
The PCR mixture was prepared the same as in Koekemoer et al. (2002) except that only
two primers (UV and a Malaf B) were used. The PCR mixture was carried out in the
Primus 96 thermal cycle under the following cycling conditions: 94°C for 2 minutes initial
denaturation, 35 cycles of 94°C for 30 seconds denaturation for melting of double-stranded
DNA, 45°C for 30 seconds annealing of specific primers, 72°C for 30 seconds extension
and a final auto extension at 72°C for 10 minutes. The positive control consisted of a
Page 157
156
positively identified field An. funestus-like specimen and the negative control was made up
of only the PCR mix without template. PCR products were analysed as described in section
(Appendix IIB). Positive samples gave bands of approximately 440bp.
D) Plasmodium sporozoite ELISA Test Protocol Wirtz et al. (1992)
Mosquito preparation
The head and thorax of individual Anopheles female mosquito was separated from the
abdomen with the aid of a blade and forceps and placed in a sterile 1.5 ml microcentifuge
tube. The blade and forceps were rinsed twice in methylated spirit solution and wiped dry.
The sample was homogenised in 50µl grinding buffer with a sterile pestle and the pestle
washed with 150µl blocking buffer to give a total volume of 200µl. A positive control,
consisted of a synthetic peptide standardised against Plasmodium species and was prepared
fresh on the day of the ELISA. Negative controls, consisted of seven unfed female An.
funestus s.s. (FANG) prepared as described above and samples were stored in -70 ºC until
use (less than two months).
Each well of a 96 well microplate was coated with a solution of 0.200µg/50 µl monoclonal
antibody, and the plate was wrapped with aluminium foil before incubating overnight at 4
ºC. The microtitreplate was aspirated and filled with blocking buffer followed by one hour
incubation at room temperature. During this incubation, a positive control was prepared by
mixing 100pg of with 50µl Blocking buffer.
The wells were aspirated and 50µl of each mosquito homogenate loaded per well. Well A1
of the plate, was designated for the positive control and the last seven wells (H6 to H12)
for negative controls. This was followed by 2 hour incubation and washing of wells twice
Page 158
157
with PBS-Tween 20. Fifty µl of a 9mg/µl Peroxidase labelled monoclonal antibody (Cat.
No. 37.00-24-4, Kirkegaard and Perry Laboratories, Maryland, USA) was added into each
well and the plate incubated for one hour at room temperature. The wells were washed 3-4
times with PBS-Tween 20 and 100µl of freshly prepared ABTS peroxidase substrate (2,2‟-
azino-di-3 ethyl-benzthiazoline) (Cat. No.50-60-18, Gaithersburg, Maryland USA) was
added to each well. The plate was incubated in the dark at room temperature for 30-60
minutes to allow the peroxidase reaction to occur. Optical density was measured using a
plate reader at a wavelength of 405 nm.
Positive controls used
Plasmodium falciparum: Pf 2+ (Cat. No. Pf-PC Washington DC, USA)
Plasmodium vivax: Pv210-PC (Cat. No. Pv-PC Washington DC, USA)
Monoclonal antibody used
Plasmodium falciparum: Pf 2A10-CDC O1 (Cat. No. 37-00-24-2, Kirkegaard and Perry
Laboratories, Maryland, USA)
Plasmodium vivax: Pv 2A10-CDC O1 (Cat. No. 37-00-24-2, Kirkegaard and Perry
Laboratories, Maryland, USA)
E) Mosquito blood meal identification using direct ELISA (Beir et al., 1988)
Sample preparation
The abdomen of individual mosquito was separated from the head and thorax with the aid
of a sterile blade and forceps and placed into a 1.5ml microcentrifuge eppendorf. The blade
and forceps were rinsed twice in methylated spirit solution and wiped dry. The specimen
Page 159
158
was ground in 50µl 0.01M PBS. This was followed by a 1:50 dilution of the mosquito
triturate using PBS.
Blood meal ELISA procedure
Each well of a 96 well microplate was coated with 50µl of diluted mosquito triturate and
the plate was wrapped with aluminium foil before incubating overnight at room
temperature for 3hours. The microtiter plate wells were aspirated and washed twice with
PBS Tween-20. Host specific conjugate (antihost IgG conjugate in either peroxidase for
human or phosphatase for bovine) was diluted in 0.5% boiled casein containing 0.025%
Tween-20. The dilutions were 1:2000 for antihost IgG conjugated with peroxidase and
1:250 dilutions for antihost IgG conjugated with phosphatase. On to each well was added
50µl host specific conjugate and plate wrapped with aluminium foil before incubated for
one hour at room temperature. The wells of the microtiter plate were aspirated and washed
thrice with PBS-Tween-20. One hundred µl ABTS peroxidase substrate (22-azino-di 3-
ethylbenzthiazoline sulfonate) and phosphatase substrate (p-Nitrophenyl phosphatase)
(Cat. No.50-80-00, Gaithersburg, Maryland USA) was respectively added to plate
containing antihost IgG conjugated and antihost IgG conjugated to phosphatase. Optical
density was measured using a plate reader at wavelength of 405 nm after 30 minutes.
F) QIAquick Gel Extraction kit Protocol
DNA fragment of interest was excised from the gel matrix using a clean sharp scalpel and
transferred into a 1.5ml eppendorf tube. The size of the gel slice was determined by weight
and three volumes of buffer QG was added to one volume of gel (100mg ≈ 100µl). The
tube was incubated at 50ºC until the gel slice had dissolved completely. To help dissolve
gel, the tube was mixed by vortexing every 2-3 minutes during the incubation. After the
Page 160
159
gel slice had dissolved and the mixture was yellow in colour, one volume of isopropanol
was added and mixed. A QIAquick spin column was placed in a 2ml collection tube
labelled with the name of the sample. To bind DNA, the sample was applied to the
QIAquick column and centrifuged for a minute. The flow-through was discarded and
QIAquick column returned in the same collection tube. To remove traces of agarose, 0.5ml
of buffer QG was added to the QIAquick column and centrifuged for one minute. The
flow-through was discarded and column returned in the same collection tube. The column
was washed by adding 0.75ml of buffer PE and centrifuged for one minute. The flow-
through was discarded and the QIAquick column was centrifuged for one minute to
remove residual ethanol from Buffer PE. The QIAquick column was placed in a clean
1.5ml microcentrifuge tube and the DNA was eluted by adding 50 µl of double distilled
water to the center of the QIAquick membrane and centrifuged for one minute. All
centrifugation were performed at 13,000 rpm.
G) LB plate with ampicilin/IPTG/X-gal
To a 15g agar was added 1L LB medium mixed and autoclaved. The medium was allowed
to cool to about 50ºC (just enough to hold container with the hand). This was followed by
the addition to final concentration, ampicillin 100µg/ml, X-gal 80µg/ml and IPTG 0.5m M.
The mixture was mixed by swirling and 30-35ml of the medium was poured into petri
dishes. The agar was allowed to harden, wrapped in plastic and was stored at 4ºC for a
month.
Page 161
160
H) DNA ligation
Ligation was carried out using pGEMT-Easy kit (Promega, USA) and the reaction set up in
a 0.2ml microcentrifuge PCR tube. The ligation mixtures for test and control reactions are
showed in Table V.
Table x Reagents and reaction volume for the preparation of ligation reactions for the
cloning of PCR products
Reagents Reaction volumes (µl)
Test sample + control - control
2x Rapid ligation buffer, T4 DNA ligase 5 5 5
P GEM-T Easy vector (50ng) 1 1 1
PCR product 3 - -
Control insert DNA - 2 -
T4 DNA Ligase 1 1 1
Double distilled waster 1 1 3
Total volume 10 10 10
+ Control = positive control, - control = negative control, TC= transformation control and -
=
no reagent. The ligation reactions were incubated overnight at 4ºC.
Figure X pGEM®
-T Easy Vector circle map and sequence reference point (promega.com)
Page 162
161
I) Transformation of E. coli JM109 chemical competent cells
The cloning area was wiped properly with 70% ethanol to ensure sterility. 1.5ml eppendorf
tubes were labelled as per name of ligation reaction and left on ice to pre-chill before use.
Competent cells from -80ºC freezer were allowed to thaw completely on ice for 5-10
minutes. Forty µl of the competent cells was placed into each eppendorf tube. This was
followed by the addition of 4 µl of ligation reaction to the 40µl cells on ice. For a
transformation control 1ul (1:100 dilution of a 1ng/µl P UC18 DNA) template was added
to 9µl water. The content of each tube was briefly stirred with a pipette tip before
incubating on ice for 30 minutes. The competent cells were heat shocked by placing the
transformation reaction in a 42ºC water bath for 45 seconds. The tube and content were
returned immediate to ice for two minutes. A recovery medium (960µl) was added to the
cells and the tubes were placed in a shaking incubator at 250 rpm for 1.5 hours at 37ºC.
One hundred µl of transformed cells was transferred to the centre of an LB agar plate
containing ampicillin (AMP)/IPTG/X-gal. A sterile spreader was used to spread the
transformed cells over the entire surface of the plate. The plates were labelled with the
name of the ligation reaction, dated and incubated overnight at 37ºC.
Page 163
162
APPENDIX III
Cattle kraal collection
Cattle Kraal collection in Kwambwe
Page 164
163
APPENDIX IV
Seasonal blood meal source for three species of mosquitoes in the Anopheles funestus group across five collection sites
Collection site
S
e
a
s
o
n
An.
species
Total
number
of
samples
tested
Samples with identified Host blood HBI
Single blood
meal
Multiple blood meal
H D C G BG BG
H
HPDckG PDG DchG HPchB PckG HPB
Mwakabighili
Wet An. riv 3 - - - - 2 - - - - - - - 0
Dry An. riv 15 - - 3 - 3 - - - - - 1 1 12.5
Mwenetete
Wet An. riv 10 - - - - 7 1 - - - - - - 12.5
An. par 1 - - - - 1 - - - - - - - 0
Dry An. riv 25 - - 2 1 8 - - - - 1 - - 8.3
An. fun 1 1 - - - - - - - - - - - 100
Mwampaghatwa Dry An. riv 5 - - - - 2 - - - - - - - 0
Wovwe
Wet An. fun 19 1 1 - - 1 - 1 3 1 - - - 25
Dry An .fun 1 - - - - - - - - - - - - 0
Kwambwe Wet An. riv 2 - - - - 2 - - - - - - - 0
An. riv: An. rivulorum, An. par: An. parensis, An. fun: An. funestus
H: Human, D: Dog, B: Bovine, G: Goat, ck: Chicken - : no sample
Page 165
164
APPENDIX V
Quantitative taxonomic wing length raw data for adult females of Anopheles funestus-like and Anopheles funestus species
An. species
/Country
No Observed range Mean 95%CI SD SE Mean
An. funestus-like/Malawi
49
2.4380-3.0480
2.7953
2.7569-2.8336
0.1335
0.0191
An. funestus /Madagascar
18
3.0480-3.3530
3.2208
3.1789-3.2628
0.0843
0.0199
An. funestus
/Malawi
18
2.7430-3.2320
2.9192
2.8605-2.9780
0.1182
0.278
Page 166
165
APPENDIX VI
Ethical clearance waiver
Page 168
167
APPENDIX VII
Published manuscript I
Vezenegho, S. B., Bass, C., Puinean, M., Williamson, M. S Field, L. M., Coetzee, M. and
Koekemoer, L. L (2009). Development of multiplex real-time PCR assays for identification
of members of the Anopheles funestus species group. Malaria Journal, 8:282.
Contribution:
I carried out the laboratory work, interpretation of all results and wrote the first and
subsequent drafts on the manuscript.
Page 169
168
See attachment Appendix VII
Page 170
169
REFERENCES
Abbott W. S. (1925). A method of computing the effectiveness of an insecticide. Journal of
Economic Entomology, 18:265-266.
Abilio, A. P., Kleinschmidt, I., Rehman, A. M., Cuamba1, N., Ramdeen, V., Mthembu, D.
S., Coetzer, S., Maharaj, R., Wilding, C. S., Steven, A., Coleman, M., Hemingway, J. and
Coleman, M. (2010).The emergence of insecticide resistance in central Mozambique and
potential threat to the successful indoor residual spraying malaria control programme. Malaria
Journal, 10:110.
Afonina, I., Zivarts, M., Kutyavin, I., Lukhtanov, E., Gamper, H. and Meyer, R. B.
(1997). Efficient priming of PCR with short oligonucleotides conjugated to a minor groove
binder. Nucleic Acids Research, 25:2657-2660.
Bass, C., Nikou, D., Donnelly, M. J., Williamson, M. S., Ranson, H., Ball, A., Vontas, J.
and Field, L. M. (2007a). Detection of knockdown resistance (kdr) mutations in Anopheles
gambiae: a comparison of two new high-throughput assays with existing methods. Malaria
Journal 2007, 6:111.
Bass, C., Williamson, M. S., Wilding, C. S., Donnelly, M. and Field, L. M. (2007b).
Identification of the main malaria vectors in the Anopheles gambiae species complex using a
TaqMan real-time PCR assay. Malaria Journal, 6:155.
Page 171
170
Bass, C., Nikou, D., Blagborough, A. M., Vontas, J., Sinden, R. E, Williamson, M. S. and
Field, L. M. (2008). PCR-based detection of Plasmodium in Anopheles mosquitoes: a
comparison of a new high-throughput assay with existing methods. Malaria Journal, 7:177
Beier, J. C., Perkins, P. V., Wirtz, R. A., Koros, J., Diggs, D., Gargan, T. PII. and Koech,
L. K. (1988). Blood-meal identification by direct enzyme-linked immunosorbent assay
(ELISA) tested on Anopheles (Diptera: Culicidae) in Kenya. Journal of Medical Entomology,
25:9-16.
Beerntsen, B. T., James, A. A. and Christensen, B. M. (2000). Genetics of mosquito vector
competence. Microbiology and Molecular Biology Reviews, 64:15-137.
Bigoga, J. D., Manga, L., Titanji, V. P., Coetzee, M. and Leke, R. G. (2007). Malaria
vectors and transmission dynamics in coastal south-western Cameroon. Malaria Journal, 6:5.
Brengues, C., Hawkes, N. J., Chandre, F., McCarroll, L., Dunchon, S., Guillet, P.,
Manguin, S., Morgan, J. C. and Hemingway, J. (2003). Pyrethroid and DDT cross-
resistance in Aedes aegypti is correlated with novel mutations in the voltage-gate sodium
channel gene. Medical and Veterinary Entomology, 17:87-94.
Chapman, H. C. (1974). Biological control of mosquito larvae. Annual Review of
Entomology, 19:33-59.
Page 172
171
Charlwood, J. D., Thompson, R. and Madsen, H. (2003). Observations on the swarming
and mating behaviour of Anopheles funestus from southern Mozambique. Malaria Journal, 2:
2.
Chiphwanya, J. A. (2004). Evaluation of insecticide susceptibility in malaria vector
mosquitoes and their role in malaria transmission in central Malawi. M.Sc Thesis, University
of Witswatersrand, South Africa.
Claridge, M. F., Dawah, H. A. and Wilson, M. R. (1997). Practical approaches to species
concepts for living organisms. Species: the units of biodiversity. Chapman and Hall, London.
Coetzee, M. and Fontenille, D. (2004). Advances in the study of Anopheles
funestus, a major vector of malaria in Africa. Insect Biochemistry and Molecular Biology, 34:
599-605.
Cohuet, A., Simard, F., Toto, J., Kengne, P., Coetzee, M. and Fontenille, D. (2003).
Species identification within the Anopheles funestus group of malaria vectors in Cameroon
and evidence for new species. American Journal of Tropical Medicine and Hygiene, 62:200-
205.
Coleman, P. G. and Alphey, L. (2004). Editorial: Genetic control of vector
populations: an imminent prospect. Tropical Medicine and International Health, 9:
433-437.
Page 173
172
Collins, F., Mendez, A. M., Rasmussen, M. O., Mehaffey, C. F., Besansky, N. J. and
Finnerty, V. (1987). A ribosomal RNA gene probe differentiates member species of the
Anopheles gambiae complex. American Journal of Tropical Medicine and Hygiene, 37:37-41.
Collins, F. H., Porter, C. H. and Cope, S. E. (1990). Comparison of rDNA and mtDNA in
sibling species Anopheles freeborni and Anopheles hermsi. American Journal of Tropical
Medicine and Hygiene, 42:417-423.
Collins, F. H. and Paskewitz, S. M. (1995). Malaria: current and future prospects for control.
Annual Review of Entomology, 40:195-219.
Coluzzi, M. and Sabatini, A. (1967). Cytogenetic observations on species A and B of the
Anopheles gambiae complex. Parassitologia, 9:73-88.
Costantini, C, M., Sagnon, N. F., Ilboundo-Sanogo, E., Coluzzi, M. and Bocolini, D.
(1999). Chromosomal and bionomic heterogeneities suggest incipient speciation in Anopheles
funestus from Burkina Faso. Parassitologia, 41:595-611.
“Countries of the world. Country profile: Malawi”
<http://www.infoplease.com/ipa/A0107747>[ accessed 20 March 2011].
Cox-Singh, J., Davis, T. M., Lee, K., Shamsul, S. S., Matusop, A., Ratnam, S., Rahman,
H. A., Conway, D. J. and Singh, B. (2007). Plasmodium knowlesi malaria in humans is
Page 174
173
widely distributed and potentially life threatening. Infectious Disease Society of America, 46:
165-171.
Cracraft, J. (1983). Species concepts and speciation analysis. Current Ornithology, 1:159-
187.
Dabire, K. R., Diabaté, A., Namountougou, M., Toé, K. H., Ouari, A., Kengne, P., Bass,
C. and Baldet, T. (2009). Distribution of pyrethroid and DDT resistance and the L1014F kdr
mutation in Anopheles gambiae s.l. from Burkina Faso (West Africa). Transactions of the
Royal Society of Tropical Medicine and Hygiene, 103:1113-1120.
Davidson, G. (1969). The potential use of sterile hybrid males for the eradication of member
species of the Anopheles gambiae complex. Bulletin of the World Health Organization, 40:
211-228.
De Meillon, B. and Evans, A. M. (1935). Two new anophelines from South Africa.
Annals of Tropical. Medicine and Parasitology, 29:91.
De Meillon, B., Van Eeden. G, J., Coetzee, L., Coetzee, M., Meiswinkel, R. Du Toit, C. L.
N. and Hansford, C. F. (1977). Observations on a species of the Anopheles funestus
subgroup, a suspected exophilic vector of malaria parasites in the north-eastern Transvaal,
South Africa. Mosquito News, 37:657-661.
Page 175
174
Dobzhansky, T. (1935). A critique of the species concept in biology. Philosophy of Science,
2:344-355.
Durnez, L., Van Bortel, W., Denis, L., Roelants, P., Veracx, A., Trung, H., Sochantha, T.
and Marc Coosemans. (2011). False positive circumsporozoite protein ELISA: a challenge
for the estimation of the entomological inoculation rate of malaria and for vector
incrimination. Malaria Journal, 10:195.
Durvasula, R. V., Gumbs. A., Panackal. A., Kruglov. O., Askoy. S., Merrifield. R. B.,
Richards, F. F. and Beard. C. B. (1997). Prevention of insect-borne disease: an approach
using transgenic symbiotic bacteria. Proceedings of the National Academy of Sciences of the
United States of America, 94:3274-3278.
Franz, G. and Savakis, C. (1991). Minos, a new transposable element from Drosophila
hydei, is a member of the Tc1-like family of transposons. Nucleic Acids Research, 19(23):
6646.
Garnham, P. C. C. (1966). Malaria parasite and other haemosporidia. Blackwell Scientific
Publications, Oxford.
Garros. C., Koekemoer, L. L., Kamau., Awolola, T. S., Van Bortel. W., Coetzee, M.,
Coosemans, M. and Manguin. S. (2004). Restriction fragment length polymorphism method
for the identification of major African and Asian malaria vectors within the Anopheles
Page 176
175
funestus and An. minimus groups. American Society of Tropical Medicine and Hygiene, 70(3):
260-265.
Giglio, S., Monis, P. T. and Saint, C. P. (2003). Demonstration of preferential binding of
SYBR Green I to specific DNA fragments in realtime multiplex PCR. Nucleic Acids Research,
31(22):e136.
Gillies, M. T. and Furlong, M. (1964). An investigation into the behaviour of Anopheles
parensis Gillies at Malindi on the Kenya coast. Bulletin of Entomological Research, 55:1-16.
Gillies, M. T. and De Meillon, B. (1968). The Anophelinae of Africa South of the Sahara.
Publications of the South African Institute for Medical Research, Johannesburg. No, 54.
Gillies, M. T. and Coetzee, M. (1987). A supplement to the Anophelinae of Africa South of
the Sahara. Publications of the South African Institute for Medical Research,
Johannesburg. No. 55.
Gonzalez, I. L., Gorski, J. L., Campen, T. J., Dorney, D. J., Erickson, J. M., Sylvester, J.
E. and Schmickel, R. D. (1985). Variation among human 28S ribosomal RNA genes
Proceedings of the Natational Academy of Science of the United State of America, 82:7666-
7670.
Google earth map (http://maps.google.co.za, accessed on 20 May 2011).
Page 177
176
Green, C. A. and Hunt, R. H. (1980). Interpretation of variation in ovarian polytene
chromosomes of Anopheles funestus Giles, A. parensis Gilies and A. aruni. Genetica, 51:187-
198.
Green, C. A. (1982). Clasdistic analysis of mosquito chromosome data (Anopheles (Cellia)
Myzomyia). Journal of Heredity, 73:2-11.
Harbach, R. E. (2004). The classification of the genus Anopheles (Diptera: Culicidae): a
working hypothesis of phylogenetic relationships. Bulletin of Entomological Research, 94:
537-553.
Hargreaves, K., Koekemoer, L. L., Brooke, B. D., Hunt, R. H., Mthembu, J. and Coetzee,
M. (2000). Anopheles funestus resistant to pyrethroid insecticides in South Africa. Medical
and Veterinary Entomology, 14:181-189.
Hassan, M. M., El-Motasim, W. M., Ahmed, R. T. and El-Sayed, B. B. (2010). Prolonged
colonisation, irradiation, and transportation do not impede mating vigour and competitiveness
of male Anopheles arabiensis mosquitoes under semi-field conditions in Northern Sudan.
Malaria World Journal, 1:2.
Helinski. M. E. H., Hassan, M. M., El-Motasim, W. M., Malcolm, C. A., Knols, B. G. J.
and El-Sayed, B. (2008). Towards a sterile insect technique field release of Anopheles
arabiensis mosquitoes in Sudan: Irradiation, transportation, and field cage experimentation.
Malaria Journal, 7:65.
Page 178
177
Hemingway, J., Hawkes, N. J., McCarroll, L. and Ranson, H. (2004). The molecular basis
of insecticide resistance in mosquitoes. Insect Biochemistry and
Molecular biology, 43:653-665.
Hunt, R. H. (1973). A cytological technique for the study of the Anopheles gambiae complex.
Parassitologia, 15:137-139.
Hunt, R. H., Coetzee, M. and Fettene, M. (1998). The Anopheles gambiae complex: a new
species from Ethopia. Transactions of the Royal Society of Tropical Medicine and Hygiene,
92:231-235.
Hunt, R. H., Edwardes, M. and Coetzee, M. (2010). Pyrethroid resistance in southern
African Anopheles funestus extends to Likoma Island in Lake Malawi. Parasites and Vectors,
3:122.
Hunter R, L., LaJeunesse, T. C. and Santos, S. R. (2007). Structure and evolution of the
rDNA internal transcribed spacer (ITS) region 2 in the symbiotic dinoflagellates
(Symbiodinium, Dinophyta). Journal of Phycology, 43:120-128.
Hwang Ui-Wook. and Kim Won (1999). General properties and phylogenetic utilities of
nuclear ribosomal DNA and mitochondrial DNA commonly used in molecular systematics.
The Korean Journal of Parasitology, 37:215-224.
Page 179
178
Ito, J., Ghosh, A., Moreira, L.A., Wimmer, E. A. and Jacobs-lorena, M. (2002).
Transgenic anopheline mosquitoes impaired in transmission of a malaria parasite. Nature,
417: 452-455.
Kamau, L., Koekemoer, L. L., Hunt, R. H. and Coetzee, M. (2003). Anopheles parensis:
the main member of the Anopheles funestus species group found resting inside human
dwellings in Mwea area of central Kenya towards the end of the rainy season. Journal of the
American Mosquito Control Association, 19:130-133.
Kazembe, L. N., Kleinschmidt, I., Holtz, T. H. and Sharp, B. L. (2006). Spatial analysis
and mapping of malaria risk in Malawi using point-referenced prevalence of infection data.
International Journal of Health Geographics, 5:41.
Kent, R. J. and Norris, D. E. (2005). Identification of mammalian blood meals in mosquitoes
by a multiplexed polymerase chain reaction targeting cytochrome b. American Journal of
Tropical Medicine and Hygiene, 73:336-342.
Kent, R. J., Thuma, P. E., Mharakurwa, S. and Norris, D. E. (2007). Seasonality, blood
feeding behaviour, and transmission of Plasmodium falciparum by Anopheles arabiensis after
an extended drought in southern Zambia. Journal of Tropical Medicine and Hygiene, 76:267-
274.
Kleinschmidt, I., Sharp, B., Benavente, L. E., Schwabe, C., Torrez, M., Kuklinski, J.,
Morris, N., Raman, J. and Carter, J. (2006). Reduction in infection with Pasmodium
Page 180
179
falciparum one year after the introduction of malaria control interventions on Bioko Island,
Equatorial Guinea. American Journal of Tropical Medicine and Hygiene, 74:972-978.
Koekemoer, L. L., Coetzee, M. and Hunt, R. H. (1998). Hpa II endonuclease distinguishes
between two species in the Anopheles funestus group. Insect Molecular Biology, 7:273-277.
Koekemoer, L. L., Lochouarn, L. L., Hunt, R. H. and Coetzee, M. (1999). Single-strand
conformation polymorphism analysis for identification of four members of the Anopheles
funestus (Diptera: Culicidae) group. Journal of Medical Entomology, 36:125-130.
Koekemoer, L. L., Rankoe, E. M., La Grange, J. P., Govere, J. and Coetzee, M., (2001).
False detection of Plasmodium falciparum sporozoite in Anopheles marshallii group of
mosquitoes. Journal of the American Mosquito Control Association, 17:160-165.
Koekemoer, L. L., Kamau, L., Hunt, R. H. and Coetzee, M. (2002). A cocktail polymerase
chain reaction assay to identify members of the Anopheles funestus (Diptera: Culicidae) group.
American journal of Tropical Medicine and Hygiene, 66:804-811.
Koekemoer, L. L., Kamau, L., Garros, C., Manguin, S., Hunt, R. H. and Coetzee, M.
(2006). Impact of the rift valley on restriction fragment length polymorphism typing of the
African malaria vector Anopheles funestus (Diptera: Culicidae). Journal of Medical
Entomology, 43:1178-1184.
Page 181
180
Kwapata, K., Mwase, W. F., Bokosi, J. M., Kwapata, M. B. and Munyenyembe, P.
(2007). Genetic diversity of Annona senegalensis Pers. Populations as revealed by simple
sequence repeats (SSRs). African Journal of Biotechnology, 6(10):1239-1247.
Lekanne, D., Fijnvandraat, A. C., Ruijter, J. M. and Moorman, A. F. (2002). Sensitivity
and accuracy of quantitative real-time polymerase chain reaction using SYBR green I depend
on c DNA synthesis conditions. Analytical biochemistry, 307:63-69.
Liew, M., Pryor, R., Palais, R., Meadows, C., Erali, M., Lyon, E. and Wittwer, C. (2004)
Genotyping of single-nucleotide polymorphisms by high resolution melting of small
amplicons. Clinical chemistry, 50:1156-1164.
Lines, J. D. (1996). The Technical Issues. Net gain, a new method for preventing malaria
deaths (C, Lengeler, J Cattani and D, de Savigny) IDRC/WHO, Geneva, pp. 17-53.
Livak, K. J. (1984): Organization and mapping of a sequence on the Drosophila
melanogaster X-chromosome and Y-chromosome that is transcribed during spermatogenesis.
Genetics, 107:611-634.
Lochouarn, L., Dia, I., Boccolini, D., Coluzzi, M. and Fontenille. (1998). Bionomical and
cytogenetic heterogeneities of Anopheles funestus in Senegal. Transactions of the Royal
Society of Tropical Medicine and Hygiene, 92:607-612.
Page 182
181
Lochouarn, L. and Fontenille, D. (1999). ELISA detection of malaria sporozoites: false-
positive results in Anopheles gambiae s.l. associated with bovine blood meals.Transactions of
the Royal Society of Tropical Medicine and Hygiene, 93:101-102.
Lyamiche, V., Brow, M. A. D. and Dahlberg, J. E. (1993). Structural specific
endonucleolytic cleavage of nucleic acid by eubacterial DNA polymerase. Science, 260:778-
783.
Lyimo, E. O. and Takken, W. (1993). Effects of adult body size on fecundity and pre-gravid
rate of Anopheles gambiae females in Tanzania. Medical Veterinary Entomology, 7:328-332.
Madhora, M., Maruyama, K. and Hartl, D. L. (1991). Molecular and functional analysis of
the mariner mutator element Mosl in Drosophila. Genetics, 128:311-318.
Majambere, S., Lindsay, S. W., Green, C., Kandeh, B. and Fillinger, U. (2006). Microbial
larvicides for malaria control in The Gambia. Malaria Journal, 6:76.
Mallet, J. (1995). A species definition for the modern synthesis. Trends in Ecology and
Evolution, 10:194-299.
Martinez-Torres, D., Chandre, F., Williamson, M. S., Darriet, F., Berge, J. B.,
Devonshire, A. L., Guillet, P., Pasteur, N. and Pauron, D. (1998). Molecular
characterisation of pyrethroid knockdown resistant (kdr) in the major malaria vector,
Anopheles gambiae s.s. Insect Molecular Biology, 7:179-184.
Page 183
182
Mayr, E. (1942). Systematics and the origin of Species. Columbia University Press, New
York.
Mayr, E. (1996). What is a species, and what is not? Philosophy of Science, 63:262-277.
Michel, A. P., Guelbeogo, W. M., Grushko, O., Schemerhorn, B. J., Kern, M., Willard,
M. B., Sagnon, N., Constantini, C. and Besansky, N. J. (2005a). Molecular differentiation
between chromosomal defined incipient species of Anopheles funestus. Insect Molecular
Biology, 14:375-387.
Michel, A. P., Ingrasci, M. J., Schemerhorn, B. J., Kern, M., LeGoff, G., Coetzee, M.,
Elissa, N., Fontenille, D., Vulule, J. and Lehmann, T. (2005b). Rangewide population
genetic structure of the African malaria vector Anopheles funestus. Molecular Ecology, 14:
4235-4248.
Monis, P. T., Giglio, S. and Saint, C. P. (2005). Comparison of SYTO9 and SYBR Green I
for real-time polymerase chain reaction and investigation of the effect of dye concentration on
amplification and DNA melting curve analysis. Analytical Biochemistry, 340:24-34.
Morgan, J. C., Irving, H., Okedi, L. M., Steven, A. and Wondji, C. S. (2010). Pyrethroid
resistance in an Anopheles funestus population from Uganda. PLoS ONE 5(7):e11872.
doi:10.1371/journal.pone.0011872.
Page 184
183
Mouatcho, J. C., Keith Hargreaves., K., Koekemoer, L. L., Brooke, B. D., Oliver, S. V.,
Hunt, R. H. and Coetzee, M. (2007). Indoor collections of the Anopheles funestus group
(Diptera: Culicidae) in sprayed houses in northern KwaZulu-Natal, South Africa. Malaria
Journal, 6:30.
Mouchet, J., Manguin, S., Sircoulon, J., Laventure, S., Faye, O., Onapa, A. W.,
Carnevale, P., Julvez, J. and Fontenille, Didier. (1998). Evolution of malaria in
Africa for the past 40 years: impact of climatic and human factors. Journal of the
American Mosquito Control Association, 14:121-130.
Mulla, M. S., Thavara, U., Tawatsin, A., Chomposri, J. and Su, T. (2003).
Emergence of resistance and resistance management in field populations of tropical Culex
quinquefasciatus to the microbial control agent Bacillus sphaericus. Journal of the American
Mosquito Control Association, 19:39-46.
Nauen, R. (2006). Insecticide resistance. Bayer Environmental Science Journal, 18:10-15.
N’Guessan, R., Corbel, V., Akogbéto, M. and Rowland M (2007). Reduced efficacy of
insecticide-treated nets and indoor residual spraying for malaria control in pyrethroid
resistance area, Benin. Emerging Infectious Disease.13:199-206
Page 185
184
Olsson, K. E., Higgs, P. J., Gaines, A. M., Powers, B. S., Davis, K. I., Kamrud, J. O.,
Carlson, C. D., Blair. and Beaty, B. J. (1996). Genetically engineered resistance to dengue-2
virus transmission in mosquitoes. Science, 272:884-886.
Paterson, H. E. H. (1985). The recognition concept of species. Species and speciation, pp. 21-
29. Transvaal Museum, Pretoria.
Paterson, H. E. H. (1993). Evolution and the recognition concept of species, collected
Writings of H.E.H. Paterson. Johns Hopkins University Press, Baltimore, MD.
Pates, H. and Curtis, C. (2005). Mosquito behaviour and vector control. Annual Review of
Entomology, 50:53-70.
PRESIDENT‟S MALARIA INITIATIVE: Malaria Operational Plan -FY (2010) MALAWI.
PRESIDENT‟S MALARIA INITIATIVE: Malaria Operational Plan -FY (2011) MALAWI.
Rehman, A. M., Coleman, M., Schwabe, C., Baltazar, G., Matias, A., Gomes, I. R.,
Yellott, L., Aragon, C., Nchama, G. N., Mzilahowa, T., Rowland, M. and Kleinschmidt, I.
(2011). How much does malaria vector control quality matter: the epidemiological impact of
holed nets and inadequate indoor residual spraying. PLoS ONE | www.plosone.org. e19205
Page 186
185
Roberts, D. W. and Hajek, A. E. (1992). Entomopathogenic fungi as bioinsecticides In:
Leathman, G. F. Ed. Frontiers in Industrial Mycology: Chapman and Hall Inc. Routledge, Pp.
144-159.
Rose, I. R. (2001). (Pesticides and public health): Intergrated methods of mosquito
management. Emerging Infectious Diseases, 7:17-23.
Rossello-Mora, R. and Amann, R. (2001). The species concept for prokaryotes. Federation
of European Microbiological Societies Microbiology Reviews, 25:39-67.
Sambrook, J., Fritsch, E. F. and Maniatis, T. (1989). DNA sequencing in: Molecular
Cloning, a laboratory manual, Nolan C. (Editor). New York: New York: Cold Spring harbour
Laboratory, press pp, 13.3-13.10., USA.
Scott, J. A., Brogdon, W. G., and Collins, F. H. (1993). Identification of single specimens of
the Anopheles gambiae complex by the polymerase chain reaction. American Journal of
Tropical Medicine and Hygiene, 49:520-529.
Service, M. W. (1983). Biological control of mosquitoes, has it a future? Mosquito
News, 43:113-120.
Service, M. W. (1984). Problems of vector-borne diseases and irrigation projects. Insect
Science and Its Application, 5:227-231.
Page 187
186
Simpson, G. G. (1951). The species concepts. Evolution, 5:285-298.
Skovmand, O. and Sanogo, E. (1999). Experimental formulations of Bacillus sphaericus and
B. thuringiensis isrealensis against Culex quinquefasciatus and Anopheles gambiae (Diptera:
Culicidae) in Burkina Faso. Journal of Medical Entomology, 36:62-67.
Snounou, G., Viriyakosol, S., Zhu, X. P., Jarra, W., Pinheiro, L., do Rosario, V. E.,
Thaithong, S. and Brown, K. N. (1993). High sensitivity of detection of human malaria
parasite by the use of nested polymerase chain reaction. Molecular and Biochemical
Parasitology, 61:315-320.
Spillings, B., Basil, B. D., Koekemoer, L. L., Chiphwanya, J., Coetzee, M. and Hunt, R,
H. (2009). A new species concealed by Anopheles funestus Gilies, a major malaria vector in
Africa. American Journal of Tropical Medicine and Hygiene, 81:510-515.
Sylla, E. H., Kun, J. F. and Kremsner, P. G. (2000). Mosquito distribution and
entomological inoculation rates in three malaria-endemic areas in Gabon. Transactions of the
Royal Society of Tropical Medicine and Hygiene, 94:652-656.
Tassanakajon, A., Boonsaeng, V., Wilairat, P. and Panyim, S. (1993). Polymerase chain
reaction detection of Plasmodium falciparum in mosquitoes. Transactions of the Royal Society
of Tropical Medicine and Hygiene, 87:273-5.
Page 188
187
Temu, E. A., Minjas, J. N., Tuno, N., Kawada, H. and Takagi, M. (2007). Identification of
four members of the Anopheles funestus (Diptera: Culicidae) group and their role in
Plasmodium falciparum transmission in Bagamoyo coastal Tanzania. Acta Tropica, 102:119-
125.
Van Bortel, W., Trung, H. D., Roelants, P., Harbach, R. E., Backeljau, T. and
Coosemans, M. (2000). Molecular identification of Anopheles minimus s.l. beyond
distinguishing the members of the species complex. Insect Molecular Biology, 9:335-340.
Van der Sande, C. A. F. M., Kwa, M., van Nues, R. W., van Heerikhuizen, H., Raue, H.
A. and Planta, R. J. (1992). Functional analysis of internal transcribed spacer 2 of
Saccharomyces cerevisiae ribosomal DNA. Journal Molecular Biology, 223:889-910.
Weeto, M. M., Koekemoer, L. L., Kamau, L. , Hunt, R. and Coetzee, M. (2004).
Evaluation of a species-specific PCR assay for the Anopheles funestus group from eleven
African countries and Madagascar. Transactions of the Royal Society of Tropical Medicine
and Hygiene, 98:142-147.
Wheeler, Q. D. and Platnick, N. I. (2000). A critique from the wheeler and Platnick
phylogenetic species concept perspective: Problems with alternative concepts of species.
Species concepts and phylogenetic theory (Ed. Q. D. Wheeler and R. Meier), pp. 133-145,
Columbia University Press, New York.
Page 189
188
Whiteacre, D. M. and Ware, G. W. (2004). The pesticide book. 6th Edition, Meister Media
Worldwide, Welloughby, Ohio.
Wilkes, T. J., Matola, Y. G. and Charlwood, J. D. (1996). Anopheles rivulorum, a vector of
human malaria in Africa. Medical and Veterinary Entomology, 10:108-110.
Wirtz R, A., Zavala, F., Charoenvit, Y., Cambell, G. H., Burkot, T. R., Schneider, I.,
Esser, K. M., Beaudoin, R. L. and Andre, G. R. (1987). Comparative testing of Plasmodium
falciparum sporozoite monoclonal antibodies for ELISA development. Bulletin of the World
Health Organanization, 65:39-45.
Wirtz, R. A., Sattabonkot, J., Hall, T., Burkot, T. R. and Rosenberg, R. (1992).
Development and evaluation of an ELISA for plasmodium vivax-VK247 sporozoites. Journal
of Medical Entomology, 29:854-57.
World Health Organisation. (1998). Test procedures for insecticide resistance monitoring in
malaria vectors, bio-efficacy and persistence of insecticides on treated surfaces. Document
WHO/CDS/CPC/MAL/98.12. Geneva, Switzerland.
World Health Organization (2001) Chemistry and specifications of pesticides. World Health
Organization Technical Series report, 899:1-68.
World Health Organization. (2004). Global strategic framework for integrated vector
management. Document WHO/CDC/CPE/PVC/2004.10. Geneva, Switzerland.
Page 190
189
World Health Organization. (2005). International Travel and Health.
World Health Organization. (2006). Malaria vector control and personal protection. WHO
technical report series, No. 936.
World Health Organization. (2008). World Malaria Report.
World Health Organization. (2010). The World Malaria Report. Geneva, Switzerland.
Young, M. D., Baerg, D. C. and Rossan, R. N. (1971). Sporozoite transmission and serial
blood passage of Plasmodium vivax in squirrel monkeys (Saimiri sciureus). Transactions of
the Royal Society of Tropical Medicine and Hygiene, 65:835-836.
Zaim, M., Aitio, A. and Nakashima, N (2000). Safety of pyrethroid-treated mosquito
nets. Medical and Veterinary Entomolology,14:1-5.


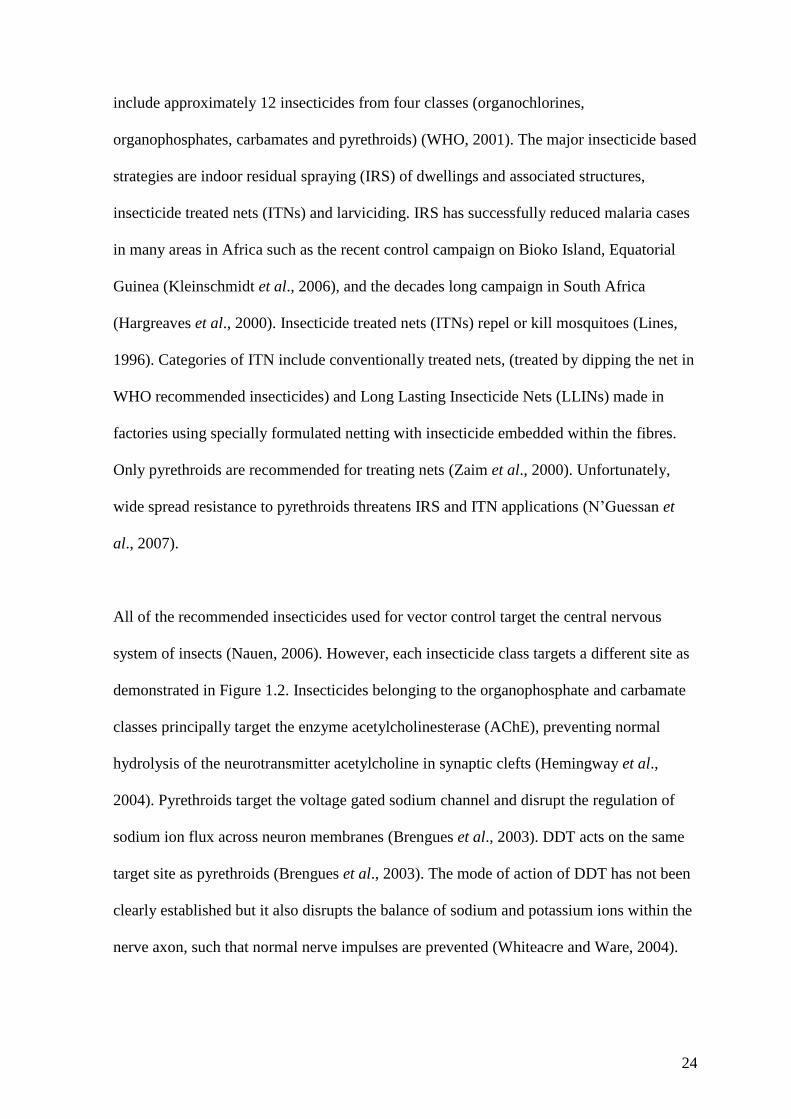


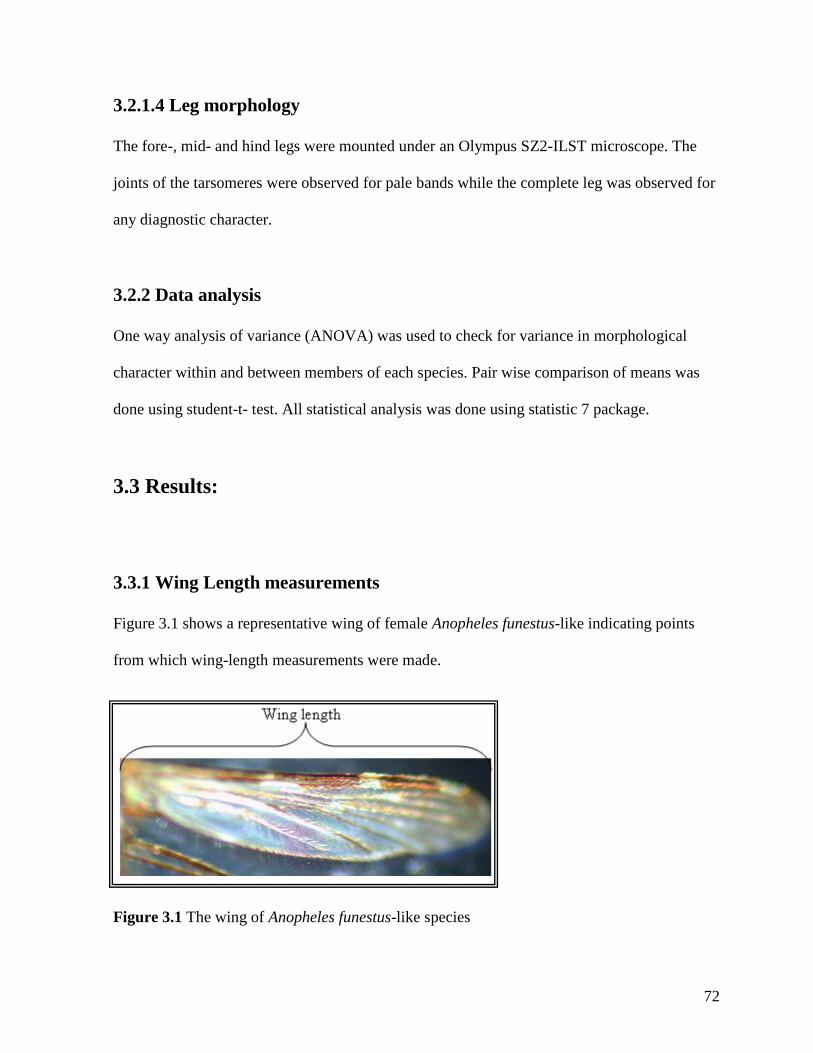


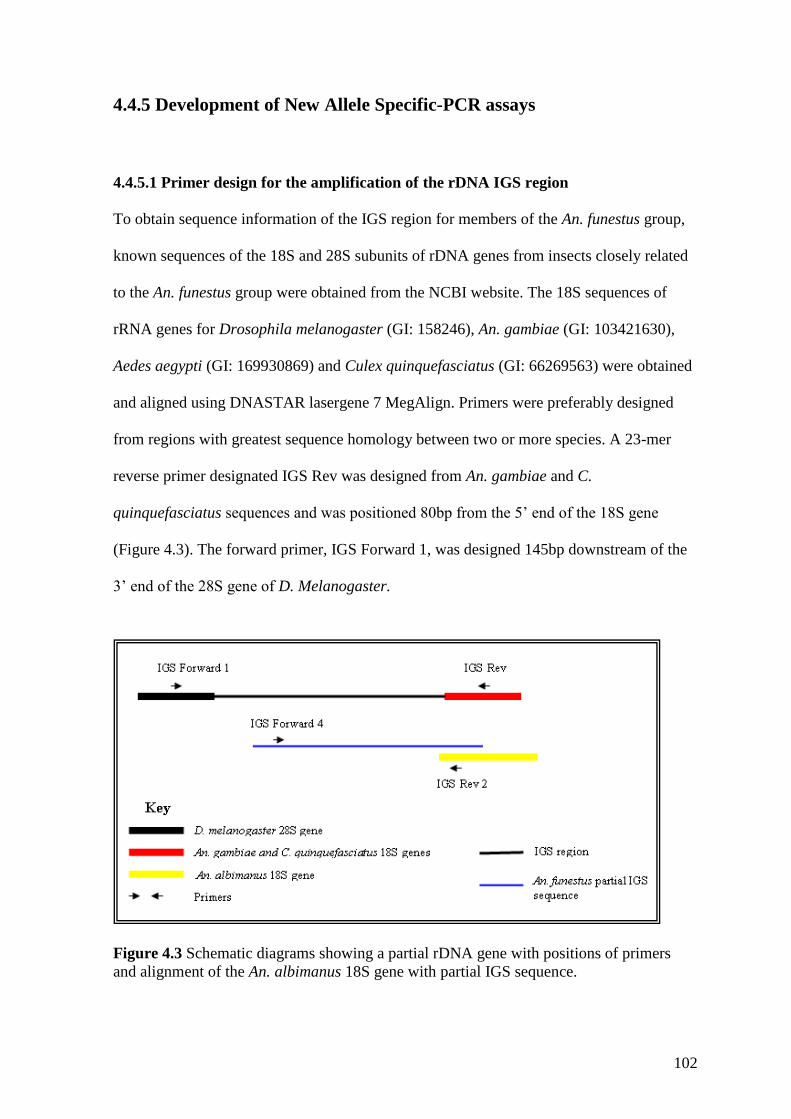


![Anopheles (Diptera: Culicidae), forest malaria vectors, in ... · complex [19] with Anopheles leucosphyrus Dönitz, 1901, Anopheles latens Sallum and Peyton, 2005, and Anopheles introlatus](https://static.documents.pub/doc/80x56/5d52cc0d88c993073e8b8565/anopheles-diptera-culicidae-forest-malaria-vectors-in-complex-19.jpg)


