A Systematic Study of the Quantitative Effects of Instrument Control on Analytical Precision in Flame Ionization Gas Chromatography D. W. Grant and Austin Clarke The Coal Tar Research Association, Gomersal, Cleckheaton, Yorks, BDI94HH, England Statistical experiments have been performed to in- vestigate the effects of variations in gas flow rates, detector temperature, sample injection conditions, detector polarization voltage, and method of peak measurement, on analytical precision. The results enable estimates to be made of the precision of instru- mental control necessary to achieve set precision levels in analysis. Recommendations are also made for achieving higher than normal precision, particu- larly in relation to peak measurement, sample in- troduction and the use of internal standards. DURING THE PAST FEW years gas chromatographic methods have become increasingly specified as standard methods for the analysis of industrial products. This has led to a pressing need for a systematic assessment of instrumental effects on analytical precision to provide information on the degree of control that is necessary to achieve set levels of precision. This need was recognized by the British Standards Institute during the preparation of a recent publication (I) and con- sequently they initiated a research project to provide this in- formation. The results described in this paper concern the part of the project dealing with flame ionization GC using packed col- umns. This is probably the most widely used form of gas chromatography currently practised and, consequently, where the greatest need for knowledge lies. It must be recognized, however, that comprehensive and generalized data cannot be supplied for all the variables involved because of the differ- ences which exist between apparatus. The FID for instance has response characteristics which depend on its particular geometric design and so the levels of the critical variables necessary to achieve a given level of precision in one detector are unlikely to apply to another detector of different design. The effects of changes in the levels of these variables, however, are likely to be of the same order in all detectors provided the working conditions are set at their optimum values, and this assumption has been made in the recommendations resulting from this work. There are two basic types of error which affect the precision of GC analysis, both of which are loosely described as instru- mental errors, ciz: (a) errors due to the choice of instru- mental conditions and to variations in their levels; (b) errors directly attributable to the operator in handling instruments and in the interpretation of results. Errors from source (a) are partly systematic in nature and partly random. The systematic errors can be minimized by an appropriate choice of variable levels for the particular type of analysis being performed. This is a matter of good chro- matographic practice, largely, although quantitative informa- tion would be useful in this connection and it is intended to study this aspect in a further project. EXPERIMENTAL The effect of small variations in instrumental conditions, as in error source (a), were assessed by means of experiments (1) British Standard 4587: 1970. in which the changes produced by deliberate alterations of the variables were measured. These changes were large coni- pared with the random variations of the variables under set conditions so that resultant changes in detector response would be statistically different from the normal random variation when there are real effects. When real effects occurred, then the quantitative relationships between the mean magnitude of the change in variable level and the consequent mean change in response were used to derive the precision of control necessary to achieve set levels of precision. The data derived in this way for each variable may depend on the levels of the other variables if there are interactions involved, and then any simple presentation of the results becomes impossible. Such interactions are more likely to exist when the relationships between the relevant variable and the detector response are nonlinear. In such cases there are usually optimum conditions for the most stable operation of the equipment and the data given will in general, be based on the assumption that the chromato- graph is operated at, or close to these optimum conditions. Apparatus. All the work described in this paper was carried out on a Varian series 1800 gas chromatograph, operable either with katharometer or dual fiame ionization detectors. The detector response was measured with a Varian 480 electronic integrator equipped with both elec- tronic and print-out facilities for peak area and retention time. This was chosen from the viewpoint of suitability for testing the various chromatographic systems and not because it was considered to be more precise than other apparatus that is commercially available. The chromatograph was modified to allow accurate read-out of temperature in the column oven and detector ovens by means of calibrated thermometers. All gas supply controls were calibrated by means of a soap bubble flowmeter, with the necessary cor- rections for the water vapor pressure. The detector polar- ization voltage was supplied at two levels, one at 90 V and one at 300 V. Columns were prepared appropriate to the investigation being performed. These were all 0.d. stainless steel columns, packed conventionally, and thoroughly conditioned before use. The major statistical calculations were carried out on a time-sharing computer, using a paper tape input system. Appropriate computer programs for the calculations involved were prepared beforehand in Telcomp I1 programming language. Less routine calculations were performed on an IME 86s electronic calculator and DG408RM programmer. General Investigation of Variables-Experiment A. An experiment was first performed to study the effects and interactions of the six main factors to affect FID response directly, ciz., detector temperature, polarizing voltage, carrier gas, air, and hydrogen flow rates, and sample con- centration. This experiment was a Z6 factorial design in which the effects of each of the six factors on detector re- sponse were studied by changing the values from one level (i) to another level (ii). Details of the experimental design are given in Tables I and 11. Table I shows the conditions and chronological order of chromatograms performed during the course of a working day, and comprises a “set.” Within each set, only the variables “cell voltage” and “sample concentration” were changed. This avoided the necessity of changing those variables which were associated with ANALYTICAL CHEMISTRY, VOL. 43, NO. 14, DECEMBER 1971 1951
Transcript
A Systematic Study of the Quantitative Effects of Instrument Control on Analytical Precision in Flame Ionization Gas Chromatography D. W. Grant and Austin Clarke The Coal Tar Research Association, Gomersal, Cleckheaton, Yorks, BDI94HH, England
Statistical experiments have been performed to in- vestigate the effects of variations in gas flow rates, detector temperature, sample injection conditions, detector polarization voltage, and method of peak measurement, on analytical precision. The results enable estimates to be made of the precision of instru- mental control necessary to achieve set precision levels in analysis. Recommendations are also made for achieving higher than normal precision, particu- larly in relation to peak measurement, sample in- troduction and the use of internal standards.
DURING THE PAST FEW years gas chromatographic methods have become increasingly specified as standard methods for the analysis of industrial products. This has led to a pressing need for a systematic assessment of instrumental effects on analytical precision to provide information on the degree of control that is necessary to achieve set levels of precision. This need was recognized by the British Standards Institute during the preparation of a recent publication ( I ) and con- sequently they initiated a research project to provide this in- formation.
The results described in this paper concern the part of the project dealing with flame ionization GC using packed col- umns. This is probably the most widely used form of gas chromatography currently practised and, consequently, where the greatest need for knowledge lies. It must be recognized, however, that comprehensive and generalized data cannot be supplied for all the variables involved because of the differ- ences which exist between apparatus. The F I D for instance has response characteristics which depend on its particular geometric design and so the levels of the critical variables necessary to achieve a given level of precision in one detector are unlikely to apply to another detector of different design. The effects of changes in the levels of these variables, however, are likely to be of the same order in all detectors provided the working conditions are set at their optimum values, and this assumption has been made in the recommendations resulting from this work.
There are two basic types of error which affect the precision of GC analysis, both of which are loosely described as instru- mental errors, ciz: (a) errors due to the choice of instru- mental conditions and to variations in their levels; (b) errors directly attributable to the operator in handling instruments and in the interpretation of results.
Errors from source (a) are partly systematic in nature and partly random. The systematic errors can be minimized by a n appropriate choice of variable levels for the particular type of analysis being performed. This is a matter of good chro- matographic practice, largely, although quantitative informa- tion would be useful in this connection and it is intended to study this aspect in a further project.
EXPERIMENTAL The effect of small variations in instrumental conditions,
as in error source (a), were assessed by means of experiments
(1) British Standard 4587: 1970.
in which the changes produced by deliberate alterations of the variables were measured. These changes were large coni- pared with the random variations of the variables under set conditions so that resultant changes in detector response would be statistically different from the normal random variation when there are real effects. When real effects occurred, then the quantitative relationships between the mean magnitude of the change in variable level and the consequent mean change in response were used to derive the precision of control necessary to achieve set levels of precision. The data derived in this way for each variable may depend on the levels of the other variables if there are interactions involved, and then any simple presentation of the results becomes impossible. Such interactions are more likely to exist when the relationships between the relevant variable and the detector response are nonlinear. In such cases there are usually optimum conditions for the most stable operation of the equipment and the data given will in general, be based on the assumption that the chromato- graph is operated at, or close to these optimum conditions.
Apparatus. All the work described in this paper was carried out on a Varian series 1800 gas chromatograph, operable either with katharometer or dual fiame ionization detectors. The detector response was measured with a Varian 480 electronic integrator equipped with both elec- tronic and print-out facilities for peak area and retention time. This was chosen from the viewpoint of suitability for testing the various chromatographic systems and not because it was considered to be more precise than other apparatus that is commercially available. The chromatograph was modified to allow accurate read-out of temperature in the column oven and detector ovens by means of calibrated thermometers. All gas supply controls were calibrated by means of a soap bubble flowmeter, with the necessary cor- rections for the water vapor pressure. The detector polar- ization voltage was supplied at two levels, one at 90 V and one at 300 V.
Columns were prepared appropriate t o the investigation being performed. These were all 0.d. stainless steel columns, packed conventionally, and thoroughly conditioned before use.
The major statistical calculations were carried out on a time-sharing computer, using a paper tape input system. Appropriate computer programs for the calculations involved were prepared beforehand in Telcomp I1 programming language. Less routine calculations were performed on an IME 86s electronic calculator and DG408RM programmer.
General Investigation of Variables-Experiment A. An experiment was first performed to study the effects and interactions of the six main factors to affect FID response directly, ciz., detector temperature, polarizing voltage, carrier gas, air, and hydrogen flow rates, and sample con- centration. This experiment was a Z 6 factorial design in which the effects of each of the six factors on detector re- sponse were studied by changing the values from one level (i) to another level (ii). Details of the experimental design are given in Tables I and 11. Table I shows the conditions and chronological order of chromatograms performed during the course of a working day, and comprises a “set.” Within each set, only the variables “cell voltage” and “sample concentration” were changed. This avoided the necessity of changing those variables which were associated with
ANALYTICAL CHEMISTRY, VOL. 43, NO. 14, DECEMBER 1971 1951
Table I. Chronological Order of Chromatograms within a Set with Nominal Cell Voltage and
Sample Component Concentration Sample component
concentration Cell voltage
300 v 90 va (9 (ii)
0.05% (i) 1, 3 2 5% (ii) 4, 6 5
a Excluded in sets 17-24.
Table 11. Set Numbers in Chronological Order with Nominal Gas Flow Rate and Detector Oven Temperature Settings
Nitrogen flow Air Hydrogen Detector oven temperature rate, flow rate, flow rate, 180 "C 250 "C 180 "C
larger setting errors and long equilibration times and con- sequently much greater significance was achieved for the effects of cell voltage and sample concentration. The use of sample concentration as one of the variables was included to test for any nonlinearity of the amplifier and detector. Thus, on changing from 0.05 to 5 concentration, the ampli-
fier range was increased by a factor of 100 t o obtain peaks of the same nominal area. Table I1 shows the chronological order of sets and the levels of the other variables investigated. T h e sample used throughout the test consisted of a mixture of n-propanol, n-butyl acetate, ethyl benzene, o-xylene, chloro- benzene, and cis-dekalin diluted to 0.05 and 5 % in pure cyclohexane. Samples of these mixtures were injected by a standardized procedure into the chromatograph, using a 1 -pl syringe (Hamilton type 7101 CH) fitted with a Chaney adap- tor. The column required to separate these components was 10 f t long and packed with 70J80 mesh Celite containing 20% Carbowax 20M.
RESULTS AND DISCUSSION
The main effects and two-factor interactions are given in Table 111 for individual peak areas and area ratios to ethyl benzene. Five of the six factors studied give significant effects a t higher than the 95 Z probability level on peak area, shown in column (a). The only nonsignificant effect was that due to the change in detector temperature. This does not imply that changes in temperature have no effect on response, but that the effects are not significantly greater than the experimental error. It is seen from columns (b) that most of the significant effects disappear on taking the ratios of peak areas to ethyl benzene. This demonstrates the advantages to be derived from the use of a n internal standard in analysis. The results also demonstrate that similarity of chemical type between the chosen standard and sample tends to give a higher precision than when the sample peak is of different chemical type to the standard. Thus, the effects for the ratios o-xyleneiethyl ben- zene and cis-dekaliniethyl benzene are much lower than for
S = Sample concentration effect. T = Detector oven temperature effect. V = Polarization voltage effect.
area for component at factor level (ii) (a) Average geometric response effect on peak area, where the geometric response is defined by area for component at factor level (i) I
(b) Average geometric response effect on the ratio of component peak area to that of added ethyl benzene. ~~ ~
1952 ANALYTICAL CHEMISTRY, VOL. 43, NO. 14, DECEMBER 1971
- 1 9 - 0 - - F r 2
2 -
1 2 3 4
1’
8.
800 800 300 300
40 80 40 80
b. Effects of air flow rate for various levels of nitrogen and hydrogen Hydrogen flow rate, Nitrogen flow rate,
ml/min ml/min 80 40 80 40
40 40 80 80
c. Effects of hydrogen flow rate for various levels of nitrogen and air Nitrogen flow rate,
1 80 800 2 40 800 3 40 300 4 80 300
Air flow rate, ml/min ml/min
the other components while the effects for n-propanollethyl benzene are the highest.
This is very significant for actual areas but only slightly significant for ratios. This suggests that the effects are due more to non-
The effect of sample concentration is of interest.
linearity of the amplifier range selector than to nonlinearity in the detector, except perhaps in the case of n-propanol. Here the effects on both peak area and relative peak area are higher than for the other compounds, and this is probably due to slight adsorption in the column.
The only two-factor interactions of any importance are those involving gas flow rates, and this is to be expected. The nitrogenlhydrogen and hydrogenlair interactions are particu- larly significant and so meaningful relationships on the effects of variations in these gases on precision are not derivable. Three-factor and higher order interactions were generally of low significance and can be neglected.
The main conclusion to be drawn from this experiment is that the quantitative effects of gas flow rate and detector temperature can be investigated in smaller scale experiments in which the other factors, where there are no significant inter- actions, are maintained constant. The mean effect of cell voltage on response can also be deduced although this does not take into account the possibility of nonlinearity between the two levels of voltage used. Most FID detectors give a plateau region where there is a negligible change in response with voltage but the start of the plateau increases with sample concentration and is critically dependent on cell geometry. McWilliams (2) claims that this plateau is constant at least up to 900 V but Bruderreck et af. (3) state that the response in- creases again at voltages much lower than this. This apparent disagreement is probably explained by interactions between plateau voltages and other detector parameters and so it would be difficult to provide general recommendations on control. However, the effect found in our work is a mean effect which was relatively free from interactions and consequently provides a useful and practicable safe limit when specifying the control of this variable. Further conclusions to be drawn from the results of this experiment are the considerable improvement in precision from the use of relative peak areas in analysis rather than actual areas, and that amplifier range changes during the course of a chromatogram are inadvisable unless the calibra- tion factors relate to the specific ranges used.
Effects of Gas Flow Rate Variations-Experiment B. The 26 designed experiment demonstrated that the relationships between detector response and the flow rates of the three supply gases is complex and obviously the precise character of these relationships will depend on the particular design of the detector. It is reasonable to assume, however, that in the region of optimum performance the effects of variations in the flow rates would be of the same order in any detector and so this assumption has been made to enable generalized conclusions to be reached for the necessary degree of control required for set precision levels.
There were no significant interactions between the gas flow rates and the other cell variables of detector temperature and voltage, Another experiment was therefore performed in which the latter two variables were maintained nominally constant and the effects of the gas flow rates were studied separately. A simple factorial design could not be used for this because of the need to study nonlinear relationships. Instead, detector responses from a I-rnl sample of 5 meth- ane in nitrogen, supplied by a conventional gas sampling valve (Pye-Unicam Ltd.) were measured at ten different nitrogen flow rates, at two different flow rates of each of the other two gases, This was repeated for the air and hydrogen flow rate to give a total of 120 runs. The column used for this work was 4 feet in length and packed with molecular sieve 4A, operated at 60 “C.
(2) I. G. McWilliam, J. Chromatogr., 6, 110 (1961). ( 3 ) H. Bruderreck et a/. , ANAL. CHEM. 36, 461 (1964).
ANALYTICAL CHEMISTRY, VOL. 43, NO. 14, DECEMBER 1971 1953
Table IV. Estimates of Long Term Error Flow rate (mlimin) of:
I ,
Carrier Integrator read-out gas (Nz) Air Hydrogen 1 2
The experimental design gave a good overall impression of the effects of the gas flow rates and the interactions of these effects. These effects, measured as methane peak area by the integrator are shown graphically in Figure 1. Figure l a shows the effect of nitrogen flow rate for the various levels of the air and hydrogen rates used. When packed columns are being used, the nitrogen rate would normally lie in the 40-60 ml/min region and evidently the effects of the hydrogen and air rates can be quite critical, particularly if the air rate is low. Optimum conditions for the air rate would, from Figure l b , be about 500-600 ml/min for this detector. Lower flow rates than this result in a very critical effect on response for small variations, while higher flow rates result in unstable operation, there being a sudden increase in noise level in the region 700- 750 ml/min. Consider now Figure IC, this shows maxima for the higher air rates in the region of 40-50 ml/min of hydrogen. Hence curve 1 in Figure la, curve 2 in Figure lb , and curve 2 in Figure I C probably most closely represent optimum detector operation and so the requirements for the precision of flow rate control to achieve set standards of precision in response can be estimated from these curves (see Table VIII).
The long term errors involved in the experiment were esti- mated from the eight sets of conditions which were performed three times according to the design requirements. Long term error arises from the need to reset the flow rates and from day to day variations in ambient conditions and other experimental parameters. Each set of ten different flow rates was in fact performed consecutively during the same day whenever pos- sible, to confound this error. A comparison between the estimated long term error and that estimated from flow varia- tions alone is given in Table IV. The agreement is generally excellent, which indicates that flow variations are largely responsible for long term errors, and these can be very large. This supports the view that equipment conditions should never be adjusted between the time of calibration and the time of analysis, Alternatively if changes are necessary, due perhaps
to the need to shut down equipment for periods of time, then the apparatus should be recalibrated on each start-up if high standards of precision are required.
Effect of Detector Temperature-Experiment C. The effect of detector temperature on FID response could not be derived from the earlier 26 experiment because of the rela- tively large experimental errors involved. An experimental scheme was therefore devised which allowed a much smaller error to be associated with this variable and its interaction with the gas flow rates. According to this scheme, a set of six samples were chromatographed each day for eight non- consecutive days. Each set consisted of four chromato- grams from a liquid sample and two from a gaseous sample- the experimental conditions for the interactive variables, ciz. hydrogen, nitrogen, and air rates, and detector temperature were each set at two levels in a way that allowed equilibrium conditions to be established for each setting. The method of controlling the detector hydrogen and air supplies had to be improved by the use of thermostatted capillary constrictions which were calibrated before use. The column conditions were the same as for experiment A and two samples were used, ciz., a liquid sample comprising 2z each of butyl acetate, ethyl benzene, o-xylene, and cis-dekalin in cyclo- hexane, and a gas sample comprising 1 methane in nitrogen.
RESULTS AND DISCUSSION
The percentage changes in detector response, relative re- sponse, and auxiliary gas flow rates resulting from an increase in detector oven temperature from 150 to 205 "C are given in Table V. Since these changes in detector temperature also had an effect on the flow rates of the hydrogen and air supplies which modified the detector effects, the results in Table V refer to the detector operated under constant mass flow conditions. The effects on relative response are generally small in com- parison with those on actual areas, only the ratio butyl acetate/ethyl benzene being statistically significant and this is probably due to the difference in chemical type.
1954 ANALYTICAL CHEMISTRY, VOL. 43, NO. 14, DECEMBER 1971
~~
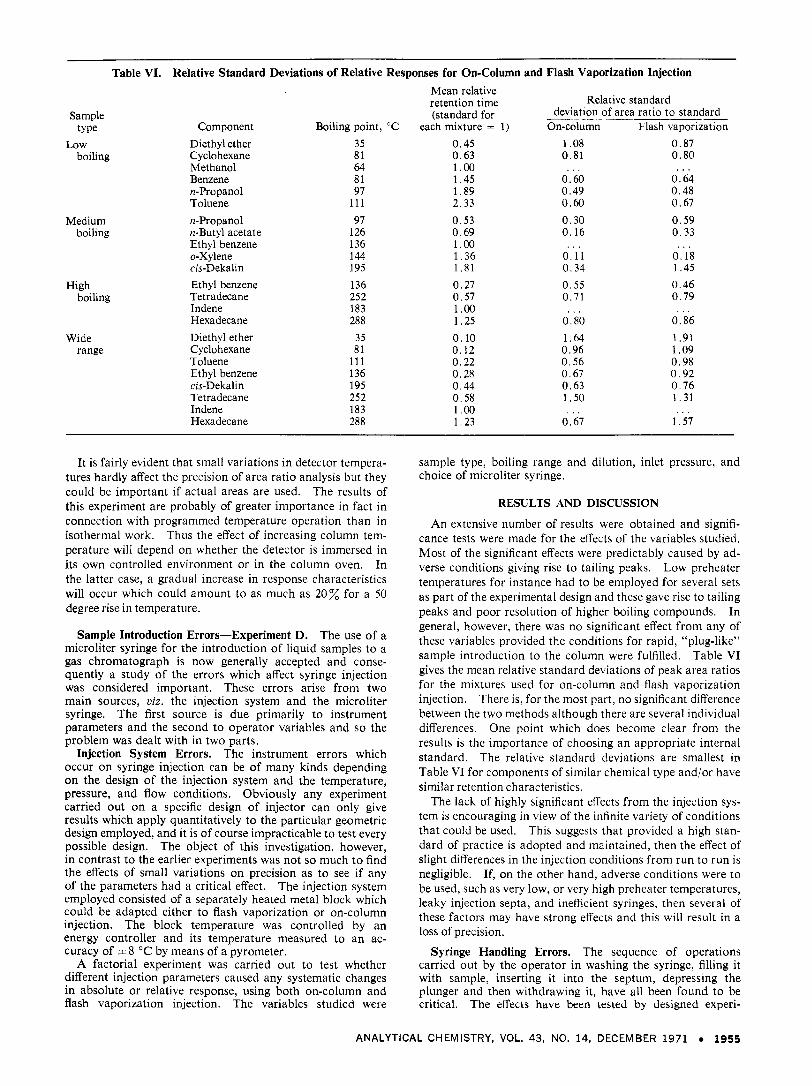
Table VI. Relative Standard Deviations of Relative Responses for On-Column and Flash Vaporization Injection
Relative standard deviation of area ratio to standard
On-column Flash vaporization - _ _ ~ ~ _ _
1.08 0.87 0.81 0.80 . . .
0.60 0.49 0.60 0.30 0.16
0.11 0.34 0.55 0.71
. . .
0.80 1.64 0.96 0.56 0.67 0.63 1 ,50
0.67 . . .
. . . 0.64 0.48 0.67 0.59 0.33
0.18 1.45 0.46 0.79
. . .
0.86 1.91 1.09 0.98 0.92 0.76 1.31
1.57 . . .
It is fairly evident that small variations in detector tempera- tures hardly affect the precision of area ratio analysis but they could be important if actual areas are used. The results of this experiment are probably of greater importance in fact in connection with programmed temperature operation than in isothermal work. Thus the effect of increasing column tem- perature will depend on whether the detector is immersed in its own controlled environment or in the column oven. In the latter case, a gradual increase in response characteristics will occur which could amount to as much as 20% for a 50 degree rise in temperature.
Sample Introduction Errors-Experiment D. The use of a microliter syringe for the introduction of liquid samples to a gas chromatograph is now generally accepted and conse- quently a study of the errors which affect syringe injection was considered important. These errors arise from two main sources, uiz. the injection system and the microliter syringe. The first source is due primarily to instrument parameters and the second to operator variables and so the problem was dealt with in two parts.
Injection System Errors. The instrument errors which occur o n syringe injection can be of many kinds depending o n the design of the injection system and the temperature, pressure, and flow conditions. Obviously any experiment carried out o n a specific design of injector can only give results which apply quantitatively to the particular geometric design employed, and it is of course impracticable to test every possible design. The object of this investigation, however, in contrast t o the earlier experiments was not so much to find the effects of small variations on precision as t o see if any of the parameters had a critical effect. The injection system employed consisted of a separately heated metal block which could be adapted either t o flash vaporization or on-column injection. The block temperature was controlled by an energy controller and its temperature measured to an ac- curacy of i 8 "C by means of a pyrometer.
A factorial experiment was carried out to test whether different injection parameters caused any systematic changes in absolute or relative response, using both on-column and flash vaporization injection. The variables studied were
sample type, boiling range and dilution, inlet pressure, and choice of microliter syringe.
RESULTS AND DISCUSSION
An extensive number of results were obtained and signifi- cance tests were made for the effects of the variables studied. Most of the significant effects were predictably caused by ad- verse conditions giving rise to tailing peaks. Low preheater temperatures for instance had to be employed for several sets as part of the experimental design and these gave rise to tailing peaks and poor resolution of higher boiling compounds. In general, however, there was no significant effect from any of these variables provided the conditions for rapid, "plug-like" sample introduction to the column were fulfilled. Table VI gives the mean relative standard deviations of peak area ratios for the mixtures used for on-column and flash vaporization injection. There is, for the most part, no significant difference between the two methods although there are several individual differences. One point which does become clear from the results is the importance of choosing an appropriate internal standard. The relative standard deviations are smallest in Table VI for components of similar chemical type and/or have similar retention characteristics.
The lack of highly significant effects from the injection sys- tem is encouraging in view of the infinite variety of conditions that could be used. This suggests that provided a high stan- dard of practice is adopted and maintained, then the effect of slight differences in the injection conditions from run to run is negligible. If, on the other hand, adverse conditions were to be used, such as very low, or very high preheater temperatures, leaky injection septa, and inefficient syringes, then several of these factors may have strong effects and this will result in a loss of precision.
Syringe Handling Errors. The sequence of operations carried out by the operator in washing the syringe, filling it with sample, inserting it into the septum, depressing the plunger and then withdrawing it, have all been found to be critical. The effects have been tested by designed experi-
ANALYTICAL CHEMISTRY, VOL. 43, NO. 14, DECEMBER 1971 1955
Table VII. Comparison of Methods of Peak Measurement
Method of measurement
Electronic integrator Ball and disc
integrator Peak height Peak height X
Peak height X width
Peak height X peak
Triangulation
retention time
at half-height
width
Relative standard deviation 0.125 0.685
0.230
0.386 1.553
2.910
2.732
Argon
95 % Confidence limits 0.1094). 148 0,5724,776
0.200-0.271
0.336-0.455 1.351-1.833
2.532-3.434
2,380-3.224
Methane Relative standard 95 z deviation Confidence limits 0.350 0.3OO-0.407 2.952 2.568-3.483
ment, the results of which are too extensive to reproduce in detail in this paper. The general conclusion is that a stan- dardized handling procedure is very important to precision and all the operations should be carried out in exactly the same way for each injection.
Precision of Peak Measurement-Experiment E. The precision of several different methods of measuring the area of a gas chromatographic peak can only be compared by calculating the area of a highly reproducible electronic signal similar in form to that produced by the chromatograph. The variance of this electrical signal should be zero, or a t least small and independent of the variances of all the methods of measurement but no such signal has been devised. Never- theless a useful practical comparison of the methods can be obtained by using the signal from the chromatograph. A gas sample which is repetitively chromatographed under nominally identical conditions gives very good reproducibility over short intervals of time. Also, any interactions between the variance of the chromatographic response and the vari- ance of the different methods of measurement are at least relevant t o gas chromatography.
The methods investigated were as follows: (a) electronic integrator, (b) ball and disc integrator, (c) peak height mea- surement, (d) peak height X retention time, (e) peak height X width at half-height, (f) peak height X peak width, and (8) triangulation.
Descriptions of the peak construction necessary for methods (c)-(g) have been given by Scott and the author in an earlier publication ( 4 ) .
In order t o decrease the errors associated with sample size and gas flow rate control, this part of the work was carried out using a hot wire katharometer for detection. The gas sample chosen was a mixture of 30% argon, 60% carbon monoxide, and 10% methane, separated on a 4-ft X l/An. 0.d. column packed with molecular sieve 5A and operated a t 50" C. The Varian 480 integrator was employed for (a), and a Disc integrator for (b). All chart measurements were made from a Servoscribe recorder running a t a chart speed of 30 mm/minute and a sensitivity of 160 mm/mV. Each chromatogram of the test mixture provided three peaks of different size and shape, and all seven methods were used to investigate each peak. The approximate heights of the peaks for argon, methane, and carbon monoxide were 160, 16, and 80 mm, respectively, and their nominal widths were 6, 15, and 30 mm. Sets of eight chromatograms were used to provide estimates of the standard deviations of a single result about the mean for all combinations of peak and method of measurement, with seven degrees of freedom. Twelve such sets were performed, and using the assumption that the standard deviations estimated in each set were the
-
(4) R. P. W. Scott and D. W. Grant, Atmlyst, 89, 179 (1964).
Table VIII. Control of Variables Required to Achieve Less than 1 Variation in Response, Using Peak Areas
Estimated safe limits or Variable procedure necessary
Column temperature FID temperature Carrier gas (N2) flow rate Air flow rate Hydrogen flow rate Polarizing voltage Method of measurement Injection variables Syringe handling
+2 "C if FID in column oven 1 2 "C i 2 z a 11.5%. +l.S%. il volt Electronic integrator Set as for good practice Use as standardized procedure
a Based on the assumption that the detector is operated under optimum conditions.
same, these results were combined to give estimates of the standard deviation with 84 degrees of freedom. The relative standard deviations obtained for the method of measure- ment, and their 95 % confidence limits, are given in Table VII.
It should be emphasized that the relative standard deviations given in Table VI1 are not absolute measures of the precision of the method of measurement because the errors of the sampling and Chromatographic systems are included. The results, nevertheless, allow comparisons to be made between the methods, using typical equipment. The use of an electronic integrator is apparently the most precise method, closely followed by the simple measurement of peak height. The precision of the latter method, however, may be offset in practice by the relatively large effect of variations in instrumental conditions on this parameter. Method (d) also gives surprisingly precise results and may be better than (c) in practice in view of the corrective effect of using retention time. Method (b) is obviously more precise than geometrical construction methods and has the additional advantage of being quicker t o use. Of the geometric methods, (e) is the most precise, which substantiates the earlier finding by Scott and the author (4 ) . These results relate to good base-line resolution and low noise and drift levels. Higher noise and drift levels and interfering peaks decrease the precision of the electronic integrator much more quickly than the other methods because of its more limited logic.
GENERAL CONCLUSIONS
The results of the experiments described in this paper show that the analytical precision in gas chromatography depends not only on the control and setting of the instrumental vari- ables but also on the analytical technique. The effects of all the variables have been shown to be considerably less on area ratios than on areas alone and so the use of a carefully chosen
1956 ANALYTICAL CHEMISTRY, VOL. 43, NO. 14, DECEMBER 1971
internal standard is apparently essential to achieve high pre- cision. Table VI11 shows estimates, calculated from the results of experiments A, B, C, and D of the precision of con- trol necessary to achieve less than 1 % variation in actual area. The precision of control in this context refers to the maximum tolerable short term variation of the variable, i .e., between successive peaks during the course of a chromatogram. Longer term variations will tend to affect methods which de- pend on actual area more than internal standard methods and so, where an internal standard is used, the data can be regarded as limiting values.
The column temperature requirements are also included in the table and were derived from earlier work using a kathara- meter system (5). The column temperature does not, of course, have a direct effect on the FID response unless the detector is contained in the same oven as the column, in which case the limitation is that of F ID temperature. The effect of column temperature can have an important secondary effect on FID response through the effect of carrier gas mass flow rate. This will vary with temperature if pressure control is used at the column inlet, and so the specification given in Table VI11 for the carrier gas flow control automatically limits the column oven temperature variation that can be tolerated. The semi-empirical relationship of Harris and Habgood (6) was used to calculate the effect of column tem- perature on mass flow rate. This gave an effect of 0.456 % per
( 5 ) A. Clarke and D. W. Grant, “Gas Chromatography 1970,” R. Stock, Ed., Institute of Petroleum, London, 1971, p 189.
(6) W. E. Harris and H. W. Habgood, “Programmed Temperature Gas Chromatography,” John Wiley and Sons, New York, N.Y., 1966, pp 23-9.
degree C at 100 “C which agrees well with an experimental value of 0.44% per degree. Thus the *2% “C tolerance on column temperature for a 1 % precision level is equivalent to a maximum variation of less than -I 1 in mass flow rate. In practice it is usual to require a stricter control of column tem- perature than is indicated by the precision requirements. This is due to the critical effect of temperature on retention volume which could lead to uncertainty in identification, particularly in the case of complex mixtures.
The control of temperature in commercial equipment is normally well within the requirements of Table VIII. The control of flow rates, however, often leaves much to be desired. Mass flow controllers are frequently used, which are affected critically by changes in ambient temperature. In addition, there is often little or no control over the supplies of hydrogen and air which have been regarded in the past as of little im- portance. In fact, it is important to control these more closely than the carrier gas, preferably by means of precision pressure controllers connected to thermostatted capillary constrictives.
ACKNOWLEDGMENT
The authors acknowledge the assistance of Mr. Stuart Lodge in performing most of the experimental work and many of the calculations.
RECEIVED for review June 18, 1971. Accepted August 27, 1971. The work described in this paper forms part of a re- search project being carried out on behalf of the British Standards institution and financed by the Department of Trade and Industry, by whose permission this paper is pub- lished.
ANALYTICAL CHEMISTRY, VOL. 43, NO. 14, DECEMBER 1971 0 1957