Imaging a Population Code for Odor Identity in theDrosophila Mushroom Body
Robert A. A. Campbell,1* Kyle S. Honegger,1,2* Hongtao Qin,1,3 Wanhe Li,1 Ebru Demir,1 and Glenn C. Turner1,2
1Cold Spring Harbor Laboratory, and 2Watson School of Biological Sciences, Cold Spring Harbor Laboratory, Cold Spring Harbor, New York 11724, and3Department of Biomedical Engineering, College of Biology, Hunan University, Yuelu District, Changsha 410082, China
The brain represents sensory information in the coordinated activity of neuronal ensembles. Although the microcircuits underlyingolfactory processing are well characterized in Drosophila, no studies to date have examined the encoding of odor identity by populationsof neurons and related it to the odor specificity of olfactory behavior. Here we used two-photon Ca 2� imaging to record odor-evokedresponses from �100 neurons simultaneously in the Drosophila mushroom body (MB). For the first time, we demonstrate quantitativelythat MB population responses contain substantial information on odor identity. Using a series of increasingly similar odor blends, weidentified conditions in which odor discrimination is difficult behaviorally. We found that MB ensemble responses accounted well forolfactory acuity in this task. Kenyon cell ensembles with as few as 25 cells were sufficient to match behavioral discrimination accuracy.Using a generalization task, we demonstrated that the MB population code could predict the flies’ responses to novel odors. The degree towhich flies generalized a learned aversive association to unfamiliar test odors depended upon the relative similarity between the odors’evoked MB activity patterns. Discrimination and generalization place different demands on the animal, yet the flies’ choices in these taskswere reliably predicted based on the amount of overlap between MB activity patterns. Therefore, these different behaviors can beunderstood in the context of a single physiological framework.
IntroductionUnderstanding the relationship between neural activity and sen-sory perception remains one of the fundamental problems insystems neuroscience (Parker and Newsome, 1998; Rieke et al.,1999). The issue has long been studied in vertebrates (Sparks etal., 1976; Georgopoulos et al., 1986; Shadlen and Newsome,1998), but the complexity of large brains makes it difficult to linkidentified neural circuits to behavior. Invertebrates have rela-tively simple brains yet boast a rich behavioral repertoire, makingthem ideal models for studying neural coding in well definedmicrocircuits (Camhi and Levy, 1989; Theunissen and Miller,1991; Briggman et al., 2005).
The olfactory system of Drosophila is anatomically well de-fined and genetically manipulable (Vosshall and Stocker, 2007),making it an excellent platform for linking circuit-level neuralactivity to behavior. Odors with innate meaning, such as phero-
mones or alarm signals (Suh et al., 2004; Sachse et al., 2007; Dattaet al., 2008; Root et al., 2008; Ruta et al., 2010), tend to evokeneural activity in specific “labeled lines.” However, most odor-ants are chemically diverse (Koulakov and Rinberg, 2011) andtheir variety cannot be captured by a small number of labeledlines. Therefore, when learning to identify arbitrary odors, theanimal must have access to the combinatorial representation thatoriginates in the pattern of responding sensory neurons (deBruyne et al., 2001; Hallem and Carlson, 2006). Informationfrom the periphery is propagated through the antennal lobe tothe mushroom body (MB), an area necessary for olfactory learn-ing and memory (de Belle and Heisenberg, 1994; Dubnau et al.,2001; McGuire et al., 2001). The odor responses of Kenyon cells(KCs), the principle neurons of the MB, are substantially moreselective than their antennal lobe inputs (Laurent and Naraghi,1994; Perez-Orive et al., 2002; Turner et al., 2008; Wang et al.,2008; Honegger et al., 2011). Theoretical studies suggest thatthese more sparse responses are useful for accurate learning be-cause they minimize overlap between response patterns to differ-ent odors (Kanerva, 1988; Laurent, 2002). But how much overlapexists between different MB odor representations? Does overlapinfluence how accurately animals learn to discriminate similarodorants and generalize responses to novel stimuli?
We used cellular-resolution Ca 2� imaging to examine odorrepresentations in large KC ensembles (typically �100 cells).This enabled us to directly characterize the overlap between dif-ferent representations in individual flies. We assessed how effec-tively KC activity patterns convey odor identity using linearclassification techniques. First, we examined odor specificity in afine discrimination task using odor blends. Pairs of similar blends
Received Feb. 12, 2012; revised May 14, 2013; accepted May 15, 2013.Author contributions: R.A.A.C., K.S.H., H.Q., W.L., E.D., and G.C.T. designed research; R.A.A.C., K.S.H., H.Q., W.L.,
and E.D. performed research; R.A.A.C. and K.S.H. analyzed data; R.A.A.C., K.S.H., and G.C.T. wrote the paper.This work was funded by the National Institutes of Health (Grant #R01 DC010403-01A1 to G.C.T.). K.S.H was
supported by the Crick-Clay fellowship from the Watson School of Biological Sciences and Predoctoral Training Grant#5T32GM065094 from the National Institute of General Medical Sciences. E.D. was supported by a European Molec-ular Biology Organization Long-Term Fellowship and a Patterson Trust Fellowship. We thank J. Dubnau, V. Jayara-man, A. Kepecs, A. Zador, Y. Zhong, and members of the Turner laboratory for advice and comments on themanuscript.
The authors declare no competing financial interests.*R.A.A.C. and K.S.H. contributed equally to this work.Correspondence should be addressed to Glenn C. Turner, Cold Spring Harbor Laboratory, 1 Bungtown Road, Cold
Spring Harbor, NY 11724. E-mail: [email protected]:10.1523/JNEUROSCI.0682-12.2013
10568 • The Journal of Neuroscience, June 19, 2013 • 33(25):10568 –10581
that were difficult for the animals to discriminate were also diffi-cult for our classifier to distinguish. Olfactory information wasdistributed across the population, but ensembles of only 25 KCswere sufficient to produce classification accuracy that matchedbehavior. Second, we investigated whether we could use the ac-tivity patterns we measured to predict flies’ behavioral responsesto novel odors in a generalization task. We found that associa-tions learned with one odor were reliably generalized to odorsevoking similar (but distinct) MB activity patterns. Therefore,one feature, the overlap between odor representations, was agood predictor of behavior in both discrimination and general-ization tasks. Furthermore, we found that activity patterns innaive flies were sufficient to make this prediction.
Materials and MethodsAnimal preparationFlies carrying the genetically encoded calcium sensor UAS-GCaMP3(Tian et al., 2009) were crossed with OK107-Gal4 flies (Connolly et al.,1996) to drive GCaMP3 expression in essentially all KCs (Lee and Luo,1999; Aso et al., 2009). All experiments were conducted on female F1heterozygotes from this cross, aged 2–5 d post-eclosion. Procedures foranimal preparation were as described previously (Turner et al., 2008;Murthy and Turner, 2010; Honegger et al., 2011). Flies were anesthetizedtemporarily on ice and inserted into a small hole cut in the recordingplatform. The animal’s head was tilted forward, exposing the olfactoryorgans to the odor delivery nozzle located on the underside of the plat-form. The fly was fixed in place with fast-drying epoxy (Devcon 5 minepoxy). The top of the fly was bathed in oxygenated saline (Wilson et al.,2004) and the cuticle overlying the brain was dissected away. Air sacsoverlying the MBs were pushed aside, but we did not attempt to removethe perineural sheath. To minimize movement of the brain inside thehead capsule, we removed the pulsatile organ at the neck and the probos-cis retractor muscles that pass over the caudal aspect of the optic lobes.
Odors were presented using a custom-built delivery system that usesserial air dilutions to control odor concentration while maintaining aconstant total airflow of 1 L/min at the fly. Experiments were conductedat an odor dilution of 1:100 or, where appropriate, adjusted to match theconcentrations used behaviorally. We used a photo-ionization detector(Aurora Scientific) to match concentrations between the imaging rig andthe T-maze and to monitor odor delivery throughout each imaging ex-periment. Odor pulses were created by switching between clean andodorized air streams using a synchronous two-way valve (N-Research).This final valve was located �50 cm from the fly, leading to a delay of�300 ms between valve switching and the odor reaching the fly. The flowpath was 1/8 inch in diameter throughout, which enabled the system towork near atmospheric pressure at these flow rates. The distance of thevalve from the fly and the large tubing diameter virtually eliminatedpressure transients caused by valve switching, as measured by the photo-ionization detector and a hot-wire anemometer.
Calcium imagingTwo-photon imaging was performed using a Prairie Ultima system(Prairie Technologies) and a Ti-Sapphire laser (Chameleon XR; Coher-ent) tuned to 920 nm delivering 8 –10 mW at the sample. All images wereacquired with Olympus water-immersion objectives (LUMPlanFl/IR,60�, numerical aperture 0.9; LUMPlanFl/IR, 40�, numerical aperture0.8). Imaging planes were selected to maximize the number of visible
KCs. Typically imaging frames were �300 � 300 pixels, acquired with apixel dwell time of 1.6 �s, yielding frame rates near 3.8 Hz. On average,120 KCs (range: 60 –170) were monitored in one plane.
Custom MATLAB (MathWorks) routines were used to control odorpresentation and synchronize stimulus delivery with data acquisition.Data were acquired in 20 s sweeps with a 1 s odor pulse triggered 8 s aftersweep onset. The interstimulus interval was 25 s. Stimuli were presentedin randomly interleaved fashion, adjusted so that the same odor wasnever presented twice in succession.
Imaging analysisData were analyzed using MATLAB and R (http://www.R-project.org).To correct for motion within the field of view, frames were aligned using2D image registration approaches. In many cases, a Fourier-based sub-pixel translation correction was sufficient (Guizar-Sicairos et al., 2008).Some animals required an affine transform to cope with global distor-tions, such as rotational movement of the brain (Thirion, 1998). Wherenecessary a nonrigid transform was used to correct more localized dis-tortions (Klein et al., 2010).
Fluorescent neural tissue was automatically segmented from the sur-rounding regions. Pixel intensity values from the area outside thisboundary were considered to represent background (tissue autofluores-cence plus shot noise) and the mean pixel intensity value from the back-ground was then subtracted from the overall image.
To quantify the response of the KCs a small, circular region of interest6 – 8 pixels in diameter was applied to each cell body. This allowed aver-aging of the pixel intensity values from each cell, treating individual KCsas separate units. Care was taken to ensure that each selected cell re-mained within its region of interest over the whole imaging session.Response amplitudes were calculated as the mean change in fluorescence(dF/F) in the 0.5– 4.5 s window after stimulus onset. Note that a subset ofthe imaging data (those shown in Fig. 1 and some of the pure odors in Fig.3) were used to estimate sparseness in Honegger et al. (2011).
A statistical test originally described in Honegger et al. (2011) was usedto determine whether a KC responded significantly on a given trial.Briefly, the SD of the baseline activity was obtained 8 s before stimulusonset. The response time course was then smoothed using a five-pointrunning average to control for outliers. The peak dF/F in the 0.5– 4.5 swindow after stimulus onset was determined. The response was judged tobe significant if this peak was 2.33 SDs greater than the baseline, whichcorresponds to a one-tailed significance test where � � 0.01.
Odor classificationA linear classification algorithm was used to predict odor identity basedupon neural activity. This approach was chosen because it is well estab-lished (Fisher, 1936), has been commonly used both within (MacLeod etal., 1998; Friedrich and Laurent, 2001; Broome et al., 2006; Bhandawat etal., 2007; Silbering et al., 2008; Cury and Uchida, 2010) and outsideolfaction (Briggman et al., 2005; Walker et al., 2008), and can be imple-mented biologically with simple integrate-and-fire neurons. The popu-lation responses of KCs are represented by points in a space and ouralgorithm uses the Euclidean distance between these points as a measureof similarity (Gochin et al., 1994; MacLeod et al., 1998). Each axis in thisspace represents the response magnitude of one KC. The number ofdifferent axes (i.e., the dimensionality of this space) corresponds to thenumber of KCs recorded in one imaging session. This multidimensionalrepresentation was used to classify the odor response patterns observedon single trials based on their similarity to the average response patternsfor each of the different odors. Classification was implemented usingleave-one-out cross-validation to avoid overfitting. In this method, theresponse pattern of interest is removed from the dataset. Then, for eachodor, response patterns of individual trials are averaged to yield a meanresponse. In the multidimensional space, these means are the centroids ofthe individual responses to each of the different odors. In this way, themissing odor response does not contribute to calculating the centoids,which could lead to overfitting. The odor identity of the withheld re-sponse pattern is then classified by assigning it to the centroid nearest inEuclidean space. Biologically, linear classification could be readily imple-mented by a downstream neuron that linearly integrates KC inputs with
Campbell, Honegger et al. • Coding Odor Identity in Drosophila J. Neurosci., June 19, 2013 • 33(25):10568 –10581 • 10569
different synaptic weights, with a spike threshold set so it responds selec-tively to one class of KC activity patterns.
Our classifier is similar to linear discriminant analysis (LDA; Fisher,1936) because it effectively draws a straight classification boundary be-tween each pair of groups. Different algorithms make different assump-tions about the structure of the data and can produce different results(Hung et al., 2005). To evaluate the generality of our findings, our datawere also run through other classifiers (Venables and Ripley, 1999) suchas LDA, support vector machines (SVM), and a perceptron-based neuralnetwork (Hamel, 2009; SVM was performed using a freely available pack-age, LIBSVM, http://www.csie.ntu.edu.tw/cjlin/libsvm). The distance-based algorithm was selected because, unlike LDA, it does not require aninitial dimensionality reduction step and, unlike SVM and perceptrons,it generalizes naturally to multiple groups. Finally, our classifier could beadapted easily for studying generalization (see Fig. 4 and Results for adescription of the adaptation). For more detail on applying discriminantanalysis to neural data, see the supplemental material of Briggman et al.(2005) and Campbell et al. (2008).
Behavioral experimentsBehavioral experiments were done using the T-maze olfactory learningparadigm (Tully and Quinn, 1985) with the Canton-S w1118 (iso1CJ) flystrain (Blum et al., 2009). Groups of �100 flies were loaded into anelectrifiable chamber, where odor presentation was paired with shock (1260 V stimuli of 1.5 s duration presented over a period of 1 min). Flies werethen lowered to a choice point at the junction of two odorized chambers,each containing a different odor. Two conditioning protocols were used,as described below.
Odor blend discrimination experiments. For the experiments shown inFigure 2 and Figure 3, flies were presented with one odor paired withshock, followed by presentation of a second odor in the absence of shock.Flies were then given a choice between the two odors experienced duringthe training phase. Performance was quantified as the proportion of fliescorrectly avoiding the odor previously paired with shock. In these exper-iments, odor concentrations were set so that naive flies distributed evenlybetween the two choices, so chance performance was 50%. A reciprocalexperimental design was used in which, for a pair of odors, one group offlies was trained to avoid one odor and a separate group of flies wastrained to avoid the other. For example, with the 70:30 blends, in the firstphase of the experiment, one group of flies was shocked in the presence of70 3-octanol (OCT) to 30 4-methylcyclohexanol (MCH) and then ex-posing them to 30 OCT: 70 MCH without shock. These flies were thengiven a choice between these two blends. In the second phase, a differentset of flies was shocked in the presence of 30 OCT: 70 MCH, exposed to70 OCT: 30 MCH, and then given the same choice in the testing phase.The mean of the scores from the two halves of the reciprocal experimentconstituted a single data point in Figure 2B; performance was very similarfor the reciprocal tests.
Odor generalization experiments. For experiments shown in Figure 4,Figure 5, and Figure 6, the protocol involved pairing shock with a singleodor and then directly giving flies a choice between two different odors.A yoked design was used with two sets of flies run through the T-maze insuccession: an experimental group that received shock in the presence ofan odor and a control group that simply received odor exposure withoutshock. This second group established how flies distributed between thechoice odors under control conditions. The odor choices of trained flieswere compared to the distribution of odor-exposed flies to establishwhether training modified their choices. For generalization, flies weretrained with one odor and then given a choice between two odors theyhad not experienced previously, one of which was predicted to be similarto the trained odor. It was also confirmed that flies could distinguishsimilar odors by training flies with one odor and testing their choicebetween that stimulus and a similar odor.
This protocol was adapted from standard associative conditioningprocedures (Tully and Quinn, 1985; Yu et al., 2006; Akalal et al., 2010).Note that we did not explicitly test for nonassociative effects of the shockusing conditions in which shock and odor are presented in an unpairedmanner, such that odor does not predict shock. Nonassociative effects ofshock have been shown to affect olfactory behavior of some mutant
strains (Preat, 1998). However, Preat (1998) also found that odor avoid-ance in Canton-S flies was unaffected by the shock intensity used in thepresent study (60 V).
ResultsPhysiological recordings have shown that individual KCs exhibithighly odor-selective responses (Perez-Orive et al., 2002; Turneret al., 2008) and that odors induce sparse activation of the KCpopulation (Wang et al., 2004; Honegger et al., 2011). This selec-tivity has been proposed to underlie the stimulus specificity ofolfactory learning (Laurent, 2002; Perez-Orive et al., 2002). Herewe examined the encoding of odor identity by large ensembles ofKCs using the calcium indicator GCaMP3 (Tian et al., 2009) andin vivo two-photon imaging. By tracking activity of �100 KCssimultaneously, we tested how the information carried at thepopulation level relates to the odor specificity of learned olfactorybehaviors. We first examined whether the information availablematches the behavioral accuracy of fine odor discrimination. Wethen tested whether we could use that information to predictbehavioral responses in a generalization task.
Odor identity is represented by unique KC activity patternsTo determine whether activity patterns in the KC populationconvey odor identity reliably and precisely, we first examinedpopulation responses to a variety of different monomolecularcompounds. To obtain a population-level view of MB represen-tations, we targeted expression of GCaMP3 to the MB using theGal4 driver OK107, which is expressed in the entire population of�2000 KCs (Lee and Luo, 1999; Aso et al., 2009). [Flies heterozy-gous for GCaMP3 and OK107 display normal aversive olfactorylearning in the T-maze (Y. Shuai, personal communication)].Individual KC somata were readily identified based on the restingfluorescence of the indicator (Fig. 1A, gray regions), enabling usto track responses with cellular resolution. To maximize thenumber of KCs that could be imaged simultaneously, we orientedthe preparation so that the imaging plane was parallel with thedisc-shaped field of KC somata. We used image registration algo-rithms (see Materials and Methods) to allow large numbers ofcells to be tracked over the course of an experiment. Figure 1A–Dshows data from an individual fly for which we obtained signalsfrom 124 KCs. A total of six different odors (plus a paraffin oilcontrol) were presented in a randomly interleaved fashion. Fig-ure 1A shows responses evoked by three of these odors acrossrepeated presentation trials. Responses were strong and repeat-able, with similar activity patterns for the same odor in both trials.Figure 1B shows the response time courses of these cells for theodors and trials depicted in Figure 1A. The responses of individ-ual neurons were fairly consistent across different presentationsof the same odor, showing a level of trial to trial variability typicalof GCaMP3 recordings (Tian et al., 2009). To summarize theresponses to all 7 stimuli across all trials we quantified responseamplitudes by averaging the fluorescence change (dF/F) in a 4 swindow after stimulus onset. Figure 1C shows the responses ob-served in these 124 cells to the 42 different stimulus presentations(7 different stimuli presented 6 times each in a randomized order;repeated presentations of the same stimulus are grouped for dis-play). Each row in this matrix shows the evoked responses of allcells on one trial. Therefore, the matrix summarizes the wholeexperiment, describing both response strength and response re-liability. These are the most important factors limiting how accu-rately a neuronal population can represent information (Rieke etal., 1999).
10570 • J. Neurosci., June 19, 2013 • 33(25):10568 –10581 Campbell, Honegger et al. • Coding Odor Identity in Drosophila
Figure 1. Two-photon calcium imaging demonstrates that MB population activity accurately conveys odor identity. A, Odor response patterns in the cell body layer of the MB. dF/Fresponses (color bar) are shown overlaid on baseline fluorescence (grayscale). The six panels show the first two presentations of three different odors. Stimuli are randomly interleaved.Scale bar, 10 �m. (B) dF/F time courses of 124 KCs extracted from the data shown in A. The white line indicates the onset of a 1 s odor pulse. C, Mean evoked dF/F responses of the 124KCs (columns) to individual odor presentations (rows), showing reliable, distinct responses to different odors. Rows are grouped by odor for display purposes. D, Dendrogram showingEuclidean distances between the rows (response vectors) shown in C. Colors correspond to odor labels in C. E, Schematic of our classification algorithm. Circles show evoked responses forsingle presentations of two different odors (red and black) for two cells. Crosses indicate mean responses (centroids) to each odor. The black line (decision boundary) is determined bythe classification algorithm and separates the groups. F, Confusion matrix showing odor classification assignments for the example recording in C. Three odors were classified correctlyin six of six trials. Overall classification accuracy across the entire stimulus set was 74%. Colors correspond to odor labels in C. G, Overall classification accuracy is consistently high indifferent flies (black points; n � 7). Dashed line indicates theoretical chance performance (14%), whereas gray points show chance performance determined by randomizing odor labels.Each point is the mean of 50 randomized runs. Black lines indicate means, and blue shaded boxes represent 95% confidence intervals for the mean. H, Compares classifier chanceperformance (same gray points and dashed line as G) to performance when cell identity is randomized independently on each trial (black points).
Campbell, Honegger et al. • Coding Odor Identity in Drosophila J. Neurosci., June 19, 2013 • 33(25):10568 –10581 • 10571
Visual inspection of the response matrix (Fig. 1C) shows clearand reliable differences between population responses to many ofthe odors. Figure 1D shows these data as a dendrogram basedupon the Euclidean distance between the response vectors (Fig.1C, rows). The odors (circles, the colors of which correspond tothe labels used in Fig. 1C) ethyl lactate (EL), pentyl acetate (PA),and 2-heptanone (HP) form groups that are largely distinct fromeach other. The remaining odors evoked responses that wereweaker and less distinct. Therefore, both plots indicate that odor-specific information was present in these activity patterns, whichcould be used for distinguishing different odors behaviorally. Al-though they are useful visualizations, neither plot constitutes astatistical test of how distinctly different odors are represented, sowe next quantified how accurately KC populations could dis-criminate odors.
To extract information from the KC population, we used aclassification approach similar to that used by Gochin et al.(1994). A classifier provides a way of quantifying informationcontent of a neural population (Nelken et al., 2005) while takinginto account the intrinsic variability (Werner and Mountcastle,1965; Tomko and Crapper, 1974) found in neural activity. Figure1E explains the principle of our approach using a small subset ofthe data from Figure 1C. Each data point shows the mean evokeddF/F of two KCs for one presentation of one odor. The differentcolors represent different odors. The two crosses indicate theaverage evoked response (centroid) over all trials of each odor.The black line is the discrimination boundary and is drawn mid-way between the two centroids and perpendicular to the axis thatlinks them. All locations falling within the gray area are nearer tothe black centroid and all locations falling within the pink area arenearer to the red centroid. All data points within the gray area areclassified as “black” and all points with the pink area are classifiedas “red.” In this case, one red point and one black point weremisassigned by the classifier. This approach is a simplified versionof Fisher’s classical linear discriminant analysis (Fisher, 1936).
To implement the algorithm on the full dataset (Fig. 1C), weused leave-one-out cross-validation to avoid overfitting. In thismethod, one trial is withheld, the centroids of the seven groupsare calculated, and the missing trial is assigned to the centroid towhich it is closest. This approach avoids overfitting because theobservation being tested does not contribute to calculating thecentroid locations. The process is repeated for each trial in turnand the results can be summarized as a confusion matrix (Fig.1F). Squares along the diagonal represent correct classifications.The digits indicate the number of trials (out of six total) that wereclassified correctly. Misclassifications are represented by non-black squares situated away from the diagonal. Overall classifica-tion accuracy across all stimuli was 74% in this example. Mosterrors are made with odors that evoke only weak responses. TheEuclidean distance classifier performed no worse than more elab-orate classification techniques (see Materials and Methods fordescription), indicating that it is adequate for extracting odoridentity from our data.
We repeated this experiment in a total of 7 flies, typicallycapturing �120 KCs (range, 65–168), which is �5% of the totalpopulation. The proportion of correct classifications in other flies(Fig. 1G, black points) was similar to that for the example animal(Fig. 1A–F). We attempted to obtain six repeats of each odor, butthis was not always possible due to excessive brain motion, par-ticularly drift in the z-dimension. Of the seven animals shown inFigure 1G, six repeats were obtained in three cases, five repeats inone case, and four repeats in the remaining three cases. Scram-bling the odor labels caused the classifier to perform at chance
levels (Fig. 1G, gray points). The observed classification accuracy(black points) was far higher than chance (dashed line).
Is the classifier using the pattern of responding neurons todetermine odor identity or are other features, such as maximumresponse strength, being used? To test this, we randomized thecell labels independently for each trial so that the variance of thedata remained unchanged but the response patterns becamescrambled. Running the algorithm on the scrambled matricesresulted in classification accuracies dropping to chance levels(Fig. 1H, black points and dashed line), confirming that it is thepattern of responding KCs that represents odor identity.
These results are significant because they are the first to quan-tify the degree of odor specificity in the KC population and dem-onstrate clearly that odor identity is represented in the pattern ofevoked responses. It was unknown previously how much infor-mation could be extracted from KC activity, which is sparse andsometimes unreliable (Stopfer et al., 2003; Perez-Orive et al.,2004; Ito et al., 2008; Turner et al., 2008) because individual KCsmay not fire on all presentations of a stimulus. Therefore, despitethe fact that individual KCs respond to few odors and only a smallproportion of KCs respond to any given odor, at the populationlevel, KC response patterns represent identity of monomolecularodors with a high level of specificity.
Measuring olfactory acuity using odor blendsWe have shown that substantial information on odor identity canbe extracted from KC response patterns. What is the relationshipbetween these activity patterns and behavior? Are odors that aredifficult for the flies to distinguish also difficult to distinguishbased upon KC activity?
We investigated this using two-component odor blends(Uchida and Mainen, 2003; Abraham et al., 2004; Fernandez etal., 2009; Miura et al., 2012) to construct a psychometric functiondescribing odor discrimination accuracy. Blends were created bysystematically varying the ratio of the constituents OCT andMCH (Fig. 2A). We chose OCT and MCH because these odorshave been used extensively in the fly learning and memory liter-ature (Tully and Quinn, 1985; Yu et al., 2005; Thum et al., 2007)and flies can discriminate them with high accuracy. We con-ducted the experiment using the T-maze (Tully and Quinn,1985), an assay in which flies were shocked in the presence of oneodor (conditioned stimulus; CS�) and then exposed to the sec-ond odor (CS�) in the absence of shock before being given achoice between the two stimuli. Performance at the task wasquantified as the proportion of flies correctly avoiding the stim-ulus previously paired with shock. Pure odors were diluted inmineral oil and their concentrations adjusted so that flies exhib-ited no bias to either odor (MCH, 1.5:1000; OCT, 1:1000). Odorblends were made by mixing these two oil dilutions at the desiredratios. Each group of flies was trained on one of three differentodor blend ratios: 100:0, 70:30, or 60:40 (Fig. 2A). We used abalanced experimental design. For example, at the 60:40 ratio,one group of flies was trained to avoid 60 OCT: 40 MCH and asecond group of flies was trained to avoid 40 OCT: 60 MCH; eachgroup was then tested on the choice between 60 OCT: 40 MCHand 40 OCT: 60 MCH. The mean of the two scores is treated as asingle independent observation, so the choices of �200 flies com-prise each data point. Flies performed close to 100% correct forthe pure odor pair (Fig. 2B), with performance falling to justabove chance for the 60:40 blend. Therefore, using these stimuli,we were able to systematically vary the difficulty of odor discrim-ination. These behavioral data are, to our knowledge, the first
10572 • J. Neurosci., June 19, 2013 • 33(25):10568 –10581 Campbell, Honegger et al. • Coding Odor Identity in Drosophila
estimate of the acuity of olfactory discrimination in Drosophila(Tully et al., 1994).
KC activity predicts odor discrimination accuracyWe next presented blend stimuli to naive flies on the imaging rigand investigated how accurately the response patterns of eachblend pair could be classified. Could we obtain a “neurometric”curve that matched the behavioral, psychophysical (Fig. 2B)curve? By conducting the experiment on naive flies, we tested thebasic question, is knowledge of the response patterns beforetraining sufficient for predicting learned behavior? We note thatprevious imaging experiments (Wang et al., 2008) found therewere no bulk changes in neural activity in the MB calyx afteraversive conditioning (see Discussion). Figure 3A shows the KCresponse patterns from one fly in which all three odor blend pairswere tested. The format is the same as that in Figure 1C: each rowcorresponds to one odor presentation trial and each column toone cell. The blend ratios are indicated by the red/green bars (Fig.
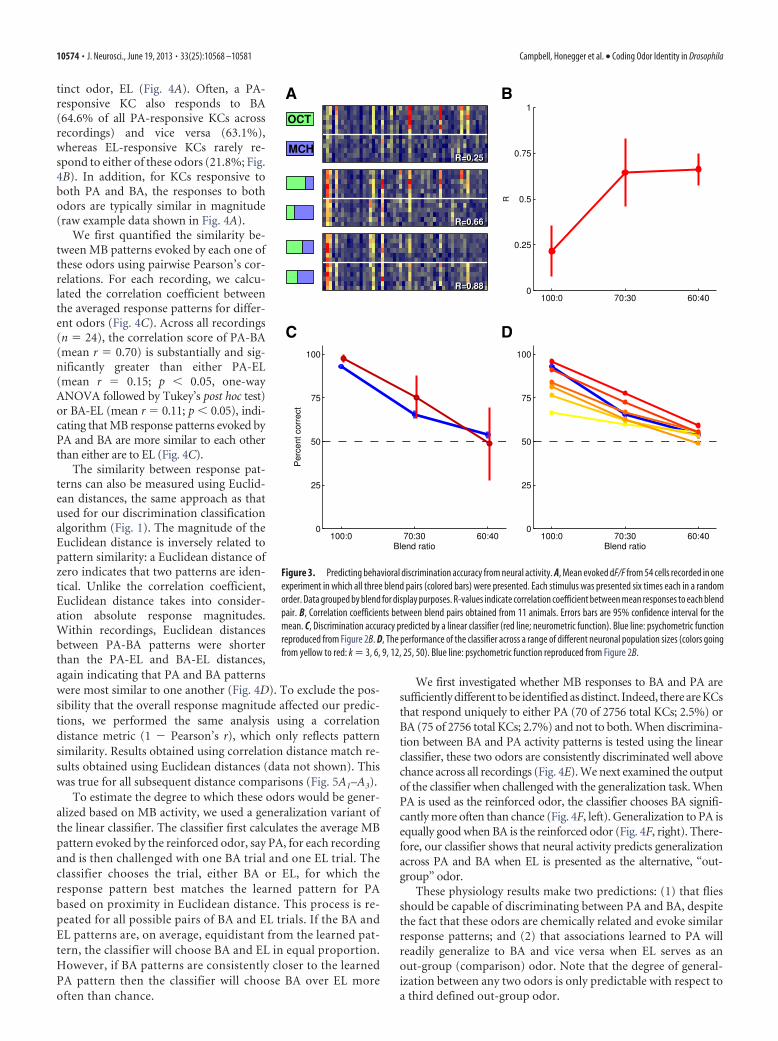
2A). In this example, each stimulus was presented six times,again, in a randomly interleaved manner. As expected, the re-sponse patterns became more similar as the blend ratios becomecloser. We quantified this using correlation coefficients (bottomright of each panel) that indicate the similarity between the meanodor response patterns (means not shown). R-values increased asblends became similar. Figure 3B summarizes the correlationdata over all animals (n � 11 flies). The number of stimulusrepetitions varied between 5 and 8: n � 5 for 7 flies, n � 6 for 2flies, n � 7 for 1 fly, and n � 8 for 1 fly.
To compare the imaging data more directly with behavior, weran our classifier within each odor blend pair for each fly. Thisallowed us to construct a neurometric curve for odor discrim-inability (Fig. 3C, red line). The neurometric curve closelymatched the behavioral (psychometric, blue) curve, indicatingthat KC response patterns could yield a good prediction of be-havior in this task. This was true across the performance rangeboth for the distinct pure odors and for the 60:40 blend pair,where the animals perform closer to chance.
The correspondence between behavior and physiology is notinevitable because there are instances in which neural activity is apoor predictor of behavior. For example, neurons in the earlyvertebrate visual system have a flicker fusion threshold that is wellabove that displayed behaviorally (Martinez-Conde et al., 2002).
The algorithm classifies responses by integrating activity frommany (�100) KCs. Trial to trial variability means that using toofew cells will result in less accurate performance because the re-sponses of the neuronal ensemble will be ambiguous. How manycells are needed for the classifier’s performance to approach thatseen behaviorally? To evaluate the impact of neuronal ensemblesize on classification accuracy, we trained the algorithm usingrandom subsamples of the KCs recorded in each fly. We drew 50random subsamples of k cells and evaluated performance foreach. This allowed us to derive the mean odor classification ac-curacy for each subpopulation of size k. The results are plotted asa series of psychometric functions in Figure 3D. The plot showsthat mean classification accuracy increases as the size of the sub-population increases; because variance is high when subpopula-tions are composed of small numbers of cells, here we show onlymean classification accuracy. Performance of the classifier ap-proaches that of the animals’ behavior at �k � 25 cells. There-fore, a relatively small subset of the total KC population is capableof accurately conveying odor identity in this task. Our approachto reading neural activity is biologically plausible because neu-rons downstream of KCs have extensive dendritic arbors (Ito etal., 1998; Tanaka et al., 2008) and likely pool from at least thisnumber of inputs. Because our classifier uses a straight decisionboundary, a single downstream neuron merely needs to linearlyintegrate and fire to match the classifier performance.
Generalization between chemically similar odorsThe discrimination results suggest that more overlapping stimu-lus representations are produced by more similar smelling odors.This suggests that the perceptual similarity between two odorscan potentially be predicted from the similarity of their evokedKC responses. To test this hypothesis, we used a different behav-ioral assay: generalization to novel odors.
We began by comparing MB responses to two chemically sim-ilar odors, pentyl acetate (PA) and butyl acetate (BA). Thesemonomolecular odorants share a functional group and differ inlength by only one carbon. Within each recording from a field ofKCs, the averaged response patterns evoked by these two odorsare similar and differ substantially from a third, chemically dis-
B
A
Figure 2. Discriminating odor blends. A, Increasingly similar odors were constructed byblending OCT and MCH over three pairs of increasingly similar blend ratios. B, Accuracy ofolfactory discrimination. Flies accurately discriminated pure OCT from pure MCH (100:0), but doprogressively worse with blends of the two odors (70:30 and 60:40). Training on the moresimilar blend (60:40) produces performance just above chance. Bars represent 95% confidenceinterval of the mean.
Campbell, Honegger et al. • Coding Odor Identity in Drosophila J. Neurosci., June 19, 2013 • 33(25):10568 –10581 • 10573
tinct odor, EL (Fig. 4A). Often, a PA-responsive KC also responds to BA(64.6% of all PA-responsive KCs acrossrecordings) and vice versa (63.1%),whereas EL-responsive KCs rarely re-spond to either of these odors (21.8%; Fig.4B). In addition, for KCs responsive toboth PA and BA, the responses to bothodors are typically similar in magnitude(raw example data shown in Fig. 4A).
We first quantified the similarity be-tween MB patterns evoked by each one ofthese odors using pairwise Pearson’s cor-relations. For each recording, we calcu-lated the correlation coefficient betweenthe averaged response patterns for differ-ent odors (Fig. 4C). Across all recordings(n � 24), the correlation score of PA-BA(mean r � 0.70) is substantially and sig-nificantly greater than either PA-EL(mean r � 0.15; p � 0.05, one-wayANOVA followed by Tukey’s post hoc test)or BA-EL (mean r � 0.11; p � 0.05), indi-cating that MB response patterns evoked byPA and BA are more similar to each otherthan either are to EL (Fig. 4C).
The similarity between response pat-terns can also be measured using Euclid-ean distances, the same approach as thatused for our discrimination classificationalgorithm (Fig. 1). The magnitude of theEuclidean distance is inversely related topattern similarity: a Euclidean distance ofzero indicates that two patterns are iden-tical. Unlike the correlation coefficient,Euclidean distance takes into consider-ation absolute response magnitudes.Within recordings, Euclidean distancesbetween PA-BA patterns were shorterthan the PA-EL and BA-EL distances,again indicating that PA and BA patternswere most similar to one another (Fig. 4D). To exclude the pos-sibility that the overall response magnitude affected our predic-tions, we performed the same analysis using a correlationdistance metric (1 � Pearson’s r), which only reflects patternsimilarity. Results obtained using correlation distance match re-sults obtained using Euclidean distances (data not shown). Thiswas true for all subsequent distance comparisons (Fig. 5A1–A3).
To estimate the degree to which these odors would be gener-alized based on MB activity, we used a generalization variant ofthe linear classifier. The classifier first calculates the average MBpattern evoked by the reinforced odor, say PA, for each recordingand is then challenged with one BA trial and one EL trial. Theclassifier chooses the trial, either BA or EL, for which theresponse pattern best matches the learned pattern for PAbased on proximity in Euclidean distance. This process is re-peated for all possible pairs of BA and EL trials. If the BA andEL patterns are, on average, equidistant from the learned pat-tern, the classifier will choose BA and EL in equal proportion.However, if BA patterns are consistently closer to the learnedPA pattern then the classifier will choose BA over EL moreoften than chance.
We first investigated whether MB responses to BA and PA aresufficiently different to be identified as distinct. Indeed, there are KCsthat respond uniquely to either PA (70 of 2756 total KCs; 2.5%) orBA (75 of 2756 total KCs; 2.7%) and not to both. When discrimina-tion between BA and PA activity patterns is tested using the linearclassifier, these two odors are consistently discriminated well abovechance across all recordings (Fig. 4E). We next examined the outputof the classifier when challenged with the generalization task. WhenPA is used as the reinforced odor, the classifier chooses BA signifi-cantly more often than chance (Fig. 4F, left). Generalization to PA isequally good when BA is the reinforced odor (Fig. 4F, right). There-fore, our classifier shows that neural activity predicts generalizationacross PA and BA when EL is presented as the alternative, “out-group” odor.
These physiology results make two predictions: (1) that fliesshould be capable of discriminating between PA and BA, despitethe fact that these odors are chemically related and evoke similarresponse patterns; and (2) that associations learned to PA willreadily generalize to BA and vice versa when EL serves as anout-group (comparison) odor. Note that the degree of general-ization between any two odors is only predictable with respect toa third defined out-group odor.
A
C D
B
Figure 3. Predicting behavioral discrimination accuracy from neural activity. A, Mean evoked dF/F from 54 cells recorded in oneexperiment in which all three blend pairs (colored bars) were presented. Each stimulus was presented six times each in a randomorder. Data grouped by blend for display purposes. R-values indicate correlation coefficient between mean responses to each blendpair. B, Correlation coefficients between blend pairs obtained from 11 animals. Errors bars are 95% confidence interval for themean. C, Discrimination accuracy predicted by a linear classifier (red line; neurometric function). Blue line: psychometric functionreproduced from Figure 2B. D, The performance of the classifier across a range of different neuronal population sizes (colors goingfrom yellow to red: k � 3, 6, 9, 12, 25, 50). Blue line: psychometric function reproduced from Figure 2B.
10574 • J. Neurosci., June 19, 2013 • 33(25):10568 –10581 Campbell, Honegger et al. • Coding Odor Identity in Drosophila
A
B
E
G H
F
C D
Figure 4. Discrimination and generalization of similar odors. A, Three example MB recordings showing response patterns evoked by the odors PA, BA, and EL, averaged across all trials.Responses to BA and PA are similar and distinct from EL. B, Venn diagram showing overlap of significantly responding cells from all recordings (n � 24). Many neurons tend to respondto both PA and BA, whereas most EL-responsive KCs respond only to EL. C, Correlation scores for each pair of odors. Each point is the correlation score calculated from the average MBresponse to each odor within a single recording (n � 24 recordings). The correlation between PA and BA is significantly (see main text) greater than the other two. Dark gray box indicates95% confidence interval; light gray box indicates 1 SD; black line is the mean. D, Euclidean distances between odor responses within recordings (circles). Distances are based upon averageMB response patterns. Each point indicates the PA-BA distance (x-axis) versus either the PA-EL (orange) or BA-EL (brown) distance ( y-axis). Statistics reported in D–F are results of aone-tailed binomial test. E, Linear classifier based on Euclidean distance distinguishes PA from BA (left) and BA from PA (right) above chance (dashed line at 50%) for all recordings. Blackline is the mean. F, When the classifier is trained to detect PA, but tested with BA versus EL, BA is consistently chosen over EL (left). Likewise, when trained to BA, PA is chosen more often(right). G, Flies can discriminate PA and BA. Gray lines show choices of yoked control/experimental group pairs. Pairing PA with shock significantly reduces the number of flies choosingPA compared with un-shocked controls (paired t test, one-tailed). Black line indicates the mean across experiments. The label “PA: PA vs BA” indicates that flies in the experimental groupwere shocked to PA, then given a choice between PA and BA. Odor preference was calculated against PA in this case. Similar results were obtained in the reciprocal case, “BA: BA vs PA”(right). H, Flies generalize across PA and BA when tested against EL. Flies shocked to PA and given a choice between BA and EL chose BA less often (paired t test, two-tailed) than thePA-exposed-only control group (left). Right panel shows reciprocal experiment with flies shocked to BA. In only one case was the proportion of flies choosing PA greater in the shockedgroup than its yoked control (red).
Campbell, Honegger et al. • Coding Odor Identity in Drosophila J. Neurosci., June 19, 2013 • 33(25):10568 –10581 • 10575
We tested these behavioral predictions using a variant ofthe T-maze learning paradigm. Groups of �100 flies aretrained to associate one odor (CS �) with electric shock (un-conditioned stimulus) and are then given the choice betweenthe CS � and a novel test odor (discrimination task) or twonovel test odors (generalization task; see Materials and Meth-ods for details). The resulting distribution of the flies’ choicesis compared with how flies distribute when they are simplyexposed to the CS � without receiving shock. This comparisonreveals how much the shock modified flies’ innate odor prefer-ence. Note that this experimental design does not test for nonas-sociative effects of the shock. Such effects have been observed insome mutant strains, but not in wild-type Canton-S at the shockintensity we use here (Preat, 1998). The training regimen we usehere is also different from the standard discriminative trainingparadigm, in which flies are first shocked in the presence of oneodor and then exposed to a second odor in the absence of shock.Because our goal in this series of experiments was to study
generalization, we did not include the second phase of train-ing, when flies could potentially learn that the second odor(the CS �) is “safe.” In addition, previous experiments indi-cated that the CS � is dispensable for forming associations(Masek and Heisenberg, 2008). Our approach, which mea-sures the degree to which innate odor preferences are modifiedby associative training, enabled us to examine behavioral re-sponses to odors presented at the 1:100 concentration used inimaging experiments without correcting for the innate attrac-tiveness or aversion of the different odors. This approach hasbeen used previously in studies of long-term memory (Yu etal., 2006; Akalal et al., 2010, 2011). We did not attempt toadjust the odor concentrations to equalize their relative innateattractiveness because this would have been impractical giventhe number of odor pairs tested. Furthermore, it would haverequired us to iterate back and forth between physiology andbehavior, making it impossible to derive behavioral predic-tions from MB response patterns alone.
A B C
A B C
A B C
Figure 5. MB activity makes accurate predictions about generalization across chemically distinct odors. A, Euclidean distances between odor pairs were compared within recordings (Fig. 4D) forthree odor trios. Instances of generalization are predicted by A1 and A2. In A3, the points lie along the unity line so no generalization is predicted. B, Generalization across odors based on MB activity(as in Fig. 4F ). The classifier significantly generalizes between HP and PA (B1) and OCT and OE (B2). No generalization is predicted for the HP/BA/PA trio (B3). Each point corresponds to results froma single recording; black line is the mean. C, Odor generalization behavior in the T-maze (as in Fig. 4H ). C1, Flies shocked to PA chose HP over EL less often than yoked PA-exposed controls (left), andvice versa (right). C2, Flies shocked to OE chose OCT over HE less often than yoked OE-exposed controls (left) and vice versa (right). C3, Flies shocked to HP did not choose PA or BA significantly lessoften than HP-exposed controls (left). Flies shocked to PA did choose HP over BA slightly, but significantly, less often than PA-exposed controls (right). Data for BA: PA vs HP experiment are not shown,but no significant generalization of the BA-shock association to either HP or PA was observed.
10576 • J. Neurosci., June 19, 2013 • 33(25):10568 –10581 Campbell, Honegger et al. • Coding Odor Identity in Drosophila
We first tested whether flies could distinguish the chemicallysimilar odors PA and BA. Consistent with the results of MB-activity based classification shown in Figure 4E, we found thatflies readily discriminated PA and BA. Pairing PA with shocksignificantly (paired one-tailed test, see figures for details) de-creased the proportion of flies choosing PA over BA relative tocontrol flies exposed to PA in the absence of shock (Fig. 4G, left).Similar results were obtained with the reciprocal experiment inwhich BA was the odor paired with shock; flies now decreasedtheir choice of BA relative to PA (Fig. 4G, right). We next inves-tigated whether flies generalize the aversive association formedwith PA to the similar odor, BA. We found that pairing PA withshock significantly decreased the proportion of flies choosing thesimilar odor, BA, over the out-group odor, EL (Fig. 4H, left).Similar results were obtained with the reciprocal experiment inwhich flies were shocked during exposure to BA and then given achoice between PA and EL (Fig. 4H, right). The red line in Figure4H indicates an instance when the flies’ choices were the oppositeof what we predicted. These behavioral results show that fliesgeneralize between PA and BA when given EL as an alternative.
These results show that flies were clearly able to distinguishthis pair of similar odors (Fig. 4G). However, when given thechoice between two novel odors, flies avoid the odor that is mostsimilar to the previously shocked odor in terms of both chemicalsimilarity and MB activity patterns. Therefore, for this particulartrio of odors, we can accurately predict whether flies will gener-alize the learned association and use that experience in a novelcontext.
Generalization between chemically distinct odorsIn the preceding generalization experiments, the behavioral out-come could potentially have been predicted simply on the basis ofchemical similarity. To further validate the correspondence be-tween behavior and MB activity, we used imaging to search foradditional odor trios to test. In this manner, we produced threefurther predictions that could not be derived from obvious fea-tures of chemical structure.
We identified a trio in which each member possesses a differ-ent functional group: PA, HP, and EL. For all recordings, theobserved Euclidean distance between PA and HP was smallerthan the distance between EL and either odor (Fig. 5A1). Thispredicts that significant generalization should be observed be-tween PA and HP when EL is the out-group odor. As before, thisprediction was confirmed using results of the linear classifier. Theclassifier accurately discriminates between PA and HP (data notshown). For the generalization case, when PA is the reinforced
odor, HP is chosen over EL significantly more often than chance(Fig. 5B1, left). The converse is true when HP is the reinforcedodor (Fig. 5B1, right). These imaging results predict that fliesshould generalize between PA and HP with respect to EL as theout-group odor.
We tested this prediction behaviorally as before. Flies easilydiscriminated between PA and HP (Fig. 6C), confirming thatthese odors are perceptually distinct. In generalization experi-ments, when flies were shocked to PA and given the choice be-tween HP and EL, the proportion of flies choosing HP decreasedsignificantly (Fig. 5C1, left). Likewise, flies shocked to HP gener-alized the association to PA (Fig. 5C1, right). These behavioralobservations confirm that flies generalize between PA and HPwith EL as the out-group odor. This result could only be pre-dicted from neural activity because the chemical structures of thethree odors are diverse.
We next identified an odor trio where the members all sharevery similar structures. We chose OCT, an 8 carbon alcohol;1-octen-3-ol (OE), an 8 carbon alcohol with one double bond;and 1-hepten-3-ol (HE), a 7 carbon alcohol with one doublebond. From structure alone, it is not clear whether there is a pairof these odors that is more similar than the others or which pair ofodors that would be. Imaging revealed that the Euclidean dis-tance between OCT and OE patterns was significantly smallerthan the distance between either odor and HE (Fig. 5A2). Thelinear classifier discriminates accurately between OCT and OE(data not shown). Training the classifier to detect OE in the gen-eralization context leads to it selecting OCT significantly moreoften than HE (Fig. 5B2, left) and vice versa when trained to detectOCT (Fig. 5B2, right). These results indicate that flies shouldconsistently generalize between OE and OCT when tested againstthe alternative, HE.
Behaviorally, flies could readily discriminate between OCTand OE (data shown in Fig. 6D). In the generalization experi-ments, when shocked to OE and given the choice between OCTand HE, flies chose OCT significantly less often than preexposedcontrols (Fig. 5C2, left). Likewise, flies shocked to OCT general-ized the association to OE (Fig. 5C2, right). Therefore, flies gen-eralized between OCT and OE when given HE as an out-group, aspredicted by neural activity.
All of the preceding experiments showed positive results: neu-ral activity patterns always predicted clear generalization betweena single pair of odors, which was confirmed behaviorally. We thussearched for three odors that were all equally similar to one an-other. We expected that no clear generalization should be possi-ble among the members of such a trio. When we imaged MB
A B C D E
Figure 6. Summary of behavioral performance across all odor trios. A, Schematic displaying the labeling conventions for experimental configurations shown in B–E. B–E, Discrimination andgeneralization of all odor trios. Each experiment is identified by a three-component pie chart, with slice color indicating the identities and roles of the three odors in each experiment. Pies are centeredat the mean behavioral preference score, calculated as the difference between the yoked experimental and control groups (shocked or exposed-only to the odor indicated by the lower slice color) inproportion of flies choosing TestA (upper-left slice color) over TestB (upper-right slice color). Gray bars indicate the 95% t-confidence interval for each experiment. Difference in proportion of flieschoosing TestA is significantly different from zero ( p � 0.05) for all experiments except the last two in E, HP: PA vs BA ( p � 0.055) and BA: PA vs HP ( p � 0.29). Note that no odor pair from thistrio, PA/HP/BA, was predicted to display generalization.
Campbell, Honegger et al. • Coding Odor Identity in Drosophila J. Neurosci., June 19, 2013 • 33(25):10568 –10581 • 10577
responses to the odors PA, BA, and HP, we found no pair signif-icantly closer in Euclidean distance than any other (p � 0.05 forall three pairs, binomial test; Fig. 5A3). Furthermore, althoughthe linear classifier accurately discriminates between all pairs ofthe three odors (data not shown), training the classifier with anyof the odors in the generalization context produces no consistentcross-identification with any other odor from the trio (Fig. 5B3).These imaging results suggest that flies will be equally likely togeneralize between any of the odors from this trio and thereforewill display no clear generalization behavior between any pair ofodors.
Behaviorally, when flies were shocked to HP and given thechoice between PA and BA, their odor choices did not differsignificantly from preexposed controls (p � 0.055, Fig. 5C3, left).Flies shocked to PA showed weak but significant generalization toHP (p � 0.046; Fig. 5C3, left). Finally, flies shocked to BA andgiven the choice between PA and HP did not display any signifi-cant generalization behavior (p � 0.29; Fig. 6). All statistics arepaired t tests. Therefore, for this odor trio, in which imagingpredicts that no generalization will take place, we see one instanceof weak generalization and two instances of no significant gener-alization. In all three cases, the effect magnitude is small.
The results of the four generalization experiments are dis-played in Figure 6, which summarizes behavioral performance inall discrimination and generalization experiments performed. Ineach subpanel, the circular symbols indicate the odor to whichthe flies were shocked and tested. Symbols with two unique colorsindicate discrimination (denoted below the x-axis as “D”). Sym-bols with three unique colors indicate generalization (denoted as“G”). This figure highlights two striking aspects of the relation-ship between odor-driven behavior and KC ensemble odor re-sponses. First, flies discriminated all pure odor pairs, even thosethat evoke very few KC responses that are unique to one of twoodors (Fig. 4A,B,G). Second, flies consistently generalized tonovel odors in the way we predicted based on neural activity inthe MB.
In summary, we have shown that the perceptual relationshipbetween odors may be mapped onto the activity of the MB andthat flies apparently rely on this ensemble information whenmaking decisions about learned odor associations.
DiscussionWe investigated the relationship between neural response pat-terns in the MB and the specificity of behavioral responses in twodifferent learning-based tasks: odor discrimination and odorgeneralization. Most previous studies of the Drosophila olfactorycircuit that related neuronal activity to behavior focused on in-nate responses to odor (Kreher et al., 2008; Semmelhack andWang, 2009). These studies accurately predicted both attractiveand aversive innate responses to odor using activity patterns inearly olfactory layers, but did not address the principles of neuralcoding that underlie learned olfactory behaviors, which are sup-ported by deeper areas in the olfactory pathway.
Learned olfactory behaviors must be odor specific to be useful,and labeled line coding likely does not have the capacity requiredto support many different specific memories. Neurons in the MBexhibit highly odor-specific responses and odor representationsare carried by a sparsely distributed KC population code. Theo-retical studies suggest that sparseness is useful for accurate learn-ing because it minimizes the overlap between response patternsevoked by different stimuli (Kanerva, 1988; Fiete et al., 2004). Themore overlapping two representations are in naive animals, themore difficult it might be for subsequent synaptic changes to be
specific to one stimulus during learning. Imaging enabled us todirectly visualize the overlap between different odor representa-tions, because we were able to track the activity of �100 KCssimultaneously. We used both discrimination and generalizationtasks to investigate how population-level activity patterns relateto the animal’s perception of odor identity. Overall, we foundthat flies’ performance in both types of tasks was well described bythe degree to which odor-evoked activity patterns overlapped inthe MB. These results show that the MB conveys odor identity ina behaviorally meaningful way.
Discrimination of similar stimuliTo examine neural coding under conditions in which stimulusdiscrimination is difficult behaviorally, we used a series ofsmoothly morphing odor blends. We then evaluated the under-lying MB response patterns in these increasingly difficult dis-crimination conditions. We found a strong correspondencebetween behavioral discrimination and our readout of MB activ-ity across this range of conditions. There were two factors thatcontributed to the difficulty of discrimination. First, even thoughMB representations are sparse, KC patterns become increasinglyoverlapping and correlated when approaching the discrimina-tion limit. Second, the variability of KC responses is an importantlimiting factor. This variability is perhaps underappreciated—inneurons such as KCs that fire few spikes, response variability canmean that firing rates dip to zero on some odor presentation trials(Perez-Orive et al., 2002; Turner et al., 2008). It is possible thatthe variability and low evoked spike count of KCs is an inevitableconsequence of their high selectivity. Nevertheless, we found thatpooling information across the KC population is sufficient todistinguish between highly similar stimuli.
Although these factors surely limit information transmissionin the MB, we note that tracking KC activity using a calciumsensor may underestimate the information content present in thepopulation. Perhaps more information could be extracted bymonitoring spikes with multiunit electrophysiological record-ings in which greater temporal precision is available. We considerthis unlikely, because Drosophila KC spiking responses are gen-erally phasic and carry no obvious information in fine spike tim-ing (Turner et al., 2008); however, the timing of response onsetmay be a relevant coding variable (Fig. 1B).
Generalization across different stimuliIn our studies of odor discrimination, we first characterized dis-crimination behaviorally and then examined post hoc whetherneural activity matched behavior. To test more stringently ourunderstanding of population coding in the MB, we investigatedwhether we could use KC activity patterns to predict the flies’olfactory behavior. We used a generalization paradigm in whichflies learn to avoid one odor and then test their responses to twodifferent test stimuli. We predicted that flies will avoid the testodor that evokes a response pattern most similar to that of theshocked odor. This situation makes for challenging predictions,because we are testing whether flies apply their past experiencewith one odor to stimuli they have never previously encountered.We made predictions for a series of odor sets in which general-ization became increasingly difficult to predict based on chemicalstructure alone. In all cases, our predictions about odor similaritybased on KC activity matched behavioral outcomes, providingstrong evidence that the representation of odor identity in thisarea is closely related to the flies’ behavioral choices.
It is important to note that a similar relationship betweenneural activity patterns and behavior would be expected in earlier
10578 • J. Neurosci., June 19, 2013 • 33(25):10568 –10581 Campbell, Honegger et al. • Coding Odor Identity in Drosophila
stages of the olfactory pathway. The ORN and PN populationsmust contain an equal or greater amount of information aboutodor identity than the MB. For example, a study of trace condi-tioning in Drosophila (Galili et al., 2011) found evidence for acorrespondence between neural activity and generalization at thelevel of the ORNs. Those investigators compared butanol-evokedactivity patterns with patterns elicited by three other odors andfound that pattern similarity in ORNs was correlated with theflies’ ability to generalize an association they had formed withbutanol. A pioneering study in honeybees used proboscis exten-sion as a measure of learning to show that bees generalize acrosschemically similar compounds (Guerrieri et al., 2005). Com-pounds treated as similar by the bees tended to be those thatevoked similar patterns of glomerular activity measured in anearlier imaging study (Sachse et al., 1999). Similar observationswere made using calcium imaging of neuropil in the Drosophilaantennal lobe (Niewalda et al., 2011). That study reported a rela-tionship for chemical structure, perceptual distance, and spatialdistribution of calcium signals in the antennal lobe, although inthis case imaging could not resolve individual glomeruli or neu-rons. The present study benefits from our ability to track theindividual cells that are the units of the neural code. This enabledus to extract sufficient information from the KC population topredict behavioral outcomes from our imaging results.
Decoding information in the MBAlthough there are about 2000 KCs in each hemisphere, our re-sults with olfactory discrimination show that only approximately25 MB neurons are required for producing performance on parwith the flies’ behavior. It is likely that many of these neurons areof the ��/�� class, because these are the most responsive KC types(Turner et al., 2008). However, this result does not indicate thatonly 25 cells are needed for any discrimination task; rather, thisnumber of cells is sufficient for distinguishing between twoodors. Classification becomes more difficult when there are mul-tiple possible odor classes. In a natural setting, where animals areconfronted with a much wider range of odors, the representa-tional capacity provided by the larger population of MB neuronswould be extremely important.
KCs synapse on a small number (Y. Aso, personal communi-cation) of output neurons (Tanaka et al., 2008; Sejourne et al.,2011). Each output neuron likely receives input from many KCs;however, the impact of any particular KC on these downstreamneurons would depend on the strength of their synaptic connec-tions, a topic that is currently unexplored. Nevertheless, the ex-tensive dendritic arbor of MB output neurons would almostcertainly sample from more than the 25 KCs needed to conveyodor identity accurately in our task.
A unified framework for discrimination and generalizationHow can the MB support both highly accurate olfactory discrim-ination and generalization? One appealing framework is that ofmemory retrieval as template matching. According to this hy-pothesis, flies that form an association with one particular odorstore a corresponding template in the MB. Both generalizationand discrimination depend upon the degree to which test odorsmatch this stored template. When flies are trained with one stim-ulus and tested with other stimuli they have never before encoun-tered, they respond to the stimulus with the representation thatmost strongly overlaps with the stored template, even if thatmatch is not perfect. This corresponds to stimulus generalization.When confronted with a discrimination task, flies learn to accu-
rately distinguish odors based on the parts of the representationthat do not overlap.
Although molecular components involved in synaptic plastic-ity are required in KCs for proper learning (Skoulakis et al., 1993;Tully et al., 1994; Connolly et al., 1996; Skoulakis and Davis,1996; Zars et al., 2000; Schwaerzel et al., 2002; Blum et al., 2009),it is not known whether the pattern of responding KC somata isaltered by learning. We were able to use MB activity patternsrecorded in naive flies to predict generalization behavior intrained flies, which would not have been possible if traininggreatly modifies the MB representation of a conditioned odor.Therefore, our results predict that either the pattern of activatedKCs does not change after learning or that any learning-inducedchanges in patterns are relatively restricted. What feature of MBactivity changes as a result of leaning? There is evidence thatassociative conditioning modifies KC output, as Ca 2� imaging ofKC neuropil suggests that plasticity occurs in the output lobes ofthe MB, but not the calyx (Yu et al., 2006; Wang et al., 2008;Akalal et al., 2010; Davis, 2011). More directly, learning has beenshown to cause changes in the odor responses of MB outputneurons (Sejourne et al., 2011). It is possible that only KC axonaloutput is modified and the association is carried by activitychanges in neurons downstream of the MB. Regardless, our re-sults show that knowledge of KC response patterns in naive ani-mals can effectively describe the odor specificity of learnedolfactory behavior.
ReferencesAbraham NM, Spors H, Carleton A, Margrie TW, Kuner T, Schaefer AT
(2004) Maintaining accuracy at the expense of speed: stimulus similaritydefines odor discrimination time in mice. Neuron 44:865– 876. CrossRefMedline
Akalal DB, Yu D, Davis RL (2010) A late-phase, long-term memory traceforms in the � neurons of Drosophila mushroom bodies after olfactoryclassical conditioning. J Neurosci 30:16699 –16708. CrossRef Medline
Akalal DB, Yu D, Davis RL (2011) The long-term memory trace formed inthe Drosophila �/� mushroom body neurons is abolished in long-termmemory mutants. J Neurosci 31:5643–5647. CrossRef Medline
Aso Y, Grubel K, Busch S, Friedrich AB, Siwanowicz I, Tanimoto H (2009)The mushroom body of adult Drosophila characterized by GAL4 drivers.J Neurogenet 23:156 –172. CrossRef Medline
Bhandawat V, Olsen SR, Gouwens NW, Schlief ML, Wilson RI (2007) Sen-sory processing in the Drosophila antennal lobe increases reliability andseparability of ensemble odor representations. Nat Neurosci 10:1474 –1482. CrossRef Medline
Blum AL, Li W, Cressy M, Dubnau J (2009) Short- and long-term memoryin Drosophila require cAMP signaling in distinct neuron types. Curr Biol19:1341–1350. CrossRef Medline
Briggman KL, Abarbanel HD, Kristan WB Jr (2005) Optical imaging of neu-ronal populations during decision-making. Science 307:896 –901.CrossRef Medline
Broome BM, Jayaraman V, Laurent G (2006) Encoding and decoding ofoverlapping odor sequences. Neuron 51:467– 482. CrossRef Medline
Camhi JM, Levy A (1989) The code for stimulus direction in a cell assemblyin the cockroach. J Comp Physiol A 165:83–97. CrossRef Medline
Campbell RA, King AJ, Nodal FR, Schnupp JW, Carlile S, Doubell TP (2008)Virtual adult ears reveal the roles of acoustical factors and experience inauditory space map development. J Neurosci 28:11557–11570. CrossRefMedline
Connolly JB, Roberts IJ, Armstrong JD, Kaiser K, Forte M, Tully T, O’Kane CJ(1996) Associative learning disrupted by impaired Gs signaling in Dro-sophila mushroom bodies. Science 274:2104 –2107. CrossRef Medline
Cury KM, Uchida N (2010) Robust odor coding via inhalation-coupledtransient activity in the mammalian olfactory bulb. Neuron 68:570 –585.CrossRef Medline
Datta SR, Vasconcelos ML, Ruta V, Luo S, Wong A, Demir E, Flores J, BalonzeK, Dickson BJ, Axel R (2008) The Drosophila pheromone cVA activatesa sexually dimorphic neural circuit. Nature 452:473– 477. CrossRefMedline
Campbell, Honegger et al. • Coding Odor Identity in Drosophila J. Neurosci., June 19, 2013 • 33(25):10568 –10581 • 10579
Davis RL (2011) Traces of Drosophila memory. Neuron 70:8 –19. CrossRefMedline
de Belle JS, Heisenberg M (1994) Associative odor learning in Drosophilaabolished by chemical ablation of mushroom bodies. Science 263:692–695. CrossRef Medline
de Bruyne M, Foster K, Carlson JR (2001) Odor coding in the Drosophilaantenna. Neuron 30:537–552. CrossRef Medline
Dubnau J, Grady L, Kitamoto T, Tully T (2001) Disruption of neurotrans-mission in Drosophila mushroom body blocks retrieval but not acquisi-tion of memory. Nature 411:476 – 480. CrossRef Medline
Fernandez PC, Locatelli FF, Person-Rennell N, Deleo G, Smith BH (2009)Associative conditioning tunes transient dynamics of early olfactory pro-cessing. J Neurosci 29:10191–10202. CrossRef Medline
Fiete IR, Hahnloser RH, Fee MS, Seung HS (2004) Temporal sparseness ofthe premotor drive is important for rapid learning in a neural networkmodel of birdsong. J Neurophysiol 92:2274 –2282. CrossRef Medline
Fisher R (1936) The use of multiple measurements in taxonomic problems.Annals of Eugenics 7:179 –188. CrossRef
Friedrich RW, Laurent G (2001) Dynamic optimization of odor representa-tions by slow temporal patterning of mitral cell activity. Science 291:889 –894. CrossRef Medline
Galili DS, Ludke A, Galizia CG, Szyszka P, Tanimoto H (2011) Olfactorytrace conditioning in Drosophila. J Neurosci 31:7240 –7248. CrossRefMedline
Georgopoulos AP, Schwartz AB, Kettner RE (1986) Neuronal populationcoding of movement direction. Science 233:1416 –1419. CrossRefMedline
Hung CP, Kreiman G, Poggio T, DiCarlo JJ (2005) Fast readout of objectidentity from macaque inferior temporal cortex. Science 310:863– 866.CrossRef Medline
Ito I, Ong RC, Raman B, Stopfer M (2008) Sparse odor representation andolfactory learning. Nat Neurosci 11:1177–1184. CrossRef Medline
Ito K, Suzuki K, Estes P, Ramaswami M, Yamamoto D, Strausfeld NJ (1998)The organization of extrinsic neurons and their implications in the func-tional roles of the mushroom bodies in Drosophila melanogaster Meigen.Learn Mem 5:52–77. CrossRef Medline
Kanerva P (1988) Sparse distributed memory. Cambridge, MA: MIT.Klein S, Staring M, Murphy K, Viergever MA, Pluim JPW (2010) elastix: a
tool-box for intensity-based medical image registration. IEEE Trans MedImaging 29:196 –205. CrossRef Medline
Koulakov AA, Rinberg D (2011) Sparse incomplete representations: a po-tential role of olfactory granule cells. Neuron 72:124 –136. CrossRefMedline
Kreher SA, Mathew D, Kim J, Carlson JR (2008) Translation of sensoryinput into behavioral output via an olfactory system. Neuron 59:110 –124.CrossRef Medline
Laurent G (2002) Olfactory network dynamics and the coding of multidi-mensional signals. Nat Rev Neurosci 3:884 – 895. CrossRef Medline
Laurent G, Naraghi M (1994) Odorant-induced oscillations in the mush-room bodies of the locust. J Neurosci 14:2993–3004. Medline
Lee T, Luo L (1999) Mosaic analysis with a repressible cell marker for studiesof gene function in neuronal morphogenesis. Neuron 22:451– 461.CrossRef Medline
MacLeod K, Backer A, Laurent G (1998) Who reads temporal informationcontained across synchronized and oscillatory spike trains? Nature 395:693– 698. CrossRef Medline
Martinez-Conde S, Macknik SL, Hubel DH (2002) The function of bursts ofspikes during visual fixation in the awake primate lateral geniculate nu-
cleus and primary visual cortex. Proc Natl Acad Sci U S A 99:13920 –13925. CrossRef Medline
Masek P, Heisenberg M (2008) Distinct memories of odor intensity andquality in Drosophila. Proc Natl Acad Sci U S A 105:15985–15990.CrossRef Medline
McGuire SE, Le PT, Davis RL (2001) The role of Drosophila mushroombody signaling in olfactory memory. Science 293:1330 –1333. CrossRefMedline
Miura K, Mainen ZF, Uchida N (2012) Odor representations in olfactorycortex: distributed rate coding and decorrelated population activity. Neu-ron 74:1087–1098. CrossRef Medline
Murthy M, Turner GC (2010) In vivo whole-cell recordings in the Drosoph-ila brain. In: Drosophila neurobiology methods: a laboratory manual(Zhang B, Waddell S, Freeman M, eds). Cold Spring Harbor, NY: ColdSpring Harbor Laboratory.
Nelken I, Chechik G, Mrsic-Flogel TD, King AJ, Schnupp JW (2005) Encod-ing stimulus information by spike numbers and mean response time inprimary auditory cortex. J Comput Neurosci 19:199 –221. CrossRefMedline
Niewalda T, Voller T, Eschbach C, Ehmer J, Chou WC, Timme M, Fiala A,Gerber B (2011) A combined perceptual, physico-chemical, and imag-ing approach to “odour-distances” suggests a categorizing function of theDrosophila antennal lobe. PLoS ONE 6:e24300. CrossRef Medline
Parker AJ, Newsome WT (1998) Sense and the single neuron: probing thephysiology of perception. Annu Rev Neurosci 21:227–277. CrossRefMedline
Perez-Orive J, Mazor O, Turner GC, Cassenaer S, Wilson RI, Laurent G(2002) Oscillations and sparsening of odor representations in the mush-room body. Science 297:359 –365. CrossRef Medline
Perez-Orive J, Bazhenov M, Laurent G (2004) Intrinsic and circuit proper-ties favor coincidence detection for decoding oscillatory input. J Neurosci24:6037– 6047. CrossRef Medline
Preat T (1998) Decreased odor avoidance after electric shock in Drosophilamutants biases learning and memory tests. J Neurosci 18:8534 – 8538.Medline
Rieke F, Warland D, de Ruyter van Steveninck R, Bialek W (1999) Spikes:exploring the neural code. Cambridge, MA: MIT.
Root CM, Masuyama K, Green DS, Enell LE, Nassel DR, Lee CH, Wang JW(2008) A presynaptic gain control mechanism fine-tunes olfactory be-havior. Neuron 59:311–321. CrossRef Medline
Ruta V, Datta SR, Vasconcelos ML, Freeland J, Looger LL, Axel R (2010) Adimorphic pheromone circuit in Drosophila from sensory input to de-scending output. Nature 468:686 – 690. CrossRef Medline
Sachse S, Rappert A, Galizia CG (1999) The spatial representation of chem-ical structures in the antennal lobe of honeybees: steps towards the olfac-tory code. Eur J Neurosci 11:3970 –3982. CrossRef Medline
Sachse S, Rueckert E, Keller A, Okada R, Tanaka NK, Ito K, Vosshall LB(2007) Activity-dependent plasticity in an olfactory circuit. Neuron 56:838 – 850. CrossRef Medline
Schwaerzel M, Heisenberg M, Zars T (2002) Extinction antagonizes olfac-tory memory at the subcellular level. Neuron 35:951–960. CrossRefMedline
Sejourne J, Placais PY, Aso Y, Siwanowicz I, Trannoy S, Thoma V, Tedja-kumala SR, Rubin GM, Tchenio P, Ito K, Isabel G, Tanimoto H, Preat T(2011) Mushroom body efferent neurons responsible for aversive olfac-tory memory retrieval in Drosophila. Nat Neurosci 14:903–910. CrossRefMedline
Semmelhack JL, Wang JW (2009) Select Drosophila glomeruli mediate in-nate olfactory attraction and aversion. Nature 459:218 –223. CrossRefMedline
Shadlen MN, Newsome WT (1998) The variable discharge of cortical neu-rons: implications for connectivity, computation, and information cod-ing. J Neurosci 18:3870 –3896. Medline
Silbering AF, Okada R, Ito K, Galizia CG (2008) Olfactory information pro-cessing in the Drosophila antennal lobe: anything goes? J Neurosci 28:13075–13087. CrossRef Medline
Skoulakis EM, Davis RL (1996) Olfactory learning deficits in mutants forleonardo, a Drosophila gene encoding a 14 –3-3 protein. Neuron 17:931–944. CrossRef Medline
Skoulakis EME, Kalderon DD, Davis RL (1993) Preferential expression inmushroom bodies of the catalytic subunit of protein kinase A and its rolein learning and memory. Neuron 11:197–208. CrossRef Medline
10580 • J. Neurosci., June 19, 2013 • 33(25):10568 –10581 Campbell, Honegger et al. • Coding Odor Identity in Drosophila
Sparks DL, Holland R, Guthrie BL (1976) Size and distribution of move-ment fields in the monkey superior colliculus. Brain Res 113:21–34.CrossRef Medline
Stopfer M, Jayaraman V, Laurent G (2003) Intensity versus identity codingin an olfactory system. Neuron 39:991–1004. CrossRef Medline
Suh GS, Wong AM, Hergarden AC, Wang JW, Simon AF, Benzer S, Axel R,Anderson DJ (2004) A single population of olfactory sensory neuronsmediates an innate avoidance behaviour in Drosophila. Nature 431:854 –859. CrossRef Medline
Tanaka NK, Tanimoto H, Ito K (2008) Neuronal assemblies of the Drosoph-ila mushroom body. J Comp Neurol 508:711–755. CrossRef Medline
Theunissen FE, Miller JP (1991) Representation of sensory information inthe cricket cercal sensory system. II. Information theoretic calculation ofsystem accuracy and optimal tuning-curve widths of four primary in-terneurons. J Neurophysiol 66:1690 –1703. Medline
Thirion JP (1998) Image matching as a diffusion process: an analogy withMaxwell’s demons. Med Image Anal 2:243–260. CrossRef Medline
Thum AS, Jenett A, Ito K, Heisenberg M, Tanimoto H (2007) Multiplememory traces for olfactory reward learning in Drosophila. J Neurosci27:11132–11138. CrossRef Medline
Tian L, Hires SA, Mao T, Huber D, Chiappe ME, Chalasani SH, Petreanu L,Akerboom J, McKinney SA, Schreiter ER, Bargmann CI, Jayaraman V,Svoboda K, Looger LL (2009) Imaging neural activity in worms, fliesand mice with improved GCaMP calcium indicators. Nat Methods 6:875–881. CrossRef Medline
Tomko GJ, Crapper DR (1974) Neuronal variability: non-stationary re-sponses to identical visual stimuli. Brain Res 79:405– 418. CrossRefMedline
Tully T, Quinn WG (1985) Classical conditioning and retention in normaland mutant Drosophila melanogaster. J Comp Physiol A 157:263–277.CrossRef Medline
Tully T, Preat T, Boynton SC, Del Vecchio M (1994) Genetic dissection ofconsolidated memory in Drosophila. Cell 79:35– 47. CrossRef Medline
Turner GC, Bazhenov M, Laurent G (2008) Olfactory representations byDrosophila mushroom body neurons. J Neurophysiol 99:734 –746.CrossRef Medline
Uchida N, Mainen ZF (2003) Speed and accuracy of olfactory discrimina-tion in the rat. Nat Neurosci 6:1224 –1229. CrossRef Medline
Venables WN, Ripley BD (1999) Modern Applied Statistics with S, 4 ed.Springer.
Vosshall LB, Stocker RF (2007) Molecular architecture of smell and taste inDrosophila. Annu Rev Neurosci 30:505–533. CrossRef Medline
Walker KMM, Ahmed B, Schnupp JW (2008) Linking cortical spike patterncodes to auditory perception. J Cogn Neurosci 20:135–152. CrossRefMedline
Wang Y, Guo HF, Pologruto TA, Hannan F, Hakker I, Svoboda K, Zhong Y(2004) Stereotyped odor-evoked activity in the mushroom body of Dro-sophila revealed by green fluorescent protein-based Ca 2� imaging. J Neu-rosci 24:6507– 6514. CrossRef Medline
Wang Y, Mamiya A, Chiang AS, Zhong Y (2008) Imaging of an earlymemory trace in the Drosophila mushroom body. J Neurosci 28:4368 –4376. CrossRef Medline
Werner G, Mountcastle VB (1965) Neural activity in mechanoreceptive cu-taneous afferents: stimulus-response relations, weber functions, and in-formation transmission. J Neurophysiol 28:359 –397. Medline
Wilson RI, Turner GC, Laurent G (2004) Transformation of olfactory rep-resentations in the Drosophila antennal lobe. Science 303:366 –370.CrossRef Medline
Yu D, Keene AC, Srivatsan A, Waddell S, Davis RL (2005) Drosophila DPMneurons form a delayed and branch-specific memory trace after olfactoryclassical conditioning. Cell 123:945–957. CrossRef Medline
Yu D, Akalal DB, Davis RL (2006) Drosophila �/� mushroom body neuronsform a branch-specific, long-term cellular memory trace after spacedolfactory conditioning. Neuron 52:845– 855. CrossRef Medline
Zars T, Fischer M, Schulz R, Heisenberg M (2000) Localization of a short-term memory in Drosophila. Science 288:672– 675. CrossRef Medline
Campbell, Honegger et al. • Coding Odor Identity in Drosophila J. Neurosci., June 19, 2013 • 33(25):10568 –10581 • 10581