69
Alameda County Water District Board Workshop Presentation Water Rate Design July 26, 2018 1

t Alameda County Water District Board Workshop Presentation Water Rate Design July 26, 2018
1

Agenda • Financial Workshop Timeline Recap • Service Charges for Meters Upsized for Fire Flows • Rate Structures Overview • Stage Rates • Board Ranked Policy Objectives • Alternative Water Rate Structure Options • Next Steps
2

Board Guidance • Policy on meters upsized for fire flows • Water Rate Structure
› Fixed Service Charges › Water Commodity Charges › Stage Rates
3

Financial Workshops Timeline • February 22: Development Charges Overview • April 26: Water Rates Overview
› Development Charges Follow-up › Water Rates 101/Cost of Service Requirements › Policy Objectives
– Fixed/Variable Revenue Allocation › Account Establishment Fees › State Water Project Override Property Tax
4

Financial Workshops Timeline • May 22: Mid-cycle Budget Review
› Operating Budget Amendments › 25 year CIP/Capital Budget Amendments
– AMI Project Update › Reserve Policy Revisions
• July 26: Water Rate Design Review › Water Rates Design
– Service Charges for Meters Upsized for Fire Flows – Board Ranked Policy Objectives – Stage Rates – Alternative Rate Structure Options
5

Financial Workshops Timeline
• August 15: Financial Planning Model Scenarios › State Water Project Override Tax › WaterFix › Debt Issuance for AMI › Future Water Demand Alternatives › Los Vaqueros Expansion › Pension/Retiree Health Care Advanced Funding
• September 27: Financial Workshop › Development Charges Follow-up › Water Rates Follow-up
6

Financial Workshops Timeline
• December 6: Water Rates and Development Charges › Financial Planning Model Updates › Help on Tap Review › Set Proposition 218 Public Hearing › Set Mitigation Fee Act Public Hearing
• February 14, 2019 (Board Meeting): Rate and Fee Adoption › Water Rates effective March 1, 2019 › Development Charges effective May 1, 2019
7

8
Service Charges for Meters Upsized for Fire Flows

Service Charges for Meters Upsized for Fire Flows • Given current code requirements, most new residential
development is required to have fire sprinklers › This generally requires an upsize to the meter
• Current Policy: Any meter to a single-family residence that has been oversized to accommodate a fire sprinkler system is billed at the rate of the smallest meter, but not less than 1”, that could provide adequate service absent the fire sprinkler system
› 1 ½ -inch or larger meters due to fire flows requirements typically service charges are reduced 1 size lower
› ¾-inch and 1-inch meters will be charged at actual meter size no reduction in service charges
9

Policy Options for Fire Protection 1. Maintain current policy 2. Charge all customers based on actual meter size
• They receive a higher level of service
3. Charge based on what they need without fire sprinkler • Fire sprinklers provide a public benefit
4. Same as Option 3 + charge for the fire sprinkler as if it was a fire line • 1 ½ inch FLRES = 1” water meter ($80.70) + ¾” fire line
($14.40) • 1 inch FLRES = ¾” water meter ($52.33) + ¾” fire line
($14.40) • 2 inch FLRES = 1 ½” water meter ($151.59)+ ¾” fire line
($14.40) • Additional data will be required
10

Financial Consequence
11
Options Fixed Charges Rev Impacts
($ change from current policy)
% Impact of Fixed Charges Rev
Maintain current policy $34.60M $0 0%
Charges at actual meter size $35.49M $888K + 2.57%
Charges based on demand w/o fire flow requirements $33.58M -$1.02M -2.95%
Combine 1 size lower water charges + ¾” fire line $34.28M -$322K -0.93%

Staff Recommendation • Staff recommends setting the service charge for single family
residential customers at the rate of the smallest meter that could serve the property absent the need to upsize for fire flows
› Consistent across all meter sizes › Consistent with dedicated fireline service charges, which are not
assessed for full system capacity costs › Most new residential construction has a 1-inch meter that services
domestic use and fire flow capacity › Customers with a ¾-inch meter that serves domestic and fire service
would continue to pay the same meter charge (¾-inch meters pay the lowest service charge)
› Equivalent of a 1% weighted average rate decrease, which would be accounted for in the District’s financial planning
• Staff further recommends implementing any change concurrent with the next rates update
12

13
Rate Structures Overview
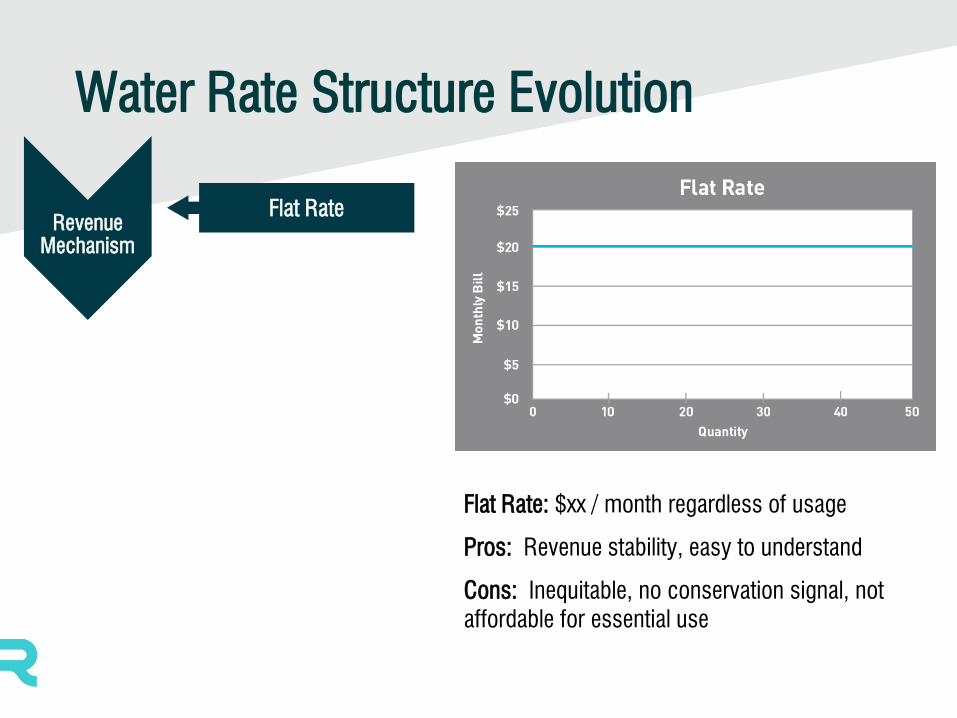
Water Rate Structure Evolution
Flat Rate: $xx / month regardless of usage
Pros: Revenue stability, easy to understand
Cons: Inequitable, no conservation signal, not affordable for essential use
Revenue Mechanism
Flat Rate

Uniform Rate: $xx / ccf
Pros: Revenue stability, administrative ease, easy to understand
Cons: Weak conservation signal, not affordable for essential use
Revenue Mechanism
Price Information
Flat Rate
Uniform Rate
Water Rate Structure Evolution
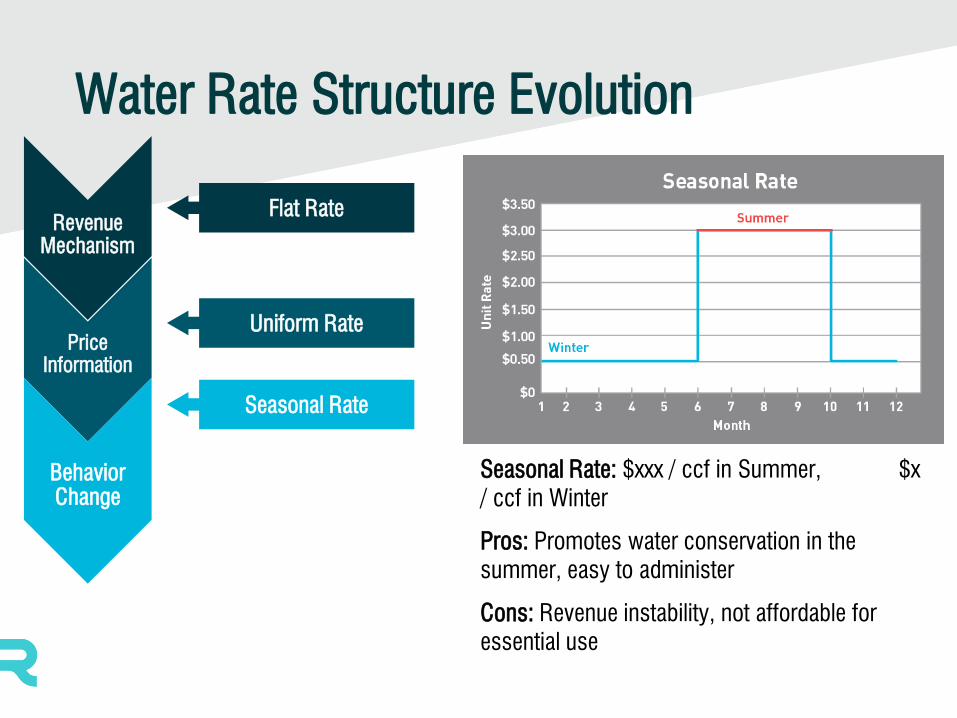
Seasonal Rate: $xxx / ccf in Summer, $x / ccf in Winter
Pros: Promotes water conservation in the summer, easy to administer
Cons: Revenue instability, not affordable for essential use
Water Rate Structure Evolution
Revenue Mechanism
Price Information
Behavior Change
Flat Rate
Uniform Rate
Seasonal Rate

Inclining Tiered Rate
Pros: Promotes conservation, affordable for essential use, easy to administer, easy to understand
Cons: Targets large users
Water Rate Structure Evolution
Revenue Mechanism
Price Information
Behavior Change
Flat Rate
Uniform Rate
Seasonal Rate
Inclining Tiered Rate

Excess Use Rate
Pros: Promotes conservation, affordable for essential use, fair among diversified customers
Cons: Perceived opportunity for gaming, harder to understand
Water Rate Structure Evolution
Revenue Mechanism
Price Information
Behavior Change
Flat Rate
Uniform Rate
Seasonal Rate
Inclining Tiered Rate
Excess Use Rate

Water Budget Tiered Rate
Pros: Promotes water efficiency, equitable, affordable for essential use, drought allocation tool, revenue stability
Cons: High administrative cost, harder to understand
Revenue Mechanism
Price Information
Behavior Change
Water Resource Management
Water Rate Structure Evolution
Flat Rate
Uniform Rate
Seasonal Rate
Inclining Tiered Rate
Excess Use Rate
Water Budget Rate

20
Stage Rates

Stage Rates Discussion
Stage Rates • Recovers the financial cost of an
emergency, such as a drought • Revenue generating mechanism • There is a nexus between the cost
of providing service and the associated rates
Drought Penalties • Utilizes price to enforce water
rationing • Non-revenue generating, strictly
punitive • A violation not based on cost of
service • Example: City of Santa Cruz
excessive water use penalties applied to residential accounts
› $25 per ccf above 10 units › $50 per ccf above 11 units
21

Stage Rates Options 1. Monthly Fixed Charge
› Example: $15 flat charge for 3/4 in. meter
2. Uniform Commodity Charge › Example: $0.70 per ccf
3. Uniform Percentage applied to each Tier/Class › Example: 20% increase applied to each tier
4. Inclining Commodity Charge › Example:
Tier 1 (0 to 10 ccf): no surcharge Tier 2 (10 to 50 ccf): $1.50 per ccf Tier 3 (> 50 ccf): $2.50 per ccf
22

Stage Rate Option 1: Monthly Fixed Charges
Advantages • Stable and guaranteed
recovery of lost revenue • Simple to understand and
administer
Disadvantages • Not tied to use of water
resources and does not provide incentive to reduce consumption
• Assessing the same charge to all customers does not target highest users
• Impacts affordability
23
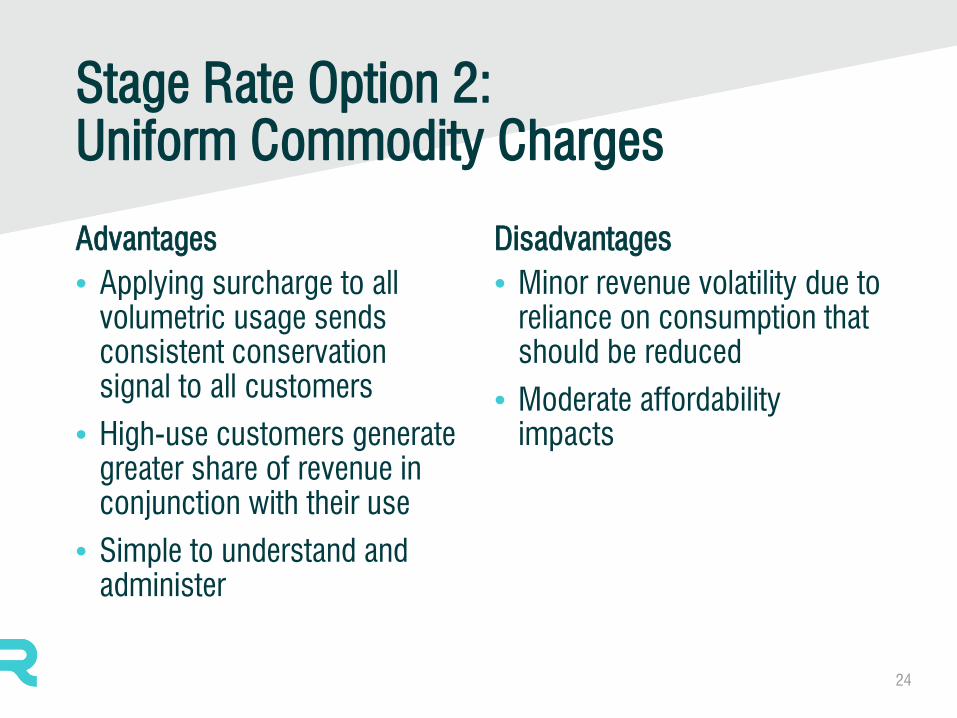
Stage Rate Option 2: Uniform Commodity Charges
Advantages • Applying surcharge to all
volumetric usage sends consistent conservation signal to all customers
• High-use customers generate greater share of revenue in conjunction with their use
• Simple to understand and administer
Disadvantages • Minor revenue volatility due to
reliance on consumption that should be reduced
• Moderate affordability impacts
24

Stage Rate Option 3: Uniform Percentage
Advantages • Targets high volume users • Customers have the ability to
control their bill • Minimal impact on
affordability
Disadvantages • Moderate revenue volatility
due to reliance on consumption in higher tiers
25

Stage Rate Option 4: Inclining Commodity Charges
Advantages • Targets high volume users • Customers have the ability to
control their bill • Minimal impact on
affordability
Disadvantages • Most revenue volatility due to
reliance on consumption in higher tiers
• Complex to understand/explain and administer
26

Objectives Monthly Fixed Charge
Uniform Commodity
Charge
Uniform Percentage
Inclining Commodity
Charge
Easy to understand and administer
Stability and guaranteed recovery of revenue
Ability to change the bill
Targeted use / conservation
Promotes affordability
Policy Overview of Stage Rates Options
27

28
Board Ranked Policy Objectives
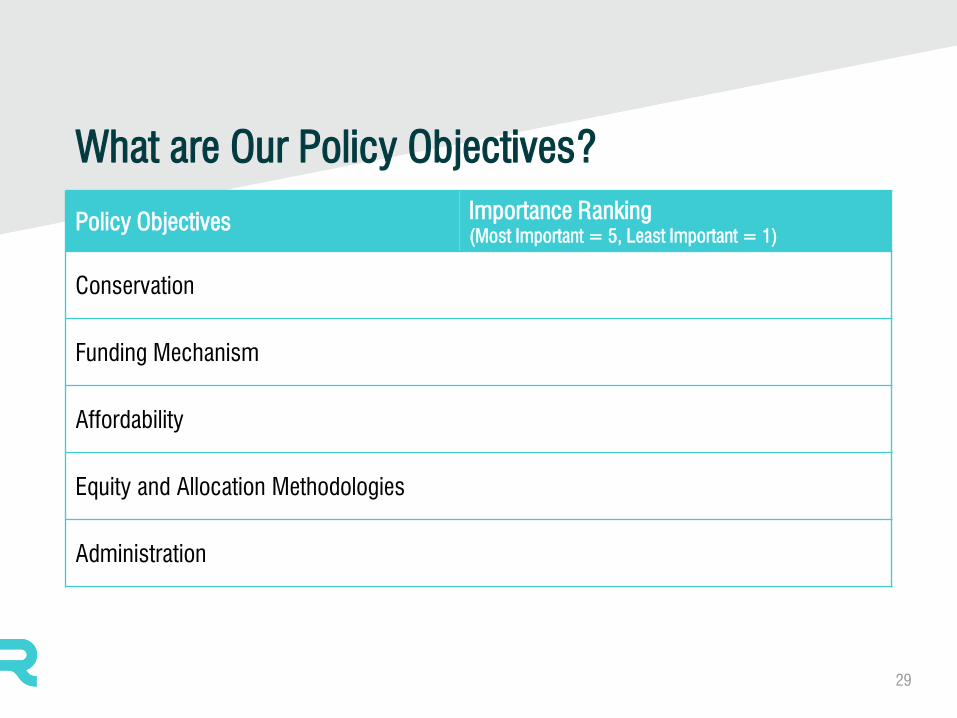
What are Our Policy Objectives? Policy Objectives Importance Ranking
(Most Important = 5, Least Important = 1)
Conservation
Funding Mechanism
Affordability
Equity and Allocation Methodologies
Administration
29
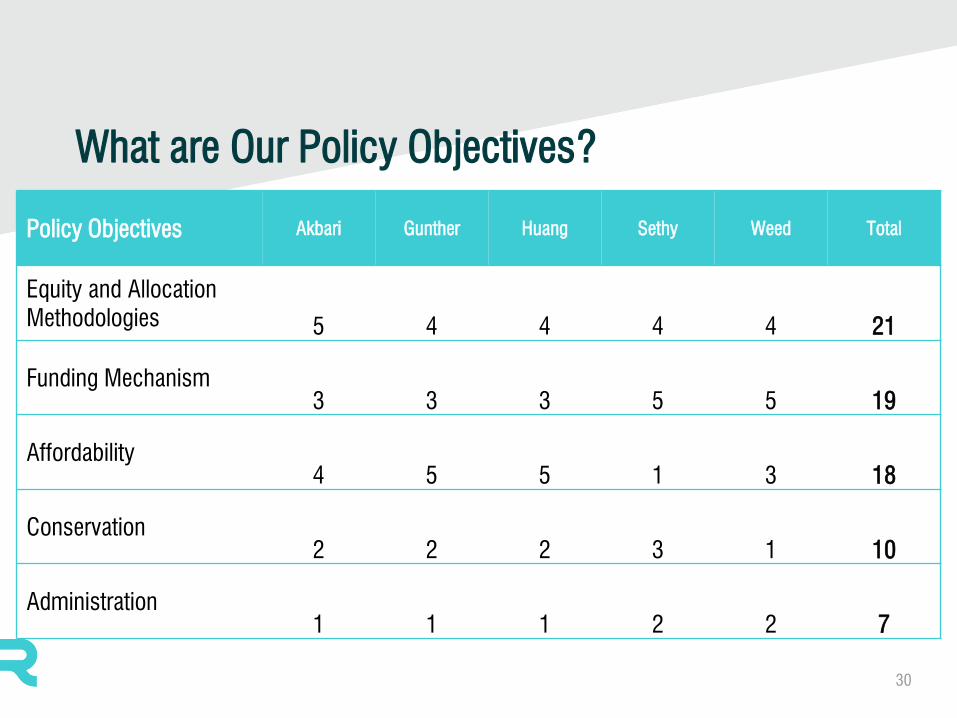
What are Our Policy Objectives?
30
Policy Objectives Akbari Gunther Huang Sethy Weed Total
Equity and Allocation Methodologies 5 4 4 4 4 21
Funding Mechanism 3 3 3 5 5 19
Affordability 4 5 5 1 3 18
Conservation 2 2 2 3 1 10
Administration 1 1 1 2 2 7

Conservation
• Reducing total annual demand
• Reducing water waste
• Reducing peak demand
• Reducing outdoor water usage
Funding Mechanism
• Enhancing revenue stability
• Ensuring financial sufficiency
• Providing funding mechanisms for alternative water supply, conservation program
Affordability
• Minimizing customer impacts
• Maintaining low average customer bills
• Crafting rates that provide affordable water for essential uses
Equity and Allocation
Methodologies
• Allocating water supply equitably
• Providing a drought management tool
• Allocating capital costs equitably
• Complying with government regulations and guidelines
Administration
• Allowing cost-effective administration
• Allowing easy implementation
• Enhancing customer understanding
Common Policy Objectives
From Water and Wastewater Finance and Pricing: The Changing Landscape, 4th Edition 31

Policy Objectives Akbari Gunther Huang Sethy Weed Total
Complying with government regulations and guidelines x x x x 4
Allocating water supply equitably x x x 3
Ensuring financial sufficiency x x x x 4
Enhancing revenue stability x x x 3
Crafting rates that provide affordable water for essential uses
x x x x 4
Board Pricing Objective
32
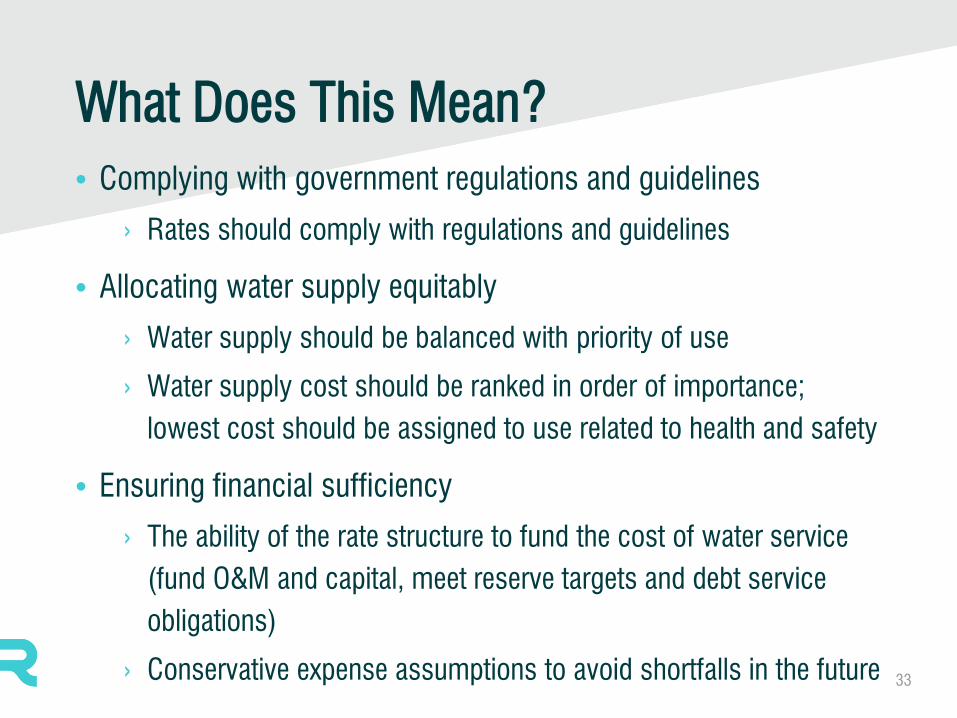
What Does This Mean? • Complying with government regulations and guidelines
› Rates should comply with regulations and guidelines
• Allocating water supply equitably › Water supply should be balanced with priority of use
› Water supply cost should be ranked in order of importance; lowest cost should be assigned to use related to health and safety
• Ensuring financial sufficiency › The ability of the rate structure to fund the cost of water service
(fund O&M and capital, meet reserve targets and debt service obligations)
› Conservative expense assumptions to avoid shortfalls in the future 33

What Does This Mean? • Enhancing revenue stability
› The ability to generate stable and predictable revenues from year to year
› Less volatile with water demand changes and price signals
• Crafting rates that provide affordable water for essential uses › Maintaining the price of water for essential use - i.e., that which is
used for health and safety - at the lowest cost possible while considering the needs of the utility, industry practice, and regulatory conditions
34

Policy Outcomes • Complying with government regulations and guidelines
› Conduct a comprehensive rate study • Allocating water supply equitably
› Examine unit cost of water and bundle similar expense • Ensuring financial sufficiency
› Evaluate the proper reserve level • Enhancing revenue stability
› Increase the “fixed” charge or › Adopt stage rates
• Crafting rates that provide affordable water for essential uses › Two tier rates, with tier 1 achieving this objective or › Lower the fixed charge
35

Policy Options • Enhancing revenue stability
› Increase the “fixed” charge or › Adopt stage rates
• Crafting rates that provide affordable water for essential uses
› Two tier rates, with tier 1 achieving this objective or › Lower the fixed charge
36
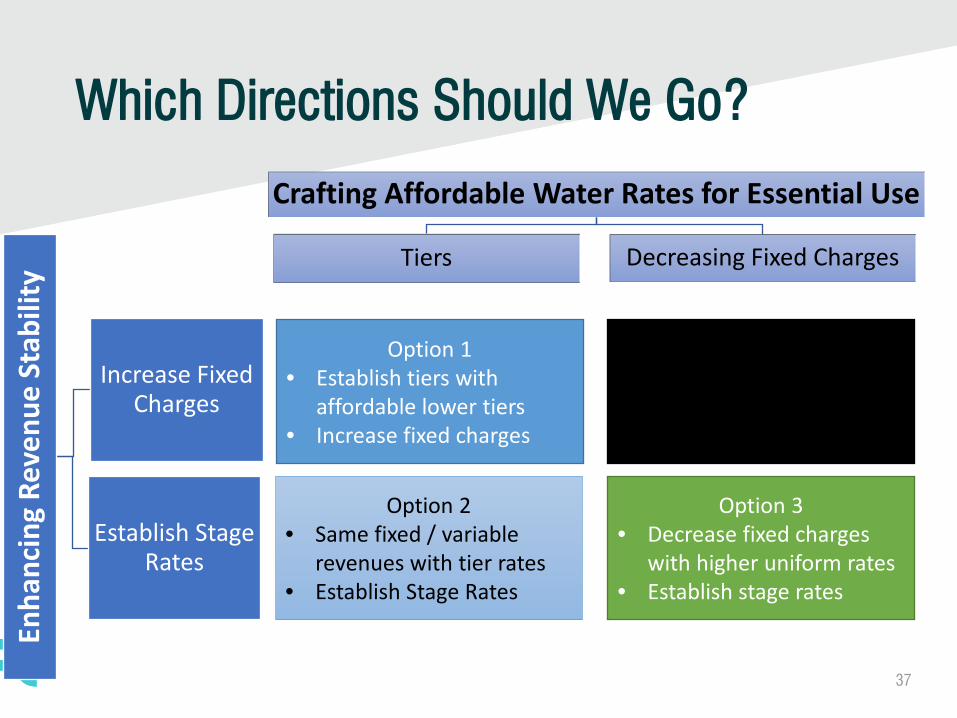
Which Directions Should We Go?
37
Enha
ncin
g Re
venu
e St
abili
ty
Increase Fixed Charges
Establish Stage Rates
Crafting Affordable Water Rates for Essential Use
Tiers Decreasing Fixed Charges
Option 1 • Establish tiers with
affordable lower tiers • Increase fixed charges
Option 2 • Same fixed / variable
revenues with tier rates • Establish Stage Rates
Option 3 • Decrease fixed charges
with higher uniform rates • Establish stage rates
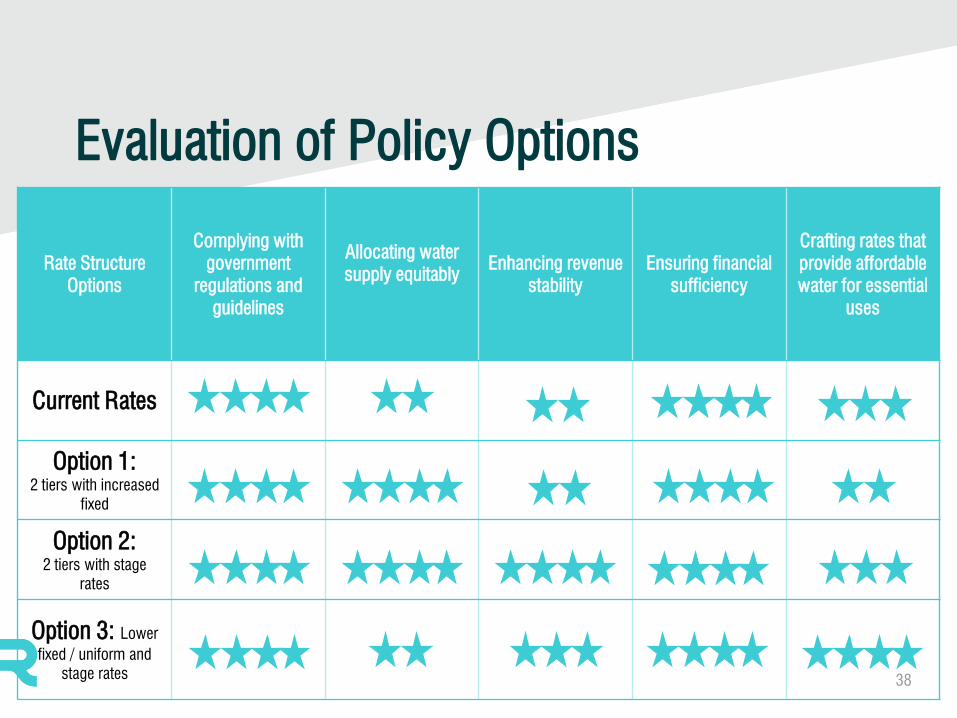
Evaluation of Policy Options
Rate Structure Options
Complying with government
regulations and guidelines
Allocating water supply equitably
Enhancing revenue stability
Ensuring financial sufficiency
Crafting rates that provide affordable water for essential
uses
Current Rates
Option 1: 2 tiers with increased
fixed
Option 2: 2 tiers with stage
rates
Option 3: Lower fixed / uniform and
stage rates 38

Evaluation of Policy Options
Rate Structure Options Allocating water supply
equitably
Enhancing revenue stability
Crafting rates that provide affordable water for
essential uses
Current Rates
Option 1: 2 tiers with increased fixed
Option 2: 2 tiers with stage rates
Option 3: Lower fixed / uniform and
stage rates
39

Defining Tier 1 for Affordability • Method 1: Based on Winter Average Use
› Proxy of indoor water use
• Method 2: Indoor Water Budget Framework › Calculate the indoor needs based on certain household size and
on gallons per capita per day
40

Tier 1 Definition Methods Winter Average (Prior year average usage Dec – Mar)
• Pros: › Simple to understand
• Cons: › Potential inclusion of
outdoor water usage during winter
› Potential volatility with dry / wet weather
Indoor Water Budget Household size x GPCD
• Pros: › Based on State efficiency
standard for indoor use › More stable with weather
change
• Cons: › Not tailored to individual
households
41

42
Alternative Rate Structure Options

Key Factors • Usage:
› CY 2015 usage patterns › 32.78 MGD projected sales
– Consistent with FY 2017 financial plan • Rates/Revenue:
› Current rates (effective March 2018) › Total revenue requirement from rates: $103 million
– Revenue collected for full fiscal year • Stage Rates:
› Uniform commodity charge › Stage rate analysis accounts for SWP supply cost savings resulting from
decreased sales › Assumes that reduction in use comes from higher water users
43

Alternative Rate Structures • Several alternative rate structure options were developed based on
feedback provided at the April 26, 2018 financial workshop • Alternative rates are for discussion purposes only. Final proposed
rates will vary based on Board guidance and completion of the cost of service study
• Each alternative is compared to current rates • Each alternative varies in how it approaches
› stage rates › revenue recovery between fixed and commodity charges › tiered rates
• Additional options can be developed
44

Alternative Rate Structures • Current Rate Structure:
› Uniform commodity rates › Revenue recovery: 34% fixed/ 66% variable
• Option 1: › Two tier SFR commodity rates* › Increased fixed charges: 37% fixed/ 63% variable
• Option 2: › Two tier SFR commodity rates* › No change to fixed charges › Stage rates
• Option 3: › Increased uniform commodity rates › Decreased fixed charges: 31% fixed/ 69% variable › Stage Rates
*The tier threshold for today’s discussion is set at 18 hundred cubic feet based on water use of 55 gallons per person per day for a four-person household
45

Option 1 Rate Structure • Two tier SFR commodity rates
› Affordable Tier 1 rate (offset by property tax; no conservation cost allocation)
› Tier definitions – Tier 1: 0-18 ccf (per bi-monthly billing period) – Tier 2: >18 ccf
• Increased fixed charges › Fixed/variable revenue: 37%/63% (current split is 34%/66%)
• No stage rates
46

Option 1 Rates
47
Bi-monthly Fixed Charges Current Rate Option 1 Rate $ Difference
5/8-inch $52.33 $56.97 $4.640 3/4-inch $52.33 $56.97 $4.640 1-inch $80.70 $87.85 $7.150
1 1/2-inch $151.59 $165.02 $13.430 2-inch $236.67 $257.63 $20.960 3-inch $506.08 $550.90 $44.820 4-inch $903.11 $983.07 $79.960 6-inch $2,278.54 $2,480.27 $201.730 8-inch $3,980.09 $4,332.48 $352.390
10-inch $5,965.22 $6,493.37 $528.150
Commodity Rates ($/ccf) Current Rate Option 1 Rate $ Difference
SFR Tier 1 $4.249 $3.900 -$0.349 SFR Tier 2 $4.249 $4.836 $0.587 Non-SFR $4.249 $4.055 -$0.194
Outside District $4.885 $4.691 -$0.194

Option 1 Usage Impacts
48

Option 1 Bill Impacts
49

Option 2 Rate Structure • Two tier SFR commodity rates
› Affordable Tier 1 rate (offset by property tax; no conservation cost allocation)
› Same tier definitions as Option 1 • No change to fixed charges • Stage rates: uniform ($/ccf) surcharge for each drought stage
(as defined in current UWMP) › Base Demand: No reduction in water availability/sales › Stage 1: 10% reduction › Stage 2: 20% reduction › Stage 3: 30% reduction › Stage 4: Up to 50% reduction
50
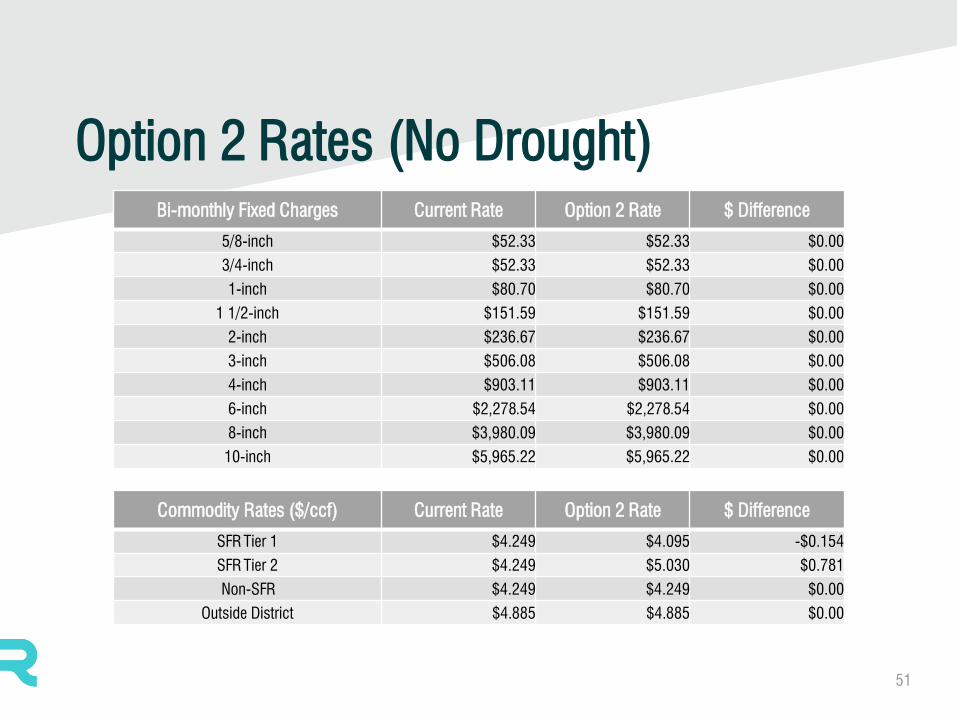
Option 2 Rates (No Drought)
51
Bi-monthly Fixed Charges Current Rate Option 2 Rate $ Difference
5/8-inch $52.33 $52.33 $0.00 3/4-inch $52.33 $52.33 $0.00 1-inch $80.70 $80.70 $0.00
1 1/2-inch $151.59 $151.59 $0.00 2-inch $236.67 $236.67 $0.00 3-inch $506.08 $506.08 $0.00 4-inch $903.11 $903.11 $0.00 6-inch $2,278.54 $2,278.54 $0.00 8-inch $3,980.09 $3,980.09 $0.00
10-inch $5,965.22 $5,965.22 $0.00
Commodity Rates ($/ccf) Current Rate Option 2 Rate $ Difference
SFR Tier 1 $4.249 $4.095 -$0.154 SFR Tier 2 $4.249 $5.030 $0.781 Non-SFR $4.249 $4.249 $0.00
Outside District $4.885 $4.885 $0.00

Option 2 Usage Impacts
52

Option 2 Bill Impacts
53

Option 2 Stage Rates
54
Description Base Demand Stage 1 Stage 2 Stage 3 Stage 4
Reduction in Water Availability 0% 10% 20% 30% Up to 50%
Unit Surcharge ($/ccf) $0.000 $0.496 $1.097 $1.830 $4.166
Commodity Rates by Stage ($/ccf)
SFR Tier 1 $4.095 $4.591 $5.192 $5.925 $8.261
SFR Tier 2 $5.030 $5.526 $6.127 $6.860 $9.196
Non-SFR $4.249 $4.745 $5.346 $6.079 $8.415
Outside District $4.885 $5.381 $5.982 $6.715 $9.051

Option 2 Bill Impacts: Average SFR Customer during Stage 2 Drought
55
Option 3 Rate Structure • Increased uniform commodity rates • Decreased fixed charges
› Fixed/variable revenue: 31%/69% (current split is 34%/66%)
• Stage rates: uniform ($/ccf) surcharge for each drought stage › Same methodology as used in Option 2
56

Option 3 Rates (No Drought)
57
Bi-monthly Fixed Charges Current Rate Option 3 Rate $ Difference
5/8-inch $52.33 $47.73 -$4.600
3/4-inch $52.33 $47.73 -$4.600
1-inch $80.70 $73.60 -$7.100
1 1/2-inch $151.59 $138.26 -$13.330
2-inch $236.67 $215.85 -$20.820
3-inch $506.08 $461.56 -$44.520
4-inch $903.11 $823.66 -$79.450
6-inch $2,278.54 $2,078.07 -$200.470
8-inch $3,980.09 $3,629.91 -$350.180
10-inch $5,965.22 $5,440.39 -$524.830
Commodity Rates ($/ccf) Current Rate Option 3 Rate $ Difference
Inside District $4.249 $4.442 $0.193
Outside District $4.885 $5.078 $0.193
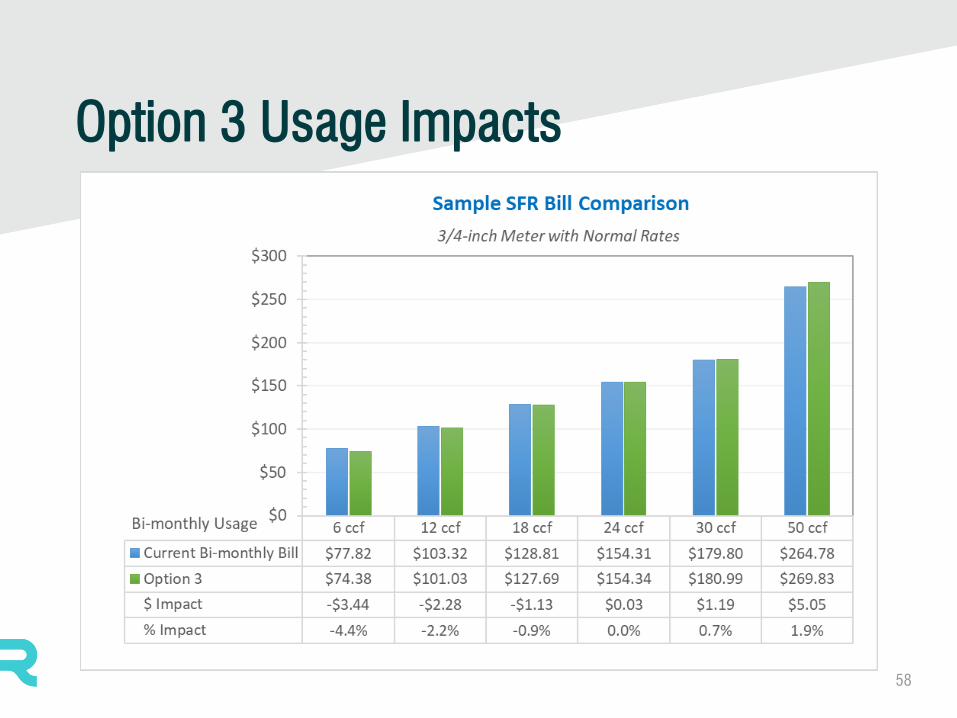
Option 3 Usage Impacts
58

Option 3 Bill Impacts
59

Option 3 Stage Rates
60
Description Base Demand Stage 1 Stage 2 Stage 3 Stage 4
Reduction in Water Availability 0% 10% 20% 30% Up to 50%
Unit Surcharge ($/ccf) $0.000 $0.478 $1.075 $1.842 $4.288
Commodity Rates by Stage ($/ccf)
Inside District $4.442 $4.920 $5.517 $6.284 $8.730
Outside District $5.078 $5.556 $6.153 $6.920 $9.366

Option 3 Bill Impacts: Average SFR Customer during Stage 2 Drought
61

SFR Bill Comparison (No Drought)
62

Comparison of Water Rate Structures • Differences between the presented options are relatively minor
except at very large levels of consumption › Implementing tiered rates will affect large residential water
consumers
• Options for further evaluation could include: › More or less significant adjustments to the ratio between meter
charge revenue and commodity charge revenue › More or less pronounced distinction between the two tiers for
residential customers › Alternative approaches to stage rates
63

Enhancing Financial Stability
64
% of Revenue Requirement Recovered by Rates
Drought Stage Current Rates Option 1 Option 2 Option 3
Base Demand 100% 100% 100% 100%
Stage 1 (10% Reduction) 94% 93% 100% 100%
Stage 2 (20% Reduction) 87% 87% 100% 100%
Stage 3 (30% Reduction) 81% 81% 100% 100%
Stage 4 (Up to 50% Reduction) 68% 69% 100% 100%

Staff Recommendation • Staff recommends including stage rates in the final approved
rate structure to enhance revenue stability during times of drought
• Provide feedback on preferred rate structure options and either 1) direct staff to analyze additional options for further Board deliberation, or 2) direct staff to develop final options for Board consideration
65
66
Next Steps

Key Upcoming Dates (FY 2018/19) • August 15: Review financial planning scenarios • September 27: Water Rates and Development Charges follow up • December 6: Water Rates and Development Charges; set public
hearings • Mid- to late December: Send formal notice of proposed rates • February 14: Rate and Fee adoption • March 1: Rates are effective (development fees effective May 1) • Additional public meetings and outreach typically occur in
advance of the rate adoption meeting. The District might consider more extensive outreach if there are significant rate structure changes
67
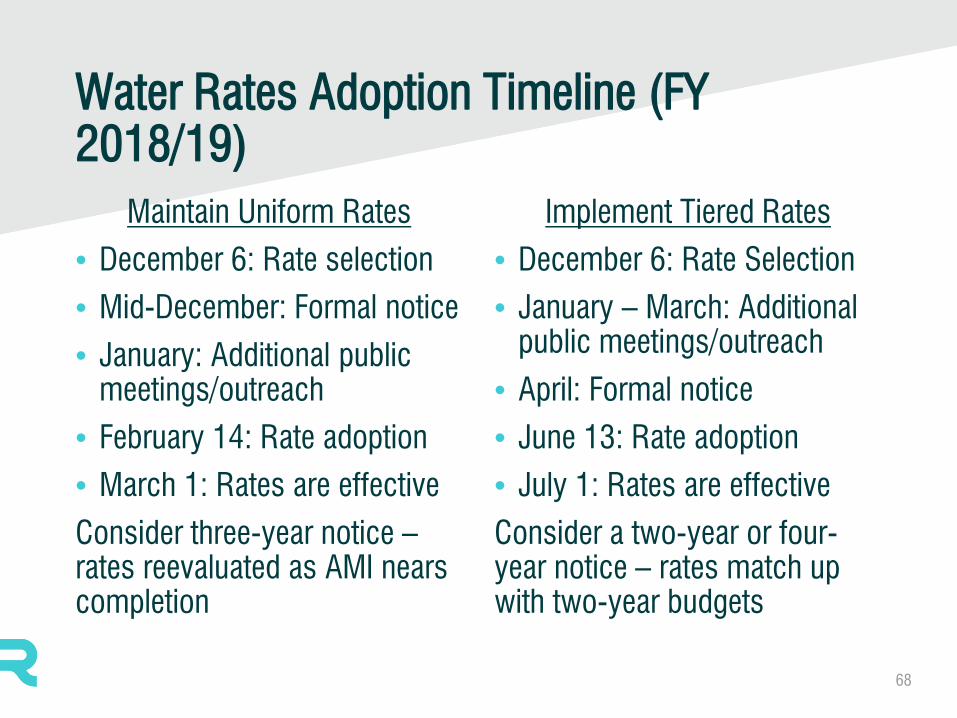
Water Rates Adoption Timeline (FY 2018/19)
Maintain Uniform Rates • December 6: Rate selection • Mid-December: Formal notice • January: Additional public
meetings/outreach • February 14: Rate adoption • March 1: Rates are effective Consider three-year notice – rates reevaluated as AMI nears completion
Implement Tiered Rates • December 6: Rate Selection • January – March: Additional
public meetings/outreach • April: Formal notice • June 13: Rate adoption • July 1: Rates are effective Consider a two-year or four-year notice – rates match up with two-year budgets
68


