T cells in multiple myeloma display featuresof exhaustion and senescence at the tumorsiteClaudia Zelle-Rieser1, Shanmugapriya Thangavadivel1, Rainer Biedermann2, Andrea Brunner3, Patrizia Stoitzner4,Ella Willenbacher5, Richard Greil1,6,7 and Karin Jöhrer1*
Abstract
Background: Multiple myeloma is an incurable plasma cell malignancy that is mostly restricted to the bonemarrow. Cancer-induced dysfunction of cytotoxic T cells at the tumor site may be responsible for immune evasionand therapeutical failure of immunotherapies. Therefore, enhanced knowledge about the actual status of T cells inmyeloma bone marrow is urgently needed. Here, we assessed the expression of inhibitory molecules PD-1, CTLA-4,2B4, CD160, senescence marker CD57, and CD28 on T cells of naive and treated myeloma patients in the bonemarrow and peripheral blood and collected data on T cell subset distribution in both compartments. In addition, Tcell function concerning proliferation and expression of T-bet, IL-2, IFNγ, and CD107a was investigated after in vitrostimulation by CD3/CD28. Finally, data was compared to healthy, age-matched donor T cells from bothcompartments.
Methods: Multicolor flow cytometry was utilized for the analyses of surface molecules, intracellular staining ofcytokines was also performed by flow cytometry, and proliferation was assessed by 3H-thymidine incorporation.Statistical analyses were performed utilizing unpaired T test and Mann-Whitney U test.
Results: We observed enhanced T cell exhaustion and senescence especially at the tumor site. CD8+ T cellsexpressed several molecules associated with T cell exhaustion (PD-1, CTLA-4, 2B4, CD160) and T cell senescence(CD57, lack of CD28). This phenotype was associated with lower proliferative capacity and impaired function.Despite a high expression of the transcription factor T-bet, CD8+ T cells from the tumor site failed to produce IFNγafter CD3/CD28 in vitro restimulation and displayed a reduced ability to degranulate in response to T cell stimuli.Notably, the percentage of senescent CD57+CD28− CD8+ T cells was significantly lower in treated myelomapatients when compared to untreated patients.
Conclusions: T cells from the bone marrow of myeloma patients were more severely impaired than peripheral Tcells. While our data suggest that terminally differentiated cells are preferentially deleted by therapy, immune-checkpoint molecules were still present on T cells supporting the potential of checkpoint inhibitors to reactivate Tcells in myeloma patients in combination therapies. However, additional avenues to restore anti-myeloma T cellresponses are urgently needed.
Keywords: Multiple myeloma, Immune-checkpoint molecules, T cell exhaustion, T cell senescence, Bone marrow
* Correspondence: [email protected] Cancer Research Institute, Innrain 66, 6020 Innsbruck, AustriaFull list of author information is available at the end of the article
BackgroundTreatment of cancer aims at the deletion of all malig-nant cells. Besides minimizing the bulk of tumor cells byconventional therapy, the cytotoxic ability of activated Tcells is central to tumor eradication and cancer cure. Tcell anergy, exhaustion, and/or senescence are character-ized by elevated levels of multiple inhibitory molecules,impaired effector cytokine production, loss of proliferativecapacity, impaired cytotoxicity, and altered use of keytranscription factors including T-bet (reviewed in [1–3]).T cell exhaustion occurs after chronic antigenic exposureand prevents optimal control of tumors. Modulation ofmolecules and pathways overexpressed in the exhaustionphase could reverse this dysfunctional state and reinvigor-ate immune response [4, 5]. Senescent T cells are late dif-ferentiated memory/effector T cells which lack CD28 andgain CD57 and regulatory receptor expression. Theyrather express CD45RA than CD45RO, are in cell-cyclearrest, and have enhanced secretion of inflammatory cyto-kines [6]. Most studied inhibitory molecules which func-tion as negative regulators of lymphocyte activation arePD-1 (CD279) and CTLA-4 (CD152). Natural killer cellreceptor 2B4 (CD244), glycoprotein CD160, TIM3, Lag3,and many others have also been shown to contribute es-sentially to the regulation of T cell activity [2, 7]. Blockingimmune checkpoint molecules achieved promising resultsin the treatment of solid cancers; however, targeting thesemolecules in hematologic malignancies is relatively under-studied [8–10]. First promising results with an anti-PD-1antibody in the treatment of refractory Hodgkin’s lymph-oma were recently published [11–13], and studies areunder way to investigate the effectiveness of combinationswith low-dose glucocorticoids. Recently, data on immunecheckpoints such as PD-1 expression of myeloma patientshave been published. In addition, the potential of PD-1blocking antibodies to reactivate diseased T cells were in-vestigated in vitro and proved this molecule as promisingcandidate for immunotherapy [14–16]. In vivo, however,these PD-1 inhibitors appear to work only in combinationwith immunomodulatory drugs in myeloma patients, andfirst positive results have been presented at the ASH 2015meeting by J. San Miguel and A.Z. Badros.Multiple myeloma is a hematologic cancer characterized
by the accumulation of malignant plasma cells within thebone marrow. Despite the advances in therapy by the intro-duction of novel immunomodulatory agents and prote-asome inhibitors, this cancer remains largely incurable. Theimmunogenic nature of multiple myeloma is underlined bythe observation of disease remission after allogeneic stemcell transplantation or donor lymphocyte infusion, possiblycaused by graft-versus-myeloma effects [17, 18]. Delineatingthe tumor-driven defects of the immune system in mye-loma in more depth will contribute to the development ofnovel immuno-therapeutical strategies.
Defects in T cell distribution and function have beenconsistently documented in this disease, including a re-duction of peripheral blood CD4 and CD8 T cells, inver-sion of the CD4/CD8 ratio, abnormal Th1/Th2 ratio,downregulation of signal transduction components, andabnormal T cell responses [19–22]. Intriguingly, the ma-jority of studies so far focused on immunological alter-ations in the peripheral blood of myeloma patientsdespite the fact that myeloma cells almost exclusivelygrow and spread within the bone marrow. So far, little isknown regarding the composition and activity of the im-mune system in myeloma bone marrow. In this study,we investigated the expression of inhibitory moleculeson effector T cells as well as their function in responseto in vitro stimulation by antibodies against CD3/CD28.We studied both T cells from peripheral blood and fromthe bone marrow of myeloma patients and healthy, age-matched donors in order to elucidate systemic and localtumor-mediated alterations.We demonstrate that, especially at the tumor site, both
T cell exhaustion and T cell senescence might play animportant role in supporting tumor growth. Moreover,we show data on the T cell composition in refractory pa-tients and how therapy might change T cell suppressivemolecules.
MethodsSample collectionBlood samples and bone marrow aspirates from the pos-terior iliac crest from the same patient were obtainedfrom 16 newly diagnosed patients (MM naive) and 6 pa-tients treated with immunomodulatory drugs and dexa-methasone (MM Tx) at the Department of InternalMedicine, University Hospital of Innsbruck, Austria.Peripheral blood samples and bone marrow aspiratesfrom the proximal femur of the same individuals weretaken from age-matched healthy donors in the course ofhip arthroplasty at the Department of Orthopedic Sur-gery, University Hospital of Innsbruck (n = 12). Accord-ing to a recent publication, T cell subset distribution iscomparable between samples from the posterior iliaccrest and proximal femur [23]. Healthy subjects werescreened for the presence of viral infections and anybone marrow abnormalities and did not receive immu-nomodulatory drugs or suffer from diseases known toinfluence the immune system, including autoimmunediseases or cancer.
Cell isolation from human PB and BM aspiratesPeripheral blood mononuclear cells (PBMC) and bonemarrow mononuclear cells (BMMC) were separated bydensity gradient centrifugation (GE Healthcare Life Sci-ences) and either used immediately (for flow cytometric
Zelle-Rieser et al. Journal of Hematology & Oncology (2016) 9:116 Page 2 of 12
analyses) or cryopreserved for later functional analysis.Recovery rates from frozen T cells were above 85 %.
Immunofluorescence staining and flow cytometricanalysisStaining of surface antigens was performed in erythrocyte-free samples (blood samples and bone marrow aspirates)by multicolour staining using fluorescently labeled CD3(clone UCHT1), CD4 (RPA-T4), CD8 (RPA-T8), CD28(CD28.2), CD45 (2D1), CD45RA (HI100), CD57 (NK-1),CD62L (DREG-56), CD152/CTLA-4 (BNI3), CD160(BY55), CD244/2B4 (2-69), CD279/PD1 (MI-H4) (all fromBD, Heidelberg, Germany). For staining of intracellularproteins, PBMC and BMMC were stimulated with anti-CD3 (2 μg/ml) and anti-CD28 (5 μg/ml) (both fromeBioscience/Affymetrix) for 6 or 24 h. Ten microgramsper milliliter Brefeldin A (Sigma-Aldrich) were added tothe cell cultures for the last 4 h of incubation. Intracellularstaining was carried out using CytoFix/CytoPerm kit, ac-cording to manufacturer’s instructions (BD). All antibodiesagainst cytokines (IL-2, clone 5344.111; IFNγ, B27), T-bet(O4-46), and CD107a (H4A3) were purchased from BD.Flow cytometry was performed on a BD FACS Canto IIflow cytometer with subsequent analysis using FACSDIVA Software 7.0. The analysis was performed after gat-ing on single viable cells after 7-AAD staining.
T cell proliferation and degranulationCell proliferation was measured by culturing BMMC ata density of 2 × 10⁶/ml in RPMI1640/10 % FCS togetherwith anti-CD3 (2 μg/ml) and anti-CD28 (5 μg/ml) anti-bodies. 3H-thymidine (Hartmann Analytic) was addedfor the last 16 h of stimulation, cells were harvested, and3H-thymidine incorporation was measured on a ß-coun-ter (Beckman Coulter, USA). The proliferation index wascalculated as ratio of stimulated T cells and unstimulatedcontrols. For assessment of degranulation, cells werestimulated with anti-CD3 and anti-CD28 as above withthe addition of 10 μg/ml anti-CD107a antibody for 6 hat 37 °C. For assessment of CD8+ T cell activation/pro-liferation, 5 × 10⁶ cells/ml (BMMC) were washed andstained with 0.4 μM carboxyfluorescein succinimidylester (CFSE; eBioscience/Affymetrix) for 5 min at roomtemperature in the dark. After quenching with FCS andwashing with RPMI1640 and once with PBS, the cellswere diluted at 2 × 10⁶/ml in RPMI1640/10 % FCS andstimulated with anti-CD3 and anti-CD28 antibodies for72 h as described above.
Statistical analysisFor all data sets which could be accurately modeled by aGaussian distribution an unpaired t test was used for ana-lysis of differences between groups; otherwise, the Mann-Whitney U test was used. P values of less than 0.05 were
considered statistically significant (significance levels*p < 0.05, **p < 0.01, ***p < 0.001, n.s. not significant).
ResultsIncreased expression of PD-1, CTLA-4, CD160, and 2B4 onCD8+ T cells from the bone marrow of myeloma patientsWe assessed expression of inhibitory molecules on Tcells from the bone marrow (BM) and peripheral blood(PB) of myeloma patients and healthy, age-matched indi-viduals by multicolour flow cytometry. Patients’ charac-teristics are summarized in Table 1.In brief, both, CD3+CD4+ as well as CD3+CD8+ T
cells exhibited enhanced expression of PD-1 in PB aswell as BM of myeloma patients. This is in accordancewith recently published data [15, 24]. We could alsoconfirm enhanced expression of CTLA-4 [25], and wefound it to be restricted to bone marrow T cells of mye-loma patients. In general, the higher the numbers of in-hibitory receptors which are present, the more severe Tcells are exhausted. Therefore, we analyzed the expres-sion of two additional inhibitory molecules which aresuggested to play a role in T cell regulation, i.e., CD160and 2B4. CD160 competes with BTLA for binding to
Table 1 Donor characteristics
Chemo-naivepatients
Treatedpatients
Healthycontrols
Number Total 16 6 12
Age Median 70 65 59
Range 67–76 62–74 55–70
Sex Male 8 3 7
Female 8 3 5
International stagingsystem
I 5 1
II 6 1
III 5 2
Unknown 0 2
Durie-Salmon stagingsystem
I 0 2
IIA 2 1
IIIA 10 2
IIIB 3 0
Unknown 1 1
Immunoglobulinsubtypes
IgG 8 4
IgA 5 1
Lightchains
2 0
Unknown 1 1
Immunoglobulin lightchains
κ 11 4
λ 4 1
Unknown 1 1
The patients were classified according to the International Myeloma WorkingGroup (IMWG) criteria
Zelle-Rieser et al. Journal of Hematology & Oncology (2016) 9:116 Page 3 of 12
herpes virus entry mediator (HVEM) and has beenshown to negatively regulate TCR-mediated signaling[26]. Crosslinking of 2B4 on T cells decreases prolifera-tion, and 2B4 expression is upregulated on exhausted Tcells [27, 28]. In our analyses both, CD160 and 2B4,were significantly upregulated on bone marrow T cells ofmyeloma patients suggesting that the extent of local im-mune suppression might be even higher than estimatedfrom the previous investigations. The percentages of Tcells expressing the respective molecules are depicted inTable 2.
T cell subsets are altered in myeloma bone marrowPD-1 expression on T cells has recently been describedas novel therapeutical target in myeloma disease [15]. Ingeneral, high levels of PD-1 expression are found on ef-fector memory T cells [29]. In depth analyses of T cellsubset distributions in myeloma are largely missing sofar which prompted us to further analyze patients’ Tcells according to CD45RA and CD62L levels. Concomi-tantly, we analyzed PD-1 levels on the different T cellsubsets.Whereas percentage of CD4+ subsets did not vary signifi-
cantly between healthy and diseased peripheral blood andbone marrow compartments, CD8+ subset distribution wasstrikingly altered. Briefly, we found a significant accumula-tion of effector T cells (Temra; CD45RA+CD62L−) and aneven more pronounced decrease of effector memory T cells(Tem; CD45RA−CD62L−) within the CD8+ T cell poolin the myeloma bone marrow (Table 3, Fig. 1a, b). Atrend for the increase of Temra cells as a consequenceof aging has been described [30], and we found it to befurther enhanced in myeloma patients. In addition, we
found that PD-1 expression was significantly increasedin all T cell subsets (Fig. 1c).
Bone marrow CD8+ T cells of myeloma patients showfunctional defectsIn the next set of experiments, we assessed the ability ofBM CD8+ T cells to proliferate in response to T cellstimulation by anti-CD3 and anti-CD28 antibodies. Pro-liferation of CD8+ T cells from myeloma patients wassignificantly lower compared to healthy controls (Fig. 2a).To further investigate the involved mechanisms, wecompared expression of various molecules in the abovesetting. First, we analyzed the transcription factor T-betwhich plays a crucial role in T cell development, regu-lates effector function, and is essential for the inductionof IFNγ [31]. Significantly more T-bet+ CD8+ T cellswere detected in BM samples of myeloma patients.However, upon stimulation, healthy donor T cells upreg-ulated T-bet whereas expression in myeloma T cellsremained the same (Fig. 2b). The high constitutive ex-pression of T-bet is consistent with a skewing towardsCD8+ effector cell subsets as shown above. Physiologic-ally, high T-bet expression goes along with enhancedcytokine production [32]. According to T-bet expression,the percentage of IFNγ-expressing cells was higher inunstimulated samples of myeloma patients compared tohealthy donors. However, upon activation, expressionwas significantly downregulated in myeloma T cellswhereas it was upregulated in healthy controls (Fig. 2c).This finding points to an activated but exhausted CD8+T cell population in diseased BM. Interestingly, furtherin depth analyses of T-bet and IFNγ expression in T cellsubsets revealed a significant decrease in the CD45RA+
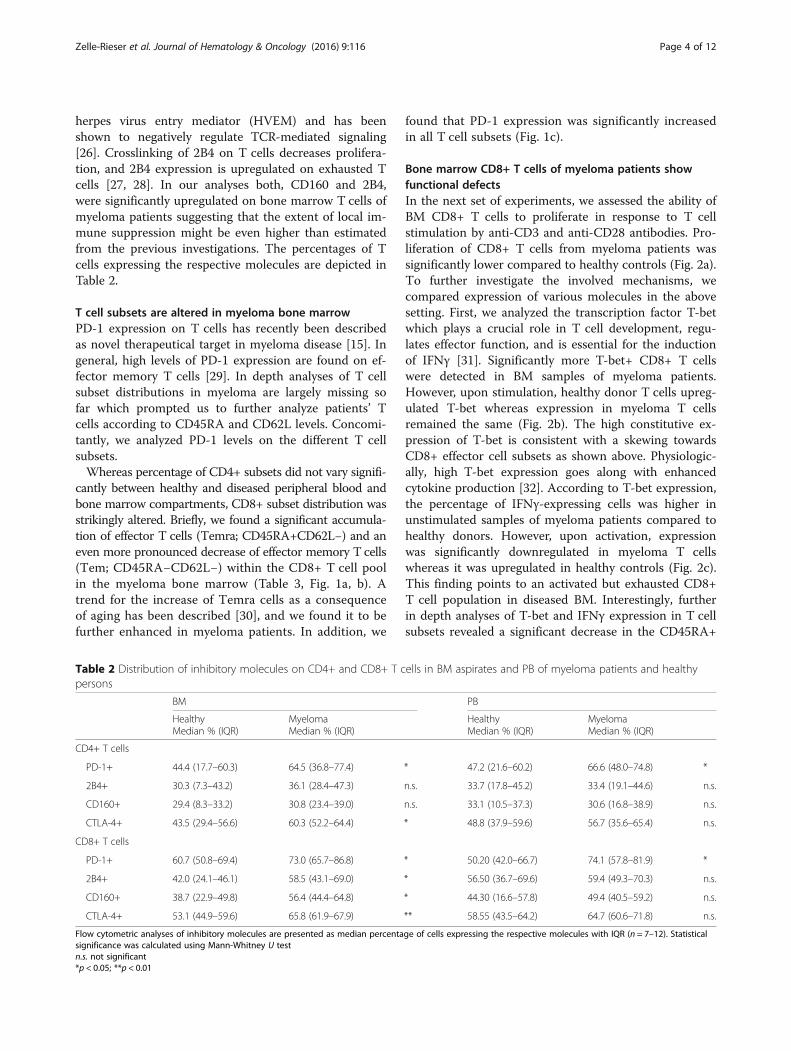
Table 2 Distribution of inhibitory molecules on CD4+ and CD8+ T cells in BM aspirates and PB of myeloma patients and healthypersons
Flow cytometric analyses of inhibitory molecules are presented as median percentage of cells expressing the respective molecules with IQR (n = 7–12). Statisticalsignificance was calculated using Mann-Whitney U testn.s. not significant*p < 0.05; **p < 0.01
Zelle-Rieser et al. Journal of Hematology & Oncology (2016) 9:116 Page 4 of 12
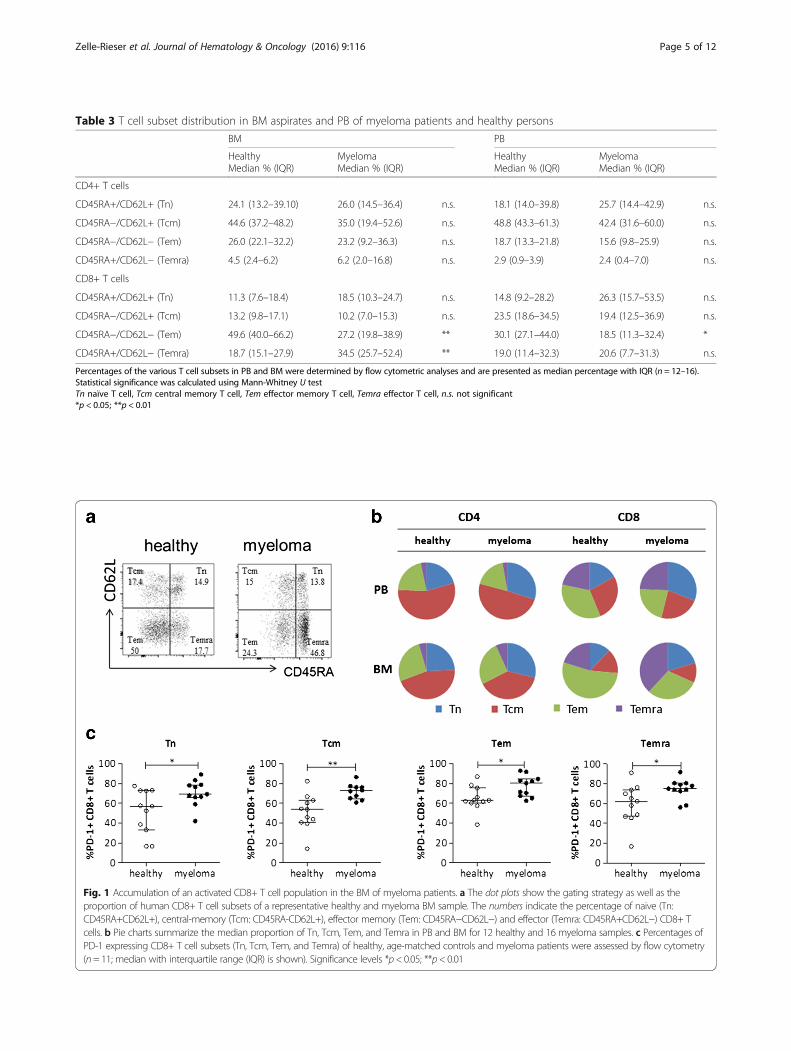
Table 3 T cell subset distribution in BM aspirates and PB of myeloma patients and healthy persons
Percentages of the various T cell subsets in PB and BM were determined by flow cytometric analyses and are presented as median percentage with IQR (n = 12–16).Statistical significance was calculated using Mann-Whitney U testTn naïve T cell, Tcm central memory T cell, Tem effector memory T cell, Temra effector T cell, n.s. not significant*p < 0.05; **p < 0.01
Fig. 1 Accumulation of an activated CD8+ T cell population in the BM of myeloma patients. a The dot plots show the gating strategy as well as theproportion of human CD8+ T cell subsets of a representative healthy and myeloma BM sample. The numbers indicate the percentage of naive (Tn:CD45RA+CD62L+), central-memory (Tcm: CD45RA-CD62L+), effector memory (Tem: CD45RA−CD62L−) and effector (Temra: CD45RA+CD62L−) CD8+ Tcells. b Pie charts summarize the median proportion of Tn, Tcm, Tem, and Temra in PB and BM for 12 healthy and 16 myeloma samples. c Percentages ofPD-1 expressing CD8+ T cell subsets (Tn, Tcm, Tem, and Temra) of healthy, age-matched controls and myeloma patients were assessed by flow cytometry(n= 11; median with interquartile range (IQR) is shown). Significance levels *p< 0.05; **p< 0.01
Zelle-Rieser et al. Journal of Hematology & Oncology (2016) 9:116 Page 5 of 12
CD8+ T cell compartment (Tn and Temra) of myelomapatients, whereas expression in CD45RA− CD8+ T cells(Tcm and Tem) was similar in healthy and myelomapeople (Fig. 2d). Taking into account that effector T cells(Temra) represent about 60 % of the T cell CD45RA+compartment in myeloma patients, we suggest that ef-fector cell function is markedly impaired.Cytotoxic T cell function also relies on their functional
degranulation capacity. CD107a (LAMP1) has been de-scribed as a marker of cytotoxic CD8+ T cell degranula-tion and is strongly upregulated on the cell surface of thisT cell type upon stimulation [33]. Interestingly, myelomaCD8+ T cells displayed high constitutive CD107a expres-sion. Upon stimulation, healthy BM CD8+ T cells wereable to mobilize intracellular CD107a to the membranewhereas degranulation of myeloma CD8+ T cells wasimpaired (Fig. 2e). These data also support a decreased
cytotoxic activity of CD8+ T cells in multiple myeloma.Together, the impaired proliferative and cytotoxic capacityof T cells in BM of myeloma patients in response to acti-vation suggests T cell exhaustion.
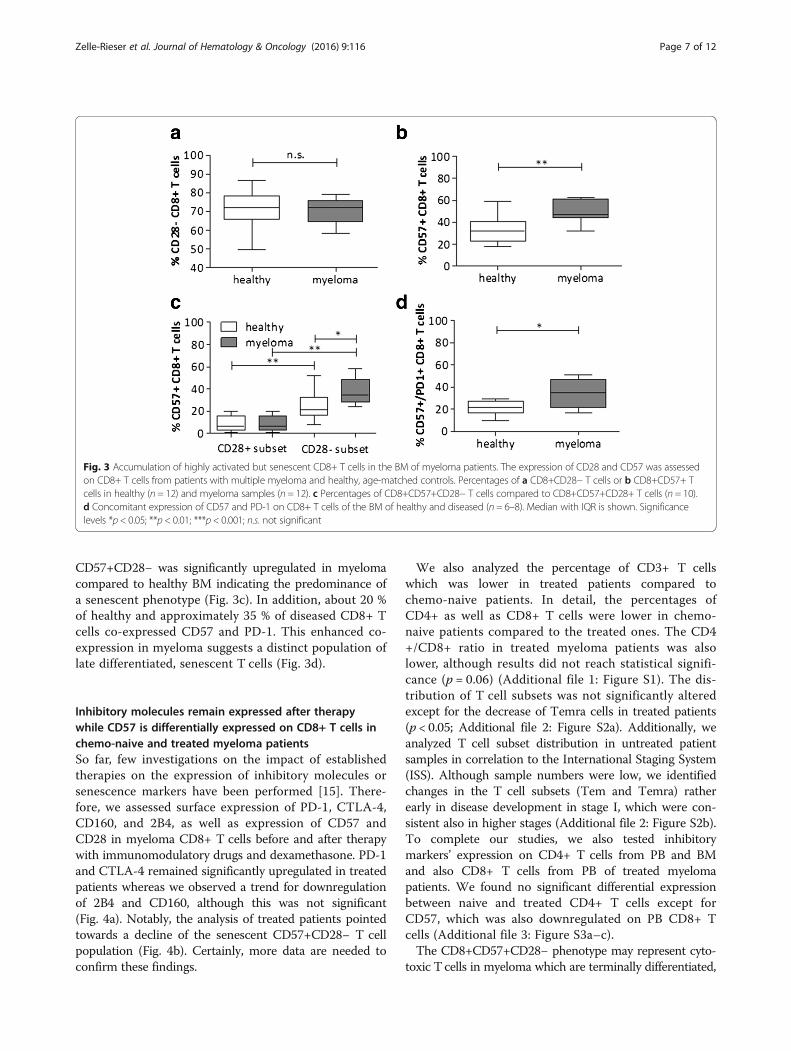
Accumulation of a senescent T cell population inmyeloma bone marrowUnder persistent antigenic stimulation, CD28 expressionis progressively and irreversibly downregulated, whereasthe expression of CD57 increases, characterizing a state ofreplicative senescence [34]. Since high numbers of senes-cent cells might additionally blunt immunotherapies, weanalyzed the extent of CD28 and CD57 expression in BMT cells [35]. In both healthy and diseased samples, most Tcells lacked CD28 expression (Fig. 3a) whereas CD57 ex-pression was significantly increased in myeloma bonemarrow T cells (Fig. 3b). Specifically, the total amount of
Fig. 2 CD8+ T cells of myeloma patients show functional defects in proliferation and cytotoxicity. a Proliferation was assessed by 3H-thymidineincorporation after stimulating the cells for 72 h with anti-CD3/anti-CD28 antibodies. The proliferative index (3H-thymidine incorporation of stimulated Tcells divided by 3H incorporation of unstimulated cells) is shown for BM CD8+ T cells from myeloma patients (n= 12) and from healthy controls (n= 6).b T-bet and c IFNγ expression was assessed by intracytoplasmic staining of total CD8+ BMMCs before (0 h) and after stimulation (24 h) of the cells (n= 7;median with IQR is shown). d T-bet and IFNγ expression on different T cell subtypes (CD8+ CD45RA+ or CD45RA−) was assessed by intracytoplasmicstaining before (0 h) and after (24 h) stimulation with CD3/CD28 antibodies (n= 7; mean ± SEM is shown). e Surface levels of CD107a were detected byflow cytometry before (0 h) and after stimulation (24 h) (n= 3; median with IQR is shown). Significance levels: *p < 0.05; **p< 0.01; n.s. not significant
Zelle-Rieser et al. Journal of Hematology & Oncology (2016) 9:116 Page 6 of 12
CD57+CD28− was significantly upregulated in myelomacompared to healthy BM indicating the predominance ofa senescent phenotype (Fig. 3c). In addition, about 20 %of healthy and approximately 35 % of diseased CD8+ Tcells co-expressed CD57 and PD-1. This enhanced co-expression in myeloma suggests a distinct population oflate differentiated, senescent T cells (Fig. 3d).
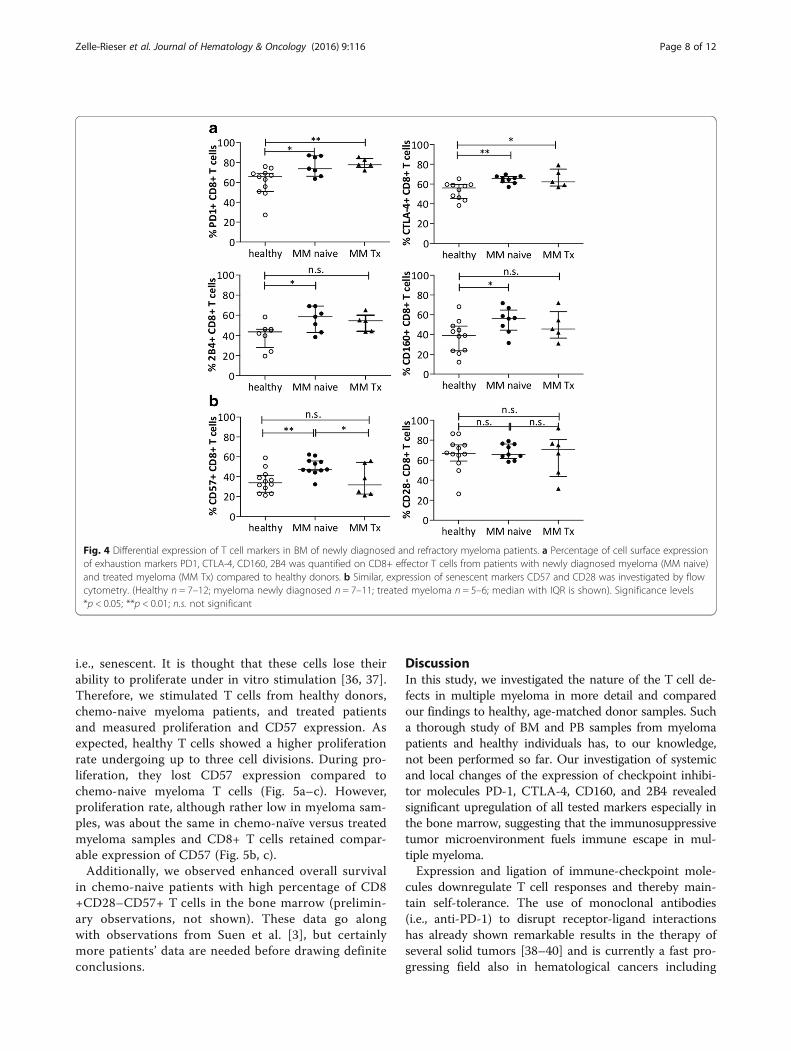
Inhibitory molecules remain expressed after therapywhile CD57 is differentially expressed on CD8+ T cells inchemo-naive and treated myeloma patientsSo far, few investigations on the impact of establishedtherapies on the expression of inhibitory molecules orsenescence markers have been performed [15]. There-fore, we assessed surface expression of PD-1, CTLA-4,CD160, and 2B4, as well as expression of CD57 andCD28 in myeloma CD8+ T cells before and after therapywith immunomodulatory drugs and dexamethasone. PD-1and CTLA-4 remained significantly upregulated in treatedpatients whereas we observed a trend for downregulationof 2B4 and CD160, although this was not significant(Fig. 4a). Notably, the analysis of treated patients pointedtowards a decline of the senescent CD57+CD28− T cellpopulation (Fig. 4b). Certainly, more data are needed toconfirm these findings.
We also analyzed the percentage of CD3+ T cellswhich was lower in treated patients compared tochemo-naive patients. In detail, the percentages ofCD4+ as well as CD8+ T cells were lower in chemo-naive patients compared to the treated ones. The CD4+/CD8+ ratio in treated myeloma patients was alsolower, although results did not reach statistical signifi-cance (p = 0.06) (Additional file 1: Figure S1). The dis-tribution of T cell subsets was not significantly alteredexcept for the decrease of Temra cells in treated patients(p < 0.05; Additional file 2: Figure S2a). Additionally, weanalyzed T cell subset distribution in untreated patientsamples in correlation to the International Staging System(ISS). Although sample numbers were low, we identifiedchanges in the T cell subsets (Tem and Temra) ratherearly in disease development in stage I, which were con-sistent also in higher stages (Additional file 2: Figure S2b).To complete our studies, we also tested inhibitorymarkers’ expression on CD4+ T cells from PB and BMand also CD8+ T cells from PB of treated myelomapatients. We found no significant differential expressionbetween naive and treated CD4+ T cells except forCD57, which was also downregulated on PB CD8+ Tcells (Additional file 3: Figure S3a–c).The CD8+CD57+CD28− phenotype may represent cyto-
toxic T cells in myeloma which are terminally differentiated,
Fig. 3 Accumulation of highly activated but senescent CD8+ T cells in the BM of myeloma patients. The expression of CD28 and CD57 was assessedon CD8+ T cells from patients with multiple myeloma and healthy, age-matched controls. Percentages of a CD8+CD28− T cells or b CD8+CD57+ Tcells in healthy (n = 12) and myeloma samples (n = 12). c Percentages of CD8+CD57+CD28− T cells compared to CD8+CD57+CD28+ T cells (n = 10).d Concomitant expression of CD57 and PD-1 on CD8+ T cells of the BM of healthy and diseased (n = 6–8). Median with IQR is shown. Significancelevels *p < 0.05; **p < 0.01; ***p < 0.001; n.s. not significant
Zelle-Rieser et al. Journal of Hematology & Oncology (2016) 9:116 Page 7 of 12
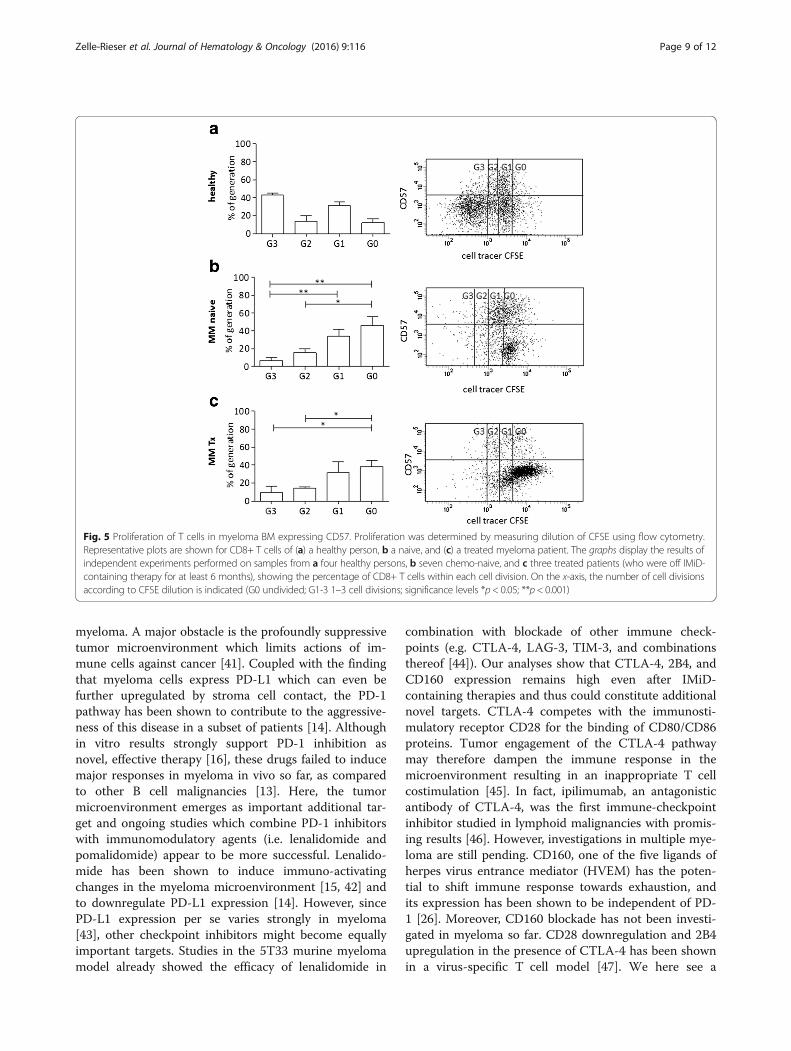
i.e., senescent. It is thought that these cells lose theirability to proliferate under in vitro stimulation [36, 37].Therefore, we stimulated T cells from healthy donors,chemo-naive myeloma patients, and treated patientsand measured proliferation and CD57 expression. Asexpected, healthy T cells showed a higher proliferationrate undergoing up to three cell divisions. During pro-liferation, they lost CD57 expression compared tochemo-naive myeloma T cells (Fig. 5a–c). However,proliferation rate, although rather low in myeloma sam-ples, was about the same in chemo-naïve versus treatedmyeloma samples and CD8+ T cells retained compar-able expression of CD57 (Fig. 5b, c).Additionally, we observed enhanced overall survival
in chemo-naive patients with high percentage of CD8+CD28–CD57+ T cells in the bone marrow (prelimin-ary observations, not shown). These data go alongwith observations from Suen et al. [3], but certainlymore patients’ data are needed before drawing definiteconclusions.
DiscussionIn this study, we investigated the nature of the T cell de-fects in multiple myeloma in more detail and comparedour findings to healthy, age-matched donor samples. Sucha thorough study of BM and PB samples from myelomapatients and healthy individuals has, to our knowledge,not been performed so far. Our investigation of systemicand local changes of the expression of checkpoint inhibi-tor molecules PD-1, CTLA-4, CD160, and 2B4 revealedsignificant upregulation of all tested markers especially inthe bone marrow, suggesting that the immunosuppressivetumor microenvironment fuels immune escape in mul-tiple myeloma.Expression and ligation of immune-checkpoint mole-
cules downregulate T cell responses and thereby main-tain self-tolerance. The use of monoclonal antibodies(i.e., anti-PD-1) to disrupt receptor-ligand interactionshas already shown remarkable results in the therapy ofseveral solid tumors [38–40] and is currently a fast pro-gressing field also in hematological cancers including
Fig. 4 Differential expression of T cell markers in BM of newly diagnosed and refractory myeloma patients. a Percentage of cell surface expressionof exhaustion markers PD1, CTLA-4, CD160, 2B4 was quantified on CD8+ effector T cells from patients with newly diagnosed myeloma (MM naive)and treated myeloma (MM Tx) compared to healthy donors. b Similar, expression of senescent markers CD57 and CD28 was investigated by flowcytometry. (Healthy n = 7–12; myeloma newly diagnosed n = 7–11; treated myeloma n = 5–6; median with IQR is shown). Significance levels*p < 0.05; **p < 0.01; n.s. not significant
Zelle-Rieser et al. Journal of Hematology & Oncology (2016) 9:116 Page 8 of 12
myeloma. A major obstacle is the profoundly suppressivetumor microenvironment which limits actions of im-mune cells against cancer [41]. Coupled with the findingthat myeloma cells express PD-L1 which can even befurther upregulated by stroma cell contact, the PD-1pathway has been shown to contribute to the aggressive-ness of this disease in a subset of patients [14]. Althoughin vitro results strongly support PD-1 inhibition asnovel, effective therapy [16], these drugs failed to inducemajor responses in myeloma in vivo so far, as comparedto other B cell malignancies [13]. Here, the tumormicroenvironment emerges as important additional tar-get and ongoing studies which combine PD-1 inhibitorswith immunomodulatory agents (i.e. lenalidomide andpomalidomide) appear to be more successful. Lenalido-mide has been shown to induce immuno-activatingchanges in the myeloma microenvironment [15, 42] andto downregulate PD-L1 expression [14]. However, sincePD-L1 expression per se varies strongly in myeloma[43], other checkpoint inhibitors might become equallyimportant targets. Studies in the 5T33 murine myelomamodel already showed the efficacy of lenalidomide in
combination with blockade of other immune check-points (e.g. CTLA-4, LAG-3, TIM-3, and combinationsthereof [44]). Our analyses show that CTLA-4, 2B4, andCD160 expression remains high even after IMiD-containing therapies and thus could constitute additionalnovel targets. CTLA-4 competes with the immunosti-mulatory receptor CD28 for the binding of CD80/CD86proteins. Tumor engagement of the CTLA-4 pathwaymay therefore dampen the immune response in themicroenvironment resulting in an inappropriate T cellcostimulation [45]. In fact, ipilimumab, an antagonisticantibody of CTLA-4, was the first immune-checkpointinhibitor studied in lymphoid malignancies with promis-ing results [46]. However, investigations in multiple mye-loma are still pending. CD160, one of the five ligands ofherpes virus entrance mediator (HVEM) has the poten-tial to shift immune response towards exhaustion, andits expression has been shown to be independent of PD-1 [26]. Moreover, CD160 blockade has not been investi-gated in myeloma so far. CD28 downregulation and 2B4upregulation in the presence of CTLA-4 has been shownin a virus-specific T cell model [47]. We here see a
Fig. 5 Proliferation of T cells in myeloma BM expressing CD57. Proliferation was determined by measuring dilution of CFSE using flow cytometry.Representative plots are shown for CD8+ T cells of (a) a healthy person, b a naive, and (c) a treated myeloma patient. The graphs display the results ofindependent experiments performed on samples from a four healthy persons, b seven chemo-naive, and c three treated patients (who were off IMiD-containing therapy for at least 6 months), showing the percentage of CD8+ T cells within each cell division. On the x-axis, the number of cell divisionsaccording to CFSE dilution is indicated (G0 undivided; G1-3 1–3 cell divisions; significance levels *p < 0.05; **p < 0.001)
Zelle-Rieser et al. Journal of Hematology & Oncology (2016) 9:116 Page 9 of 12
similar situation in myeloma bone marrow, i.e., a highproportion of CD8+ T cells which lost CD28 expressionand concomitantly gained CTLA-4 expression and up-regulated 2B4. These regulations could be the result ofchronic stimulation leading to enhanced T cell exhaus-tion. The CMV status of the patients might play a rolehere, however, recent papers showed defects in T cellfunction irrespective of CMV serostatus [48, 49].Additionally, to our checkpoint molecule analysis, we
detected an altered T cell subset distribution at thetumor site, leading to a significant increase of the ef-fector T cell population at the expense of the memory Tcell population. These CD8+ BM T cells would generallyfavor anti-cancer immune responses. However, thesecells also displayed upregulation of checkpoint mole-cules, reduced cytokine production, reduced ability todegranulate in response to T cell stimulation, and re-duced proliferative capacity. Thus, without further acti-vations, these T cells are most likely ineffective in tumorimmune surveillance. The loss of CD28 expression is asign of T cell aging in healthy individuals [30], and wefound it further enhanced in myeloma patients. Inaddition, we observed that myeloma CD8+CD28− T cellsconcomitantly expressed CD57, pointing to a high accu-mulation of a late differentiated, senescent T cell popula-tion in the BM. CD8+CD28–CD57+ T cells fromperipheral blood have been shown to play an active pro-tumor role via suppressing proliferation of responder Tcells [34], and removal of these cells in vitro restored Tcell proliferative capacity [50, 51]. Moreover, CD8+CD28–CD57+ T lymphocyte clones in the PB of mye-loma patients have been associated with progressive andadvanced stage disease [52]. In our analyses, we foundthat the percentage of CD57+ T cells in the bone mar-row of treated patients was reduced suggesting a windowof opportunity for effective immune modulatory treat-ments. However, sample size needs to be extended to beable to draw solid conclusions about the potential role ofCD8+CD28–CD57+ T cells in myeloma. Clearly, due tothe severe impairment of T cell function, reactivation of Tcells has to be built on several columns. An additionalpromising approach demonstrated that exogenous IL-7added to T cells co-cultured with tumor cells inhibitedloss of CD28, a feature of replicative senescence, andallowed normal proliferative capacity and IL-2 production[53]. IL-7 can also induce telomerase activity [54]. Inter-estingly, an ongoing phase I clinical trial using the non-glycosylated form of human IL-7 shows promise, in that itseems to cause the expansion of naive and memory CD4and CD8 T cell populations (NTC00062049). This may beimportant for myeloma patients as especially memory Tcells are reduced at the tumor site. Together with IL-15,which is a critical factor for development, proliferationand activation of natural killer cells and CD8+ memory T
cells, it may effectively contribute to fight the tumor. Inpreclinical studies, this cytokine exhibited potent antitu-mor activities against established tumors in animalmodels, showing that CD8+ T cells play a pivotal role inthe anti-myeloma effect of IL-15 agonists [55, 56].
ConclusionsIn this study, we show that the percentages of CD8+ ef-fector T cells especially at the tumor site, i.e., the bonemarrow, of myeloma patients are increased but cells arefunctionally severely impaired and display several fea-tures of exhaustion and senescence. Whereas expressionof checkpoint inhibitory molecules is retained during thecourse of treatment, senescent T cell-marker CD57 ap-pears to be downregulated. These data clearly show thatseveral avenues for the reactivation of the immune re-sponse in multiple myeloma will finally be needed to de-velop novel successful therapies.
Additional files
Additional file 1: Figure S1. T cell distribution in BM aspirates frommyeloma patients and healthy persons. (TIFF 44 kb)
Additional file 2: Figure S2a. T cell subset distribution in BM aspiratesof naive and refractory myeloma patients compared to healthy individuals.Figure S2b. T cell subset distribution in BM aspirates of naive myelomapatients (subdivided according to ISS staging) compared to healthyindividuals. (TIFF 100 kb)
Additional file 3: Figure S3. Differential expression of exhaustion andsenescent markers in T cells in myeloma BM and PB of newly diagnosedand treated patients. Expression on CD4+ T cells in the bone marrow(Figure S3a), CD4+ T cells in PB (Figure S3b), and CD8+ T cells in PB(Figure S3c). (ZIP 192 kb)
AbbreviationsBM: Bone marrow; BMMC: Bone marrow mononuclear cells; CTLA-4: Cytotoxic Tlymphocyte-associated protein 4; PB: Peripheral blood; PBMC: Peripheral bloodmononuclear cells; PD-1: Programmed cell death protein 1
AcknowledgementsWe thank Dr. Wolfgang Willenbacher and Mag. Roman Weger for participatingin the retrieval of patient data.
FundingThe research leading to these results has received funding from the EuropeanUnion Seventh Framework Programme (FP7/2007-2013) OPTATIO under grantagreement no. 278570 (to R.G.), from the Österreichische Krebshilfe Tirol (to C.ZR)and from the SCRI-LIMCR GmbH.
Availability of data and materialsAll data generated or analyzed during this study are included in this publishedarticle and its supplementary information files.
Authors’ contributionsCZR, KJ, and RG designed the project and discussed the data. ST and CZRperformed the experiments. AB, RB, and EW provided samples and patientdata. PS discussed the data. CZR and KJ analyzed the data and wrote themanuscript. All authors approved the manuscript.
Competing interestsThe authors declare that they have no competing interests.
Zelle-Rieser et al. Journal of Hematology & Oncology (2016) 9:116 Page 10 of 12
Ethics approval and consent to participateEthics approval for this study was given by the local Ethics Committee of MedicalUniversity of Innsbruck (No. UN 3252 and 5064), and written informed consentwas obtained in accordance with the Declaration of Helsinki.
Author details1Tyrolean Cancer Research Institute, Innrain 66, 6020 Innsbruck, Austria.2Department of Orthopedic Surgery, Medical University of Innsbruck,Anichstraße 35, Innsbruck, Austria. 3Department of Pathology, MedicalUniversity of Innsbruck, Müllerstraße 44, Innsbruck, Austria. 4Department ofDermatology, Venereology and Allergology, Medical University of Innsbruck,Anichstraße 35, Innsbruck, Austria. 5Department of Internal Medicine V,Medical University of Innsbruck, Anichstraße 35, Innsbruck, Austria. 6SalzburgCancer Research Institute (SCRI), Müllner Hauptstraße 48, 5020 Salzburg,Austria. 7Third Medical Department at The Paracelsus Medical UniversitySalzburg, Müllner Hauptstraße 48, Salzburg, Austria.
Received: 19 August 2016 Accepted: 18 October 2016
References1. Doering TA, Crawford A, Angelosanto JM, Paley MA, Ziegler CG, Wherry EJ.
Network analysis reveals centrally connected genes and pathways involvedin CD8+ T cell exhaustion versus memory. Immunity. 2012;37:1130–44.
2. Wherry EJ, Kurachi M. Molecular and cellular insights into T cell exhaustion.Nat Rev Immunol. 2015;15:486–99.
3. Suen H, Brown R, Yang S, Weatherburn C, Ho PJ, Woodland N, et al.Multiple myeloma causes clonal T-cell immunosenescence: identification ofpotential novel targets for promoting tumour immunity and implicationsfor checkpoint blockade. Leukemia. 2016;30:1716–24.
4. Barber DL, Wherry EJ, Masopust D, Zhu B, Allison JP, Sharpe AH, et al.Restoring function in exhausted CD8 T cells during chronic viral infection.Nature. 2006;439:682–7.
5. Nguyen LT, Ohashi PS. Clinical blockade of PD1 and LAG3—potentialmechanisms of action. Nat Rev Immunol. 2015;15:45–56.
6. Dock JN, Effros RB. Role of CD8 T cell replicative senescence in humanaging and in HIV-mediated immunosenescence. Aging Dis. 2011;2:382–97.
7. Blackburn SD, Shin H, Haining WN, Zou T, Workman CJ, Polley A, et al.Coregulation of CD8+ T cell exhaustion by multiple inhibitory receptorsduring chronic viral infection. Nat Immunol. 2009;10:29–37.
8. Khalil DN, Smith EL, Brentjens RJ, Wolchok JD. The future of cancertreatment: immunomodulation, CARs and combination immunotherapy.Nat Rev Clin Oncol. 2016;13:273–90.
9. Khan H, Gucalp R, Shapira I. Evolving concepts: immunity in oncology fromtargets to treatments. J Oncol. 2015;2015:847383.
10. Melero I, Berman DM, Aznar MA, Korman AJ, Perez Gracia JL, Haanen J.Evolving synergistic combinations of targeted immunotherapies to combatcancer. Nat Rev Cancer. 2015;15:457–72.
11. Ansell SM, Lesokhin AM, Borrello I, Halwani A, Scott EC, Gutierrez M, et al.PD-1 blockade with nivolumab in relapsed or refractory Hodgkin’slymphoma. N Engl J Med. 2015;372:311–9.
12. Armand P, Shipp MA, Ribrag V, Michot JM, Zinzani PL, Kuruvilla J, et al.Programmed death-1 blockade with pembrolizumab in patients withclassical Hodgkin lymphoma after brentuximab vedotin failure. J Clin Oncol.2016; JCO’673467. [Epub ahead of print]
13. Lesokhin AM, Ansell SM, Armand P, Scott EC, Halwani A, Gutierrez M, et al.Nivolumab in patients with relapsed or refractory hematologic malignancy:preliminary results of a phase Ib study. J Clin Oncol. 2016;34(23):2698–704.
14. Benson Jr DM, Bakan CE, Mishra A, Hofmeister CC, Efebera Y, Becknell B, etal. The PD-1/PD-L1 axis modulates the natural killer cell versus multiplemyeloma effect: a therapeutic target for CT-011, a novel monoclonal anti-PD-1 antibody. Blood. 2010;116:2286–94.
15. Gorgun G, Samur MK, Cowens KB, Paula S, Bianchi G, Anderson JE, et al.Lenalidomide enhances immune checkpoint blockade-induced immuneresponse in multiple myeloma. Clin Cancer Res. 2015;21:4607–18.
16. Ray A, Das DS, Song Y, Richardson P, Munshi NC, Chauhan D, et al.Targeting PD1-PDL1 immune checkpoint in plasmacytoid dendritic cell
interactions with T cells, natural killer cells and multiple myeloma cells.Leukemia. 2015;29:1441–4.
17. Alyea E, Weller E, Schlossman R, Canning C, Webb I, Doss D, et al. T-cell–depleted allogeneic bone marrow transplantation followed by donorlymphocyte infusion in patients with multiple myeloma: induction of graft-versus-myeloma effect. Blood. 2001;98:934–9.
18. Lokhorst HM, Schattenberg A, Cornelissen JJ, Thomas LL, Verdonck LF.Donor leukocyte infusions are effective in relapsed multiple myeloma afterallogeneic bone marrow transplantation. Blood. 1997;90:4206–11.
19. Prabhala RH, Neri P, Bae JE, Tassone P, Shammas MA, Allam CK, et al.Dysfunctional T regulatory cells in multiple myeloma. Blood. 2006;107:301–4.
20. Pratt G, Goodyear O, Moss P. Immunodeficiency and immunotherapy inmultiple myeloma. Br J Haematol. 2007;138:563–79.
21. Redoglia V, Boccadoro M, Battaglio S, Dianzani U, Massaia M, Pileri A.Multiple myeloma: altered CD4/CD8 ratio in bone marrow. Haematologica.1990;75:129–31.
22. Willenbacher W, Willenbacher E, Zelle-Rieser C, Biedermann R, Weger R,Johrer K, et al. Bone marrow microenvironmental CD4+ and CD8+lymphocyte infiltration patterns define overall- and progression free survivalin standard risk multiple myeloma—an analysis from the Austrian MyelomaRegistry. Leuk Lymphoma. 2016;57:1478–81.
23. Pritz T, Landgraf-Rauf K, Herndler-Brandstetter D, Rauf R, Lair J, Gassner R, etal. Bone marrow T cells from the femur are similar to iliac crest derived cellsin old age and represent a useful tool for studying the aged immunesystem. Immun Ageing. 2013;10:17.
24. Paiva B, Azpilikueta A, Puig N, Ocio EM, Sharma R, Oyajobi BO, et al. PD-L1/PD-1 presence in the tumor microenvironment and activity of PD-1 blockade inmultiple myeloma. Leukemia. 2015;29:2110–3.
25. Brown RD, Pope B, Yuen E, Gibson J, Joshua DE. The expression of T cellrelated costimulatory molecules in multiple myeloma. Leuk Lymphoma.1998;31:379–84.
26. Vigano S, Banga R, Bellanger F, Pellaton C, Farina A, Comte D, et al. CD160-associated CD8 T-cell functional impairment is independent of PD-1expression. PLoS Pathog. 2014;10:e1004380.
27. Costello RT, Boehrer A, Sanchez C, Mercier D, Baier C, Le Treut T, et al.Differential expression of natural killer cell activating receptors in bloodversus bone marrow in patients with monoclonal gammopathy.Immunology. 2013;139:338–41.
28. Schlaphoff V, Lunemann S, Suneetha PV, Jaroszewicz J, Grabowski J, Dietz J,et al. Dual function of the NK cell receptor 2B4 (CD244) in the regulation ofHCV-specific CD8+ T cells. PLoS Pathog. 2011;7:e1002045.
29. Legat A, Speiser DE, Pircher H, Zehn D, Fuertes Marraco SA. Inhibitoryreceptor expression depends more dominantly on differentiation andactivation than “exhaustion” of human CD8 T cells. Front Immunol.2013;4:455.
30. Herndler-Brandstetter D, Landgraf K, Tzankov A, Jenewein B, Brunauer R,Laschober GT, et al. The impact of aging on memory T cell phenotype andfunction in the human bone marrow. J Leukoc Biol. 2012;91:197–205.
31. Joshi NS, Cui W, Chandele A, Lee HK, Urso DR, Hagman J, et al.Inflammation directs memory precursor and short-lived effector CD8(+) Tcell fates via the graded expression of T-bet transcription factor. Immunity.2007;27:281–95.
32. Lazarevic V, Glimcher LH. T-bet in disease. Nat Immunol. 2011;12:597–606.33. Betts MR, Brenchley JM, Price DA, De Rosa SC, Douek DC, Roederer M, et
al. Sensitive and viable identification of antigen-specific CD8+ T cells by aflow cytometric assay for degranulation. J Immunol Methods. 2003;281:65–78.
34. Strioga M, Pasukoniene V, Characiejus D. CD8+ CD28- and CD8+ CD57+ Tcells and their role in health and disease. Immunology. 2011;134:17–32.
35. Ye J, Peng G. Controlling T cell senescence in the tumor microenvironmentfor tumor immunotherapy. Oncoimmunology. 2015;4:e994398.
36. Greaves P, Clear A, Owen A, Iqbal S, Lee A, Matthews J, et al. Definingcharacteristics of classical Hodgkin lymphoma microenvironment T-helpercells. Blood. 2013;122:2856–63.
37. Wherry EJ, Barber DL, Kaech SM, Blattman JN, Ahmed R. Antigen-independentmemory CD8 T cells do not develop during chronic viral infection. Proc NatlAcad Sci U S A. 2004;101:16004–9.
38. Postow MA, Chesney J, Pavlick AC, Robert C, Grossmann K, McDermott D, etal. Nivolumab and ipilimumab versus ipilimumab in untreated melanoma. NEngl J Med. 2015;372:2006–17.
Zelle-Rieser et al. Journal of Hematology & Oncology (2016) 9:116 Page 11 of 12
39. Powles T, Eder JP, Fine GD, Braiteh FS, Loriot Y, Cruz C, et al. MPDL3280A(anti-PD-L1) treatment leads to clinical activity in metastatic bladder cancer.Nature. 2014;515:558–62.
40. Tumeh PC, Harview CL, Yearley JH, Shintaku IP, Taylor EJ, Robert L, et al. PD-1 blockade induces responses by inhibiting adaptive immune resistance.Nature. 2014;515:568–71.
41. Pitt JM, Marabelle A, Eggermont A, Soria JC, Kroemer G, Zitvogel L.Targeting the tumor microenvironment: removing obstruction to anticancerimmune responses and immunotherapy. Ann Oncol. 2016;27(8):1482–92.
42. Semeraro M, Vacchelli E, Eggermont A, Galon J, Zitvogel L, Kroemer G, et al.Trial watch: lenalidomide-based immunochemotherapy. Oncoimmunology.2013;2:e26494.
43. Yousef S, Marvin J, Steinbach M, Langemo A, Kovacsovics T, Binder M, et al.Immunomodulatory molecule PD-L1 is expressed on malignant plasma cellsand myeloma-propagating pre-plasma cells in the bone marrow of multiplemyeloma patients. Blood Cancer J. 2015;5:e285.
44. Jing W, Gershan JA, Weber J, Tlomak D, McOlash L, Sabatos-Peyton C, et al.Combined immune checkpoint protein blockade and low dose whole bodyirradiation as immunotherapy for myeloma. J Immunother Cancer. 2015;3:2.
45. Wing JB, Ise W, Kurosaki T, Sakaguchi S. Regulatory T cells control antigen-specific expansion of Tfh cell number and humoral immune responses viathe coreceptor CTLA-4. Immunity. 2014;41:1013–25.
46. Bashey A, Medina B, Corringham S, Pasek M, Carrier E, Vrooman L, et al.CTLA4 blockade with ipilimumab to treat relapse of malignancy afterallogeneic hematopoietic cell transplantation. Blood. 2009;113:1581–8.
47. Liu D, Krummey SM, Badell IR, Wagener M, Schneeweis LA, Stetsko DK, et al.2B4 (CD244) induced by selective CD28 blockade functionally regulatesallograft-specific CD8+ T cell responses. J Exp Med. 2014;211:297–311.
48. Riches JC, Davies JK, McClanahan F, Fatah R, Iqbal S, Agrawal S, et al. T cellsfrom CLL patients exhibit features of T-cell exhaustion but retain capacityfor cytokine production. Blood. 2013;121:1612–21.
49. Schnorfeil FM, Lichtenegger FS, Emmerig K, Schlueter M, Neitz JS, DraenertR, et al. T cells are functionally not impaired in AML: increased PD-1expression is only seen at time of relapse and correlates with a shifttowards the memory T cell compartment. J Hematol Oncol. 2015;8:93.
51. Garcia-Sanz R, Gonzalez M, Orfao A, Moro MJ, Hernandez JM, Borrego D, etal. Analysis of natural killer-associated antigens in peripheral blood andbone marrow of multiple myeloma patients and prognostic implications. BrJ Haematol. 1996;93:81–8.
52. Sze DM, Giesajtis G, Brown RD, Raitakari M, Gibson J, Ho J, et al. Clonalcytotoxic T cells are expanded in myeloma and reside in the CD8(+)CD57(+)CD28(−) compartment. Blood. 2001;98:2817–27.
53. Zhang Y, Pfannenstiel LW, Bolesta E, Montes CL, Zhang X, Chapoval AI, et al.Interleukin-7 inhibits tumor-induced CD27-CD28- suppressor T cells:implications for cancer immunotherapy. Clin Cancer Res. 2011;17:4975–86.
54. Rathmell JC, Farkash EA, Gao W, Thompson CB. IL-7 enhances the survivaland maintains the size of naive T cells. J Immunol. 2001;167:6869–76.
55. Steel JC, Waldmann TA, Morris JC. Interleukin-15 biology and its therapeuticimplications in cancer. Trends Pharmacol Sci. 2012;33:35–41.
56. Xu W, Jones M, Liu B, Zhu X, Johnson CB, Edwards AC, et al. Efficacy andmechanism-of-action of a novel superagonist interleukin-15: interleukin-15receptor alphaSu/Fc fusion complex in syngeneic murine models ofmultiple myeloma. Cancer Res. 2013;73:3075–86.
• We accept pre-submission inquiries
• Our selector tool helps you to find the most relevant journal
• We provide round the clock customer support
• Convenient online submission
• Thorough peer review
• Inclusion in PubMed and all major indexing services
• Maximum visibility for your research
Submit your manuscript atwww.biomedcentral.com/submit
Submit your next manuscript to BioMed Central and we will help you at every step:
Zelle-Rieser et al. Journal of Hematology & Oncology (2016) 9:116 Page 12 of 12