Global Listed Infrastructure The Case for Global Listed Infrastructure Robert Becker, Senior Vice President and Portfolio Manager Benjamin Morton, Senior Vice President and Portfolio Manager Allocations to listed infrastructure have been on the rise in recent years amid growing demand for real assets offering relatively predictable cash flows and the potential for attractive real returns. We examine the asset class’s historical investment characteristics and the secular themes driving significant capital formation in infrastructure globally. Highlights • Compelling investment characteristics. Many infrastructure companies have monopolistic businesses that often have regulated or concession-based revenues— features that can help potentially reduce financial risk, generate attractive risk- adjusted returns and provide downside protection. • Policy imperatives driving long-term opportunities. Governments in the U.S. and elsewhere have been intent on using infrastructure spending to boost economic growth while making much-needed modernizations. As plans proceed, there will likely be growing incentives for increased private investment in infrastructure and privatization of key assets. • Valuation support from private investment demand. There is a large and growing backlog of uninvested capital in private infrastructure funds, and these investors have been willing to pay premiums in a competitive environment. • Strong secular themes. The global infrastructure investment opportunity is driven primarily by two distinct trends: the need to upgrade aging infrastructure systems in developed economies after decades of neglect, and the demographically fueled growth in new infrastructure associated with bringing higher standards of living to emerging regions. • Innovative investment security structures. As cash-strapped governments increasingly turn to private markets to fill a capital void, new security structures have been introduced globally, including those focused on income delivery. Institutions & Consultants: 212 822 1620
Transcript
Global Listed Infrastructure
The Case for
Global Listed Infrastructure Robert Becker, Senior Vice President and Portfolio Manager Benjamin Morton, Senior Vice President and Portfolio Manager
Allocations to listed infrastructure have been on the rise in recent years amid growing demand for real assets offering relatively predictable cash flows and the potential for attractive real returns. We examine the asset class’s historical investment characteristics and the secular themes driving significant capital formation in infrastructure globally.
Highlights
• Compelling investment characteristics. Many infrastructure companies have monopolistic businesses that often have regulated or concession-based revenues— features that can help potentially reduce financial risk, generate attractive risk-adjusted returns and provide downside protection.
• Policy imperatives driving long-term opportunities. Governments in the U.S. and elsewhere have been intent on using infrastructure spending to boost economic growth while making much-needed modernizations. As plans proceed, there will likely be growing incentives for increased private investment in infrastructure and privatization of key assets.
• Valuation support from private investment demand. There is a large and growing backlog of uninvested capital in private infrastructure funds, and these investors have been willing to pay premiums in a competitive environment.
• Strong secular themes. The global infrastructure investment opportunity is driven primarily by two distinct trends: the need to upgrade aging infrastructure systems in developed economies after decades of neglect, and the demographically fueled growth in new infrastructure associated with bringing higher standards of living to emerging regions.
• Innovative investment security structures. As cash-strapped governments increasingly turn to private markets to fill a capital void, new security structures have been introduced globally, including those focused on income delivery.
Listed Infrastructure: A Growing Asset Class With a Compelling Track RecordOver the past decade, investor interest in having an infrastructure allocation has surged amid a growing emphasis on real assets and the desire for broader diversification. The listed market offers an increasingly popular way to access infrastructure assets, combining key investment attributes of private infrastructure with the benefits of liquidity and daily pricing.
Investors’ demand for listed infrastructure has also grown as the asset class’s attractive risk-adjusted-return profile has received wider attention. Exhibit 1 compares risk and return characteristics of listed infrastructure with the broader stock market.
2 Introduction 12 Public and Private Funding
4 Asset Class Overview 13 Asset Allocation
6 Macro Sensitivities 14 Conclusion
7 Secular Drivers
Exhibit 1: Performance Risk and Return Characteristics2009–2017
Annualized Total Return Standard Deviation Upside/Downside Capture (Global Infrastructure)
7%
9%
11%
9.9 9.9
6%
10%
14%12.8
10.3
25%
50%
75%
50.8
65.3
GlobalInfrastructure
GlobalEquities
GlobalInfrastructure
GlobalEquities
UpsideCapture
DownsideCapture
At December 31, 2017. Source: Morningstar Direct and Cohen & Steers.
Data quoted represents past performance, which is no guarantee of future results. The information presented above does not reflect the performance of any fund or account managed or serviced by Cohen & Steers. There is no guarantee that any historical trend illustrated herein will be repeated in the future, and there is no way to predict precisely when such a trend will begin. See page 15 for index associations and additional disclosures.
Results for the eight-year period ended December 31, 2017, (the infrastructure index used in Exhibit 1 was incepted in 2009) indicate that listed infrastructure could have the potential to deliver:
Equity-like returns. Listed infrastructure’s annualized return of 9.9% for the period was competitive with the broader stock market’s performance.
Reduced volatility. The group’s returns in the period came with a lower standard deviation. The relatively predictable cash flows of infrastructure companies historically have led to lower volatility of returns compared with the broader equity market.
Downside protection. The potential to produce attractive full-cycle returns with some downside protection also reflects the unique aspects of the asset class. In down markets during the period, infrastructure held up considerably better than the broad stock market.
3
For investors seeking alternatives to bonds in a rising-rate environment and wary of elevated valuations in broader stock markets, we believe listed infrastructure offers a compelling complement to their portfolios. The search for diversification in the modern market environment also helps explain the strong growth in infrastructure investment demand shown in Exhibit 2.
Between 2009 and 2017, institutional assets under management in listed infrastructure strategies increased from under $1 billion to more than $42 billion (Exhibit 2). Institutions in Australia were some of the early adopters of listed infrastructure allocations, as their market was among the first to privatize transportation infrastructure assets, giving investors greater familiarity with infrastructure owned by listed entities. The expansion of the listed infrastructure market reflects greater acceptance of the asset class in the U.S. and other parts of the world, primarily by institutions, but also increasingly by individual investors.
Exhibit 2: Listed Infrastructure Assets Under Management$ billions
Institutional AUM
Non-Institutional AUM
$15
$30
$45
31.9
8.7 8.1
21.3
42.6
31.8
24.2 24.5
31.5
26.2
15.2
22.3
10.1 10.1
15.0
0.45.2 4.8
2009 2010 2011 2012 2013 2014 2015 2016 2017
At December 31, 2017. Source: eVestment. There is no guarantee that any historical trend illustrated herein will be repeated in the future, and there is no way to predict precisely when such a trend will begin. See page 15 for additional disclosures.
Exhibit 3: Record Dry Powder Creating a Valuation Floor Private Infrastructure Dry Powder(1) in $billions
$50
$90
$130
$170
7484
152159
105 109109
68
37
646665
15
2005 2007 2009 2011 2013 2015 2017
At December 31, 2017. Source: Preqin, Goldman Sachs and Cohen & Steers. (1) As defined by Preqin, Dry Powder is the amount of capital that has been committed to a private equity fund minus the amount that has been called by the general partner for investment. Preqin Dry Powder figures represent Dry Powder for all private funds reporting data at December 31, 2017. See page 15 for additional disclosures.
Recognizing the challenges private investors are having finding attractive infrastructure investments, more large institutions in our view are likely to increase their allocations to listed strategies. And as the backlog of private capital continues to find its way into infrastructure assets—including those owned by listed infrastructure companies—the premiums paid may continue to provide strong support for listed company valuations.
According to market intelligence firm Preqin, uninvested capital in private infrastructure funds hit a record $159 billion at the end of 2017, compared with $109 billion just two years prior (Exhibit 3). Facing a competitive environment for the relatively few assets available for sale, private transactions have generally occurred at significant premiums to the market-implied cash-flow multiples of listed infrastructure companies. Our analysis of recent transactions indicate that private investors have been acquiring assets at multiples of 18–20x year-ahead cash flows, compared with a 10–12x average cash-flow multiple for listed infrastructure companies.
Policy Imperatives Driving Long-Term OpportunitiesMore recently, shifting economic and political factors have put a spotlight on infrastructure. Many analysts foresee a turning point in the economy amid a strengthening business cycle and a more active mindset for policymakers in the U.S. and elsewhere. While there may be periods of short-term volatility as interest rates adjust to accelerated growth, we expect infrastructure to be a key beneficiary from a reflationary environment, as historically, listed infrastructure has tended to perform well during periods of unexpected inflation.
Stronger growth should particularly benefit the more economically sensitive infrastructure subsectors such as marine ports and freight railways. At the same time, the prospect for higher inflation could raise the group’s overall appeal, as many infrastructure businesses have inflation-linked pricing mechanisms.
Political shifts in the U.S. have also drawn attention to infrastructure, as the Trump administration appears keen to boost infrastructure spending to repair aging systems and provide economic stimulus. Engineering, construction and materials companies would likely be the primary beneficiaries of any such programs. Listed infrastructure companies, which are more akin to “landlords” than builders, stand to be secondary beneficiaries amid increased private sector
The Case for Global Listed Infrastructure
4
involvement in the ownership, operation and financing of infrastructure projects over the medium to longer term. This trend will be supported by increasing awareness of service and reliability issues—reinforced by headline events ranging from Flint, Michigan-type water crises to the latest freight or passenger train derailment. Given weak government balance sheets and increased political motivation, this should drive more private sector (potentially listed) ownership and operation of critical infrastructure assets in the U.S. We believe that the private sector is ultimately the more efficient financer and operator of infrastructure assets, and that any long-term solution to reverse the deterioration of infrastructure service quality will include increased privatization of key assets. This will take time, as infrastructure projects are locally approved and financed and fraught with political issues.
Asset Class Overview
Investing in Assets Vital to Economic FunctionInfrastructure companies own assets that provide essential services and facilitate economic progress. Found in a broad range of industries within the transportation, energy, utilities and communications sectors, infrastructure companies are generally united by having monopolistic business models, with limited competition/high barriers to entry due to the capital-intensive nature of their respective industries. They also typically have resilient, inelastic demand—their customers will continue to pay for electricity and water, for instance, regardless of the economic landscape.
Infrastructure companies tend to have more relatively predictable income streams than global equities, often linked to inflation. As a result, many infrastructure businesses have historically shown the versatility to perform well in periods of both rising and easing inflation, as well as through different points in the economic cycle.
Infrastructure Business Characteristics
Long-lived real assets The useful lives of infrastructure assets are typically greater than 20 years.
High barriers to entry The value of existing assets can be enhanced by strict zoning restrictions and large capital requirements—and in some cases exclusivity rights—which make it difficult or prohibitive for competitors to enter the market. The replacement cost cycle helps provide inflation protection.
Stable cash flows The often regulated nature of infrastructure businesses can serve to enhance cash-flow predictability and potentially lower financial risk.
Inelastic demand Infrastructure assets that provide essential services have tended to be resistant to economic downturns.
Geographic and Industry DiversificationThrough listed infrastructure companies, investors can gain access to a globally diversified portfolio of infrastructure assets, spread across the Americas, Europe and Asia Pacific. The listed infrastructure universe spans a broad range of subsectors, which we group into four main categories:
Transportation Energy Utilities Communications
Toll Roads Storage and Transportation Electric Utilities Wireless Towers
Airports Renewable Energy Gas Utilities Satellite Services
Marine Ports Pipelines Water
Railroads
Infrastructure companies typically have limited competition with high barriers to entry.
5
Exhibit 4: Revenue Drivers of Infrastructure Subsectors
Subsector Price Inflation Characteristics Volume
Airports Aeronautical—regulated, Regulatory Asset Base (RAB) methodology with 3- to 5-year rate agreements.
Retail, real estate—can be regulated, unregulated or quasi-regulated.
Regulated fees generally have annual CPI-based adjustments.
Economic growth is the key driver of business/leisure travel and retail consumption.
Demographic shifts in emerging markets leading to air travel as a growing means of transport.
Integrated Utilities
Power generation revenues, typically driven by market power prices.
Power prices have shown strong historical correlation with inflation.
Generally same as regulated utilities.
Passenger Rails
Transportation—often regulated with infrequent price adjustments; retail and real estate—generally unregulated.
Little inflation impact on pricing. Passenger volumes driven primarily by GDP; retail business often a function of passenger traffic.
Ports Mix of direct asset ownership and concessions; mostly deregulated.
1- to 5-year contracts negotiated with customers (shippers). Short-term pricing often supply/demand driven.
Longer-term contracts can have inflation escalators.
Trade volumes are usually linked to GDP. Since 1990, container volumes grew at 3.0x the rate of GDP.
Tanker and dry bulk volumes have expanded at 0.7x and 1.2x, respectively.
Toll Roads Long-term (20–99 year) concession agreements with local governments.
Inflation impacts on allowed returns often occur through rate base and cost of capital calculations.
Industrial and commercial demand is primarily a function of economic conditions.
Residential demand historically steady over the long run and weather-driven in the short term.
At December 31, 2017. Source: Cohen & Steers. See page 15 for additional disclosures.
Most listed infrastructure companies own several, if not dozens, of infrastructure assets, which are not necessarily all in the same country. This type of asset diversification—similar to the benefits of portfolio diversification—is important for several reasons:
• Regulation is a significant risk faced by the asset class; accordingly, diversification across regulatory and political environments can be beneficial.
• Diversification can reduce volatility related to varying regional economic and market conditions.
Predictable Revenue, Often Linked to InflationInfrastructure assets tend to produce predictable cash flows, which are generally a function of two factors—price and volume.
• Prices are often a function of the regulatory or concession framework and can have periodic inflation-linked adjustments.
• Volume is often a function of a region’s underlying economic conditions, such as gross domestic product (GDP) growth.
Below, we provide context on how price and volume tend to drive revenues in several infrastructure subsectors, while showing how these characteristics can be inherently linked with inflation.
The Case for Global Listed Infrastructure
6
Macro Sensitivities
Macroeconomic Impact on Infrastructure ReturnsThe relative performance of infrastructure stocks compared with broader equities has historically varied across different stages of the business cycle as well as in differing growth and yield scenarios, as displayed in Exhibits 5A and 5B. In general, the asset class outperformed broader equity markets in periods characterized by business cycle downturns and troughs, reflecting the group’s more predictable cash flows. It performed particularly well when economic slowdowns were accompanied by
Exhibit 5A: Relative Returns vs. Equities Across Business Cycles(1)
Average Excess Return Ann. (lhs)
Median Excess Return Ann. (lhs)
Hit Rate of Outperformance (rhs)
Infra
stru
ctur
e Pe
rform
ance
Re
lativ
e to
Equ
ities
0%
4%
8%
0
-1
6
1
5
0
2 2
50%
60%
70%
DownturnOverheatRecoveryTrough
Exhibit 5B: Relative Returns vs. Equities During Various Growth and Yield Regimes(2)
Infra
stru
ctur
e Pe
rform
ance
Rela
tive
to E
quiti
es
-5%
0%
5%
10%
15%
2-1
-8
1
-6
3
11
6
15%
30%
45%
60%
75%
Growth UpYield Up
Growth DownYield Up
Growth UpYield Down
Growth DownYield Down
At December 31, 2017. Source: Cohen & Steers, Morningstar.
Data quoted represents past performance, which is no guarantee of future results. Methodology: Monthly historical analysis of the Thomson Reuters Global Infrastructure Index versus the Thomson Reuters Global Equity Index. Trough: stage of the US business cycle when growth is below potential and falling (as measured by our proprietary C&S Lead Economic Index). Recovery: Stage of the US business cycle when growth is below potential but rising. Overheat: Stage of the US business cycle when growth is above potential and rising. Downturn: Stage of the US business cycle when growth is above potential but falling. Hit Rate is the percentage of time that returns outperform their long-term average return, in that given regime. Growth and Yields are defined using our C&S LEI and 10-year U.S. Treasury yield on a 1 month basis, i.e. whether the LEI rises or falls month-over-month, and whether yields rise or fall month-over-month. Excess returns are annualized. (1) From 1973-2010 (2) From 1989-2017. Please see page 15 for index associations and additional disclosures.
a decline in bond yields. Conversely, listed infrastructure often underperformed when investors were more willing to embrace risk, such as during business cycle recoveries. We believe this pattern of behavior is consistent with the group’s market upside and downside capture as shown in Exhibit 1 on page 2, and likewise speaks to the diversification appeal of the asset class.
Infrastructure Historically Has Shown Resilience After Interest Rate IncreasesInfrastructure companies are often more sensitive to interest rates due to their high dividend yields and capital-intensive business models. However, while infrastructure stocks may at first react negatively to rapid increases in interest rates, performance has historically improved over the long run as the initial shock of higher rates wore off and investors began to focus on the underlying fundamentals. Exhibit 6 shows the average returns during the 10 largest spikes in the 10-year Treasury yield since 2000. After an initial reaction, infrastructure stocks subsequently produced strong absolute and relative performance.
Exhibit 6: Average Returns Following the Largest Increases in the 10-Year Treasury Yield(a)
At December 31, 2017. Source: Cohen & Steers, Morningstar.
Data quoted represents past performance, which is no guarantee of future results. There is no guarantee that any historical trend illustrated herein will be repeated in the future, and there is no way to predict precisely when such a trend will begin. (a) Time periods determined by ranking 30-day increases in the 10-year U.S. Treasury yield since 2000 (discarding overlapping periods of lesser yield increases), measuring average index returns in those 30-day periods and the ensuing 3-, 6- and 12-month periods thereafter. See page 15 for index associations and additional disclosures.
Against a backdrop of broadly improving economic trends and strong fundamentals, reactions to interest rates are generally associated with a contraction in earnings multiples rather than an indication of balance-sheet strength or cash-flow sustainability. We believe long-term returns will ultimately be driven by fundamental factors specific to each infrastructure business, subsector and region.
7
Exhibit 8: U.S. Government Investment in InfrastructureInfrastructure Spending as a Percentage of Gross Domestic Product
% o
f GD
P
2%
3%
4%
20161956 1966 1976 1986 1996 2006
At March 31, 2017 (most recently published data). Source: Thomson Reuters, Credit Suisse Research.
There is no guarantee that any historical trend illustrated herein will be repeated in the future, and there is no way to predict precisely when such a trend will begin. See page 15 for additional disclosures.
Positive Association With Inflation SurpriseOne reason often stated for allocating to infrastructure is the desire for protection from inflation. Periods in which inflation comes as a surprise can be particularly damaging to portfolio returns. To illustrate this point, we compared the sensitivity of various asset classes to unexpected changes in inflation (Exhibit 7). The chart shows the average outperformance of each asset class for every 1% that inflation exceeded the median inflation estimate from the prior year. A positive sensitivity to inflation surprise signifies that unexpected inflation has typically had a beneficial effect on performance, and vice versa.
Exhibit 7: Sensitivity to Unexpected Changes in Inflation1991–2017
0%
2%
4%
6%
-0.5-0.4
4.9
InfrastructureBondsStocks
At December 31, 2017. Source: Bloomberg and Cohen & Steers.
Data quoted represents past performance, which is no guarantee of future results. There is no guarantee that any historical trend illustrated herein will be repeated in the future, and there is no way to predict precisely when such a trend will begin. Stocks represented by the S&P 500 Index. Bonds represented by the BofA Merrill Lynch U.S. 7–10 Year Treasury Index. Infrastructure represented by a 50/50 Blend of Datastream World Pipelines and Datastream World Gas, Water & Multi-Utilities through July 2008 and the Dow Jones Brookfield Global Infrastructure Index thereafter. Inflation sensitivity based on a linear regression analysis of 1-year real returns and the difference between the realized inflation rate (y/y change in the Consumer Price Index) and the lagged 1-year-ahead median inflation estimate from the University of Michigan survey of consumers. See page 15 for index associations and additional disclosures.
Secular Drivers
Opportunities Amid the Massive Need for Infrastructure FinancingInfrastructure is vital to everyday life and economic growth. Yet while public funding for infrastructure has become scarcer, especially after the financial crisis, the need to maintain or build networks worldwide is greater than ever. For developed markets, investment opportunities can be framed by the daunting task of upgrading and replacing antiquated infrastructure networks (e.g., roads and bridges, electricity transmission wires, water pipelines). At the same time, emerging economies frequently face critical investment needs to support economic growth, expand urban capacity and meet the demand for higher standards of living.
Developed Markets: A History of Infrastructure UnderinvestmentDeveloped markets have seen a steady, decades-long decline in infrastructure spending. Exhibit 8 shows the more than 50-year decline in infrastructure investment in the U.S. as a percentage of the country’s GDP. To varying degrees, similar patterns exist in developed markets in Europe and Asia.
Spending on infrastructure in the United States has been on the decline for many years. According to the American Society of Civil Engineers (ASCE), this neglect could lead to about $3.6 trillion of pending needs by the year 2020. Yet only about $2.0 trillion has been funded to date, leaving a funding gap of just over $1.6 trillion.
The results of our analysis suggest that an allocation to listed infrastructure may help mitigate the potentially negative effects of unexpected inflation on stocks and bonds. The data imply that for every one percentage point increase in inflation above the previous year’s forecast, stocks and bonds delivered inflation-adjusted returns that were 40 and 50 basis points below average, respectively, whereas listed infrastructure outperformed its long-term inflation-adjusted average by 490 basis points. We believe this reinforces the view that listed infrastructure has distinct characteristics from a broad equity portfolio, consistent with the qualities of a real assets allocation.
The Case for Global Listed Infrastructure
8
Every four years, ASCE compiles a comprehensive report card that grades the state of infrastructure assets across a broad range of sectors. What was notable from their most recent report, published in March 2017, was America’s poor overall grade of D+. The report concludes that the deterioration of the nation’s infrastructure undermines the U.S. economy, jeopardizes public safety and threatens the quality of life. ASCE’s findings by infrastructure category are highlighted in Exhibit 9.
Exhibit 9: Poor Grades for U.S. Infrastructure from the American Society of Civil Engineers (ASCE)
Grade Comments
OverallD+
Grades have been near failing since the survey began in 1998, due to delayed maintenance and underinvestment across most categories.
AviationD
With a federal cap on how much airports can charge passengers for facility improvements, airports struggle to keep up with investment needs, creating a $42 billion funding gap between 2016 and 2025.
Bridges C+ Nearly 10% of the nation’s 614,387 bridges were structurally deficient in 2016.
Dams D It is estimated that it will require an investment of nearly $45 billion to repair aging, yet critical, high-hazard-potential dams.
Drinking WaterD
According to the American Water Works Association, an estimated $1 trillion is necessary to maintain and expand service to meet demands over the next 25 years.
Energy (national grid) D+
Without greater attention to aging equipment, capacity bottlenecks, and increased demand, Americans will likely experience longer and more frequent power interruptions.
Hazardous Waste D+ More than half of the U.S. population lives within three miles of a hazardous waste site.
WaterwaysD
Most locks and dams on the inland waterway system are well beyond their 50-year design life, and nearly half of vessels experience delays.
Ports C+ To remain competitive globally and with one another, ports have been investing in expansion, modernization and repair.
RailsB
Although the grade rose to B from C+ in the last report U.S. rail still faces clear challenges, most notably in passenger rail, which faces the dual problems of aging infrastructure and insufficient funding.
RoadsD
More than two out of every five miles of America’s urban interstates are congested and traffic delays cost the country $160 billion in wasted time and fuel in 2014.
TransitD-
Despite increasing demand, the nation’s transit systems have been chronically underfunded, resulting in aging infrastructure and a $90 billion rehabilitation backlog.
A = Exceptional B = Good C = Mediocre D = Poor F = Failing
At December 31, 2016. Source: ASCE. The views expressed in the above exhibit do not express the views of Cohen & Steers. See page 15 for additional disclosures.
According to a study by the American Society of Civil Engineers, the deterioration of the nation’s infrastructure undermines the U.S. economy, jeopardizes public safety and threatens the quality of life.
9
Exhibit 11A: Internet-Capable Devices, Global ForecastExabytes per Month(a)
Exhibit 11B: Data Usage by Device: GlobalMegabytes per Month(b)
1
2
3
4
5
6
7
2.6
4.1
5.0
6.2
2.0
3.3
Network Tra�c Growth: 25.4% CAGR
500
1,000
1,500
2,000
2,500
3,000
3,500
70
2,6412,913
22
2,0003x
37x
94x119x
20152014 2019201820172016Machine-
to-Machine(“M2M”)
FeaturePhone
4G TabletLaptop4GSmartphone
At February 28, 2015. Source: Cisco VNI Mobile.
There is no guarantee that any historical trend illustrated herein will be repeated in the future, and there is no way to predict precisely when such a trend will begin. (a) One exabyte equals one quintillion bytes, or one billion gigabytes. (b) One megabyte equals one million bytes. See page 15 for additional disclosures.
Exhibit 10: EPA Assessment of Infrastructure Capital Requirements Through 2020
Capital Require-ments by 2020
Infrastructure Category Purpose
$247.5 billion Distribution and transmission
Replace or refurbish aging or deteriorating lines
$72.5 billion Treatment Construct, expand or rehabilitate infrastructure to reduce contamination
$39.5 billion Storage Construct, rehabilitate or cover finished water storage reservoirs
$20.5 billion Source Construct or rehabilitate intake structures, wells and spring collectors
At June 2013. Source: Environmental Protection Agency.The views expressed in the above exhibit do not express the views of Cohen & Steers.
Wireless data services continue to grow rapidly year to year.
Growing Demand for Wireless Communications Not all developed-market opportunities are tied to the obsolescence of aging infrastructure assets. Here we introduce the case for tower companies, which revolves around the increasingly data-intensive nature of wireless traffic as well as the growth in demand for wireless devices. These trends are highlighted in Exhibits 11A and 11B below.
Today, there are over 100,000 commercial wireless towers spread throughout the United States. To accommodate the increasing data intensity of wireless traffic, telecommunications carriers are reportedly investing heavily in their networks, requiring more leased space from cellular tower companies to house their communications equipment. We expect this trend to bode well for the business models of tower companies, which are often characterized by low variable costs, low churn and high operating leverage. Due to these types of business models, incremental revenues from new leases and lease escalations tend to flow directly to the bottom line. Moreover, leases tend to be long term and often have annual revenue escalators.
Antiquated Water Infrastructure SystemsAs highlighted by the recent water crisis in Flint, Michigan, where elevated lead levels were attributed to aging pipes, the United States is a prime example of a need for safe water upgrades. A mid-2013 study by the U.S. Environmental Protection Agency (EPA) projected that $380 billion in improvements would be needed through 2020 for nearly 75,000 systems to continue providing safe drinking water. In many cases, drinking water infrastructure was reported to be 50 to 100 years old. The 2013 survey, submitted to Congress as part of the Safe Drinking Water Act, divided the capital requirements into the four general areas summarized in Exhibit 10 below.
The Case for Global Listed Infrastructure
10
North American Midstream Energy Companies Poised for RecoveryMidstream energy companies represent a key component of North American infrastructure. They are critical to the energy value chain, collecting fees for the services of transporting, processing and storing energy commodities as they move from supply regions to demand centers. Companies are organized as both corporations and master limited partnerships (MLPs)— a tax-advantaged vehicle designed for the efficient delivery of income to U.S. investors.
While turmoil in energy markets and a rapid decline in energy prices and production growth in 2014–2016 weighed heavily on midstream energy companies, fundamental conditions have vastly improved since then. As shown in Exhibit 12, crude oil and natural gas prices have stabilized and pipeline throughput volumes have been increasing rather than falling. This partly reflects an effort by the Organization of Petroleum Exporting Countries (OPEC) to reduce output and shore up prices.
Midstream energy companies that own pipeline assets stand to benefit from rising pipeline utilization amid growing energy production as North America continues to increase its market share of global energy supply. As fundamentals improve, we expect midstream energy stocks and MLP unit prices to respond positively.
North American shale oil is well positioned to benefit from a recovery in oil demand. Like offshore and oil sands, shale offers substantial undeveloped resources. Yet in contrast to those competing sources, shale oil can be tapped in as little as 6 to 12 months and at a moderate cost. We expect North American producers to gain significant market share due to their cost competitiveness and speed to market, with favorable implications for midstream energy companies that operate in the region.
In addition, these favorable trends have been occurring as more companies shift to “midstream 2.0,” employing new business models focused on return on invested capital, rather than the maximization of distributed cash. These transitions have been associated with improved corporate governance and general efforts to become more self-funding.
Exhibit 12: Stable Energy Price Levels Are Driving Increasing U.S. Production Volumes
At December 31, 2017. Source: Bloomberg, U.S. Energy Information Administration and Cohen & Steers.
Data quoted represents past performance, which is no guarantee of future results. See page 15 for additional disclosures.
11
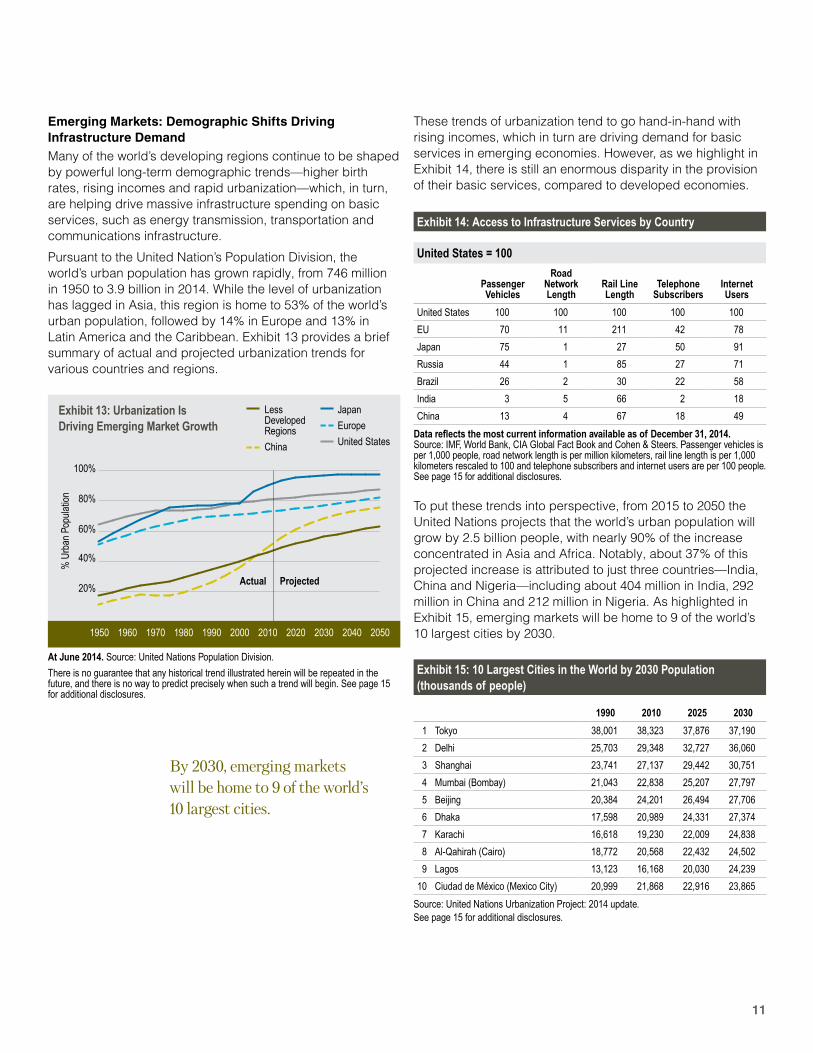
By 2030, emerging markets will be home to 9 of the world’s 10 largest cities.
Emerging Markets: Demographic Shifts Driving Infrastructure DemandMany of the world’s developing regions continue to be shaped by powerful long-term demographic trends—higher birth rates, rising incomes and rapid urbanization—which, in turn, are helping drive massive infrastructure spending on basic services, such as energy transmission, transportation and communications infrastructure.
Pursuant to the United Nation’s Population Division, the world’s urban population has grown rapidly, from 746 million in 1950 to 3.9 billion in 2014. While the level of urbanization has lagged in Asia, this region is home to 53% of the world’s urban population, followed by 14% in Europe and 13% in Latin America and the Caribbean. Exhibit 13 provides a brief summary of actual and projected urbanization trends for various countries and regions.
Exhibit 14: Access to Infrastructure Services by Country
United States = 100
Passenger Vehicles
Road Network Length
Rail Line Length
Telephone Subscribers
Internet Users
United States 100 100 100 100 100
EU 70 11 211 42 78
Japan 75 1 27 50 91
Russia 44 1 85 27 71
Brazil 26 2 30 22 58
India 3 5 66 2 18
China 13 4 67 18 49
Data reflects the most current information available as of December 31, 2014. Source: IMF, World Bank, CIA Global Fact Book and Cohen & Steers. Passenger vehicles is per 1,000 people, road network length is per million kilometers, rail line length is per 1,000 kilometers rescaled to 100 and telephone subscribers and internet users are per 100 people. See page 15 for additional disclosures.
Exhibit 13: Urbanization Is Driving Emerging Market Growth
Less Developed Regions
China
Japan
Europe
United States
% U
rban
Pop
ulat
ion
Actual Projected20%
40%
60%
80%
100%
19601950 1980 200019901970 20202010 20402030 2050
At June 2014. Source: United Nations Population Division.
There is no guarantee that any historical trend illustrated herein will be repeated in the future, and there is no way to predict precisely when such a trend will begin. See page 15 for additional disclosures.
These trends of urbanization tend to go hand-in-hand with rising incomes, which in turn are driving demand for basic services in emerging economies. However, as we highlight in Exhibit 14, there is still an enormous disparity in the provision of their basic services, compared to developed economies.
Exhibit 15: 10 Largest Cities in the World by 2030 Population (thousands of people)
1990 2010 2025 2030
1 Tokyo 38,001 38,323 37,876 37,190
2 Delhi 25,703 29,348 32,727 36,060
3 Shanghai 23,741 27,137 29,442 30,751
4 Mumbai (Bombay) 21,043 22,838 25,207 27,797
5 Beijing 20,384 24,201 26,494 27,706
6 Dhaka 17,598 20,989 24,331 27,374
7 Karachi 16,618 19,230 22,009 24,838
8 Al-Qahirah (Cairo) 18,772 20,568 22,432 24,502
9 Lagos 13,123 16,168 20,030 24,239
10 Ciudad de México (Mexico City) 20,999 21,868 22,916 23,865
Source: United Nations Urbanization Project: 2014 update.See page 15 for additional disclosures.
To put these trends into perspective, from 2015 to 2050 the United Nations projects that the world’s urban population will grow by 2.5 billion people, with nearly 90% of the increase concentrated in Asia and Africa. Notably, about 37% of this projected increase is attributed to just three countries—India, China and Nigeria—including about 404 million in India, 292 million in China and 212 million in Nigeria. As highlighted in Exhibit 15, emerging markets will be home to 9 of the world’s 10 largest cities by 2030.
The Case for Global Listed Infrastructure
12
Water Scarcity: A Rising 21st Century ChallengeAccording to the UN, water usage has been rising over the past century at more than twice the rate of population growth. By 2025, 1.8 billion people could be living in countries or regions with absolute water scarcity; we believe it is possible that two-thirds of the world population could be under stress conditions. Fresh water accounts for less than 3% of the world’s total water resources; 60% is found in just 10 countries.(1)
Global infrastructure investment opportunities exist in water utilities, wastewater treatment providers and their related businesses. We also find attractive investment opportunities in U.S.-based regulated water utilities, which are investing heavily in pipeline upgrades and are attempting to grow through acquisitions of smaller, often municipal water systems. Wastewater treatment is also an attractive theme, particularly in emerging markets, while we expect investment opportunities in desalinization businesses to grow significantly over time due to a rising need for potable water.
Public and Private Funding
Trends in Financing of Infrastructure
Business Structures With a Growing Focus on Income DeliveryGovernments within developed and emerging markets, already challenged by fiscal budget constraints, have become even more stressed in the wake of the financial crisis, compounding their approach to meet infrastructure challenges. Amid a massive capital void, new forms of listed infrastructure have arisen to help meet these needs, including YieldCos, MLPs and REITs in the U.S., and infrastructure trusts in Mexico, Japan and India.
This relatively new mechanism for capital formation also reflects investors’ increased appetite for income-focused investments, as well as the desire of many companies to segment risk to attract a broader pool of investors. Examples can be found throughout infrastructure-related sectors such as energy transmission and communications.
New Structures in an Expanding Universe for Global Infrastructure Stocks The global listed infrastructure universe continues to expand, with a growing emphasis on security structures focused on income delivery. In addition to the types of U.S. securities highlighted below, new structures have also arisen internationally, such as the FIBRA-E in Mexico and the infrastructure trust in India.
YieldCos MLPs REITs
Description YieldCos, which can be structured as publicly traded limited liability companies, limited partnerships or traditional corporations, generally house power generation assets, including renewables.
For U.S. investors, distributions generally tax sheltered, and in some cases, tax credits.
Like MLPs, REITs are not taxable entities. However, they typically must pay out at least 90% of taxable earnings as dividends to shareholders.
Potential Investment Benefits
• Historically predictable cash flows and attractive income with relatively low volatility
• For U.S. investors, distributions generally tax sheltered through depreciation, and in some cases, tax credits
• Historically above-average dividend growth
• Relatively high predictable streams of income and distributions
• Often lower cost of capital than C-Corporation peers
• Tax efficiency for U.S. investors
• Historically predictable streams of income
Examples
Company NextEra Energy Partners Enterprise Products Partners Crown Castle International
Business Focus Solar and Wind Energy Midstream Energy Wireless Infrastructure
Market Cap $2.4 billion at 12/31/2017 $56.9 billion as of 12/31/2017 $46.0 billion as of 12/31/2017
Description NextEra Energy Partners is a growth-oriented partnership formed by NextEra Energy, a leading developer of renewable energy in the United States. The company’s portfolio includes contracted renewable generation assets.
Enterprise Products Partners is the largest midstream energy company in North America, with several business lines including natural gas liquids (NGL), natural gas, and crude oil pipelines and related product services.
Crown Castle, which converted to REIT status in 2014, is a pure-play U.S. tower company. The company provides infrastructure for broadcasting and wireless broadband on behalf of major service providers.
(1) Source: Food and Agriculture Organization of the United Nations as of May 2015.
13
Listed infrastructure offers liquidity and typically can be sold at any time, in contrast to direct investments that often have long lock-ups.
Asset Allocation
Listed Infrastructure as a Complement to Direct Investment Listed infrastructure is a compelling way to invest in a rapidly growing sector of the global economy, combining attributes of private infrastructure investments with benefits of liquidity, transparency and daily market pricing.
Business Characteristics Similar to Direct Investments As noted earlier, listed infrastructure companies tend to own long-lived assets with regulated and monopolistic structures. Similar to private infrastructure investments, their businesses are often characterized by significant barriers to entry, and there is relatively inelastic demand for the services they provide. Many invest in the same types of assets owned by sovereign wealth funds, infrastructure funds and private equity funds. In several cases, assets are co-owned by a combination of listed infrastructure companies and direct institutional investors.
Relative Liquidity Advantage While private and listed infrastructure invest in the same kinds of assets, listed infrastructure markets provide a higher level of liquidity relative to the long lock-up periods and limited secondary markets for private infrastructure investment vehicles. These securities benefit from transaction-driven, real-time pricing and can typically be sold at any time, while lock-ups on direct investments can last anywhere from 5 to 15 years. In a liquid environment, managers of listed infrastructure can capitalize on pricing anomalies and other technical drivers.
Moderate LeverageDirect infrastructure investments are often highly leveraged to enhance return potential. Comparatively, most listed infrastructure companies are more conservatively leveraged.
Rising Privatization Trends Across Global Markets
Many governments are actively seeking private capital investment in large-scale infrastructure projects. Through privatizations and public-private partnerships, public projects can often be designed, implemented, administered and salvaged at lower cost and risk to the public than those associated with traditional government provisions.
An example of a privatization can be found in the Spanish government’s sale of 49% of its stake in AENA, the world’s largest airport operator by passenger volume, in a February 2015 IPO. Other countries that have privatized infrastructure assets or have plans to step up infrastructure spending through private enterprise include Mexico, France, India, Australia and the U.S.
Cash-strapped governments are turning to private sectors for funding.
Company Profile: AENA
Country and Sector Date of Issuance Market Cap
Spanish Airport February 2015 €25.5 billion at December 31, 2017
The Case for Global Listed Infrastructure
14
Potential Diversification Benefits The scope of the industry groups found in global infrastructure, such as those highlighted in Exhibit 4 on page 5, underscores the broad diversification that can be offered by listed infrastructure through a range of subsectors and geographies. There is also diversification at the security level. For example, it is not uncommon for utilities, which make up the largest sector within the listed infrastructure universe, to own dozens or more assets spread across multiple subsectors and geographies. This type of diversification can help reduce the risk of concentrated exposure to regional economic downturns, regulations and market performance. In contrast, direct infrastructure funds typically invest in just a handful of assets, which tend to be concentrated within a few geographies and/or subsectors.
Notably, there is very little overlap between global listed infrastructure and global equities. The 220 securities of the FTSE Global Core 50/50 Net Tax Index represent roughly 4% of the MSCI World Index as measured on a market-capitalization basis, with well fewer than half of the FTSE index companies also included in the MSCI index. This aspect of infrastructure appears consistent with the group’s typically modest correlation with the wider equity market.
Access to Themes Not Always Available Through Private InvestmentsOne of the attractive aspects of listed infrastructure is that investors can access a broad set of liquid investment themes across all geographies and subsectors—some of which would likely entail significant hurdles when trying to invest directly in the same assets. Often, public companies have premier assets that may not be accessed easily.
Conclusion Listed infrastructure offers unique characteristics and potential competitive advantages, providing easy access to subsectors and investment themes that are typically under-represented in general equity. Given this relatively light representation, a standalone allocation to listed infrastructure can benefit overall portfolios.
While there are parallels between the business characteristics of listed infrastructure and private equity infrastructure investment—long-lived assets, often with high barriers to entry and a monopolistic structure—the value-add comes primarily from the transparency, diversification, liquidity and daily pricing advantages of public securities markets. Depending on the asset allocation framework and investment objectives of the investor, listed infrastructure tends to be treated as a component of a real assets portfolio or as a carve-out allocation from global equities. In our view, both approaches make sense:
• A sleeve of a real assets allocation—either standalone or as a complement to direct infrastructure—recognizes the unique asset profiles, inflation linkages and long-term performance characteristics of the underlying businesses.
• An allocation as a carve-out of global equities recognizes that listed infrastructure has an equity “wrapper,” while appreciating its defensive attributes and alternative asset characteristics.
Within either framework, we believe listed infrastructure offers an attractive total-return proposition that combines stable, predictable dividends and attractive long-term cash-flow growth.
We believe the appeal of an allocation to global listed infrastructure lies in the relatively predictable cash flows and attractive return potential of the asset class, implemented as part of a separate real assets allocation or as a carve-out of global equities.
15
About Cohen & SteersCohen & Steers is a global investment manager specializing in liquid real assets, including real estate securities, listed infrastructure, commodities and natural resource equities, as well as preferred securities and other income solutions. Founded in 1986, the firm is headquartered in New York City, with offices in London, Hong Kong, Tokyo and Seattle.
Index DefinitionsAn investor cannot invest directly in an index and index performance does not reflect the deduction of any fees, expenses or taxes.The Thomson Reuters Datastream Global Infrastructure index is a custom index that utilizes Thomson Reuters’ indices on Global Utilities, Global Rails, Global Transportation Services, Global Pipelines, Telecom and Asia Travel & Tourism. The Thomson Reuters Datastream Global Equities index is a free-float-adjusted, market-capitalization-weighted indexes designed to serve as broad market benchmarks to track the performance of liquid equities worldwide. The BofA Merrill Lynch U.S. 7-10 Year Treasury Index is composed of U.S. Treasury Notes with a 7-10 year maturity. The Datastream World Gas, Water & Multi-Utilities Index is a global index of companies in these sectors compiled by Thomson Reuters Datastream. The Datastream World Pipelines Index is a global index of energy pipeline companies compiled by Thomson Reuters Datastream. The S&P 500 Index is an unmanaged index of 500 large-capitalization, publicly traded stocks representing a variety of industries. The Dow Jones Brookfield Global Infrastructure Index measures the stock performance of publicly listed infrastructure companies. Unless otherwise noted, asset classes mentioned in this material are represented by the following indexes: Global infrastructure: The FTSE Global Core Infrastructure 50/50 Net Tax Index is a market-capitalization-weighted index of worldwide infrastructure and infrastructure-related securities and is net of dividend withholding taxes. Constituent weights are adjusted semi-annually according to three broad industry sectors: 50% utilities, 30% transportation, and a 20% mix of other sectors, including pipelines, satellites, and telecommunication towers. The utilities sector excludes the subsector generation utilities. The index is free-float market-capitalization-weighted and is reconstituted annually with quarterly rebalances. Global stocks: MSCI World Index, a free-float-adjusted market-capitalization-weighted index that is designed to measure the equity market performance of developed markets.
Important DisclosuresData quoted represents past performance, which is no guarantee of future results. The views and opinions in the preceding commentary are as of the date of publication and are subject to change without notice. There is no guarantee that investors will experience the type of performance reflected in this commentary. There is no guarantee that any historical trend illustrated in this commentary will be repeated in the future, and there is no way to predict precisely when such a trend will begin. There is no guarantee that a market forecast made in this commentary will be realized. The views and opinions in the preceding commentary are as of the date of publication and are subject to change without notice. This material represents an assessment of the market environment at a specific point in time, should not be relied upon as investment advice and is not intended to predict or depict performance of any investment. We consider the information in this commentary to be accurate, but we do not represent that it is complete or should be relied upon as the sole source of suitability for investment. Investors should consult their advisors with respect to their individual circumstances.
These materials are provided for informational purposes only and reflect the views of Cohen & Steers, Inc. and sources believed by us to be reliable as of the date hereof. The mention of specific securities is not a recommendation or solicitation to buy, sell or hold any particular security.
Cohen & Steers Capital Management, Inc. (Cohen & Steers) is a registered investment advisory firm that provides investment management services to corporate retirement, public and union retirement plans, endowments, foundations and mutual funds.Cohen & Steers UK Limited is authorized and regulated by the Financial Conduct Authority (FRN 458459). Cohen & Steers Japan, LLC is a registered financial instruments operator (investment advisory and agency business with the Financial Services Agency of Japan and the Kanto Local Finance Bureau No. 2857) and is a member of the Japan Investment Advisers Association.
We believe accessing investment opportunities around the world requires local knowledge and insight into specialized and regional markets. Cohen & Steers maintains a global presence through the following offices:
Americas
NEW YORK
Corporate Headquarters280 Park Avenue, 10th Floor New York, New York 10017
Phone 212 832 3232 Fax 212 832 3622
SEATTLE
Cohen & Steers Capital Management, Inc.Skyline Tower, 10900 NE 4th Street Suites 2331–2332 Bellevue, Washington 98004
Phone 206 788 4240
Europe
LONDON
Cohen & Steers UK Limited50 Pall Mall, 7th Floor London SW1Y 5JH United Kingdom
Phone +44 207 460 6350
Asia Pacific
HONG KONG
Cohen & Steers Asia LimitedSuites 1201–02, Champion Tower 3 Garden Road Central, Hong Kong
Phone +852 3667 0080
TOKYO
Cohen & Steers Japan, LLCPacific Century Place, 16F 1-11-1 Marunouchi Chiyoda-ku Tokyo 100–6216 Japan