36
TIRED OF UNHEALTHY GRILLED CHEESE SANDWICHES?
| Date post: | 31-Dec-2015 |
| Category: |
Documents |
| Upload: | rosemary-small |
| View: | 215 times |
| Download: | 1 times |

TIRED OF UNHEALTHY GRILLED CHEESE SANDWICHES?

MARKETING RESULTS
Whitney Hall foods were the least favorite
Reasons why: poor taste poor quality poor nutrition
So we decided to alter the recipe of the
grilled cheese sandwich at Whitney Hall

OBJECTIVE
To make a healthier, better-tasting grilled cheese sandwich by altering the type of bread and using different fat content of one specific type of cheese

HYPOTHESIS
By using more nutritious bread and cheese with less fat, the taste and density of the sandwich will not be drastically changed and the nutrition and quality will be improved

TARGET AUDIENCE
People who eat at Whitney Dining Hall: Students Staff Faculty Local Residents Visitors Etc.

SIGNIFICANCE OF STUDY
To discover if a healthier version of grilled cheese can be made without compromising taste.

TWO SIMILAR STUDIES
Peer Reviewed Articles: Mediterranean Milk and Milk Products
Including Indigestible Carbohydrates in the Evening Meal of Healthy Subjects Improves Glucose Tolerance, Lowers Inflammatory Markers, and increases Satiety after a Subsequent Standardized Breakfast

MEDITERRANEAN MILK AND MILK PRODUCTS
Comparing: German cheese technique and Mediterranean techniqueGerman technique: Softer and made with
whey and creamMediterranean technique: use milk from
sheep, goat and buffalo. High in essential AA and lower in fat
Conclusion: Adding whey protein to low fat cheese is that in low-fat cheese it allows for sensory improvement and high nutritional value

INCLUDING INDIGESTIBLE CARBOHYDRATES IN THE EVENING MEAL OF HEALTHY SUBJECTS IMPROVES GLUCOSE TOLERANCE, LOWERS INFLAMMATORY MARKERS, AND INCREASES SATIETY AFTER A SUBSEQUENT STANDARDIZED BREAKFAST •This was done to find out how many indigestible carbohydrates affect glucose tolerance and satiety.•Barley kernel bread and white wheat flour bread enriched with barley improved glucose tolerance
•White wheat flour bread without the barley enrichment had no such affect
•The study also found that barley bread and enriched white wheat bread improved satiety

NUTRITIONAL DIFFERENCES
Total Calories: 331 Fat: 17g Sat. Fat: 8.5g Cholesterol: 60mg Sodium: 840mg Carbohydrate: 31g Sugar: 5g Fiber: 1g Protein: 11g
Total Calories: 300 Fat: 13g Sat. Fat: 6.5g Cholesterol: 35mg Sodium: 920mg Carbohydrate: 32g Sugar: 8g Fiber: 1g Protein: 13g
Treatment 1: Control Treatment 2: White bread/ 2% Cheese

NUTRITIONAL DIFFERENCES CON’T
Total Calories: 320 Fat: 12g Sat. Fat: 10g Cholesterol: 45mg Sodium: 820mg Carbohydrates: 27g Sugar: 7g Fiber: 3g Protein: 13g
Total Calories: 290 Fat: 13g Sat. Fat: 7g Cholesterol: 35mg Sodium: 890mg Carbohydrates: 29g Sugar: 9g Fiber: 3g Protein: 15g
Treatment 3: Whole wheat bread/ full fat cheese
Treatment 4: Whole wheat bread/ 2% cheese

VARIABLES
Density Salty Buttery Chewy Soft Mushy Creamy Oily Cheesy After Taste
Whole wheat bread vs. White Bread
Full fat cheese vs. 2% Cheese
Dependent Independent

CHARACTERISTICS OF TREATMENTS
INGREDIENTS
2 slices of white bread
2 slices of full fat cheese
½ TBSP salted butter
2 slices of white bread
2 slices of 2% cheese
½ TBSP salted butter
Treatment 1: Control
Treatment 2: White bread, 2% cheese

CHARACTERISTICS OF TREATMENTS
INGREDIENTS
2 slices of bread
2 slices of cheese
½ TBSP salted butter
2 slices of bread
2 slices of cheese
½ TBSP salted butter
Treatment 3: Whole Wheat bread, full
fat cheese
Treatment 4:Whole wheat bread, 2%
cheese

PROCEDURESUNIFORMITY Spread ¼ TBSP of butter on one side of each
slice of bread
Place 2 slices of cheese in between two slices of bread
Place sandwich on cast iron skillet and grill on each side until golden brown
Cover sandwich with lid until cheese is melted

PROCEDURESOBJECTIVE METHODS EXPERIMENTS Density
Take center piece of each treatmentUse the penetrometer to measure densityRecord dataEach treatment had 9 trials
3 sandwiches tested per treatment

PROCEDURESSENSORY EXPERIMENTS QDA
9-Point Hedonic Scale47 panelists rated each sandwich Each rating received a number
Disliked Very Much- 1Liked Very Much- 9


OBJECTIVE RESULTS
We used a penetrometer to determine how firm or soft the grilled cheese sandwiches were.
The results show that the most firm sandwich was the whole wheat/low fat cheese with an average penetration of 2.02 cm.
The least firm was the white bread/low fat cheese sandwich with an average penetration of 2.83 cm.

OBJECTIVE RESULTS
Average
White Bread/Regular Cheese 2.62 cm
White Bread/ Low Fat Cheese 2.83 cm
Whole Wheat Bread/ Regular Cheese 2.42 cm
Whole Wheat Bread/ Low Fat Cheese 2.02 cm

OBJECTIVE RESULTS INTERPRETED
The wheat bread is firmer than the white bread.
There is no significant difference in the firmness between the low fat and the full fat cheese.
The healthy sandwich is not completely opposite of the control sandwich in firmness and this confirms that the healthier sandwich does not have to be totally compromised from the control.
These results help confirm our hypothesis.

SENSOR RESULTS: HEDONIC SCALE
Groups Count Sum Average VarianceWhite Bread/ Full Fat Cheese 47 318 6.765957 1.922294Whole Wheat Bread/ Full Fat Cheese 47 330 7.021277 2.586494Whole Wheat Bread/ Low Fat Cheese 47 336 7.148936 1.912118White Bread/ Low Fat Cheese 47 331 7.042553 1.172063
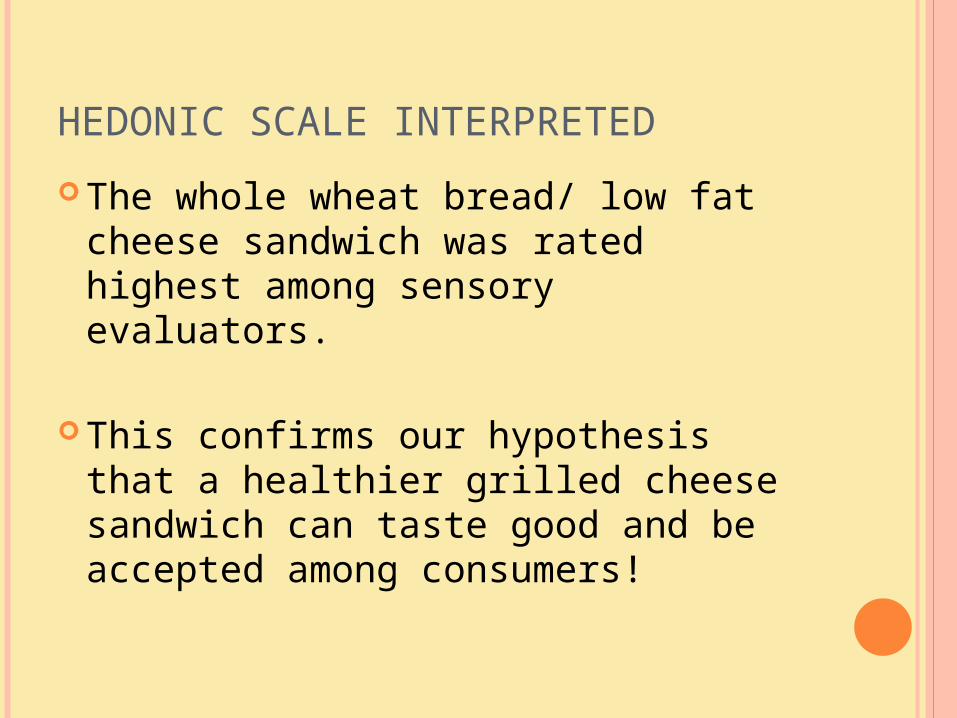
HEDONIC SCALE INTERPRETED
The whole wheat bread/ low fat cheese sandwich was rated highest among sensory evaluators.
This confirms our hypothesis that a healthier grilled cheese sandwich can taste good and be accepted among consumers!

QDA INTERPRETED
The higher the value, the less the attribute is sensed.
Salty Buttery Chewy Soft Dense Mushy Creamy OilyCheesy
After Taste
white bread/ full fat cheese 3.3 2.7 2.6 2.3 2.8 4 3.1 3.2 2.3
white bread/ low fat cheese 3.3 3 3 2.4 3.6 4 2.9 3.2 2.7
whole wheat
bread/ full fat cheese 3.3 2.5 2.5 3.2 2.7 3.7 2.8 2.8 2
whole wheat
bread/ low fat cheese 3.8 3.1 2.4 3.1 2.8 3.9 2.4 2.7 2.9

SENSORY RESULTS: QDA
Series 1= white bread/ full fat cheeseSeries 2= white bread/low fat cheeseSeries 3= whole wheat bread/ full fat cheeseSeries 4= whole wheat bread/ low fat cheese

QDA INTERPRETED
White bread is softer than wheat
Wheat bread sandwiches were chewier than white bread ones.
The full fat cheese sandwiches had higher attributes of cheesy after taste.
The whole wheat bread/ low fat healthy grilled cheese sandwich had the lowest attribute of butteryness.

QDA INTERPRETED
The range of perception of the panelists and the sandwiches was not wide.
All the attributes were within 1.5 points. The largest difference between the control
sandwich and the healthy version was a variance of 0.8 for softness.
This confirms our hypothesis that the sandwich attributes do not have to be compromised much for a healthier sandwich.

SUBJECTIVE EVALUATION OF PREFERENCE, DENSITY, SOFTNESS, AND CHEWINESS
Type of Grilled Cheese Sandwich Preference (1) Density (2) Softness (3) Chewy(4)
White Bread 6.8 + 1.9(a)
2.9 + 1.5(a)
2.3 + 2.3(a)
2.8 + 1.5(a)
Full Fat Cheese
White Bread 7.04 + 1.2(a)
3.7 + 1.7(a)
2.3 + 1.9(a)
3.3 + 2.2(a)
2% Cheese
Whole Wheat Bread
7.02 + 2.6(a)
2.8 + .9(a)
3.2 + 2.8(a)
2.4 + 1.1(a)
Full Fat Cheese
Whole Wheat Bread
7.1 + 1.9(a) 3 + 1.1(a) 3 + 3.2(a) 2.4 + .9(a)
2% Cheese

SUBJECTIVE EVALUATION OF PREFERENCE, DENSITY, SOFTNESS, AND CHEWINESS

OUR DATA RESULTS COMPARED TO THE LITERATURE
According to a grain of truth, wholegrain breads are more nutritious, which is why we chose whole wheat bread for our healthier version of the grilled cheese sandwich.
A traditional grilled cheese sandwich, consisting of two slices of white bread, two slices cheese, and two tablespoons butter, has 410 calories, 29 grams of fat, 18 grams of saturated fat, 840 mg. of sodium, and just 1 gram of fiber.

OUR DATA RESULTS COMPARED TO THE LITERATURE
Using whole-wheat bread, less cheese, and omitting the butter (which in our case we only changed 2 things and decided to choose low-fat cheese), reduces the calories by about 25%, 60% less fat, 70% less saturated fat, and 38% less sodium!

STUDY LIMITATIONS
The primary limitation to our study is that it was difficult to keep all the grilled cheese sandwiches the same temperature and freshness. By the time we would get to our fifth sandwich, our first sandwich would be cold.
We tried our best to solve this by putting our sandwiches at a low temperature in the oven to keep them all warm.

OBJECTIVE STUDY LIMITATIONS
Our objective results for the penetrometer could have been skewed from the sandwiches being cold from having to wait for other groups to use it and also there being a slight difference in the space between the probe and each sandwich

Conclusion
• Results were inconclusive
•Based on the P value of all tests, there was never a difference <0.05 or significant difference
• Promising that the variations of sandwiches were not detected
• Grilled Cheese may taste the same to people because variations not that different
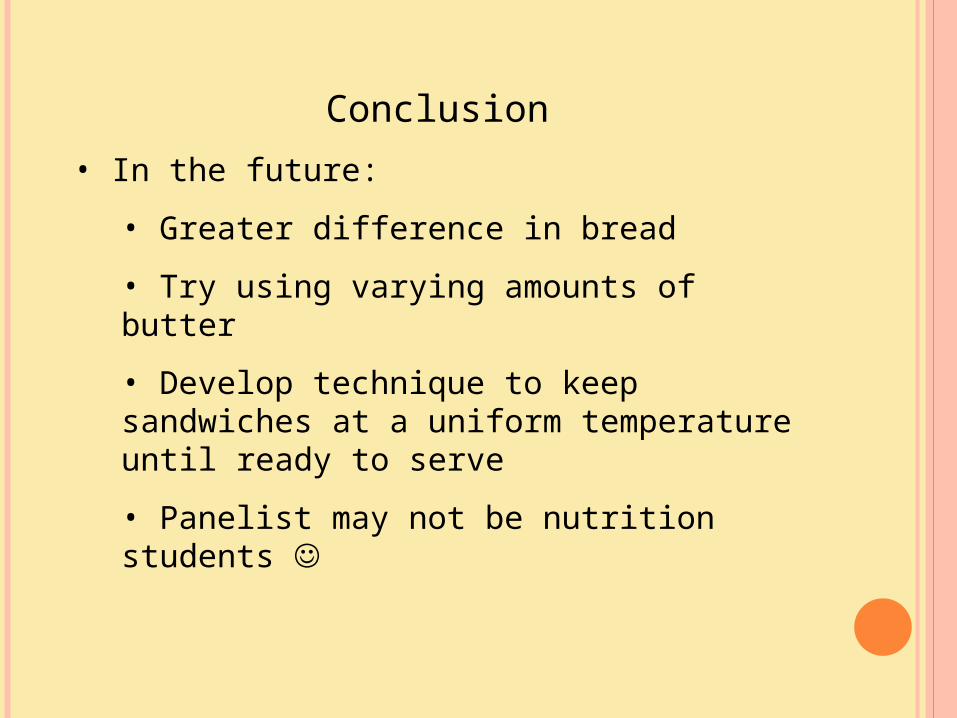
Conclusion
• In the future:
• Greater difference in bread
• Try using varying amounts of butter
• Develop technique to keep sandwiches at a uniform temperature until ready to serve
• Panelist may not be nutrition students

Conclusion
Further Research:
• More variety in the treatments
• Varied amounts of butter and butter alternatives
• Different types of bread and cheeses
• Larger group of panelist


