ARTICLES https://doi.org/10.1038/s41564-019-0659-3 1 Department of Developmental Biology and Cancer Research, Institute for Medical Research Israel-Canada, Hebrew University Medical School, Jerusalem, Israel. 2 Division of Epigenetics, DKFZ-ZMBH Alliance, German Cancer Research Center, Heidelberg, Germany. 3 Department of Immunology, The Weizmann Institute of Science, Rehovot, Israel. 4 The Lautenberg Center for Immunology, Institute for Medical Research Israel-Canada, Hebrew University Medical School, Jerusalem, Israel. 5 These authors jointly supervised this work: Frank Lyko, Yehudit Bergman. *e-mail: [email protected]D NA methylation is a chemical marking system for annotat- ing genetic information by causing gene expression changes through its ability to affect protein binding and chromatin structure 1 . Epigenetic mechanisms have recently been recognized as operating at the interface between the microbiota and the intestinal epithelial cell (IEC) genome 2–4 , and as a critical player in the patho- genesis of inflammatory bowel disease (IBD). Inflammatory dis- eases of the intestine induce a number of health-related problems, and decrease the quality of life in both developing and industrial- ized countries. Genome-wide association studies have linked over 160 genetic susceptibility loci to IBD 5 . However, the vast majority of these loci contribute to disease development with low odds ratios (1–1.15), suggesting a more limited genetic contribution to these disorders. Moreover, experiments with monozygotic twins revealed a low concordance of less than 50% for IBD within pairs 6 . It is well accepted that environmental factors are likely to play an important role in the development of IBD, and implicate epigenetic mecha- nisms, such as histone modifications and DNA methylation in nor- mal development 2,7,8 and disease pathogenesis 9 . The intestinal microbiota regulates intestinal physiology by modifying host gene expression throughout the intestine, but the underlying mechanisms have remained uncharacterized. Previously published genome-wide histone modification analyses showed that the microbiota regulates the chromatin landscape of several intestinal cell immune subpopulations 10,11 . We have now analysed the impact of commensal bacteria on the epigenetic DNA methylation landscapes of mouse IECs under normal and acute inflammatory conditions. Results Microbiota-induced gene expression changes. To determine the genome-wide impact of the commensal microbiota on host gene transcription in the gut epithelium, we analysed the mRNA tran- scriptome of intestinal epithelial cells (IECs) that were isolated from mouse colonic crypts (Supplementary Table 1). We compared germ-free (GF) mice that were reared since birth in the absence of microorganisms to age- and gender-matched conventionally (CNV) raised mice that were reared since birth in the presence of micro- organisms. Data analysis showed no general difference in immune gene expression (Supplementary Table 2) and FACS analyses revealed that the immune cell contribution is low in preparations of colonic crypt IECs (Supplementary Fig. 1a), suggesting negligible confounding by infiltration of immune cells. Principal component analysis indicated substantial similarity among the three CNV replicates as opposed to the three GF samples (Supplementary Fig. 1b). Differential gene expression analysis iden- tified 824 genes that were significantly (q ≤ 0.05 and ≥2-fold change) upregulated and 358 genes that were downregulated in CNV versus GF samples (Extended Data Fig. 1a), indicating substantial micro- biota-controlled gene expression. Gene Ontology (GO) analysis of the 358-downregulated genes revealed enrichment in extracellular matrix and metabolic processes (Extended Data Fig. 1b). Pathway analysis of the 824 upregulated genes revealed a highly significant enrichment of genes involved in mitotic cell division (Extended Data Fig. 1c), consistent with the previously published data showing that the crypt renewal rate in GF intestinal cells is attenuated 12,13 . In agree- ment with this finding, proliferation markers showed significantly increased expression levels in CNV crypts (Extended Data Fig. 1d,e). Altogether, our results clearly show that exposure of IECs to bacteria significantly affects multiple aspects of gut epithelial cell biology. Microbiota induces profound epigenetic changes at regulatory elements. To determine the genome-wide impact of the microbiota The microbiota programs DNA methylation to control intestinal homeostasis and inflammation Ihab Ansari 1 , Günter Raddatz 2 , Julian Gutekunst 2 , Meshi Ridnik 1 , Daphne Cohen 1 , Monther Abu-Remaileh 1 , Timur Tuganbaev 3 , Hagit Shapiro 3 , Eli Pikarsky 4 , Eran Elinav 3 , Frank Lyko 2,5 and Yehudit Bergman 1,5 * Although much research has been done on the diversity of the gut microbiome, little is known about how it influences intestinal homeostasis under normal and pathogenic conditions. Epigenetic mechanisms have recently been suggested to operate at the interface between the microbiota and the intestinal epithelium. We performed whole-genome bisulfite sequencing on conven- tionally raised and germ-free mice, and discovered that exposure to commensal microbiota induced localized DNA methylation changes at regulatory elements, which are TET2/3-dependent. This culminated in the activation of a set of ‘early sentinel’ response genes to maintain intestinal homeostasis. Furthermore, we demonstrated that exposure to the microbiota in dextran sodium sulfate-induced acute inflammation results in profound DNA methylation and chromatin accessibility changes at regu- latory elements, leading to alterations in gene expression programs enriched in colitis- and colon-cancer-associated functions. Finally, by employing genetic interventions, we show that microbiota-induced epigenetic programming is necessary for proper intestinal homeostasis in vivo. NATURE MICROBIOLOGY | www.nature.com/naturemicrobiology
Transcript
Articleshttps://doi.org/10.1038/s41564-019-0659-3
1Department of Developmental Biology and Cancer Research, Institute for Medical Research Israel-Canada, Hebrew University Medical School, Jerusalem, Israel. 2Division of Epigenetics, DKFZ-ZMBH Alliance, German Cancer Research Center, Heidelberg, Germany. 3Department of Immunology, The Weizmann Institute of Science, Rehovot, Israel. 4The Lautenberg Center for Immunology, Institute for Medical Research Israel-Canada, Hebrew University Medical School, Jerusalem, Israel. 5These authors jointly supervised this work: Frank Lyko, Yehudit Bergman. *e-mail: [email protected]
DNA methylation is a chemical marking system for annotat-ing genetic information by causing gene expression changes through its ability to affect protein binding and chromatin
structure1. Epigenetic mechanisms have recently been recognized as operating at the interface between the microbiota and the intestinal epithelial cell (IEC) genome2–4, and as a critical player in the patho-genesis of inflammatory bowel disease (IBD). Inflammatory dis-eases of the intestine induce a number of health-related problems, and decrease the quality of life in both developing and industrial-ized countries. Genome-wide association studies have linked over 160 genetic susceptibility loci to IBD5. However, the vast majority of these loci contribute to disease development with low odds ratios (1–1.15), suggesting a more limited genetic contribution to these disorders. Moreover, experiments with monozygotic twins revealed a low concordance of less than 50% for IBD within pairs6. It is well accepted that environmental factors are likely to play an important role in the development of IBD, and implicate epigenetic mecha-nisms, such as histone modifications and DNA methylation in nor-mal development2,7,8 and disease pathogenesis9.
The intestinal microbiota regulates intestinal physiology by modifying host gene expression throughout the intestine, but the underlying mechanisms have remained uncharacterized. Previously published genome-wide histone modification analyses showed that the microbiota regulates the chromatin landscape of several intestinal cell immune subpopulations10,11. We have now analysed the impact of commensal bacteria on the epigenetic DNA methylation landscapes of mouse IECs under normal and acute inflammatory conditions.
ResultsMicrobiota-induced gene expression changes. To determine the genome-wide impact of the commensal microbiota on host gene
transcription in the gut epithelium, we analysed the mRNA tran-scriptome of intestinal epithelial cells (IECs) that were isolated from mouse colonic crypts (Supplementary Table 1). We compared germ-free (GF) mice that were reared since birth in the absence of microorganisms to age- and gender-matched conventionally (CNV) raised mice that were reared since birth in the presence of micro-organisms. Data analysis showed no general difference in immune gene expression (Supplementary Table 2) and FACS analyses revealed that the immune cell contribution is low in preparations of colonic crypt IECs (Supplementary Fig. 1a), suggesting negligible confounding by infiltration of immune cells.
Principal component analysis indicated substantial similarity among the three CNV replicates as opposed to the three GF samples (Supplementary Fig. 1b). Differential gene expression analysis iden-tified 824 genes that were significantly (q ≤ 0.05 and ≥2-fold change) upregulated and 358 genes that were downregulated in CNV versus GF samples (Extended Data Fig. 1a), indicating substantial micro-biota-controlled gene expression. Gene Ontology (GO) analysis of the 358-downregulated genes revealed enrichment in extracellular matrix and metabolic processes (Extended Data Fig. 1b). Pathway analysis of the 824 upregulated genes revealed a highly significant enrichment of genes involved in mitotic cell division (Extended Data Fig. 1c), consistent with the previously published data showing that the crypt renewal rate in GF intestinal cells is attenuated12,13. In agree-ment with this finding, proliferation markers showed significantly increased expression levels in CNV crypts (Extended Data Fig. 1d,e). Altogether, our results clearly show that exposure of IECs to bacteria significantly affects multiple aspects of gut epithelial cell biology.
Microbiota induces profound epigenetic changes at regulatory elements. To determine the genome-wide impact of the microbiota
The microbiota programs DNA methylation to control intestinal homeostasis and inflammationIhab Ansari1, Günter Raddatz2, Julian Gutekunst2, Meshi Ridnik1, Daphne Cohen1, Monther Abu-Remaileh1, Timur Tuganbaev3, Hagit Shapiro3, Eli Pikarsky4, Eran Elinav 3, Frank Lyko 2,5 and Yehudit Bergman 1,5*
Although much research has been done on the diversity of the gut microbiome, little is known about how it influences intestinal homeostasis under normal and pathogenic conditions. Epigenetic mechanisms have recently been suggested to operate at the interface between the microbiota and the intestinal epithelium. We performed whole-genome bisulfite sequencing on conven-tionally raised and germ-free mice, and discovered that exposure to commensal microbiota induced localized DNA methylation changes at regulatory elements, which are TET2/3-dependent. This culminated in the activation of a set of ‘early sentinel’ response genes to maintain intestinal homeostasis. Furthermore, we demonstrated that exposure to the microbiota in dextran sodium sulfate-induced acute inflammation results in profound DNA methylation and chromatin accessibility changes at regu-latory elements, leading to alterations in gene expression programs enriched in colitis- and colon-cancer-associated functions. Finally, by employing genetic interventions, we show that microbiota-induced epigenetic programming is necessary for proper intestinal homeostasis in vivo.
on host DNA methylation we performed whole-genome bisul-fite sequencing (WGBS) on colonic crypt IECs (Supplementary Table 3). Data analysis revealed that global methylation levels were robustly reduced in the CNV samples as compared to GF (Fig. 1a and Extended Data Fig. 2a). We also compared the methyla-tion levels of promoters and canyons, two regulatory features that are commonly associated with 5' regions of genes14, and identi-fied slight but reproducible methylation changes (Extended Data Fig. 2b,c). As Hidden Markov Modelling also suggested the dif-ferential methylation of enhancers (Supplementary Table 4), we identified low-methylated regions (LMRs)15 in our datasets, which represent active regulatory regions. The CNV samples contained about 93,000 LMRs whereas the GF samples harboured only about 57,000 (Extended Data Fig. 2d). Further analysis revealed that the methylation level of 12,983 LMRs decreased in colonic crypt IECs isolated from CNV mice (designated hypomethylated LMRs), whereas only 3,115 increased their methylation level (hypermethyl-ated LMRs) (methylation difference >0.1) (Fig. 1b). We also vali-dated our WGBS data by targeted bisulfite analysis on GF and CNV colonic crypt DNA from additional mice, as well as on FACS-sorted IECs, which yielded similar results (Extended Data Fig. 2e). Our results suggest that exposure to the microbiota induces profound epigenetic changes at regulatory elements such as LMRs.
Since LMRs provide an opportunity to overlap DNA methylation changes with gene expression changes, we focused on intragenic LMRs, which allow the assignment of individual LMRs to specific genes16. We found that the majority of the LMRs associated with gene expression change underwent hypomethylation (554 LMRs
as compared to 154 LMRs that underwent de novo methylation). We focused further on the 300 LMRs that became hypomethylated in CNV mice and showed significantly (q ≤ 0.05) increased expres-sion, as this association is considered a direct effect of methylation on gene expression (Fig. 1c). Of note, these hypomethylated LMRs showed highly significant enrichment for binding sites of only three families of transcription factor: FoxA, Eklf and AP1—suggesting that this set of transcription factors is involved in integrating micro-biota-related signals (Fig. 1d). Indeed, FoxA and Eklf transcription factors play an important role in gut development, morphology and homeostasis, while AP1 transcription factors are critical in cell proliferation, differentiation, inflammation, transformation, cell migration, and apoptosis17–20.
The 300 genes that were upregulated in CNV mice were enriched in the GO terms ‘mouse colitis’, ‘human inflammatory bowel disease’ and ‘human senescence’ (Fig. 1e). Examination of the upregulated genes in these three categories suggests that exposure to commen-sal microbiota leads to LMR demethylation and transcriptional acti-vation of an ‘early’ set of inflammatory genes, designated ‘sentinel inflammatory genes’, that are likely to drive normal intestinal homeo-stasis. This set of genes includes IFITM3 (2.9-fold up, q = 8.65 × 10⁻⁹), NOS2 (15.6-fold up, q = 5.32 × 10⁻²⁸) and PLA2G2A (15.5-fold up, q = 2.91×10−69), which are all known to be microbiota-induced and involved in antibacterial and anti-inflammatory responses21–23.
Acute colitis in CNV mice induces DNA hypomethylation. Administration of dextran sodium sulfate (DSS) alters the intestinal mucus layers and allows bacterial infiltration into the inner layer
Num
ber
of g
enes
Up Down Up Down0
100
200
300
400
55 66
300
254
Hypermethylated Hypomethylated
Met
hyla
tion
ratio
GFCNV
0.0
0.2
0.4
0.6
0.80.72
0.69
a b c
d e
0.6
0.45
0.3
0.15
0
GF
Counts
0 0.15 0.3 0.45 0.6
3,115
12,983
0 40C
NV
0 5 10 15
FRA1KLF9AP1
KLF5FOXM1
KLF4FOXA1
EKLFFOXA2
–log[P value]
0 1 2 3 4 5
Osteoarthritis
Senescence
Inflammatory bowel disease
Colitis
–log[adjusted P value]
Fig. 1 | WGBS of colonic crypt cells isolated from GF versus CNV mice. a, Average global DNA methylation ratios are shown for GF (n = 2) and CNV (n = 2) samples, respectively. b, Comparison of average LMR methylation levels in CNV and GF mice. The upper dashed line indicates the positions in the plot where CNV is exactly 0.1 hypermethylated compared to GF, and the lower line indicates the same for hypomethylation. There are 3,115 LMRs that are more than 0.1 hypermethylated in CNV versus GF, and 12,983 that are more than 0.1 hypomethylated. c, Bar graph showing the number of up- and downregulated genes that are associated with hyper- and hypomethylated LMRs in CNV compared to GF. d, Motif analysis of the hypomethylated LMRs (n = 300) associated with upregulated genes in CNV versus GF samples; motifs with the highest scores are listed (P values were calculated using a hypergeometrical test). e, Diseases associated with the upregulated genes (n = 300) containing hypomethylated LMRs in CNV compared to GF samples (P values were calculated using two-tailed Fisher’s exact test; adjusted P value calculated using the Benjamini–Hochberg method for correction for multiple hypotheses testing).
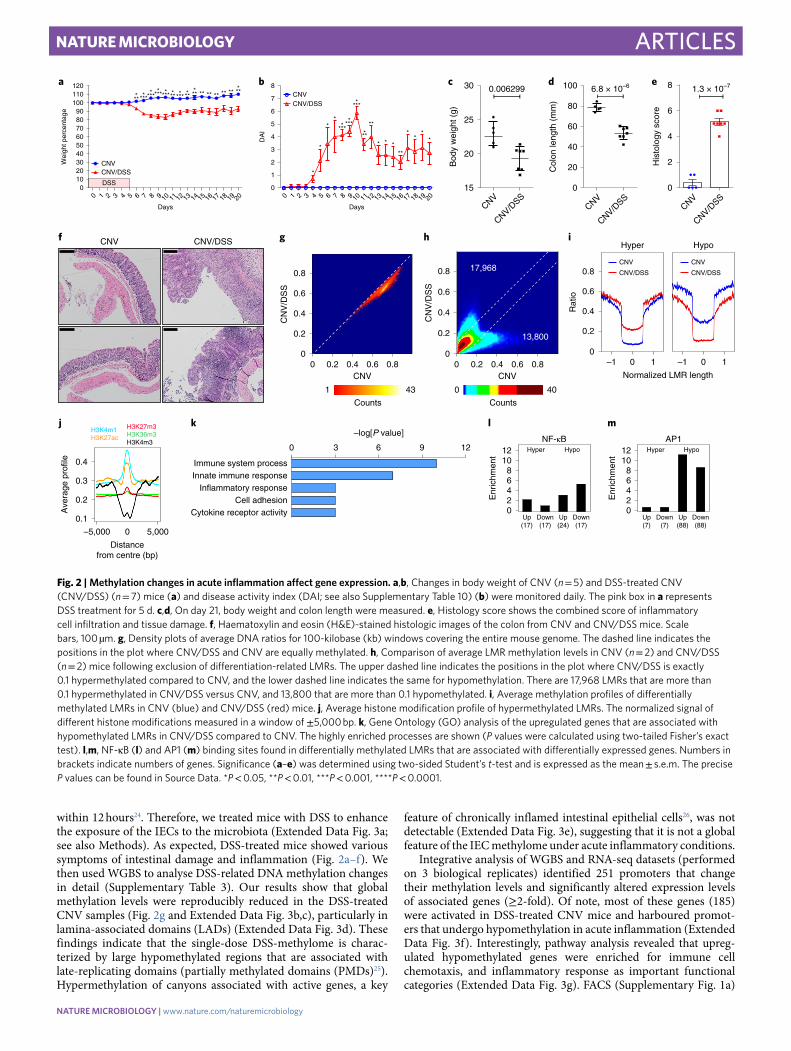
within 12 hours24. Therefore, we treated mice with DSS to enhance the exposure of the IECs to the microbiota (Extended Data Fig. 3a; see also Methods). As expected, DSS-treated mice showed various symptoms of intestinal damage and inflammation (Fig. 2a–f). We then used WGBS to analyse DSS-related DNA methylation changes in detail (Supplementary Table 3). Our results show that global methylation levels were reproducibly reduced in the DSS-treated CNV samples (Fig. 2g and Extended Data Fig. 3b,c), particularly in lamina-associated domains (LADs) (Extended Data Fig. 3d). These findings indicate that the single-dose DSS-methylome is charac-terized by large hypomethylated regions that are associated with late-replicating domains (partially methylated domains (PMDs)25). Hypermethylation of canyons associated with active genes, a key
feature of chronically inflamed intestinal epithelial cells26, was not detectable (Extended Data Fig. 3e), suggesting that it is not a global feature of the IEC methylome under acute inflammatory conditions.
Integrative analysis of WGBS and RNA-seq datasets (performed on 3 biological replicates) identified 251 promoters that change their methylation levels and significantly altered expression levels of associated genes (≥2-fold). Of note, most of these genes (185) were activated in DSS-treated CNV mice and harboured promot-ers that undergo hypomethylation in acute inflammation (Extended Data Fig. 3f). Interestingly, pathway analysis revealed that upreg-ulated hypomethylated genes were enriched for immune cell chemotaxis, and inflammatory response as important functional categories (Extended Data Fig. 3g). FACS (Supplementary Fig. 1a)
CN
V/D
SS
CNV
Counts Counts
0 0.2 0.4 0.6 0.8
1 43
g h i
j
0.8
0.6
0.4
0.2
0
CNV0 0.2 0.4 0.6 0.8
17,968
13,800
0 40
CN
V/D
SS
Hyper Hypo
0.8
0.6
0.4
0.2
0
Rat
io
Normalized LMR length
–1 0 1 –1 0 1
CNV/DSS
CNV
CNV/DSS
CNV
0.3
0.2
0.1
Ave
rage
pro
file
–5,000 0 5,000
0.4
H3K4m1H3K27ac
H3K27m3H3K36m3H3K4m3
Distancefrom centre (bp)
Enr
ichm
ent
Hyper
Up(17)
Down(17)
1210
86
0
42
Down(17)
Up(24)
NF-κBHypo
AP1Hyper
Up(7)
Down(88)
Down(7)
Up(88)
Hypo0 12
Cytokine receptor activityCell adhesion
Inflammatory responseInnate immune responseImmune system process
Fig. 2 | Methylation changes in acute inflammation affect gene expression. a,b, Changes in body weight of CNV (n = 5) and DSS-treated CNV (CNV/DSS) (n = 7) mice (a) and disease activity index (DAI; see also Supplementary Table 10) (b) were monitored daily. The pink box in a represents DSS treatment for 5 d. c,d, On day 21, body weight and colon length were measured. e, Histology score shows the combined score of inflammatory cell infiltration and tissue damage. f, Haematoxylin and eosin (H&E)-stained histologic images of the colon from CNV and CNV/DSS mice. Scale bars, 100 µm. g, Density plots of average DNA ratios for 100-kilobase (kb) windows covering the entire mouse genome. The dashed line indicates the positions in the plot where CNV/DSS and CNV are equally methylated. h, Comparison of average LMR methylation levels in CNV (n = 2) and CNV/DSS (n = 2) mice following exclusion of differentiation-related LMRs. The upper dashed line indicates the positions in the plot where CNV/DSS is exactly 0.1 hypermethylated compared to CNV, and the lower dashed line indicates the same for hypomethylation. There are 17,968 LMRs that are more than 0.1 hypermethylated in CNV/DSS versus CNV, and 13,800 that are more than 0.1 hypomethylated. i, Average methylation profiles of differentially methylated LMRs in CNV (blue) and CNV/DSS (red) mice. j, Average histone modification profile of hypermethylated LMRs. The normalized signal of different histone modifications measured in a window of ±5,000 bp. k, Gene Ontology (GO) analysis of the upregulated genes that are associated with hypomethylated LMRs in CNV/DSS compared to CNV. The highly enriched processes are shown (P values were calculated using two-tailed Fisher’s exact test). l,m, NF-κB (l) and AP1 (m) binding sites found in differentially methylated LMRs that are associated with differentially expressed genes. Numbers in brackets indicate numbers of genes. Significance (a–e) was determined using two-sided Student’s t-test and is expressed as the mean ± s.e.m. The precise P values can be found in Source Data. *P < 0.05, **P < 0.01, ***P < 0.001, ****P < 0.0001.
and RNA-seq (Supplementary Table 5) showed that the immune cell contribution is low in our DSS samples, suggesting that the observed gene expression changes are likely to be due to epigenetic reprogramming of IECs. Finally, our set of 185 genes, which was robustly enriched in colitis and colon cancer GO terms (Extended Data Fig. 3h), may provide a mechanistic link between epigenetic changes, inflammation and cancer27.
Acute colitis induces profound changes at epigenetic regulatory elements. To further decipher CNV/DSS-dependent changes, we analysed LMR methylation levels. Out of 131,133 LMRs, 20,061 were hypermethylated (methylation difference >0.1) in the CNV/DSS samples, whereas 14,585 were hypomethylated (Extended Data Fig. 4a and Supplementary Table 6). A highly similar result was obtained when differentiation-related LMRs28 were excluded from the analysis (Fig. 2h), indicating that differentiation-related LMRs28 do not contribute significantly to the inflammation-induced methylation changes. Moreover, results from WGBS analyses were validated on five different LMRs using FACS-sorted IECs (Extended Data Fig. 4b), as well as crypt cells from CNV and CNV/DSS mice raised in a different animal house (Extended Data Fig. 4c–i). Inflammation-associated methylation changes usually extend over the entire length of the LMR (Fig. 2i). Furthermore, Hidden Markov Modelling revealed a consistent DSS-dependent hypomethylation for primed, active and intragenic enhancer seg-ments (Supplementary Table 7). Finally, differentially methylated LMRs were distinctly enriched for the enhancer chromatin marks H3K4me1 and H3K27ac, and strongly depleted for the active pro-moter mark H3K4me3 (Fig. 2j). Together, these results suggest that acute inflammation induces profound epigenetic changes at puta-tive enhancer regions. Further analysis identified a subset of 373 genes with significantly (q ≤ 0.05) increased expression and with LMRs that became hypomethylated in DSS-treated CNV mice. These genes showed a clear enrichment of immune response path-ways (Fig. 2k), whereas the 181 hypomethylated LMRs with reduced expression showed no GO enrichment.
LMRs that were associated with differentially expressed genes showed a highly significant enrichment for a variety of predicted transcription factor binding sites (Supplementary Table 8), includ-ing two paradigmatic factors for inflammatory responses: NF-κB and AP1 (Fig. 2l,m). NF-κB binding sites were 3.4-fold enriched among hypomethylated LMRs associated with upregulated genes and 5.5−fold enriched among hypomethylated LMRs associated with downregulated genes, consistent with the dual function of NF-κB as a transcriptional activator and repressor29. A comparable enrichment could not be observed for hypermethylated LMRs, which is in agreement with selective inflammation-induced bind-ing of NF-κB to hypomethylated LMRs30. Even stronger effects were observed for AP1 binding sites, which were 11.3-fold enriched among hypomethylated LMRs associated with upregulated genes and 8.8-fold enriched among hypomethylated LMRs associated with downregulated genes. Again, no enrichment could be observed for hypermethylated LMRs. DSS-induced hypomethylation at LMRs that contained NF-κB or AP1 binding sites appeared pronounced and extended over the entire length of the LMR (Extended Data Fig. 4j). Thus, acute inflammation induced by mucosal barrier dis-ruption induces extensive methylation changes in enhancer regions, which are associated with an altered activity of major inflammatory transcriptional networks.
Overlapping chromatin accessibility, methylation and expression datasets in acute inflammation in CNV mice. Since expression is usually correlated with local changes in chromatin accessibility, we carried out a genome-wide ATAC-seq analysis (Supplementary Table 9) and identified 469 significantly differential peaks in CNV and 21,925 in DSS/CNV IECs. Of the latter, 4,122 overlapped with
hypomethylated CNV/DSS-specific LMRs (Fig. 3a), which were associated with 391 significantly upregulated genes. These genes are enriched in acute and innate inflammatory responses in mouse (Fig. 3b) as well as human colitis and colon cancer (Fig. 3c), con-firming our genome-wide methylation analysis. Of note, AP1 transcription factor binding sites were highly enriched in these ATAC-seq peaks (Fig. 3d). An example from this set of genes is Myd88. It is associated with a hypomethylated LMR, a DSS-unique ATAC-seq peak and activated expression in DSS-treated CNV mice (Fig. 3e). Myd88 is involved in bacteria sensing and functions as a downstream adapter protein of the Toll-like-receptor signalling pathway including TLR4, which is known to interact with bacte-rial lipopolysaccharides (LPS)31. Our results thus demonstrate that microbiota-related regulation of host intestinal epithelium genes is mechanistically linked to chromatin accessibility.
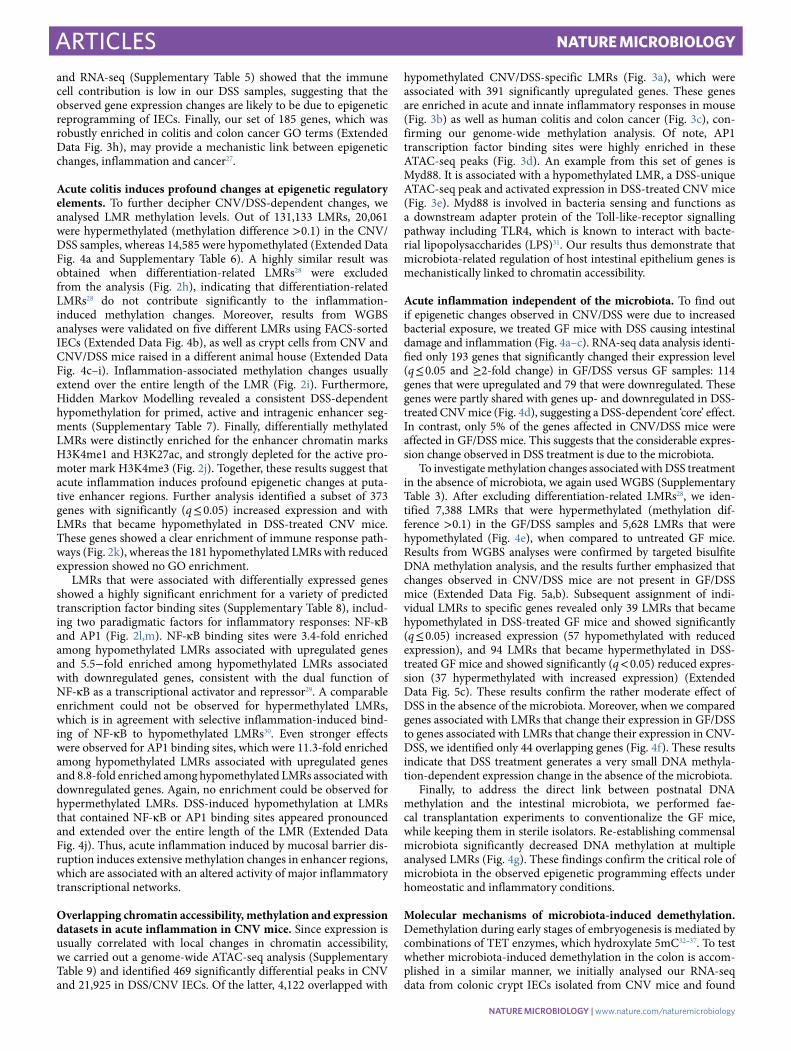
Acute inflammation independent of the microbiota. To find out if epigenetic changes observed in CNV/DSS were due to increased bacterial exposure, we treated GF mice with DSS causing intestinal damage and inflammation (Fig. 4a–c). RNA-seq data analysis identi-fied only 193 genes that significantly changed their expression level (q ≤ 0.05 and ≥2-fold change) in GF/DSS versus GF samples: 114 genes that were upregulated and 79 that were downregulated. These genes were partly shared with genes up- and downregulated in DSS-treated CNV mice (Fig. 4d), suggesting a DSS-dependent ‘core’ effect. In contrast, only 5% of the genes affected in CNV/DSS mice were affected in GF/DSS mice. This suggests that the considerable expres-sion change observed in DSS treatment is due to the microbiota.
To investigate methylation changes associated with DSS treatment in the absence of microbiota, we again used WGBS (Supplementary Table 3). After excluding differentiation-related LMRs28, we iden-tified 7,388 LMRs that were hypermethylated (methylation dif-ference >0.1) in the GF/DSS samples and 5,628 LMRs that were hypomethylated (Fig. 4e), when compared to untreated GF mice. Results from WGBS analyses were confirmed by targeted bisulfite DNA methylation analysis, and the results further emphasized that changes observed in CNV/DSS mice are not present in GF/DSS mice (Extended Data Fig. 5a,b). Subsequent assignment of indi-vidual LMRs to specific genes revealed only 39 LMRs that became hypomethylated in DSS-treated GF mice and showed significantly (q ≤ 0.05) increased expression (57 hypomethylated with reduced expression), and 94 LMRs that became hypermethylated in DSS-treated GF mice and showed significantly (q < 0.05) reduced expres-sion (37 hypermethylated with increased expression) (Extended Data Fig. 5c). These results confirm the rather moderate effect of DSS in the absence of the microbiota. Moreover, when we compared genes associated with LMRs that change their expression in GF/DSS to genes associated with LMRs that change their expression in CNV-DSS, we identified only 44 overlapping genes (Fig. 4f). These results indicate that DSS treatment generates a very small DNA methyla-tion-dependent expression change in the absence of the microbiota.
Finally, to address the direct link between postnatal DNA methylation and the intestinal microbiota, we performed fae-cal transplantation experiments to conventionalize the GF mice, while keeping them in sterile isolators. Re-establishing commensal microbiota significantly decreased DNA methylation at multiple analysed LMRs (Fig. 4g). These findings confirm the critical role of microbiota in the observed epigenetic programming effects under homeostatic and inflammatory conditions.
Molecular mechanisms of microbiota-induced demethylation. Demethylation during early stages of embryogenesis is mediated by combinations of TET enzymes, which hydroxylate 5mC32–37. To test whether microbiota-induced demethylation in the colon is accom-plished in a similar manner, we initially analysed our RNA-seq data from colonic crypt IECs isolated from CNV mice and found
that TET1 is not expressed, whereas TET2 and TET3 (TET2/3) are expressed (Extended Data Fig. 6a). We then tested whether TET2/3 expression levels vary between colonic crypt IECs derived from GF versus CNV. Indeed, TET3 (but not TET2) was expressed significantly higher in CNV versus GF. Furthermore, treatment of CNV mice with antibiotics decreased TET3 expression to GF levels (Extended Data Fig. 6b), while DSS treatment of mice and LPS treatment of colonic organoids upregulated TET3 expression levels (Extended Data Fig. 6a,c), linking intestinal microbiota to TET3 expression.
In subsequent experiments we therefore crossed Tet2/3fl/fl mice38,39 with animals expressing the CRE recombinase under the control of the intestinal-specific Villin promoter40 to obtain mice with a tissue-specific knockout of these enzymes in the intestinal
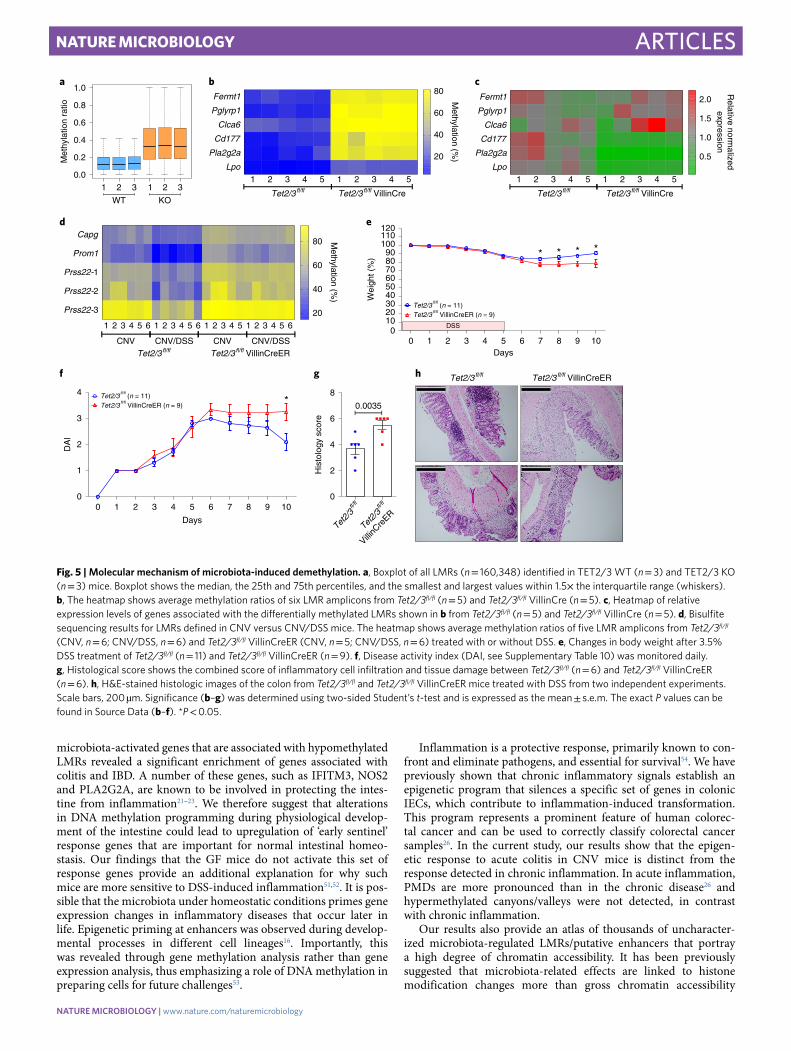
epithelium (Tet2/3fl/fl VillinCre). We then isolated crypt IECs from colons of Tet2/3fl/fl (designated WT) and KO mice, and performed WGBS (Supplementary Table 3). Our results showed that global methylation levels were markedly elevated in the Tet2/3 KO samples (Fig. 5a and Extended Data Fig. 6d–f), which were further validated by targeted bisulfite sequencing on six of our microbiota-induced hypomethylated LMRs (Fig. 5b). These results show that TET2/3 play a key role in microbiota-induced demethylation.
RT-PCR analysis of six genes associated with the hypermethyl-ated LMRs in the KO mice showed that transcription of three genes was significantly reduced in all mutant animals (Fig. 5c), indicating that TET2/3-mediated demethylation at these regulatory sequences plays a direct role in gene induction. The other three genes showed variable expression in the mutant mice, suggesting that either these
UCSC Genes (RefSeq, GenBank, tRNAs and Comparative Genomics)
Combined peaks
ATAC_DSS peaks
Combined ATAC-seq signals CNV/DSS
ATAC_control peaks
Combined ATAC-seq signals CNV
LMRs in control
LMRs in DSS
Myd88 Acaa1a
DSS-merged
250 _
0
Water-merged
250 _
0
ATAC-DSS peaks
ATAC-control peaks
Fig. 3 | ATAC-seq analysis of intestinal colitis. a, Venn diagrams of differential ATAC peaks and unique LMRs for CNV/DSS mice. b, GO analysis of the upregulated genes (n = 391) in CNV/DSS compared to CNV. The highly enriched processes are shown (P values were calculated using two-tailed Fisher’s exact test). c, Diseases related to the upregulated genes (n = 391) associated with hypomethylated LMRs in CNV/DSS compared to CNV samples (P values were calculated using two-tailed Fisher’s exact test, adjusted P value calculated using the Benjamini–Hochberg method for correction for multiple hypotheses testing). d, The list shows the top of motifs enriched for transcription factor binding sites in the unique ATAC-seq peaks that contain hypomethylated LMRs and are associated with upregulated genes (n = 391) in CNV/DSS samples. All sequences belong to members of the AP1 family of transcription factors (P values were calculated using a hypergeometrical test). e, Displayed is a ~10 kbp genomic region up- and downstream of Myd88 in the UCSC genome browser (mm9). Red and blue boxes represent potential ATAC peak regions. Peak signals are shown in the corresponding colours beneath predicted regions. LMRs for each group are provided in the last two tracks, coloured in black. Myd88 represents a gene characterized by a unique ATAC-seq peak in CNV/DSS associated with an upregulated gene. The hypomethylated LMR is in the centre of the peak.
LMRs do not regulate their associated genes, or that additional regulatory elements are involved.
Since these LMR-associated genes most likely play a role in intestinal homeostasis in the CNV colon, we next asked whether TET2/3 KO mice are more sensitive to DSS treatment, similar to GF animals. To this end, we generated TET2/3 inducible mutant mice. We crossed Tet2/3fl/fl mice with animals expressing the CRE recombinase under control of the intestinal-specific Villin promoter that can be activated by administration of tamoxifen to the animal (CreER)41. To examine whether the TET2/3 deletion inhibits the demethylation reaction, we carried out targeted bisulfite sequenc-ing on five DSS-induced hypomethylated LMRs. This revealed that all tested LMRs failed to undergo demethylation in the DSS-treated TET2/3 double-KO mice, compared with Tet2/3fl/fl control mice (Fig. 5d). Furthermore, the Tet2/3 mutants were more susceptible to the DSS treatment than Tet2/3fl/fl mice, as evidenced by disease activ-ity, weight loss and histological analysis (Fig. 5e–h). This is consis-tent with the notion that the microbiota-dependent demethylation is mediated by TET2/3, and that the mutant mice had a reduced response to inflammatory challenges compared to WT animals.
DiscussionThe diversity and composition of intestinal microbiomes have been studied for over a decade, but their precise roles in maintaining
tissue homeostasis and influencing host epigenetics are still poorly understood. DNA methylation is known to play an important role in controlling intestinal homeostasis and differentiation3,7,28,42. We have studied the effect of the intestinal microbiota on the epigenetic landscape of the IECs under homeostasis and in acute inflamma-tion. While it has been shown previously that the intestinal micro-biota affects the DNA methylation of a small subset of genes3,43, here we show how the microbiota shapes the IEC methylome at the global level, thus contributing to intestinal health and homeosta-sis44. Our results support a direct link between putative enhancer methylation and the microbiota.
The LMRs identified in our analyses are distinct from both the maturation-associated differentially methylated regions (DMRs) that identify DNA methylation changes in the intestine as a function of age, and the differentiation-associated DMRs, which distinguish Lgr5-positive stem cells and differentiated epithelial cells3,28,45,46. LMRs identified in this study showed a highly significant enrich-ment for transcription factor binding sites, such as the FoxA family members that have been termed ‘pioneering’ transcription factors47, and KLF4 and KLF5, which play a major role in intestinal develop-ment and homeostasis48,49. Recently, it has been shown that KLF4 is also a ‘pioneering’ factor that interacts directly with TET2 and recruits the enzyme to specific DNA sites, prior to chromatin open-ing50. Moreover, pathway analysis on the hundreds of commensal
DN
A m
ethy
latio
n (%
)
CD177
Pla2g2
aR28
4R81
0
20
40
60
80
100 GFCNVexGF
**
**
***
******
*********
0.8
0.6
0.4
0.2
0
GF
/DS
S
GF
Counts
0 0.2 0.4 0.6 0.8
7,388
5,628
0 40
481
1,034
00
0
00
55
540
30
756
5
GF/DSSUp
CNV/DSSDown
GF/DSSDown
CNV/DSSUp
0
1,419 183
44
CNV/DSS-specificLMRs
GF/DSS-specificLMRs
a cC
olon
leng
th (
mm
)
60
70
80
90
100
110
0.0095
GF/DSSGF
GF
GF/DSS
His
tolo
gy s
core
GF GF/DSS0
2
4
6
8
2.6 × 10⁻⁷
b
d fe g
Fig. 4 | Expression and methylation changes of inflamed colon in the absence of microbiota. a, Colon length from GF (n = 7) and GF/DSS) (n = 8) mice was compared. b, Histology score shows the combined score of inflammatory cell infiltration and tissue damage. c, H&E-stained histologic images of the colon from GF and GF/DSS mice. Scale bars, 100 µm. d, Venn diagram of activated and repressed genes in GF/DSS normalized to GF and CNV/DSS normalized to CNV. e, Density plot of the average LMR methylation levels in GF and GF/DSS mice. The upper dashed line indicates the positions in the plot where GF/DSS is exactly 0.1 hypermethylated compared to GF, and the lower dashed line indicates the same for 0.1 hypomethylated. There are 7,388 LMRs that are more than 0.1 hypermethylated in CNV/DSS versus CNV, and 5,628 that are more than 0.1 hypomethylated. f, Pie chart indicating the number of up- and downregulated genes that are associated with hypermethylated and hypomethylated LMRs in GF/DSS compared to GF mice. g, Quantification of targeted bisulfite sequencing results for four representative LMRs amplicons (2–4 CpGs). IECs were derived from GF mice (n = 5), CNV (n = 5) and exGF (GF following faecal transplantation, n = 5). Significance (a,b,g) was determined using two-sided Student’s t-test and is expressed as the mean ± s.e.m. The exact P values can be found in Source Data. *P < 0.05, **P < 0.01, ***P < 0.001, ****P < 0.0001.
microbiota-activated genes that are associated with hypomethylated LMRs revealed a significant enrichment of genes associated with colitis and IBD. A number of these genes, such as IFITM3, NOS2 and PLA2G2A, are known to be involved in protecting the intes-tine from inflammation21–23. We therefore suggest that alterations in DNA methylation programming during physiological develop-ment of the intestine could lead to upregulation of ‘early sentinel’ response genes that are important for normal intestinal homeo-stasis. Our findings that the GF mice do not activate this set of response genes provide an additional explanation for why such mice are more sensitive to DSS-induced inflammation51,52. It is pos-sible that the microbiota under homeostatic conditions primes gene expression changes in inflammatory diseases that occur later in life. Epigenetic priming at enhancers was observed during develop-mental processes in different cell lineages16. Importantly, this was revealed through gene methylation analysis rather than gene expression analysis, thus emphasizing a role of DNA methylation in preparing cells for future challenges53.
Inflammation is a protective response, primarily known to con-front and eliminate pathogens, and essential for survival54. We have previously shown that chronic inflammatory signals establish an epigenetic program that silences a specific set of genes in colonic IECs, which contribute to inflammation-induced transformation. This program represents a prominent feature of human colorec-tal cancer and can be used to correctly classify colorectal cancer samples26. In the current study, our results show that the epigen-etic response to acute colitis in CNV mice is distinct from the response detected in chronic inflammation. In acute inflammation, PMDs are more pronounced than in the chronic disease26 and hypermethylated canyons/valleys were not detected, in contrast with chronic inflammation.
Our results also provide an atlas of thousands of uncharacter-ized microbiota-regulated LMRs/putative enhancers that portray a high degree of chromatin accessibility. It has been previously suggested that microbiota-related effects are linked to histone modification changes more than gross chromatin accessibility
Fig. 5 | Molecular mechanism of microbiota-induced demethylation. a, Boxplot of all LMRs (n = 160,348) identified in TET2/3 WT (n = 3) and TET2/3 KO (n = 3) mice. Boxplot shows the median, the 25th and 75th percentiles, and the smallest and largest values within 1.5× the interquartile range (whiskers). b, The heatmap shows average methylation ratios of six LMR amplicons from Tet2/3fl/fl (n = 5) and Tet2/3fl/fl VillinCre (n = 5). c, Heatmap of relative expression levels of genes associated with the differentially methylated LMRs shown in b from Tet2/3fl/fl (n = 5) and Tet2/3fl/fl VillinCre (n = 5). d, Bisulfite sequencing results for LMRs defined in CNV versus CNV/DSS mice. The heatmap shows average methylation ratios of five LMR amplicons from Tet2/3fl/fl (CNV, n = 6; CNV/DSS, n = 6) and Tet2/3fl/fl VillinCreER (CNV, n = 5; CNV/DSS, n = 6) treated with or without DSS. e, Changes in body weight after 3.5% DSS treatment of Tet2/3fl/fl (n = 11) and Tet2/3fl/fl VillinCreER (n = 9). f, Disease activity index (DAI, see Supplementary Table 10) was monitored daily. g, Histological score shows the combined score of inflammatory cell infiltration and tissue damage between Tet2/3fl/fl (n = 6) and Tet2/3fl/fl VillinCreER (n = 6). h, H&E-stained histologic images of the colon from Tet2/3fl/fl and Tet2/3fl/fl VillinCreER mice treated with DSS from two independent experiments. Scale bars, 200 µm. Significance (b–g) was determined using two-sided Student’s t-test and is expressed as the mean ± s.e.m. The exact P values can be found in Source Data (b–f). *P < 0.05.
(DNaseI hypersensitivity) changes45,46. Our results demonstrate that microbiota-dependent regulation of IEC genes is mechanisti-cally linked to DNA methylation and to chromatin accessibility, as determined by ATAC-seq. This provides another important layer in the regulation of intestinal host genes involved in physiology and human disease.
Finally, our study shows that in acute inflammation the microbi-ota induces TET2/3-dependent enhancer demethylation. Indeed, the number of LMR-regulated genes in the GF/DSS mice was small (237) as compared with those changed in DSS-treated CNV mice (2,463), indicating that most of the methylation-dependent gene expression alterations detected in CNV/DSS mice are due to TET2/3-dependent microbiota exposure. Remarkably, this microbiota-induced epigene-tic transition plays a critical role in re-establishing homeostasis, as evidenced by increased disease severity following depletion of TET2/3.
MethodsPreparation of samples. Male mice (C57BL/6) were obtained from Harlan Laboratory (Israel) at 6-7 weeks of age. One week prior to DSS treatment the mice received regular water for adaptation. For inflammation induction, mice were given 2% of 36–50 kDa DSS (MP Biomedicals) for 5 days in their drinking water. On day 6 mice received water and were kept for an additional 16 days. Body weight, stool consistency and the presence of gross blood in faeces were evaluated daily and scored for each mouse during the experimental period. The disease activity index (DAI) was calculated by the total score (body weight decrease + stool consistency + rectal bleeding) (Supplementary Table 10). Mice were also scored for colonic shortening, intestinal ulceration and loss of crypt architecture. Mice were housed and cared for under SPF conditions. The Animal Care and Use Committee of The Hebrew University of Jerusalem approved all animal procedures.
Germ-free (GF) mice were generated in the Weizmann Institute GF facility and routinely monitored for sterility; at 7-8 weeks, GF mice were transferred into sterile iso-cages55. For inflammation induction, mice were given 1% of 36–50 kDa DSS (MP Biomedicals) for 5 days in their drinking water, and then left for two weeks with regular drinking water. These treatment conditions are suitable for GF mice survival. Adult GF male mice (8 weeks old) (C57BL/6) served as recipients for faecal transplants and were housed in sterile isolators (Park Bioservices). Mice were euthanised at 11 weeks of age.
For faecal transplantation experiments, 100 mg of stool (from mouse pellets) was re-suspended in 1 ml of PBS under anaerobic conditions. Homogenous faecal solution was filtered using 65 μm metal mesh. Microbial transplantation into recipient mice was achieved by gavage with 200 μl of the faecal solution and mice were maintained on standard normal-chow diet and water throughout the experiment. The Animal Care and Use Committee of Weizmann Institute of Science approved all the animal procedures (IACUC no. 28790716-4 (ref. 56).
We followed a previously published protocol for colonic epithelial cells57. Briefly, the colon was flushed with ice-cold PBS then cut open longitudinally. Distal and proximal colon regions were processed separately. Each part was minced into small pieces in cold PBS. Enterocytes were mechanically isolated by shaking in PBS with 30 mM EDTA at 37 °C. Crypts were recovered and then stored at −80 °C for DNA and RNA extraction. For FACS-sorted IECs, crypts fraction was washed twice in PBS, centrifuged at 300g for 3 min, and dissociated with TrypLE express (Invitrogen) for 1 min at 37 °C. The single-cell suspension was then passed through a 40 μm filter and stained for FACS. Only samples from the distal colon were used in our study. For histological analysis of colon samples, representative pieces of distal and proximal colon were used. No statistical methods were used to predetermine the sample size for the animal experiments. Mice of similar age were randomly assigned to experimental and control groups. All animal experiments were not blinded, except for the pathology assessment.
FACS sorting. For EpCAM+ isolation58, cells were stained with anti-CD45 (cat. no. 103125; dilution 1:200, BioLegend), anti-CD31 (cat. no. 102421; dilution 1:250, BioLegend), anti-TER-119 (cat. no. 116231; dilution 1:200, BioLegend) and anti-EpCAM (cat. no. 118211; dilution 1:100, BioLegend). Cells (EpCAM+, CD45−, CD31− and TER-119−) were immediately sorted into Eppendorf tubes using a BD FACS Aria (BD Biosciences) and stored at −80 °C for DNA extractions. All samples were below 5% contaminating EpCAM-negative cells.
Histochemistry, immuno-histochemistry and histological scoring. All tissues were fixed for 24 h in 4% (wt/vol) formaldehyde, embedded in paraffin and cut into sections 5 μm in thickness for staining with H&E and immunostaining. Sections were de-paraffinized by standard techniques. Sections were then incubated overnight at 4 °C with primary antibodies at the following dilutions: antibody to Ki67 (anti-Ki-67), 1:200 (cat. no. MA5-14520; Thermo Fisher Scientific). The histological score was assessed using the sum of both inflammatory cell infiltrate (0–3) and intestinal architecture (0–3), as previously described59.
Whole-genome bisulfite sequencing. WGBS was performed on two biological replicates from CNV, CNV/DSS, GF and GF/DSS mice (samples were also used for RNA-seq), as well as on three biological replicates of TETfl/fl and TET KO mice. Library preparation for bisulfite sequencing was performed as described previously60. Reads were trimmed to a maximal length of 80 bp and stretches of bases having a quality score <30 at the ends of the reads were removed. Reads were mapped using BSMAP 2.5 (ref. 61). As a reference sequence for the bisulfite mapping we used the mm9 assembly of the mouse genome. Only reads mapping with both partners of the read pairs at the correct distance were used. The correct distance was defined by setting the minimum value to 50 bp and the maximum value to 800 bp. In case a read pair mapped to multiple sites on the reference sequence a random hit was chosen. This was done by setting the option -r of bsmap to 1. The maximum number of mismatches allowed was set to 4% of the number of bases of a read. The whole list of parameters used for mapping with BSMAP 2.5 are: -d mm9, -s 16, -v 0.04, -w 100, -r 1, -q 0, -z 33, -f 5, -A none, -B 1, -E 4,294,967,295, -L 144, -D none, -I 4, -S 0, -n 1, -M TC, -p 4, -m 50, -x 800. Duplicates were removed using the Picard tool (http://broadinstitute.github.io/picard). Methylation ratios were determined using a Python script (methratio.py) distributed together with the BSMAP package. For both the forward and reverse strands, all cytosine bases in GC context were called independently.
For further analysis we used chromHMM62, which performs Hidden Markov Modelling62 of input data. As training data sets we used available ChIP-seq tracks (http://genome.ucsc.edu) for H3K4me1, H3K4me3, H3K27ac, H3K27me3 and H3K36me3. This resulted in a segmentation of the genome in 15 different types of compartments, which were annotated based on the combination of related histone patterns. The motif analysis was performed using HOMER software63.
Targeted bisulfite DNA methylation analysis. For deep DNA bisulfite sequencing, 500 ng of genomic DNA for each mouse sample was treated with bisulfite, using the EpiTect Bisulfite Kit (Qiagen), according to the manufacturer’s instructions. Treated DNA was amplified with sequence-specific primers containing Illumina Nextera handle sequence. The primers were selected to amplify a sequence shorter than 200 bp that contained four to nine CpG sites. PCR products of 100–200 bp were gel-extracted using the QIAquick Gel Extraction Kit (Qiagen). Equimolar amounts of all amplicons for each sample were pooled in a single tube. To incorporate the index sequences, the pooled PCR products were amplified by limited cycle-number PCR using Nextera complimentary primers. Each indexed pool were gel-extracted using the QIAquick Gel Extraction Kit, and equimolar amounts of all pools were again pooled in a single tube and processed for sequencing. Sequencing was performed on the pool using MiSeq Reagent Kit v2 (MiSeq, Illumina method). Sequenced reads were separated by barcode, aligned to the target sequence, and methylation ratios were determined using a Python script (methratio.py).
Transcriptome sequencing and integration with methylation data. mRNA was isolated from mouse colonic crypt intestinal IECs from the distal part of the colon. Mice (CNV, CNV/DSS, GF, GF/DSS, 3 biological replicates for each sample) were 11 weeks old at the end of the experiments. Transcriptome sequencing libraries were prepared using the TruSeq RNA Sample Preparation Kit (Illumina, San Diego, USA), according to the manufacturer’s instructions. Reads were trimmed to a maximal length of 80 bp and stretches of bases having a quality score <30 at the ends of the reads were removed. Reads were mapped using Tophat 2.0.6 (ref. 64). As a reference sequence for the transcriptome mapping we used the mm9 assembly of the mouse genome. The parameters used for mapping are: -N 5, -read-edit-dist 5, -g 1, -p 8, -r 20. All other parameters were kept at their default values. Differential expression was quantified using DESeq 1.10.1 (ref. 65) applying the built-in procedures for library normalization and estimation of variance and with Cuffdiff 2.0 (ref. 66). The resulting P values were subjected to multiple testing correction using built-in functions available in DESeq and Cuffdiff, respectively. Genes with a Q value smaller than 0.05 were considered as differentially expressed. GO analysis and pathway analysis for gene sets were performed using EnrichR67,68.
To integrate DNA methylation changes with gene expression changes, the intragenic LMRs fraction that represents a major part (46%) of all LMRs. This approach identified LMRs that became hyper- and hypo- methylated in DSS-treated mice and their associated genes showed expression changes.
qPCR analysis. Total RNA was extracted from intestinal epithelial cells using miRNeasy (cat. no. 1038703, Qiagen). Reverse transcription was performed using qScript (cat. no. 95047, Quanta Biosciences), and mRNA expression levels were measured with qPCR using SYBR-Green (cat. no. 1725124, Bio-Rad) in a CFX-380 Real-Time PCR system (Bio-Rad). Relative quantities of gene transcripts were normalized to ubiquitin C (UBC), hypoxanthine phosphoribosyltransferase 1 (HPRT) and peptidylprolyl isomerase A (PPIA) transcripts.
ATAC-seq. To profile open chromatin, we used the ATAC-seq protocol69. In brief, fresh crypts, isolated from 3 control and 3 DSS-treated mice, were dissociated into single cells and then 50,000 cells were sorted and pelleted by centrifugation for 5 min at 500g and 4 °C. Cell pellets were washed once with 1× PBS and cells were pelleted by centrifugation using the previous settings. Cell pellets were re-suspended in 25 μl of lysis buffer (10 mM Tris-Cl) [pH 7.4], 10 mM NaCl,
3 mM MgCl2, 0.1% Igepal CA-630) and nuclei were pelleted by centrifugation for 10 min at 500g, 4 °C with low acceleration and brake settings. Supernatant was discarded and nuclei were re-suspended in 50 μl reaction buffer containing 2.5 μl of Tn5 transposase and 25 μl of TD buffer (Nextera Sample preparation kit from Illumina). The reaction was incubated at 37 °C for 30 min and the DNA then purified using QIAquick minelute columns (Qiagen) and amplified by PCR using Nextera complimentary primers. Paired-end sequencing was performed on an Illumina HiSeq 2000 machine by multiplexing three samples on one lane. Reads were trimmed and mapped with Bowtie2 (ref. 70) using the mm9 assembly of the mouse genome as a reference sequence. Alignment files were merged (samtools merge version 0.1.18)71 to detect all possible peaks. To define and call all peaks, a very sensitive approach (P < 0.1, not considering local bias at peak regions, and bypassing building a shifting model) was chosen for MACS2 (version 2.1.1.20160309)72 to detect a reasonable amount of ATAC peaks. For each sample and each peak the number of reads per peak was counted using HTSeq count (version 0.8.0)73. DESeq2 (version 1.18.1)74 was used to assign experimental groups (CNV and CNV/DSS) to each sample and call the statistically significant differential peaks (P < 0.05) between them. The motif analysis was performed using HOMER software63.
Tet2/3 KO mice. Tet2/3fl/fl mice have been previously described16. All mice are C57BL/6 or have been backcrossed to the C57BL/6 background. Eleven-week-old male mice were used for all experiments. For the DSS experiment, we crossed Tet2/3fl/fl with VillinCreER mice41. For inflammation induction, mice (Tet2/3fl/fl and Tet2/3fl/fl VillinCreER) were given 3.5% of 36–50 kDa DSS for 5 days in their drinking water. On day 6, mice received water and were kept for an additional 5 days. The mice were injected with tamoxifen (20 mg kg−1, Sigma) before and during the experiment to ensure efficient knockout. For developmental effects of TET2/3 loss, we crossed Tet2/3fl/fl with VillinCre mice40 to generate Tet2/3fl/fl and Tet2/3fl/fl VillinCre mice.
Reporting Summary. Further information on research design is available in the Nature Research Reporting Summary linked to this article.
Data availabilityThe data to support the findings of this study are available from the corresponding authors upon reasonable request. All sequencing data are available from the GEO database under accession number GSE137037. Source data for Figs. 2a–e, 4a,b,g and 5a–g and Extended Data Figs. 2e, 4b–g,i and 5a,b are included in this article.
Received: 21 January 2019; Accepted: 11 December 2019; Published: xx xx xxxx
References 1. Yin, Y. et al. Impact of cytosine methylation on DNA binding specificities of
human transcription factors. Science 356, eaaj2239 (2017). 2. Alenghat, T. et al. Histone deacetylase 3 coordinates commensal-bacteria-
dependent intestinal homeostasis. Nature 504, 153–157 (2013). 3. Yu, D. H. et al. Postnatal epigenetic regulation of intestinal stem cells
requires DNA methylation and is guided by the microbiome. Genome Biol. 16, 211 (2015).
4. Fellows, R. et al. Microbiota derived short chain fatty acids promote histone crotonylation in the colon through histone deacetylases. Nat. Commun. 9, 105 (2018).
5. Jostins, L. et al. Host-microbe interactions have shaped the genetic architecture of inflammatory bowel disease. Nature 491, 119–124 (2012).
6. Khor, B., Gardet, A. & Xavier, R. J. Genetics and pathogenesis of inflammatory bowel disease. Nature 474, 307–317 (2011).
7. Elliott, E. N., Sheaffer, K. L., Schug, J., Stappenbeck, T. S. & Kaestner, K. H. Dnmt1 is essential to maintain progenitors in the perinatal intestinal epithelium. Development 142, 2163–2172 (2015).
8. Kim, R., Sheaffer, K. L., Choi, I., Won, K. J. & Kaestner, K. H. Epigenetic regulation of intestinal stem cells by Tet1-mediated DNA hydroxymethylation. Genes Dev. 30, 2433–2442 (2016).
9. Jenke, A. C. & Zilbauer, M. Epigenetics in inflammatory bowel disease. Curr. Opin. Gastroenterol. 28, 577–584 (2012).
10. Thaiss, C. A. et al. Microbiota diurnal rhythmicity programs host transcriptome oscillations. Cell 167, 1495–1510 (2016).
11. Gury-BenAri, M. et al. The spectrum and regulatory landscape of intestinal innate lymphoid cells are shaped by the microbiome. Cell 166, 1231–1246 e13 (2016).
12. Gordon, H. A. & Pesti, L. The gnotobiotic animal as a tool in the study of host microbial relationships. Bacteriol. Rev. 35, 390–429 (1971).
13. Park, J. H. et al. Promotion of intestinal epithelial cell turnover by commensal bacteria: role of short-chain fatty acids. PLoS ONE 11, e0156334 (2016).
14. Xie, W. et al. Epigenomic analysis of multilineage differentiation of human embryonic stem cells. Cell 153, 1134–1148 (2013).
15. Stadler, M. B. et al. DNA-binding factors shape the mouse methylome at distal regulatory regions. Nature 480, 490–495 (2011).
16. Orlanski, S. et al. Tissue-specific DNA demethylation is required for proper B-cell differentiation and function. Proc. Natl Acad. Sci. USA 113, 5018–5023 (2016).
17. Ye, D. Z. & Kaestner, K. H. Foxa1 and Foxa2 control the differentiation of goblet and enteroendocrine L- and D-cells in mice. Gastroenterology 137, 2052–2062 (2009).
18. Gosalia, N., Yang, R., Kerschner, J. L. & Harris, A. FOXA2 regulates a network of genes involved in critical functions of human intestinal epithelial cells. Physiol. Genomics 47, 290–297 (2015).
19. Yu, T. et al. Kruppel-like factor 4 regulates intestinal epithelial cell morphology and polarity. PLoS ONE 7, e32492 (2012).
20. Schonthaler, H. B., Guinea-Viniegra, J. & Wagner, E. F. Targeting inflammation by modulating the Jun/AP-1 pathway. Ann. Rheum. Dis. 70(Suppl 1), i109–i112 (2011).
21. Alteber, Z. et al. The anti-inflammatory IFITM genes ameliorate colitis and partially protect from tumorigenesis by changing immunity and microbiota. Immunol. Cell. Biol. 96, 284–297 (2018).
22. Okita, Y. et al. Interleukin-22-induced antimicrobial phospholipase A2 group IIA mediates protective innate immunity of nonhematopoietic cells against listeria monocytogenes. Infect. Immun. 84, 573–579 (2016).
23. Muhl, H., Bachmann, M. & Pfeilschifter, J. Inducible NO synthase and antibacterial host defence in times of Th17/Th22/T22 immunity. Cell. Microbiol. 13, 340–348 (2011).
24. Johansson, M. E. et al. Bacteria penetrate the inner mucus layer before inflammation in the dextran sulfate colitis model. PLoS ONE 5, e12238 (2010).
25. Berman, B. P. et al. Regions of focal DNA hypermethylation and long-range hypomethylation in colorectal cancer coincide with nuclear lamina-associated domains. Nat. Genet. 44, 40–46 (2012).
26. Abu-Remaileh, M. et al. Chronic inflammation induces a novel epigenetic program that is conserved in intestinal adenomas and in colorectal cancer. Cancer Res. 75, 2120–2130 (2015).
27. Elinav, E. et al. Inflammation-induced cancer: crosstalk between tumours, immune cells and microorganisms. Nat. Rev. Cancer 13, 759–771 (2013).
28. Sheaffer, K. L. et al. DNA methylation is required for the control of stem cell differentiation in the small intestine. Genes Dev. 28, 652–664 (2014).
29. Lawrence, T. The nuclear factor NF-κB pathway in inflammation. Cold Spring Harb. Perspect. Biol. 1, a001651 (2009).
30. Kirillov, A. et al. A role for nuclear NF-κB in B-cell-specific demethylation of the Igkappa locus. Nat. Genet. 13, 435–441 (1996).
31. Kagan, J. C. & Medzhitov, R. Phosphoinositide-mediated adaptor recruitment controls Toll-like receptor signaling. Cell 125, 943–955 (2006).
32. Gu, T. P. et al. The role of Tet3 DNA dioxygenase in epigenetic reprogramming by oocytes. Nature 477, 606–610 (2011).
33. Wossidlo, M. et al. 5-Hydroxymethylcytosine in the mammalian zygote is linked with epigenetic reprogramming. Nat. Commun. 2, 241 (2011).
34. Ito, S. et al. Role of Tet proteins in 5mC to 5hmC conversion, ES-cell self-renewal and inner cell mass specification. Nature 466, 1129–1133 (2010).
35. Koh, K. P. et al. Tet1 and Tet2 regulate 5-hydroxymethylcytosine production and cell lineage specification in mouse embryonic stem cells. Cell Stem Cell 8, 200–213 (2011).
36. Vincent, J. J. et al. Stage-specific roles for tet1 and tet2 in DNA demethylation in primordial germ cells. Cell Stem Cell 12, 470–478 (2013).
37. Dawlaty, M. M. et al. Loss of Tet enzymes compromises proper differentiation of embryonic stem cells. Dev. Cell 29, 102–111 (2014).
38. Ko, M. et al. Ten-Eleven-Translocation 2 (TET2) negatively regulates homeostasis and differentiation of hematopoietic stem cells in mice. Proc. Natl Acad. Sci. USA 108, 14566–14571 (2011).
39. Ko, M. et al. TET proteins and 5-methylcytosine oxidation in hematological cancers. Immunol. Rev. 263, 6–21 (2015).
40. Madison, B. B. et al. Cis elements of the villin gene control expression in restricted domains of the vertical (crypt) and horizontal (duodenum, cecum) axes of the intestine. J. Biol. Chem. 277, 33275–33283 (2002).
41. el Marjou, F. et al. Tissue-specific and inducible Cre-mediated recombination in the gut epithelium. Genesis 39, 186–193 (2004).
42. Elliott, E. N., Sheaffer, K. L. & Kaestner, K. H. The ‘de novo’ DNA methyltransferase Dnmt3b compensates the Dnmt1-deficient intestinal epithelium. eLife 5, e12975 (2016).
43. Pan, W. H. et al. Exposure to the gut microbiota drives distinct methylome and transcriptome changes in intestinal epithelial cells during postnatal development. Genome Med. 10, 27 (2018).
44. Cheng, J., Palva, A. M., de Vos, W. M. & Satokari, R. Contribution of the intestinal microbiota to human health: from birth to 100 years of age. Curr. Top. Microbiol. Immunol. 358, 323–346 (2013).
45. Davison, J. M. et al. Microbiota regulate intestinal epithelial gene expression by suppressing the transcription factor Hepatocyte nuclear factor 4 alpha. Genome Res. 27, 1195–1206 (2017).
46. Camp, J. G. et al. Microbiota modulate transcription in the intestinal epithelium without remodeling the accessible chromatin landscape. Genome Res. 24, 1504–1516 (2014).
47. Golson, M. L. & Kaestner, K. H. Fox transcription factors: from development to disease. Development 143, 4558–4570 (2016).
48. Ghaleb, A. M., McConnell, B. B., Kaestner, K. H. & Yang, V. W. Altered intestinal epithelial homeostasis in mice with intestine-specific deletion of the Kruppel-like factor 4 gene. Dev. Biol. 349, 310–320 (2011).
49. Liu, Y., Chidgey, M., Yang, V. W. & Bialkowska, A. B. Kruppel-like factor 5 is essential for maintenance of barrier function in mouse colon. Am. J. Physiol. Gastrointest. Liver Physiol. 313, G478–G491 (2017).
50. Sardina, J. L. et al. Transcription factors drive Tet2-mediated enhancer demethylation to reprogram cell fate. Cell Stem Cell 23, 727–741 (2018).
51. Macpherson, A. J. & Harris, N. L. Interactions between commensal intestinal bacteria and the immune system. Nat. Rev. Immunol. 4, 478–485 (2004).
52. Gensollen, T., Iyer, S. S., Kasper, D. L. & Blumberg, R. S. How colonization by microbiota in early life shapes the immune system. Science 352, 539–544 (2016).
53. Bergman, Y. & Cedar, H. DNA methylation dynamics in health and disease. Nat. Struct. Mol. Biol. 20, 274–281 (2013).
54. Ben-Neriah, Y. & Karin, M. Inflammation meets cancer, with NF-κB as the matchmaker. Nat. Immunol. 12, 715–723 (2011).
55. Hecht, G. et al. A simple cage-autonomous method for the maintenance of the barrier status of germ-free mice during experimentation. Lab Anim. 48, 292–297 (2014).
56. Thaiss, C. A. et al. Persistent microbiome alterations modulate the rate of post-dieting weight regain. Nature 540, 544–551 (2016).
57. Sato, T. & Clevers, H. Primary mouse small intestinal epithelial cell cultures. Methods Mol. Biol. 945, 319–328 (2013).
58. Haber, A. L. et al. A single-cell survey of the small intestinal epithelium. Nature 551, 333–339 (2017).
59. Erben, U. et al. A guide to histomorphological evaluation of intestinal inflammation in mouse models. Int. J. Clin. Exp. Pathol. 7, 4557–4576 (2014).
60. Raddatz, G., Gao, Q., Bender, S., Jaenisch, R. & Lyko, F. Dnmt3a protects active chromosome domains against cancer-associated hypomethylation. PLoS Genet. 8, e1003146 (2012).
61. Xi, Y. & Li, W. BSMAP: whole genome bisulfite sequence MAPping program. BMC Bioinformatics 10, 232 (2009).
62. Ernst, J. & Kellis, M. ChromHMM: automating chromatin-state discovery and characterization. Nat. Methods 9, 215–216 (2012).
63. Heinz, S. et al. Simple combinations of lineage-determining transcription factors prime cis-regulatory elements required for macrophage and B cell identities. Mol. Cell 38, 576–589 (2010).
64. Trapnell, C., Pachter, L. & Salzberg, S. L. TopHat: discovering splice junctions with RNA-Seq. Bioinformatics 25, 1105–1111 (2009).
65. Anders, S. & Huber, W. Differential expression analysis for sequence count data. Genome Biol. 11, R106 (2010).
66. Trapnell, C. et al. Transcript assembly and quantification by RNA-Seq reveals unannotated transcripts and isoform switching during cell differentiation. Nat. Biotechnol. 28, 511–515 (2010).
67. Chen, E. Y. et al. Enrichr: interactive and collaborative HTML5 gene list enrichment analysis tool. BMC Bioinformatics 14, 128 (2013).
68. Kuleshov, M. V. et al. Enrichr: a comprehensive gene set enrichment analysis web server 2016 update. Nucleic Acids Res. 44, W90–W97 (2016).
69. Buenrostro, J. D., Wu, B., Chang, H. Y. & Greenleaf, W. J. ATAC-seq: a method for assaying chromatin accessibility genome-wide. Curr. Protoc. Mol. Biol. 109, 21.29.1–21.29.9 (2015).
70. Langmead, B. & Salzberg, S.L. Fast gapped-read alignment with Bowtie 2. Nat. Methods 9, 357–359 (2012).
71. Li, H. et al. The sequence alignment/Map format and SAMtools. Bioinformatics 25, 2078–2079 (2009).
72. Zhang, Y. et al. Model-based analysis of ChIP-Seq (MACS). Genome Biol. 9, R137 (2008).
73. Anders, S., Pyl, P. T. & Huber, W. HTSeq—a Python framework to work with high-throughput sequencing data. Bioinformatics 31, 166–169 (2015).
74. Love, M. I., Huber, W. & Anders, S. Moderated estimation of fold change and dispersion for RNA-seq data with DESeq2. Genome Biol. 15, 550 (2014).
AcknowledgementsWe thank all members of our groups for helpful discussions. This work was supported by research grants from the Israel Academy of Sciences (grant 734/13 Y.B.), the Israel Cancer Research Foundation (grant 211410 to Y.B.), The Emanuel Rubin Chair in Medical Sciences (Y.B.), the Israel Center of Excellence Program (grant 1796/12 to Y.B.), the Helmholtz-Israel-Cooperation in Personalized Medicine (to Y.B. and F.L.), the Helmholtz program ‘Aging and Metabolic Programming’ (AMPro, to F.L.) and the German-Israeli Foundation (grant 1424 to Y.B. and F.L.).
Author contributionsI.A. conceived and carried out most of the experiments, and analysed and interpreted the results. M.R. prepared the samples, targeted bisulfite, qPCR and ATAC-seq analyses. D.C. performed targeted bisulfite analyses. M.A.-R. initiated the acute inflammation experiments. T.T performed and analysed the FACS experiments. H.S. conducted experiments with germ free mice. G.R., J.G. and I.A. analysed and interpreted the genome-wide data. E.P. evaluated all histological samples. E.E., E.P., F.L. and Y.B. designed and supervised this study. I.A, F.L. and Y.B. wrote the paper.
Competing interestsThe authors declare no competing interests.
Additional informationSupplementary information is available for this paper at https://doi.org/10.1038/s41564-019-0659-3.
Correspondence and requests for materials should be addressed to Y.B.
Reprints and permissions information is available at www.nature.com/reprints.
Publisher’s note Springer Nature remains neutral with regard to jurisdictional claims in published maps and institutional affiliations.
Extended Data Fig. 1 | Microbiota induces transcriptional alterations. a, Pie chart showing the number of significantly differentially expressed genes (1182) with a fold-change of ≥2, relative to germ free (GF). Conventional (CNV) upregulated genes are shown in red and downregulated genes are shown in green. b, Ingenuity pathway analysis of the 358 downregulated genes from (a). The highly enriched functions from the most highly enriched categories are shown. c, Gene Ontology (GO) analysis of the CNV 824 upregulated genes from (a). The highly enriched biological processes from the enriched categories are shown. P values (b,c) were calculated using two-tailed Fisher’s exact test. d, Expression levels of proliferation genes (Mki67 and Top2a) in GF (n = 3) and CNV (n = 3), data were extracted from RNA-seq analysis. e, Mki67 staining on distal colon specimens from GF (n = 3) and CNV (n = 3) mice. Scale bar 100 µm. Quantification of Mki67-positive cells is also shown. Significance (d,e) was determined using two-sided t-test and is expressed as the mean ± SEM.
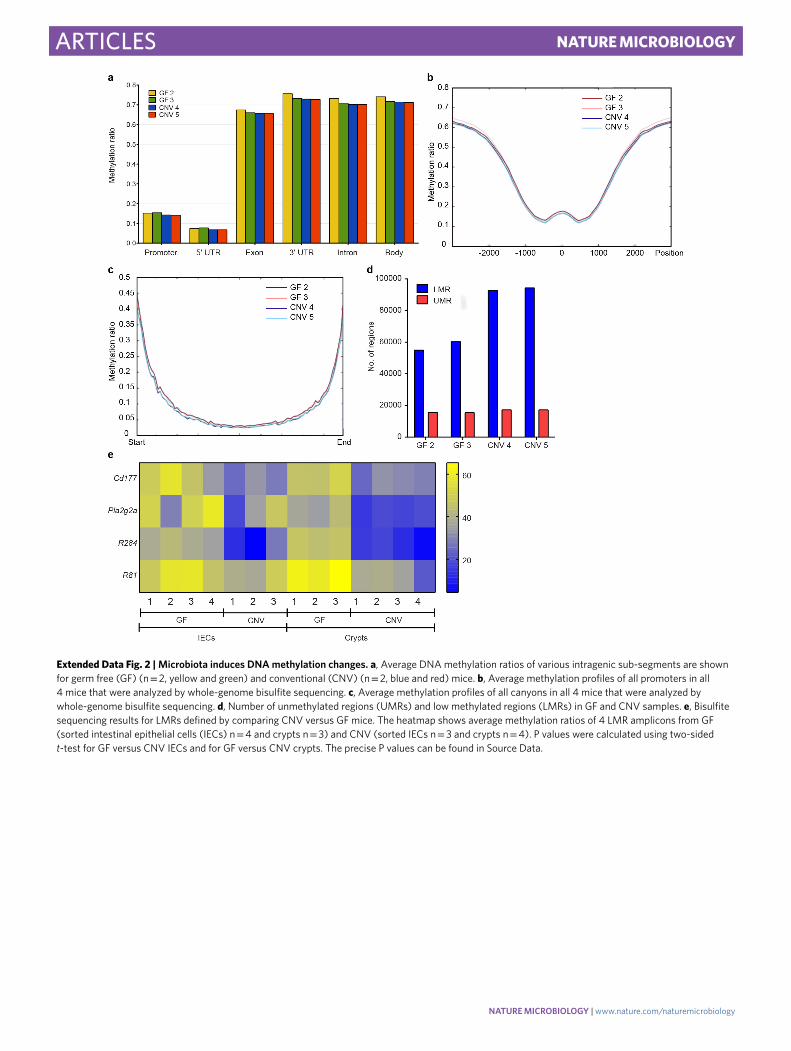
Extended Data Fig. 2 | Microbiota induces DNA methylation changes. a, Average DNA methylation ratios of various intragenic sub-segments are shown for germ free (GF) (n = 2, yellow and green) and conventional (CNV) (n = 2, blue and red) mice. b, Average methylation profiles of all promoters in all 4 mice that were analyzed by whole-genome bisulfite sequencing. c, Average methylation profiles of all canyons in all 4 mice that were analyzed by whole-genome bisulfite sequencing. d, Number of unmethylated regions (UMRs) and low methylated regions (LMRs) in GF and CNV samples. e, Bisulfite sequencing results for LMRs defined by comparing CNV versus GF mice. The heatmap shows average methylation ratios of 4 LMR amplicons from GF (sorted intestinal epithelial cells (IECs) n = 4 and crypts n = 3) and CNV (sorted IECs n = 3 and crypts n = 4). P values were calculated using two-sided t-test for GF versus CNV IECs and for GF versus CNV crypts. The precise P values can be found in Source Data.
Extended Data Fig. 3 | Acute inflammation in conventional (CNV) mice provokes DNA methylation changes. a, A schematic diagram of the protocol used to induce acute inflammation. Briefly, acute inflammation was induced by administration of 2% DSS in the drinking water for 5 days followed by regular drinking water for an additional 16 days. b, Average global DNA methylation ratios are shown for CNV (n = 2, blue) and DSS-treated CNV (CNV/DSS) (n = 2, orange) mice, respectively. c, Average DNA methylation ratios of various intragenic sub-segments are shown for CNV (n = 2, yellow and green) and CNV/DSS (n = 2, blue and red) mice. d, Methylation and lamina-associated domain (LAD) tracks of mouse chromosome 4 (blue CNV, red CNV/DSS). e, Average methylation profiles of all canyons in all 4 mice that were analyzed by whole-genome bisulfite sequencing. f, Bar graph showing the number of up- and down- regulated genes in CNV/DSS versus CNV samples associated with hyper- and hypo- methylated promoters. g, Gene Ontology (GO) analysis of the upregulated genes (n = 185) associated with hypomethylated promoters in CNV/DSS compared to CNV. The highly enriched processes are shown (P values were calculated using two-tailed Fisher’s exact test). h, Diseases-related with the upregulated genes (n = 185) associated with hypomethylated promoter in CNV/DSS compared to CNV samples (P values were calculated using two-tailed Fisher’s exact test, adjusted p-value calculated using the Benjamini-Hochberg method for correction for multiple hypotheses testing).
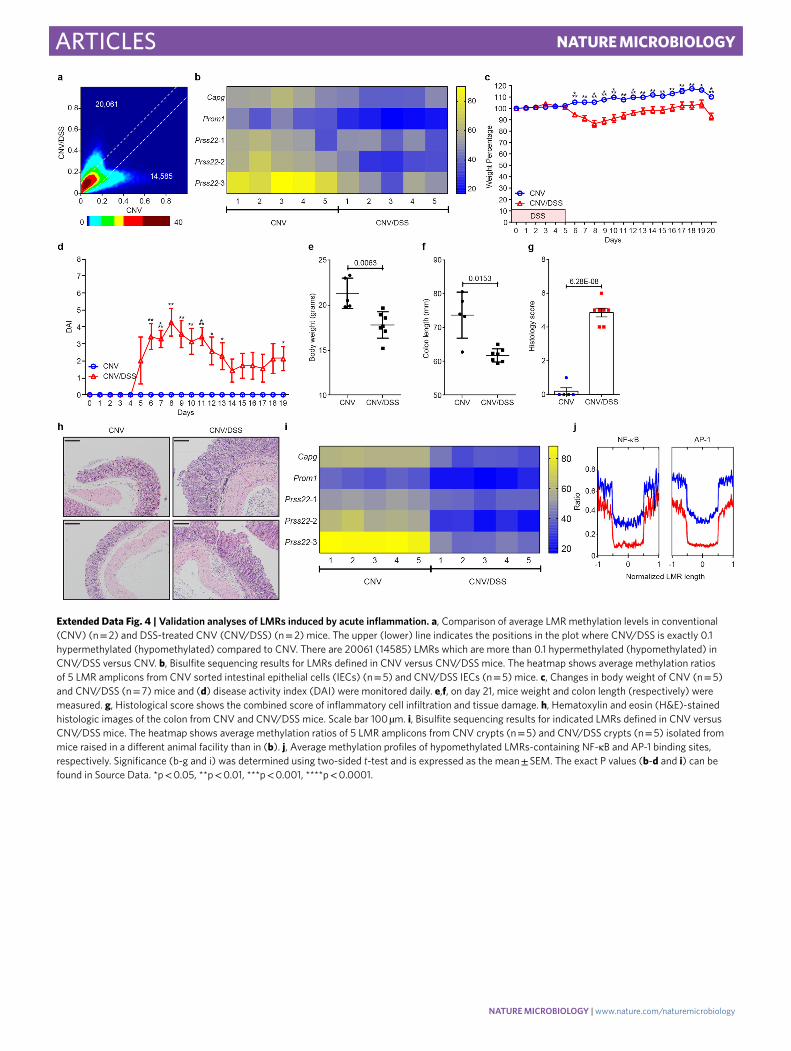
Extended Data Fig. 4 | Validation analyses of LMRs induced by acute inflammation. a, Comparison of average LMR methylation levels in conventional (CNV) (n = 2) and DSS-treated CNV (CNV/DSS) (n = 2) mice. The upper (lower) line indicates the positions in the plot where CNV/DSS is exactly 0.1 hypermethylated (hypomethylated) compared to CNV. There are 20061 (14585) LMRs which are more than 0.1 hypermethylated (hypomethylated) in CNV/DSS versus CNV. b, Bisulfite sequencing results for LMRs defined in CNV versus CNV/DSS mice. The heatmap shows average methylation ratios of 5 LMR amplicons from CNV sorted intestinal epithelial cells (IECs) (n = 5) and CNV/DSS IECs (n = 5) mice. c, Changes in body weight of CNV (n = 5) and CNV/DSS (n = 7) mice and (d) disease activity index (DAI) were monitored daily. e,f, on day 21, mice weight and colon length (respectively) were measured. g, Histological score shows the combined score of inflammatory cell infiltration and tissue damage. h, Hematoxylin and eosin (H&E)-stained histologic images of the colon from CNV and CNV/DSS mice. Scale bar 100 µm. i, Bisulfite sequencing results for indicated LMRs defined in CNV versus CNV/DSS mice. The heatmap shows average methylation ratios of 5 LMR amplicons from CNV crypts (n = 5) and CNV/DSS crypts (n = 5) isolated from mice raised in a different animal facility than in (b). j, Average methylation profiles of hypomethylated LMRs-containing NF-κB and AP-1 binding sites, respectively. Significance (b-g and i) was determined using two-sided t-test and is expressed as the mean ± SEM. The exact P values (b-d and i) can be found in Source Data. *p < 0.05, **p < 0.01, ***p < 0.001, ****p < 0.0001.
Extended Data Fig. 5 | Validation analyses of LMR methylation changes in sterile inflammation. a, Bisulfite sequencing results for indicated LMRs defined in germ free (GF) versus DSS-treated GF (GF/DSS) mice. The heatmap shows average methylation ratios of LMRs from GF crypt IECs (n = 5) and CNV/DSS crypt IECs (n = 5). b, Bisulfite sequencing results for indicated LMRs defined in GF versus GF/DSS mice. The heatmap shows average methylation ratios of LMRs from GF FACS-sorted intestinal epithelial cells (IECs) (n = 5) and CNV/DSS FACS-sorted IECs (n = 5). P values (a,b) were calculated using two-sided t-test. The exact P values can be found in Source Data. c, Pie chart indicating the number of up- and down- regulated genes that are associated with hypermethylated- and hypomethylated- LMRs in GF/DSS compared to GF mice.
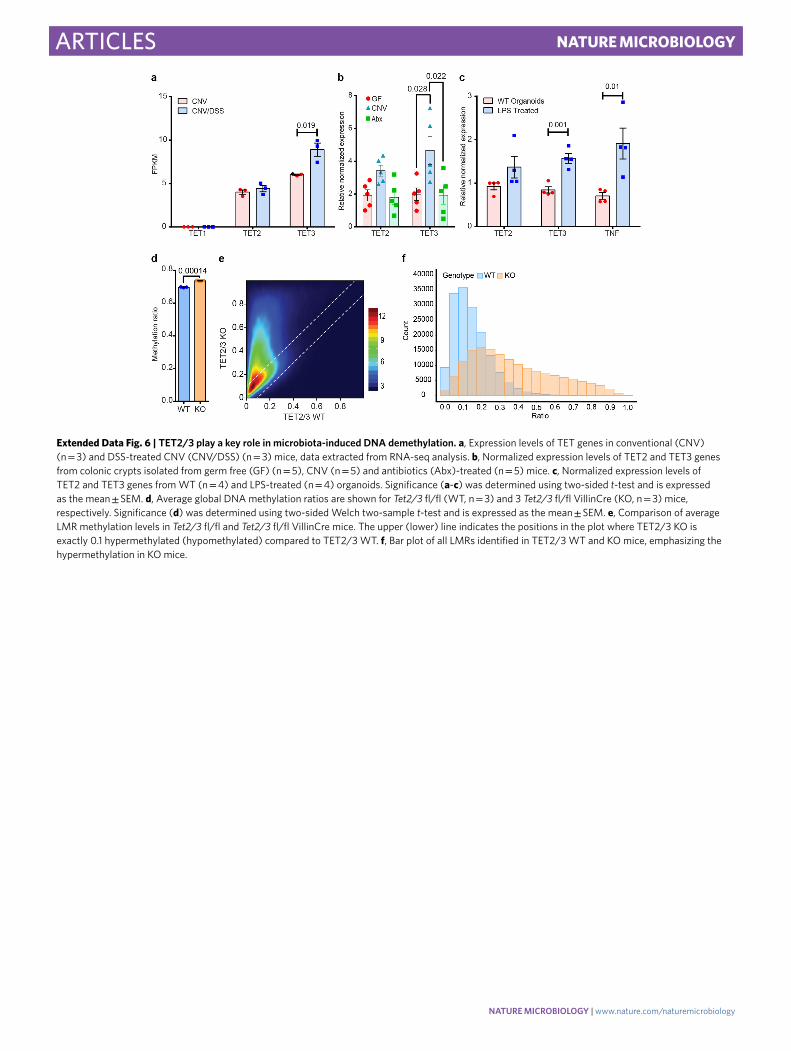
Extended Data Fig. 6 | TET2/3 play a key role in microbiota-induced DNA demethylation. a, Expression levels of TET genes in conventional (CNV) (n = 3) and DSS-treated CNV (CNV/DSS) (n = 3) mice, data extracted from RNA-seq analysis. b, Normalized expression levels of TET2 and TET3 genes from colonic crypts isolated from germ free (GF) (n = 5), CNV (n = 5) and antibiotics (Abx)-treated (n = 5) mice. c, Normalized expression levels of TET2 and TET3 genes from WT (n = 4) and LPS-treated (n = 4) organoids. Significance (a-c) was determined using two-sided t-test and is expressed as the mean ± SEM. d, Average global DNA methylation ratios are shown for Tet2/3 fl/fl (WT, n = 3) and 3 Tet2/3 fl/fl VillinCre (KO, n = 3) mice, respectively. Significance (d) was determined using two-sided Welch two-sample t-test and is expressed as the mean ± SEM. e, Comparison of average LMR methylation levels in Tet2/3 fl/fl and Tet2/3 fl/fl VillinCre mice. The upper (lower) line indicates the positions in the plot where TET2/3 KO is exactly 0.1 hypermethylated (hypomethylated) compared to TET2/3 WT. f, Bar plot of all LMRs identified in TET2/3 WT and KO mice, emphasizing the hypermethylation in KO mice.
Reporting SummaryNature Research wishes to improve the reproducibility of the work that we publish. This form provides structure for consistency and transparency in reporting. For further information on Nature Research policies, see Authors & Referees and the Editorial Policy Checklist.
StatisticsFor all statistical analyses, confirm that the following items are present in the figure legend, table legend, main text, or Methods section.
n/a Confirmed
The exact sample size (n) for each experimental group/condition, given as a discrete number and unit of measurement
A statement on whether measurements were taken from distinct samples or whether the same sample was measured repeatedly
The statistical test(s) used AND whether they are one- or two-sided Only common tests should be described solely by name; describe more complex techniques in the Methods section.
A description of all covariates tested
A description of any assumptions or corrections, such as tests of normality and adjustment for multiple comparisons
A full description of the statistical parameters including central tendency (e.g. means) or other basic estimates (e.g. regression coefficient) AND variation (e.g. standard deviation) or associated estimates of uncertainty (e.g. confidence intervals)
For null hypothesis testing, the test statistic (e.g. F, t, r) with confidence intervals, effect sizes, degrees of freedom and P value noted Give P values as exact values whenever suitable.
For Bayesian analysis, information on the choice of priors and Markov chain Monte Carlo settings
For hierarchical and complex designs, identification of the appropriate level for tests and full reporting of outcomes
Estimates of effect sizes (e.g. Cohen's d, Pearson's r), indicating how they were calculated
Our web collection on statistics for biologists contains articles on many of the points above.
Software and codePolicy information about availability of computer code
Data collection Miseq v2, Illumina HiSeq 2000 v4, Illumina CFX384 Touch Real-Time PCR Detection System BD FACSAria™ III sorter (BD Biosciences)
Data analysis Bio-Rad CFX Manager Graphpad Prism version 6.0 and Graphpad Prism version 7.0 BSMAP 2.02 methratio.py Tophat 2.0.6 DESeq 1.10.1 Cuffdiff 2.0 EnrichR (GO_Biological_Process_2015 , GO_Molecular_Function_2015 and Disease_Perturbations) Bowtie2 2.2.4 MACS2 (version 2.1.1.20160309) HTSeq count (version 0.8.0) R studio (3.4.3) Microsoft Excel (Microsoft Office, 2016) HOMER 4.9.1
For manuscripts utilizing custom algorithms or software that are central to the research but not yet described in published literature, software must be made available to editors/reviewers. We strongly encourage code deposition in a community repository (e.g. GitHub). See the Nature Research guidelines for submitting code & software for further information.
2
nature research | reporting summ
aryO
ctober 2018
DataPolicy information about availability of data
All manuscripts must include a data availability statement. This statement should provide the following information, where applicable: - Accession codes, unique identifiers, or web links for publicly available datasets - A list of figures that have associated raw data - A description of any restrictions on data availability
All sequencing data are available from the GEO database under accession number GSE137037.
Field-specific reportingPlease select the one below that is the best fit for your research. If you are not sure, read the appropriate sections before making your selection.
Life sciences Behavioural & social sciences Ecological, evolutionary & environmental sciences
For a reference copy of the document with all sections, see nature.com/documents/nr-reporting-summary-flat.pdf
Life sciences study designAll studies must disclose on these points even when the disclosure is negative.
Sample size No sample-size calculation was performed. For in vivo experiments, we performed at least 5 independent replicates for each condition (GF/CNV), treatment (water/DSS) and genotype (C57BL/6, TET2/3 fl/fl, TET2/3 fl/fl villinCre and TET2/3 fl/fl villinCreER) We used sample sizes commonly accepted for high throughput genome wide experiments. We performed 2 (3 for TET2/3) biological replicates for WGBS. The results of the WGBS were validated using at least 5 independent replicates by targeted bisulfite sequencing.
Data exclusions No samples were excluded in this study. However, one analysis done in this study is to show that LMRs that identified in DSS/CNV mice is due to intestinal inflammation (not due differentiation of the epithelial cells). Therefore, we excluded LMRs that are related to differentiation just to prove that they don't affect the results that we obtained as a result of acute inflammation.
Replication Each experiment was replicated n times (and n is given in each figure for each experiment). Although the exact quantitative results differ between replicates, the qualitative results were the same, so that it is reasonable to state that the "All attempts at replication were successful".
Randomization The mice were allocated randomly in this study.
Blinding The data collection was not blinded. Blinding was not possible as the investigators were also conducting the experiments and had to be aware of controls and treated groups. Pathology analysis was single-blinded.
Reporting for specific materials, systems and methodsWe require information from authors about some types of materials, experimental systems and methods used in many studies. Here, indicate whether each material, system or method listed is relevant to your study. If you are not sure if a list item applies to your research, read the appropriate section before selecting a response.
Materials & experimental systemsn/a Involved in the study
Validation All antibodies used in this study were validated by the manufacturer. - Ki-67 Monoclonal Antibody: (https://www.thermofisher.com/antibody/product/Ki-67-Antibody-clone-SP6-Monoclonal/MA5-14520) - Pacific Blue™ anti-mouse CD45 Antibody: (https://www.biolegend.com/en-us/products/pacific-blue-anti-mouse-cd45-antibody-3102) - Pacific Blue™ anti-mouse CD31 Antibody: (https://www.biolegend.com/en-us/products/pacific-blue-anti-mouse-cd31-antibody-6669) Pacific Blue™ anti-mouse TER-119/Erythroid Cells Antibody: (https://www.biolegend.com/en-us/products/pacific-blue-anti-mouse-ter-119-erythroid-cells-antibody-6137)
Animals and other organismsPolicy information about studies involving animals; ARRIVE guidelines recommended for reporting animal research
Laboratory animals All mice were c57bl/6, males and 11 weeks old.
Wild animals The study did not involve wild animals.
Field-collected samples This study did not involve samples collected from the field.
Ethics oversight The Animal Care and Use Committee of The Hebrew University of Jerusalem approved all animal procedures. The Animal Care and Use Committee of Weizmann Institute of Science approved all the animal procedures.
Note that full information on the approval of the study protocol must also be provided in the manuscript.
Flow CytometryPlots
Confirm that:
The axis labels state the marker and fluorochrome used (e.g. CD4-FITC).
The axis scales are clearly visible. Include numbers along axes only for bottom left plot of group (a 'group' is an analysis of identical markers).
All plots are contour plots with outliers or pseudocolor plots.
A numerical value for number of cells or percentage (with statistics) is provided.
Methodology
Sample preparation Briefly, the colon was flushed with ice-cold PBS then cut open longitudinally. Distal colon region was used. The distal part was minced into small pieces in cold PBS. Enterocytes were mechanically isolated by shaking in PBS with 30 mM EDTA at 37oC. Crypts were recovered and then washed twice in PBS, centrifuged at 300 g for 3 min, and dissociated with TrypLE express (Invitrogen) for 1 min at 37 °C. The single-cell suspension was then passed through a 40 μm filter and stained for FACS. For EpCAM+ isolation, cells were stained with anti-CD45, anti-CD31, anti-TER-119 and anti-EpCAM . Cells (EpCAM+, CD45-, CD31- and TER-119-) were immediately sorted into Eppendorf tubes and stored at -80°C for DNA extractions.
Instrument BD FACSAria™ III sorter
Software BD FACSDiva software was used for acquisition and sorting. FlowJo v10 software was used for the cytometric analysis.
Cell population abundance The sorted samples of the EpCAM+ CD45– cell populations contained less then 5% of EpCAM– CD45– contaminants as was determined by the sample analysis after sorting.
Gating strategy Initially, the SSC-A/FSC-A gate was set-up in a way to include 95% of events beyond the 5000 FSC threshold. Then the doublets, triplets etc were gated out in the FSC-A/FSC-H diagonal gate. Live cells were then separated from the dead ones through the means of the Zombie UV viability staining. Then the CD45+ cells were gated out and finally the gate separating EpCAM+ cells among the CD45– ones allowed for the sorting of CD45– EpCAM+ colonic epithelial cell population. Positive and negative controls were used to determine the boundary of staining specificity for the viability staining as well as the antibody staining.
Tick this box to confirm that a figure exemplifying the gating strategy is provided in the Supplementary Information.