904 OPTICS LETTERS / Vol. 22, No. 12 / June 15, 1997 T-ray tomography Daniel M. Mittleman,* Stefan Hunsche, Luc Boivin, and Martin C. Nuss Bell Laboratories, Lucent Technologies, 101 Crawfords Corner Road, Holmdel, New Jersey 07733 Received March 24, 1997 We demonstrate tomographic T-ray imaging, using the timing information present in terahertz (THz) pulses in a ref lection geometry. THz pulses are reflected from refractive-index discontinuities inside an object, and the time delays of these pulses are used to determine the positions of the discontinuities along the propagation direction. In this fashion a tomographic image can be constructed. 1997 Optical Society of America We recently described a new imaging modality, based on time-resolved measurements of picosecond bursts of electromagnetic radiation in the terahertz (THz) fre- quency range. 1 Although THz time-domain measure- ments have been used successfully for spectroscopy, 2,3 imaging with THz pulses has not been practical ow- ing to the long (minutes) acquisition times for the THz waveforms. Our new T-ray imaging technique is made possible by reduction of the acquisition time of a single THz waveform from several minutes to sev- eral milliseconds, while a signal– noise ratio of . 1000:1 is maintained. 4 In the original demonstration, 1 no ex- plicit use of the time-domain nature of the THz pulses was made, and the images displayed only the trans- mitted power obtained by integration of the Fourier spectrum of the THz waveform with a digital signal processor. There is much more spectroscopic informa- tion available from the THz waveforms, such as tim- ing, broadening, and other temporal distortions that result from the frequency-dependent absorption and dispersion of the object. These temporal distortions can be analyzed in real time to yield compositional in- formation about the sample. For example, we recently demonstrated real-time recognition of gases and gas mixtures, using linear predictive coding as a waveform classif ication and recognition procedure. 5 In this Letter we report on the extension of T-ray imaging to three-dimensional tomographic imaging by analyzing the temporal structure of THz waveforms returned from objects in a ref lection geometry. The return time of reflected pulses directly correlates with the location of the dielectric interfaces along the propa- gation direction of the beam. Because the arrival time of the THz waveforms can be determined with an accuracy of a few femtoseconds, i.e., much less than the pulse duration, the positions of ref lecting surfaces within the object under study can be determined with an accuracy of a few micrometers when successive reflections are well separated in time. 4 In contrast with the two-dimensional T-ray transmission images published earlier, 1 full volume images of many objects in the THz frequency range can now be obtained. The experimental setup is described in detail in Ref. 4. The beam of THz pulses is incident upon the sample at nearly normal incidence and comes to a focus at the sample surface. The beam ref lected from the object is recollimated and then captured by a pick-off mirror, which directs it to the receiver antenna. The generation, detection, and real-time processing of the THz waveforms are similar to what is described in the original transmission experiments. 1,4 For an ob- ject with multiple reflecting internal surfaces, the re- f lected waveform consists of a series of replicas of the input pulse of varying magnitude, polarity, and tem- poral distortion. We illustrate this, using the example of a 3.5-in. f loppy disk, with the input and ref lected THz waveforms from a single point on the floppy disk shown in Fig. 1. We obtain waveform (a) by replacing the object with a mirror, and thus the pulse that is inci- dent upon the sample is represented. The small oscil- lations that follow the main pulse in this waveform are a result of residual water vapor in the beam path 6 and do not affect the measurement significantly. Curve (b), a representative ref lected waveform, consists of a Fig. 1. (a) Input THz waveform and (b) ref lected waveform from a single point on a 3.5-in. floppy disk. Each of the ref lected pulses identifies a dielectric dis- continuity along the propagation direction of the beam normal to the f loppy disk, as labeled in the figure. Curve (c) is the ref lected waveform after signal pro- cessing, as described in the text. Curve (d) is the refractive-index prof ile of the medium (right-hand axis), derived from curve (c) by Eqs. (3) and (4) below. Curve (b) has been scaled up by a factor of 3 relative to the left (photocurrent) axis and vertically offset for clarity. 0146-9592/97/120904-03$10.00/0 1997 Optical Society of America
Daniel M. Mittleman,* Stefan Hunsche, Luc Boivin, and Martin C. Nuss
Bell Laboratories, Lucent Technologies, 101 Crawfords Corner Road, Holmdel, New Jersey 07733
Received March 24, 1997
We demonstrate tomographic T-ray imaging, using the timing information present in terahertz (THz) pulsesin a ref lection geometry. THz pulses are ref lected from refractive-index discontinuities inside an object, andthe time delays of these pulses are used to determine the positions of the discontinuities along the propagationdirection. In this fashion a tomographic image can be constructed. 1997 Optical Society of America
We recently described a new imaging modality, basedon time-resolved measurements of picosecond bursts ofelectromagnetic radiation in the terahertz (THz) fre-quency range.1 Although THz time-domain measure-ments have been used successfully for spectroscopy,2,3
imaging with THz pulses has not been practical ow-ing to the long (minutes) acquisition times for theTHz waveforms. Our new T-ray imaging technique ismade possible by reduction of the acquisition time ofa single THz waveform from several minutes to sev-eral milliseconds, while a signal–noise ratio of .1000:1is maintained.4 In the original demonstration,1 no ex-plicit use of the time-domain nature of the THz pulseswas made, and the images displayed only the trans-mitted power obtained by integration of the Fourierspectrum of the THz waveform with a digital signalprocessor. There is much more spectroscopic informa-tion available from the THz waveforms, such as tim-ing, broadening, and other temporal distortions thatresult from the frequency-dependent absorption anddispersion of the object. These temporal distortionscan be analyzed in real time to yield compositional in-formation about the sample. For example, we recentlydemonstrated real-time recognition of gases and gasmixtures, using linear predictive coding as a waveformclassification and recognition procedure.5
In this Letter we report on the extension of T-rayimaging to three-dimensional tomographic imaging byanalyzing the temporal structure of THz waveformsreturned from objects in a ref lection geometry. Thereturn time of ref lected pulses directly correlates withthe location of the dielectric interfaces along the propa-gation direction of the beam. Because the arrival timeof the THz waveforms can be determined with anaccuracy of a few femtoseconds, i.e., much less thanthe pulse duration, the positions of ref lecting surfaceswithin the object under study can be determined withan accuracy of a few micrometers when successiveref lections are well separated in time.4 In contrastwith the two-dimensional T-ray transmission imagespublished earlier,1 full volume images of many objectsin the THz frequency range can now be obtained.
The experimental setup is described in detail inRef. 4. The beam of THz pulses is incident upon thesample at nearly normal incidence and comes to a focusat the sample surface. The beam ref lected from theobject is recollimated and then captured by a pick-offmirror, which directs it to the receiver antenna. Thegeneration, detection, and real-time processing of the
0146-9592/97/120904-03$10.00/0
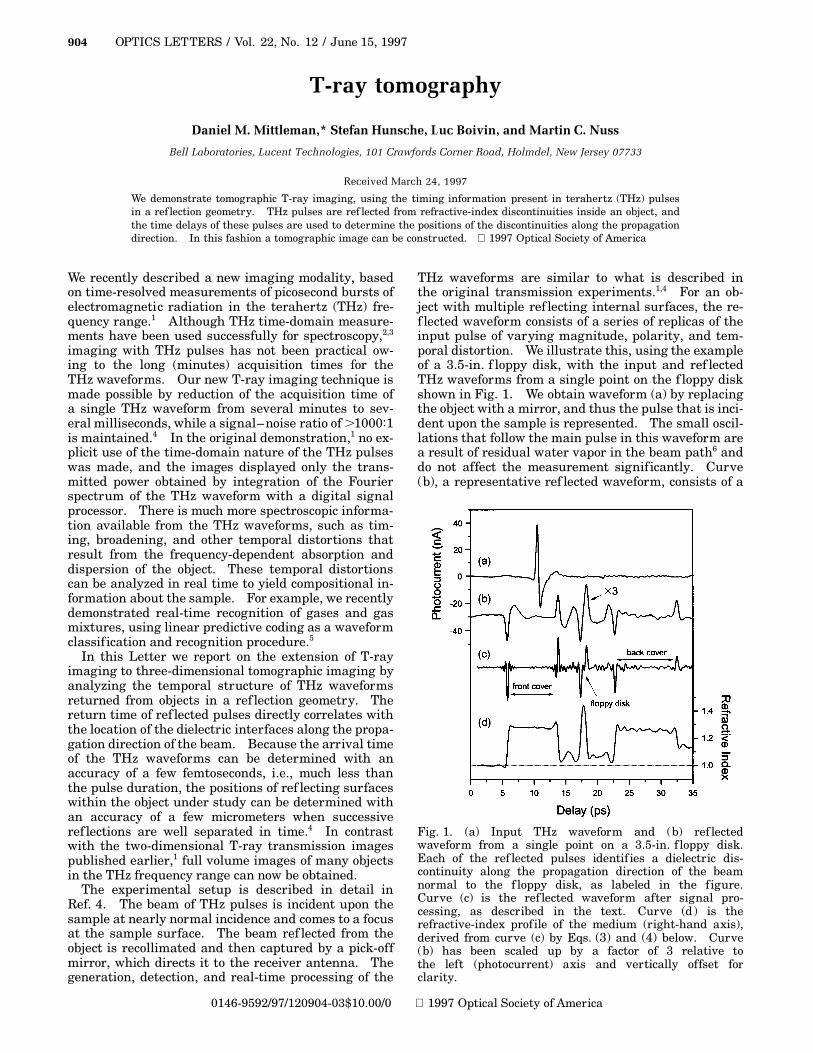
THz waveforms are similar to what is described inthe original transmission experiments.1,4 For an ob-ject with multiple ref lecting internal surfaces, the re-f lected waveform consists of a series of replicas of theinput pulse of varying magnitude, polarity, and tem-poral distortion. We illustrate this, using the exampleof a 3.5-in. f loppy disk, with the input and ref lectedTHz waveforms from a single point on the f loppy diskshown in Fig. 1. We obtain waveform (a) by replacingthe object with a mirror, and thus the pulse that is inci-dent upon the sample is represented. The small oscil-lations that follow the main pulse in this waveform area result of residual water vapor in the beam path6 anddo not affect the measurement significantly. Curve(b), a representative ref lected waveform, consists of a
Fig. 1. (a) Input THz waveform and (b) ref lectedwaveform from a single point on a 3.5-in. f loppy disk.Each of the ref lected pulses identif ies a dielectric dis-continuity along the propagation direction of the beamnormal to the f loppy disk, as labeled in the figure.Curve (c) is the ref lected waveform after signal pro-cessing, as described in the text. Curve (d) is therefractive-index profile of the medium (right-hand axis),derived from curve (c) by Eqs. (3) and (4) below. Curve(b) has been scaled up by a factor of 3 relative tothe left (photocurrent) axis and vertically offset forclarity.
series of replicas of the input waveform. These cor-respond to ref lections from the dielectric interfaces ofthe f loppy disk from air to plastic, from plastic to air,or from surfaces of the magnetic recording material.The polarity and the magnitude of each ref lection aregiven by the ref lection coefficient at each interface andare related to the size and sign of the corresponding in-dex step. The four ref lections resulting from the frontand back plastic covers are clearly resolved. However,the thickness of the magnetic recording material is sosmall that the waveforms returned from its front andback surfaces cannot be distinguished and appear as asingle distorted waveform. In this example the tem-poral waveforms hardly change shape while travers-ing the object because the plastic material has littleabsorption and dispersion. In a more general situa-tion, ref lected waveforms may be significantly alteredin shape.
In Fig. 1, (c) is the waveform of (b) after numericalFourier deconvolution (i.e., division of the Fourierspectra of the incident and the ref lected wave-forms, with a low-pass filter to remove noise above,2.5 THz). Subsequently, low-frequency backgroundis removed by means of wavelet filtering.7 Thisprocedure produces a sharp spike at a time delaycorresponding to the position of every ref lecting inter-face. Thus it helps to determine more accurately thepositions of the various interfaces. In contrast with(b) in Fig. 1, the front and back surfaces of the thin(,120-mm) magnetic recording material are clearlyresolved in the deconvolved data (c). This is con-sistent with the expected resolution of Lcy2, whereLc 200 mm is the coherence length of the THz pulsein the intervening material. In contrast, when noother ref lections are nearby, we find that the positionof a ref lecting surface can be determined with aprecision of only a few micrometers.4
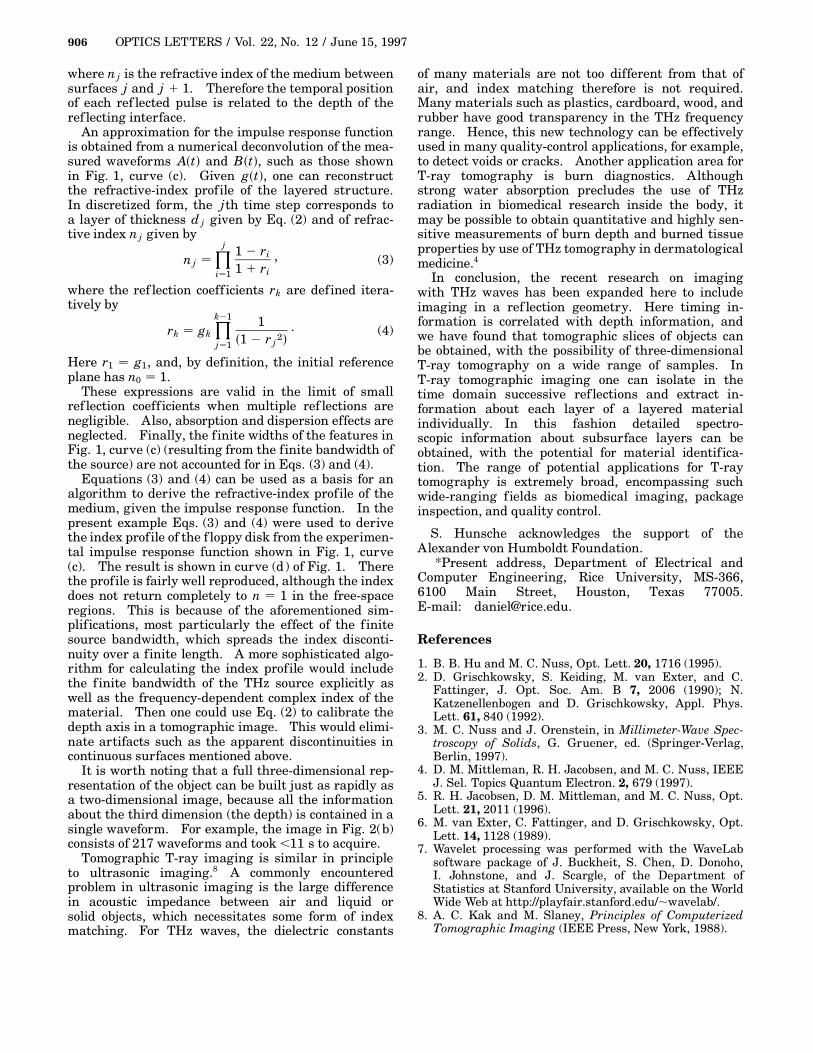
Figure 2 shows a conventional T-ray image of a sec-tion of the f loppy disk obtained in ref lection [Fig. 2(a)]and a tomographic slice [Fig. 2(b)] at a f ixed verticalposition. We obtained the conventional T-ray image atthe top by computing the total ref lected power, usingreal-time processing of the ref lected waveforms witha digital signal processor,1,4 with the ref lected powertranslated into a gray scale. The plastic cover with itsvarious features, the circular recording disk, and themetallic hub in the center of the disk can be distin-guished.
In Fig. 2(b) a tomographic T-ray slice of the f loppydisk is shown at a particular vertical position (y 15 mm), indicated by the dashed line in Fig. 2(a). Foreach horizontal (x) position a ref lected waveform isacquired, processed as described above [curve (c),Fig. 1], and displayed as a function of delay in thistomographic image. The amplitude of the processedwaveforms is translated into a gray scale so that eachref lecting surface appears as a stripe. The positionsof the various parts of the f loppy disk along thepropagation direction of the THz beam, such as thefront and back covers, the magnetic recording disk,and the metal hub, can be observed clearly in thistomographic picture. The image also shows someartifacts of the technique that result from multiple
ref lections among the various interfaces, such as thefeatures observed behind the (opaque) metal hub, aswell as the apparent discontinuity in the magneticrecording medium caused by a change in the thicknessof the front plastic cover at x 12 mm.
Signal processing of the THz waveforms can be usedto extract the layer structure of the medium at anygiven (x, y) position. The ref lected waveform Bstd isrelated to the input waveform Astd by a convolutionwith the impulse response gstd of the layered medium:
Bj MX
k0
gj2kAk . (1)
In Eq. (1) discrete-time functions defined by digitiza-tion with a time step Dt [e.g, Bk BskDtd] are used.M is the number of samples in the digitized waveforms,1024 in these examples. The impulse response gstdis characteristic of the object and does not depend onthe details of the input pulse. The coeff icients gk aredetermined by the ref lection off the kth layer as wellas by the transmission through the preceding layers,j 1, . . . , k 2 1, once in each direction. The distancedj between two adjacent layers j and j 1 1 is relatedto the time separation of the two corresponding ref lec-tions Dt tj11 2 tj by
dj c
2njDt , (2)
Fig. 2. (a) Conventional ref lective T-ray image of the3.5-in. f loppy disk and (b) tomographic image of the samedisk at a constant vertical position, indicated by the dashedline at y 15 mm in (a). Darker stripes indicate positiverefractive-index steps (Dn . 0), and lighter stripes indicatenegative steps (Dn , 0). The vertical axis (optical delay)is related to the waveform delay by Eq. (2), neglecting allrefractive-index variations.
where nj is the refractive index of the medium betweensurfaces j and j 1 1. Therefore the temporal positionof each ref lected pulse is related to the depth of theref lecting interface.
An approximation for the impulse response functionis obtained from a numerical deconvolution of the mea-sured waveforms Astd and Bstd, such as those shownin Fig. 1, curve (c). Given gstd, one can reconstructthe refractive-index profile of the layered structure.In discretized form, the jth time step corresponds toa layer of thickness dj given by Eq. (2) and of refrac-tive index nj given by
nj jY
i1
1 2 ri
1 1 ri
, (3)
where the ref lection coeff icients rk are defined itera-tively by
rk gk
k21Yj1
1s1 2 rj
2d. (4)
Here r1 g1, and, by definition, the initial referenceplane has n0 1.
These expressions are valid in the limit of smallref lection coeff icients when multiple ref lections arenegligible. Also, absorption and dispersion effects areneglected. Finally, the f inite widths of the features inFig. 1, curve (c) (resulting from the finite bandwidth ofthe source) are not accounted for in Eqs. (3) and (4).
Equations (3) and (4) can be used as a basis for analgorithm to derive the refractive-index profile of themedium, given the impulse response function. In thepresent example Eqs. (3) and (4) were used to derivethe index profile of the f loppy disk from the experimen-tal impulse response function shown in Fig. 1, curve(c). The result is shown in curve (d) of Fig. 1. Therethe profile is fairly well reproduced, although the indexdoes not return completely to n 1 in the free-spaceregions. This is because of the aforementioned sim-plifications, most particularly the effect of the f initesource bandwidth, which spreads the index disconti-nuity over a finite length. A more sophisticated algo-rithm for calculating the index profile would includethe f inite bandwidth of the THz source explicitly aswell as the frequency-dependent complex index of thematerial. Then one could use Eq. (2) to calibrate thedepth axis in a tomographic image. This would elimi-nate artifacts such as the apparent discontinuities incontinuous surfaces mentioned above.
It is worth noting that a full three-dimensional rep-resentation of the object can be built just as rapidly asa two-dimensional image, because all the informationabout the third dimension (the depth) is contained in asingle waveform. For example, the image in Fig. 2(b)consists of 217 waveforms and took ,11 s to acquire.
Tomographic T-ray imaging is similar in principleto ultrasonic imaging.8 A commonly encounteredproblem in ultrasonic imaging is the large differencein acoustic impedance between air and liquid orsolid objects, which necessitates some form of indexmatching. For THz waves, the dielectric constants
of many materials are not too different from that ofair, and index matching therefore is not required.Many materials such as plastics, cardboard, wood, andrubber have good transparency in the THz frequencyrange. Hence, this new technology can be effectivelyused in many quality-control applications, for example,to detect voids or cracks. Another application area forT-ray tomography is burn diagnostics. Althoughstrong water absorption precludes the use of THzradiation in biomedical research inside the body, itmay be possible to obtain quantitative and highly sen-sitive measurements of burn depth and burned tissueproperties by use of THz tomography in dermatologicalmedicine.4
In conclusion, the recent research on imagingwith THz waves has been expanded here to includeimaging in a ref lection geometry. Here timing in-formation is correlated with depth information, andwe have found that tomographic slices of objects canbe obtained, with the possibility of three-dimensionalT-ray tomography on a wide range of samples. InT-ray tomographic imaging one can isolate in thetime domain successive ref lections and extract in-formation about each layer of a layered materialindividually. In this fashion detailed spectro-scopic information about subsurface layers can beobtained, with the potential for material identifica-tion. The range of potential applications for T-raytomography is extremely broad, encompassing suchwide-ranging f ields as biomedical imaging, packageinspection, and quality control.
S. Hunsche acknowledges the support of theAlexander von Humboldt Foundation.
*Present address, Department of Electrical andComputer Engineering, Rice University, MS-366,6100 Main Street, Houston, Texas 77005.E-mail: [email protected].
References
1. B. B. Hu and M. C. Nuss, Opt. Lett. 20, 1716 (1995).2. D. Grischkowsky, S. Keiding, M. van Exter, and C.
Fattinger, J. Opt. Soc. Am. B 7, 2006 (1990); N.Katzenellenbogen and D. Grischkowsky, Appl. Phys.Lett. 61, 840 (1992).
3. M. C. Nuss and J. Orenstein, in Millimeter-Wave Spec-troscopy of Solids, G. Gruener, ed. (Springer-Verlag,Berlin, 1997).
4. D. M. Mittleman, R. H. Jacobsen, and M. C. Nuss, IEEEJ. Sel. Topics Quantum Electron. 2, 679 (1997).
5. R. H. Jacobsen, D. M. Mittleman, and M. C. Nuss, Opt.Lett. 21, 2011 (1996).
6. M. van Exter, C. Fattinger, and D. Grischkowsky, Opt.Lett. 14, 1128 (1989).
7. Wavelet processing was performed with the WaveLabsoftware package of J. Buckheit, S. Chen, D. Donoho,I. Johnstone, and J. Scargle, of the Department ofStatistics at Stanford University, available on the WorldWide Web at http://playfair.stanford.edu/,wavelab/.
8. A. C. Kak and M. Slaney, Principles of ComputerizedTomographic Imaging (IEEE Press, New York, 1988).