Annu. Rev. Public Health 2004. 25:247–80 doi: 10.1146/annurev.publhealth.25.102802.124329 Copyright c 2004 by Annual Reviews. All rights reserved TIME-SERIES STUDIES OF PARTICULATE MATTER Michelle L. Bell, 1 Jonathan M. Samet, 1 and Francesca Dominici 2 1 Department of Epidemiology and 2 Department of Biostatistics, Johns Hopkins Bloomberg School of Public Health, Baltimore, Maryland 21205; email: [email protected], [email protected], [email protected]Key Words air pollution, public health, epidemiology, regression models ■ Abstract Studies of air pollution and human health have evolved from descriptive studies of the early phenomena of large increases in adverse health effects following extreme air pollution episodes to time-series analyses based on the use of sophisticated regression models. In fact, advanced statistical methods are necessary to address the challenges inherent in the detection of a relatively small pollution risk in the presence of potential confounders. This paper reviews the history, methods, and findings of the time-series studies estimating health risks associated with short-term exposure to par- ticulate matter (PM), though much of the discussion is applicable to epidemiological studies of air pollution in general. We review the critical role of epidemiological studies in setting regulatory standards and the history of PM epidemiology and time-series anal- ysis. We also summarize recent time-series results and conclude with a discussion of current and future directions of time-series analysis of particulates, including research on mortality displacement and the resolution of results from cohort and time-series studies. INTRODUCTION For centuries, people have understood that outdoor air pollution harms human health. Air pollution has been ubiquitous across human existence because fire, a major pollutant source, has been used for cooking and warmth. The earliest recorded outdoor air pollution problems came largely from coal and wood com- bustion in large cities such as London (12–13). As with today’s approaches to air pollution control, initial attempts to lessen pollution balanced political and economic considerations against detrimental impacts, including those to health, buildings, and other materials, and to the environment more generally. Despite this early recognition of the dangers of air pollution, industrialization and fossil fuel–based transportation during and after the Industrial Revolution caused air pollution concentrations to rise in many areas. Risks to health were readily apparent during extreme air pollution episodes in which excess mortality and morbidity accompanied exceptionally high air pollution levels. By the mid 0163-7525/04/0421-0247$14.00 247
Transcript
19 Feb 2004 11:46 AR AR209-PU25-11.tex AR209-PU25-11.sgm LaTeX2e(2002/01/18)P1: IBD10.1146/annurev.publhealth.25.102802.124329
Annu. Rev. Public Health 2004. 25:247–80doi: 10.1146/annurev.publhealth.25.102802.124329
and Francesca Dominici21Department of Epidemiology and2Department of Biostatistics,Johns Hopkins Bloomberg School of Public Health, Baltimore, Maryland 21205;email: [email protected], [email protected], [email protected]
Key Words air pollution, public health, epidemiology, regression models
■ Abstract Studies of air pollution and human health have evolved from descriptivestudies of the early phenomena of large increases in adverse health effects followingextreme air pollution episodes to time-series analyses based on the use of sophisticatedregression models. In fact, advanced statistical methods are necessary to address thechallenges inherent in the detection of a relatively small pollution risk in the presenceof potential confounders. This paper reviews the history, methods, and findings of thetime-series studies estimating health risks associated with short-term exposure to par-ticulate matter (PM), though much of the discussion is applicable to epidemiologicalstudies of air pollution in general. We review the critical role of epidemiological studiesin setting regulatory standards and the history of PM epidemiology and time-series anal-ysis. We also summarize recent time-series results and conclude with a discussion ofcurrent and future directions of time-series analysis of particulates, including researchon mortality displacement and the resolution of results from cohort and time-seriesstudies.
INTRODUCTION
For centuries, people have understood that outdoor air pollution harms humanhealth. Air pollution has been ubiquitous across human existence because fire,a major pollutant source, has been used for cooking and warmth. The earliestrecorded outdoor air pollution problems came largely from coal and wood com-bustion in large cities such as London (12–13). As with today’s approaches toair pollution control, initial attempts to lessen pollution balanced political andeconomic considerations against detrimental impacts, including those to health,buildings, and other materials, and to the environment more generally.
Despite this early recognition of the dangers of air pollution, industrializationand fossil fuel–based transportation during and after the Industrial Revolutioncaused air pollution concentrations to rise in many areas. Risks to health werereadily apparent during extreme air pollution episodes in which excess mortalityand morbidity accompanied exceptionally high air pollution levels. By the mid
0163-7525/04/0421-0247$14.00 247
19 Feb 2004 11:46 AR AR209-PU25-11.tex AR209-PU25-11.sgm LaTeX2e(2002/01/18)P1: IBD
248 BELL ¥ SAMET ¥ DOMINICI
Figure 1 Air pollution, mortality, and cardiac emergency bed service applications duringthe 1952 London Smog. Source: Bell & Davis (8), U.K. Ministry of Health (177).
twentieth century, several widely publicized acute episodes of air pollution spurredscientific research, public awareness, and government action (91, 177). Three ofthe most dramatic episodes were in the Meuse Valley in Belgium in 1930 (50, 112),Donora, Pennsylvania in 1948 (24, 143), and London in 1952 (8, 177). Pollutionduring these episodes had a large and readily evident impact on mortality andmorbidity (Figure 1).
These and similar events prompted many governments, including the UnitedStates and Britain, to initiate research on air pollution and health and eventually toenact legislation aimed at improving air quality. Such regulatory efforts have donemuch to curb the problem in some areas, yet air pollution remains a significantconcern worldwide, with profound adverse effects on public health (46). Manyareas of the world still suffer from extreme levels of air pollution, with annual con-centrations of total suspended particles (TSP) above 400µg/m3 in some Chineseand Indian cities in the 1990s (181). Recently the World Health Organization’sGlobal Burden of Disease Initiative estimated that ambient air pollution causesalmost 800,000 premature deaths annually (46).
19 Feb 2004 11:46 AR AR209-PU25-11.tex AR209-PU25-11.sgm LaTeX2e(2002/01/18)P1: IBD
TIME-SERIES STUDIES OF PARTICULATE MATTER 249
Research on air pollution’s effects on health has amassed an impressive liter-ature that comes from several relevant disciplines including toxicology, humanexposure assessment, and epidemiology. Although the connection between airpollution concentrations and mortality was readily apparent in the London Fog of1952 (Figure 1), modern air-pollution research in developed countries addressesassociations at far lower levels of pollution. Time-series analysis of morbidity andmortality data has emerged as one of the most important tools for this purpose.The time-series approach investigates associations between short-term changesin pollution levels with short-term changes in acute health outcomes, and it hasbeen applied widely to investigate the health affects associated with exposure toairborne particulate matter (PM) and other pollutants. The use of time-series anal-yses has been facilitated by relatively accessible data from public sources in manycountries.
Findings from time-series studies are relevant to regulatory processes, which setthe standards for pollution at levels considered sufficiently safe for human health(55). Estimating the burden of disease attributable to air pollution exposure canbe part of the regulatory process, sometimes combined with cost information forcost-benefit considerations. In fact, time-series studies have a crucial role in recentdiscussions of the appropriate air quality standards for PM pollution in the UnitedStates and elsewhere (55). Time-series studies results also were used in the CleanAir Act (CAA) Section 812 studies that estimated the costs and benefits of theClean Air Act (40, 42). For example, the number of hospital admissions avoidedby lower levels of PM under the CAA from 1990 to 2010 was estimated usingconcentration-response functions derived from References 14, 16, 107, 146–148,151–152, 164, 166, and 176.
This paper reviews the time-series approach to investigating the risks of PM,placing the analytical approach in the broader context of epidemiological studiesof air pollution in general. We discuss the history of epidemiologic research on PMand the use of time-series analysis. We conclude with a discussion of future direc-tions of time-series analysis of PM, including multicity studies and the merging oftime-series and cohort studies. Whereas our focus is on time-series studies of PM,time-series methods are also applied to other pollutants, particularly ozone (O3).Time-series approaches have broad applicability in investigating the environmentand health, particularly for factors that vary on relatively short timescales (e.g.,temperature).
The Critical Role of Epidemiologic Evidence in Policiesfor Air Pollution Control
The United States Congress enacted the Clean Air Act (CAA) in 1970, whichbuilt on the Clean Air Act of 1953 and the Air Quality Act of 1967. It was sub-sequently amended in 1977 and 1990. The legislation was passed in responseto Congress’s findings that the “amount and complexity of air pollution. . . hasresulted in mounting dangers to the public health and welfare. . .” (20). The
19 Feb 2004 11:46 AR AR209-PU25-11.tex AR209-PU25-11.sgm LaTeX2e(2002/01/18)P1: IBD
250 BELL ¥ SAMET ¥ DOMINICI
Environmental Protection Agency (EPA) is required by the CAA to establish Na-tional Ambient Air Quality Standards (NAAQS) for criteria pollutants, such as PM,that endanger public health and/or welfare. The primary or health-based standardsare to be set at a level sufficient to protect human health with an “adequate marginof safety” for sensitive subpopulations, such as the elderly. Because the criteria pol-lutants are regulated individually, epidemiological studies are generally designedto estimate the health effects from exposure to each pollutant separately, often bycontrolling for the potential confounding effects of other pollutants through studydesign or data analysis.
The Clean Air Act requires the EPA to review each NAAQS at least every fiveyears and to recommend revisions if necessary, based on the most recent healthresearch. The design of the periodic review process is intended to keep regulatorystandards consistent with new scientific evidence (55). During this review process,the EPA is advised by the Clean Air Scientific Advisory Committee (CASAC), aCongressionally mandated panel of scientific experts. The EPA prepares a criteriadocument that compiles and assesses research related to the health and welfareimpacts of the pollutant. The EPA evaluates the policy implications of the cri-teria document and makes recommendations in a staff paper, which describesevidence-based policy options. Both of these documents are subject to external re-view and comment from the public, industry, and other interested parties. CASACmakes final recommendations; EPA then proposes changes to regulatory stan-dards, if needed. Whereas the EPA administrator has final authority to promulgatea NAAQS, the Executive Branch also performs a review.
Epidemiological evidence on the health impacts of particulate air pollutionplays a pivotal role in the setting of regulatory standards. Findings from com-plementary disciplines, such as animal toxicology and clinical human exposurestudies, have also contributed to the body of knowledge of how air pollution affectshealth, especially in characterizing the biological mechanisms underlying adversehealth effects. Such evidence on mechanisms reduces uncertainty, particularly inextrapolating risks to exposures at lower pollution levels for which epidemiologi-cal data are lacking. For PM and several of the other criteria pollutants, it is largelythe direct evidence of epidemiologic research that drives the setting of standards.Epidemiological evidence has prominence in the regulatory process because itdirectly addresses human health at exposures experienced by the population.
PARTICULATE MATTER
The health effects of airborne particles have been vigorously investigated for fivedecades (45, 122). PM has been linked to numerous adverse health effects includingincreased hospital admissions and emergency room visits, respiratory symptoms,exacerbation of chronic respiratory and cardiovascular diseases, decreased lungfunction, and premature mortality (45). The broad range of epidemiological studiesof the health effects of PM has been reviewed elsewhere (25, 45, 60, 122, 123,175, 180); this review focuses on time-series approaches because of the recent
19 Feb 2004 11:46 AR AR209-PU25-11.tex AR209-PU25-11.sgm LaTeX2e(2002/01/18)P1: IBD
TIME-SERIES STUDIES OF PARTICULATE MATTER 251
emergence of this method and the central role of time-series findings in settinghealth-based regulatory standards.
The term particulate matter refers to solid or liquid particles in the air. PM hasmany sources and can be either primary or secondary in origin. Primary PM isemitted directly and can be either coarse or fine, whereas secondary PM, whichtends to be finer in size, is formed in the atmosphere through physical and chemicalconversion of gaseous precursors such as nitrogen oxides (NOx), sulfur oxides(SOx), and volatile organic compounds (VOCs). Whereas most air pollutants aredefined with respect to a particular chemical composition, PM is a generic term thatincludes a broad range of physical characteristics and chemical species. It is theonly major pollutant regulated under Section 109 of the CAA to be defined withoutregard to chemical form (20). The pollutants regulated under this section, oftenreferred to as criteria pollutants because of the process used to develop standards,include five others: lead, carbon monoxide (CO), sulfur dioxide (SO2), nitrogendioxide (NO2), and ozone.
For regulatory and scientific purposes, PM is measured according to themass concentration within a specific size range (Figure 2 and Table 1). Size
Figure 2 Particulate matter size distribution by volume for urban areas. Adapted fromWilson & Suh (179).
19 Feb 2004 11:46 AR AR209-PU25-11.tex AR209-PU25-11.sgm LaTeX2e(2002/01/18)P1: IBD
252 BELL ¥ SAMET ¥ DOMINICI
TABLE 1 Measures of particulate matter in air
Particle metric Definition
Black smoke or A nongravimetric measure in which air is passed through a filterBritish smoke (BS) paper and the darkness of the resulting stain is determined
Coefficient of Measure of the intensity of light transmitted through a filter withhaze (COH) particles relative to that of a clean filter
Total suspended Particles with an aerodynamic diameter up to approximatelyparticles (TSP) 45 microns
PM10 Particles with an aerodynamic diameter no larger than 10 microns
PM2.5 Particles with an aerodynamic diameter no larger than 2.5 microns
Ultrafine Particles with an aerodynamic diameter no larger than 0.1 microns
characteristics are linked to sources and are a determinant of atmospheric trans-portation, environmental deposition, and the pattern of deposition in the respiratorysystem. Particle size is characterized by aerodynamic diameter, which is the di-ameter of a uniform sphere of unit density that would attain the same terminalsettling velocity as the particle of interest. This measure facilitates size compari-son among irregularly shaped particles and refers to the physical behavior of theparticles rather than the actual size. Aerodynamic diameter is determined by aparticle’s shape and density. TSP can be measured by a high volume sampler (HiVol); however, this method does not collect all particles in the coarse mode, asdoes a wide area aerosol classifier (WRAC) (179) (Figure 2).
For regulatory and research purposes, several different particle metrics havebeen used (Table 1). Thus, the various fractions of PM in air have been definedand measured without regard to their composition, to date.
Particles in the air can be characterized both physically and chemically. In typ-ical urban environments, there are two broad sets of source categories: (a) com-bustion sources, including mobile sources (predominantly vehicles) and stationarysources (primarily industrial sources and power plants); and (b) mechanical forces,including wind, and vehicle traffic and other activities. The smaller particles resultfrom combustion and stationary sources, whereas the larger particles tend to comefrom mechanical forces, such as wind or road traffic. Particles in urban air tendto have a multimodal distribution, reflecting these sources (Figure 2). Three basicsize modes have been identified: nuclei (particles with a diameter less than about0.1µm), accumulation (particles with a diameter of about 0.1 to 1 or 2µm), andcoarse (particles with a diameter above 1 or 3µm) (45). In a sample of urbanair, coarse particles typically make up a small fraction of all particles with regardto number density but comprise a large fraction with respect to volume or mass.Smaller particles contribute less to total volume and mass but more to surfacearea and the total number of particles. In recent health effects research, emphasishas been placed on the smaller particles because they are in the size range thatpenetrates into the lung without being removed in the upper airway (45).
19 Feb 2004 11:46 AR AR209-PU25-11.tex AR209-PU25-11.sgm LaTeX2e(2002/01/18)P1: IBD
TIME-SERIES STUDIES OF PARTICULATE MATTER 253
Although PM is classified by size for regulatory purposes and also for healthresearch, other physical and chemical characteristics may also be relevant to health.The composition of PM differs by geographic area and can vary with season,source, and meteorology (43, 45). In the eastern United States, PM often has asubstantial sulfate component, reflecting the contributions of emissions from powerplants; in the West, transportation emissions contribute a larger fraction of PM,and hence PM samples in some western locations tend to have a substantial nitratecomponent. In the Northwest, wood burning may be a dominant source duringcolder seasons. These regional differences in emissions sources account for someof the variation in PM composition across the country, and these compositionaldifferences may be relevant to risk to health, a topic currently of research interest;however, mass-based PM measures do not index composition and hence may notadequately capture the risk to health posed by exposure to PM.
PM and other major air pollutants in urban air have common sources and existas a complex mixture. Sulfur dioxide and PM are both generated by the combus-tion of sulfur-containing fuels, particularly coal, although PM has numerous othersources. The heat of combustion generates sulfur oxides, which can contribute tothe formation of PM via secondary aerosol formation. VOCs are a key precursor totropospheric ozone (smog), which is also regulated as one of the criteria pollutantsunder the Clean Air Act. Although the gaseous pollutants NO2 and SO2 contributeto PM formation, they are also separately regulated pollutants that can indepen-dently cause adverse health effects at sufficiently high concentrations (1, 142).Thus, although PM is regulated specifically, it is one component of the complexmixture of pollutants present in outdoor air. In investigating the health effects ofair pollution, researchers face the challenge of attempting to disentangle effects ofthe components of a complex air pollution mixture.
As researchers have gained a deeper understanding of how PM affects humanhealth, and evidence for adverse health effects has mounted, the NAAQS havebeen revised. In 1971, the EPA established a 24-h average NAAQS for TSP of 260µg/m3 and an annual average of 75µg/m3 (38). In 1987, the EPA replaced theTSP standards with requirements for PM10: a 24-h average of 150µg/m3 and anannual average of 50µg/m3averaged over three years (39). This change reflectedan evolving understanding of the dosimetry of particles in the respiratory tract andimproving measurement capability.
In the early 1990s, new evidence on PM, coming primarily from time-seriesstudies, led to a further revision of the PM NAAQS. Motivated by the new time-series evidence and the EPA’s tardiness in developing a new PM criteria document,the American Lung Association and other organizations successfully sued the EPAto perform the required review of the PM and ozone NAAQS, eventually leading tothe 1997 revisions. The revised PM standards, largely reflective of epidemiologicalevidence coming from the time-series and longer-term cohort studies of mortality,added a new standard for PM2.5(24-h standard of 65µg/m3and an annual average of15µg/m3), while retaining the PM10standard (41). These changes to the regulatoryrequirements were based on an enhanced understanding of the potential health
19 Feb 2004 11:46 AR AR209-PU25-11.tex AR209-PU25-11.sgm LaTeX2e(2002/01/18)P1: IBD
254 BELL ¥ SAMET ¥ DOMINICI
effects associated with particles of smaller size. In these revisions to the NAAQS,the EPA also made modifications to the details of how exceedances and attainmentare calculated. For instance, the 24-h PM2.5 standard is not to be exceeded by athree-year average of each year’s 98th percentile of the 24-h values.
American Trucking and other industries challenged the EPA’s 1997 revisions tothe NAAQS for PM and tropospheric ozone (48, 103). A Washington D.C. CircuitCourt found that PM10 is not an appropriate indicator for coarse particles and thatthe regulation of both PM10 and PM2.5 constitutes double regulation because thematter in PM2.5 would also be a part of PM10. The EPA recently called for a risk-analysis plan for PM10-2.5(the “coarse fraction” between 2.5µm and 10µm) andPM2.5 and may revise the NAAQS to include a standard for the coarse fractionrather than PM10.
EPIDEMIOLOGICAL STUDY DESIGNS: TIME-SERIESAND COHORT STUDIES
Several epidemiological study designs have been used to investigate air pollutionand health (133). These studies use different methods for estimating health risksassociated with variation in exposure across spatial and temporal gradients. Studytypes are often distinguished by their use of individual- or aggregate-level data onexposure, health, and modifying and confounding factors. A confounder, possiblya copollutant, is associated with both the outcome and the exposure of interest butis not in the causal pathway between the exposure and health endpoint. Most airpollution studies use exposure indicators aggregated over a specific geographicarea, and some studies use a mixture of individual- and group-level exposures.
Some contemporary studies use individual-level health outcomes and risk fac-tors but rely upon aggregate-level exposure (e.g., concentration recorded by nearestmonitor) (78). These studies cannot account for differences in exposure based onsubregional scale changes in pollution levels or people’s activity patterns. As anexample, the Children’s Health Study is a 10-year prospective cohort study insouthern California that combines multiple design approaches to investigate theeffects of air pollution on∼6000 children in 12 California communities (51–52,111, 118–119). Data regarding indoor air pollution and confounders are collectedat the individual level, whereas outdoor air pollution is assessed at the communitylevel. Geographical information systems (GIS) are used to assess differences inexposure within a community, such as varying exposure to pollution from traf-fic. This hybrid design combines comparisons among individuals’ exposure withcomparison among particular groups (e.g., across communities).
Most contemporary epidemiological research of air pollution’s health effectsuses either cohort or time-series approaches. Some studies are cross-sectional indesign, and associations between environmental pollutants and health outcomesare assessed at one point in time. Time-series studies assess the effects of short-termchanges in air pollution on acute health effects by estimating associations between
19 Feb 2004 11:46 AR AR209-PU25-11.tex AR209-PU25-11.sgm LaTeX2e(2002/01/18)P1: IBD
TIME-SERIES STUDIES OF PARTICULATE MATTER 255
day-to-day variations in both air pollution and in mortality and morbidity counts.Thus, the data for daily time-series analysis include daily measures of the numberof health events (e.g., daily mortality count), concentrations of PM and otherpollutants (e.g., 24-h average PM10), and weather variables (e.g., daily temperature)for a given area. Short-term effects from time-series studies are estimated byusing regression models where the concentration of PM is included in the modellagged for 0 (current day) to a few days. Recent methodological developmentsin time-series analyses allow estimation of subchronic health effects associatedwith changes in exposure averaged over a few weeks. The different timescales ofpollution, mortality, and weather are shown in Figures 3a andb, which providethe daily PM10 concentrations and cardiovascular mortality for Pittsburgh as the
Figure 3 (a) Frequency decomposition of daily PM10 levels [µg/m3] for Pittsburgh.Source: Dominici et al. (33). (b) Frequency decomposition of daily cardiovascular mor-tality for Allegheny County (Pittsburgh).
19 Feb 2004 11:46 AR AR209-PU25-11.tex AR209-PU25-11.sgm LaTeX2e(2002/01/18)P1: IBD
256 BELL ¥ SAMET ¥ DOMINICI
Figure 3 (Continued)
components representing various timescales. The first line represents the long-term fluctuations in the series that have a cycle larger than two months. The lastline shows the daily data. The PM data shows seasonal behavior, with higherconcentrations during the summer months. Cardiovascular mortality also showscyclical behavior, with higher mortality in winter and an overall decline. A time-series analysis of these data would investigate the association between daily PM10
and mortality, controlling for daily variations in temperature and seasonal trends.Time-series studies assess the association of short-term variation in pollution
and health outcomes within the same geographical area; thus, the population servesas its own control, and confounding by population characteristics is negligible asthey are quite stable day to day. However, time-series studies can be affected byconfounding bias arising from factors such as influenza epidemics and temperature,which vary on short timescales, and may be associated with pollution and health
19 Feb 2004 11:46 AR AR209-PU25-11.tex AR209-PU25-11.sgm LaTeX2e(2002/01/18)P1: IBD
TIME-SERIES STUDIES OF PARTICULATE MATTER 257
outcomes. For example, PM concentrations in some regions peak during the wintermonths, as does the occurrence of respiratory illnesses, such as influenza. However,factors such as smoking are not likely confounders for time-series studies becausethey do not vary on short-term timescales and are not associated with air pollutionlevels.
Statistical concerns for estimating short-term effects from analyses of time-series data include: (a) controlling for observed and unobserved confounding fac-tors, such as season and temperature, that might confound the true associationbetween pollution and health; (b) accounting for serial correlation in the residualsthat might underestimate statistical uncertainty of the estimated risk; (c) selectingthe lag of the exposure variable; (d) accounting for exposure measurement error;and more in general, (e) assessing and reporting uncertainty associated with thechoice of statistical model.
Regression models are used in time-series analysis to estimate the increase inrisk for a health outcome, such as mortality, associated with a unit increase in am-bient air pollution levels on a short-term basis. Frequently used statistical methodsfor time-series analysis include regression models with smooth functions of timeand temperature to adjust for seasonal variations, long-term trends, and tempo-ral changes in temperature that might bias the estimation of the health risk. Themost common choices for the regression models are the generalized linear model(GLM) with parametric regression splines (e.g., natural cubic splines) and general-ized additive models (GAM) with nonparametric splines (e.g., smoothing splinesor loess smoothers). GLM uses iteratively reweighted least squares (IRWLS) toestimate the health risk, whereas GAM uses the backfitting algorithm. Previousanalyses suggest that the difference between the health risk estimates from GAMand GLM depends on (a) the unknown underlying nonlinear functions of time,weather, and seasonality; (b) the degree of adjustment for confounding factors;and (c) the correlation between the time-varying predictors, also called concurvity(33).
In the regression formulation it is assumed that the daily number of deathsYt
has an overdispersed Poisson distribution with expected value E[Yt] = µt where,for example,
where PM10,t-1 = PM10 concentration on the previous day,DOW = indicatorvariables for day of week,Tt = temperature on dayt, Dt = dew point on dayt,s(Tt, 8) = smooth function of temperature with 8◦ of freedom, s(Dt, 3) = smoothfunction of dew point with 3◦ of freedom, s(Time, 7) = smooth function of timewith 7◦ of freedom, andβPM = log relative rate.
Time-series models can also include additional terms for other confounders,including other pollutants. Distributed lag models simultaneously include termsfor multiple lagged measures of the pollutant, as shown in the following example,which includes terms for the effect of PM10 up to a week previously:
19 Feb 2004 11:46 AR AR209-PU25-11.tex AR209-PU25-11.sgm LaTeX2e(2002/01/18)P1: IBD
Complementary information on longer-term associations of air pollution expo-sure with health outcomes is obtained from cohort studies. Cohort studies generallycompare long-term average pollution levels (e.g., years) and adjusted mortalityrates across geographical locations rather than day-to-day variations in pollutionand mortality counts within a geographic location. In cohort studies, exposures toair pollution generally have been estimated by using place of residence as the linkto air pollution concentrations at the community level. In most major cohort stud-ies published to date, exposure is based on a single measure of air pollution thatrepresents the exposure at a specific time or cumulative exposure. The measure-ment error associated with this approach can be estimated using nested validationstudies with measurements made at home locations or using personal monitors.Model-based approaches using GIS have been incorporated into several recentstudies (64–65). Cohort studies have incorporated discrete outcomes, includingmortality, as well as changes in physiologic indicators such as lung-function level.Key advantages of the cohort study are the ability to assess individual risk factorsof susceptibility and to adjust for individual-level confounders such as smokingstatus, race, body mass index, and occupation. Although the use of individual levelinformation reduces the potential for residual confounding, cohort studies are lim-ited by the adequacy of data on these confounders, the appropriateness of modelsused for confounder adjustment, and often the lack of personal exposure data.
A prominent cohort study of particulate air pollution and mortality was theHarvard Six Cities Study, which identified a relationship between air pollutionlevels and adjusted mortality rates in a cohort of more than 8000 adults in six U.S.cities. The adjusted mortality-rate ratio was 1.26 [95% confidence interval (CI)1.08 to 1.47] comparing the most polluted city, Steubenville, Ohio, to the leastpolluted city, Portage, Wisconsin, which corresponds to an 18.6µg/m3 differencein PM2.5averaged over∼9 years (26). Another cohort study, the American CancerSociety (ACS)’s Cancer Prevention Study (CPS) II, considered∼500,000 adultsin 151 U.S. metropolitan areas (121, 126). The adjusted relative risk ratio for totalmortality comparing the most polluted to the least polluted areas was 1.17 (95%CI 1.09 to 1.26), which corresponds to a 24.5µg/m3 increase in PM2.5 averagedover∼5 years.
THE EVOLUTION OF THE TIME-SERIES APPROACHTO STUDYING AIR POLLUTION AND HEALTH
Early epidemiological evidence on the health effects of air pollution came largelyfrom studies of extreme episodes, when high air pollution levels over severaldays were accompanied by noticeably large increases in mortality and morbidity(2, 24). Analyses of severe air pollution episodes examined the association between
19 Feb 2004 11:46 AR AR209-PU25-11.tex AR209-PU25-11.sgm LaTeX2e(2002/01/18)P1: IBD
TIME-SERIES STUDIES OF PARTICULATE MATTER 259
pollution levels and mortality through correlations and found strikingly similarpatterns between high air pollution concentrations over several days and excessmorbidity and mortality in several industrial and urban locations including London,Donora, the Meuse Valley, and New York City (e.g., 7, 8, 50, 56–58, 99, 177).
As such high levels became less frequent, more formal time-series analysis wasrecognized as a useful tool for the study of air pollution and health (10). Manyof these studies utilized growing public databases on health outcomes, weathervariables, and pollution. Even in the decade following the 1952 London event, itwas possible to track mortality and air pollution using daily data. In early studies,time-series data were analyzed by the use of linear regression methods. Researcherswere aware of the need to address potential time-varying confounders such asweather and season, included such terms in models or stratified by season ortemperature, and also attempted to account for day-of-the-week and holiday effects(e.g., 53, 54, 141).
Several early analyses examined the relationship between air pollution and mor-tality in London [e.g., the winters of 1958–1959 and 1959–1960 by Martin (95)and Martin & Bradley (96)], in part because the air quality in London was trackedafter the London Fog of 1952. Mortality in London during this period was alsoinvestigated by MacFarlane who used visual inspection to examine the relation-ships among low temperature, influenza epidemics, air pollution, and mortality inLondon from the 1950s to the early 1970s (94). Mills (102) used time-series anal-ysis to assess respiratory and cardiac deaths in Los Angeles. Other studies foundassociations between air pollution and cough and eye irritation (100), bronchitis(17, 82, 83), respiratory illness (3), and lung function (5, 6, 171, 172).
In the 1970s and 1980s, research on air pollution and health largely involvedthe use of cross-sectional designs comparing the morbidity and mortality ratesacross cities with different ambient air pollutant concentrations (e.g., 18, 49, 80,89). Sprague & Hagstrom (170) used multiple regression techniques to investigateyearly air pollution levels and fetal and infant mortality rates in Nashville. By thelate 1980s, researchers were considering the effects of particle size and source (e.g.,117). These studies identified associations between PM and health, as adjustedmortality rates were higher in more polluted cities, but much of this research waslimited by the ecologic design and lacked information on potentially confoundingand modifying variables (133).
Time-series approaches were also used in the 1970s and 1980s to investigatethe association between short-term changes in air pollution levels and mortalitycounts (e.g., 62, 113, 140, 167) (see 67 and 90 for review). Some research revis-ited mortality in London (e.g., 68, 97, 113, 163). Additional time-series analyseswere performed for New York City (9, 53, 63, 84, 85, 116, 139, 141), Tokyo (87),Philadelphia (182), and 117 U.S. metropolitan areas (81). Investigators recognizedthe importance of the potential confounding effects of: (a) the levels of other pollu-tants; (b) weather; and (c) seasonal variations in mortality due to influenza, whichmight be associated erroneously with the seasonal variations in PM. However,these investigators faced the challenge of adjusting for all of these confounders
19 Feb 2004 11:46 AR AR209-PU25-11.tex AR209-PU25-11.sgm LaTeX2e(2002/01/18)P1: IBD
260 BELL ¥ SAMET ¥ DOMINICI
properly, given the constraints of the then-available statistical models and compu-tation. Proper adjustment of confounding is still a concern today. Techniques usedby these investigators to adjust for the confounding effects of current and pasttemperature levels included use of a moving average of past temperature (e.g.,182), stratification by temperature (e.g., 53), correction for periods of heat waves(e.g., 141), and comparison of regions with similar weather but different pollutantlevels (e.g., 54).
Although many of these studies had limited data, generally they found asso-ciations between air pollution and mortality, with higher levels of mortality ac-companying higher levels of air pollution. Typical measures of PM were BritishSmoke or KM (carbonaceous material). One early time-series study of air pollutionand mortality examined daily mortality in New York City for 10 years and dailylevels of SO2 and smoke shade, a measure of particulate pollution, adjusted fordaily temperature (141). This study reported an association between air pollutionlevels and total, respiratory, and cardiac mortality. Additional time-series studiesidentified associations between daily particulate levels and health effects includingmortality, heart disease, emergency room visits, and respiratory symptoms (e.g.,86, 98, 116, 128).
By the early 1990s, advances in computing hardware, statistical models, andsoftware facilitated a new wave of time-series studies that were distinguished bymore sophisticated approaches to account for temporal confounding. Many of theseadvances adopted statistical methods from other disciplines. Whereas earlier workaddressed confounding through techniques such as stratification and model vari-ables, newer approaches used harmonics and later, smoothing to remove temporaltrends. Key studies in this period include analysis of mortality in Steubenville,Ohio, which used a random-effects model for yearly fluctuations of mortality andnonlinear models of weather’s impact on mortality (160) and in Birmingham,Alabama using harmonics (trigonometric filtering) to remove long-term patternsof season and month (145). The regression model used by Fairley (47) to ex-amine mortality in Santa Clara County, California included separate third-orderpolynomials for each year and a second-order model for temperature. Researchon mortality and PM in Cincinnati used several methods of smoothing includingnatural splines, cubic polynomials fitted to intervals of time or temperature, andnonparametric smoothing (149).
Currently used statistical approaches for time-series analysis are generalizedlinear models (GLM) with parametric splines (101) and generalized additive mod-els (GAM) with nonparametric splines (59). These regression techniques estimatethe association between short-term changes in air pollution and short-term changesin mortality, while smoothing for fluctuations in time-varying confounders suchas season, weather variables, and other trends. These methods are more flexiblethan earlier approaches in their assumptions regarding temporal confounders andeffects on mortality.
The new time-series studies provided compelling evidence that short-termchanges in even low levels of air pollution could be associated with short-term
19 Feb 2004 11:46 AR AR209-PU25-11.tex AR209-PU25-11.sgm LaTeX2e(2002/01/18)P1: IBD
TIME-SERIES STUDIES OF PARTICULATE MATTER 261
changes in mortality at a single location. Several studies in the early 1990s identi-fied associations between cause-specific mortality and air pollution using Poissonregression techniques, which are appropriate for analyzing count data such as mor-tality. The measure of PM was generally TSP (e.g., 73, 144, 159, 160), COH (e.g.,47), or PM10 (e.g., 27, 125, 145).
Initially, the findings of these studies were quite controversial, in part because ofthe novelty of their methods and also because of the implications of their findings.Critics argued that the observed associations could have resulted from the specifi-cation of statistical models, with a bias toward those giving larger effect estimatesand hence more likely to be statistically significant, and also from uncontrolledconfounding by other time-varying factors, particularly weather (70).
Additionally, publication bias could have contributed to the reporting of resultsthat show positive associations, whereas null findings would go unreported. How-ever, over time, the associations were observed in data from numerous locationsanalyzed with differing approaches. Furthermore, the Health Effects Institute ar-ranged for replication of several key data sets and analyses, which were publishedin 1995 as the Criteria Document was in development (134). This model of com-missioned reanalysis was later applied to the cohort study data as well (76). Severalstudies have found that alternative approaches to control for confounding and ef-fect modification by weather did not greatly alter effect estimates for pollutionand mortality (124, 137). However, an investigation of bias from model selectionand residual confounding in King County, Washington found the absolute amountof bias to be small in absolute terms, but on the same order of magnitude as theestimated health risk (93). Time-series studies have now identified associationsbetween PM and mortality in many cities in the U.S. and other countries includingPoland (69), Spain (4), France (187), the Netherlands (66), Mexico (91), Thailand(114), Chile (115), and the Czech Republic (120).
As experience with these methods has grown, so has an appreciation of thesensitivity of model results to the details of model specification and of subtle,technical issues that were poorly recognized previously (130). Uncertainty stillexists with regard to the degree of control for temporal confounding. The choiceof statistical model (e.g., GAM or GLM) was also found to affect the magnitudeof the estimated effect. A recent paper reported that concurvity (the nonparametricequivalent to collinearity) in time-series studies of mortality and PM can result inunderestimation of the variance of effect estimates (127).
The sensitivity of findings to details of model specification was further high-lighted by the identification of a problem with the default implementation of acommonly used statistical software package, S-plus (33, 130). When the estimatedregression coefficients are small and confounding factors are modeled using twoor more nonparametric smoothing functions, the default settings for generalizedadditive models in the S-plusgamfunction were not sufficiently strict for assuringconvergence of the algorithm used for estimating pollution health effects. Inappro-priate implementation ofgamfor time-series analyses using default settings mightbias the relative rate estimates. In addition,gamestimates the standard errors of
19 Feb 2004 11:46 AR AR209-PU25-11.tex AR209-PU25-11.sgm LaTeX2e(2002/01/18)P1: IBD
262 BELL ¥ SAMET ¥ DOMINICI
the relative rates through an approximation that assumes the smooth part of themodel is linear and thus understates statistical uncertainty. An S-plus package,gam.exact, has been developed to allow a more robust assessment of the uncer-tainty of air pollution effects (32). The improved analyses show lower air pollutioneffects but still demonstrate a consistent harmful impact of PM on daily mortality.Thus, the key health implications of results remain unchanged (22). Reanalysisof the National Morbidity, Mortality, and Air Pollution Study (NMMAPS) workindicates that daily mortality from all causes is increased 0.21% per 10-µg/m3
increase in PM10, rather than the original estimate of 0.4% generated using S-plusdefault parameters (61). Other research was reanalyzed as well, and results aresummarized in a Health Effects Institute report (61).
The use of multicity studies is a major advance in time-series research on airpollution. Results from single-city studies are potentially limited in their gener-alizability to other areas because the statistical approaches used to analyze datavary with each study and the city and population characteristics may differ. Withmulticity studies it is also possible to map variation in the magnitude of the effectof air pollution across geographic regions and to explore the sources of this varia-tion. The following is an example of a hierarchical model in which the estimatesgenerated by city-specific models, such as shown in Equations 1 or 2, are combinedin a second stage to produce a regional or national effect estimate:
βCR = βR+
P∑j=1
α j xCj + εC
R, 3.
whereβCR = log relative rate for the cityC in regionR, βR = log relative rate
for the regionR, xCj = city-specific characteristicj for city C (e.g., population
The use of standardized approaches to examine time-series data from numer-ous cities allows a more comprehensive assessment of the air pollution healtheffects than meta-analyses of separate studies of individual cities that may haveused inconsistent methods. More conventional meta-analysis also has been usedto produce a weighted average of single-city results (e.g., 88, 145a). Unlike tradi-tional meta-analysis that combines published findings of individual cities, multicitystudies are not subject to publication bias resulting from failure to publish insignif-icant or negative results. Some cities included in multicity research have not beenstudied previously with time-series analysis. Multicity studies also benefit fromconsistent data analysis and model specifications and can examine systematicallyregional differences, which is especially valuable given the heterogeneous natureof PM (45). Another advantage is that city-specific confounding biases are likelyto average out when national averages are estimated.
Several studies have examined the effects of PM across multiple cities (e.g.,11, 15, 21, 23, 29, 30, 36, 37, 74, 75, 79, 104, 105, 153, 155, 157, 158, 162,165, 176a), including two large-scale projects: the Air Pollution and Health: AEuropean Approach (APHEA) (71, 72) and NMMAPS (131, 135).
19 Feb 2004 11:46 AR AR209-PU25-11.tex AR209-PU25-11.sgm LaTeX2e(2002/01/18)P1: IBD
TIME-SERIES STUDIES OF PARTICULATE MATTER 263
RESULTS OF TIME-SERIES STUDIES OF MORTALITYAND PARTICULATE MATTER
Numerous time-series studies, in different locations and using various model spec-ifications, have provided evidence that PM and mortality are associated. Results oftime-series studies of PM are summarized in the EPA’s Air Quality Criteria Docu-ments (44, 45). The 1996 Air Quality Criteria Document incorporated results from35 PM and mortality time-series studies published between 1988 and 1996 (44).These studies used a range of statistical approaches; however, only five usedgamwith the default convergence criteria. Thus, the EPA concluded that the studiescould be summarized without undue bias relating to the problems of the defaultgamconvergence criteria. Based on these studies, a 50-µg/m3 increase in 24-hPM10 is associated with a 2.5% to 5% increase in premature non-accident mor-tality for the general population, with higher risks for the elderly and those withpreexisting cardiopulmonary conditions (44). Time-series analysis of the citiesused in the Harvard Six Cities study indicated that fine PM appears to be associ-ated with a 3% increase in total mortality for a 25-µg/m3 increase in daily PM2.5
(74, 157, 161).Of the 80+ time-series studies on PM and mortality published since 1996,
approximately 70% used GAM methods, quite likely with the default convergencecriteria. Almost all of these showed statistically significant associations betweenshort-term PM concentrations and mortality. Of the studies that did not use GAMmethods or were reanalyzed using appropriate statistical methods, the estimatedeffects are largely consistent with earlier studies with a 1% to 8% increase inmortality for every 50-µg/m3 increase in daily PM10 and a 2% to 6% increase indaily mortality per 25-µg/m3 increase in PM2.5 (45).
From the time-series mortality literature, the EPA concluded that the effectestimates for PM and mortality (a) are unlikely to be biased to a large degree byinadequate control for temporal trends such as seasonal effects, although someresearch (e.g., 106, 136) found different PM effects by season; (b) are unlikelyto be confounded by weather as evidenced by synoptic weather models; (c) maypossibly be confounded or modified by copollutants because although the effectof PM on mortality generally remains when other pollutants are considered, it isoften somewhat reduced; and (d) show no evidence for a threshold effect (45).However, possible publication bias in studies of PM and mortality was indicatedby a comparison of NMMAPS (before reanalysis) and 21 individual studies, whichfound that 93% of the individual studies’ results showed positive associations, 79%of which were statistically significant, whereas only 72% of the NMMAPS citieshad positive associations, of which 13% were statistically significant (168).
Few studies have investigated risks of PM in relation to chemical composition;however, time-series analysis of the cities included in the Harvard Six Cities Studyexploring size fraction of PM (PM2.5, PM10/15, and PM10/2.5), sulfates, and H+ foundPM2.5 to be the index most significantly associated with mortality (74, 157, 161).Analysis of daily mortality and the elemental composition of various size fractions
19 Feb 2004 11:46 AR AR209-PU25-11.tex AR209-PU25-11.sgm LaTeX2e(2002/01/18)P1: IBD
264 BELL ¥ SAMET ¥ DOMINICI
of PM indicated that PM2.5combustion particles from mobile and coal combustionsources were associated with mortality (79). Other evidence suggesting an effectof small particles includes studies of hospital admissions and fine particles (45).
The APHEA project, supported by the European Commission, studied the short-term effects of air pollution on human health in 15 European cities. A primary goalof the study was to analyze the time-series data under a common framework sothat results would be comparable. APHEA researchers used time-series analysisto estimate the relative risk of total, respiratory, and cardiovascular disease mor-tality and hospital admissions associated with daily changes in the concentrationsof several pollutants. City-specific estimates were combined to estimate regionaleffects. For western European cities, an increase of 50µg/m3 in daily PM10 wasassociated with an estimated 2% increase in total daily mortality (95% CI 1% to3%). In central eastern European cities, a 50-µg/m3 increase in daily PM10 wasassociated with a 4% (95% CI 0.3% to 9%) increase in total daily mortality. Resultsfor Black Smoke were higher for western European cities than for central east-ern European cities (72). Subsequent analysis to investigate regional differences,confounding, and sensitivity of the results to model specifications provided largerpollution effect estimates and indicated that part of the heterogeneity in regionalresults was due to the statistical approach (138).
The second phase of this work, APHEA 2, examined mortality and pollutionfor 29 European cities. A 10-µg/m3 increase in daily PM10 or Black Smoke levelswas associated with a 0.6% increase (95% CI 0.4 to 0.8%) in total daily mortality(71). The concentration of NO2 was found to modify the relationship between PMand mortality, with a stronger association at high NO2 levels.
NMMAPS, sponsored by the Health Effects Institute, examined the effect ofPM on mortality and hospital admissions (131, 135). Initial analyses were based onmethods development and estimation of relative rates of mortality associated withshort-term exposure to PM10 in 20 large U.S. cities (37, 129, 131, 135). Furtheranalyses were carried out to estimate relative rates for 90 large U.S. cities from 1987to 1994 (30, 34) and on average for the entire nation. Additional methodologicalwork included the development of statistical methods to (a) adjust for exposuremeasurement (36, 186); (b) investigate the question of mortality displacement (35,185); (c) test the hypothesis of a nonlinear relationship between air pollution levelsand mortality, including the possibility of the existence of a threshold effects (23,30, 154); and (d) estimate city-specific, regional, and national relative rates, takinginto account heterogeneity (28, 129, 135).
One of the most important contributions of NMMAPS was the development andapplication of new methodology to address confounding and measurement errorand to combine evidence. The NMMAPS researchers developed a unified statisticalframework to combine city-specific estimates to provide a national estimate of theimpact of changes in daily PM10 on daily mortality (33, 34, 37, 129, 131). First,the relative change in mortality associated with changes in air pollution levelswas estimated separately for each city using generalized additive models. Next, aBayesian hierarchical model was used to produce regional and national average
19 Feb 2004 11:46 AR AR209-PU25-11.tex AR209-PU25-11.sgm LaTeX2e(2002/01/18)P1: IBD
TIME-SERIES STUDIES OF PARTICULATE MATTER 265
estimates taking into account the heterogeneity of the health effects within andacross regions. The results showed that a 10-µg/m3 increase in daily average PM10
was associated with a 0.21% increase in total mortality (95% CI 0.04 to 0.33),with slightly larger effects for mortality related to heart and lung disease. Figure 4provides the city-specific, regional, and national effects for the percent change inmortality associated with a 10-µg/m3 increase in daily PM10. The largest regionaleffect was for northeastern United States (61, 135).
One approach for the future is Air Pollution and Health: A Combined Euro-pean and North American Approach (APHENA), which builds upon the multicitystudies conducted in the United States and Europe (NMMAPS and APHEA). Aprimary goal of APHENA is to characterize the effects of air pollution on mortalityand morbidity in Europe and North America using a common analytic frameworkand building upon previous work in Europe, the United States, and Canada. Thisapproach will explore the spatial variation in the health effects of air pollution.
CURRENT AND FUTURE DIRECTIONS IN TIME-SERIESPARTICULATE MATTER RESEARCH
Time-series methods have advanced greatly since the earliest studies. For example,multisite time-series analyses have estimated regional and national averages ofpollution effects, which are important pieces of evidence for setting air pollutionquality regulations. Availability of national databases in pollution, weather, andhealth, and the progress in computational tools and statistical methods, have madepossible the estimation of national average pollution effects and the exploration ofpotential sources of heterogeneity in the effects of air pollution across countries orregions. Time-series studies have also benefited from the work of complementarydisciplines, especially with respect to PM speciation and biological mechanism.However, interpretation of the findings of time-series analysis of PM needs totake several challenging issues into consideration, including possible uncontrolledconfounding and the resolution of seemingly conflicting results from time-seriesand cohort studies. Additionally, interpretation of time-series studies is made moredifficult by the need to consider the degree of mortality displacement caused byair pollution exposure.
Mortality Displacement/Years Life Lost
A key uncertainty in interpreting the findings of time-series studies is the extentof life shortening attributable to short- and long-term pollution exposure, i.e., howmany lives are shortened and by how much is the time of death advanced bypollution? If the deaths attributable to air pollution exposure occur only amongthose frail persons who would otherwise have died a few days later, their lifespansare not greatly shortened and the public health significance of pollution healtheffects is reduced. Such a short-term effect would lead to an association between
19 Feb 2004 11:46 AR AR209-PU25-11.tex AR209-PU25-11.sgm LaTeX2e(2002/01/18)P1: IBD
266 BELL ¥ SAMET ¥ DOMINICI
Figure 4 NMMAPS city, regional, and national estimates for the percent change in mortalityper 10-µg/m3 increase in daily PM10. Source: Health Effects Institute (61). Note: The solidsquares with bold segments represent the posterior means and 95% posterior intervals of thepooled regional effects. The triangle at the bottom of the figure represents the overall PM10
effect for 88 U.S. cities.
19 Feb 2004 11:46 AR AR209-PU25-11.tex AR209-PU25-11.sgm LaTeX2e(2002/01/18)P1: IBD
TIME-SERIES STUDIES OF PARTICULATE MATTER 267
air pollution and mortality. This phenomenon of only brief life shortening has beencalled mortality displacement or “harvesting,” an unfortunate term.
Mortality from air pollution can be quantified using several approaches. Excessdeaths, also called extra deaths or premature deaths, are the number of deaths thatoccurred with exposure minus the number of deaths that would be expected withoutexposure (or with a lesser exposure) for a given timeframe. This measure does notconsider the degree of prematurity of the death. Potential life years lost or the loss-of-life expectancy is the life expectancy without exposure minus the age of deathunder exposure, usually reported as the average over a population. This approachaccounts for the ages of those who die and depends on the age distribution of thepopulation. Some studies aim to quantify the impact of pollution on mortality by es-timating the monetary value of excess deaths or of potential life years lost (40, 42).
The years of life lost will depend on how PM affects mortality. Air pollutionexposure could raise mortality rates in several ways: (a) increased risk of under-lying diseases leading to frailty and higher short-term risk of death among frailindividuals; (b) increased risk of chronic diseases leading to frailty, but not relatedto the timing of death; or (c) increased short-term risk of deaths among frail indi-viduals, but not related to the risk of chronic disease (77) (Figure 5). Time-seriesanalysis can capture the first and third of these effects but cannot estimate theinfluence of air pollution on increased risk of chronic conditions. Cohort studiescan capture the first two of these effects but cannot examine increased short-termrisk of death among the frail population. Cohort studies, unlike time-series, can beused to estimate the years of life lost.
Time-series data can be used to evaluate the magnitude of mortality displace-ment: If pollution exposure only advances death by a few days, then an association
Figure 5 Model of mortality for the healthy and frail populations.
19 Feb 2004 11:46 AR AR209-PU25-11.tex AR209-PU25-11.sgm LaTeX2e(2002/01/18)P1: IBD
268 BELL ¥ SAMET ¥ DOMINICI
would only be detected at very brief timescales, but not on longer timescales, andwould not have broad public health implications (45). Under the assumption thatonly frail persons are affected by air pollution, the air pollution episode depletesthe pool of the frail people, and thus the increase in mortality immediately after theair pollution episode would be followed by a decrease in mortality that persists un-til the pool of the frail people is replenished. However, evidence from time-seriesanalyses is inconsistent with this hypothesis and shows an association betweenair pollution and mortality at longer timescales as well (35, 154, 185). Sustainedexposure to air pollution may lead to an increase in frailty and to the occurrence ofa health outcome (e.g., death or hospitalization) that is unrelated with short-termair pollution exposure. Because time-series studies estimate short-term effects as-sociated with temporal variations in air pollution and health, they are unable todetect such chronic health events and the corresponding life-span indicators.
Strategies to assess the degree of mortality displacement involve examiningpollution effects at multiple timescales. A study of mortality in Boston classifieddata into three time-series representing seasonal and long-term trends, short-termtrends, and immediate changes. The effect of mortality displacement on differ-ent timescales was explored by varying the cutoff between the three differenttimescales (154). Another study used a multi-day (15, 30, 45, and 60 days) smooth-ing of mortality and hospital admissions data with seasonal trends removed (156).An analysis of mortality displacement for Philadelphia from 1983 to 1988 iden-tified a decrease in deaths after pollution episodes, indicating some harvesting,but not enough of a decline to alter the risk estimate of daily mortality from TSP(L.A. Cifuentes, L.B. Lave, manuscript in preparation). Mortality displacementfor daily mortality in Erfurt, Germany was investigated using an interaction termof pollution and the mean number of deaths for the previous 2 to 21 days (173). Ananalysis of the mortality displacement of air pollution decomposed the informationinto distinct timescales and examined the effect using information that excludedshort-term effects subject to harvesting (185). A multicity analysis with a hierar-chical modeling approach used a distributed lag model with up to a 40-day lag forair pollution effects as part of the APHEA 2 study (183). Each of these studiesindicated that air pollution advances adverse health outcomes by more than a fewdays, and therefore has a much larger public health impact than would be the caseunder the harvesting theory.
Resolution of Results from Cohort and Time-Series Studies
Estimates of the impact of PM on mortality from time-series studies providesmaller estimates than those from cohort studies. For example, the reanalysisof NMMAPS data found a 0.31% (95% CI 0.15 to 0.47%) increase in cardio-vascular and respiratory mortality for a 10-µg/m3 increase in the previous day’sPM10 level, adjusted for time-varying confounders such as weather and influenzaepidemics (61). The ACS II study found approximately a 4%, 6%, and 8% in-crease in total, lung cancer, and cardiopulmonary mortality, respectively, for a
19 Feb 2004 11:46 AR AR209-PU25-11.tex AR209-PU25-11.sgm LaTeX2e(2002/01/18)P1: IBD
TIME-SERIES STUDIES OF PARTICULATE MATTER 269
10-µg/m3 increase in long-term average PM2.5, adjusted by individual risk fac-tors such as age, gender, education, and smoking (121). Although the cohort andtime-series studies estimate different relationships between health and pollution,resolution of their results is important to policy makers who must establish regula-tory limits. Cohort studies generally have larger estimates than time-series studies,which may indicate that long-term exposure to PM has a larger effect on humanhealth than short-term exposure. One strategy to better understand how short-termand long-term exposure affects human health is to extend the time-series model-ing approaches to examine comprehensively the impacts of exposure over differenttimescales in a single study (184).
Confounding in Time-Series Studies
Failure to adequately address confounding could result in observation of a spuri-ous association that represents true events but does not reflect a causal relationshipbetween the exposure and the outcome. Likely confounders for the relationshipbetween PM and mortality are meteorological variables and copollutants. Temper-ature affects emissions patterns and thereby PM concentrations and mortality. Forexample, cold winter temperatures generally result in higher PM concentrationsowing to elevated energy use. Stable atmospheric conditions resulting from tem-perature inversions are common in colder temperatures, causing higher pollutantconcentrations.
Additionally, unmeasured confounders such as seasonal trends can affect mor-tality and pollution concentrations. Copollutants such as CO, NO2, SO2, and O3
are potential confounders because they have been associated with adverse healtheffects; their concentrations may also be correlated with PM owing to commonsources and meteorological factors such as wind patterns. The pollutants SO2 andNO2 contribute to the formation of PM, leading to correlation among the con-centrations of these pollutants (45). Other possible confounders include long-termtrends of disease survival because both air pollution levels and the severity of ma-jor diseases, such as cardiovascular disease, have declined. Individual variablessuch as smoking history are not likely to confound time-series studies becausethey are generally not related to pollution levels and they are likely to vary slowlywith time. Further complicating the assessment of the effect of pollution on mor-tality is the need to consider possible nonlinear effects of temperature on mor-tality and the possibility that other pollutants not only confound but modify theeffect.
As methodology and computational ability have advanced, time-series analysishas accounted for potential confounding in more sophisticated ways, includingthe application of smoothing techniques starting in the mid 1990s (e.g., 149).Smoothing allows control for observed and unobserved time-varying confound-ing factors. Researchers must choose an appropriate model including smoothingparameters. Recent efforts have explored the sensitivity of results to changes inmodel specification, such as the degree of smoothing (32).
19 Feb 2004 11:46 AR AR209-PU25-11.tex AR209-PU25-11.sgm LaTeX2e(2002/01/18)P1: IBD
270 BELL ¥ SAMET ¥ DOMINICI
Other Research Needs
Time-series methods continue to evolve with methodological advances and ourgreater understanding of air pollution’s effects on human health. The National Re-search Council Committee on Research Priorities for Airborne Particulate Matterdiscusses key research priorities in several reports (108–110). Two of the crucial re-search concerns are the need to determine what properties of PM are associated withgreater risk for adverse health effects and to better understand the implications ofusing ambient indicators as a surrogate for exposure. Other critical research needsare further characterization of the effects on the general population and susceptiblesubpopulations, emissions sources, deposition and fate of PM in the respiratorytract, combined effects of PM and other pollutants, and biological mechanisms.
An important assumption in many epidemiological studies of air pollution isa consistent, harmful effect from PM, as defined by size, without attention to theheterogeneous nature of PM. This heterogeneity hampers comparison across stud-ies for different locations, because differences in risk estimates may be due to adifference in PM characteristics. The actual toxicity-determining characteristics,both physical and chemical, of PM are uncertain, with possibilities including size,metals, acidity, organics, sulfates, or some particular combination of these char-acteristics (60). The harmful components of PM may differ by health endpoint orsubgroup of the population. Multicity studies and research incorporating speciationor source apportionment somewhat address these concerns (e.g., 162).
Increased surveillance of air quality through monitoring networks and speci-ation data will help to distinguish among the health consequences from variousaspects of PM. The EPA Particulate Matter Supersites Program is an ambient moni-toring program intended to better characterize PM and to support health effects andexposure research. This physical and chemical characterization is achieved throughdetailed atmospheric measurements of PM constituents, precursors, copollutants,atmospheric transport, and source categorization. The program also supports theevaluation of multiple methods of characterizing PM. Supersites have been locatedin Atlanta, New York City, Baltimore, Pittsburgh, St. Louis, Houston, Fresno, andLos Angeles (e.g., 169, 178).
Epidemiological studies generally use ambient air pollution concentrations assurrogates for actual exposure. This method assumes that all individuals in a ge-ographic area experience identical exposure and ignores differences in activitypatterns, indoor/outdoor concentrations, and subspatial variability. The potentialfor exposure misclassification is especially critical among subgroups such as theelderly whose activity patterns may differ from the general population (e.g., moretime spent indoors). Additionally, the use of monitoring networks within epidemi-ological studies varies based on the availability of data. Exposure is typicallyestimated using data from a single monitor, a simple average of multiple moni-tors, or a weighted average of multiple monitors. The use of ambient monitoringdata as a substitute for individual exposure likely misses important distinctions indifferent people’s exposure. Therefore, this approach could introduce bias in the
19 Feb 2004 11:46 AR AR209-PU25-11.tex AR209-PU25-11.sgm LaTeX2e(2002/01/18)P1: IBD
TIME-SERIES STUDIES OF PARTICULATE MATTER 271
estimates of health effects. Measurement error correction models have been devel-oped to explore these effects (36, 186). Personal exposure studies, which estimateindividual-level exposure to pollution, can also address this issue.
CONCLUSIONS
Research on the association between ambient exposure to air pollution and humanhealth has progressed from the descriptive investigation of changes in morbidityand mortality following extreme acute episodes, such as in London in 1952, tothe sophisticated analysis of national databases of time-series data of pollutionconcentrations, cause-specific health data, and covariates such as weather. Thisprogress has been facilitated by advances in statistical techniques including the useof smoothing approaches to adjust for temporal-varying covariates and sensitivityanalysis of model specification such as the inclusion of multiple pollutants andthe degree of smoothing. The metric used to define PM has been refined, movingfrom TSP and PM10 to PM2.5, the coarse fraction, and ultrafine particles. Majorfindings of time-series analysis, in conjunction with those from other designs suchas cohort studies and human exposure studies, have provided strong evidencesupporting an association between PM levels and adverse public health impacts.Epidemiological evidence from time-series studies has played a crucial role in thesetting of regulatory health-based standards.
ACKNOWLEDGMENTS
We thank Charlotte Gerczak, Aidan McDermott, and Tom Louis for their contri-butions to this paper.
The Annual Review of Public Healthis online athttp://publhealth.annualreviews.org
LITERATURE CITED
1. Ackermann-Liebrich U, Rapp R. 1999.Epidemiological effects of oxides of ni-trogen, especially NO2. In Air Pollutionand Health,ed. ST Holgate, JM Samet,HS Koren, RL Maynard, pp. 559–84.New York: Academic
2. Anderson HR. 1999. Health effects of airpollution episodes. See Ref. 1, pp. 461–82
3. Angel JH, Fletcher CM, Hill ID, TinkerCM. 1965. Respiratory illness in factoryand office workers. A study of minor res-
piratory illnesses in relation to changesin ventilatory capacity, sputum charac-teristics, and atmospheric pollution.Br.J. Dis. Chest59:66–80
4. Ballester F, Saez M, Perez-Hoyos S,Iniguez C, Gandarillas A, et al. 2002.The EMECAM project: a multicentrestudy on air pollution and mortality inSpain: combined results for particulatesand for sulfur dioxide.Occup. Environ.Med.59:300–8
5. Bates DV, Gordon CA, Paul GI, Place
19 Feb 2004 11:46 AR AR209-PU25-11.tex AR209-PU25-11.sgm LaTeX2e(2002/01/18)P1: IBD
272 BELL ¥ SAMET ¥ DOMINICI
RE, Snidal DP, Woolf CR. 1966. Chronicbronchitis: report on the third and fourthstages of the coordinates study of chronicbronchitis in the Department of VeteransAffairs, Canada.Med. Serv. J. Can.22:1–59
6. Bates DV, Woolf CR, Paul GI. 1962.Chronic bronchitis: a report on the firsttwo stages of the coordinated study ofchronic bronchitis in the Department ofVeterans Affairs, Canada.Med. Serv. J.Can.18:211–303
7. Becker WH, Schilling FJ, Verma MP.1968. The effect on health of the 1966Eastern seaboard air pollution episode.Arch. Environ. Health16:414–19
8. Bell ML, Davis DL. 2001. Reassess-ment of the lethal London fog of1952: novel indicators of acute andchronic consequences of acute exposureto air pollution. Environ. Health Per-spect.19(S3):389–94
9. Beuchley RW, Riggan WB, HasselbladV, Van Bruggen JB. 1973. SO2 levels andperturbations in mortality.Arch. Environ.Health27:134–37
10. Bishop YMM. 1977. Statistical methodsfor hazards and health.Environ. HealthPerspect.20:149–57
11. Braga ALF, Zanobetti A, Schwartz J.2001. The lag structure between particu-late air pollution and respiratory and car-diovascular deaths in ten U.S. cities.J.Occup. Med.43:927–33
12. Brimblecombe P. 1987.The Big Smoke:A History of Air Pollution in Lon-don Since Medieval Times.New York:Methuen
13. Brimblecombe P. 1999. Air pollution andhealth history. See Ref. 1, pp. 5–18
14. Burnett RT, Cakmak S, Brook JR,Krewski D. 1997. The role of par-ticulate size and chemistry in theassociation between summertime airpollution and hospitalization for car-diorespiratory diseases.Environ. HealthPerspect.105:614–20
15. Burnett RT, Goldberg MS. 2003. Size-
fractionated particulate mass and dailymortality in eight Canadian cities. InRe-vised Analyses of Time-Series Studies ofAir Pollution and Health, Special Report,pp. 85–89. Cambridge, MA: Health Ef-fects Inst.
16. Burnett RT, Smith-Doiron M, Stieb D,Cakmak S, Brook JR. 1999. Effects ofparticulate and gaseous air pollution oncardiorespiratory hospitalizations.Arch.Environ. Health54:130–39
17. Burrows G, Kellogg AL, Buskey J. 1968.Relationship of symptoms of chronicbronchitis and emphysema to weatherand air pollution.Arch. Environ. Health16:406–13
18. Chappie J, Lave L. 1982. The health ef-fects of air pollution: a reanalysis.J. Ur-ban Econ.12:346–76
19. Deleted in proof20. Clean Air Act. 42 U.S.C. § 7401 et seq.
1990, 40 C.F.R. Part 50 200321. Clyde MA, Guttorp P, Sullivan E. 2000.
Effects of ambient fine and coarse par-ticles on mortality in Phoenix, Arizona.NRCSE Tech. Rep. Ser., NRCSE-TRSNo. 040. Univ. Washington, Natl. Res.Cent. Stat. Environ., Seattle, WA
22. Colburn KA, Johnson PRS. 2003. Airpollution concerns not changed by S-Plus flaw.Science299:665–66
23. Daniels MJ, Dominici F, Samet JM,Zeger SL. 2000. Estimating particulatematter-mortality dose-response curvesand threshold levels: an analysis of dailytime-series for the 20 largest US cities.Am. J. Epidemiol.152:397–406
24. Davis DL. 2002.When Smoke Ran LikeWater: Tales of Environmental Decep-tion and the Battle Against Pollution.New York: Basic Books
25. Dockery DW, Pope CA 3rd. 1994. Acuterespiratory effects of particulate air pol-lution. Ann. Rev. Public Health15:107–32
26. Dockery DW, Pope CA 3rd, Xu X,Spengler JD, Ware JH, et al. 1993. Anassociation between air pollution and
19 Feb 2004 11:46 AR AR209-PU25-11.tex AR209-PU25-11.sgm LaTeX2e(2002/01/18)P1: IBD
TIME-SERIES STUDIES OF PARTICULATE MATTER 273
mortality in six U.S. cities.N. Engl. J.Med.329:1753–59
27. Dockery DW, Schwartz J, Spengler JD.1992. Air pollution and daily mortality:associations with particulates and acidaerosols.Environ. Res.59:362–73
28. Dominici F. 2002. Invited commentary:air pollution and health—What can welearn from a hierarchical approach?Am.J. Epidemiol.155:11–15
29. Dominici F, Daniels M, McDermott A,Zeger SL, Samet JM. 2003. Shape of theexposure-response relation and mortalitydisplacement in the NMMAPS database.See Ref. 15, pp. 91–96
30. Dominici F, Daniels M, Zeger SL, SametJM. 2002. Air pollution and mortality.Estimating regional and national dose-response relationships.J. Am. Stat. As-soc.97:110–11
31. Deleted in proof32. Dominici F, McDermott A, Hastie T.
2003.Issues in semi-parametric regres-sion with applications in time seriesmodels for air pollution and mortality.Tech. Rep. Accessed 15 Nov. http://www.biostat.jhsph.edu/∼fdominic/research.html/jasafe.Ra.pdf
33. Dominici F, McDermott A, Zeger SL,Samet JM. 2002. On the use of general-ized additive models in time-series stud-ies of air pollution and health.Am. J. Epi-demiol.156:193–203
34. Dominici F, McDermott A, Zeger SL,Samet JM. 2002. National maps of the ef-fects of PM on mortality: exploring geo-graphical variation.Environ. Health Per-spect.111:39–43
35. Dominici F, McDermott A, Zeger SL,Samet JM. 2003. Airborne particulatematter and mortality: time-scale effectsin four U.S. cities.Am. J. Epidemiol.157:1055–65
36. Dominici F, Zeger SL, Samet JM. 2000.A measurement error correction modelfor time-series studies of air pollutionand mortality.Biostatistics2:157–75
37. Dominici F, Zeger SL, Samet JM. 2000.
Combining evidence on air pollution anddaily mortality from the 20 largest U.S.cities: a hierarchical modelling strategy.J. R. Stat. Soc. A163:263–302
39. EPA. 1987. Revisions of the NationalAmbient Air Quality Standard for Par-ticulate Matter; Final Rule. 52Fed. Reg.24854
40. EPA. 1997.The Benefits and Costs of theClean Air Act, 1970 to 1990.EPA/410/R-97/002, EPA Off. Air and Radiation,Washington, DC
41. EPA. 1997. National Ambient Air Qual-ity Standards for Particulate Matter; Fi-nal Rule. 62Fed. Reg.38651
42. EPA. 1999.Benefits and Costs of theClean Air Act, 1990 to 2010.EPA/410/R-99/001, EPA Off. Air and Radiation, EPAOff. Policy, Washington, DC
43. EPA. 2002.Latest Findings on NationalAir Quality: 2001 Status and Trends.EPA/454/K-02–001, EPA Off. Air Qual.Plan. Stand., Research Triangle Park, NC
44. EPA. 2002.Third External Review Draftof Air Quality Criteria for ParticulateMatter. EPA/600/P-99/002aC, EPA Of-fice of Research and Development, Re-search Triangle Park, NC
45. EPA. 2003. Fourth External Reviewfor Air Quality Criteria for ParticulateMatter (Draft). EPA/600/P-95/001aF-cF, EPA Off. Res. and Dev., ResearchTriangle Park, NC
46. Ezzati M, Lopez AD, Rodgers A, VanderHoorn S, Murray CJL. Comp. Risk As-sess. Collab. Group. 2002. Selected ma-jor risk factors and global and regionalburden of disease.Lancet360:1347–60
47. Fairley D. 1990. The relationship of dailymortality to suspended particulates inSanta Clara County, 1980–1986.Envi-ron. Health Perspect.89:159–68
48. Farber DA. 2002. Rethinking regulatoryreform after American Trucking.Pace L.Rev.23:43–82
19 Feb 2004 11:46 AR AR209-PU25-11.tex AR209-PU25-11.sgm LaTeX2e(2002/01/18)P1: IBD
274 BELL ¥ SAMET ¥ DOMINICI
49. Ferris BG Jr, Higgins ITT, Higgins MW,Peters JM, Van Ganse WF, GoldmanMD. 1971. Chronic nonspecific respi-ratory disease, Berlin, New Hampshire,1961–1967: a cross-sectional study.Am.Rev. Respir. Dis.104:232–44
50. Firket J. 1936. Fog along the Meuse Val-ley. Trans. Faraday Soc.32:1192–97
51. Gauderman WJ, Gilliland GF, Vora H,Avol E, Stram D, et al. 2002. Associa-tion between air pollution and lung func-tion growth in Southern California chil-dren: results from a second cohort.Am.J. Respir. Crit. Care Med.166:1383–90
52. Gilliland FD, Berhane K, Rappaport EB,Thomas DC, Avol E, et al. 2001. The ef-fects of ambient air pollution on schoolabsenteeism due to respiratory illness.Epidemiology12:43–54
53. Glasser M, Greenburg L. 1971. Air pol-lution, mortality, and weather. New YorkCity, 1960–1964.Arch. Environ. Health22:334–43
54. Goldstein IF, Rausch LE. 1978. Time se-ries analysis of morbidity data for assess-ment of acute environmental health ef-fects.Environ. Res.17:266–75
55. Greenbaum DS, Bachmann JD, KrewskiD, Samet JM, White R, Wyzga R. 2001.Particulate air pollution standards andmorbidity and mortality: case study.Am.J. Epidemiol.154(Suppl.):78–90
56. Greenburg L, Erhardt C, Field F, ReedJI, Seriff NS. 1963. Intermittent air pol-lution episode in New York City, 1962.Public Health Rep.78:1061–64
57. Greenburg L, Field F, Reed JI, ErhardtCL. 1962. Air pollution and morbidityin New York City. J. Am. Med. Assoc.182:159–62
58. Greenburg L, Jacobs MB, Drolette BM,Field F, Braverman MM. 1962. Reportof an air pollution incident in New YorkCity, November 1953.Public HealthRep.77:7–16
59. Hastie T, Tibshirani R. 1995. Gener-alized additive models for medical re-
search.Stat. Methods Med. Res.4:187–96
60. Health Effects Inst. (HEI). 2002.Un-derstanding the Health Effects of Com-ponents of the Particulate Matter Mix:Progress and Next Steps.Cambridge,MA: Health Effects Inst.
61. HEI. 2003.Revised Analyses of Time-Series Studies of Air Pollution andHealth: Preprint Version, Revised Analy-ses of the National Morbidity, Mortality,and Air Pollution Study, Part II, RevisedAnalyses of Selected Time-Series Stud-ies.Cambridge, MA: Health Effects Inst.
62. Hexter AC, Goldsmith JR. 1971. Car-bon monoxide: association of commu-nity air pollution with mortality.Science172:265–67
63. Hodgson TA Jr. 1970. Short-term effectsof air pollution on mortality in New YorkCity. Environ. Sci. Technol.4:589–97
64. Hoek G, Brunekreef B, Goldbohm S,Fischer P, Van Den Brandt PA. 2002.Association between mortality and indi-cators of traffic-related air pollution inthe Netherlands: a cohort study.Lancet360:1203–9
65. Hoek G, Fischer P, Van Den Brandt P,Goldbohm S, Brunekreef B. 2001. Esti-mation of long-term average exposure tooutdoor air pollution for a cohort studyon mortality.J. Expo. Anal. Environ. Epi-demiol.11:459–69
66. Hoek G, Schwartz JD, Groot B, Eilers P.1997. Effects of ambient particulate mat-ter and ozone on daily mortality in Rot-terdam, The Netherlands.Arch. Environ.Health52:455–63
67. Holland WW, Bennett AE, Cameron IR,Florey CV, Leeder SR, et al. 1979. Healtheffects of particulate pollution: reap-praising the evidence.Am. J. Epidemiol.110:527–659
68. Ito K, Thurston GD. 1989. Character-ization and reconstruction of historicalLondon, England, acidic aerosol con-centrations.Environ. Health Perspect.79:35–42
19 Feb 2004 11:46 AR AR209-PU25-11.tex AR209-PU25-11.sgm LaTeX2e(2002/01/18)P1: IBD
TIME-SERIES STUDIES OF PARTICULATE MATTER 275
69. Jedrychowski W. 1999. Ambient air pol-lution and respiratory health in the eastBaltic region.Scand. J. Work Environ.Health25(Suppl.):5–16
70. Kalkstein LS. 1991. A new approach toevaluate the impact of climate on hu-man mortality.Environ. Health Perspect.96:145–50
71. Katsouyanni K, Touloumi G, Samoli E,Gryparis A, Le Tertre A, et al. 2001. Con-founding and effect modification in theshort-term effects of ambient particles ontotal mortality: results from 29 Europeancities within the APHEA2 Project.Epi-demiology12:521–31
72. Katsouyanni K, Touloumi G, Spix C,Schwartz J, Balducci F, et al. 1997. Shortterm effects on ambient sulfur dioxideand particulate matter on mortality in 12European cities: results from time seriesdata from the APHEA project.B. Med.J. 314:1658–63
73. Kelsall JE, Samet JM, Zeger SL, XuJ. 1997. Air pollution and mortality inPhiladelphia, 1974–1988.Am. J. Epi-demiol.146(9):750–62
74. Klemm RM, Mason R. 2003. Replicationof reanalysis of Harvard Six-City mortal-ity study. See Ref. 15, pp. 165–72
75. Klemm RJ, Mason RM Jr, Helig CM,Neas LM, Dockery DW. 2000. Is dailymortality associated specifically withfine particles? Data reconstruction andreplication of analyses.J. Air WasteManag. Assoc.50:1215–22
76. Krewski D, Burnett R, Goldberg MS,Siemiatycki J, Jerrett M, et al. 2000.Re-analysis of the Harvard Six-Cities andAmerican Cancer Society Cohort Studiesof Particulate Air Pollution and Mortal-ity, Phase I: Replication and Validation.Cambridge, MA: Health Effects Inst.
77. Kunzli N, Medina S, Kaiser R, Quenel P,Horak F Jr, Studnicka M. 2001. Assess-ment of deaths attributable to air pollu-tion: Should we use risk estimates basedon time series or on cohort studies?Am.J. Epidemiol.153:1050–55
78. Kunzli N, Tager IB. 1997. The semi-individual study in air pollution epidemi-ology: a valid design as compared to eco-logic studies.Environ. Health Perspect.105:1078–83
79. Laden F, Neas L, Dockery DW, SchwartzJ. 2000. Association of fine particulatematter from different sources with dailymortality in six U.S. cities.Environ.Health Perspect.108:941–47
80. Lave LB, Seskin EP. 1970. Air pollutionand human health.Science169:723–33
81. Lave LB, Seskin EP. 1973. An analysisof the association between U.S. mortal-ity and air pollution.J. Am. Stat. Assoc.68:284–90
82. Lawther PJ. 1958. Climate, air pollu-tion and chronic bronchitis.Proc. R. Soc.Med.51:262–64
83. Lawther PJ. 1967. Air pollution andchronic bronchitis.Med. Thorac.24:44–52
84. Lebowitz MD. 1973. A comparison ofthe relationships of mortality and mor-bidity with air pollution-weather and theimplications for further research.Sci. To-tal Environ.2:191–95
85. Lebowitz MD. 1973. A comparativeanalysis of the stimulus-response re-lationship between mortality and airpollution-weather.Environ. Res.6:106–18
86. Lebowitz MD, Collins L, Holberg CJ.1987. Time series analyses of respira-tory responses to indoor and outdoor en-vironmental phenomena.Environ. Res.43:332–41
87. Lebowitz MD, Toyama T, McCarroll J.1973. The relationship between air pol-lution and weather as stimuli and dailymortality as responses in Tokyo, Japan,with comparisons with other cities.Env-iron. Res.6:327–33
88. Levy JI, Hammitt JK, Spengler JD. 2000.Estimating the mortality impacts of par-ticulate matter: What can be learnedfrom between-study variability.Environ.Health Perspect.108:109–17
19 Feb 2004 11:46 AR AR209-PU25-11.tex AR209-PU25-11.sgm LaTeX2e(2002/01/18)P1: IBD
90. Lipfert FW. 1994.Air Pollution andCommunity Health: A Critical Reviewand Data Sourcebook. New York: VanNostrand Reinhold
91. Logan WPD, Glasg MD. 1953. Mortal-ity in the London fog incident.Lancet264:336–38
92. Loomis DP, Borja-Aburto VH, Bangdi-wala SI, Shy CM. 1996. Ozone expo-sure and daily mortality in Mexico City:a time-series analysis.Res. Rep. HealthEff. Inst.75:1–37
93. Lumley T, Sheppard L. 2000. Assessingseasonal confounding and model selec-tion bias in air pollution epidemiologyusing positive and negative control anal-yses.Environmetrics11:705–17
94. MacFarlane A. 1977. Daily mortality andenvironment in English conurbations, 1:air pollution, low temperature, and in-fluenza in Greater London.Br. J. Prev.Soc. Med.31:54–61
95. Martin AE. 1964. Mortality and morbid-ity statistics and air pollution.Proc. R.Soc. Med.57:969–75
96. Martin AE, Bradley WH. 1960. Mortal-ity, fog, and atmospheric pollution—aninvestigation during the Winter of 1958–59.Mon. Bull. Minist. Health Lab. Serv.19:56–73
97. Mazumdar S, Schimmel H, Higgens IT.1982. Relation of daily mortality to airpollution: an analysis of 14 London win-ters, 1958/59–1971/72.Arch. Environ.Health37:213–20
98. Mazumdar S, Sussman N. 1983. Rela-tionships of air pollution to health: re-sults from the Pittsburgh study.Arch. En-viron. Health38:17–24
99. McCarroll J, Bradley W. 1966. Excessmortality as an indicator of health effectsof air pollution. Am. J. Public Health56:1933–42
100. McCarroll JR, Cassell EJ, Wolter DW,
Mountain JD, Diamond JR, MountainIM. 1967. Health and urban environ-ment. V. Air pollution and illness in anormal urban population.Arch. Environ.Health14:178–84
101. McCullagh P, Nelder JA. 1989.Gener-alized Linear Models. New York: Chap-man and Hall
102. Mills CA. 1960. Respiratory and car-diac deaths in Los Angeles smogs during1956, 1957, and 1958.Am. J. Med. Sci.239:307–15
103. Mills E. 2002. Annual review of environ-mental and natural resources law: Whit-man v. American Trucking Associations,Inc. Ecol. Law Q.29:159–79
104. Moolgavkar SH. 2000. Air pollutionand daily mortality in three U.S. coun-ties.Environ. Health Perspect.108:777–84
105. Moolgavkar SH. 2003. Air pollution anddaily deaths and hospital admissions inLos Angeles and Cook counties. See Ref.15, pp. 183–98
106. Moolgavkar SH, Luebeck EG. 1996. Acritical review of the evidence on par-ticulate air pollution and mortality.Epi-demiology7:420–28
107. Moolgavkar SH, Luebeck EG, Ander-son EL. 1997. Air pollution and hospi-tal admissions for respiratory causes inMinneapolis-St. Paul and Birmingham.Epidemiology8:364–70
108. Natl. Res. Counc. (NRC) Comm. Res.Prior. Airborne Part. Matter. 1998.Re-search Priorities for Airborne Particu-late Matter I: Immediate Priorities anda Long-Range Research Portfolio.Wash-ington, DC: Natl. Acad. Press
19 Feb 2004 11:46 AR AR209-PU25-11.tex AR209-PU25-11.sgm LaTeX2e(2002/01/18)P1: IBD
TIME-SERIES STUDIES OF PARTICULATE MATTER 277
Research Progress.Washington, DC:Natl. Acad. Press
111. Navidi W, Thomas D, Stram D, PetersJ. 1994. Design and analysis of multi-level analytic studies with applications toa study of air pollution.Environ. HealthPerspect.102(Suppl.):25–32
112. Nemery B, Hoet PHM, Nemmar A.2001. The Meuse Valley fog of 1930: anair pollution disaster.Lancet357:704–8
113. Ostro B. 1984. A search for a threshold inthe relationship of air pollution to mortal-ity: a reanalysis of data on London win-ter.Environ. Health Perspect.58:397–99
114. Ostro B, Chestnut L, Vichit-VadakanN, Laixuthai A. 1999. The impact ofparticulate matter on daily mortality inBangkok, Thailand.J. Air Waste Manag.Assoc.49(Spec.):100–7
115. Ostro B, Sanchez JM, Aranda C, Eske-land GS. 1996. Air pollution and mor-tality: results from a study of Santiago,Chile.J. Expo. Anal. Environ. Epidemiol.6:97–114
116. Ozkaynak H, Spengler JD. 1985. Analy-sis of health effects resulting from pop-ulation exposures to acid precipitationprecursors.Environ. Health Perspect.63:43–55
117. Ozkaynak H, Thurston GD. 1987. As-sociations between 1980 U.S. mortal-ity rates and alternative measures of air-borne particle concentration.Risk Anal.7:449–61
118. Peters JM, Avol E, Gauderman WJ, LinnWS, Navidi W, et al. 1999. A study oftwelve Southern California communitieswith differing levels and types of air pol-lution II: effects on pulmonary function.Am. J. Respir. Crit. Care Med.159:768–75
119. Peters JM, Avol E, Navidi W, LondonSJ, Gauderman WJ, et al. 1999. A studyof twelve Southern California commu-nities with differing levels and types ofair pollution: I. Prevalence of respiratorymortality.Am. J. Respir. Crit. Care Med.159:760–67
120. Peters A, Skorkovsky J, Kotexovec F,Brynda J, Spix C, et al. 2000. Associ-ations between mortality and air pollu-tion in Central Europe.Environ. HealthPerspect.108:283–87
121. Pope CA 3rd, Burnett RT, Thun MJ,Calle EE, Krewski D, et al. 2002. Lungcancer, cardiopulmonary mortality, andlong-term exposure to fine particulate airpollution.J. Am. Med. Assoc.287:1132–41
122. Pope CA 3rd, Dockery DW. 1999. Epi-demiology of particle effects. See Ref. 1,pp. 673–705
123. Pope CA 3rd, Dockery DW, SchwartzJ. 1995. Review of epidemiological evi-dence of health effects of particulate airpollution. Inhal. Toxicol.7:1–18
124. Pope CA 3rd, Kalkstein LS. 1996. Syn-optic weather modeling and estimates ofthe exposure-response relationship be-tween daily mortality and particulateair pollution.Environ. Health Perspect.104:414–20
125. Pope CA 3rd, Schwartz J, Ransom MR.1992. Daily mortality and PM10 pol-lution in Utah Valley. Arch. Environ.Health47:211–17
126. Pope CA 3rd, Thun MJ, NamboodiriMM, Dockery DW, Evans JS, et al. 1995.Particulate air pollution as a predictor ofmortality in a prospective study of U.S.adults.Am. J. Respir. Crit. Care Med.151:669–74
127. Ramsay TO, Burnett RT, Krewski D.2003. The effect of concurvity in gener-alized additive models linking mortalityto ambient particulate matter.Epidemi-ology14:18–23
128. Samet JM, Bishop Y, Speizer FE, Spen-gler JD, Ferris BG Jr. 1981. Therelationship between air pollution andemergency room visits in an industrialcommunity.J. Air Pollut. Control Assoc.31:236–40
129. Samet JM, Dominici F, Curriero FC,Coursac I, Zeger SL. 2000. Fine partic-ulate air pollution and mortality in 20
19 Feb 2004 11:46 AR AR209-PU25-11.tex AR209-PU25-11.sgm LaTeX2e(2002/01/18)P1: IBD
278 BELL ¥ SAMET ¥ DOMINICI
U.S. cities, 1987–1994.N. Engl. J. Med.343:1742–49
130. Samet JM, Dominici F, McDermott A,Zeger SL. 2003. New problems for an olddesign: time series analyses of air pol-lution and health.Epidemiology14:11–12
131. Samet JM, Dominici F, Zeger SL,Schwartz J, Dockery DW. 2000.TheNational Morbidity, Mortality, and AirPollution Study Part I: Methods andMethodologic Issues.Cambridge, MA:Health Effects Inst.
132. Deleted in proof133. Samet JM, Jaakkola JJK. 1999. The
epidemiologic approach to investigat-ing outdoor air pollution. See Ref. 1,pp. 431–60
134. Samet JM, Zeger SL, Berhane K. 1995.Particulate Air Pollution and Daily Mor-tality Replication and Validation of Se-lected Studies, The Phase I Report ofthe Particle Epidemiology EvaluationProject.Cambridge, MA: Health EffectsInst.
135. Samet JM, Zeger SL, Dominici F, Cur-riero F, Coursac I, et al. 2000.TheNational Morbidity, Mortality, and AirPollution Study Part II: Morbidity andMortality from Air Pollution in theUnited States.Cambridge, MA: HealthEffects Inst.
136. Samet JM, Zeger SL, Kelsall JE, XuJ, Kalkstein LS. 1997.Particulate AirPollution and Daily Mortality: Analy-ses of the Effects of Weather and Multi-ple Air Pollutants, The Phase I.B Reportof the Particle Epidemiology EvaluationProject. Cambridge, MA: Health EffectsInst.
137. Samet JM, Zeger S, Kelsall J, Xu J, Kalk-stein L. 1998. Does weather confound ormodify the association of particulate airpollution with mortality? An analysis ofthe Philadelphia data, 1972–1980.Envi-ron. Res.77:9–19
138. Samoli E, Schwartz J, Wojtyniak B,Touloumi G, Spix C, et al. 2001. In-
vestigating regional differences in short-term effects of air pollution on daily mor-tality in the APHEA Project: a sensi-tivity analysis for controlling long-termtrends and seasonality.Environ. HealthPerspect.109:349–53
139. Schimmel H. 1978. Evidence for pos-sible acute health effects of ambientair pollution from time series analysis;methodological questions and some newresults based on New York City dailymortality, 1963–1976.Bull. N.Y. Acad.Med.54:1052–108
140. Schimmel H, Greenburg L. 1972. Astudy of the relation of pollution to mor-tality, New York City, 1963–1968.J. AirPollut. Control Assoc.22:607–16
141. Schimmel H, Murawski TJ. 1976. Therelation of air pollution to mortality.J.Occup. Med.18(5):316–33
142. Schlesinger RB. 1999. Toxicology ofsulfur oxides. See Ref. 1, pp. 585–602
143. Schrenk HH, Heimann H, Clayton GD,Gafafer WM, Wexler H. 1949. Air Pol-lution in Donora, PA: Epidemiology ofthe Unusual Smog Episode of October1948, Preliminary Report. Public HealthBull. No. 306. U.S. Public Health Serv.,Washington, DC
144. Schwartz J. 1991. Particulate air pollu-tion and daily mortality in Detroit.Env-iron. Res.56:204–13
145. Schwartz J. 1993. Air pollution and dailymortality in Birmingham, Alabama.Am.J. Epidemiol.137:1136–47
145a. Schwartz J. 1994. Air pollution and dailymortality: a review and meta analysis.Environ. Res.64:36–52
146. Schwartz J. 1994. Air pollution and hos-pital admissions for the elderly in Birm-ingham, Alabama.Am. J. Epidemiol.139:589–98
147. Schwartz J. 1994. Air pollution and hos-pital admissions for the elderly in De-troit. Am. J. Respir. Crit. Care Med.150:648–55
148. Schwartz J. 1994. PM10, ozone, andhospital admissions for the elderly in
19 Feb 2004 11:46 AR AR209-PU25-11.tex AR209-PU25-11.sgm LaTeX2e(2002/01/18)P1: IBD
149. Schwartz J. 1994. Total suspended par-ticulate matter and daily mortality inCincinnati, Ohio.Environ. Health Per-spect.102:186–89
150. Deleted in proof151. Schwartz J. 1995. Short term fluctua-
tions in air pollution and hospital admis-sions of the elderly for respiratory dis-ease.Thorax50:531–38
152. Schwartz J. 1999. Air pollution and hos-pital admissions for heart disease in eightU.S. counties.Epidemiology10:17–22
153. Schwartz J. 2000. Assessing confound-ing, effect modification, and thresholdsin the associations between ambient par-ticles and daily deaths.Environ. HealthPerspect.108:563–68
154. Schwartz J. 2000. Harvesting and longterm exposure effects in the relation be-tween air pollution and mortality.Am. J.Epidemiol.151:440–48
155. Schwartz J. 2000. The distributed lag be-tween air pollution and daily deaths.Epi-demiology11:320–26
156. Schwartz J. 2001. Is there harvesting inthe association of airborne particles withdaily deaths and hospital admissions?Epidemiology12:55–61
157. Schwartz J. 2003. Daily deaths associ-ated with air pollution in six US citiesand short-term mortality displacement inBoston. See Ref. 15, pp. 219–26
158. Schwartz J, Ballester F, Saez M, Perez-Hoyos S, Bellido J, et al. 2001. Theconcentration-response relation betweenair pollution and daily deaths.Environ.Health Perspect.109:1001–6
159. Schwartz J, Dockery DW. 1992. In-creased mortality in Philadelphia asso-ciated with daily air pollution concentra-tions.Am. Rev. Respir. Dis.145:600–4
160. Schwartz J, Dockery DW. 1992. Partic-ulate air pollution and daily mortalityin Steubenville, Ohio.Am. J. Epidemiol.135:12–19
161. Schwartz J, Dockery DW, Neas LM.
1996. Is daily mortality associatedspecifically with fine particles?J. AirWaste Manag. Assoc.46:927–39
162. Schwartz J, Laden F, Zanobetti A. 2002.The concentration-response relation be-tween PM2.5 and daily deaths.Environ.Health Perspect.110:1025–29
163. Schwartz J, Marcus A. 1990. Mortalityand air pollution in London: a time seriesanalysis.Am. J. Epidemiol.131:185–94
164. Schwartz J, Morris R. 1995. Air pollutionand hospital admissions for cardiovascu-lar disease in Detroit, Michigan.Am. J.Epidemiol.142:23–25
165. Schwartz J, Zanobetti A. 2000. Us-ing meta-smoothing to estimate dose-response trends across multiple studieswith application to air pollution and dailydeath.Epidemiology11:666–72
166. Sheppard L, Levy D, Norris G, LarsonTV, Koenig JQ. 1999. Effects of ambientair pollution on nonelderly asthma hos-pital admissions in Seattle, Washington,1987–1994.Epidemiology10:23–30
167. Shumway RH, Azari AS, Pawitan Y.1988. Modeling mortality fluctuationsin Los Angeles as functions of pollu-tion and weather effects.Environ. Res.45:224–41
168. Smith R, Guttorp P, Sheppard L, Lum-ley T, Ishikawa N. 2001.Comments onthe Criteria Document for ParticulateMatter Air Pollution.NRCSE Tech. Rep.Ser., NRCSE-TRS No. 066. NRCSETech. Rep. Ser. Univ. Washington, Natl.Res. Cent. Stat. Environ., Seattle, WA
169. Solomon PA, Chamedies W, WeberR, Middlebrook A, Kiang CS, et al.2003. Overview of the 1999 Atlanta su-persite project.J. Geophys. Res.108.doi:10.1029/2001JD001458
170. Sprague HA, Hagstrom R. 1969. TheNashville air pollution study: mortal-ity multiple regression.Arch. Environ.Health18:503–7
171. Spicer WS Jr, Reinke WA, Kerr DH.1966. Effects of environment upon res-piratory function II: daily studies in
19 Feb 2004 11:46 AR AR209-PU25-11.tex AR209-PU25-11.sgm LaTeX2e(2002/01/18)P1: IBD
280 BELL ¥ SAMET ¥ DOMINICI
patients with chronic obstructive lungdisease.Arch. Environ. Health13:753–62
172. Spicer WS Jr, Storey PB, Morgan WKC,Kerr HD, Standiford NE. 1962. Varia-tion in respiratory function in selectedpatients and its relation to air pollution.Am. Rev. Respir. Dis.86:705–12
173. Spix C, Heinrich J, Dockery D, SchwartzJ, Volksch G, et al. 1993. Air pollutionand daily mortality in Erfurt, East Ger-many, 1980–1989.Environ. Health Per-spect.101:518–26
174. Deleted in proof175. Thurston GD. 1996. A critical review
of PM10-mortality time-series studies.J.Expo. Anal. Environ. Epidemiol.6:3–21
176. Thurston GD, Ito K, Hayes CG, BatesDV, Lippmann M. 1994. Respiratoryhospital admissions and summertimehaze air pollution in Toronto, Ontario:consideration of the role of acid aerosols.Environ. Res.65:271–90
176a. Tsai FC, Apte MG, Daisey JM. 2000.An exploratory analysis of the relation-ship between mortality and the chemi-cal composition of airborne particulatematter. Inhal. Toxicol.12(Suppl.):121–35
177. U.K. Ministr. Health. 1954.Mortalityand Morbidity During the London Fog ofDecember 1952.Rep. on Public HealthMed. Subj. No 95. U.K. Ministr. Health,London, England
178. Watson JG, Chow JC, Bowen JL, Lowen-thal DH, Hering S, et al. 2000. Air qualitymeasurements from the Fresno supersite.J. Air Waste Manag. Assoc.50:1321–34
179. Wilson WE, Suh HH. 1997. Fine par-ticles and coarse particles: concentra-tion relationships relevant to epidemio-logic studies.J. Air Waste Manag. Assoc.47:1238–49
180. Wilson R, Spengler J, ed. 1996.Particlesin Our Air: Concentrations and HealthEffects.Cambridge, MA: Harvard Univ.Press
181. World Health Organ. (WHO). 2001. AirQuality and Health Air ManagementInformation System AMIS 3.0. WHO,Geneva, Switz.
182. Wyzga RE. 1978. The effect of air pol-lution upon mortality: a consideration ofdistributed lag models.J. Am. Stat. As-soc.73:463–72
183. Zanobetti A, Schwartz J, Samoli E, Gry-paris A, Touloumi G, et al. 2002. Thetemporal pattern of mortality responsesto air pollution: a multicity assessmentof mortality displacement.Epidemiology13:87–93
184. Zeger SL, Dominici F, McDermott A,Samet JM. 2002. Modeling the healtheffects of environmental exposures: par-ticulate air pollution and mortality in ur-ban America. InMonitoring the Healthof Populations: Statistical Methods forPublic Health Surveillance, ed. R Brook-meyer, D Stroup. Oxford: Oxford Univ.Press
185. Zeger SL, Dominici F, Samet J. 1999.Harvesting-resistant estimates of air pol-lution effects on mortality.Epidemiology10:171–75
186. Zeger SL, Thomas D, Dominici F, SametJM, Schwartz J, et al. 2000. Expo-sure measurement error in time-seriesstudies of air pollution: concepts andconsequences.Environ. Health Perspect.108:419–26
187. Zeghnoun A, Czernichow P, BeaudeauP, Hautemaniere A, Froment L, et al.2001. Short-term effects of air pollutionon mortality in the cities of Rouen andLe Havre, France, 1990–1995.Arch. En-viron. Health56:327–35

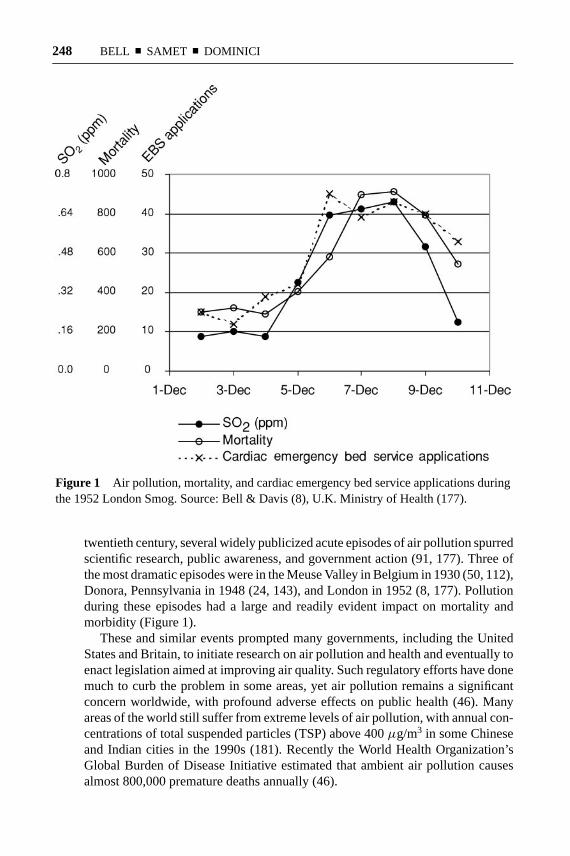


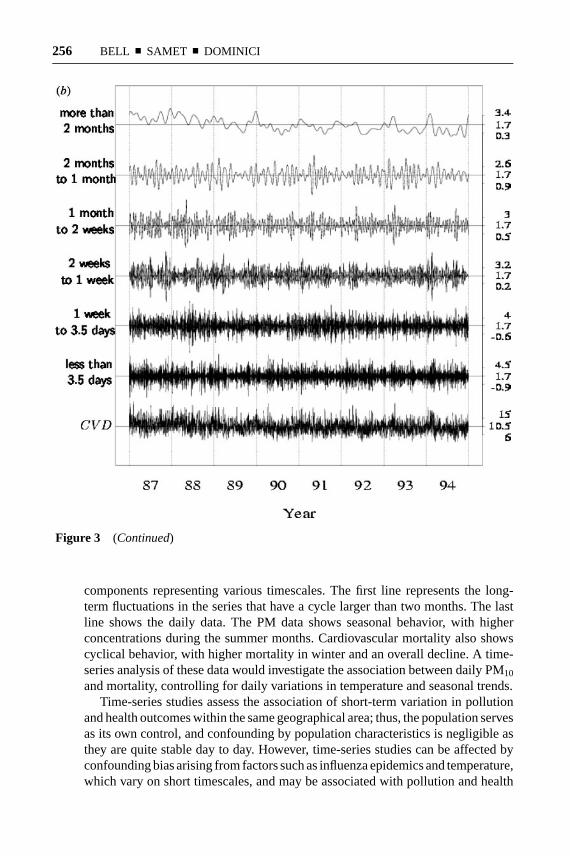


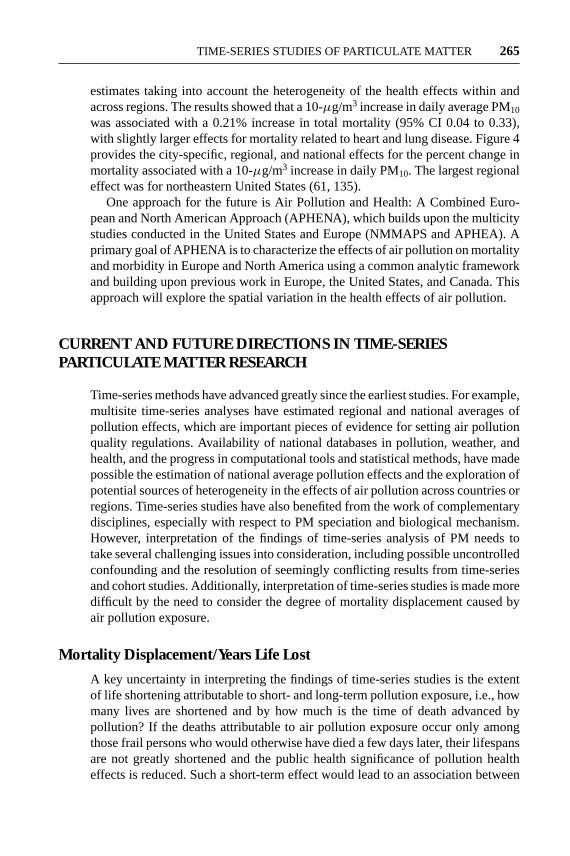


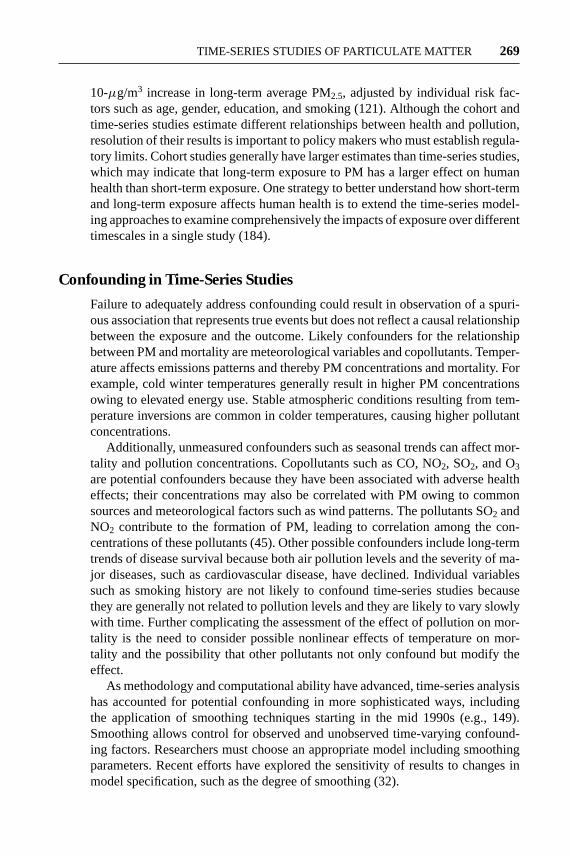


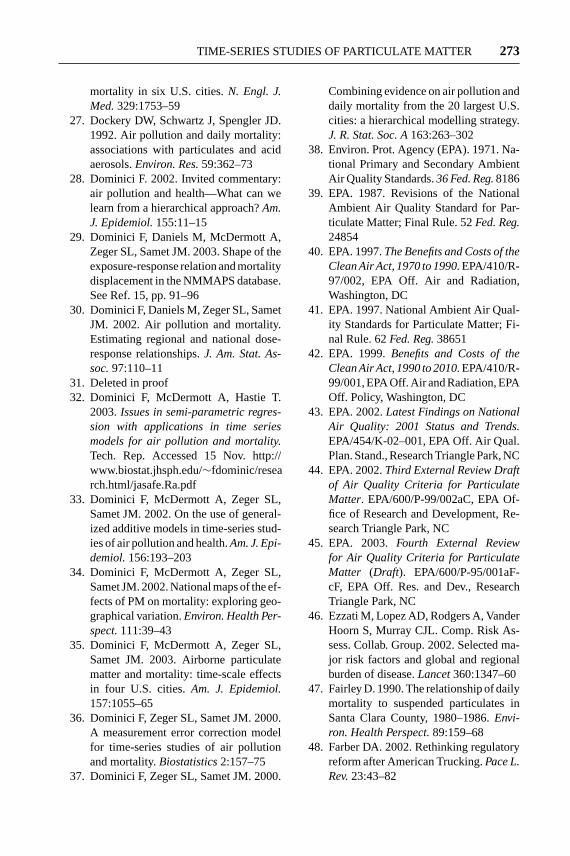


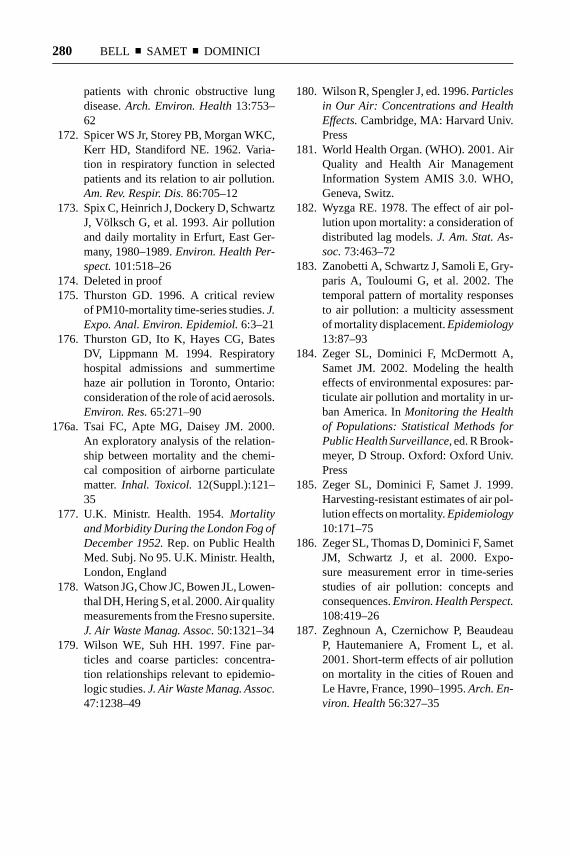


![Xvii samet dr. yoshihiro yamazake [mini-curso 6ª -feira] 3 wrf-nesting_apres3](https://static.documents.pub/doc/80x56/5589a4cdd8b42ad43f8b458e/xvii-samet-dr-yoshihiro-yamazake-mini-curso-6a-feira-3-wrf-nestingapres3.jpg)


