49
T-TESTS AND ANALYSIS OF VARIANCE Jennifer Kensler
| Date post: | 22-Dec-2015 |
| Category: |
Documents |
| Upload: | rosaline-sims |
| View: | 216 times |
| Download: | 3 times |

T-TESTS AND ANALYSIS OF VARIANCE
Jennifer Kensler
ONE SAMPLE T-TEST

ONE SAMPLE T-TEST
Used to test whether the population mean is different from a specified value.
Example: Is the mean amount of soda in a 20 oz. bottle different from 20 oz?
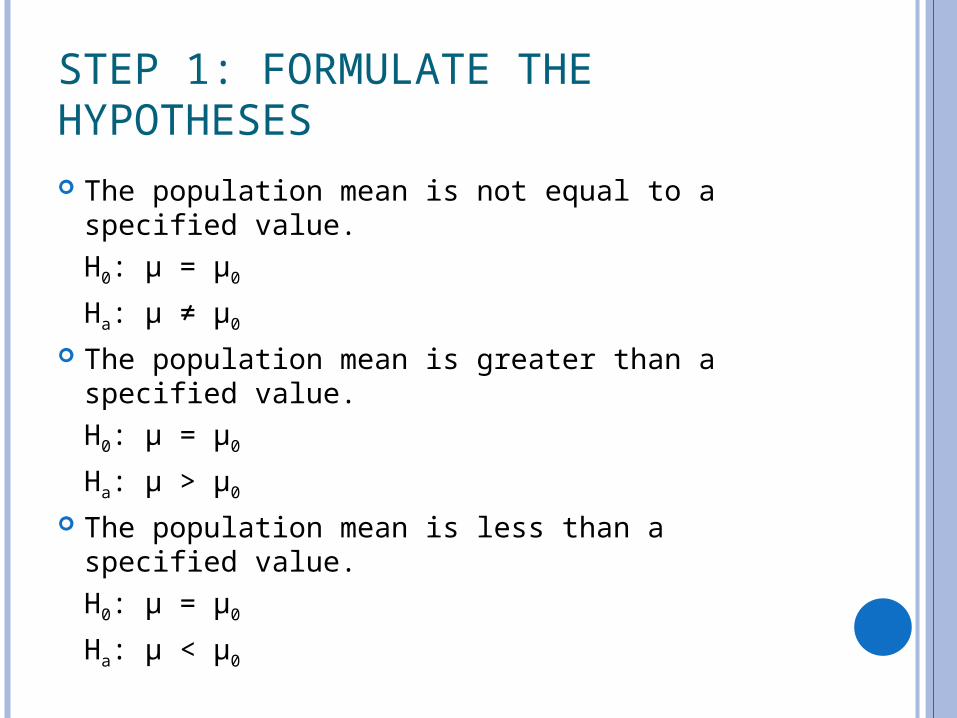
STEP 1: FORMULATE THE HYPOTHESES The population mean is not equal to a specified
value.
H0: μ = μ0
Ha: μ ≠ μ0
The population mean is greater than a specified value.
H0: μ = μ0
Ha: μ > μ0
The population mean is less than a specified value.
H0: μ = μ0
Ha: μ < μ0

STEP 2: CHECK THE ASSUMPTIONS
The sample is random.
The population from which the sample is drawn is either normal or the sample size is large.

STEPS 3-5
Step 3: Calculate the test statistic:
Where
Step 4: Calculate the p-value based on the appropriate alternative hypothesis.
Step 5: Write a conclusion.
ns
yt
/0
11
2
n
yys
n
ii

IRIS EXAMPLE A researcher would like to know whether the mean
sepal width of a variety of irises is different from 3.5 cm.
The researcher randomly measures the sepal width of 50 irises.
Step 1: HypothesesH0: μ = 3.5 cm
Ha: μ ≠ 3.5 cm
JMP
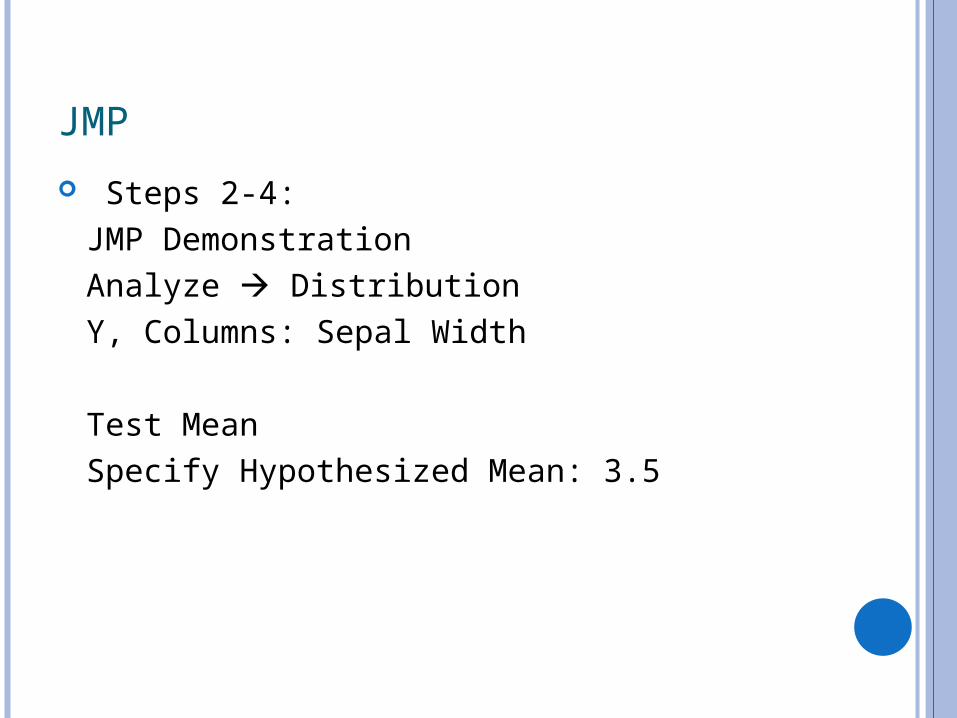
Steps 2-4:JMP DemonstrationAnalyze DistributionY, Columns: Sepal Width
Test MeanSpecify Hypothesized Mean: 3.5
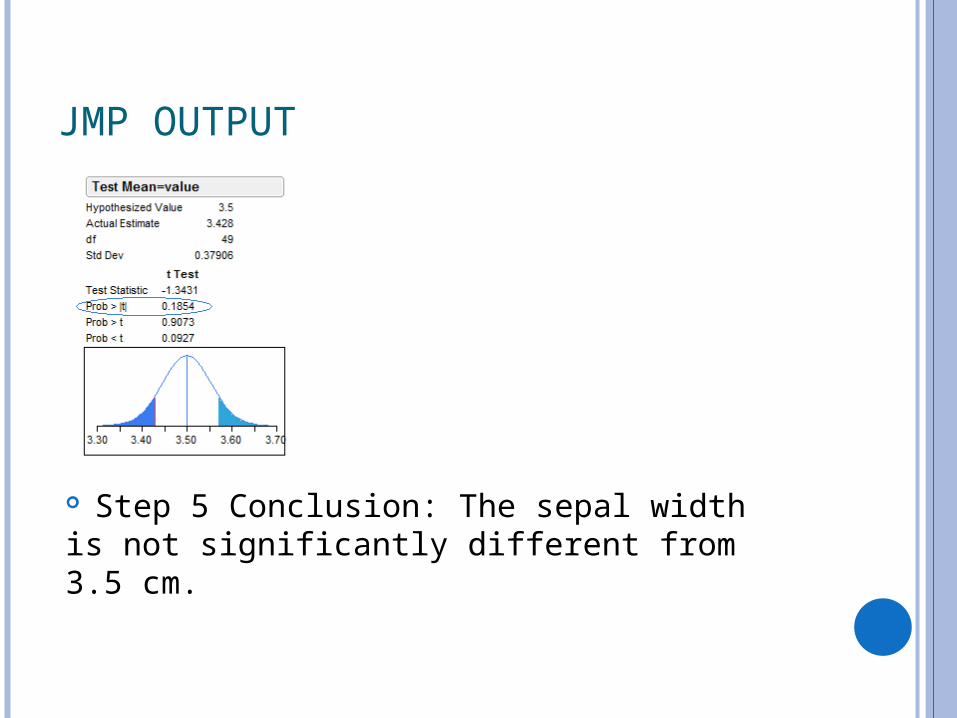
JMP OUTPUT
Step 5 Conclusion: The sepal width is not significantly different from 3.5 cm.
TWO SAMPLE T-TEST

TWO SAMPLE T-TEST
Two sample t-tests are used to determine whether the mean of one group is equal to, larger than or smaller than the mean of another group.
Example: Is the mean cholesterol of people taking drug A lower than the mean cholesterol of people taking drug B?

STEP 1: FORMULATE THE HYPOTHESES
The population means of the two groups are not equal.
H0: μ1 = μ2
Ha: μ1 ≠ μ2
The population mean of group 1 is greater than the population mean of group 2.
H0: μ1 = μ2
Ha: μ1 > μ2
The population mean of group 1 is less than the population mean of group 2.
H0: μ1 = μ2
Ha: μ1 < μ2

STEP 2: CHECK THE ASSUMPTIONS
The two samples are random and independent.
The populations from which the samples are drawn are either normal or the sample sizes are large.
The populations have the same standard deviation.

STEPS 3-5
Step 3: Calculate the test statistic
where
Step 4: Calculate the appropriate p-value. Step 5: Write a Conclusion.
21
21
11nn
s
yyt
p
2
)1()1(
21
222
211
nn
snsnsp

TWO SAMPLE EXAMPLE
A researcher would like to know whether the mean sepal width of a setosa irises is different from the mean sepal width of versicolor irises.
Step 1 Hypotheses:H0: μsetosa = μversicolor
Ha: μsetosa ≠ μversicolor

JMP
Steps 2-4:JMP Demonstration:Analyze Fit Y By XY, Response: Sepal WidthX, Factor: Species

JMP OUTPUT
Step 5 Conclusion: There is strong evidence (p-value < 0.0001) that the mean sepal widths for the two varieties are different.

PAIRED T-TEST

PAIRED T-TEST
The paired t-test is used to compare the means of two dependent samples.
Example:A researcher would like to determine if background noise causes people to take longer to complete math problems. The researcher gives 20 subjects two math tests one with complete silence and one with background noise and records the time each subject takes to complete each test.

STEP 1: FORMULATE THE HYPOTHESES The population mean difference is not equal to
zero.
H0: μdifference = 0
Ha: μdifference ≠ 0 The population mean difference is greater than
zero.
H0: μdifference = 0
Ha: μdifference > 0 The population mean difference is less than a
zero.
H0: μdifference = 0
Ha: μdifference < 0

STEP 2: CHECK THE ASSUMPTIONS
The sample is random.
The data is matched pairs.
The differences have a normal distribution or the sample size is large.

STEPS 3-5
ns
dt
d /
0
Where d bar is the mean of the differences and sd is the standard deviations of the differences.
Step 4: Calculate the p-value.
Step 5: Write a conclusion.
Step 3: Calculate the test Statistic:

PAIRED T-TEST EXAMPLE
A researcher would like to determine whether a fitness program increases flexibility. The researcher measures the flexibility (in inches) of 12 randomly selected participants before and after the fitness program.
Step 1: Formulate a HypothesisH0: μAfter - Before = 0
Ha: μ After - Before > 0

PAIRED T-TEST EXAMPLE
Steps 2-4:JMP Analysis:Create a new column of After – BeforeAnalyze DistributionY, Columns: After – Before
Test MeanSpecify Hypothesized Mean: 0
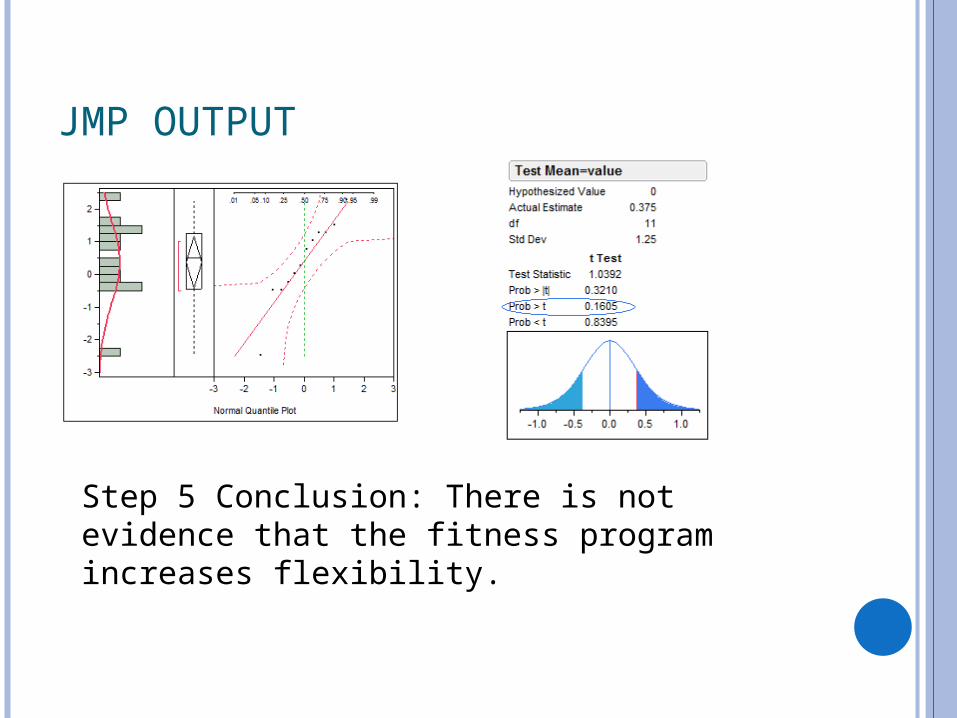
JMP OUTPUT
Step 5 Conclusion: There is not evidence that the fitness program increases flexibility.

ONE-WAY ANALYSIS OF VARIANCE

ONE-WAY ANOVA
ANOVA is used to determine whether three or more populations have different distributions.
A B C
Medical Treatment

ANOVA STRATEGY
The first step is to use the ANOVA F test to
determine if there are any significant
differences among means.
If the ANOVA F test shows that the means are
not all the same, then follow up tests can be
performed to see which pairs of means differ.
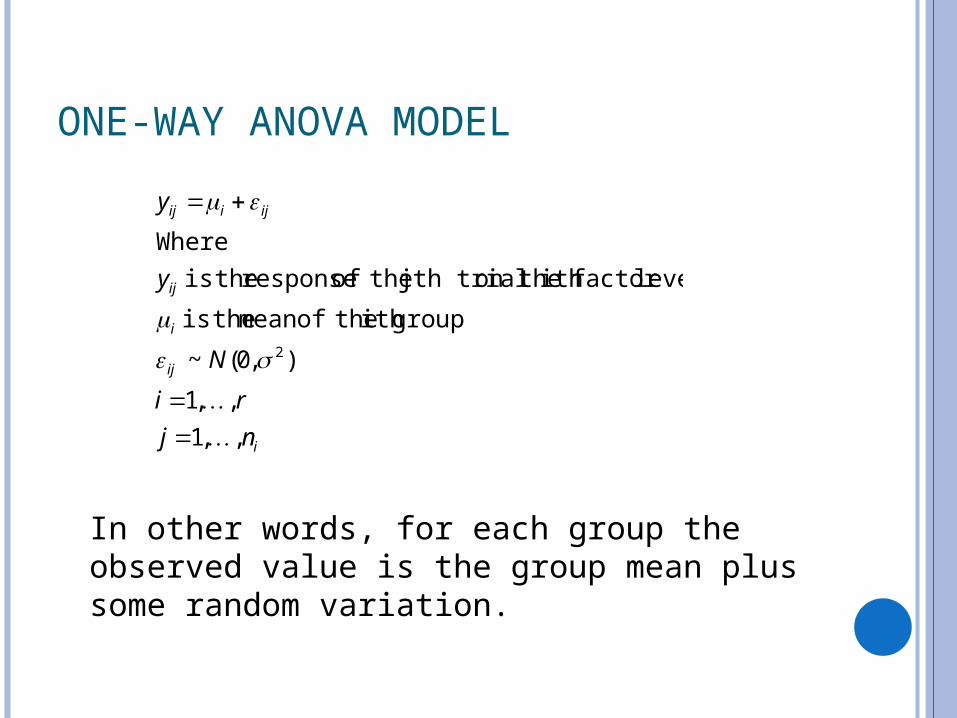
ONE-WAY ANOVA MODEL
i
ij
i
ij
ijiij
nj
ri
N
y
y
,,1
,,1
),0(~
groupith theofmean theis
levelfactor ith on the jth trial theof response theis
Where
2
In other words, for each group the observed value is the group mean plus some random variation.

ONE-WAY ANOVA HYPOTHESIS
Step 1: We test whether there is a difference in the means.
equal. allnot are The :
: 210
ia
r
H
H
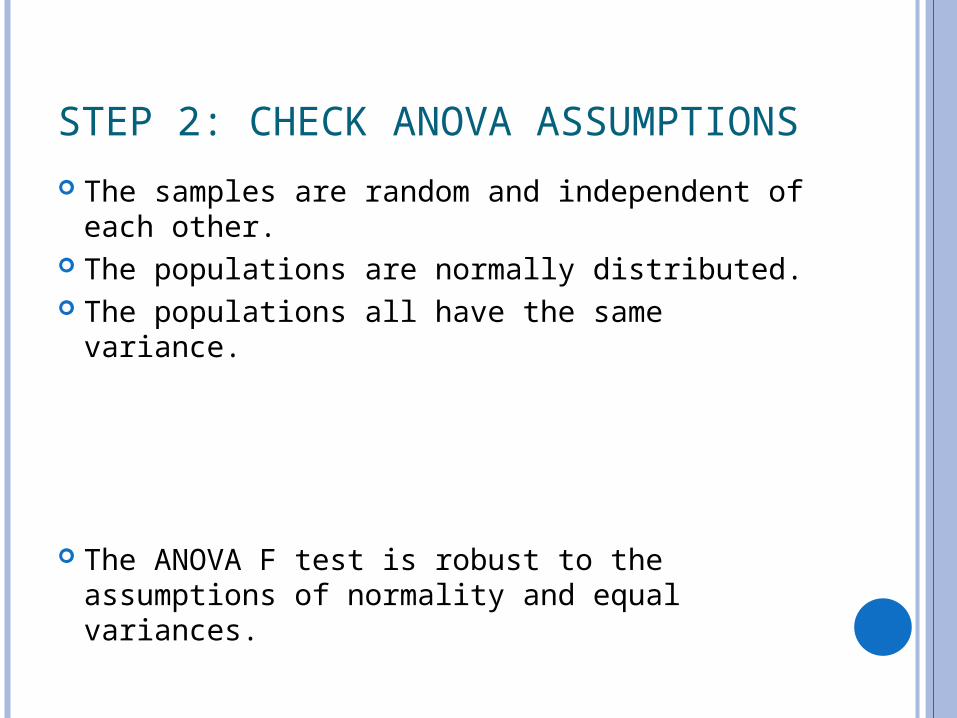
STEP 2: CHECK ANOVA ASSUMPTIONS
The samples are random and independent of each other.
The populations are normally distributed. The populations all have the same variance.
The ANOVA F test is robust to the assumptions of normality and equal variances.

STEP 3: ANOVA F TEST
Compare the variation within the samples to the variation between the samples.
A B C A B C
Medical Treatment

ANOVA TEST STATISTIC
MSE
MSG
Groupswithin Variation
Groupsbetween Variation F
Variation within groups small compared with variation between groups → Large F
Variation within groups large compared with variation between groups → Small F

MSG
1-r
)(n)(n)(n
1 -r
SSGMSG
21r
222
211
yyyyyy
The mean square for groups, MSG, measures
the variability of the sample averages.
SSG stands for sums of squares groups.

MSE
1
)(
s
Wherer -n
1)s - (n1)s - (n 1)s - (n
r -n
SSE MSE
1i
2rr
222
211
i
n
jiij
n
yyi
Mean square error, MSE, measures the variability within the groups. SSE stands for sums of squares error.

STEPS 4-5
Step 4: Calculate the p-value.
Step 5: Write a conclusion.

ANOVA EXAMPLE
A researcher would like to determine if three drugs provide the same relief from pain.
60 patients are randomly assigned to a treatment (20 people in each treatment).
Step 1: Formulate the HypothesesH0: μDrug A = μDrug B = μDrug C
Ha : The μi are not all equal.

STEPS 2-4
JMP demonstrationAnalyze Fit Y By X Y, Response: Pain
X, Factor: Drug

EXAMPLE 1: JMP OUTPUT AND CONCLUSION
Step 5 Conclusion: There is strong evidence that the drugs are not all the same.

FOLLOW-UP TEST
The p-value of the overall F test indicates that level of pain is not the same for patients taking drugs A, B and C.
We would like to know which pairs of treatments are different.
One method is to use Tukey’s HSD (honestly significant differences).

TUKEY TESTS
Tukey’s test simultaneously tests
JMP demonstrationOneway Analysis of Pain By Drug Compare Means All Pairs, Tukey HSD
'a
'0
:H
:H
ii
ii
for all pairs of factor levels. Tukey’s HSD controls the overall type I error.

JMP OUTPUT
The JMP output shows that drugs A and C are significantly different.

ANALYSIS OF COVARIANCE

ANALYSIS OF COVARIANCE (ANCOVA)
Covariates are variables that may affect the response but cannot be controlled.
Covariates are not of primary interest to the researcher.
We will look at an example with two covariates, the model is
ijiijy covariates

ANCOVA EXAMPLE
Consider the previous example where we tested whether the patients receiving different drugs reported different levels of pain. Perhaps age and gender may influence the efficacy of the drug. We can use age and gender as covariates.
JMP demonstration
Analyze Fit Model
Y: Pain
Add: Drug
Age
Gender

JMP OUTPUT

CONCLUSION
The one sample t-test allows us to test whether the mean of a group is equal to a specified value.
The two sample t-test and paired t-test allows us to determine if the means of two groups are different.
ANOVA and ANCOVA methods allow us to determine whether the means of several groups are statistically different.

SAS AND SPSS
For information about using SAS and SPSS to do ANOVA:
http://www.ats.ucla.edu/stat/sas/topics/anova.htm
http://www.ats.ucla.edu/stat/spss/topics/anova.htm

REFERENCES
Fisher’s Irises Data (used in one sample and two sample t-test examples).
Flexibility data (paired t-test example):Michael Sullivan III. Statistics Informed Decisions Using Data. Upper Saddle River, New Jersey: Pearson Education, 2004: 602.


