Energy Education Science and Technology 2006 Volume(issue) 17(1): 7-25 Decision support system for regional electricity planning T. V. Ramachandra 1,* Vince George 2 , Krishna S.Vamsee 2 , G. B. Purnima 2 1 Centre for Sustainable Technology, Indian Institute of Science 2Centre for Ecological Sciences, Indian Institute of Science Received 24 January 2006; accepted 26 April 2006 Abstract Electricity appears to be the energy carrier of choice for modern economics since growth in electricity has outpaced growth in the demand for fuels. A decision maker (DM) for accurate and efficient decisions in electricity distribution requires the sector wise and location wise electricity consumption information to predict the requirement of electricity. In this regard, an interactive computer-based Decision Support System (DSS) has been developed to compile, analyse and present the data at disaggregated levels for regional energy planning. This helps in providing the precise information needed to make timely decisions related to transmission and distribution planning leading to increased efficiency and productivity. This paper discusses the design and implementation of a DSS, which facilitates to analyse the consumption of electricity at various hierarchical levels (division, taluk, sub division, feeder) for selected periods. This DSS is validated with the data of transmission and distribution systems of Kolar district in Karnataka State, India. Keywords: Electricity planning; Decision Support System (DSS); Geographic Information System (GIS); Transmission and distribution losses; Optimal routing 1. Introduction Electrification plays a prominent role in maintaining the standard of living. Modern civilization differs from earlier civilizations in the enormous use of inanimate sources of energy and mechanization of day-to-day activities. The results are a diminution of mechanical drudgery, a shorter working day, a higher standard of living, a healthier and more balanced diet and freedom to a large extent from local famines. Energy demand has been increasing with burgeoning population coupled with intensive agricultural activities, industrialisation and changes in living standards. Renewable energy technologies can meet much of the growing demand through adequate support and interventions from the Government [1]. ___________ * Corresponding author. Tel.: +91-080-2360-0985, Fax: +91-080-2360-1428 E-mail address: [email protected] (T. V. Ramachandra)
Transcript
Energy Education Science and Technology 2006 Volume(issue) 17(1): 7-25
Decision support system for regional
electricity planning
T. V. Ramachandra1,* Vince George2, Krishna S.Vamsee2, G. B. Purnima2
1Centre for Sustainable Technology, Indian Institute of Science 2Centre for Ecological Sciences, Indian Institute of Science
Received 24 January 2006; accepted 26 April 2006
Abstract
Electricity appears to be the energy carrier of choice for modern economics since growth in electricity has outpaced growth in the demand for fuels. A decision maker (DM) for accurate and efficient decisions in electricity distribution requires the sector wise and location wise electricity consumption information to predict the requirement of electricity. In this regard, an interactive computer-based Decision Support System (DSS) has been developed to compile, analyse and present the data at disaggregated levels for regional energy planning. This helps in providing the precise information needed to make timely decisions related to transmission and distribution planning leading to increased efficiency and productivity. This paper discusses the design and implementation of a DSS, which facilitates to analyse the consumption of electricity at various hierarchical levels (division, taluk, sub division, feeder) for selected periods. This DSS is validated with the data of transmission and distribution systems of Kolar district in Karnataka State, India. Keywords: Electricity planning; Decision Support System (DSS); Geographic Information System (GIS); Transmission and distribution losses; Optimal routing
1. Introduction
Electrification plays a prominent role in maintaining the standard of living. Modern civilization differs from earlier civilizations in the enormous use of inanimate sources of energy and mechanization of day-to-day activities. The results are a diminution of mechanical drudgery, a shorter working day, a higher standard of living, a healthier and more balanced diet and freedom to a large extent from local famines. Energy demand has been increasing with burgeoning population coupled with intensive agricultural activities, industrialisation and changes in living standards. Renewable energy technologies can meet much of the growing demand through adequate support and interventions from the Government [1]. ___________ *Corresponding author. Tel.: +91-080-2360-0985, Fax: +91-080-2360-1428 E-mail address: [email protected] (T. V. Ramachandra)
8 T. V. Ramachandra et al. / Energy Education Science & Technology 17 (2006) 7-25 The market for renewable energy depends in part on the future demand for energy services like heating, lighting, cooking so forth. This demand in turn, depends on economic and population growth and so on efficiency of energy use. Energy supply requirements need to be estimated by taking such considerations into account. A DSS can assist to analyse and estimate energy requirements and consumptions. DSS is defined as “interactive computer-based systems, which help DMs to utilize data and models to solve unstructured problems". A “what if” is an important feature of DSS that enables us to find what happens to certain conclusions or results if changes are being made in the assumptions or in the input information. DSS is designed to support the solution of complex problems, provide fast response to unexpected situations that result in changed conditions. It is versatile with an ability to try several different strategies under different configurations quickly and effectively. The basic characteristics of DSS are:
. New insights and learning . Facilitated communication . Improved management control and performance . Cost savings . Objective decisions . Improving managerial effectiveness
DSS play a major role in pre-feasibility investigations, generation, planning of transmission and distribution systems, and management of load and energy (at feeder level etc.). Owing to the limited resources on generation and transmission as well as high rates of growth has resulted in many distribution systems in the less developed countries being in a poor technical state. A multi-attribute DSS was developed for evaluating energy resources to enable the selection of a suitable electricity generation alternative in Turkey [2]. It also provides an integrated decision framework for the selection of the most suitable multi-attribute method and presents ranking of alternatives and robustness analysis as recommendation to the authorities. Preference Ranking Organization Method for Enrichment Evaluation is used to analyse decision problem. According to the partial ordering, wind power is ranked first followed by hydropower and photovoltaic (PV) for electricity generation. A DSS was developed to solve complex Electrical Power Districting Problem (EPDP), which renders the solution using a visualization tool, known as Pareto Rank Scatter Plot (PRSP) [3]. The PRSP is useful in helping the DMs judge alternative districting plans relative to others in the solution space. The PRSP organizes the solutions into a "soft efficient frontier" comprised of equivalence class layers. Each solution in an equivalence class layer is displayed with a marker corresponding to the legend in PRSP. This DSS was found to effectively support DMs at the World Bank in solving an EPDP in the context of a case study for the Republic of Ghana.
T. V. Ramachandra et al. / Energy Education Science & Technology 17 (2006) 7-25 9 A time-series-based decision-support system was developed to integrate data management, model base management, simulation, graphic display and statistical analysis to provide near-optimal forecasting models [4]. The model base includes a variety of time-series techniques, such as exponential smoothing, Box-Jenkins and dynamic regression. The system produces short-term forecasts (one year ahead) by analysing the behaviour of monthly peak loads. The performance of the DSS is validated through a comparison with results suggested by econometricians. Modular Energy System Analysis and Planning (MESAP) was developed to aid as a DSS for energy and environmental management on a local, regional or global scale [5]. In addition to this, MESAP can be used to set up statistical energy and environmental information system to produce regular reports such as energy balances and emission inventories. It consists of a general information system based on relation database theory, which is linked to different modelling tools. It supports every phase of the structured analysis procedure to assist the decision making process in a pragmatic way. It offers tools for demand analysis, integrated resource planning, demand side management and simulation and optimisation of supply system. 2. Transmission and distribution of electricity Electricity generated at a power station is distributed to consumers through a network of transmission and distribution systems. Transmission systems have large power handling capability; relatively long lines that connect generator sites to load centres or one utility to another. Distribution systems branch out from the transmission systems; they have lower power levels and relatively short lines. Transmission and distribution systems are again subdivided into primary and secondary transmission, and primary and secondary distribution. The distribution systems can be subdivided into feeders, distributors and service mains. The feeders are the conductors, which connect the sub-stations or the generating stations to the areas served by these stations. The distributors consist of numerous tappings from which the supply to consumers is taken. A transmission system can be used to carry electrical energy from generating station to a series of substations. The transmission system carries large quantities of energy, which can be most economically transported on thin conductors at high voltage over long distances. Then at the areas of energy consumption the transmission lines deliver energy to substations, which reduce the voltage to safer values for circuits running through inhabited localities. The distribution systems in turn feed transformers, carried on poles or located in underground manholes that finally reduce the voltage to the magnitude at which the consumers will use it. Power system energy loss occurs in the process of delivering energy from the point of generation to consumption. These are broadly grouped as transmission losses, substation losses and distribution losses. 2.1. Transmission loss This is the electrical energy lost owing to the electrical characteristics of transmission lines. The total amount of loss within the transmission network is calculated by two different approaches. (i) By subtracting the sum total of the energy taken by all the loads from the sum total of the energy fed into the network by all sources.
10 T. V. Ramachandra et al. / Energy Education Science & Technology 17 (2006) 7-25
(ii) By calculating and summarizing the losses of the individual lines within the network. 2.1. Substation loss This is the electrical energy spent in transforming voltage level step-up or step-down at the grid or distribution substation. 2.3. Distribution loss This is the electrical energy lost by the distribution electrical networks, which is categorized as:
. Technical loss
These are line losses caused by the resistance of the conductor, transformer and regulator loss, corona loss in extra high voltage or ultra high voltage, dielectric loss especially in under ground cables, energy meter loading loss, power factor loss, voltage drop loss and overload loss.
. Non-technical loss They are theft or pilferage by metered and unmetered customers, illegal connection, incorrect operation of the meter and illegal use in collaboration with the utility’s personnel and others.
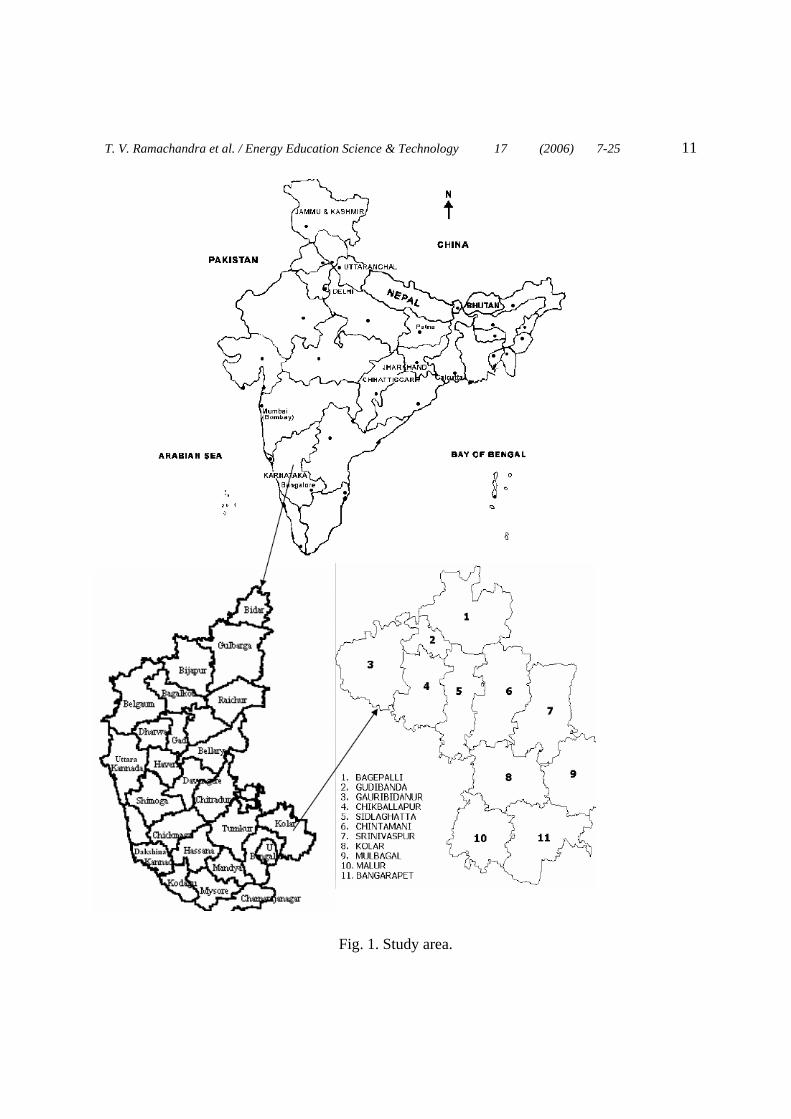
Energy losses cannot be eliminated fully, but can be minimized by strengthening of electrical facilities. In this regard, spatial decision support system helps in identifying the nodes (with unreasonable losses), which in turn helps in lowering the losses [6]. Nodes of the network represent energy activities or processes. The DSS processes a representative network of all energy production, conservation, transportation, distribution and utilization activities in a region. 3. Objective The main objectives of the study are to (i) design and develop a DSS for the assessment of electricity consumption at district, division, taluk, substation and feeder levels and (ii) validate the DSS with a sample data of the district. 4. Study area Kolar district is located in the southern plains of Karnataka State, India. It lies between 770 21' to 780 35' east longitude and 120 46' to 130 58' north latitude and extends over an area of 8,225 sq. km. According to 2001 Census, the population was 25.23 lakh. For administrative purposes, the district has been divided into 11 taluks. There are 15 towns and 3,325 inhabited villages in the district. Kolar belongs to the semi-arid zone of Karnataka. Fig. 1 shows the study area. Kolar district is divided in to three administrative divisions namely Kolar, Chikballapur and Kolar Gold
T. V. Ramachandra et al. / Energy Education Science & Technology 17 (2006) 7-25 11
Fig. 1. Study area.
12 T. V. Ramachandra et al. / Energy Education Science & Technology 17 (2006) 7-25 Field (K.G.F) for managing transmission and distribution of electricity in the district. Each division distributes electricity to taluks. 4.1. Kolar division Kolar division consists of 14 substations (one 220 kV substation, eight 66 kV substation and five 33 kV substations). Transformer capacity in Kolar division is 400.40 MVA. Kolar division has two 220 kV power transformers having aggregate capacity of 200MVA and seventeen 66 kV power transformers having aggregate capacity of 162.4MVA and nine 33 kV transformers having 38.0 MVA capacity. It has 1515 km High Tension Distribution Line (HTDL) and 4244 km Low Tension Distribution Line (LTDL). 4.2. Chikballapur division Chikballapur division consists of 13 substations (one 220 kV substation, twelve 66 kV substation). Chikballapur division transformer capacity is 281 MVA. This division has two 220 kV power transformers having aggregate capacity of 100MVA and twenty-one 66 kV power transformers having aggregate capacity of 171 MVA and two 33 kV transformers having 10 MVA capacity. It has 3716 km HTDL and 13937 km LTDL. 4.3. K. G. F division K.G.F division consists of nine 66 kV substations. The transformer capacity in K.G.F division is 157.60 MVA. This division has twenty-five 66 kV power transformers having aggregate capacity of 157.6 MVA. It has 2076 km HTDL and 7410 km LTDL. 5. Methodology The DSS for electricity distribution (Fig. 2) provides a user friendly Graphical User Interface (GUI), developed using Microsoft Visual Basic 6.0 as frontend with MS Access database as backend. This GUI Environment helps in entry, update of database along with the options to compute shortest route, category and energy analysis for selected locations. 6. DSS for electricity distribution The overall structure of the DSS for electricity distribution is given below. User interacts through GUI, which contains the following menu options:
. Edit: to enter category and energy details.
. Analysis: to do category wise and energy wise analysis at different levels.
. Forecast: to forecast the future consumption.
. Geographical Information System (GIS): to find the shortest route of the electrical networks.
. Help: on-line help.
T. V. Ramachandra et al. / Energy Education Science & Technology 17 (2006) 7-25 13
The user can select any of the five modules and the data for each of the module is retrieved from the database. The processed output is either stored in the database or given to the user. For finding the shortest route the digitised maps are given through the GIS. Kernel passes the data to the application manager. The kernel accesses the needed data from the database according to the Application manager’s request through the help of the Data Base Management System (DBMS). Then processed data is given back to users. According to the analysis at various levels the application manager selects various levels from the electricity supply or from demand.
7. Process design of DSS
The physical design for DSS is the software package written in Visual Basic as front-end tool and Microsoft Access as back-end tool. This DSS consists of 4 modules: electrical energy analysis, category analysis, forecast and shortest route.
8. Energy Analysis
In this module yearly, monthly, daily consumption and loss of electricity is computed. First, it checks for the data in the database. According to the availability of data, analysis is done at district/division/taluk/substation/feeder levels. If the data is not available, then the required data has to be added to the database. To compute the yearly consumption and loss of electricity, select the levels such as district, division, taluk, substation, feeder and then the year. Proceed if the data is present, else it will display the message “No Data”. If the yearly data is available then the computed result is the true value else the computed result is the average value (based on previous years consumption). If the selected level is district (division / taluk / substation / feeder) then total consumption of electricity of all the divisions under that district (or respective hierarchical level) is aggregated and displayed. The monthly and daily consumption and loss of electricity is computed in the similar manner for various levels (division, taluk, substation, feeder levels).
9. Category analysis In this module yearly, monthly, daily consumption and loss of electricity (category wise at various levels) is computed and displayed graphically. First it checks for the data in the database and then allows navigating at various levels (division, taluk, substation, feeder, etc.) according to the availability of the data. If the data is not available then the data may be appended to the database. 10. Forecast The future consumption of electricity is computed based on historical data. This is based on regression analysis with the data of at least ten years/months. If the data is available for
14 T. V. Ramachandra et al. / Energy Education Science & Technology 17 (2006) 7-25
Fig. 2. Overall structure of the DSS.
T. V. Ramachandra et al. / Energy Education Science & Technology 17 (2006) 7-25 15 specified range of years in the database, the relation between x and y is computed that is used for prediction. Otherwise user has the option to append the required data. 11. Shortest Route 11. 1. System representation and data storage The distribution systems is modelled to provide a reasonable representation of the actual systems as well as to enable the relevant data to be stored and meaningfully applied in the analysis programmes. Identifying the suitable nodes and the corresponding sections between two adjacent nodes does this. The data with respect to the length of the line is included in the section data while the station details such as voltage etc., is stored in the node. 11. 2. Digitisation of the model After selecting the model the network and the load data can be input via the terminal or by use of a digitiser. The digitiser is used to enter all required spatial data (vector data), which is used in maintaining the necessary records as well as in presentation of line routes, substation and equipment locations. The data thus stored can be reproduced by use of a plotter or a graphics monitor 11. 3. Computation of the shortest path Particular taluk is chosen and the two nodes (source and destination) information is provided as input for which shortest route is to be computed. The algorithm used to compute the shortest distance is Dijkstra’s algorithm. Here all the arc and node information is stored in a table called arc and node. From the arc table, number of nodes and their length is found and stored in a matrix A (m x n). The entries in the matrix are Length, if there is a direct path between i and j A (i, j) = infinite, if there is no path between i and j 0 if i=j
where, m : number of rows, n : number of columns, i : ith row and j : jth column.
12. Results and discussion
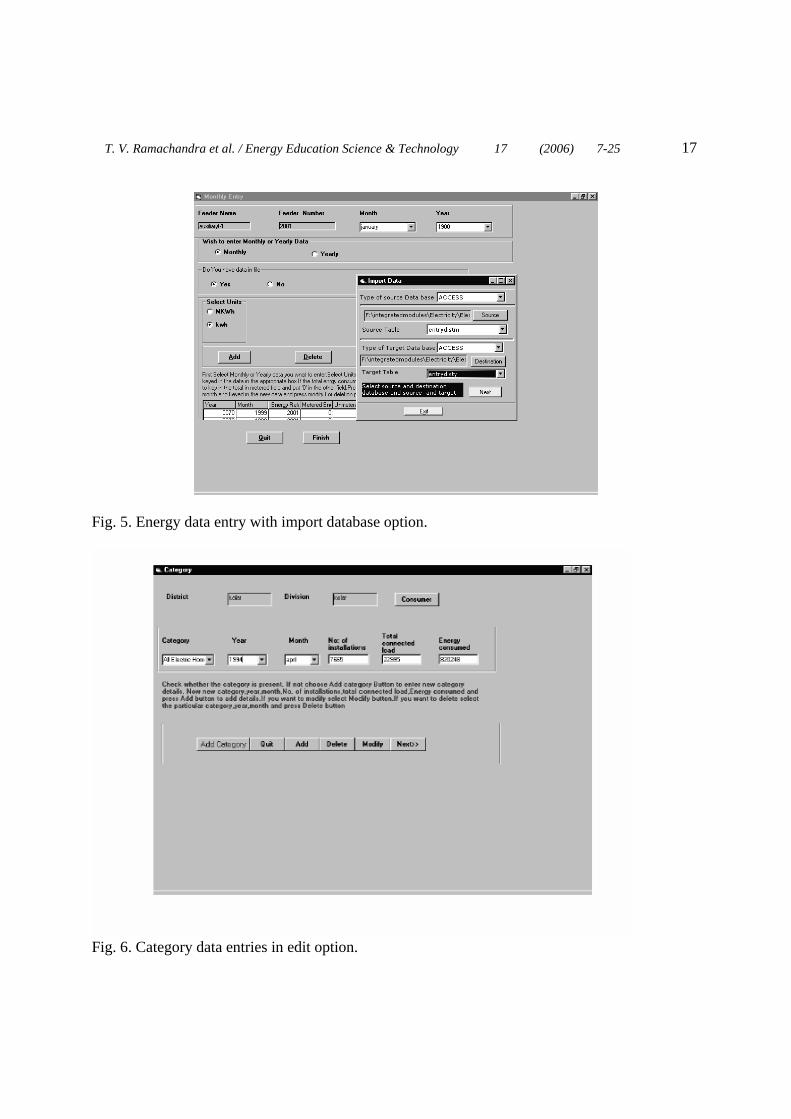
The flowchart for navigating DSS is given in Fig. 3. An executable file is provided for this application and by executing, a security form is displayed that allows user to enter password. Fig. 4 shows the login security form. Menu options (File, Edit, GIS, Analysis, Forecast) are displayed after the successful login. Edit menu option allows user to enter data for energy and category. Fig. 5 shows energy entry and the import file option allows user to enter data form existing database. User has to specify the source and target database names. Category data entry form is shown in Figure 6.
16 T. V. Ramachandra et al. / Energy Education Science & Technology 17 (2006) 7-25
Fig. 3. Navigation of DSS. Fig. 4. Login screen.
Category and energy entry[monthly / yearly]
GIS Shortest route analysis
Energy analysis -district, division, taluk,
substation, feeder wise
Forecast Predict energy consumption
- district, division, feeder wise
T. V. Ramachandra et al. / Energy Education Science & Technology 17 (2006) 7-25 17
Fig. 5. Energy data entry with import database option.
Fig. 6. Category data entries in edit option.
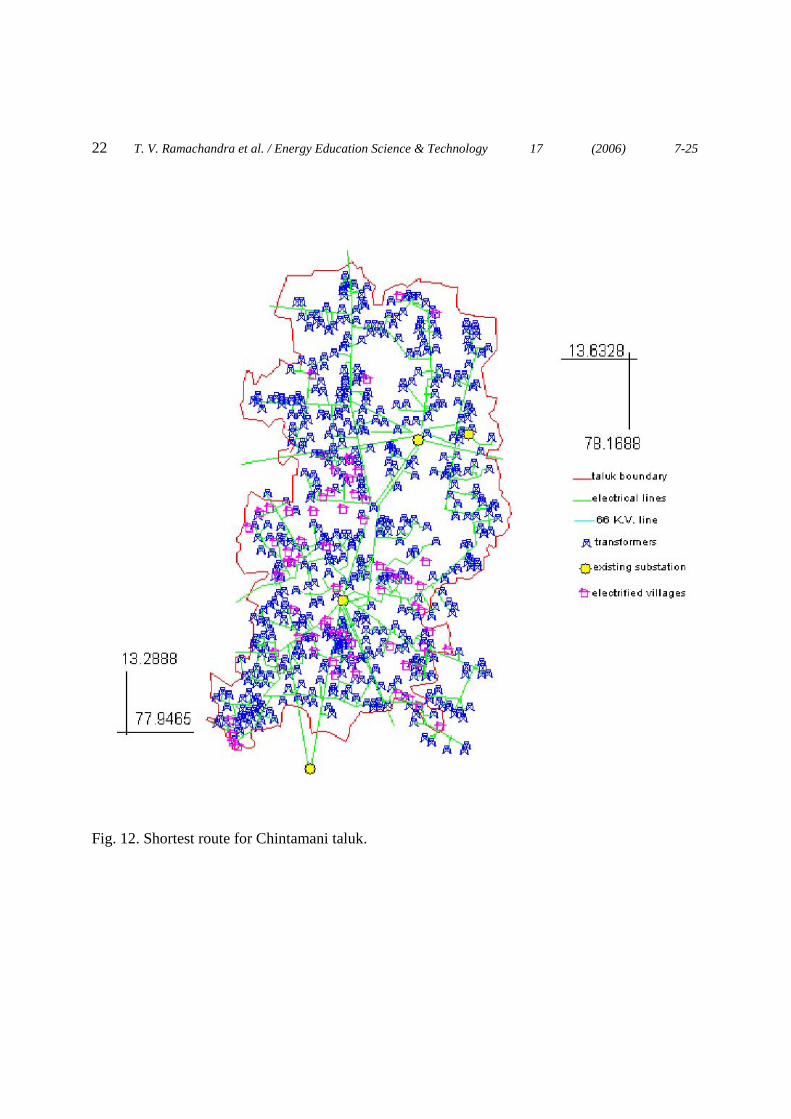
18 T. V. Ramachandra et al. / Energy Education Science & Technology 17 (2006) 7-25 Analysis menu option can be used to view category and energy analysis details. Fig. 7 gives the energy analysis at district, division, taluk, substation and feeder levels. Fig. 8 shows category wise analysis details such as number of installations, total connected load and energy consumption details. Electricity distribution data compiled for Kolar district is used for implementation and validation of DSS. Fig. 9 shows the calculations of energy consumption for district, division, taluk, substation and feeder wise for selected category and year. Graphical representation of energy consumption for selected year and month is illustrated in Fig. 10. GIS menu option allows user to find the shortest route between two selected nodes. Fig. 11 shows the shortest route for selected nodes. Fig. 12 illustrates the shortest route for Chintamani taluk. Forecast menu option allows user for computing future consumption for selected years district, division and taluk wise. Fig. 13 shows the predicted value. Fig. 14 shows the graphical representation of electricity consumption for selected years.
Fig. 7. Energy analysis screen.
T. V. Ramachandra et al. / Energy Education Science & Technology 17 (2006) 7-25 19
Fig. 8. Category analysis details.
Fig. 9. Calculations of energy consumption.
20 T. V. Ramachandra et al. / Energy Education Science & Technology 17 (2006) 7-25
Fig. 10. Graphical representation of energy consumption.
T. V. Ramachandra et al. / Energy Education Science & Technology 17 (2006) 7-25 21
Fig. 11. Shortest route for selected nodes.
22 T. V. Ramachandra et al. / Energy Education Science & Technology 17 (2006) 7-25
Fig. 12. Shortest route for Chintamani taluk.
T. V. Ramachandra et al. / Energy Education Science & Technology 17 (2006) 7-25 23 Fig. 13. Forecast menu option.
24 T. V. Ramachandra et al. / Energy Education Science & Technology 17 (2006) 7-25 Fig. 14. Graphical representation of electricity consumption for selected years.
13. Conclusions
DSS for regional electricity planning has been developed in a user-friendly way using the powerful GUI tools Visual Basic and GIS. The system has enough flexibility to meet the needs of the planners at regional levels. The system is fast and the result produced is accurate. The DSS helps to find the yearly, monthly, daily consumption and loss of electricity at various hierarchical levels. The planners can forecast the future consumption and with that result the planners can take better decision and plan accordingly. The purpose of this spatial DSS has been established as it satisfies the user requirements.
T. V. Ramachandra et al. / Energy Education Science & Technology 17 (2006) 7-25 25 The average energy consumption in Kolar district is approximately 68 million kWh. The average division wise and taluk wise consumption per month is as shown in Table 1 and Table 2 respectively. Table 1. Average division wise electricity consumption/Month Division KGF Kolar Chikballapur Consumption, kWh 22790293 25320373 20070234
Table 2. Average taluk wise electricity consumption/Month
References [1] Johansson TB, Kelly HA, Reddy KN, Williams RH. Renewable energy sources for fuels and electricity, Island Press, USA, 1992. [2] Topcu YI, F. Ulengin F. Energy for the future: An integrated decision aid for the case of Turkey, Energy 2004;29:137–154. [3] Bergey PK, Ragsdale CT, Hoskote M. A decision support system for the electrical power districting problem. Decision Support Systems 2003;36:1–17. [4] Badri MA, Al-Mutawa A, Davis D, Davis D. EDSSF: A decision support system (DSS) for electricity peak-load forecasting. Energy 1997;22:579–589. [5] Baumhögger F, Baumhögger J, Baur J-M, Kühner R, Schellmann U, Schlenzig C, Schweiker A, Steidle T. Manual MESAP, Version 3.1, Institute of Energy Economics and the Rational use of Energy (IER), Germany, 1998. [6] Jusko MJ, Buehring WA, Cirillo R, Hamilton BP, Macal CM, Peerenboom JP, Groningen CV, Wolsko TD. Energy and power evaluation program, ENPEP, Version 3.0, User’s Guide, International Atomic Energy Agency, United States, 1996.