1 Process Analysis Terms In today's business environment nothing is more common than change. Organizations are always looking to improve the way business is done. Departments and divisions are challenging practices and procedures in order to improve service to customers: students, parents, co-workers, and the metropolitan community. Through process analysis, departments can identify improvement opportunities
Transcript
1
Process Analysis Terms
In today's business environment nothing is more common than change. Organizations are always looking to improve the way business is done.
Departments and divisions are challenging practices and procedures in order to improve service to customers: students, parents, co-workers, and the metropolitan community. Through process analysis, departments can identify improvement opportunities
2
A process can be defined as "a logical series of related transactions that converts input to results or output" (Andersen 1999). The process we are considering is a "business process," which can be defined as "a chain of logical connected, repetitive activities that utilizes the organization's resources to refine an object for the purpose of achieving specified and measurable results or products for internal or external customers
3
Process Analysis TermsProcess: Is any part of an organization that takes inputs and transforms them into outputsCycle Time: Is the average successive time between completions of successive units Utilization: Is the ratio of the time that a resource is actually activated relative to the time that it is available for use
4
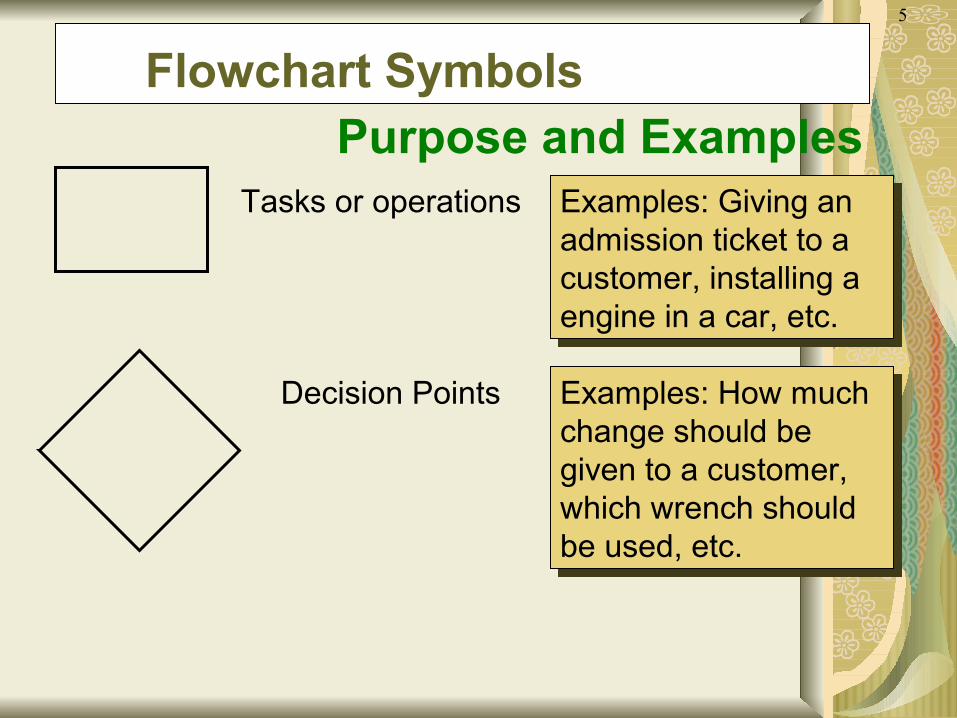
Process Flowcharting
Defined Process flowcharting is the use of a diagram to present the major elements of a process
The basic elements can include tasks or operations, flows of materials or customers, decision points, and storage areas or queues
It is an ideal methodology by which to begin analyzing a process
5
Tasks or operations Examples: Giving an admission ticket to a customer, installing a engine in a car, etc.
Decision Points Examples: How much change should be given to a customer, which wrench should be used, etc.
Purpose and Examples Flowchart Symbols
6
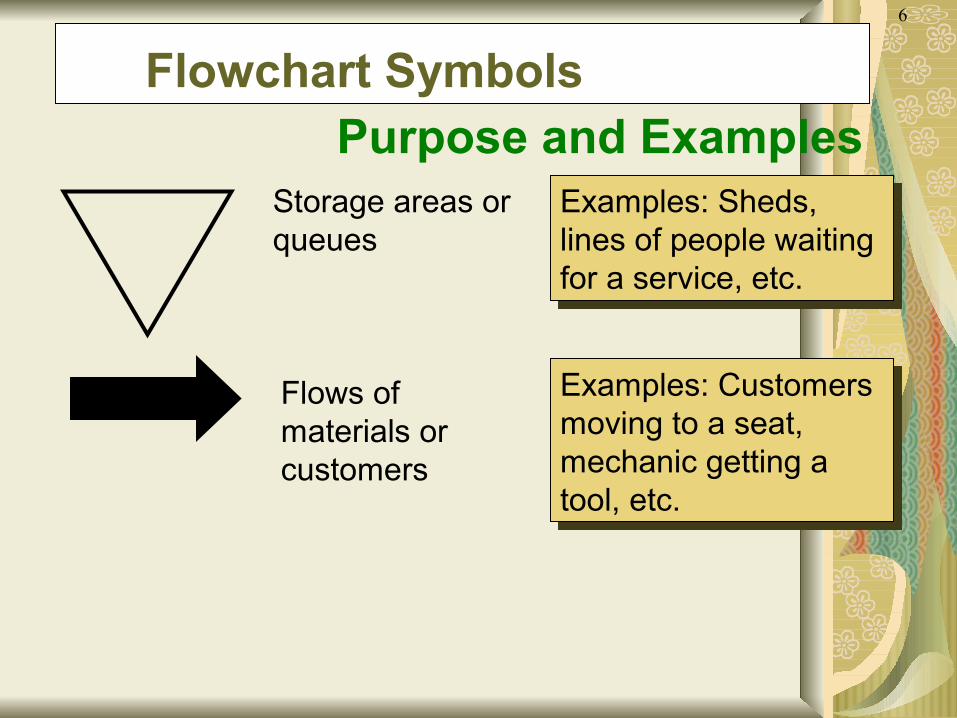
Examples: Sheds, lines of people waiting for a service, etc.
Examples: Customers moving to a seat, mechanic getting a tool, etc.
Storage areas or queues
Flows of materials or customers
Purpose and Examples Flowchart Symbols
7
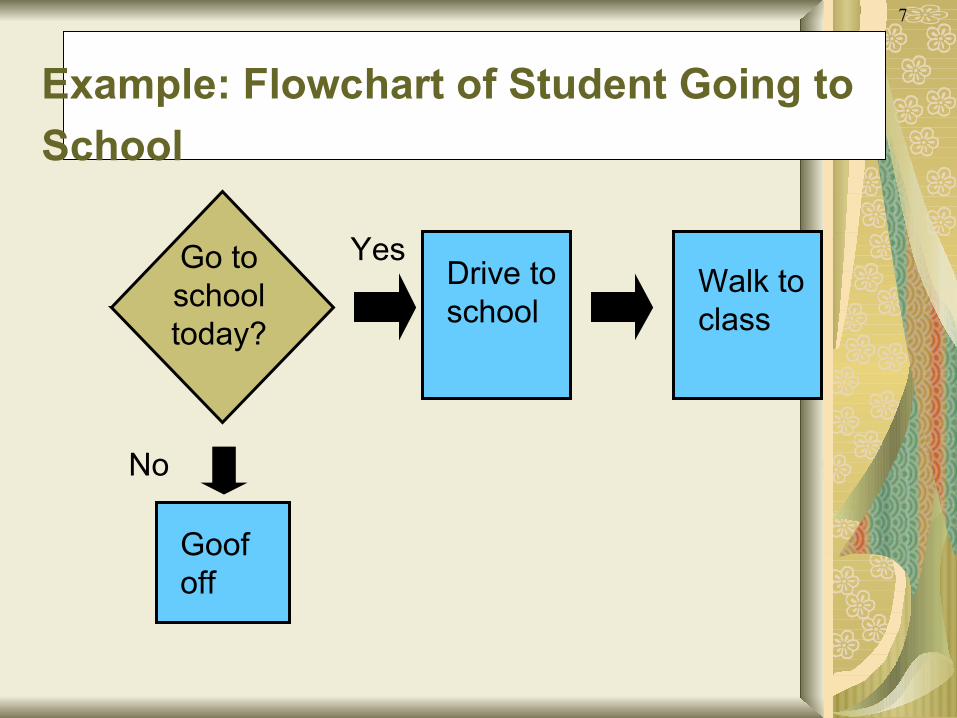
Example: Flowchart of Student Going to
School
Yes
No
Goof off
Go to school today?
Walk to class
Drive to school
8
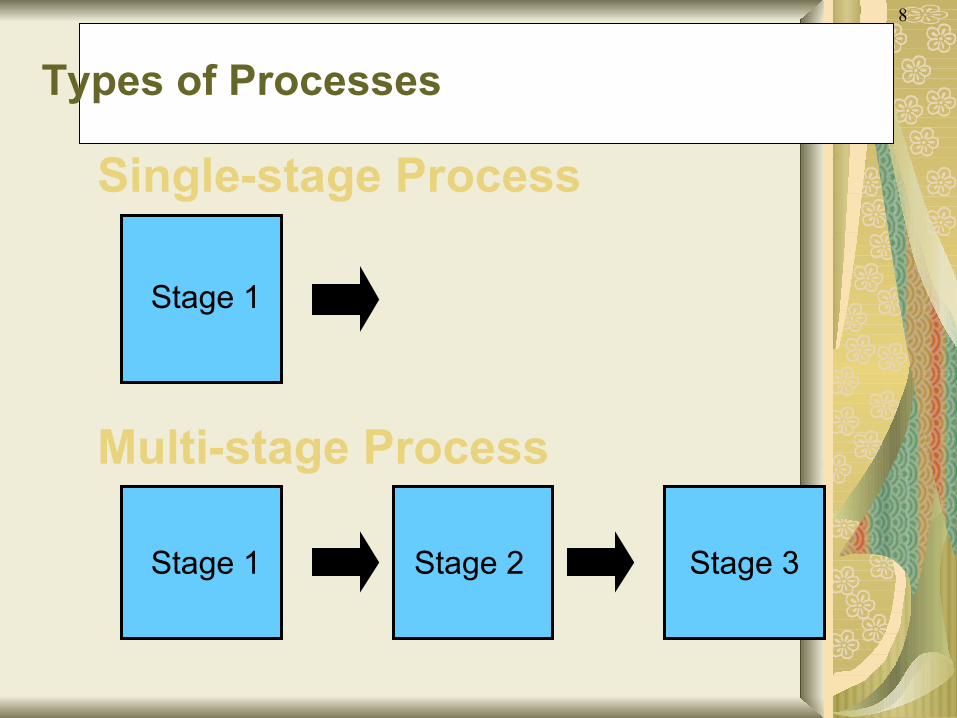
Types of Processes
Single-stage Process
Stage 1
Stage 1 Stage 2 Stage 3
Multi-stage Process
9
Types of Processes (Continued)
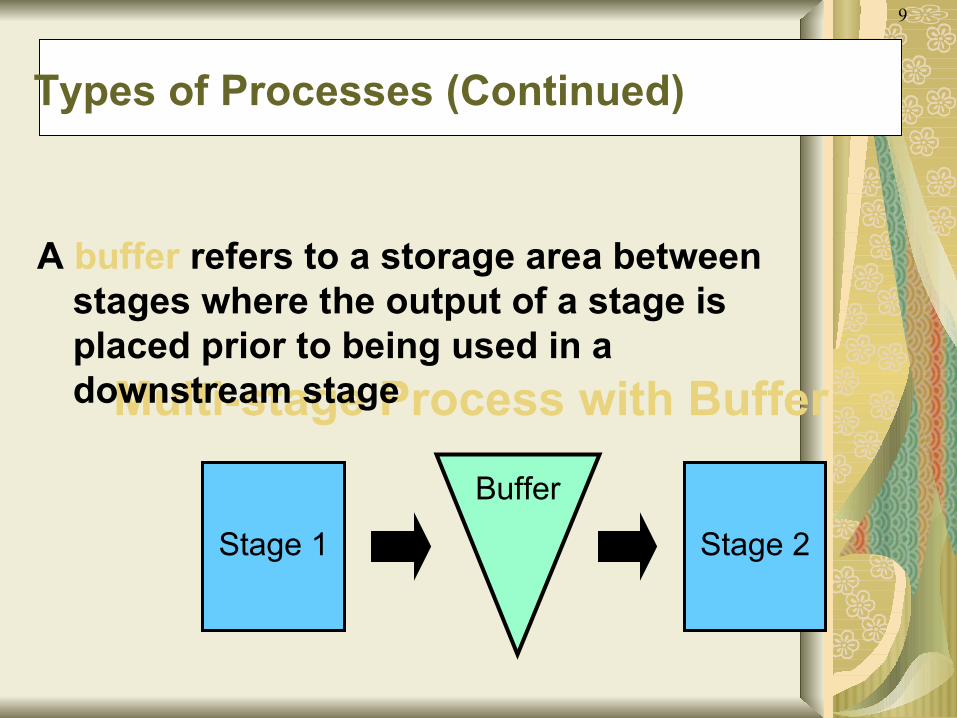
Stage 1 Stage 2
Buffer
Multi-stage Process with Buffer
A buffer refers to a storage area between stages where the output of a stage is placed prior to being used in a downstream stage
10
Other Process Terminology
BlockingOccurs when the activities in a stage must stop because there is no place to deposit the item just completed
If there is no room for an employee to place a unit of work down, the employee will hold on to it not able to continue working on the next unit
StarvingOccurs when the activities in a stage must stop because there is no work
If an employee is waiting at a work station and no work is coming to the employee to process, the employee will remain idle until the next unit of work comes
11
Other Process Terminology (Continued)Bottleneck
Occurs when the limited capacity of a process causes work to pile up or become unevenly distributed in the flow of a processIf an employee works too slow in a multi-stage process, work will begin to pile up in front of that employee. In this is case the employee represents the limited capacity causing the bottleneck.
PacingRefers to the fixed timing of the movement of items through the process
12
Other Types of Processes
Make-to-orderOnly activated in response to an actual order
Both work-in-process and finished goods inventory kept to a minimum
Make-to-stockProcess activated to meet expected or forecast demand
Customer orders are served from target stocking level
13
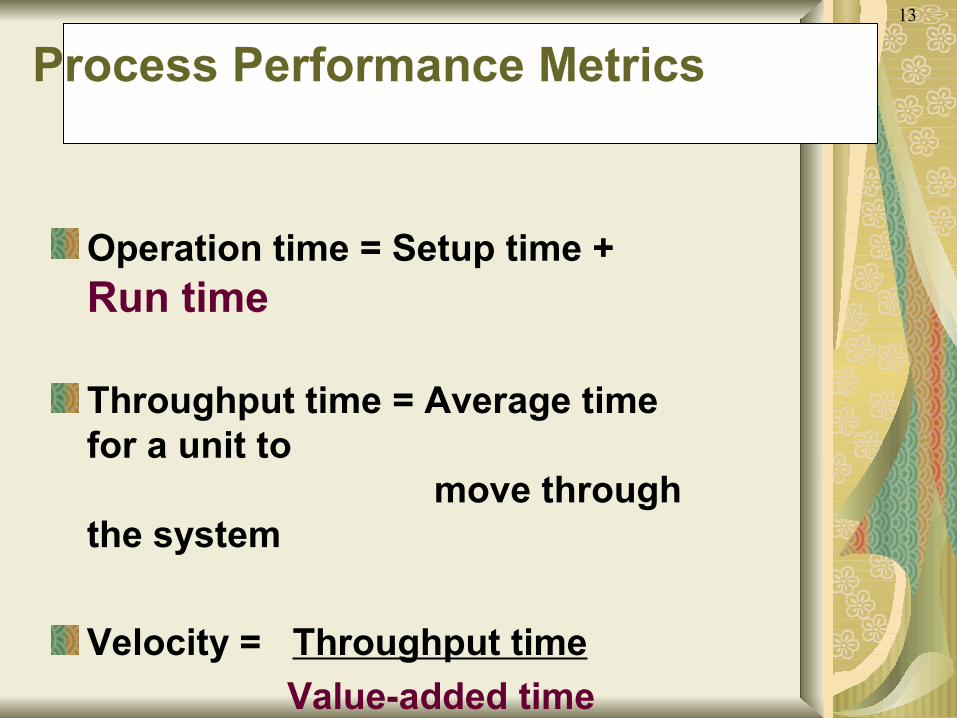
Process Performance Metrics
Operation time = Setup time + Run time
Throughput time = Average time for a unit to
move through the system
Velocity = Throughput time
Value-added time
14
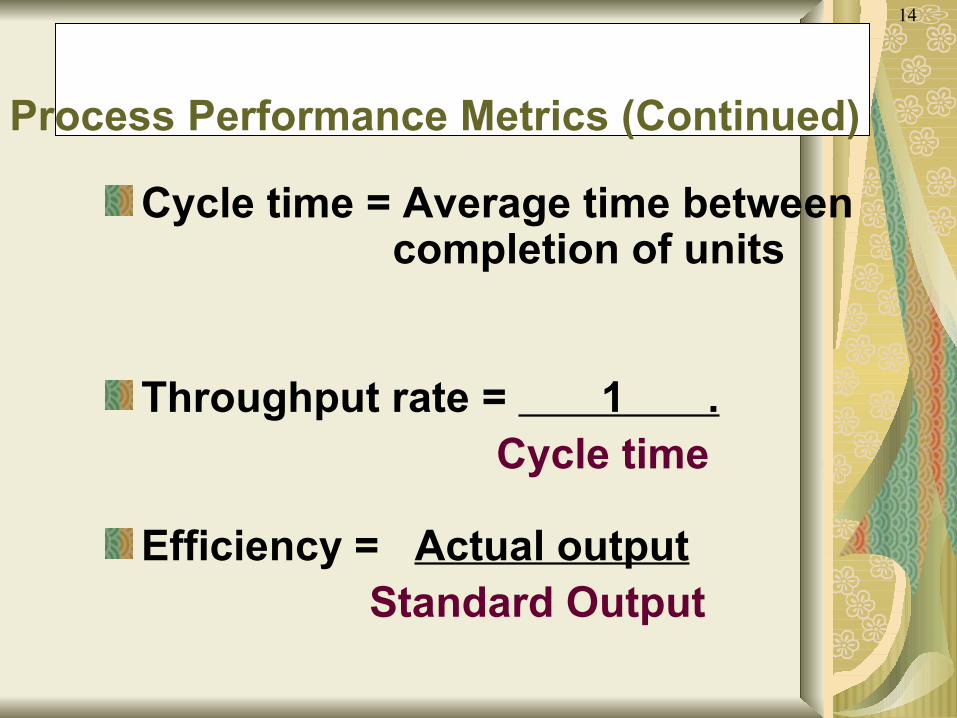
Process Performance Metrics (Continued)
Cycle time = Average time betweencompletion of units
Throughput rate = 1 . Cycle time
Efficiency = Actual output Standard Output
15
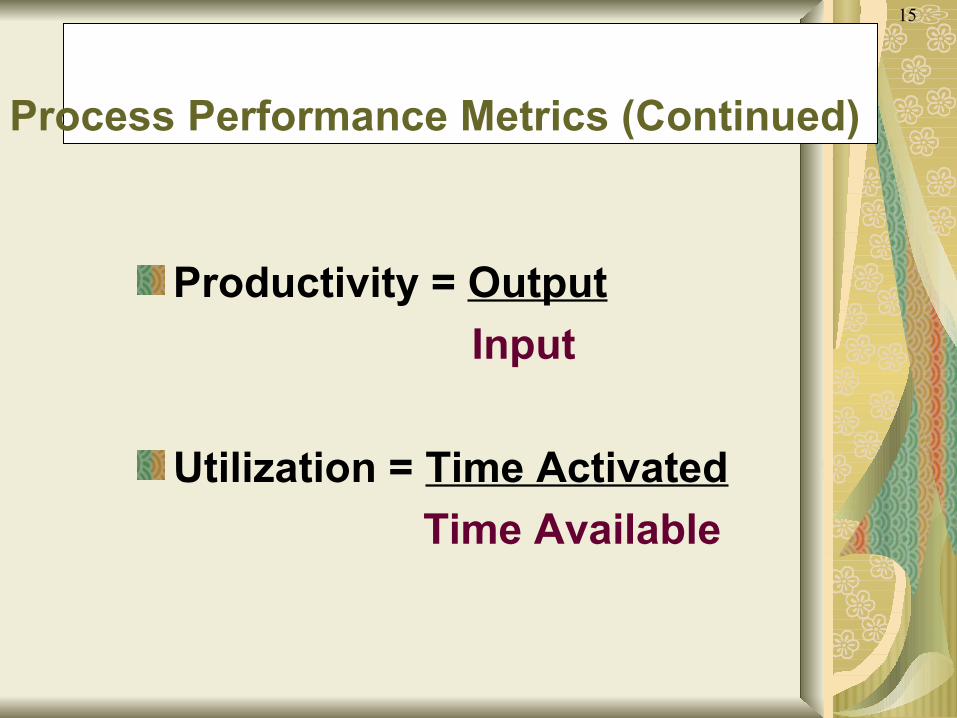
Process Performance Metrics (Continued)
Productivity = Output
Input
Utilization = Time Activated
Time Available
16
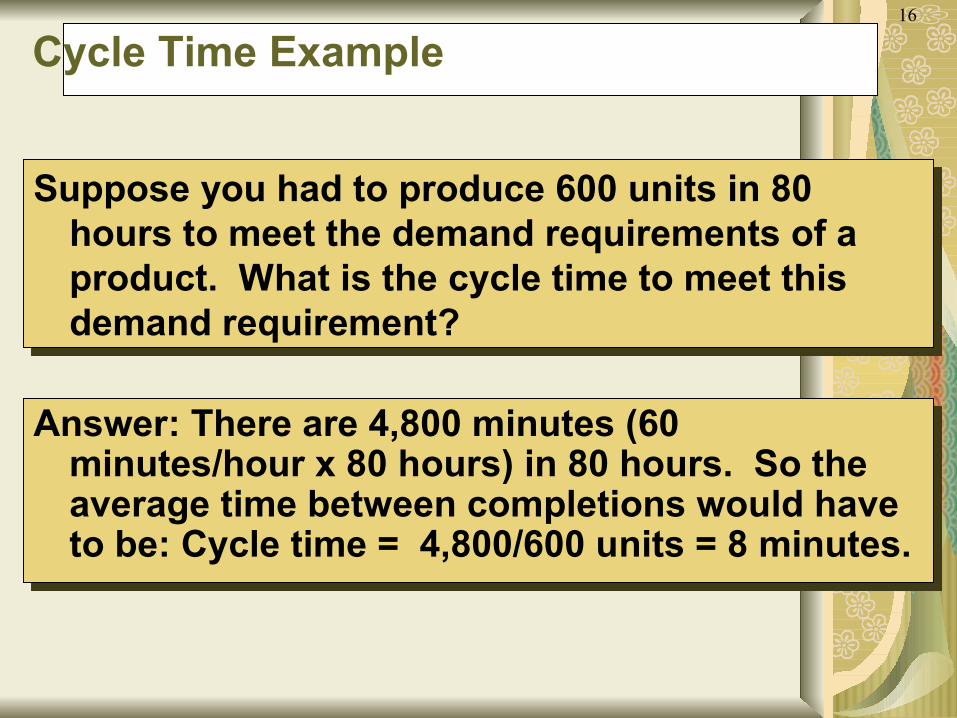
Cycle Time Example
Suppose you had to produce 600 units in 80 hours to meet the demand requirements of a product. What is the cycle time to meet this demand requirement?
Answer: There are 4,800 minutes (60 minutes/hour x 80 hours) in 80 hours. So the average time between completions would have to be: Cycle time = 4,800/600 units = 8 minutes.
17
Process Throughput Time Reduction
Perform activities in parallel
Change the sequence of activities
Reduce interruptions
18
A job shop is a type of manufacturing process structure where small batches of a variety of custom products are made. In the job shop
process flow, most of the products produced require a unique set-up and sequencing of processing steps. Examples of a job shop
include a machine tool shop, a factory machining center, paint shops, a French
restaurant, a commercial printing shop, and other manufacturers that make custom products in small lot sizes. Volume and standardization is