48
| Date post: | 30-Dec-2015 |
| Category: |
Documents |
| Upload: | tucker-avila |
| View: | 28 times |
| Download: | 0 times |


T28 N R4 W S01
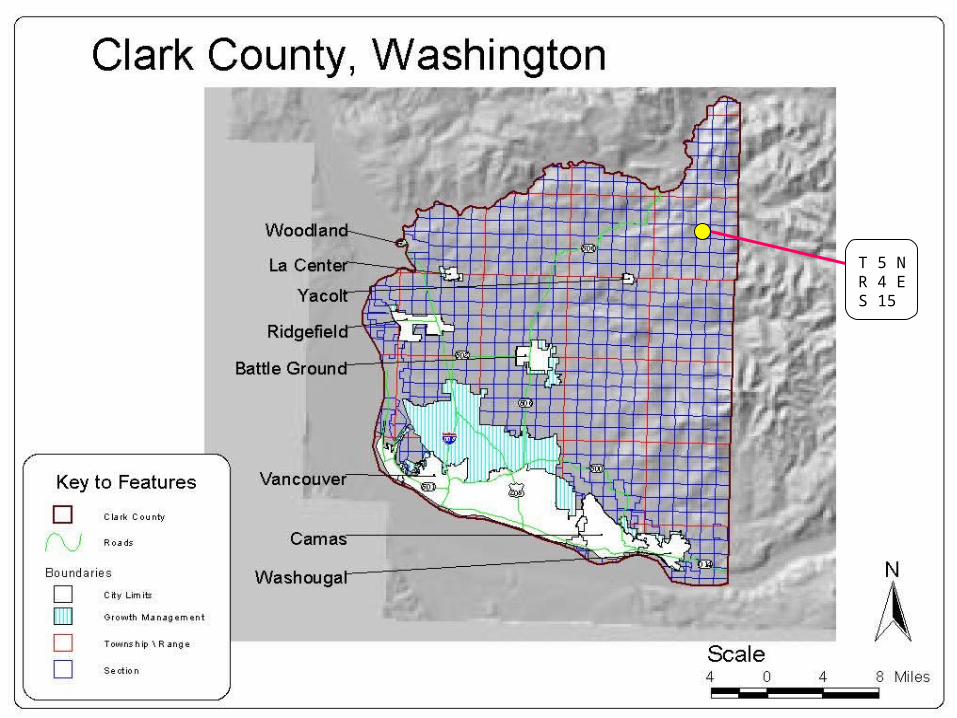
T 5 NR 4 ES 15

T31 N R4 E S20


One Digit Code
Two Digit Code
Short Code
Class ESRI Color No.
ESRI Color
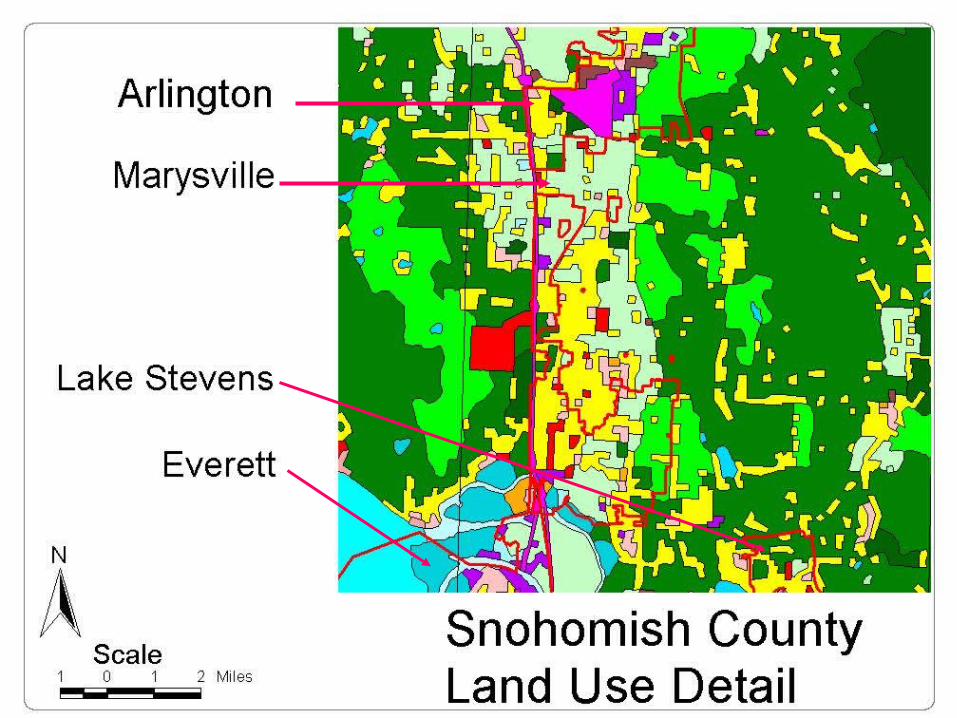
1 1 1 Human Habitat (Urban or Built-Up) 46 blue/red rose x11 1 Residential 39 bright yellow x12 1 Commercial Services 9 med red x13 1 Industrial 59 red/purple x14 1 Transportation , Communications 33 med magenta x15 1 Industrial and Commercial 10 dark red x16 1 Mixed Urban or Built-Up Areas 8 lite red x17 1 Other Urban or Built-Up Areas 7 pink x
2 2 3 Agricultural Land 56 green/blue x21 3 Cropland and Pasture 13 pale green x22 3 Orchards, Groves, Vineyards 55 yellow/green x23 3 Confined Feeding Operations 49 pale olive x24 3 Other Agricultural Land 14 lite green x
3 3 3 Rangeland 40 yellow tan x31 3 Herbaceous Rangeland 52 med olive x32 3 Shrub and Brush Rangeland 41 light olive x33 3 Mixed Rangeland 48 drk tan x
4 4 5 Forest Land 16 tree green x41 5 Deciduous Forest Land 15 med green x42 5 Evergreen Forest Land 18 drk olive x43 5 Mixed Forest Land 17 Olive grn x
5 5 7 Water 50 green/grey x51 7 Streams and Canals 25 pale blue x52 7 Lakes 57 sky blue x53 7 Reservoirs 26 light blue x54 7 Bays and Estuaries 27 med blue x
6 6 9 Wetland 30 dark blue green x61 9 Forested Wetlands 29 Med blue green x62 9 Non Forest Wetlands 28 blue green x
7 7 11 Barren Land 53 yellow/brown x71 11 Dry Salt Flats 37 pale yellow x72 11 Beaches 43 orange red x73 11 Sandy Areas Other than Beaches 44 med orange x74 11 Bare Exposed Rock 11 red/brwn x75 11 Strip Mines, Quarries, Gravel Pits 54 med brown x76 11 Transitional Areas 45 drk ornage x77 11 Mixed Barren Land 47 rose red x
8 8 13 Tundra 31 pale magenta x81 13 Shrub and Brush Tundra 51 blue grey x82 13 Wet Tundra 20 light blue purple x82 13 Herbaceous Tundra 32 light magenta x83 13 Bare Ground 58 blue purple x85 13 Mixed Tundra 22 dark blue x
9 9 15 Perennial Snow and Ice 19 pale purple x91 15 Perennial Snowfields 3 lite gray x92 15 Glaciers 2 white x
Land Use Codes and Colors


Hydrologic Cycle
Aquifer
Surface
Ocean
LakeStream
Interflow
Groundwater Flow
Tra
nspi
rat i o
n
Infil
trat
ion
Per
cola
tion
Eva
pora
tion
Pre
cipi
tatio
n
Bed Rock
Root Zone
Sub Soils

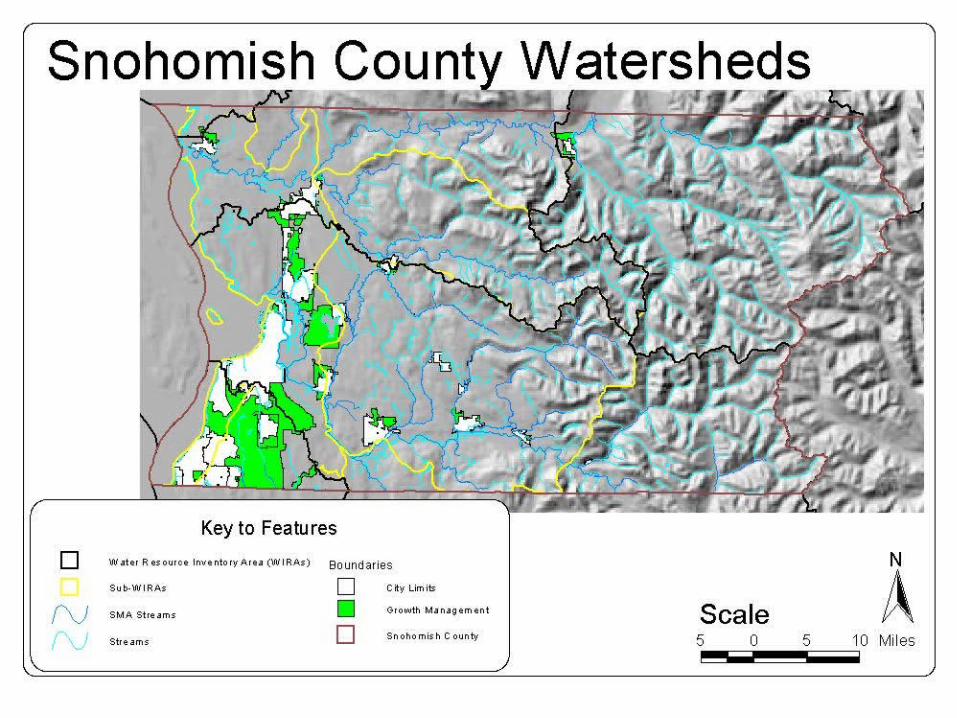
Shoreline Management Act
• Applies to:– All marine waters– Streams with a mean annual flow greater than 20 cubic
feet per second– Lakes 20 acres or larger– Upland areas called “shorelands” 200 feet landward
from the edge of these waters– Following when associate with above
• Biological wetlands and river deltas• 100-year floodplain


Dis
solv
eM
erg
e
Input Overlay Output
Cli
pIn
ters
ect
Un
ion
Dissolve combines features that have the same value for a specified feature. The output layer contains simplified features of different values.
Merge combines common features of two or more themes into a single theme. Feature data will be retained if they have the same name.
Clip uses an overlay layer like a cookie cutter on the input theme. The input theme’s data features are not altered in the clipped layer.
Intersect cuts an input layer with the features from an overlay layer to produce an output layer with combined areas that have feature data from both themes.
Union combines features of an input layer with the features froman overlay layer to produce an output layer that contains the feature data andfull extent of both input and overlay layers.
Redrawn from Help: ArcView 3.2, ESRI, 1999 LMG 2000
GIS
Ope
ratio
ns

Der
ivat
ion
of
Sp
ecie
s L
ayer
s
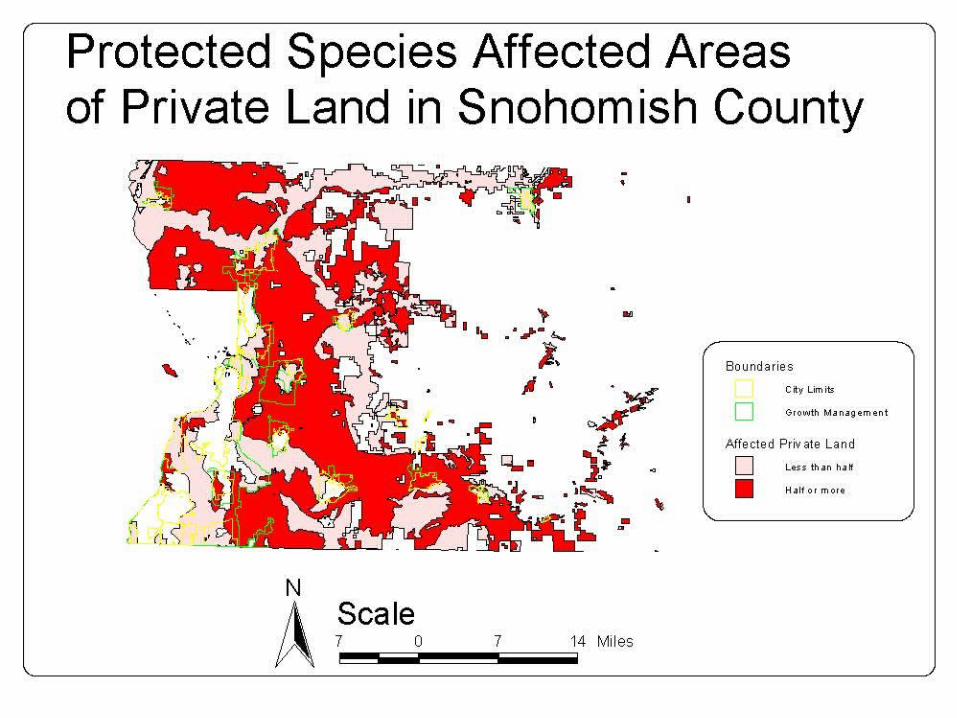
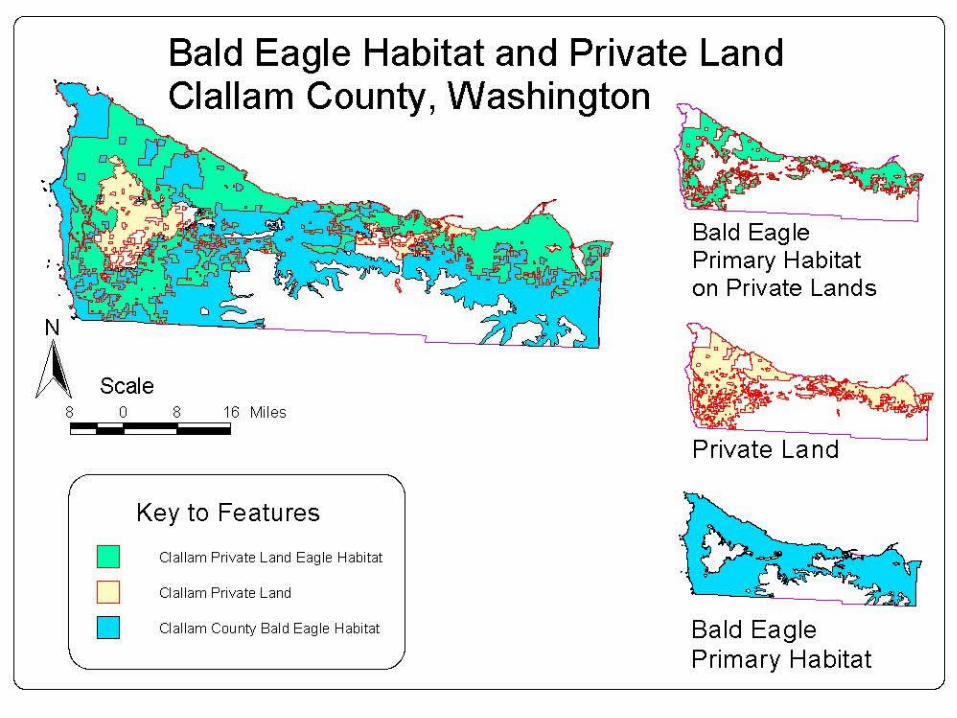
Richness maps were then processed into two classes: Less than or equal to ½ or greater than ½ of the total number of species occurring on private land used to create the map. This map is then clipped with the shape of private land to produce a map of affected and unaffected areas
END
Multiple individual species combined by repeated intersection by species then unioned by number to produce species group maps
State Gap Habitat Map
County
Cutting Shape
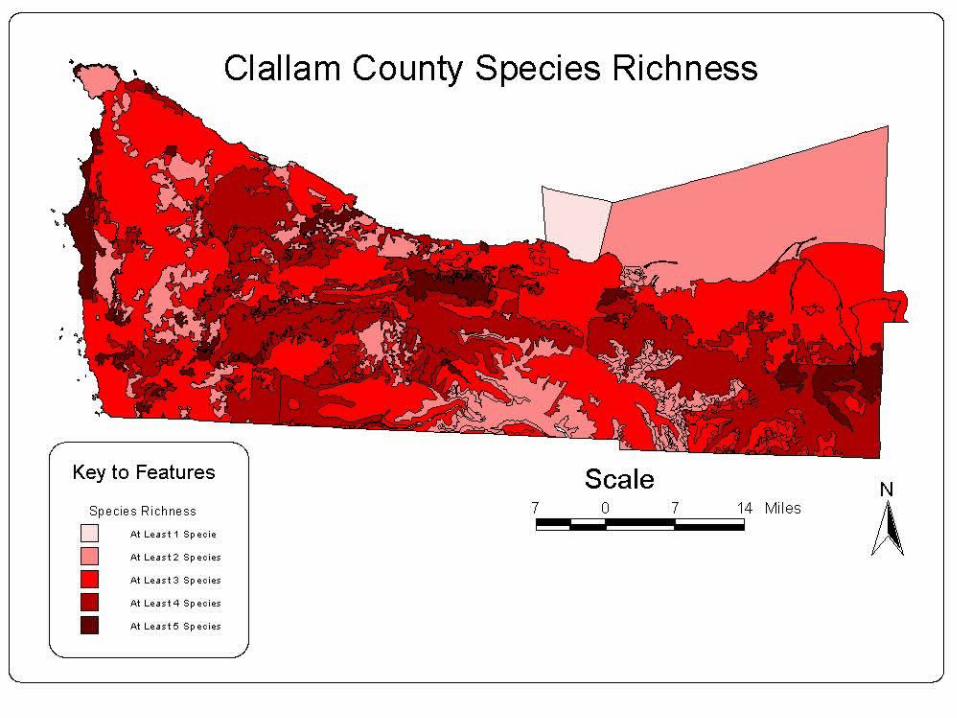
Species Group maps were unioned by number of species to produce county wide Species Richness maps
Making a clipped county habitat map for each species was the first step
1
Composed from images seen elsewhere. LMG, 2002

In this simple example, two layers like individual species layers are overlaid. The solid red layer is the result on the intersection of them. That is it is all the places that the two layers have in common or for our use where there are two species. This process was repeated for each pair to make the two species layers, each triplet for the threes and so on.
The white areas of the next layer represent the areas where there is at least one species. The different outline colors are left to make the areas recognizable. These areas are then summed by merging to make the lighter red area.
The two layers representing one and two species are then summed to include all of the information in both layers by unioning them. The result is a layer showing all the areas with one or two species habitat. Using the presence of the appropriate habitat as a proxy for the presence of the species.
Input layers: species habitat
Graphic overlay of Input Layers
Merge of single species = one species habitat areas.
Intersection of the two specie habitat layers = two species habitat areas
Final Union of one and two species habitat layers.
Der
ivat
ion
of
Sp
ecie
s L
ayer
s 2
LMG, 2002


Birds Short List12345
10 0 10 20 Miles
N
Reptiles/ Amphibians1234
Mammals12345
Scale
Salmonids Mammals
Reptiles and Amphibians Birds
Clallam County
Salmonids123