+ All Categories
Home > Documents > T2REPtRI -T - apps.dtic.mil fileMurphy and Dr. Lynn Miner for encouragement and support. ......

T2REPtRI -T - apps.dtic.mil fileMurphy and Dr. Lynn Miner for encouragement and support. ......

Date post: 14-Mar-2019
Category:
Upload: lamduong
View: 214 times
Download: 0 times
Share this document with a friend
50
1 Of.- Abpaved REPORT DOCUMENTATION PAGE WAsIwo. 07040198 I I w e" isa *NC U 1 mmnW~ Wf,40MttMA ftwffibti I0 fto of romof wr ' pw tfo norwtoof wwo"~ *spot" "to ~ form I mwv9 thenbwl4Sn t0 *UrafpUr f M" jigwflgf Sieocm Dwcilw e fr ti u rati mm 0owwgvnwo ii5 "I 1AGENCY 15M ONLY f"VO 01141,) T2REPtRI OAT[ 3 EPORT TYPE A14D DATES COVERED Fb81 -T Final (Jun 80-Feb 81 MAGNTUDEDYNA!MIC LOADS Gerald A. Woelfi .PROMNGOGNZlO Ln PERpRN OANIAION XAME(S) AND ADMOSSES) PRF004WG NUURGXZ" Marquette UniversityREOTNMR Department of Civil Engineering N 1515 West W isconsin Ave, Milwaukee, WI 53233 i M Tot - 9- 15S25 SPONSORMG/MONITORING AGENCY NAME(S) AND A20I4E4s, Ia. SPONSORING I MONITORI AFOSR AGENCY IIPI~ NUIMBER BLG410 BAFB DC 20332-6448 AFOSR-80-0 193 11. SUPPLUMENTARY NOTES 12s. 011STRUVUTION/IAVAILASIL4l STATEMENT 12b. DISTRIBUTION COE Dw'rUbU IONTATEM.YENT A A--- rove-d for public release; Diz~triLuitof Unlirmited 13. ABSTRACT 'Asamim 200 of V 14. SUBJECT TERMS IS. NUMBER OF PAGES 49 I L PRICE CODE 17' SECURITY CLASSIFICATION 16I. SECURITY CLASSIFICATION 12g. SECURITY CLASSIFICATION 20. LIMITATION OF ABSTR.ACT OF REPORT I OF THIS PAGE I OF ABSTRACT unclassi fied unclassified I _________I___ NSN StndardFortm 298 (890 704 Dratt) .4 7
Transcript

1 Of.- Abpaved

REPORT DOCUMENTATION PAGE WAsIwo. 07040198

I I w e" isa *NC U 1 mmnW~ Wf,40MttMA ftwffibti I0 fto of romof wr ' pw tfo norwtoof wwo"~ *spot" "to ~form I mwv9 thenbwl4Sn t0 *UrafpUr f M" jigwflgf Sieocm Dwcilw e fr ti u rati mm 0owwgvnwo ii5 "I

1AGENCY 15M ONLY f"VO 01141,) T2REPtRI OAT[ 3 EPORT TYPE A14D DATES COVEREDFb81 -T Final (Jun 80-Feb 81

MAGNTUDEDYNA!MIC LOADS

Gerald A. Woelfi .PROMNGOGNZlO

Ln PERpRN OANIAION XAME(S) AND ADMOSSES) PRF004WG NUURGXZ"Marquette UniversityREOTNMRDepartment of Civil EngineeringN 1515 West W isconsin Ave, Milwaukee, WI 53233 i M Tot - 9- 15S25SPONSORMG/MONITORING AGENCY NAME(S) AND A20I4E4s, Ia. SPONSORING I MONITORI

AFOSR AGENCY IIPI~ NUIMBERBLG410

BAFB DC 20332-6448 AFOSR-80-0 193

11. SUPPLUMENTARY NOTES

12s. 011STRUVUTION/IAVAILASIL4l STATEMENT 12b. DISTRIBUTION COE

Dw'rUbU IONTATEM.YENT A

A--- rove-d for public release;Diz~triLuitof Unlirmited

13. ABSTRACT 'Asamim 200 of V

14. SUBJECT TERMS IS. NUMBER OF PAGES

49I L PRICE CODE

17' SECURITY CLASSIFICATION 16I. SECURITY CLASSIFICATION 12g. SECURITY CLASSIFICATION 20. LIMITATION OF ABSTR.ACTOF REPORT I OF THIS PAGE I OF ABSTRACT

unclassi fied unclassified I _________I___

NSN StndardFortm 298 (890 704 Dratt)

.4 7

ANALYSIS OF RAPI1D RIJN AY REPAITCBS ;U3JLX7PD '1R) L.Ai'E MAC-N LTUULDYNAMIC LOADS

GeraldI A. WoltlaWIX1rtmnt of Civil EnlineerinclMarque-tte University1515 West Wisconsin AvenueMilwaukee, Wisconsin 53233

February 1981

Final Report for Period June 1980 -Fcbruary 1981

A 2 r~ IgniLL..-l.JLW

Aeoesston For

N TIS CIJRA& IDTIC TAB3

Just ifttitlonLPrepared for_________

AIR RDWE FFE OF SCTEI{PIFTC PESFARCH IDtriuttoti/Buldinq 410, [lolling AMFB, D.C. 20332 1-

ILvPall M If tVGCodes

ws ~t 1~T~/

P I EFA C L

This research effort was sponsored by the Air Force Office of

Scientific Research and is a continuation of research perfurmed in

1979 under the summer faculty research program. This effort was

begun in June 1980 and completed in January 1981.

The author would like to thank the Air Force Systems Command

and the Air Force Office of Scientific Research for providing him

with the opportunity to participate in a most worthwhile program.

Special acknowledgement is due to those at Air Force Engi-

neering and Services Center at Tyndall Air Force Base, Florida,

for their cooperation and assistance, and for providing a pleasant

working environment. The author is especially indebted to Lt.

Col. Robert Boyer, Lt. Col. Roger Caldwell, Major Michael Carter,

Robert Van Orman, Phillip Nash, and Capt. Michael "IcNerney for

their continuous encouragement and guidance.

Finally, the author would like to express appreciation to

Marquette University, and in particular to Professor William

Murphy and Dr. Lynn Miner for encouragement and support. Also

special acknowledgement is due to Kathleen Hawkins for her

assistance in preparing this manuscript.

ii

TABLE OF CONTEN'T'S

SECTION TITLE PAGE

I. INTRODUCTION . . . . . . . . . . . . . . . 1

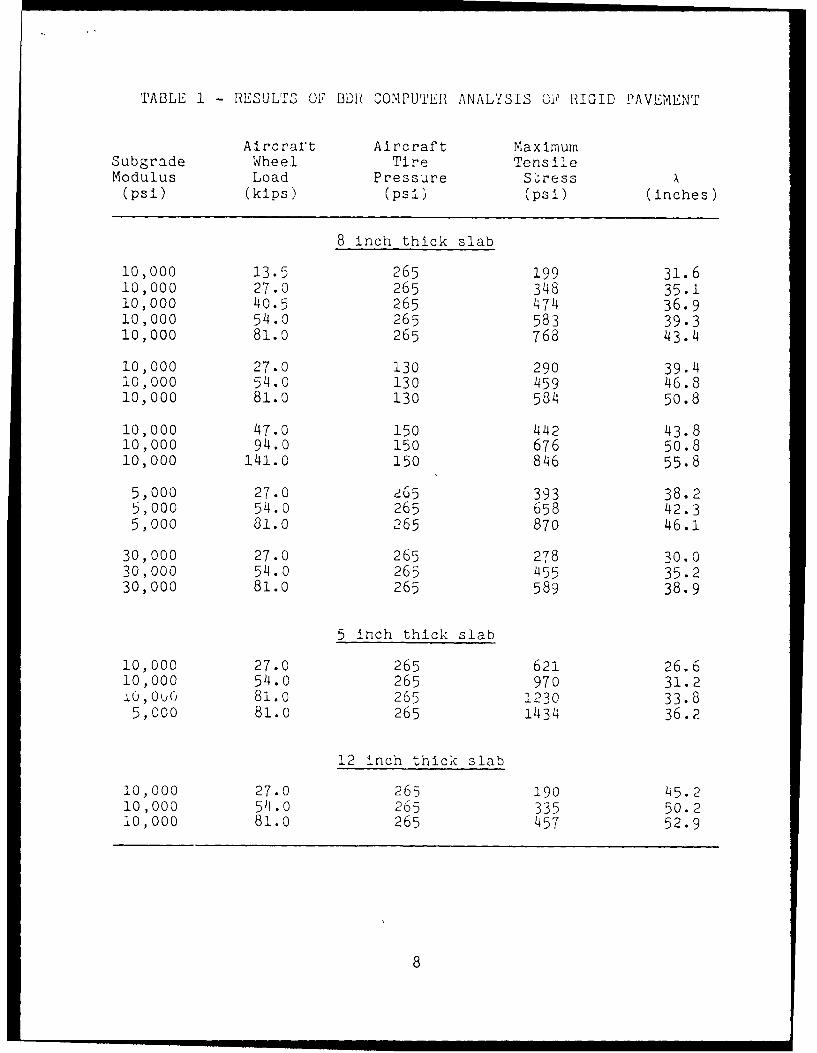
II. RELATIONSHIP OF LOAD DURATION WITHAIRCRAFT AND PAVEMENT PARAMETERS .. ..... 3

III. DYNAMIC 14ODULUS AND FATIGUE TESTINGCF POLYMER CONCRETE .... ........... .12

IV. ANALYSIS OF RIGID AND GRANULAR RAPIDRUNWAY REPAIRS ..... .............. 28

V. CONCLUSIONS ...... ................ 38

VI. RECOMMENDATIONS ..... .............. .41

REFERENCES ....... .............. 43

iii

LIST OF FIGURES

FIGURE TITLE PAGE

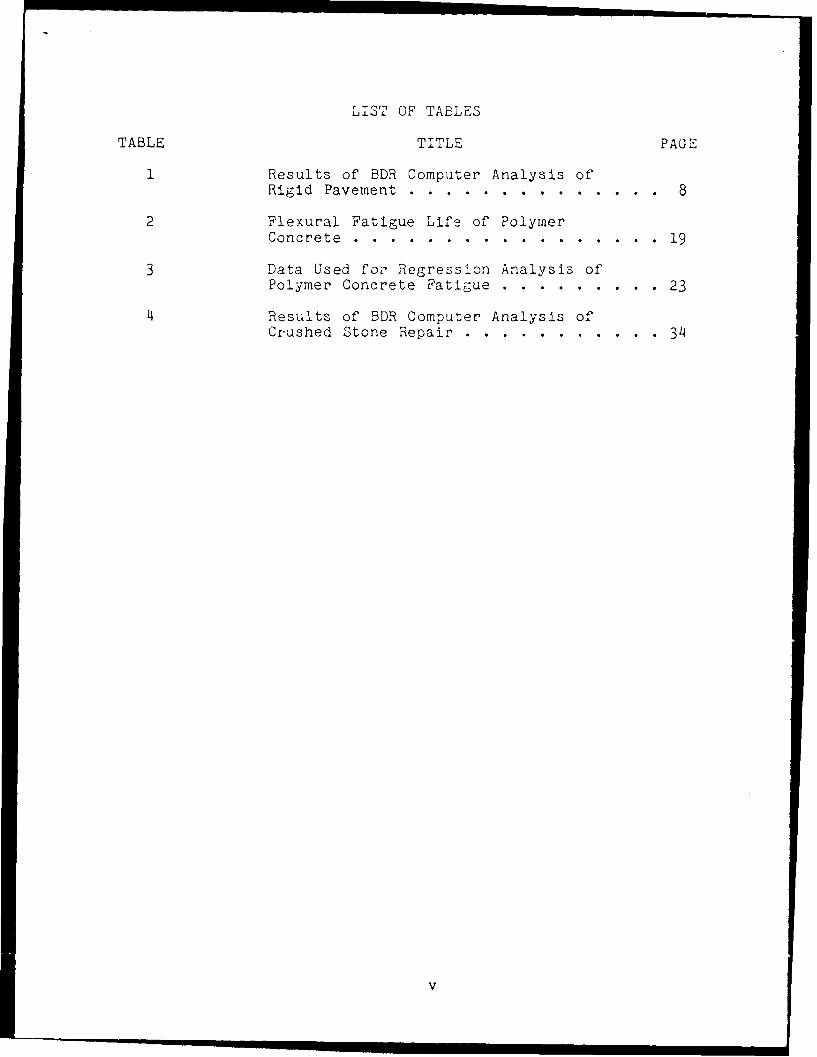
1 Tensile Stress Distribution forBottom of Rigid Slab ..... ........... 5

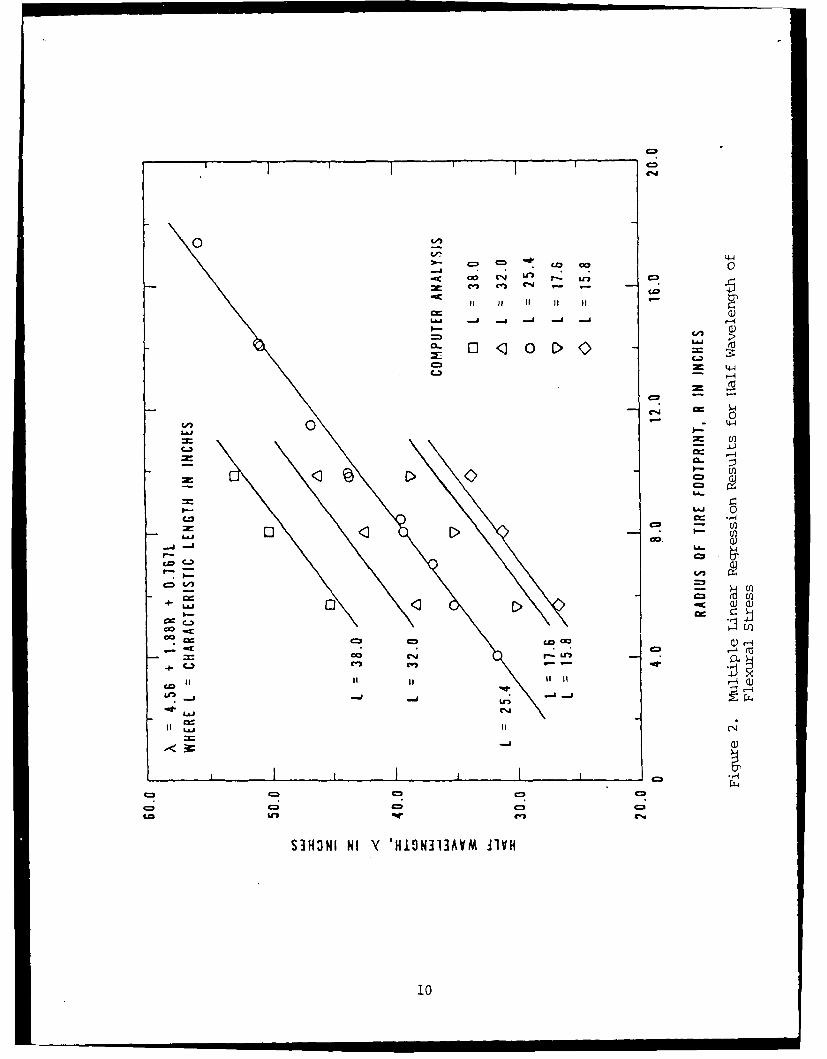
2 Multiple Linear Regression Resultsfor Half Wavelength of Flexural Stress . • 10

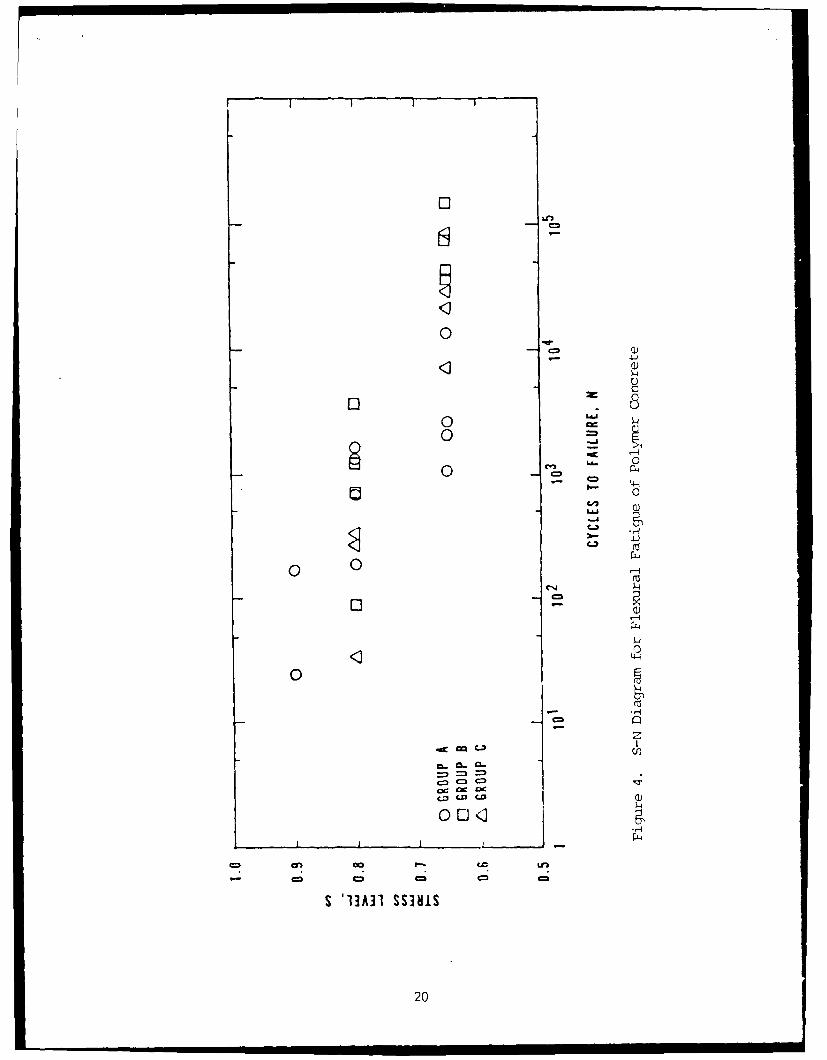
3 Loading Waveforms Used for PolymerConcrete Fatigue Testing ... ......... 18

S-N Diagram for Flexural Fatigue ofPolymer Concrete .... ............. ... 20

5 Comparison of Observed and CalculatedValues for Fatigue of Polymer Concrete . 25

6 Maximum Rigid Slab Flexural StressVersus Dynamic Load Ratio ........... ... 29

7 Crushed Stone Repair Deformation VersusDynamic Load Ratio .... ............ .35

iv

LIST OF TABLES

TABLE TITLE PAGE

1 Results of BDR Computer Analysis ofRigid Pavement ..... ................ 8

2 Flexural Fatigue Life of PolymerConcrete ....... ................. 19

3 Data Used for Regression Analysis ofPolymer Concrete Fatigue ... ......... .23

Results of BDR Computer Analysis ofCrushed Stone Repair ..... ........... 34

V

SECTION T

INTRODUCTION

Traditional design and analysis of airport pavements are

based on static wheel loads. But measurements of landing gear

forces during various aircraft modes of operation have shown that

pavements are subjected to dynamic loads of higher magnitude than

the static load. However, because of the relatively slow response

of pavement materials, these higher magnitude dynamic loads are

neglected in pavement dcsign. Fiela observations reinforce the

use of static load for pavement design since areas of airfield

pavements subjected to static and low speed modes of aircraft

operation generally show more distress than areas of runways

limited to medium and high speed aircraft operations.

Field test results from rapidly repaired bomb damaged

runways, however, indicate unusually high magnitude dynamic loads

due to increased surface roughness of the repaired runway. Pre-

liminary data from the first phase of the Air Force's "Have

Bounce" testing program have shown that dynamic main gear loads

can be as high as 2.5 times the corresponding static aircraft

loads (Reference 1).

Current research efforts in the Air Force Bomb Damage Repair

Program concentrate on the effects of these high magnitude dynamic

loads on the aircraft structure, aircraft payload, and pilot

performance. But pavement response to these high magnitude

dynamic loads must also be investigated. Specifically, a non-

traditional dynamic analysis of pavement is needed in order to

l1

evaluate the structural adequacy of rapid runway repairs. Such an

analysis was initiated by the author while participating in the

Air Force's Summer Faculty Research Program at the Engineering and

Service Center, Tyndall Air Force Base, Florida. The results of

this initial research effor. are reported in the final report

entitled "Response of Airfield Pavement to Large Magnitude Dynamic

Loads" (Reference 2).

The purpose of this investigation is to continue the research

initiated on the dynamic analysis of rapid runway repairs sub-

jected to large magniLude loads. This research effort includes

continuing a search of the literature, analytical work utilizing

the computer, and experimental work. Specifically, this report

addresses:

1. Developing a relationship for duration of load with air-

craft and pavement parameters. Such a relationship is

needed for dynamic testing of airfield pavement material

properties.

2. Experimental testing of the dynamic behavior of polymer

concrete. Since a search of the literature revealed that

the dynamic behavior of polymer concrete had not been

investigated, this research effort required experimental

work.

3. Analysis of rigid and granular rapid runway repairs. The

response of polymer concrete, sulfur concrete, and

crushed stone repairs subjected to high magnitude dynamic

loads Is needed to design and analyze field tests using

load carts and aircraft.

2

SECTION II

RELATIONSHIP OF LOAD DURATION WITH1 AIRCRAFT

AND PAVEMENT PARAMETERS

Material properties needed for dynamic airfield pavement

analysis depend on the duration of loading. It has een shown

that duration of loading for a moving wheel load, T, can be deter-

mined from aircraft velocity and the half-wavelength of stress

diitribution obtained from a static stress analysis (Reference 2).

The relationship is:

2AT = (1)

where:

T = duration of load, in secondsX = half the wavelength of static stress distribution, in

inchesV = aircraft velocity, in inches per second

Results from previous work showed considerable variation of A for

various aircraft and pavement systems (Reference 2).

The purpose of this section is to formulate a relationship

for X which includes aircraft and pavement parameters so that

duration of loading, which is needed to determine dynamic material

properties, can be computed for different aircraft and pavement

systems.

1. X DEFINED

Figure 1 shows a typical stress distribution for tensile

stresses for the bottom of a rigid pavement slab as determined

from a static stress analysis. For a moving wheel load, the

3

static stress distribution can be visualized as moving throug~l the

paveme system with time. The vertical axis in Figure 1 is

stress, the horizontal axis represents distance for a static

analysis, or time for a dynamic analysis (Equauion (1) relates

distance and time).

A cosine curve is used to represent this stress distribution

for dynamic testing of materials. Figure 1 shows two cosine

curves superimposed on the pavement stress distribution. The

cosine curve having the same half-wavelength, V. as the slab

stress distribution is not a good representation of pavement

stresses. The second cosine curve, by definition, intersects the

pavement stress distribution at one-half the maximum stress and

better represents the higher magnitude stress. An accurate

simulation of the higher stress magnitudes is most important when

testing dynamic material properties such as resilient modulus and

fatigue life. For example, in testing the modulus of rupture of

portland cement concrete, AS T4 allows using any loading rate for

loading up to 50% of the failure load. However, the modulus of

rupture is sensitive to tne rate of loading used from one-half the

failure load to failure.

Decker (Reference 3) has summarized fatigue testing of

asphalt concrete using square, cosine, and triangular loading

waveforms. Specimens subjected to the square-waveform loading had

less than one-half the fatigue life of identical specimens loaded

with the cosine-waveform; the use of the triangular-waveform

4I

zMOM

0

<U) crCL D Z

Q) Q

U) z20 w

>H 0

1/ - 0

U)

-4

SS3U S 3-1SNC

loading resulted in a 45 percent increase in fatigue life as

compared to the cosine loading. Frequency and maximum stress

amplitude were held constant for the test. The square-waveform

loading has the fastest rate of loading, but the maximu-m stress is

applied for the ,itire load cycle, whereas it is only applied for

an instant for the triangular loading. The duration of the higher

magnitude portion of the load apparent±y cominates the behavior.

To determine X using the cosine curve yielding a better fit,

the static stress distribution as a function of x used is

7TX

ax = ocos - (2)

whrre a. is the mn.ximum stress at x = 0.

From Figure 1, x' is defined as the horizontal distance from

the center of the wheel load where the stress, ao, is a maximum to

the point *here the stress is one-half the maximum. Therefore,

substituting ax = ao/ 2 and x = x' into Equation (2) and solving

for N0 7 X'

- = o cos (4)2

from which

= 3x' (5)

From the results of static stress pavement analysis, x' can be

computed and X solved for.

2. RELATIONSHIP OF A WITH PIRCRAFT AND PAVEMENT PARAMETERS

The BDR computer code developed by the Air Force was used for

static pavement analysis to determine x', and thus X, for various

6

aircraft and pavement systems. The BDR computer code is the most

recent and sophisticated pavement analysis computer program

developed by the Air Force. Twenty-four aircraft-pavement systems

were analyzed using several slab thicknesses, subgrade moduli,

aircraft tire pressures, and gross weights. The pavement and air-

craft variaoles used for the analysis are listed in Table 1 along

with the maximum tensile slab stresses and the half-wavelengths,

X, as previously defined.

Multiple regression analysis was used to relate the half-

wavelength corresponding to the horizontal stress at the bottom of

a slab, 's, with aircraft and pavement parameters. After prelimi-

nary analysis us'nS several aircraft parameters, it was found that

the radius of tire footprint, R, correlated best with As for a

given oavement. The radius of tire footprint incorporates air-

craft weight and tire pressure and is defined as

R : (6)7Tp

where:

R radius of tire footprint, in inches= weIght on aircraft tire, in pounds

p = tire pressure, in psi

The characteristic length, L, was used to incorporate the

parameters of pavement slab and subgrade. The characteristic

length is defined as (Reference 4)

7

TABLE . - RESULTS Or, 1D1i COMPUTER1 ANALYSIS 01' RIGID PAVEMENT

Aircrat't Aircraft MaximumSubgrade Wheel Tire TensileModulus Load Pressure S ress(psi) (kips) (psi) (psi) (inches)

8 inch thick slab

10,000 13.5 265 199 31.610,000 27.0 265 348 35.110,000 40.5 265 474 36.910,000 54.0 265 583 39.310,000 81.0 265 768 43.4

10,000 27.0 130 290 39.410,000 54.0 130 459 46.810,000 81.0 130 584 50.8

10,000 47.0 150 442 43.810,000 94.0 150 676 50.810,000 141.0 150 846 55.8

5,000 27.0 1 393 38.25,000 54.0 265 658 42.35,000 81.0 265 870 46.1

30,000 27.0 265 278 30.030,000 54.0 265 455 35.230,000 81.0 265 589 38.9

5 inch thick slab

10,000 27.0 265 621 26.610,000 54.0 265 970 31.2.0, Ooo 81.0 265 1230 33.85,000 81.0 265 1434 36.2

12 inch thick slab

10,000 27.0 265 190 45.210,000 5" .0 265 335 50.2i0,000 81.0 265 457 52.9

8

Esh3

L (7)12k(1-v s)

whe re:L = characteristic length, in inchesE = modulus of slab material, in psi.s

h = thickness of the slab, in inchesi= Poisson's ratio of the slab material

After several multiple regression analyses, both linear and non-

linear, the result yielding the highest correlation coefficient

was

s= 4.56 + 1.88R + 0.767L (8)

where, As, R, and L, are all expressed in inches. The correla-

tion coefficient squared was computed as 0.974 and the standard

error of estimate was 1.30 inches. Equation (8) is shown

graphically in Figure 2 along with the data from the computer

analysis. A correlation coefficient squared of 0.974 indicates

Equation (8) represents an excellent relationship between the

variables. Of course the data used for the regression analysis

was computer generated and therefore such a high correlation would

not be expected using data from actual field tests.

A similar multiple regression analysis was used to relatc the

half-wavelength for the vertical subgrade stress, Nsub, with R

and L. Several different multiple regression analyses, linear and

nonlinear, were performed. It was found that the influence of

radius of tire footprint, R, was insignificant and the equation

showing the highest correlation was

9

C2d

-J CD 0

~ (N W

CAP

0C,0 4-

I--

C.0

LAAJ

-LJ 00 LA- )0

- (

4 OC- Cc --

co1

It lii4

LAJ

S3H3NI NI 'HiSN313AVM 11WH

10

sub= 16.37 + 1.917L (9)

where sub and L are both in inches.

The correlation coefficient squared for Equation (9) i

0.935. However, an analysis using actual field data would

probably not yield as high a correlation.

In summary, for a given aircraft and pavement system, the

equations developed in this section can be used to determine the

load duration (and thus an estimate of rate of loading) for

dynamic modului testing, or loading frequency for fatigue testing.

Specifically, Equations (6) and (7) are used to calculate R and L

for a given aircraft and pavement. Substituting R and L into

Equation (8) for the pavement slab and Equation (9) for the

subgrade, X is computed. Using Equation (1), the duration of

load, T, can be computed for various aircraft speeds. The rate of

loading to be used for determining dynamic modului can be

approximated by assuming the load increases from zero to maximum

within one-half the load duration, T. (The rate of loading

actually varies, decreasing to zero at maximum stress as shown in

Figure 1.) The frequency of loading to be used for fatigue

testing is simply the inverse of the duration of load, T.

11

SECTIO14 III

DYNAMIC MODULUS AND FATIGUE TESTING OF POLYMER CONCRETE

The U.S. Air Force is investigating the use of polymer con-

crete for rapid repair of bomb damaged runways. A review of the

literature revealed that the dynamic behavior of polymer concrete

has not been investigated (References 5, 6, and 7). This section

reports the results of a laboratory investigation undertaken to

study the dynamic behavior of polymer concrete. In particular,

the influence of rate of loading on the modulus of rupture, and

the influence of loading frequency and rest periods on fatigue

life was studied. Other parameters, such as mix proportions,

specimen size, and temperature were held constant.

1. EXPERIMENTAL PROCEDURE

1.1 Materials Used

The polymer concrete used in this study was a special pre-

packaged Silikafa methyl methacrylate polymer concrete supplied by

the U.S. Air Force. Silikal® polymer concrete is a proprietary

prepackaged methyl methacrylate polymer concrete system manufac-

tured by SilikalQ North America and it's licensees. The pre-

packaged system consists of two components, one powder and one

liquid. The powder component consists of fine quartz sand,

powdered benzoyl peroxide initiator, pigment, powdered polymer for

workability, and other proprietary additives. The liquid compo-

12

nent consists of liquid methyl methacrylate monomer, a promoter,

and other proprietary additives. The powder component is mixed

directly with the liquid component in a polyethylene mixing bag in

premeasured quantities. This produces a concrete with mortar

consistency. In this study, dry coarse aggregate was added to the

mortar to extend the mortar to a consistency of normal concrete.

The special Silikal® polymer concrete used for this study is

similar to the colimercially available Silikal R7 with special

packaging to permit extended shelf-life. The Silikal® used was

packaged in 15 kg bags, and seven beam specimens were made from

each bag. All 7 bags used were from the same numbered lot and had

been stored and shipped togetner.

The course aggregate was locally purchased river run gravel.

The gravel was then washed, mechanically screened, and oven dried.

For each 15 kg bag of powder, 15 kg of coarse aggregate was recom-

bined in the following proportions: 5/8 inch to 1 inch, 6.25 kg;

5/16 inch to 5/8 inch, 5.0 kg; and 2 mm (#10 sieve) to 5/16 inch,

3.75 kg. Each batch of coarse aggregate was precisely weighed and

thoroughly mixed. No aggregate finer than a #10 sieve was added

because the prepackaged polymer concrete system contains all the

fine aggregate required in the powder component.

1.2 Specimen Preparation

The beam specimens were cast at Tyndall AFB in batches of

seven beams, and in general conformance to ASTM Making and Curing

13

Concrete Test Specimens in the Laboratory (C 192). A minor

departure to the concrete standard was introduced by placing and

rodding the polymer concrete in two lifts rather than three

because of the size of the 3" x 3" x 11" beams. A thermocouple

was inserted at one end of each beam to observe the time and

temperature of the peak exotherm in each specimen as part of an

anticipated quality control program. The intended purpose of this

control was the identification of abnormal temperature rises which

might serve as rejection criteria for atypical behavior, thereby

effecting a reduction in the coefficient of variation for the

flexural strength. At this time, however, such an analysis has

not been performed, and there is no information on the effect on

the coefficient of variation. To minimize the cure time or age

difference of the specimens, all the beams were cast within a two

day period at room temperature. At least 90 days elapsed between

casting the specimens and testing. The specimens were tested at

Marquette University.

1.3 Testing

The experimental program included testing for the modulus of

rupture and fatigue behavior of polymer concrete beam specimens.

An MTS testing machine with a 20 kip load cell was used for all

testing. The MTS testing machine was fitted with supports for

third-point loading. The supports conformed to ASTM Standard Test

Methods for Flexural Strength of Concrete (Using Simple Beam with

14

Third-Point Loading) (C 78-75). Specimens were chosen for the

various tests in a random manner. All tests were conducted at

room temperature.

Modulus of Rupture Testing - The modulus of rupture testing

was divided into static and dynamic loading. For the static load

test, specimens were loaded in accordance with ASTM CT8-75.

Specifically, four specimens were loaded rapidly to 3 kips (less

than 50 percent of the failure load), then loaded at a rate of

-150 psi/min to failure. The maximum loads recorded from a digital

voltmeter were 7.65, 6.27, 7.37, and '.27 kips. The low reading

of 6.27 kips was discarded and the mean of the remaining three

values was calculated to be 7.4 3 kips. This value was used as the

load corresponding to the modulus of rupture of the polymer con-

crete for calculating stress levels for the fatigue testing.

To determine if the rate of loading influenced the modulus of

rupture of polymer concrete, four 6pecimens were loaded at a rate

of luading of 199,980 psi/min which was about the same rate of

loading corresponding to fatigue loading at 0.5 c/s. Maximum

loads determined to two significant figures from an osciloscope

were 8.8, 8.3, 7.4 and 8.4 kips.

Fatigue Testing - For fatigue loading, all of the specimens

were loaded with a haver-sine loading where the load varied

between a maximum and minimum. The maximum load applied was a

ratio of the modulus of rupture load of 7.43 kips determined from

the static testing. The ratio is termed the stress level, S

15

(the ratio of flexural stresses is the same as the ratio of loads

for a given specimen size and loading configuration). A minimum

load of about 200 lbs was used to prevent stress reversals and to

hold the specimens in place.

To determine the effect of certain parameters on the fatigue

behavior of polymer concrete, specimens were divided into three

groups: A, B, and C. Specimens from group A were loaded at a

frequency of 0.5 c/s. Initially a stress level of 0.9 was used

(maximum load at 90 percent of 7 ,43, or 6.69 kips), but after

testing two specimens, it was decided to use lower stress levels.

Four specimens were tested at a stress level of 0.8 and another

four were tested at a stress level of 0.65.

Specimens of group B were used to determine if frequency of

loading effects the fatigue life of polymer concrete. Specimens

of group B were loaded at a frequency of 10 c/s, four specimens at

a stress level of 0.8 and another four at a stress level of 0.65.

For most uses, polymer concrete would not be subjected to the

type of continuous cyclic loading used in standard fatigue

testing. In particular, for pavements, especially airport pave-

ments, there would be a rest period between load pulses. For this

reason, group C was used to determine if the inclusion of a rest

period between each load pulse influenced fatigue life of polymer

concrete. The loading uscd for group C had a load pulse duration

of 0.1 sec., which was the same load pulse duration used for

specimens of group B, which were loaded at a frequency of 10 c/s.

16

For group C, however, each load cycle included a rest duration of

0.9 sec during which the specimen was subjected only to the

minimum load. The 0.1 sec load pulse followed by the 0.9 sec rest

period gave a frequency of loading of 1 c/s. For group C, three

specimens were tested at a stress level of 0.80 and four specimens

at a stress level of 0.65.

The loading waveforms used for testing groups A, B, and C are

shown in Figure 3. Results of the fatigue testing are listed in

Table 2 and plotted in Figure 4.

2. ANALYSIS OF RESULTS

2.1 Modulus of Rupture Testing

Comparing results of the static and dynamic modulus of rup-

ture testing, it was apparent that the rate of loading influenced

the modulus of rupture of polymer concrete. Discarding the one

low reading from the results of the dynamic test, the mean of the

remaining three values was 15 percent higher than the results of

the static modulus of rupture testing.

Rate of loading had a similar effect on the modulus of rup-

ture of Portland Cement Concrete (PCC). McHenry (Reference 8)

reported that as rate of loading increased from 1034 to 3477

kPa/min, the modulus of rupture of PCC increased by about 2 to 13

percent, depending on mix parameters, age at testin6, etc.

17

GROUP A -0.5 C/S

TIME

GROUP B - 10 c/s

TIME

GROUP C - 1 c/s

TIME

Figure 3. Loading Waveforrrs Used for Polynmr Concrete Fatigue Testing

TABLTE 2 -FLEXURAL FATIGUE LIFE OF POLYMER CONCRETE

Number of Cycles to f'ailure, N, for a givenstress level, S.

Group S = .90 S =.80 S=.65

A 2~4 192 1,o67172 689 2,039

1,310 2, 5851,678 13,784

B 90 36,310690 43,010

1,290 ) 72,6903 , tl0 147,720

C 3,J ,016278 21,417328 29,149

85,381

i9

0

4-0

m - 0IJ

0= C)

U

C-

00

00

-4

C2:

C..

ca CD

-I

S '13A31l SS ~IlS

20

,. i I I I I I I I I I II I

An increase of only 15 percent for the modulus o' rupture of

polymer corcrete for a rate of Loading Lzcreuse from 1034 to

1,380,000 ,Pa/ win Ian increase of over o:e thousand times) appears

small compared to a 2 to 13 percent increase for the modulus of

rupture of PCC for a rate of loading increase from 1034 to 3447

kFA/min (an increase of only about 3.3 tiiies). The increase of

modulus of rupture for , however, is linearly related to the

logarithn of rate of loading. If the same is true for polymer

concrete, a 15 percent increase in modulus of rupture for a rate

of loading of 1,380,000 kPA/min would correspond to a 2.5 percent

.increase for a 3477 kPa//min rate of loading. This increase would

be within the range of increases for PCC.

2.2 Fat igue Testin,:

The S-N plot of the fatigue test results are shown in Figure

4. The scatter of data is typical for fatigue testing. Because

of the variability of fatigue test results, it has become

customary to describe fatigue behavior in terms of probability of

failure. The data is analyzed by ranking the specimens in the

order of cycles to failure for each stress ratio, and calculating

the probabilities to failuc'e, P, by dividing the ranK of each

specimen, m, by (n + 1), where n equals the total number of

specimens tested at the particular stress ratio.

Graphical and mathematical techniques for obtaining the S-N-P

relationship have been described by McCall (Reference 9). For a

mathematical S-N-P relationship, an equation of the form

21

L = 0-aSb(log N)c (10)

has been successfully used to describe the fatigue behavior of PCC

(Reference 10). In Equation (10), S is the stress level pre-

viously defined, N is the number of loading cycles, and a, b, and

c are experimental constants. Instead of using P, the probability

of failure, the equation uses L, the probability of survival,

which equals unity minus the probability of failure (i.e., L = 1 -

P). The reason for changing from P to L is because this

simplifies the form of Equation (10).

Equation (10) is linearized by taking logarithms of the

logarithms of both sides of the equation and then rearranged to

predict the cycles to failure for a given stress level and a

certain probability of survival. The result is expressed as

Z = A + BX + CY (11)

where Z = log log N, X = log S, and Y = log (- log L). The

experimental constants of Equation (10) are related to the con-

stants of Equation (11) by a = 1 0- A/C, b = -B/C, and c = 1/C.

A multiple linear regression analysis was performed to deter-

mine the constants in Equation (11). Since there were only four

or less data points for a given loading waveform at a given stress

level, it was decided to combine the data of all the loading wave-

forms for a given stress level. The values of N, S, and L used

for the regression analysis arc listed in Table 3. The two data

points for the stress level of 0.90 were deleted from the analysis

since only two values may not be representative of the fatigue

life at a particular stress level.

22

TA3LE 3 - DATA USED FOH EGWGSON ANALYS.S OFPOLYMER CONCRETE FATIGUE

Number of cycles to failure, N, and probability ofsurvival, L*, for a stress level, S

S .80 S = .65

rank, in N L N L

1 34 .92 1,067 .92

2 90 .83 2,039 .85

3 192 .75 2,585 .77

4 278 .67 7,016 .69

5 328 .58 13,784 .62

6 689 .50 21,417 .54

7 690 .42 29,149 .46

8 1290 .33 36,310 .38

9 1310 .25 43,010 .31

10 1678 .17 72,690 .23

11 3610 .08 85,381 .15

12 - - 147,720 .08

m*L 1 - -I

n+l

23

The results of the regression analysis in the form of

Equation (11) i

Z 0.317 - 2.27X + 0.206Y (12)

This equation is compared with the test data in Figure 5. The

multiple correlation coefficient was calculated to be 0.989

indicating the equation is a good representation of the test

data.

The results of the regression analysis were used to calcu-

late the constants of Equation (10) and yields

L = 10- 0289S11.0 (log N)4.

8 6

Since the data for the different waveforms was combined for the

regression analysis, the probabilities calculated by Equation (13)

include the var'ability of loading waveforms used for testing.

This is a useful relationship, however, because polymer concrete

used for rapid runway repairs would be subjected to a variety of

loading waveforms since aircraft would be traveling at different

speeds and spacings. Thus, frequency and rest periods would vary

considerably.

Equation (13) is valid only within the range of parameters

tested and should not be used to predict results for stress levels

above 0.80 nor below 0.65. Likewise, the equation is only valid

for the range of frequencies and rest periods, as well as specimen

size and temperatures, used for this testing program.

Influence of Loading Frequency - Kesler (Reference 11) found

that the frequency used for fatigue testing of PCC had negligible

effect on fatigue strength for frequencies between 70 and 440 cpm

(1.17 to 7.33 c/s). The same cannot be said for polymer concrete

24

III I I I I I i t

0 Z = 0.317 2.27X + 0.206Y0.7 - 0 WHERE X =LOG S

0

00

0.6 -

S = 0.650

0

2C0.5 00-J

00

0.40

0

S =0.80

0.3 0

o TEST0.2 - THEORY

0

-0.2 *0.6 *1.0 -1.4

Y =LOG [-LOG L)

Figure 5. Corparison of Cbserved andi Calculated Values for Fatigueof Polyrrr Concrete

25

The data plotted in Figure 4 shows a definite ulfference at a

stress level of 0.65 between specimens tested at a frequency of

0.5 c/s compared to those tested at 10 c/s. Although too little

data is available to determine if the difference is statistically

significant, it can be concluded that frequency of testing is

probably an important parameter. Therefore, in fatigue testing of

polymer concrete, the frequency of testing should be treated as a

variable when designing a testing program.

Influence of Rest Periods - Hilsdorf and Kesler (Reference

12) found that periodic rest periods increased the fatigue life of

PCC. In their testing program, after every 4500 load cycles, the

specimen was given a rest period of either 1, 5, 10, 20 or 27 min

duration. It was found that for stress levels below about 0.70,

fatigue life increased as the length of rest period increased up

to 5 min. Further increases in the length of rest periods did not

cause further increases of fatigue life.

Actual fatigue loading of airfield pavements includes a

period of rest within each loading cycle. For this reason, such a

waveform was used for group C specimens. In order Lz complete the

testing within a reasonable period of time, a rest period of 0.9

sec. with a load pulse of 0.1 sec. made up the loading cycle. The

data plotted in Figure 4 indicates a slight shift to a lower

fatigue life at a 0.65 stress level, with the introduction of the

rest period in the loading cycle. However, given the scatter of

data, the differences in fatigue life may simply be due to the

variability of the material rather than the introduction of the

26

rest period. Too little data is available to determine if the

difference is statistically significant. In any event, longer

rest periods are probably needed. But introducing a 5 min. rest

period within each loading cycle would require 347 days for

100,000 loading cycles. Such testing is not practical and

therefore the use of periodic rest periods, similar to Hilsdorf

and Kesler, would have to be used.

in summary, the modulus of rupture of polymer concrete

increases with rate of loading. The increase of modulus of

rupture of polymer concrete was found to be within the range of

increases for Portland Cement Concrete. Since a previous report

concluded that a rupture failure of Portland Cement Concrete

pavement caused by a single high magnitude load is unlikely at

medium and high aircraft speeds (Reference 2), the same can be

concluded for polymer concrete.

Equation (13) can be used to predict the probability of sur-

vival for stress levels and number of cycles to failure. However,

the equation is only valid within the ranges of stress levels,

loading frequencies, and rest periods, as well as the size of

specimens and temperature used in this study.

Further testing is needed to statistically determine the

influence of loading frequency and rest periods on the fatigue

life of polymer concrete.

27

SECTION IV

ANALYSIS OF RIGID AND GRANULAR RAPID RUNWAY REPAIRS

The Air Force is currently investigating several techniques

for rapid runway repairs. Because of the time constraints for

completing the repairs, new pavement systems and materials are

being considered.

It is the pupiose of this section to analyze polymer con-

crete, sulfur concrete, and crushed limestone rapid runway repairs

subjected to high magnitude dynamic loads.

1. POLYMER CONCRETE REPAIR

Based on the results of the fatigue testing discussed in

Section III, polymer concrete has a relatively poor fatigue life.

Specifically, the stress ratio decreases rapidly with increasing

number of loading cycles. An analysis of polymer concrete repairs

subjected to high magnitude dynamic loads must consider a fatigue

failure. The results of twenty-four computer analyses using the

BDR computer code are listed in Table 1 of Section II. The

maximum tensile stresses from some of the results of the computer

analysis are shown in Figure 6 along with dynamic load ratios for

an F-4 aircraft.

The dynamic load ratio is defined as the high magnitude

dynamic wheel load applied to the pavement due to aircraft

response to surface roughness, divided by the static aircraft

wheel load (static wheel load for the F-4 is 27 kips). Although

Figure 6 shows dynamic load ratios up to 3.0, the highest dynamic

28

U)U)

w00

oC~c

I-00

o 0

U) a< , 0 F

LL U)

w4: ~0 -

0D 2

00 (0

2: (1

Oo 0

0

0 0 0

OIIVU OIVOl1 OIV4VNAG

29

load ratio which needs to be considered would be less than 2.5

since higher values would cause failure of the aircraft.

The modulus of rupture of SilikalR polymer concrete computed

from the average failure load of 7.43 kips from Section III is

2,477 psi. All of the tensile stresses in Figure 6 are less than

one-half the modulus of rupture. If Equation (13) developed in

Section III is valid for lower stress levels, a stress level of

0.50 with a probability of survival of 0.90 gives over 200,000

loading cycles before failure. The highest tensile stress listed

in Table 1 is 1434 psi. This is the maximum stress computed from

the BDR comliter code and corresponds to a dynamic load ratio of

3.0, a slab thickness of 5 inches, and a resilient modulus for the

subgrade (bomb damage debris backfill) of 5,000 psi. The stress

level for the system would be .579 and for a 0.90 probability for

survival, the number of load cycles would be 6,300.

The effect of aircraft speed on the number of loading cycles

to failure depends on the effect of loading frequency on the

fatigue life of polymer concrete, and, in some cases, the effect

of loading frequency on the resilient modulus of the backfill and

subgrade soil. As discussed in Section III, further testing is

needed to statistically determine the influence of frequency of

loading on the fatigue life of polymer concrete. To determine the

resilient moduli of fine grained soils corresponding to different

aircraft speeds, the loading frequencies to be used must be

computed as outlined in Section II. The resilient moduli of

30

coarse grained soils is relatively independent of loading

frequency (Reference 2).

The fatigue life for any of the aircraft-pavement systems

analyzed is more than adequate for rapid runway repairs. Present

BDR criteria requires about 7,000 passes, which would be less than

1000 coverages or loading cycles, over any one point on the

pavement. In addition, because of variations in aircraft speed,

the application of high magnitude dynamic loads would vary longi-

tudinally along the pavement. Thus, the actual number of high

magnitude dynamic loads applied to any point on the pavement would

be further reduced. In summary, the repair would be designed for

considerably less than 1000 load cycles, probably fewer than 100,

for the anticipated high magnitude dynamic loads. However,

because of the high modulus of rupture of polymer concrete, other

failure criteria may limit the design.

2. SULFUR CONCRETE REPAIR

Sulfur melts at 239 F and when mixed with aggregate between

239°i and 320°F, a workable thermoplastic sulfur concrete results

which can be placed like normal concrete. Because of the rapid

gain in strength and the unusually high fatigue life of sulfur

concrete, the Air Force is investigating it's use for rapid runway

repairs.

Lee and Klaiber (Reference 13) investigated the modulus of

elasticity, modulus of rupture, and fatigue life of several sulfur

concrete mixes. The modulus of elasticity and modulus of rupture

31

of sulfur concrete are within the range of values of conventional

portland cement concrete. But sulfur concrete does have

drastically improved fatigue life, exhibiting an endurance limit

above a stress level of about 0.90.

The moduli of rupture of sulfur concrete reported by Lee and

Klaiber ranged between 435 to 590 psi. Since this is consider-

ably lower than polymer concrete, flexural stress will control the

design of sulfur concrete repairs. The design must be based on

the maximum anticipated dynamic load ratio otherwise a rupture

failure of the slab would result.

In order to avoid an overly conservative design, it is

imperative that the beneficial effects of aircraft speed be taken

into account. Specifically, the modulus of elasticity and modulus

of rupture of sulfur concrete along with the resilient modulus of

the bomb damage debris backfill must be determined at the duration

and rate of loading corresponding to the aircraft speed at which

the maximum anticipated dynamic load ratio occurs.

An accurate design and analysis of sulfur concrete repairs

should also include the fatigue life of sulfur concrete. Specif-

ically, a testing program similar to the one performed for polymer

concrete discussed in Section III should be undertaken to develop

an equation similar to Equation (13).

3. CRUSHED STONE REPAIR

The Air Force is currently testing a 24 inch lift of com-

pacted crushed stone for rapid repair of runways. The failure

32

criteria is specifying a maximum allowable deformation. If defor-

mations become large, surface roughness increases, which in turn

increases the magnitude of dynamic loads to the aircraft and

pavement repair.

Currently, failure criteria for crushed stone repairs looks

only at permanent deformations, but elastic deformations are just

as Lnportant in analyzing surface roughness. Ideally, field tests

using load carts or aircraft at speeds greater than creep speed

should incorporate a means of recording both elastic and inelastic

deformations; several studies emphasize the importance of sepa-

rating elastic and inelastic deformations when analyzing field

test results (References 14, 15 and 16). This is important for

tests involving any rapid runway repair for which deformations are

important.

Twelve crushed stone repairs were analyzed using the BDR

computer code. Maximum deformation and debris backfill vertical

stress are listed in Table 4 for 18 and 24 inch thick crushed

stone lifts for various wheel loads and backfill moduli. Some

results are shown in Figure 7.

The computer analysis does not consider rutting since a suit-

able model has never been developed for crushed stone. Rutting in

clays, silts, and sands have been modeled, but the interaction of

a tire with coarse granular material is significantly diffcrent;

development of such a model is beyond the scope of this study.

However, the crushed stone repair requires instaLling a Foreign

Object Damage (FOD) cover which would melp to minimize rutting.

33

TABLL 4 - ESULTS OF BDH COvPUTER ANALYSISOF CRUSHED STONE REPAIR

Debris Aircraift MaximuimBackfill Wheel BackfillModulus Load Deformation Stress

(psi) (kips) (inches) (psi)

24 inch crushed stone thickness

5,000 1.0 0.0523 2.?5,000 2.0 0.0886 4.95,000 3.0 0.122 6.9

10,00 1.0 0.0407 4.510,000 2.0 0.0676 7.3

15,000 1.0 0.035c 6.115,000 2.0 0.0580 10.6

40,000 1.0 0.0285 10.3

40,000 2.0 0.0425 19.0

18 inch crushed stone thickness

5,000 1.0 0.125 5.05,000 2.0 0.199 9.75,000 3.0 0.269 14.2

34

BACKFILL MODULUS

0.10 0 5 ksi

L15

0.080)

Z 0.060I-

0U- 0.04LU

0.02

1.0 2.0

DYNAMIC LOAD RATIO

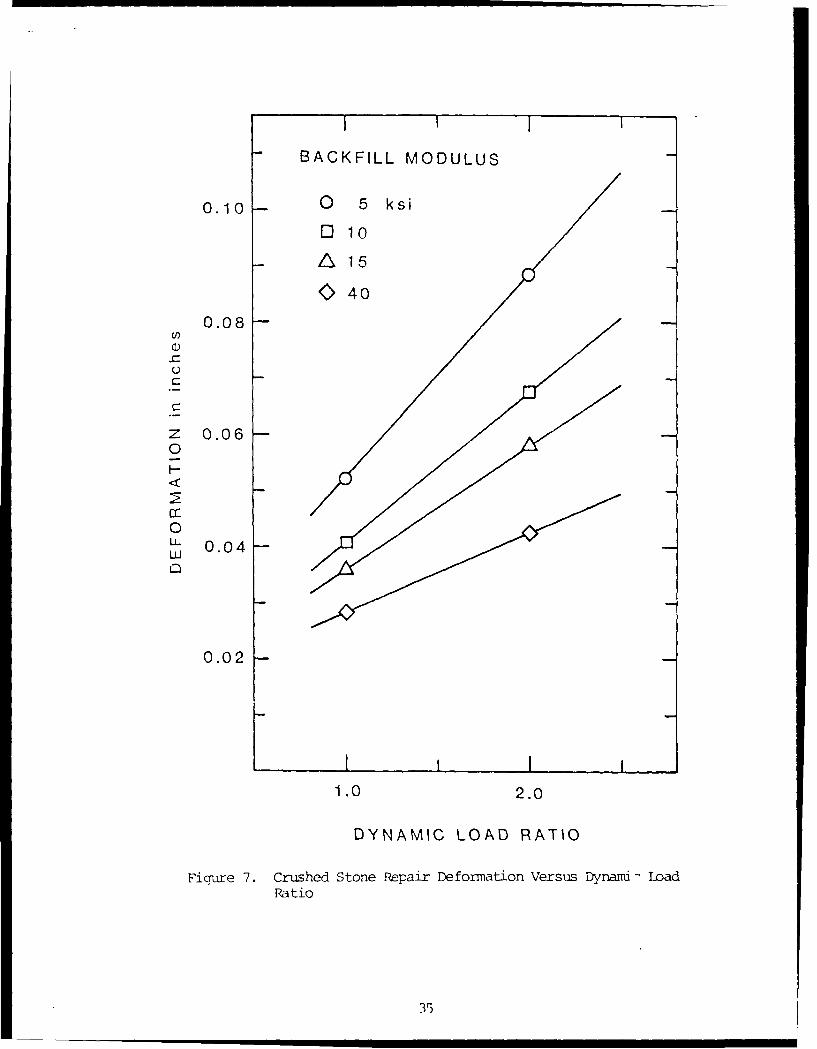
Figure 7. Crushed Stone Repair Deformation versus Dynarni L~oadPatio

3 5

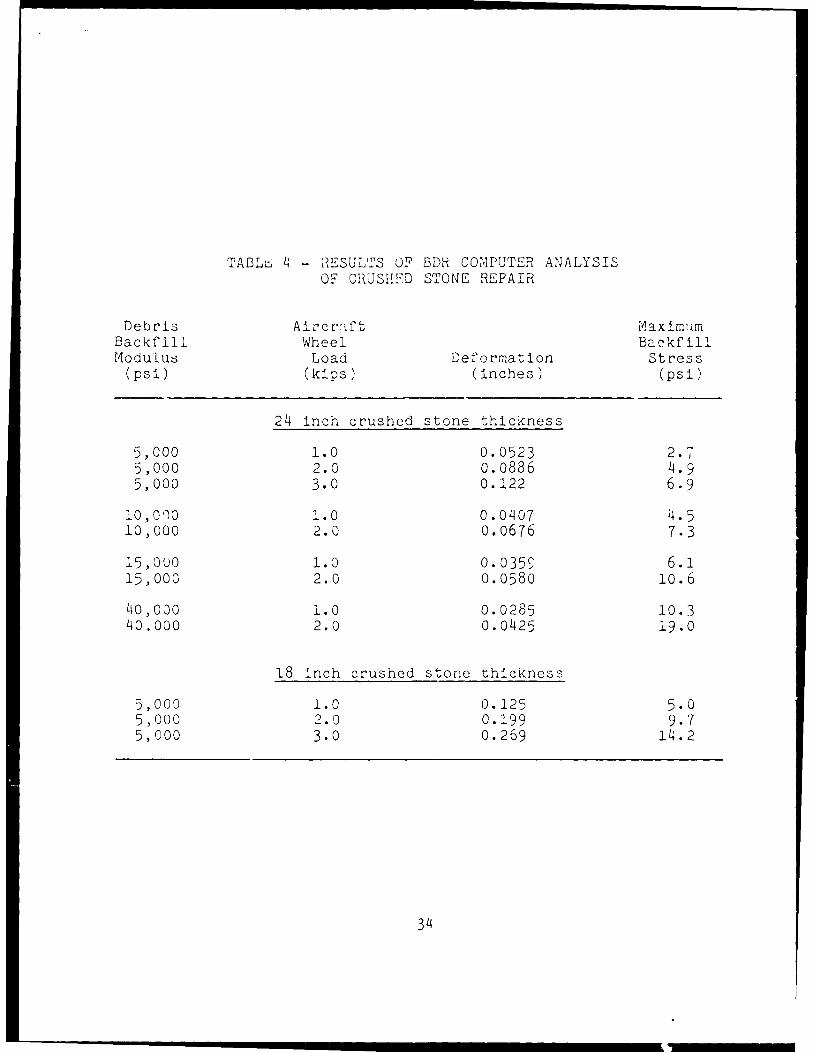
The rate and duration of loading have little influence on the

dynamic modulus of the crushed stone layer itself (Reference 2).

But the effect of aircraft speed can be very significant for

crushed stone repairs because of the strong ini±uence of bomb

damage debris backfill modulus on deformations.

For fine grained soils (and perhaps bomb damage debris back-

fill), the rate and duration of loading may have a strong

influence on the resilient modulus. Changes in dynamic material

properties are closer to being linearly proportional to the

logarithm of the rate and duration of loading and therefore

linearly proportional to the logarithm of aircraft speed. For

example, Wignot, et al (Reference 17) report test results for the

complex modulus of a silty-clay at 90 percent saturation. The

complex moduli of the soil were 2,000, 3,500, and 6,200 psi at

frequencies of 0.16, 1.6, and 16.0 hertz respectively.

For a crushed stone repair example, assume the resilient

moduli of the bomb damage debris backfill are 5,000, 10,000, and

15,000 psi at frequencies of loading corresponding to aircraft

speeds of 1, 10, and 100 knots respectively. From Table 4, a 24

inch crushed stone repair yields a deformation of 0.0523 inches

for a dynamic load ratio of 1.0 and backfill modulus of 5,000 psi.

If the anticipated load ratio is 1.5 at aircraft speeds of 10 and

100 knots, the resulting deformations from Figure 7 would be about

0.054 (a 3% increase) and 0.046 (a 12% decrease) inches respec-

tively. If deformation is the failure criteria, the repair would

be satisfactory for the higher magnitude dynamic loads at the

36

higher aircraft speeds. If the anticipated dynamic load ratio was

2.0 at an aircraft speed of knots, the backfill modulus would

be about 12,500 psi (the logarithm of 30 is about halfway between

the logarithms of 10 and 100), and from Figure 7, the deformation

would be atbout 0 .C6 'c a I,% increase), in this case, the

high magnitude dynamic load governs the design.

In summary, for silt and clay subgrades and backfill, the

resilient moduli of the soil must be determined at frequencies

corresponding to aircraft speeds at which high magnitude dynamic

loads are anticipated. This is because of the strong influence of

the backfill modulus on the deformations of crushed stone repairs.

For granular backfill, the resilient modulus of the soil is

independent of frequency of loading and therefore no benefit can

be expected from aircraft speed.

37

SECTION V

CONCLUSIONS

Based on the laboratory testing and computer analyses con-

ducted for this investigation, the following conclusions are

noted:

1. Design and analysis of rapid runway repairs su)bJected to

large magnitude dynamic loads require that dynamic

material properties be determined. Laboratory testing

for dynamic material properties must be conducted at

frequencies and load rates corresponding to aircraft

speeds at which large magnitude loads are anticipated.

Equations (1), (6), (7), (8), and (9) developed in this

report can be used to calculate the frequency and

duration of loading which correspond to an aircraft speed

for a particular type aircraft and pavement system.

2. The modulus of rupture of polymer concrete increases with

rate of loading; the increase is within the range of

increases for Portland -ement Concrete. For the fatigue

life of polymer concrete, there is a high correlation

between experimental results and Equation (13) developed

in this study which relates probability of survival with

stress level and the number of cycles tn failure. How-

ever, the equation is only valid within the ranges of

stress levels, loading frequencies, and rest periods, as

well as the size of specimens and temperature, used in

38

this study. Also, unlike Portland Cement Concrete, the

frequency of loading probably effects the fatigue life of

polymer concrete. More testing is needed to statisti-

cally determine the influence of loading frequency on the

fatigue life of polymer concrete.

3. Because of the high modulus of rupture of polymer con-

crete, all of the aircraft-pavement systems analyzed in

this report are more than adequate for flexural fatigue

failure criteria. For example, a five-inch-thick polymer

concrete slab on bomb damage debris backfill having a

resilient modulus of 5,000 psi and subjected to an

aircraft load of three times the static load can with-

stand 6,300 coverages with a 90 percent probability of

survival. However, this result is restricted to the

limitations of Equation (13); at low temperatures the

results may be considerably different. Also, failure

criteria other than flexural fatigue may govern the

design.

4. The design of sulfur concrete repairs must be based on

the maximum dynamic load. The modulus of rupture and

fatigue life of sulfur concrete as well as the resilient

modulus of the bomb damage debris backfill must be deter-

mined at the frequency and rate of loading corresponding

to the aircraft speed for which the maximum dynamic load

39

is anticipated. Sulfur concrete repairs will be under

designed if high magnitude dynamic loads are ignored and

over designed if beneficial effects of aircraft speed are

ignored when including high magnitude loads.

5. For crushed stone rapid runway repairs, the modulus of

the bomb damage debris backfill has a strong influence on

the dynamic response of the repair. If the resilient

modulus of the backfill is sensitive to frequency of

loading, the modulus must be determined at a testing fre-

quency corresponding to the anticipated aircraft speed

for which high magnitude dynamic loads occur as well as

at a testing frequency corresponding to aircraft creep

speed. Because of the strong influence of backfill

modulus on the dynamic response of crushed stone repairs,

either the static aircraft load at creep speed or high

magnitude dynamic load aL medium or high speeds may

govern the design. If the resilient modulus of the back-

fill is independent of frequency of loading, no benefit

can be expected from aircraft speed since the resilient

modulus of crushed stone is independent of aircraft

speed.

40

SECTION VI

RECOMMENDATIONS

1. Further fatigue testing of polymer concrete is necessary

for the design of polymer concrete rapid runway repairs subjected

to large magnitude dynamic loads. Specifically, an equation for

the probability of survival should be developed which is valid for

stress levels as low as 0.5, and incorporates temperature as a

parameter since low temperatures may significantly alter the

fatigue behavior of polymer concrete. Also, further testing is

needed in order to satistically determine the influence of loading

frequency and rest periods on the fatigue life of polymer

concrete.

2. The dynamic behavior of sulfur concrete must be deter-

mined. Specifically, the influence of rate and duration of

loading on the modulus of rupture, modulus of elasticity, and

fatigue life of sulfur concrete must be known if sulfur concrete

rapid runway repairs are to be designed and analyzed for large

magnitude dynamic loads.

3. Laboratory dynamic testing of bomb damage debris backfill

must be coordinated with load cart and aircraft field tests of all

rapid runway repairs. This is essential if field test results are

to be used in conjunction with the BDR computer code for the

design and analysis of rapid runway repairs.

4. It is further recommended that load cart testing capa-

bilities be developed which would provide for field tests using

speeds of from creep to medium aircraft speeds and load capaci-

41

ties from static up to about twice the static wheel load. This is

because of the sensitivity of the dynamic response of some pave-

ment materials to vehicle speed. Ideally, these field tests

should be conducted at various temperatures, since temperature is

an important parameter. In addition, field tests should be

designed so that both the elastic and inelastic responses can be

determined.

42

REFERENCES

1. Redd, L. T. and Borowski, R., "Have Bounce Phase I TestResults," Report No. AFFTC-TR-79-1, April 1979.

2. Woelfl, G. A., "Dynamic Response of Airfield Pavement toLarge Magnitude Loads," Report No. ESL-TR-80-10, January1980.

3. Decker, D. S., "Predicting the Fatigue Life of FlexibleAirfield Pavements - A Recommended Approach," Report No.CEEDO-TR-79, Air Force Systems Command, Tyndall Air ForceBase, Florida, June 1979.

4. Timoshenko, S. and Woinowski-Krieger, S., Theory of Platesand Shells, McGraw-Hill Book Company, New York, 1959.

5. Dennard, J. E., Resin Concretes: A Literature Review, U.S.Army Engineer Waterways Experiment Station Concrete Labora-tory, Vicksburg, Mississippi, Miscellaneous Paper C-72-21,September 1972, NTIS AD-750 101.

6. Polymers in Concrete, Publication SP-58, American ConcreteInstitute, Detroit, 1978.

7. Solomatov, V. I., "Polymer-Cement Concretes and Polymer Con-cretes," Translation Series No. 7147, April 1970, ComputerTranslation from Russian by M. Gerrard et al., U.S. AtomicEnergy Commission, Oak Ridge, Tennessee,

8. McHenry, D., "Review of Data on Effect of Speed in MechanicalTesting of Concrete," Symposium on Speed of Testing of Non-Metallic Materials, ASTM Special Technical Publication No.185, 1955, pp. 72-82.

9. McCall, J. T., "Probability of Fatigue Failure of Plain Con-crete," Proceedings of the Amerinan Concrete Institute,Vol. 55, No. 2, August 1958, pp. 233-244.

10. Ople, F. S. and Hulsbos, C. L., "Probable Fatigue Life ofPlain Concrete with Stress Gradient," Proceedings of theAmerican Concrete Institute, Vol. 63, No. 2, January 1966,pp. 59-81.

11. Kesler, C. E., "Effect of Speed of Testing on FlexuralFatigue Strength of Plain Concrete," Proceedings, Thirty-Second Annual Meeting, Highway Research Board, Vol. 32, 1953,p. 251.

12. Hilsdorf, H. K. and Kcsler, C. E., "Fatigue Strength of Con-crete Under Varying Flexural Stresses," Proceedings of theAmerican Concrete Institute, Vol. 63, No. 50, October 1966,pp. 1059-1076.

4 3

13. Lee, D. Y. and Klaiber, F. W., "Fatigue Behavior of SulfurConcrete," presented at the International Symposium on NewHorizons in Construction Materials, Lehigh University,Bethleham, Pennsylvania, Vol. 1, November 1, 1976, pp. 363-375.

14. Horn, W. J. and Ledbetter, R. H., "Pavement Repsonse to Air-craft Dynamic Loads; Volume I: Instrumentation Systems andTesting Program," Report No. FAA-RD-74-39-I, Federal AviationAdministration, Washington, D. C., June 1975.

15. Ledbetter, R. H., "Pavement Response to Aircraft DynamicLoads; Presentation and Analysis of Data; Appendix B: Data,"Report No. FAA-RD-74-39, Vol. II, September 1975, FederalAviation Administration, Washington, D.C., and TechnicalReport S-75-11, Vol. II U.S. Army Engineer Waterways Experi-ment Station, CE, Vicksburg, Miss., September 1975.

16. Ledbetter, R. H., "Pavement Response to Aircraft DynamicLoads; Vol. III: Compendium," Report No. FAA-RD-74-39-III,Federal Aviation Administration, Washington, D.C., November1975.

17. Wignot, J. E., et al., "Aircraft Dynamic Wheel Load Effect onAirport Pavements," Report No. FAA-RD-70-19, Federal AviationAdministration, Washington, D. C., May 1970.

44


Recommended