Available in accessible formats upon request
Tab 5 1
Index 2
May 12, 2017 3
MANITOBA HYDRO 4
2017/18 & 2018/19 GENERAL RATE APPLICATION 5
6
ASSET MANAGEMENT & CAPITAL EXPENDITURE FORECAST 7
8
INDEX 9
10
5.0 Overview ............................................................................................................................. 1 11
5.1 Asset Management ............................................................................................................. 2 12
5.1.1 Corporate Asset Management Initiative ................................................................ 2 13
5.1.2 Asset Investment Planning ..................................................................................... 4 14
5.1.3 Asset Investment Process Improvements ............................................................ 12 15
5.2 CEF16 Summary ................................................................................................................ 16 16
5.2.1 Major New Generation & Transmission ............................................................... 19 17
5.2.2 Business Operations Capital ................................................................................. 24 18
5.2.3 Demand Side Management .................................................................................. 27 19
20
Appendices 21
5.1 UMS Asset Management Gap Assessment Report 22
5.2 Capital Portfolio Management Terms of Reference 23
5.3 Audit Report of Asset Condition Assessment Methodologies for Transmission, 24
Distribution & HVDC (Kinetrics Audit Report) 25
5.4 Capital Expenditure & Demand Side Management Forecast (CEF16)26
Tab 5 Page 1 of 28
May 12, 2017
1
2
MANITOBA HYDRO 3
2017/18 & 2018/19 GENERAL RATE APPLICATION 4
5
ASSET MANAGEMENT & CAPITAL EXPENDITURE FORECAST 6
7
5.0 OVERVIEW 8
9
Tab 5 provides a summary of Manitoba Hydro’s asset investment processes and the 10
resulting investment requirements necessary to meet the regionally growing energy 11
needs of Manitoba, replace aging utility assets and pursue energy conservation and 12
efficiency activities designed to manage the demand for energy. 13
14
Section 5.1 describes the corporation’s asset management practices and various 15
initiatives underway to improve its capital planning and portfolio management. 16
Section 5.2 provides a summary of the Capital Expenditure & DSM Forecast (CEF16). 17
This section includes further information on Major New Generation and 18
Transmission (MNG&T) capital expenditures, including changes in the cost estimates 19
for the Bipole III Reliability and Keeyask Generation projects, as well as details on the 20
capital expenditure requirements for Electric Business Operations capital and a 21
summary of program information related to Electric Demand Side Management 22
(DSM) expenditures. 23
Tab 5 Page 2 of 28
May 12, 2017
5.1 ASSET MANAGEMENT 1
Manitoba Hydro is an asset intensive organization that has been managing assets for 2
generations and embraces the need to mature its asset management practices to 3
maximize value from scarce funding. 4
5
In mature asset management organizations, asset processes are integrated and 6
aligned to achieve a prescribed balance of asset performance, cost and risk that 7
supports business objectives. Asset management is thereby the framework of 8
processes and metrics used to make asset life cycle decisions, including operating 9
context (duty cycle), maintenance schedules, and replacements/upgrades in 10
accordance with corporate priorities and risk tolerances to maximize value creation 11
within established constraints. In other words, asset management translates 12
organizational objectives into asset-related decisions, plans and activities that 13
balance cost, performance and risk. 14
15
A Corporate Asset Management initiative was launched in 2016 to foster mature and 16
consistent asset management practices across the Corporation, as discussed in 17
Section 5.1.1, below. 18
19
Core to this initiative is asset investment planning in consideration of the long and 20
near term asset requirements. Section 5.1.2 describes how long term investment 21
requirements are developed into near term portfolios of potential investments, 22
from which projects are advanced for execution. Investment requirements for 23
generation, transmission and distribution assets are also discussed in Section 5.1.2 24
and are enumerated in the Capital Expenditures Forecast, Section 5.2. Several 25
specific asset management improvement initiatives are underway in support of the 26
Corporate Asset Management initiative. These are discussed in Section 5.1.3. 27
5.1.1 Corporate Asset Management Initiative 28
The corporation’s asset management initiative consists of centralizing asset 29
management governance and developing a Corporate Asset Management 30
Framework to foster mature and consistent asset management practices across the 31
Corporation. 32
33
Tab 5 Page 3 of 28
May 12, 2017
Centralized Asset Management Governance 1
Centralized asset management governance was instituted in 2016 through the 2
creation of the Corporate Asset Management (“CAM”) Executive Council and the 3
CAM Steering Committee. 4
5
The CAM Executive Council is a Vice-President level committee chaired by the 6
corporation’s Chief Finance & Strategy Officer. The CAM Executive Council provides 7
a centralized vision and direction for asset management at Manitoba Hydro and 8
embodies the role of Asset Owner to set business objectives, risk tolerance and 9
budgets. 10
11
The CAM Steering Committee is a Director level committee chaired by the Director 12
of Strategic Business Integration, responsible for executing the corporation’s asset 13
management development strategy. 14
15
The Director of Strategic Business Integration is a new position created within the 16
Finance & Strategy Corporate group with specific asset management responsibilities 17
that integrate with Manitoba Hydro’s financial planning processes. 18
19
Corporate Asset Management Framework 20
An external asset management consultant was retained to assist in development of 21
a corporate asset management framework in three separate phases: 22
1. Assessment of current asset management practices; 23
2. Development of asset management policies and strategies; and 24
3. Development of a detailed roadmap for the implementation of a 25
corporate asset management framework at Manitoba Hydro. 26
27
The UMS Group was selected through a competitive request for proposal process to 28
provide expert asset management advice in 2016. The UMS Group is an 29
international leader in asset management in the utility sector and has over 20 years 30
of experience guiding utilities through the development of asset management 31
systems and programs. They have recently worked with other Canadian utilities such 32
as SaskPower, BC Hydro and Hydro One and are proficient in the application and use 33
of asset management industry standards such as ISO 55000 and PAS55. 34
Tab 5 Page 4 of 28
May 12, 2017
1
The first phase of Manitoba Hydro’s engagement with UMS was an assessment of 2
Manitoba Hydro’s current asset management practices and comparing them to 3
industry best practices as well as the ISO 55000 and PAS55 standards. The Asset 4
Management Gap Assessment report can be found in Appendix 5.1. 5
5.1.2 Asset Investment Planning 6
Manitoba Hydro’s capital planning model is depicted in Figure 5.1 and is also the 7
basis for the Corporation’s investment requirements detailed in the Capital 8
Expenditures Forecast (CEF). Certainty in the capital plan is highest in year one 9
where projects have a defined scope, schedule and budget, as well as a start date. 10
Plans become more uncertain and more likely to change the further they are out in 11
time. Long term planning investments have only a notional definition of scope, 12
schedule and budget. 13
14
Tab 5 Page 5 of 28
May 12, 2017
Figure 5.1 Capital Planning Model 1
2
3 As depicted in Figure 5.1, Programs are a collection of asset classes requiring 4
renewal that are not planned on a specific asset basis, but rather as a fleet. 5
Examples include large populations of comparatively inexpensive assets that require 6
annual replacement for sustainability (e.g. wood poles), ongoing fleet life extension 7
works (e.g. cable injection) and run to failure assets, such as pole top transformers. 8
9
To understand the concept of run-to-failure, consider the example of pole top 10
transformers. Manitoba Hydro runs pole top transformers to failure to utilize the 11
full potential of the asset life cycle. Pole top transformers are low cost and common 12
stock items which can be replaced in a short time frame (1-2 hours) once they fail. 13
As they are not a critical asset, the benefit of avoiding in-service failure does not 14
justify the cost of preventive monitoring and replacement. 15
16
Tab 5 Page 6 of 28
May 12, 2017
Capital expenditures for programs are forecasted based on anticipated failure rates 1
and necessary investment rates to keep asset populations healthy. Specific works 2
within a program are scoped year to year according to immediate need and 3
efficiency. 4
5
Long term planning investments reflect general requirements to maintain a 6
sustainable balance of asset risk and performance for capital intensive assets. These 7
are typically larger, more expensive assets that are monitored and maintained to 8
avoid in-service failures. Examples include station transformers and generating unit 9
components. 10
11
As assets are identified as having undesirable operating costs, performance or risks, 12
specific potential investments are developed to explore potential remedial 13
alternatives. Potential investments are also developed for system expansion needed 14
to meet customer demand. A tentative start date may be associated to a potential 15
investment to facilitate portfolio evaluation, but is fluid until a decision is made to 16
execute. 17
18
The potential investments are considered on an annual basis for advancement to 19
scope development or project execution, based on the urgency of the work and 20
limiting constraints of capital funds and available staff resources. Scope 21
development is used to advance the understanding of the costs, benefits and risks of 22
an investment to allow for a more informed decision about advancing to execution. 23
24
Investments selected to begin execution in the next year (the first year of the CEF) 25
join projects already in execution to form the portfolio of executing projects. 26
27
Decisions to proceed with project execution (i.e. plan the project to begin in year 1 28
of the CEF) are based on a consideration of multiple risk and economic factors 29
reviewed in the context of the specific project relative to other potential 30
investments. Factors include public and employee safety, asset condition and 31
performance, regulatory compliance and asset life cycle costs. Advancement or 32
deferral of potential investments is actively managed on an ongoing basis 33
Tab 5 Page 7 of 28
May 12, 2017
throughout the year to address changing conditions and priorities while managing 1
within funding and resource constraints. 2
3
The CEF depicts the corporation’s projected investment requirements at a point in 4
time, to which the only committed investments and those projects already in 5
execution and those planned to begin in year 1. Potential investments included 6
within the CEF are subject to change with changes in circumstances and priorities. 7
Figure 5.3 in Section 5.2 summarizes CEF16 forecasted requirements over the 10 8
year period from 2018 to 2027. 9
10
System Assets and Investments 11
Manitoba Hydro’s electric system consists of the generation, transmission and 12
distribution assets used to deliver electricity to customers. 13
14
In general, the status of the system and need for investment can be summarized as 15
follows: 16
The highest need for investment is in the distribution system. Aging 17
populations of assets, expansion required to service regional growth and 18
condition and capacity concerns on the existing system are expected to put 19
pressure on long term funding levels. 20
The transmission system also needs to expand to meet regional load growth 21
in the near term with overall acceptable system reliability once Bipole III is in 22
service. Long term funding levels included in the CEF are expected to be 23
sufficient to sustain the system. 24
The generation system has sufficient capacity to meet domestic and export 25
customer commitments for the foreseeable future. Re-investment in some 26
older generation assets is being reviewed. Near term funding levels are 27
sufficient to sustain the system and long term requirements for the large 28
northern stations are being examined. 29
30
Tab 5 Page 8 of 28
May 12, 2017
Distribution System Assets 1
Both the substations and major asset classes making up Manitoba Hydro’s 2
distribution system require significant investment to address deteriorating 3
condition. System renewal and expansion are also required to meet regional growth 4
in customer load. 5
6
Manitoba Hydro has 280 distribution substations across rural Manitoba and 101 7
substations within the City of Winnipeg. Of the 101 city substations, 29 are above 8
their firm capacity and 25 more are approaching firm capacity. A smaller number of 9
rural stations are also approaching or beyond firm capacity. 10
11
This presents a major risk of customer outage as the likelihood of equipment failure 12
increases significantly as substation capacity is exceeded. Limited substation 13
capacity challenges Manitoba Hydro’s ability to address new customer connections 14
in a timely manner in regions that are capacity constrained. Customer connections 15
are prioritized ahead of sustainment projects as Manitoba Hydro is mandated to 16
serve customer growth. 17
18
In addition to capacity limitations, substation assets are deteriorating. Power 19
transformers and substation breakers represent the highest value assets on the 20
system and the highest risks. While a number of the assets in poorest condition will 21
be addressed through planned substation capacity enhancement projects, the 22
condition of substation breakers remains a particular concern. Many of these 23
breakers were installed between the 1940s and 1960s and have deteriorated to a 24
state where their continued operation presents operational and safety risks. These 25
risks as well as the risk of extended customer outages due to equipment failure are 26
being mitigated through spare and repair strategies but this strategy is becoming 27
more difficult as spare parts are no longer being manufactured and replacement 28
requires expensive retrofitting. 29
30
Major distribution asset classes include underground cables, manholes, duct lines, 31
transformers, substation breakers, wood poles, and street light standards. These 32
assets have relatively low per unit costs but there are millions of separate 33
components spread across the province.. A significant portion of the assets are 34
Tab 5 Page 9 of 28
May 12, 2017
approaching the end of their expected lives and will require acceleration in 1
replacement rates to maintain distribution system performance over the next 2
twenty years. 3
4
The four most concerning classes of distribution assets are substation breakers, 5
underground cables, wood poles, and street light standards. Many of the assets 6
within these classes have exceeded their life expectancy and as their condition 7
continues to deteriorate they present a growing risk of equipment failure with 8
potential impacts to electrical outages and public safety. Wood poles are particularly 9
concerning as they were installed in waves as part of rural electrification in the 10
1940’s and 1950’s and are therefore also approaching end of life in waves. 11
12
CEF16 includes investments to address only the most concerning substation 13
condition and capacity issues in the near term (approximately 5 years), as well as 14
growth and expansion investments to meet customer service requirements. To pace 15
the level of investment, significant investment in the major asset classes has been 16
deferred beyond this horizon, causing degradation to pace ahead of renewal in the 17
population. 18
19
Greater levels of investment may be required in future years to sustain the major 20
asset classes and avoid building an overwhelming asset condition deficit. Asset 21
management practices are being developed to model the investments needed to 22
balance cost, performance and risks within the distribution system and plan 23
sustainable levels of investment. 24
25
Transmission System Assets 26
Manitoba Hydro’s major transmission system assets include overhead conductor & 27
hardware, wood pole structures and steel structures, and transmission station 28
equipment such as breakers, protection relays and transformers, as well as highly 29
sophisticated apparatus at the HVDC converter stations. 30
31
The overhead conductor, hardware, wood pole structures and steel structures that 32
constitute the transmission lines connecting the electrical system across the 33
Province are generally serviceable, with the exception of some of the oldest lines 34
Tab 5 Page 10 of 28 May 12, 2017
which do not meet modern standards and require replacement or decommissioning. 1
Transmission line assets have long life expectancies and require little maintenance 2
to sustain their condition. Annual programs are in place to replace transmission line 3
components based on condition, such as tilting northern tower foundations flagged 4
through inspection and wood pole structures assessed through the Integrated Pole 5
Maintenance program. 6
7
The majority of transmission station assets are also serviceable. Some station 8
breakers and protection relays will be replaced in the coming years due to 9
obsolescence, and condition and performance issues; however, most condition-10
based proactive replacements are expected to occur five or more years from now. 11
The reliability risk of running these assets to failure is being managed through spare 12
and repair strategies when possible. This strategy is only effective so long as spare 13
parts are available and failure rates remain manageable. 14
15
Assets within the HVDC system are very complex and expensive to replace and 16
usually require long lead times. Significant maintenance is performed to sustain and 17
extend the asset lifetimes, and these efforts have so far been successful in keeping 18
the assets serviceable. Of major concern is the condition of the Bipole II valve 19
groups, which rank among the oldest in the world. A significant replacement project 20
for this equipment is included in CEF16, currently planned to occur beyond the five-21
year window. The completion of Bipole III will improve the reliability of the HVDC 22
system and create redundancy which takes the immediate pressure off of Bipoles I 23
and II. 24
25
Capacity constraints remain the largest risk associated with the transmission system. 26
Rapid load growth in areas such as Winnipeg, Steinbach, Portage la Prairie, Winkler, 27
Morden and the east side of Lake Winnipeg require that the transmission system in 28
these areas be upgraded. CEF16 includes major investment projects to address these 29
capacity concerns over the next five years. 30
31
The main driver for future transmission system projects will be the risks associated 32
with system load growth, the location of new customer load additions on the system 33
and the ongoing degradation of long serving assets. A single large customer could 34
Tab 5 Page 11 of 28 May 12, 2017
potentially trigger the need for capacity investment dependent on the location 1
within the province and existing capacity levels. 2
3
Generation System Assets 4
Manitoba Hydro’s generation system assets include water retaining structures, 5
water control equipment, generation drive train assets and associated station 6
infrastructure, as well as support infrastructure such as airports and town sites at 7
remote locations. 8
9
The majority of generation system assets are generally serviceable; however, some 10
of the generating facilities on the Winnipeg River were built more than 100 years 11
ago and will require significant renewal to remain operational beyond the near term. 12
These facilities represent a small portion of Manitoba Hydro’s production capacity. 13
The remainder of Manitoba Hydro’s generating system also requires care and 14
attention to meet operational requirements as asset condition deteriorates. 15
16
Dam safety and the maintenance of water retaining structures and control 17
equipment are of paramount importance due to the high consequences of 18
uncontrolled water release. Also, generation equipment is carefully managed as 19
downtime results in lost revenue and could threaten energy delivery to customers. 20
These and other critical and expensive assets are monitored for performance and 21
condition, are subject to regular maintenance and when appropriate are replaced or 22
refurbished to avoid in-service failures. 23
24
Investment plans within CEF16 have been reduced significantly as compared to 25
CEF15 by deferring asset renewal projects at the Point de Bois Generating Station. 26
Pointe du Bois is Manitoba Hydro’s oldest generating station built circa 1911. Assets 27
at the site have significantly deteriorated over time and much of the equipment is 28
obsolete and no longer serviceable. The spillway and water retaining structures 29
were replaced in 2015 to address dam and public safety concerns and assure control 30
of the river. Plans were also in place to repower the power house by replacing some 31
of the generating units and modernizing station equipment to improve safety and 32
reduce maintenance/operating requirements. Due to declining export power prices, 33
the business case for reinvestment in the Pointe du Bois power house is being re-34
Tab 5 Page 12 of 28 May 12, 2017
evaluated to assess the viability of the facility as a generating station investment; 1
decommissioning of the power house is under consideration. 2
3
The current levels of sustaining investment in generation system assets are 4
adequate to maintain the serviceability of the existing generating fleet within the 5
near term (3 to 5 years). It is suspected that additional investment may be required 6
beyond this horizon to sustain the large Lower Nelson River assets as their condition 7
deteriorates. These investments will be proactively planned and paced within cost, 8
resource and timing constraints to meet operational requirements and manage 9
risks. Options for renewal and decommissioning are also being studied at aging 10
generating facilities that may not be sustainable. 11
12
Section 5.4 of this Tab provides a breakdown of the forecast capital expenditures by 13
investment category, including expenditures required to address capacity and load 14
growth, sustainment of infrastructure and to support business operations. 15
5.1.3 Asset Investment Process Improvements 16
Manitoba Hydro’s objectives for future asset investment practice are to: 17
1. Optimize timing of investments to maximize value; and 18
2. Forecast long term corporate capital requirements 19
20
Optimizing the timing of investments to maximize value refers to the near term 21
portfolio of potential investments and their advancement to scope development and 22
execution. 23
24
Forecasting long term corporate capital requirements refers to the long term 25
planning of significant investments, including investments needed to sustain the 26
existing system of assets and investments needed to expand the system to meet 27
customer demands. 28
29
A roadmap is currently under development for achieving these objectives. The 30
roadmap will detail the steps needed to deploy corporate tools and processes, build 31
supporting sub-processes and data structures, populate asset inventories and collect 32
Tab 5 Page 13 of 28 May 12, 2017
data, and build proficiency in the user groups. The anticipated timeline to achieving 1
the objectives is three to five years. 2
3
Foundational corporate level initiatives currently underway include the Corporate 4
Value Framework to assess the value of investments, and the Capital Portfolio 5
Management Program to deploy a suite of processes and tools to anchor capital 6
planning and portfolio management. Improving Asset Health Index methodologies 7
as a key capital planning input is also underway for transmission and distribution 8
asset classes. These are discussed below. 9
10
Corporate Value Framework 11
Manitoba Hydro engaged Copperleaf Technologies Inc. (“Copperleaf”) to assist in 12
the development of a Corporate Value Framework (sometimes referred to as “CVF”) 13
methodology. A Corporate Value Framework is a systematic framework to 14
understand the value of all investments in an organization. The CVF helps identify 15
the optimal set of investments that deliver the greatest value (or mitigates risk) to 16
the organization, within funding, resource and timing constraints. This tool will be 17
used to assess the value of capital investments across all areas of the corporation in 18
support of allocating funds to projects and assets that optimize strategic value or 19
mitigate risk. 20
21
Initial development of the Corporate Value Framework is complete and the tool is 22
being piloted in the Generation & Wholesale Business Group while being rolled out 23
in other groups as part of the Capital Portfolio Management Program (see below). 24
As the user base grows, the measures making up the value streams in the Corporate 25
Value Framework continue to be refined and the value streams calibrated to 26
business objectives. Associated business processes will also need to mature to fully 27
utilize the Corporate Value Framework. 28
29
Manitoba Hydro is seeking consent of Copperleaf Technologies to file its proprietary 30
report. 31
32
Capital Portfolio Management Program 33
Tab 5 Page 14 of 28 May 12, 2017
The Capital Portfolio Management (sometimes referred to as CPM) Program will 1
standardize capital investment planning processes through the implementation of 2
Copperleaf’s C55 asset investment planning software. The Terms of Reference for 3
the Capital Portfolio Management Program can be found in Appendix 5.2. 4
5
Copperleaf’s C55 is an enterprise wide platform that supports a risk-informed and 6
value-based approach to investment decision making. The Capital Portfolio 7
Management Program provides a consistent set of processes and methods for 8
investment portfolio management and optimization, as well as asset and program 9
analytics to support investment planning. 10
11
Asset Health Indices 12
Asset condition and health, indices and scores, methodologies and assessments are 13
some of the terms used somewhat interchangeably in industry without an accepted 14
industry convention or definition. As referred to in this Application and its 15
supporting materials, asset health and asset condition are synonymous in describing 16
the state or degradation of an asset. Asset health indices and asset condition scores 17
are equally synonymous in describing a relative quantification of degradation useful 18
in comparing assets to each other and to larger experience databases. Methodology 19
refers to how the assets are to be assessed to calculate the asset health index or 20
asset condition score. And finally, asset condition assessment is the act of 21
performing the assessment to determine the index or score. 22
23
Asset Health Indices are used to link asset condition to probability of failure and thus 24
can be used as an indicator of future investment requirements. The methodology 25
used varies by asset according to the cost to upgrade/replace, consequences of in-26
service failure and performance characteristics. 27
28
For instance, assets with a long life expectancy and whose condition does not 29
change quickly are monitored infrequently. Faster changing assets are monitored 30
more frequently. Digital equipment that does not deteriorate, but rather simply 31
stops working with no measurable warning is not monitored. Complex equipment 32
can have multiple measurement points and assessment parameters, whereas simple 33
Tab 5 Page 15 of 28 May 12, 2017
equipment may have only one. Assets with significant consequence of in-service 1
failure are monitored closely whereas others are run to failure without monitoring. 2
3
Thus, the refresh rate and depth of routine condition data varies significantly by 4
asset, described as asset condition assessment methodology. 5
6
It is not possible to predict the timing of asset failure with sufficient confidence to 7
plan specific asset replacements/upgrades using Asset Health Indices methodology 8
alone, even for assets near end of life. Assets with pending upgrade/replacement 9
requirements are subject to a more extensive risk informed economic end-of-life 10
analysis that goes well beyond AHI, particularly for larger scale, more complex 11
assets. This assessment is used to optimize the timing of executing capital projects 12
in the near term. The results of the detailed assessments are used to justify specific 13
investments and will be used in the future for project valuation through the 14
Corporate Value Framework. 15
16
Kinectrics Inc. (Kinectrics), an independent company that is recognized worldwide 17
for outstanding technical and business excellence in the energy sector, was retained 18
to assist with several AHI improvement initiatives in support of asset management, 19
including: 20
- An asset condition assessment for key distribution system assets (this report is in 21
preparation and will be filed when available). 22
- An asset condition assessment audit for transmission, HVDC and distribution 23
system assets (Appendix 5.3). 24
- Development of condition degradation curves (estimate/forecast of how 25
condition degrades over time) for some transmission system assets (this report is 26
in preparation and will be filed when available). 27
28
Updated asset condition assessments and the revised degradation curves are being 29
configured in Copperleaf C55 as part of the Capital Portfolio Management Program. 30
Tab 5 Page 16 of 28 May 12, 2017
5.2 CEF16 SUMMARY 1
The Capital Expenditure & Demand Side Management Forecast (CEF16) is a 2
projection of Manitoba Hydro’s capital expenditures for new and replacement 3
facilities to meet the electricity and natural gas service requirements in the Province 4
of Manitoba as well as expenditures required to meet firm sale commitments 5
outside the province. Expenditures included in CEF16 will provide for an ongoing 6
safe and reliable supply of energy in the most efficient and environmentally sensitive 7
manner. CEF16 also includes a projection of Manitoba Hydro’s DSM programs which 8
provide education, incentives and expertise to achieve energy savings to offset 9
growing demand. A copy of CEF16 is included as Appendix 5.4. 10
11
Capital Expenditures are categorized between Major New Generation and 12
Transmission (MNG&T) projects and Business Operations capital. MNG&T projects 13
provide significant new generation and transmission capacity and include projects of 14
a substantial cost. Business Operations capital addresses requirements to sustain 15
electricity and natural gas service through replacement of aging or obsolete assets, 16
capacity enhancements as well as system expansion due to load growth. Included 17
are expenditures which support business operations such as fleet, administrative 18
buildings and information technology hardware and software. Figure 5.2 provides a 19
10 year summary of Electric Capital & DSM. 20
21
Figure 5.2 Summary of Electric Capital & DSM 22
23
24
CEF16 for electric operations totals $14 435 million for the ten year period from 25
2017/18 through 2026/27. Expenditures for MNG&T total $8 134 million, and $5 549 26
million for Business Operations capital. DSM programs total $752 million for the 27
same period. 28
29
($ Millions)
2017
Outlook 2018 2019 2020 2021 2022 2023 2024 2025 2026 2027
2018-2027
10 Year
Total
Major New Generation & Transmission 2 355 2 476 2 126 1 274 1 066 746 358 75 4 4 5 8 134
Electric Business Operations Capital 574 526 517 516 511 499 521 544 616 640 659 5 549
Total Electric Capital 2 929 3 002 2 643 1 790 1 578 1 246 879 619 620 644 664 13 683
Year End Outlook Adjustment (45) - - - - - - - - - - -
Total Revised Electric Capital 2 884 3 002 2 643 1 790 1 578 1 246 879 619 620 644 664 13 683
Electric Demand Side Management 50 56 99 94 89 87 67 60 62 67 71 752
Total Electric Capital & Demand Side Management 2 934 3 058 2 742 1 884 1 666 1 332 945 679 682 711 734 14 435
Tab 5 Page 17 of 28 May 12, 2017
Figure 5.3 summarizes the annual forecast over the 2016/17 to 2018/19 timeframe 1
and the 10 year forecast period by executing projects, potential investments, 2
programs and planning investments. 3
4
Figure 5.3 Summary of Electric Capital & Demand Side Management 5
6
7
Investment Categories 8
Manitoba Hydro has incorporated the use of investment categories, which are 9
commonly used within the industry to provide a better understanding of the primary 10
driver for the investment. The primary investment categories are further broken 11
down into sub-categories. 12
13
The primary investment categories are Capacity & Growth, Sustainment and 14
Business Operations Support. Capacity & Growth investments provide for future 15
load growth or address existing capacity constraints in key geographic areas on the 16
transmission and distribution system. Sustainment investments are required to 17
ensure the continued and future performance capability of the electricity system 18
and address the issue of aging or obsolete assets. Business Operations Support 19
investments support corporate operations including IT investments, fleet and 20
administrative buildings. Further information on the investment categories can be 21
found in Appendix D of the Capital Expenditure & Demand Side Management 22
Forecast (CEF16). 23
($ Millions)
Total
Project
Cost
2017
Outlook
2018
Forecast
2019
Forecast
2018 -
2027
10 Year
Total MNGT
Executing Projects 17 796 2 355 2 476 2 126 8 134
Electric Business Operations Capital
Executing Projects 3 016 394 325 211 991
Potential Investments 425 - - 6 391
Programs NA 242 265 290 3 089
Planning Investments NA - - 26 1 426
Portfolio Adjustments NA (63) (64) (16) (303)
Unallocated Year End Outlook Adjustment - Electric (45) (45)
529 526 517 5 549
DSM
Electric Demand Side Management 50 56 99 752
Total Electric Capital & Demand Side Management 21 236 2 934 3 058 2 742 14 435
Tab 5 Page 18 of 28 May 12, 2017
1
Figure 5.4 below provides a breakdown of Electric Capital & DSM by Investment 2
Category over the 2016/17 to 2018/19 timeframe and the 10 year forecast period. 3
4
Figure 5.4 Summary of Electric Capital & DSM by Investment Category 5
6
7
CEF Comparison 8
CEF16 for electric operations over the ten year period to 2027 totals $14 435 million 9
compared to $11 918 for the same 10 year period in CEF15. The increase of $2 516 10
million is primarily due to revised estimates for the Keeyask Generation and Bipole 11
III Reliability projects. Figures 5.5 and 5.6 provide a summary of the changes over 12
the 10 year period. 13
14
($ Millions)
2017
Outlook2018 2019
2018-2027
10 Year
Total
Major New Generation & Transmission
Capacity & Growth 2 308 2 410 2 073 7 864
Sustainment 29 18 7 24
Business Operations Support 18 49 46 246
Business Operations -
Capacity & Growth 195 183 170 1 341
Sustainment 303 280 284 3 549
Business Operations Support 75 63 62 659
Unallocated Year End Outlook Adjustment - Electric (45) - - -
Electric Demand Side Management 50 56 99 752 -
Total Electric 2 934 3 058 2 742 14 435
Tab 5 Page 19 of 28 May 12, 2017
Figure 5.5 Change in Cost Flow from CEF15 to CEF16 1
2 3
Figure 5.6 Breakdown of 10 Year Cost Flow Change from CEF15 to CEF16 4
5 6
5.2.1 Major New Generation & Transmission 7
Expenditures for MNG&T total $8 134 million over the 10 year forecast period to 8
2027. Figure 5.7 provides a breakdown by investment category of the MNG&T 9
forecast over the 10 year period. Of the $8 134 million, $5 474 million is for New 10
Energy (primarily for Keeyask Generation) and a further $1 906 million is required to 11
address System Load Capacity (Bipole III Reliability project). 12
13
Electric Only
($ Millions)
2017
Outlook 2018 2019 2020 2021 2022 2023 2024 2025 2026 2027
2018-2027
10 Year
Total
CEF15 3,356 2,923 2,008 1,443 1,033 880 714 680 730 739 767 11,918
Incr (Decr) (422) 134 734 441 633 453 231 (1) (48) (29) (33) 2,516
CEF16 2,934 3,058 2,742 1,884 1,666 1,332 945 679 682 711 734 14,435
Electric Only
($ Millions)
Total Projected
Cost
10 Year
Increase
(Decrease)
2018 to 2027
Keeyask - Generation 8 726 2 505
Bipole III Reliability 5 042 835
Manitoba-Minnesota Transmission Project 453 113
Generating Station Improvements & Upgrades NA (256)
Target Adjustment for MNG&T NA (293)
Other MNG&T Projects NA (59)
Electric Business Operations Capital NA (237)
Electric Demand Side Management NA (90)
2 516
Tab 5 Page 20 of 28 May 12, 2017
Figure 5.7 MNG&T 10 Year Forecast by Investment Category 1
2
3
Figure 5.8 provides the annual forecast for each MNG&T project by investment 4
category over the test year period (2016/17 to 2018/19) as well as the cumulative 5
forecast over the 10 years to 2027. 6
7
Business Operations SupportAND Sustainment 3%
New Energy67%
System Load Capacity24%
Grid Interconnections -Import/Export 6%
Capacity & Growth 97%
Tab 5 Page 21 of 28 May 12, 2017
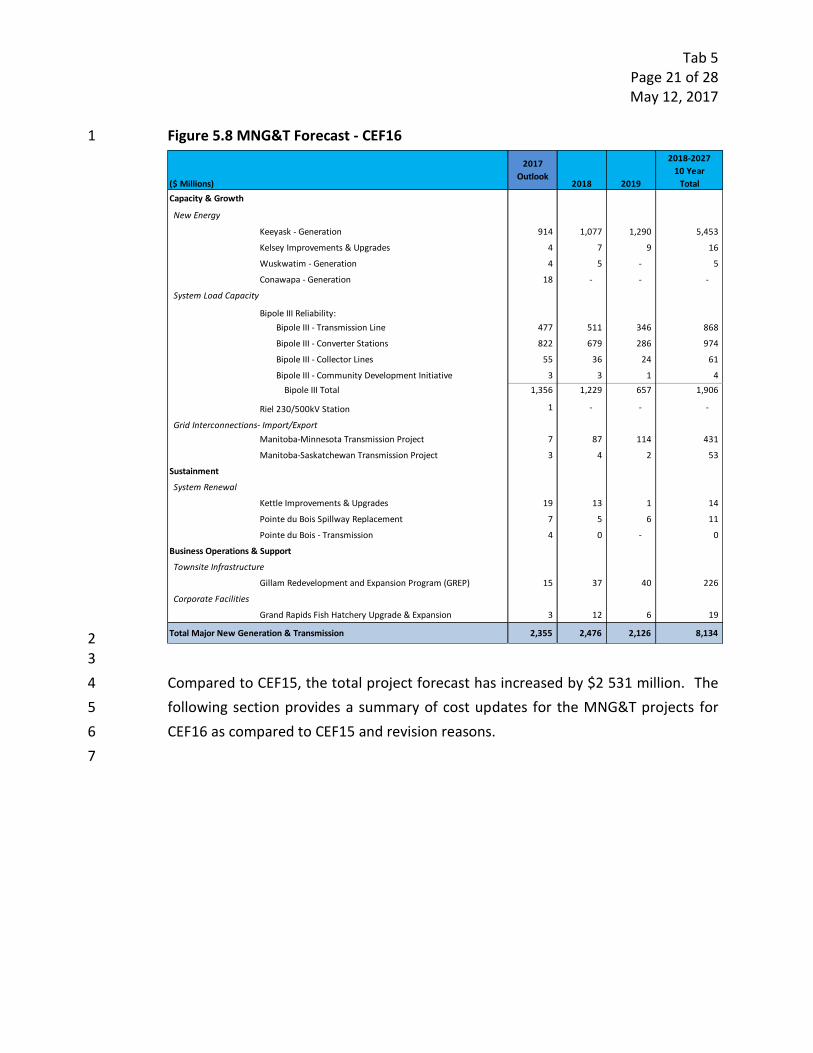
Figure 5.8 MNG&T Forecast - CEF16 1
2 3
Compared to CEF15, the total project forecast has increased by $2 531 million. The 4
following section provides a summary of cost updates for the MNG&T projects for 5
CEF16 as compared to CEF15 and revision reasons. 6
7
($ Millions)
2017
Outlook2018 2019
2018-2027
10 Year
Total
Capacity & Growth
New Energy
Keeyask - Generation 914 1,077 1,290 5,453
Kelsey Improvements & Upgrades 4 7 9 16
Wuskwatim - Generation 4 5 - 5
Conawapa - Generation 18 - - -
System Load Capacity
Bipole III Reliability:
Bipole III - Transmission Line 477 511 346 868
Bipole III - Converter Stations 822 679 286 974
Bipole III - Collector Lines 55 36 24 61
Bipole III - Community Development Initiative 3 3 1 4
Bipole III Total 1,356 1,229 657 1,906
Riel 230/500kV Station 1 - - -
Grid Interconnections- Import/Export
Manitoba-Minnesota Transmission Project 7 87 114 431
Manitoba-Saskatchewan Transmission Project 3 4 2 53
Sustainment
System Renewal
Kettle Improvements & Upgrades 19 13 1 14
Pointe du Bois Spillway Replacement 7 5 6 11
Pointe du Bois - Transmission 4 0 - 0
Business Operations & Support
Townsite Infrastructure
Gillam Redevelopment and Expansion Program (GREP) 15 37 40 226
Corporate Facilities
Grand Rapids Fish Hatchery Upgrade & Expansion 3 12 6 19
Total Major New Generation & Transmission 2,355 2,476 2,126 8,134
Tab 5 Page 22 of 28 May 12, 2017
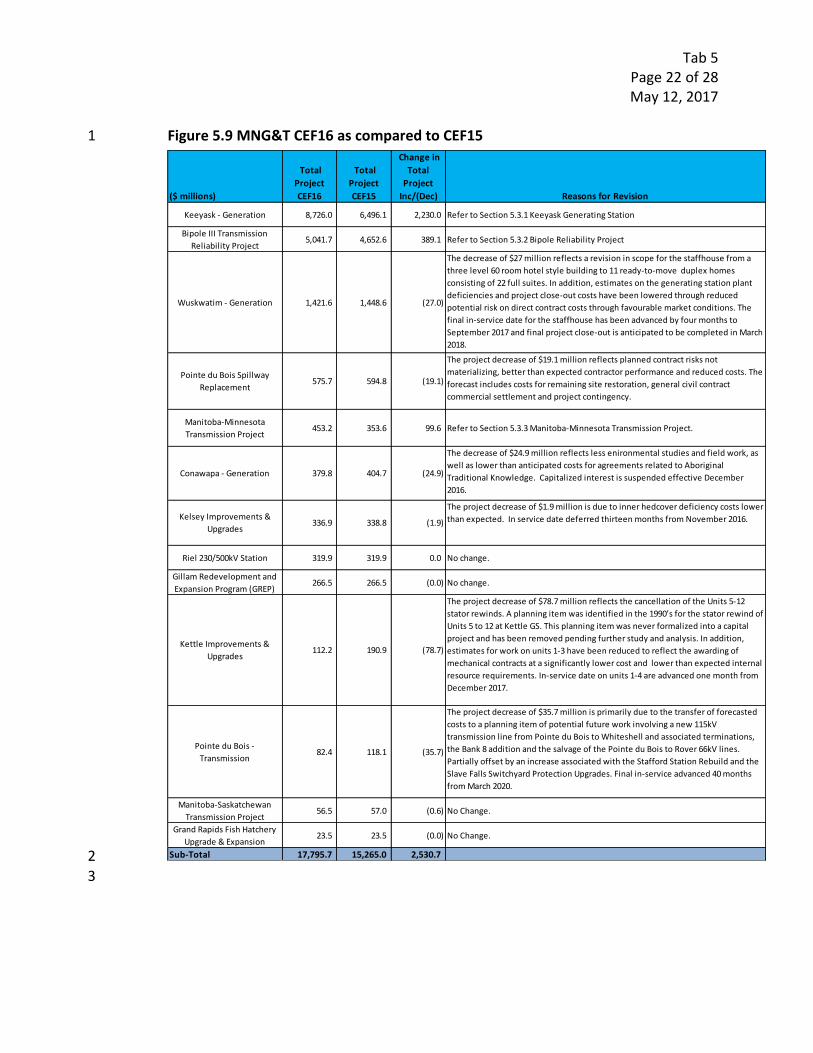
Figure 5.9 MNG&T CEF16 as compared to CEF15 1
2
3
($ millions)
Total
Project
CEF16
Total
Project
CEF15
Change in
Total
Project
Inc/(Dec) Reasons for Revision
Keeyask - Generation 8,726.0 6,496.1 2,230.0 Refer to Section 5.3.1 Keeyask Generating Station
Bipole III Transmission
Reliability Project5,041.7 4,652.6 389.1 Refer to Section 5.3.2 Bipole Reliability Project
Wuskwatim - Generation 1,421.6 1,448.6 (27.0)
The decrease of $27 million reflects a revision in scope for the staffhouse from a
three level 60 room hotel style building to 11 ready-to-move duplex homes
consisting of 22 full suites. In addition, estimates on the generating station plant
deficiencies and project close-out costs have been lowered through reduced
potential risk on direct contract costs through favourable market conditions. The
final in-service date for the staffhouse has been advanced by four months to
September 2017 and final project close-out is anticipated to be completed in March
2018.
Pointe du Bois Spillway
Replacement575.7 594.8 (19.1)
The project decrease of $19.1 million reflects planned contract risks not
materializing, better than expected contractor performance and reduced costs. The
forecast includes costs for remaining site restoration, general civil contract
commercial settlement and project contingency.
Manitoba-Minnesota
Transmission Project453.2 353.6 99.6 Refer to Section 5.3.3 Manitoba-Minnesota Transmission Project.
Conawapa - Generation 379.8 404.7 (24.9)
The decrease of $24.9 million reflects less enironmental studies and field work, as
well as lower than anticipated costs for agreements related to Aboriginal
Traditional Knowledge. Capitalized interest is suspended effective December
2016.
Kelsey Improvements &
Upgrades336.9 338.8 (1.9)
The project decrease of $1.9 million is due to inner hedcover deficiency costs lower
than expected. In service date deferred thirteen months from November 2016.
Riel 230/500kV Station 319.9 319.9 0.0 No change.
Gillam Redevelopment and
Expansion Program (GREP)266.5 266.5 (0.0) No change.
Kettle Improvements &
Upgrades112.2 190.9 (78.7)
The project decrease of $78.7 million reflects the cancellation of the Units 5-12
stator rewinds. A planning item was identified in the 1990’s for the stator rewind of
Units 5 to 12 at Kettle GS. This planning item was never formalized into a capital
project and has been removed pending further study and analysis. In addition,
estimates for work on units 1-3 have been reduced to reflect the awarding of
mechanical contracts at a significantly lower cost and lower than expected internal
resource requirements. In-service date on units 1-4 are advanced one month from
December 2017.
Pointe du Bois -
Transmission82.4 118.1 (35.7)
The project decrease of $35.7 million is primarily due to the transfer of forecasted
costs to a planning item of potential future work involving a new 115kV
transmission line from Pointe du Bois to Whiteshell and associated terminations,
the Bank 8 addition and the salvage of the Pointe du Bois to Rover 66kV lines.
Partially offset by an increase associated with the Stafford Station Rebuild and the
Slave Falls Switchyard Protection Upgrades. Final in-service advanced 40 months
from March 2020.
Manitoba-Saskatchewan
Transmission Project56.5 57.0 (0.6) No Change.
Grand Rapids Fish Hatchery
Upgrade & Expansion23.5 23.5 (0.0) No Change.
Sub-Total 17,795.7 15,265.0 2,530.7
Tab 5 Page 23 of 28 May 12, 2017
Keeyask Generating Station 1
Keeyask is located upstream of the Kettle Generating Station on the Nelson River 2
with a design rating of 695 MW under ideal operating conditions and a winter peak 3
rating of 630 MW which is utilized for planning purposes. Subsequent to the events 4
described in Tab 2, a review by the Boston Consulting Group and Manitoba Hydro 5
found the potential for delay in the Keeyask Generation Project. Upon further 6
review, a revised estimate was submitted and approved by the Manitoba Hydro-7
Electric Board (MHEB) for the Keeyask project from $6 496 million to $8 726 million 8
and a corresponding 21-month extension to the schedule. The increased estimate 9
incorporates a revised budget and schedule as a result of a schedule delay with the 10
General Civil contract. 11
12
Leading up to spring 2016, the project remained within budget and on schedule. 13
However, as the ramp-up into the first concrete work on the principal structures 14
took place, the contractor fell progressively further behind as the summer 15
construction season unfolded. Around the same time, progress on the earthworks 16
began to slip as a number of geotechnical challenges were realized. At the 17
conclusion of 2016, the first full year of civil works (first year of concrete 18
construction of the principle structures), progress of the concrete structures was 19
roughly 40 percent and progress of the earthworks was roughly 60 percent of the 20
plan for the year. As a result, a recovery plan was developed and implemented for 21
the General Civil Works contract and the overall Keeyask project. The recovery plan 22
includes a comprehensive amendment to the General Civil contract, a re-23
organization of the project execution team and the development of strategies to 24
increase production rates. All other components of the project remain on track but 25
have been affected due to a longer schedule and increased work force to 26
accommodate the recovery plan. 27
28
Bipole III Reliability Project 29
The Manitoba Hydro-Electric Board (MHEB) approved a revised estimate for the 30
Bipole III Reliability project from $4 653 million to $5 042 million with no change to 31
schedule. 32
33
Tab 5 Page 24 of 28 May 12, 2017
The revised estimate incorporates increases in actual costs and awarded contracts to 1
date as a result of higher than planned market rates for anchors and foundation 2
construction and tower assembly, erection and stringing contracts. Other increases 3
include: delay claims (weather and material) experienced to date, construction 4
schedule compression and resultant costs, increased equipment and vehicle costs to 5
support construction, additional materials required for southern route changes, 6
property costs for finalized southern route, greater material management costs, 7
relationship management costs, environmental monitoring costs, inclusion of 8
additional provincial road upgrades and contingency to address project risks. 9
10
Manitoba – Minnesota Transmission Project 11
The Manitoba – Minnesota Transmission Project is a 500 kV AC transmission line in 12
southeastern Manitoba, connecting at the border with Minnesota Power’s proposed 13
Great Northern Transmission Line. The Manitoba – Minnesota Transmission Project 14
will enable power to be exported to the United States based on current sales 15
agreements, improve reliability and import capacity in emergency and drought 16
situations, and increase access to markets in the U.S. The projected in-service date is 17
2020/21. The Great Northern Transmission Line has received all key U.S. regulatory 18
approvals, including a Certificate of Need on June 30, 2015 and a Route Permit on 19
April 11, 2016 both from the Minnesota Public Utilities Commission and a 20
Presidential Permit PP-398 from the U.S. Department of Energy on November 15, 21
2016. Manitoba Hydro filed an Application to construct and operate an 22
international power line for the Manitoba – Minnesota Transmission project with 23
the National Energy Board on December 16, 2016. 24
25
The Manitoba Hydro-Electric Board (MHEB) approved a revised estimate for the 26
Manitoba - Minnesota Transmission Project from $354 million to $453 million to 27
reflect updated costs for transmission line construction, licensing, and 28
environmental assessment work, station improvements and contingency including 29
management reserve and funding for Indigenous opportunities. 30
31
Tab 5 Page 25 of 28 May 12, 2017
5.2.2 Business Operations Capital 1
Expenditures for Electric Business Operations capital total $5 549 million over the 10 2
year forecast period to 2027. Figure 5.10 provides a breakdown of the forecast by 3
investment category over the 10 year period. Of the $5 549 million, $3 062 million is 4
for System Renewal (e.g. HVDC Transformer Replacement program), $890 million to 5
address System Load Capacity on the transmission and distribution systems (e.g. 6
Dawson Road Station) and a further $451 million is required for Customer 7
Connections (residential, commercial and industrial). 8
9
Figure 5.10 Electric Business Operations Capital 10 Year Forecast by Investment 10
Category 11
12 Figure 5.11 provides the annual forecast by investment category over the test year 13
period (2016/17 to 2018/19) as well as the cumulative forecast over the 10 years to 14
2027. 15
16
Tab 5 Page 26 of 28 May 12, 2017
Figure 5.11 Electric Business Operations Capital by Investment Category 1
2
3
Figure 5.12 provides a breakdown by major asset type (i.e. generation, transmission, 4
distribution and corporate assets) within each of the primary investment categories. 5
6
Figure 5.12 Electric Business Operations Capital by Investment Category 7
8
($ Millions)
2017
Outlook2018 2019
2018-2027
10 Year Total
Capacity & Growth
System Load Capacity 159 144 128 890
Customer Connections - Residential, Commercial & Industrial 37 40 43 454
Grid Interconnections - Independent Power Producer (0) (0) (0) (3)
Total Capacity & Growth- Electric 195 183 170 1 341
Sustainment
System Renewal 225 217 230 3 062
Mandated Compliance 56 39 37 302
System Efficiency 22 23 17 178
Decommissioning 0 0 0 6
Total Sustainment- Electric 303 280 284 3 549
Business Operations Support
Information Technology 25 27 27 263
Fleet 17 15 15 157
Corporate Facilities 25 12 12 138
Tools and Equipment 5 5 5 52
Town site Infrastructure 3 4 1 16
Generation Buildings and Grounds - - 1 32
Total Business Operations Support- Electric 75 63 62 659
Unallocated Year End Outlook Adjustment -Electric (45) - - -
Total Unallocated Target Adjustment- Electric (45) - - -
Total Electric Business Operations Capital 529 526 517 5 549
Tab 5 Page 27 of 28 May 12, 2017
Business Operations capital targets have decreased by $237 million over the same 1
10 year period as compared to CEF15 reflecting projected labour and sourcing 2
savings identified as part of the plan to improve the corporation’s financial position. 3
Figure 5.13 provides the annual cost flow changes between CEF16 and CEF15. 4
5
Figure 5.13 Change in Cost Flow from CEF15 to CEF16 6
7 8
5.2.3 Demand Side Management 9
Manitoba Hydro’s Electric DSM Program targets the achievement of 945 MW and 10
3,271 GW.h of savings over the next 10 years based upon a capital investment of 11
$752 million dollars and will be relied upon to meet approximately 90% of projected 12
load growth during this period. This is a reduction of $90 million as compared to 13
CEF15. 14
15
Figure 5.14 Change in Cost Flow from CEF15 to CEF16 16
17
18
Figure 5.15 provides an explanation of the major changes over the 10 year forecast 19
period associated with the updated DSM plan. 20
21
Electric Business
Operations Capital
($ Millions)
2017
Outlook 2018 2019 2020 2021 2022 2023 2024 2025 2026 2027
2018-2027
10 Year
Total
CEF15 610 547 547 548 573 555 563 571 621 624 637 5,786
Incr (Decr) (81) (22) (31) (32) (61) (55) (42) (27) (6) 16 22 (237)
CEF16 529 526 517 516 511 499 521 544 616 640 659 5,549
Electric Only
($ Millions)
2017
Outlook 2018 2019 2020 2021 2022 2023 2024 2025 2026 2027
2018-2027
10 Year
Total
CEF15 Demand Side Management 58 99 95 90 92 97 72 67 71 77 82 842
Incr (Decr) (8) (43) 5 4 (4) (10) (6) (7) (9) (10) (11) (90)
CEF16 Demand Side Management 50 56 99 94 89 87 67 60 62 67 71 752
Tab 5 Page 28 of 28 May 12, 2017
Figure 5.15 DSM 10 Year Cost Flow Update 1
2 3
The DSM Program targets a 814 MW reduction in peak load and a 3,527 GWh 4
reduction in annual energy consumption by 2030/31, which is similar to 2015 5
projections, which included 824 MW and 3,498 GWh achieved by 2029/30. 6
Incremental DSM excludes savings already achieved to date, savings achieved 7
through codes and standards which are included in the Load Forecast, and savings 8
from curtailable rates programming beyond existing contracts that do not qualify as 9
winter peak capacity as these are short-term resources. 10


![TECHNOLOGY ASSESSMENT AND FORECAST … ASSESSMENT AND FORECAST REPORT U.S. COLLEGES AND UNIVERSITIES--UTILITY PATENT GRANTS 1969-1999 [EXCERPT--ATTACHMENT 'A' AND TAB 'C' ONLY] September](https://static.documents.pub/doc/80x56/5b18db747f8b9a28258c1726/technology-assessment-and-forecast-assessment-and-forecast-report-us-colleges.jpg)


