Page 1
C A R 48,166 3,773 3,418 7,191 14.93 3,555 3,234 6,789 14.10 155 109 264 0.55
Abra 6,610 412 341 753 11.39 329 296 625 2.00 45 35 80 1.21Apayao 3,320 266 256 522 15.72 234 216 450 8.00 22 21 43 1.30Benguet 12,673 757 647 1,404 11.08 743 625 1,368 5.00 15 6 21 0.17Ifugao 5,659 403 337 740 13.08 287 244 531 6.00 28 27 55 0.97Kalinga 5,915 417 344 761 12.87 462 370 832 9.00 29 11 40 0.68Mt. Province 4,180 247 272 519 12.42 233 264 497 12.00 12 6 18 0.43
Baguio City 9,808 1,271 1,221 2,492 25.41 1,267 1,219 2,486 23.00 4 3 7 0.07
%
Table 2D.2 - CHILD CAREChildren Given BCG and Hepatitis B1 Vaccines by Region, Province and City
2018 Quarterly Report, Philippines
Second Quarter
BCG Hepa B1 (w/in 24 Hrs.) after birth Hepa B1 (> 24 Hrs.) after birth
Male Total % Male Female Total
E.Pop
(Total Pop
x 2.7%)
AreaFemale Total % Male Female
Page 2
Second Quarter
Male Female Total % Male Female Total % Male Female Total %
C A R 48,166 3,615 3,291 6,906 14.34 3,827 3,374 7,201 14.95 3,960 3,615 7,575 15.73
Abra 6,610 437 374 811 12.27 453 395 848 12.83 511 459 970 14.68Apayao 3,320 272 231 503 15.15 305 241 546 16.44 330 259 589 17.74Benguet 12,673 825 788 1,613 12.73 905 809 1,714 13.53 882 886 1,768 13.95Ifugao 5,659 403 347 750 13.25 430 342 772 13.64 420 389 809 14.29Kalinga 5,915 523 434 957 16.18 517 437 954 16.13 586 480 1066 18.02Mt. Province 4,180 273 270 543 12.99 286 276 562 13.45 327 294 621 14.86
Baguio City 9,808 882 847 1729 17.63 931 874 1805 18.40 904 848 1752 17.86
Table 2D.3 - Expanded Program on ImmunizationChildren Given Pentavalent Vaccines by Region, Province and City
2018 Quarterly Report, Philippines
Area
Elig. Pop.
(Total Pop.
X 2.7%)
Pentavalent 1 Pentavalent 2 Pentavalent 3
Page 3
Second Quarter
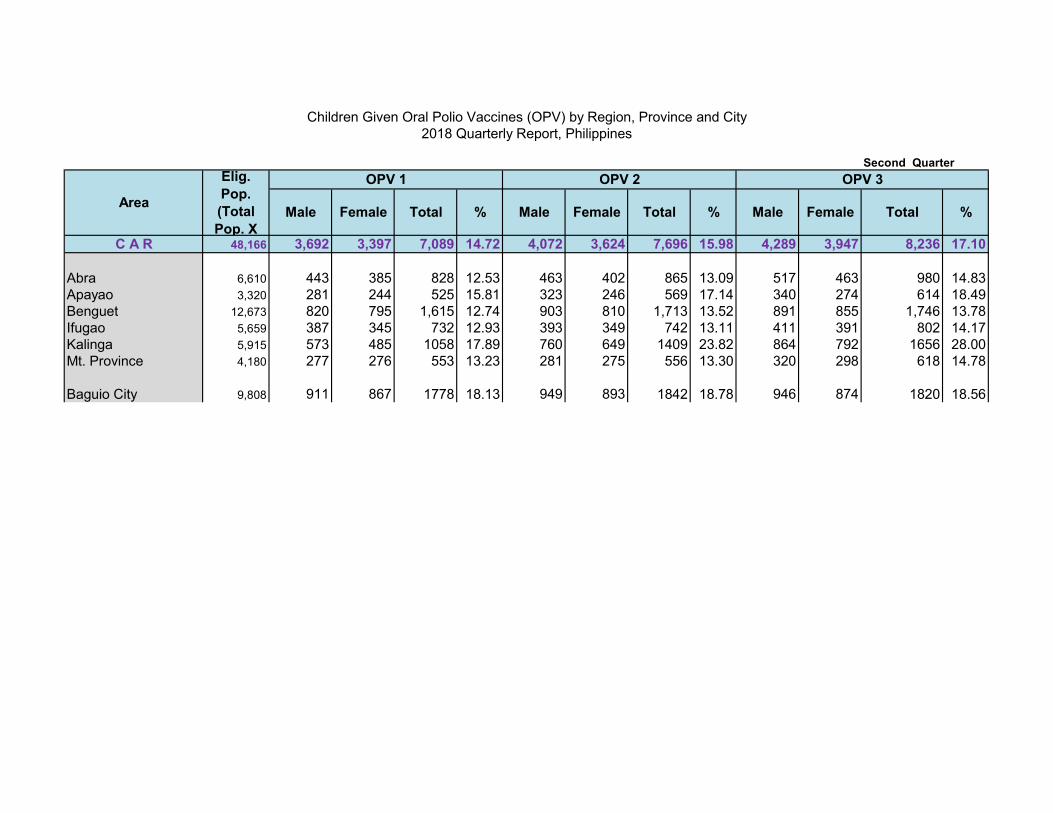
C A R 48,166 3,692 3,397 7,089 14.72 4,072 3,624 7,696 15.98 4,289 3,947 8,236 17.10
Abra 6,610 443 385 828 12.53 463 402 865 13.09 517 463 980 14.83Apayao 3,320 281 244 525 15.81 323 246 569 17.14 340 274 614 18.49Benguet 12,673 820 795 1,615 12.74 903 810 1,713 13.52 891 855 1,746 13.78Ifugao 5,659 387 345 732 12.93 393 349 742 13.11 411 391 802 14.17Kalinga 5,915 573 485 1058 17.89 760 649 1409 23.82 864 792 1656 28.00Mt. Province 4,180 277 276 553 13.23 281 275 556 13.30 320 298 618 14.78
Baguio City 9,808 911 867 1778 18.13 949 893 1842 18.78 946 874 1820 18.56
Total %Total % Male Female Total %
Children Given Oral Polio Vaccines (OPV) by Region, Province and City2018 Quarterly Report, Philippines
Area
Elig.
Pop.
(Total
Pop. X
OPV 1 OPV 2 OPV 3
Male Female Male Female
Page 4
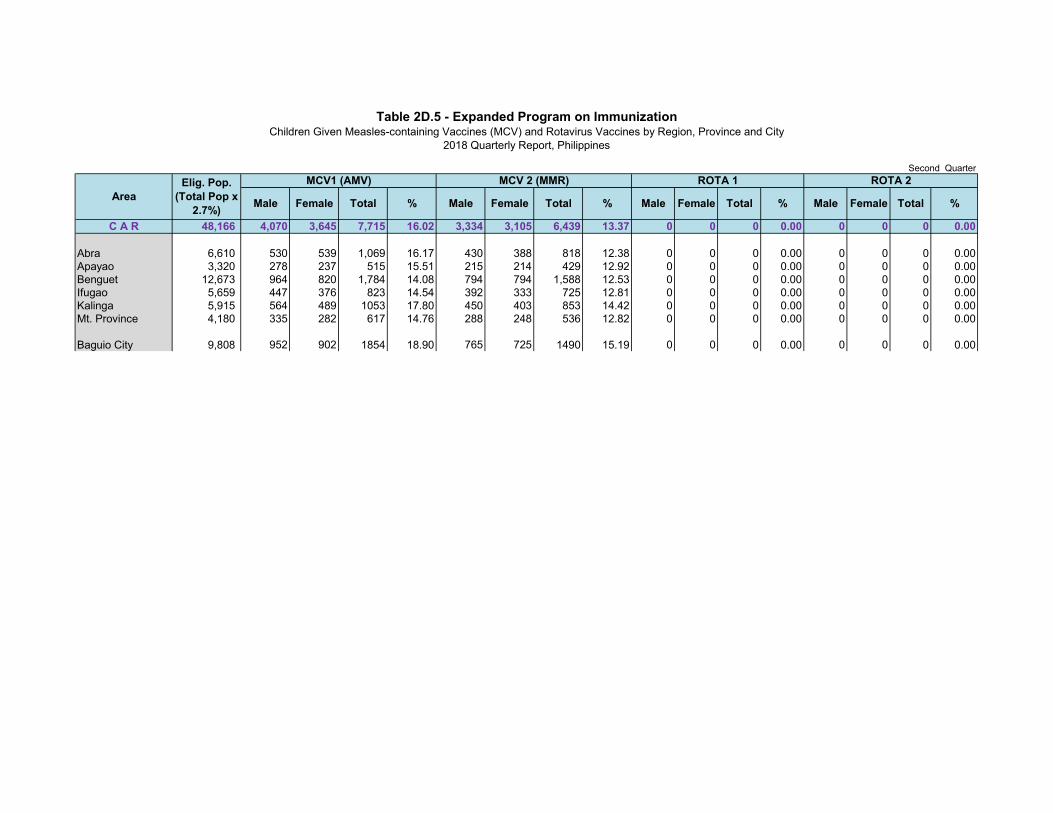
C A R 48,166 4,070 3,645 7,715 16.02 3,334 3,105 6,439 13.37 0 0 0 0.00 0 0 0 0.00
Abra 6,610 530 539 1,069 16.17 430 388 818 12.38 0 0 0 0.00 0 0 0 0.00Apayao 3,320 278 237 515 15.51 215 214 429 12.92 0 0 0 0.00 0 0 0 0.00Benguet 12,673 964 820 1,784 14.08 794 794 1,588 12.53 0 0 0 0.00 0 0 0 0.00Ifugao 5,659 447 376 823 14.54 392 333 725 12.81 0 0 0 0.00 0 0 0 0.00Kalinga 5,915 564 489 1053 17.80 450 403 853 14.42 0 0 0 0.00 0 0 0 0.00Mt. Province 4,180 335 282 617 14.76 288 248 536 12.82 0 0 0 0.00 0 0 0 0.00
Baguio City 9,808 952 902 1854 18.90 765 725 1490 15.19 0 0 0 0.00 0 0 0 0.00
Female
Table 2D.5 - Expanded Program on ImmunizationChildren Given Measles-containing Vaccines (MCV) and Rotavirus Vaccines by Region, Province and City
2018 Quarterly Report, Philippines
Second Quarter
Area
Elig. Pop.
(Total Pop x
2.7%)
MCV1 (AMV) MCV 2 (MMR) ROTA 1 ROTA 2
Male Female Total % Male Male Female Total %Total % Male Female Total %
Page 5
Second Quarter
C A R 48,166 3,994 3,606 7,600 15.78 4,475 3,905 8,380 17.40 4,555 4,244 8,799 18.27
Abra 6,610 440 378 818 12.38 469 404 873 13.21 532 467 999 15.11Apayao 3,320 278 241 519 15.63 340 269 609 18.34 374 299 673 20.27Benguet 12,673 984 903 1,887 14.89 1,112 902 2,014 15.89 1,138 1,082 2,220 17.52Ifugao 5,659 441 383 824 14.56 451 399 850 15.02 460 506 966 17.07Kalinga 5,915 646 561 1207 20.41 793 728 1521 25.71 724 621 1345 22.74Mt. Province 4,180 306 280 586 14.02 313 271 584 13.97 330 296 626 14.98
Baguio City 9,808 899 860 1759 17.93 997 932 1929 19.67 997 973 1970 20.08
Total %Total % Male Female Total %
Tabele 2D.6 - Expanded Program on ImmunizationInfants Given Pneumococcal Conjugate Vaccines (PCV) by Region, Province and City
Philippines, 2018
AreaElig. Pop. (Total
Pop. X 2.7%)
PCV 1 PCV 2 PCV 3
Male Female Male Female
Page 6
Second Quarter
C A R 48,166 3,979 3,538 7,517 15.61 346 274 620 1.29 2,518 2,300 4,818 62.37 7,735
Abra 6,610 519 518 1,037 15.69 141 112 253 3.83 238 252 490 65.51
Apayao 3,320 277 238 515 15.51 6 3 9 0.27 191 169 360 51.21
Benguet 12,673 950 812 1,762 13.90 103 75 178 1.40 771 703 1,474 100.27
Ifugao 5,659 429 369 798 14.10 32 28 60 1.06 373 296 669 93.70
Kalinga 5,915 565 487 1052 17.79 38 22 60 1.01 377 285 662 76.71
Mt. Province 4,180 333 278 611 14.62 2 4 6 0.14 245 268 513 70.56
Baguio City 9,808 906 836 1742 17.76 24 30 54 0.55 323 327 650 26.00
748
703
1,478
716
863
727
2,500
% Male Female Total %Total
Table 2D.1 - Expanded Program on ImmunizationFully and Completely Immunized Children and Children Protected at Birth by Region, Province and City
Philippines, Quarterly Report 2018
Area
Eligible
Pop.
(Total
Pop. X
Fully Immunized Children Completely Immunized Children Children Protected at BirthLive
birthsMale Female Total % Male Female
Page 7
Second Quarter
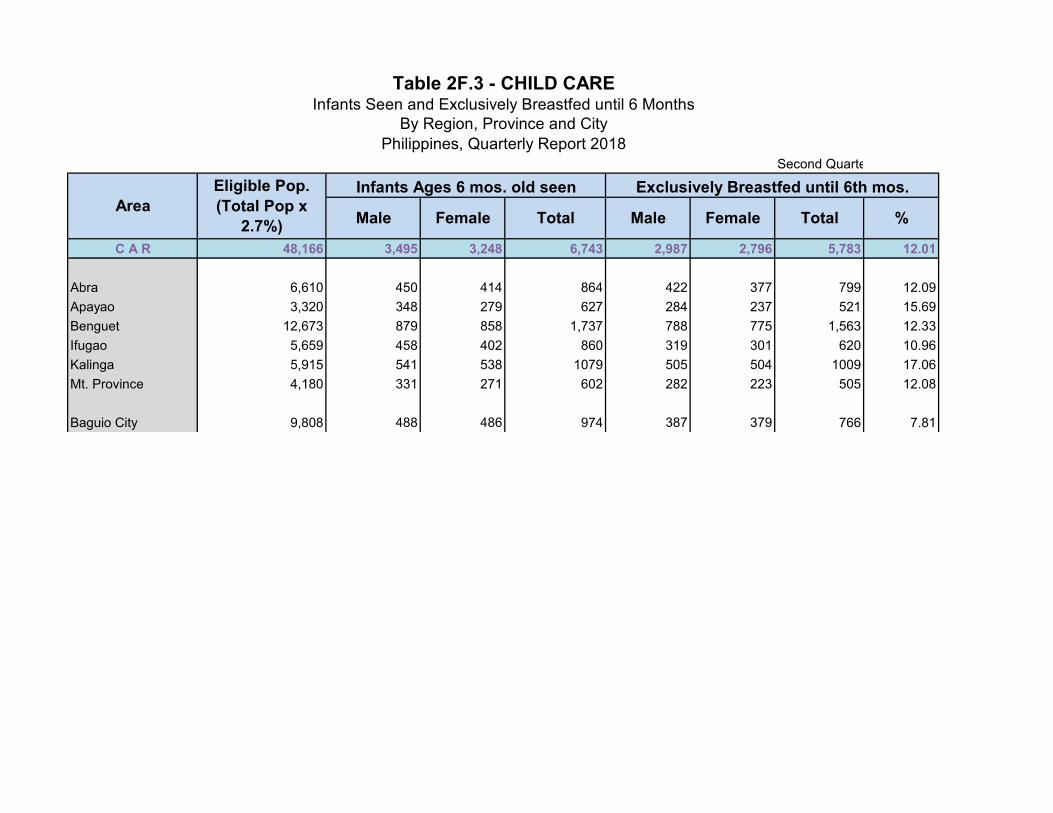
C A R 48,166 3,495 3,248 6,743 2,987 2,796 5,783 12.01
Abra 6,610 450 414 864 422 377 799 12.09
Apayao 3,320 348 279 627 284 237 521 15.69
Benguet 12,673 879 858 1,737 788 775 1,563 12.33
Ifugao 5,659 458 402 860 319 301 620 10.96
Kalinga 5,915 541 538 1079 505 504 1009 17.06
Mt. Province 4,180 331 271 602 282 223 505 12.08
Baguio City 9,808 488 486 974 387 379 766 7.81
Table 2F.3 - CHILD CAREInfants Seen and Exclusively Breastfed until 6 Months
By Region, Province and City
Philippines, Quarterly Report 2018
Area
Eligible Pop.
(Total Pop x
2.7%)
Infants Ages 6 mos. old seen Exclusively Breastfed until 6th mos.
Male Female Total Male Female Total %
Page 8
Second Quarter
Male Female Total Male Female TotalC A R 7,725 3,155 2,859 6,014 77.85 570 456 1,026 3,069 2,902 5,971
Abra 748 436 386 822 109.89 9 4 13 401 345 746
Apayao 703 337 262 599 85.21 12 10 22 106 104 210
Benguet 1,470 830 750 1,580 107.48 98 82 180 501 441 942
Ifugao 714 326 308 634 88.80 401 319 720 356 293 649
Kalinga 863 482 487 969 112.28 41 37 78 289 235 524
Mt. Province 727 291 237 528 72.63 8 3 11 236 265 501
Baguio City 2,500 453 429 882 35.28 1 1 2 1,180 1,219 2399
Tabe 2F.4 - CHILD CAREInfants 6-8 mos. old Received Solid Food and Newborn Referred/Done for Screening
By Region, Province and City
Philippines, Quarterly Report 2018
Area Live births
Infants 6-8 mos. old Received Solid
Food Newborn for Screening
Male Female Total % Referred Done
Page 9
Second Quarter
Male Female Total % Male Female Total %
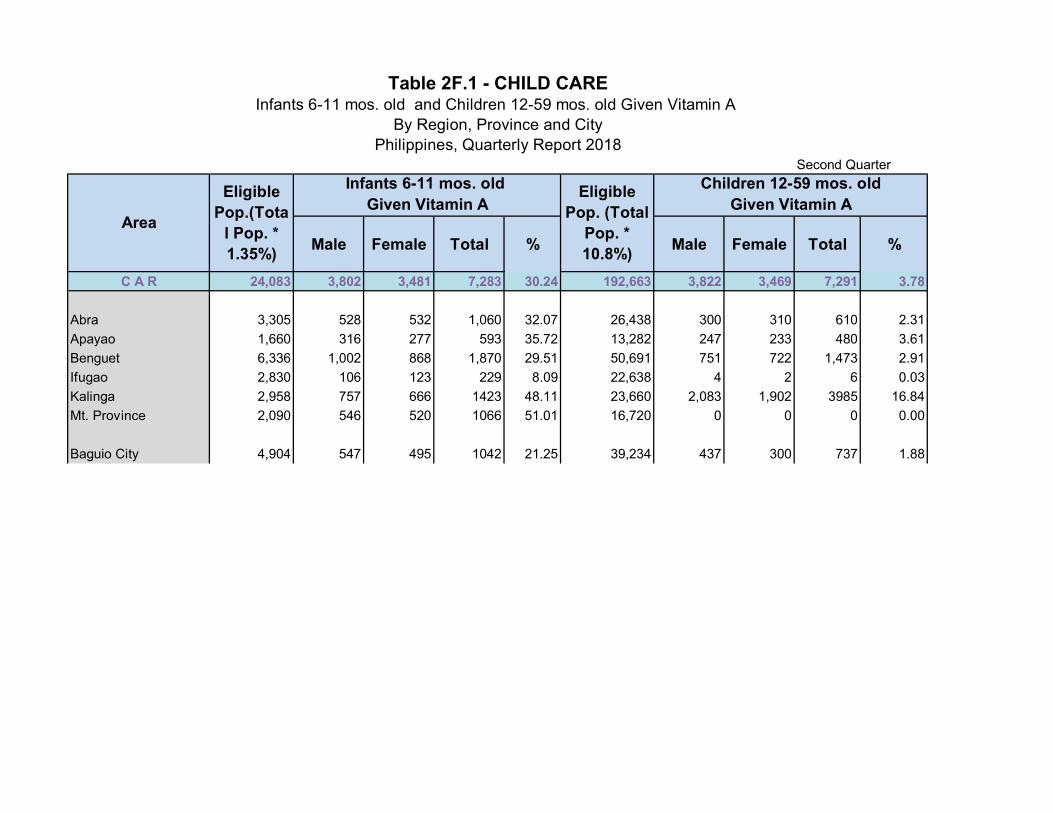
C A R 24,083 3,802 3,481 7,283 30.24 192,663 3,822 3,469 7,291 3.78
Abra 3,305 528 532 1,060 32.07 26,438 300 310 610 2.31
Apayao 1,660 316 277 593 35.72 13,282 247 233 480 3.61
Benguet 6,336 1,002 868 1,870 29.51 50,691 751 722 1,473 2.91
Ifugao 2,830 106 123 229 8.09 22,638 4 2 6 0.03
Kalinga 2,958 757 666 1423 48.11 23,660 2,083 1,902 3985 16.84
Mt. Province 2,090 546 520 1066 51.01 16,720 0 0 0 0.00
Baguio City 4,904 547 495 1042 21.25 39,234 437 300 737 1.88
Given Vitamin A
Table 2F.1 - CHILD CAREInfants 6-11 mos. old and Children 12-59 mos. old Given Vitamin A
By Region, Province and City
Philippines, Quarterly Report 2018
Area
Eligible
Pop.(Tota
l Pop. *
1.35%)
Infants 6-11 mos. old Eligible
Pop. (Total
Pop. *
10.8%)
Children 12-59 mos. old
Given Vitamin A
Page 10
Second Quarter
C A R 24,083 615 601 1,216 5.05 193,544 1,703 1,661 3,364 1.74
Abra 3,305 79 86 165 4.99 27,124 677 677 1,354 4.99
Apayao 1,660 54 58 112 6.75 13,298 150 139 289 2.17
Benguet 6,336 120 119 239 3.77 49,284 339 300 639 1.30
Ifugao 2,830 23 14 37 1.31 22,828 29 36 65 0.28
Kalinga 2,958 153 144 297 10.04 23,788 352 312 664 2.79
Mt. Province 2,090 5 4 9 0.43 17,582 17 14 31 0.18
Baguio City 4,904 181 176 357 7.28 39,642 139 183 322 0.81
Children and Infants Given Iron by Region, Province and CityPhilippines, Quarterly Report 2018
Area
Male Female Total %
Eligible
Pop.
(Total
Pop. X
Eligible
Pop.
(Total
Pop. X Male Female Total %
Infants 6-11 mos. old Given Iron Children 12-59 mos. old Given Iron
Page 11
Second Quarter
C A R 73 74 147 59 61 120 81.63 287 279 566 237 219 456 80.57
Abra 23 22 45 19 19 38 84.44 129 109 238 126 107 233 97.90
Apayao 3 3 6 2 3 5 83.33 8 10 18 5 6 11 61.11
Benguet 5 9 14 5 9 14 100.00 17 18 35 17 17 34 97.14
Ifugao 20 24 44 12 17 29 65.91 64 56 120 39 31 70 58.33
Kalinga 18 11 29 17 8 25 86.21 61 77 138 43 49 92 66.67
Mt. Province 0 1 1 0 1 1 100.00 1 0 1 0 0 0 0.00
Baguio City 4 4 8 4 4 8 100.00 7 9 16 7 9 16 100.00
TotalMale Female Total Male Female
Table 2F.2 - CHILD CARESick Infants and Children Given Vitamin A by Region, Province and City
Philippines, 2018
Area Sick Infants 6-11 mos. Sick Infants 6-11 mos. old Given Children 12-59 mos. old Children 12-59 mos. old Given
Male Female %Total Male Female Total %
Page 12
Second Quarter
C A R 24,083 838 832 1,670 6.93 1,444 1,432 2,876 11.94 192,663 1,599 1,501 3,100 1.61
Abra 3,305 94 106 200 6.05 313 271 584 17.67 26,438 7 1 8 0.03
Apayao 1,660 57 57 114 6.87 106 107 213 12.83 13,282 9 7 16 0.12
Benguet 6,336 224 196 420 6.63 298 310 608 9.60 50,691 771 740 1,511 2.98
Ifugao 2,830 32 41 73 2.58 101 108 209 7.39 22,638 2 5 7 0.03
Kalinga 2,958 84 90 174 5.88 252 256 508 17.18 23,660 150 154 304 1.28
Mt. Province 2,090 83 82 165 7.89 126 135 261 12.49 16,720 0 0 0 0.00
Baguio City 4,904 264 260 524 10.68 248 245 493 10.05 39,234 660 594 1254 3.20
TotalFemale Total % Male Female
Table 2F.6 - CHILD CAREInfants and Children Who Received Micronutrient Powder (MNP) and were Given Deworming Tablets/Syrup
By Region, Province and City
Philippines, Quarterly Report 2018
Area
Eligible
Pop. (Total
Pop *
1.35%)
Infants Ages 6-11 mos.
Received MNP
Children Ages 12-23 mos.
Received MNP
Eligible
Pop. (Total
Pop. *
10.8%)
Children 12-59 mos. old Given
Deworming Tablets/Syrup
%Male Female Total % Male
Page 13
Second Quarter
Male Female Total Male Female Total % Male Female Total Male Female Total %C A R 43 40 83 38 36 74 89.16 744 529 1,273 701 507 1,208 94.89
Abra 3 3 6 0 2 2 33.33 65 48 113 65 48 113 100.00
Apayao 1 2 3 0 2 2 66.67 134 89 223 95 67 162 72.65
Benguet 8 7 15 8 4 12 80.00 144 111 255 144 111 255 100.00
Ifugao 2 2 4 2 2 4 100.00 118 88 206 118 88 206 100.00
Kalinga 18 13 31 18 13 31 100.00 79 55 134 75 55 130 97.01
Mt. Province 4 2 6 3 2 5 83.33 113 74 187 113 74 187 100.00
Baguio City 7 11 18 7 11 18 100.00 91 64 155 91 64 155 100.00
Seen Given Full Dose of Iron No. of Cases Completed Treatment
Table 2A.2 - CHILD CAREInfants Ages 2-5 mos. with Low Birth Weight and Children Ages 0-59 mos. with Pneumonia
By Region, Province and City
AreaInfants 2-5 mos. old with Low Birth Weight Children 0-59 mos. old with Pneumonia
Philippines, Quarterly Report 2018
Page 14
Second Quarter
Male Female Total Male Female Total % Male Female Total Male Female Total %C A R 43 36 79 41 32 73 92.41 63 67 130 61 62 123 94.62
Abra 11 16 27 11 16 27 100.00 27 34 61 27 34 61 100.00
Apayao 1 2 3 0 0 0 0.00 0 2 2 1 0 1 50.00
Benguet 2 1 3 2 1 3 100.00 5 6 11 3 5 8 72.73
Ifugao 3 3 6 3 2 5 83.33 8 7 15 8 7 15 100.00
Kalinga 24 13 37 23 12 35 94.59 20 17 37 19 15 34 91.89
Mt. Province 1 0 1 1 0 1 100.00 3 1 4 3 1 4 100.00
Baguio City 1 1 2 1 1 2 100.00 0 0 0 0 0 0 0.00
Give Iron
Table 2F.7 - CHILD CAREAnemic Infants Ages 6-11 mos. and Children Ages 12-59 mos. Given Iron
By Region, Province and CityPhilippines, Quarterly Report 2018
AreaAnemic Infants 6-11 months old Children 12-59 months old
Seen Given Iron Seen
Page 15
Second Quarter
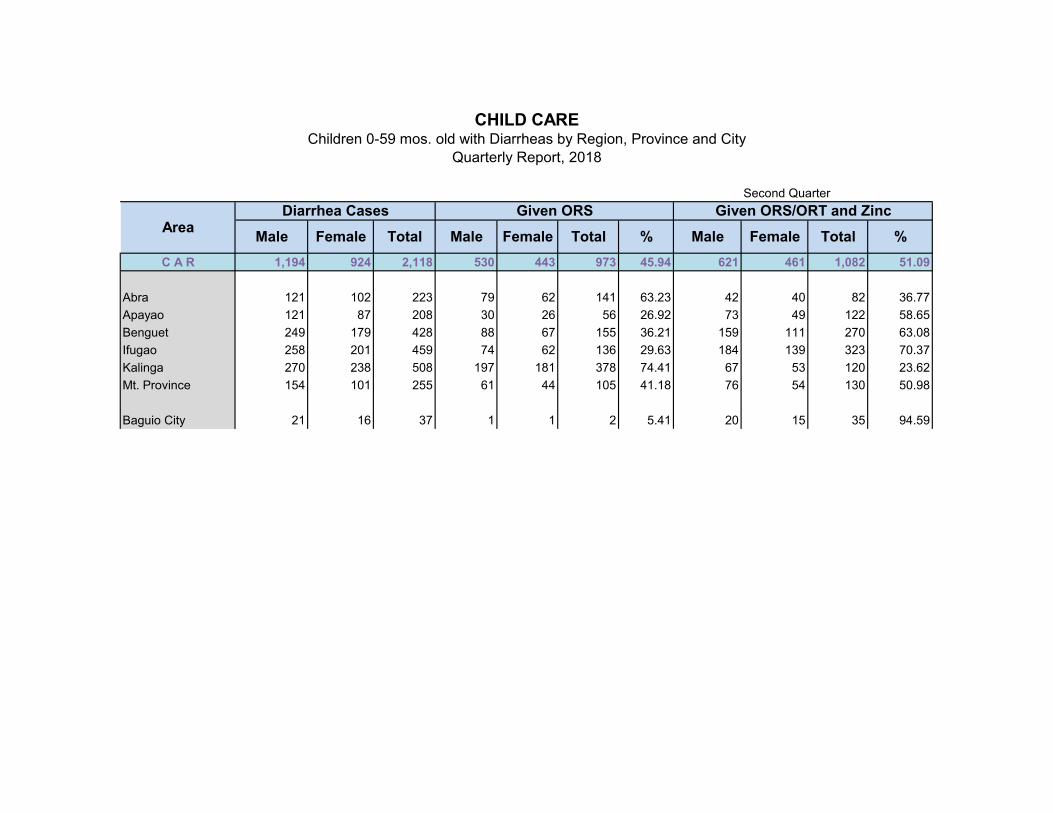
C A R 1,194 924 2,118 530 443 973 45.94 621 461 1,082 51.09
Abra 121 102 223 79 62 141 63.23 42 40 82 36.77
Apayao 121 87 208 30 26 56 26.92 73 49 122 58.65
Benguet 249 179 428 88 67 155 36.21 159 111 270 63.08
Ifugao 258 201 459 74 62 136 29.63 184 139 323 70.37
Kalinga 270 238 508 197 181 378 74.41 67 53 120 23.62
Mt. Province 154 101 255 61 44 105 41.18 76 54 130 50.98
Baguio City 21 16 37 1 1 2 5.41 20 15 35 94.59
Male Female Total %Area
Male Female Total Male Female Total %
CHILD CAREChildren 0-59 mos. old with Diarrheas by Region, Province and City
Quarterly Report, 2018
Diarrhea Cases Given ORS Given ORS/ORT and Zinc
Page 16
Second Quarter
C A R 240,828 3,480 3,906 7,386 3.07 6,217 8,513 14,730 6.12 535,174 13,026 16,792 29,818 5.57
Abra 33,048 211 216 427 1.29 462 412 874 2.64 73,440 331 502 833 1.13
Apayao 16,602 108 126 234 1.41 208 228 436 2.63 36,893 350 544 894 2.42
Benguet 63,364 2,482 2,812 5,294 8.35 4,370 6,573 10,943 17.27 140,808 10,541 12,828 23,369 16.60
Ifugao 28,297 51 66 117 0.41 265 292 557 1.97 62,883 249 542 791 1.26
Kalinga 29,575 542 550 1,092 3.69 643 663 1,306 4.42 65,723 594 978 1,572 2.39
Mt. Province 20,900 47 63 110 0.53 122 143 265 1.27 46,444 234 470 704 1.52
Baguio City 49,042 39 73 112 0.23 147 202 349 0.71 108,982 727 928 1,655 1.52
Area
Eligible Pop.
(Total Pop x
13.5%)
Orally fit Children (12-71 mos.) Children (12-71 mos.) Given BOHCEligible
Pop. (Total
Pop x 30%)
Table 2B.1 - DENTAL CAREOrally Fit Children, Adolescents and Youth Given Basic Oral Health Care (BOHC)
By Region, Province and CityPhilippines, Quarterly Report 2018
Female Total %
Adolescents and Youth (10-24 yrs.
old) Given BOHC
Male Female Total % Male Female Total % Male
Page 17
Second Quarter
C A R 48,166 8,165 16.95 123,653 4,346 4,958 9,304 7.52
Abra 6,610 845 12.78 17,329 135 204 339 1.96
Apayao 3,320 262 7.89 8,496 177 280 457 5.38
Benguet 12,673 5,799 45.76 31,487 3,487 3,712 7,199 22.86
Ifugao 5,659 111 1.96 14,585 102 169 271 1.86
Kalinga 5,915 536 9.06 15,198 259 327 586 3.86
Mt. Province 4,180 173 4.14 11,233 74 127 201 1.79
Baguio City 9,808 439 4.48 25,327 112 139 251 0.99
Male Female Total %
Table 2B.2 - DENTAL CAREPregnant Women and Older Persons Provided with BOHC by Region, Province and City
Philippines, 2018
Area
Eligible
Pop. (Total
Pop x
2.7%)
Pregnant Women Eligible
Pop.(Total
Pop x 6.9%)
Older Persons (60 yrs. and above)
No. %
Page 18
Total
Area CurrentUsers No. % No. % No. % No. % No. % No. % No. % No. % No. % No. % No. % No. %
C A R 123,146 30,768 24.98 222 0.18 36,818 29.90 10,357 8.41 21,045 17.09 4,674 3.80 83 0.07 38 0.03 2,951 2.40 9,246 7.51 4,882 3.96 2,062 1.67
Abra 19,995 5,804 29.03 31 0.16 8,119 40.61 131 0.66 2,733 13.67 142 0.71 13 0.07 1 0.01 145 0.73 2,378 11.89 437 2.19 61 0.31Apayao 11,547 1,963 17.00 9 0.08 5,556 48.12 401 3.47 2,221 19.23 1 0.01 -1 -0.01 0 0.00 14 0.12 1,155 10.00 169 1.46 59 0.51Benguet 26,165 7,220 27.59 26 0.10 6,985 26.70 2,714 10.37 4,342 16.59 44 0.17 41 0.16 4 0.02 746 2.85 1,744 6.67 1,959 7.49 340 1.30Ifugao 16,886 3,308 19.59 118 0.70 4,988 29.54 1,019 6.03 3,066 18.16 738 4.37 1 0.01 0 0.00 883 5.23 1,485 8.79 527 3.12 753 4.46
Kalinga 20,012 3,456 17.27 9 0.04 5,548 27.72 1,613 8.06 3,106 15.52 3,509 17.53 29 0.14 33 0.16 537 2.68 1,427 7.13 559 2.79 186 0.93Mountain Province 11,396 4,238 37.19 7 0.06 2,750 24.13 560 4.91 1,676 14.71 236 2.07 0 0.00 0 0.00 500 4.39 796 6.98 507 4.45 126 1.11
Baguio City 17,145 4,779 27.87 22 0.13 2,872 16.75 3,919 22.86 3,901 22.75 4 0.02 0 0.00 0 0.00 126 0.73 261 1.52 724 4.22 537 3.13
NFP-LAM Condom ImplantMale Ster/
Pills IUD Injectables NFP-STM NFP-SDMNFP-CM NFP-BBTSter/BTL Vasectomy
FAMILY PLANNING2018 - Quarterly Reports
Current Users (Beginning of the Quarter)
Second QuarterFemale
Page 19
Total
Area CurrentUsers No. % No. % No. % No. % No. % No. % No. % No. % No. % No. % No. % No. %
C A R 123,697 31,873 25.77 220 0.18 37,695 30.47 10,577 8.55 21,200 17.14 2,218 1.79 87 0.07 38 0.03 3,143 2.54 8,630 6.98 5,257 4.25 2,759 2.23 56.26
Abra 20,946 6,216 29.68 31 0.15 8,388 40.05 131 0.63 2,853 13.62 140 0.67 29 0.14 2 0.01 131 0.63 2,239 10.69 493 2.35 293 1.40 69.42
Apayao 11,528 1,988 17.24 9 0.08 5,710 49.53 402 3.49 2,181 18.92 0 0.00 -1 -0.01 0 0.00 21 0.18 1,037 9.00 161 1.40 20 0.17 76.06Benguet 27,138 7,498 27.63 21 0.08 7,272 26.80 2,767 10.20 4,388 16.17 34 0.13 29 0.11 1 0.00 823 3.03 1,537 5.66 2,233 8.23 535 1.97 46.91Ifugao 17,353 3,376 19.45 119 0.69 5,055 29.13 1,035 5.96 3,121 17.99 724 4.17 1 0.01 0 0.00 954 5.50 1,485 8.56 529 3.05 954 5.50 67.17
Kalinga 17,255 3,502 20.30 10 0.06 5,494 31.84 1,620 9.39 3,062 17.75 1,082 6.27 28 0.16 35 0.20 538 3.12 1,212 7.02 506 2.93 166 0.96 63.90Mountain Province 11,486 4,296 37.40 7 0.06 2,838 24.71 549 4.78 1,685 14.67 234 2.04 0 0.00 0 0.00 534 4.65 678 5.90 536 4.67 129 1.12 60.20
Baguio City 17,991 4,997 27.77 23 0.13 2,938 16.33 4,073 22.64 3,910 21.73 4 0.02 1 0.01 0 0.00 142 0.79 442 2.46 799 4.44 662 3.68 40.18
NFP-LAM Condom ImplantCPR
FAMILY PLANNING2018 - Quarterly Reports
Current Users (End of the Quarter)
Second QuarterFemale
Ster/BTLPills NFP-SDMIUD
VasectomyMale Ster/
Injectables NFP-STMNFP-CM NFP-BBT
Page 20
Total
Area CurrentUsers No. % No. % No. % No. % No. % No. % No. % No. % No. % No. % No. % No. %
C A R 16,945 573 3.38 6 0.04 3,845 22.69 329 1.94 2,994 17.67 #### 15.58 29 0.17 4 0.02 255 1.50 5,014 29.59 783 4.62 473 2.79
Abra 1,507 52 3.45 0 0.00 405 26.87 12 0.80 177 11.75 3 0.20 0 0.00 0 0.00 51 3.38 722 47.91 85 5.64 0 0.00Apayao 1,314 47 3.58 0 0.00 422 32.12 17 1.29 306 23.29 1 0.08 0 0.00 0 0.00 18 1.37 424 32.27 40 3.04 39 2.97Benguet 3,713 250 6.73 6 0.16 719 19.36 118 3.18 593 15.97 21 0.57 27 0.73 4 0.11 70 1.89 1,486 40.02 229 6.17 190 5.12Ifugao 2,058 52 2.53 0 0.00 589 28.62 21 1.02 430 20.89 48 2.33 0 0.00 0 0.00 52 2.53 745 36.20 84 4.08 37 1.80
Kalinga 4,760 67 1.41 0 0.00 598 12.56 39 0.82 327 6.87 #### 53.70 2 0.04 0 0.00 19 0.40 949 19.94 141 2.96 62 1.30Mountain Province 1,525 85 5.57 0 0.00 420 27.54 35 2.30 340 22.30 11 0.72 0 0.00 0 0.00 42 2.75 510 33.44 59 3.87 23 1.51
Baguio City 2,068 20 0.97 0 0.00 692 33.46 87 4.21 821 39.70 0 0.00 0 0.00 0 0.00 3 0.15 178 8.61 145 7.01 122 5.90
NFP-CM NFP-BBTSter/BTL Vasectomy
FAMILY PLANNING2018 - Quarterly Reports
Dropout
Second QuarterFemale
NFP-LAM Condom ImplantMale Ster/
Pills IUD Injectables NFP-STM NFP-SDM
Page 21
Total
Area CurrentUsers No. % No. % No. % No. % No. % No. % No. % No. % No. % No. % No. % No. %
C A R 4,371 675 15.44 1 0.02 837 19.15 114 2.61 560 12.81 0 0.00 0 0.00 1 0.02 28 0.64 1,780 40.72 218 4.99 157 3.59
Abra 1,103 337 30.55 0 0.00 193 17.50 4 0.36 72 6.53 0 0.00 0 0.00 1 0.09 1 0.09 393 35.63 69 6.26 33 2.99Apayao 271 23 8.49 0 0.00 71 26.20 4 1.48 32 11.81 0 0.00 0 0.00 0 0.00 10 3.69 119 43.91 12 4.43 0 0.00Benguet 1,281 146 11.40 1 0.08 255 19.91 40 3.12 135 10.54 0 0.00 0 0.00 0 0.00 13 1.01 562 43.87 68 5.31 61 4.76Ifugao 230 0 0.00 0 0.00 4 1.74 0 0.00 6 2.61 0 0.00 0 0.00 0 0.00 0 0.00 214 93.04 4 1.74 2 0.87
Kalinga 464 38 8.19 0 0.00 111 23.92 0 0.00 39 8.41 0 0.00 0 0.00 0 0.00 1 0.22 247 53.23 18 3.88 10 2.16Mountain Province 208 0 0.00 0 0.00 39 18.75 1 0.48 24 11.54 0 0.00 0 0.00 0 0.00 2 0.96 133 63.94 9 4.33 0 0.00
Baguio City 814 131 16.09 0 0.00 164 20.15 65 7.99 252 30.96 0 0.00 0 0.00 0 0.00 1 0.12 112 13.76 38 4.67 51 6.27
NFP-LAM Condom ImplantMale Ster/
Pills IUD Injectables NFP-STM NFP-SDMNFP-CM NFP-BBTSter/BTL Vasectomy
FAMILY PLANNING2018 - Quarterly Reports
New Acceptor
Second QuarterFemale
Page 22
Total
Area CurrentUsers No. % No. % No. % No. % No. % No. % No. % No. % No. % No. % No. % No. %
C A R 13,125 1,003 7.64 3 0.02 3,885 29.60 435 3.31 2,589 19.73 184 1.40 33 0.25 3 0.02 419 3.19 2,618 19.95 940 7.16 1,013 7.72
Abra 1,355 127 9.37 0 0.00 481 35.50 8 0.59 225 16.61 1 0.07 16 1.18 0 0.00 36 2.66 190 14.02 72 5.31 199 14.69Apayao 1,024 49 4.79 0 0.00 505 49.32 14 1.37 234 22.85 0 0.00 0 0.00 0 0.00 15 1.46 187 18.26 20 1.95 0 0.00Benguet 3,405 382 11.22 0 0.00 751 22.06 131 3.85 504 14.80 11 0.32 15 0.44 1 0.03 134 3.94 717 21.06 435 12.78 324 9.52Ifugao 2,295 120 5.23 1 0.04 652 28.41 37 1.61 479 20.87 34 1.48 0 0.00 0 0.00 123 5.36 531 23.14 82 3.57 236 10.28
Kalinga 1,539 75 4.87 1 0.06 433 28.14 46 2.99 244 15.85 129 8.38 1 0.06 2 0.13 19 1.23 487 31.64 70 4.55 32 2.08Mountain Province 1,407 143 10.16 0 0.00 469 33.33 23 1.63 325 23.10 9 0.64 0 0.00 0 0.00 74 5.26 259 18.41 79 5.61 26 1.85
Baguio City 2,100 107 5.10 1 0.05 594 28.29 176 8.38 578 27.52 0 0.00 1 0.05 0 0.00 18 0.86 247 11.76 182 8.67 196 9.33
NFP-CM NFP-BBTSter/BTL Vasectomy
FAMILY PLANNING2018 - Quarterly Reports
Other Acceptor
Second QuarterFemale
NFP-LAM Condom ImplantMale Ster/
Pills IUD Injectables NFP-STM NFP-SDM
Page 23
Second Quarter
No. % No. % No. % No. %C A R 48,166 5,779 12.00 2,580 5.36 4,479 9.30 5,368 11.14
Abra 6,610 1,122 16.98 360 5.45 583 8.82 546 8.26
Apayao 3,320 380 11.44 190 5.72 362 10.90 383 11.53
Benguet 12,673 1,647 13.00 930 7.34 1,116 8.81 2,283 18.02
Ifugao 5,659 774 13.68 292 5.16 627 11.08 644 11.38
Kalinga 5,915 1,010 17.08 349 5.90 716 12.10 719 12.16
Mt. Province 4,180 412 9.86 176 4.21 390 9.33 383 9.16
Baguio City 9,808 434 4.42 283 2.89 685 6.98 410 4.18
Table 2G.1 - MATERNAL CARE PROGRAMNumber of Pregnant Women with 4 or more Prenatal Visits (PNV), Given 2 Doses of Tetanus Toxoid (TT),
Given TT2 plus and Given Complete Iron with Folic Acid (FA) by Province, City and RegionPHILIPPINES, Quarter Report 2018
Area
Eligible
Pop. (Pop
x 2.7%)
Preg. Women w/ 4
or more PNV
Preg. Women Given
2 doses of TT
Preg. Women Given
TT2 plus
Preg. Women Given
complete Iron w/ FA
Page 24
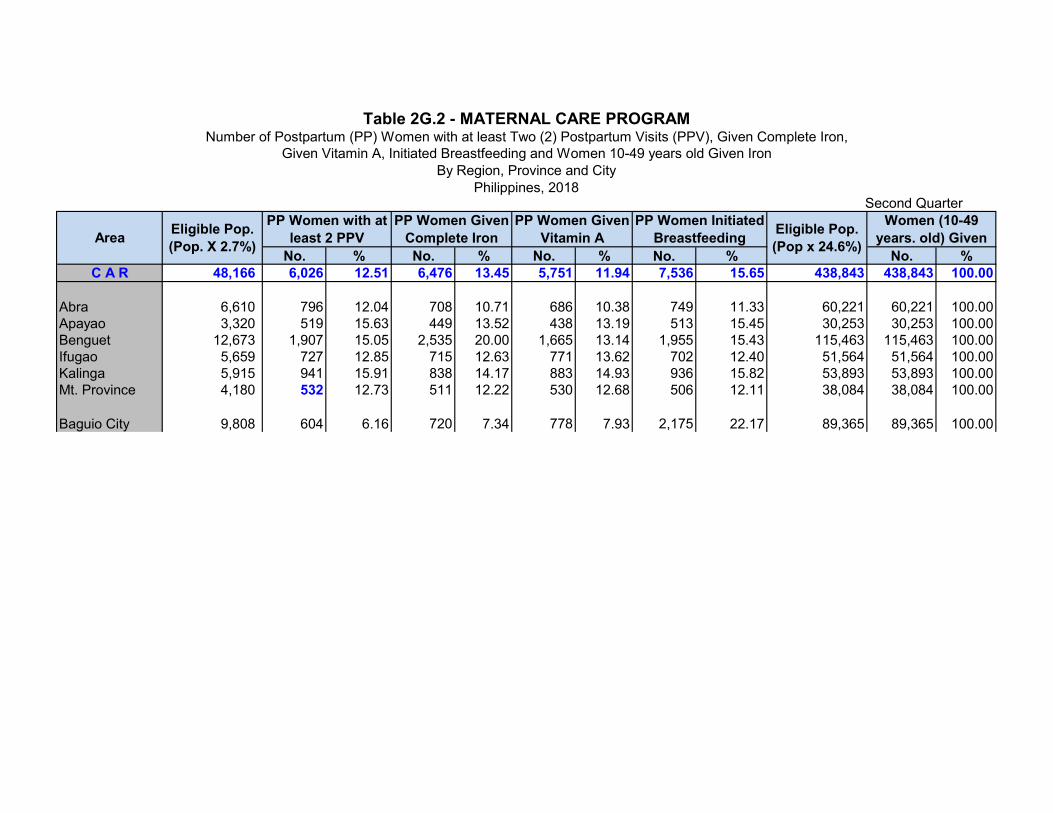
No. % No. % No. % No. % No. %C A R 48,166 6,026 12.51 6,476 13.45 5,751 11.94 7,536 15.65 438,843 438,843 100.00
Abra 6,610 796 12.04 708 10.71 686 10.38 749 11.33 60,221 60,221 100.00Apayao 3,320 519 15.63 449 13.52 438 13.19 513 15.45 30,253 30,253 100.00Benguet 12,673 1,907 15.05 2,535 20.00 1,665 13.14 1,955 15.43 115,463 115,463 100.00Ifugao 5,659 727 12.85 715 12.63 771 13.62 702 12.40 51,564 51,564 100.00Kalinga 5,915 941 15.91 838 14.17 883 14.93 936 15.82 53,893 53,893 100.00Mt. Province 4,180 532 12.73 511 12.22 530 12.68 506 12.11 38,084 38,084 100.00
Baguio City 9,808 604 6.16 720 7.34 778 7.93 2,175 22.17 89,365 89,365 100.00
PP Women Initiated
BreastfeedingEligible Pop.
(Pop x 24.6%)
Women (10-49
years. old) Given
Table 2G.2 - MATERNAL CARE PROGRAMNumber of Postpartum (PP) Women with at least Two (2) Postpartum Visits (PPV), Given Complete Iron,
Given Vitamin A, Initiated Breastfeeding and Women 10-49 years old Given IronBy Region, Province and City
Philippines, 2018 Second Quarter
AreaEligible Pop.
(Pop. X 2.7%)
PP Women with at
least 2 PPV
PP Women Given
Complete Iron
PP Women Given
Vitamin A
Page 25
Second Quarter
Male Female Total Male Female Total % Male Female Total % Male Female Total %
CAR 4,054 3,681 7,735 3,679 3,296 6,975 90.17 370 381 751 9.71 5 4 9 0.12
Abra 404 344 748 308 264 572 76.47 91 77 168 22.46 5 3 8 1.07
Apayao 364 339 703 311 298 609 86.63 53 41 94 13.37 0 0 0 0.00
Benguet 788 690 1,478 763 646 1,409 95.33 25 44 69 4.67 0 0 0 0.00
Ifugao 395 321 716 385 306 691 96.51 10 14 24 3.35 0 1 1 0.14
Kalinga 477 386 863 445 349 794 92.00 32 37 69 8.00 0 0 0 0.00
Mountain Province 351 376 727 326 349 675 92.85 25 27 52 7.15 0 0 0 0.00
Baguio City 1,275 1,225 2,500 1,141 1,084 2,225 89.00 134 141 275 11.00 0 0 0 0.00
Area
NATALITY
2018 Quarterly Report
Live Birth by Weight, Part 1a
Live Birthweighs 2500g & greater weighs less than 2500 g Unknown weight
Page 26
Male Female Total Male Female Total Male Female Total % Male Female Total % Male Female Total % Male Female Total % Male Female Total %CAR 4,054 3,681 7,735 3,965 3,620 7,585 3,493 3,221 6,714 88.52 67 58 125 1.65 324 271 595 7.84 98.01 20 19 39 0.51 61 51 112 1.48
Abra 404 344 748 404 344 748 353 300 653 87.30 11 11 22 2.94 28 25 53 7.09 97.33 10 8 18 0.24 2 0 2 0.27Apayao 364 339 703 364 340 704 328 303 631 89.63 4 5 9 1.28 23 21 44 6.25 97.16 4 3 7 0.99 5 8 13 1.85Benguet 788 690 1,478 789 689 1,478 737 646 1,383 93.57 4 2 6 0.41 21 22 43 2.91 96.89 2 0 2 0.14 25 19 44 2.98Ifugao 395 321 716 397 321 718 251 200 451 62.81 9 8 17 2.37 125 96 221 30.78 95.96 0 4 4 0.56 12 13 25 3.48
Kalinga 477 386 863 385 325 710 262 229 491 69.15 20 16 36 5.07 100 77 177 24.93 99.15 0 1 1 0.14 3 2 5 0.70Mountain Province 351 376 727 351 376 727 298 326 624 85.83 19 16 35 4.81 24 28 52 7.15 97.80 3 3 6 0.83 7 3 10 1.38
Baguio City 1,275 1,225 2,500 1,275 1,225 2,500 1,264 1,217 2,481 99.24 0 0 0 0.00 3 2 5 0.20 99.44 1 0 1 0.04 7 6 13 0.52
NATALITY
2018 Quarterly ReportLive Birth by Birth Attendant, Part 1b
Second Quarter
SBA
Attended by Hilot/ TBA Attended by OthersAttended by MidwifeArea
Live BirthAttended by MD Attended by Nurse
Live Birth by weight
Page 27
CAR 7,735 7,786 6,069 77.95 221 2.84 5,825 74.81 23 0.30 1,717 22.05 1,717 22.05 7,542 96.87
Abra 748 746 566 75.87 31 4.16 533 71.45 2 0.27 180 24.13 180 24.13 713 95.58Apayao 703 712 605 84.97 23 3.23 581 81.60 1 0.14 107 15.03 107 15.03 688 96.63Benguet 1,478 1,481 1,313 88.66 52 3.51 1,258 84.94 3 0.20 168 11.34 168 11.34 1,426 96.29Ifugao 716 717 644 89.82 53 7.39 588 82.01 3 0.42 73 10.18 73 10.18 661 92.19
Kalinga 863 897 743 82.83 21 2.34 719 80.16 3 0.33 154 17.17 154 17.17 873 97.32Mountain Province 727 731 526 71.96 38 5.20 485 66.35 3 0.41 205 28.04 205 28.04 690 94.39
Baguio City 2,500 2,502 1,672 66.83 3 0.12 1,661 66.39 8 0.32 830 33.17 830 33.17 2,491 99.56
%
Health
Facility %
Other
Places % Total % TotalArea
NATALITY2018 Quarterly Report
Deliveries by Place, Part 1c
Second Quarter
Total
Livebirths
Total
Deliveries
Normal Deliveries Operative Deliveries FBD
Total % Home %
Health
Facility %
Page 28
Male Female Total Male Female Total Male Female Total Male Female Total Male Female Total Male Female Total Male Female Total %CAR 378 373 751 7 7 14 371 366 737 381 374 755 7 7 14 374 367 741 350 348 698 92.45
Abra 15 16 31 0 0 0 15 16 31 15 16 31 0 0 0 15 16 31 15 16 31 100.00Apayao 61 54 115 4 2 6 57 52 109 61 54 115 4 2 6 57 52 109 57 49 106 92.17Benguet 84 76 160 1 1 2 83 75 158 84 76 160 1 1 2 83 75 158 84 74 158 98.75Ifugao 42 40 82 0 1 1 42 39 81 43 40 83 0 1 1 43 39 82 39 36 75 90.36
Kalinga 35 31 66 0 0 0 35 31 66 35 31 66 0 0 0 35 31 66 13 17 30 45.45Mountain Province 33 46 79 1 1 2 32 45 77 35 47 82 1 1 2 34 46 80 34 46 80 97.56
Baguio City 108 110 218 1 2 3 107 108 215 108 110 218 1 2 3 107 108 215 108 110 218 100.00
AreaLive Birth by adolescent
mother
NATALITY2018 Quarterly Report
Live Birth by Adolescent Mothers, Part 1d
Deliveries by adolescent
mothers
Facility based delivery by
adolescent mothers
Live Birth by adolescent
mother ages 10-14
Live Birth by adolescent
mother ages 15-19
Deliveries by adolescent
mothers ages 10-14
Deliveries by adolescent
mothers ages 15-19
Page 29
Second Quarter
Male Female Total Male Female Total Male Female Total % Male Female Total Male Female Total7 7 14 343 341 684 373 362 735 97.87 7 7 14 366 355 721
0 0 0 15 16 31 15 16 31 100.00 0 0 0 15 16 314 2 6 53 47 100 61 52 113 98.26 4 2 6 57 50 1071 1 2 83 73 156 84 75 159 99.38 1 1 2 83 74 1570 1 1 39 35 74 41 37 78 95.12 0 1 1 41 36 770 0 0 13 17 30 32 26 58 87.88 0 0 0 32 26 581 1 2 33 45 78 33 46 79 100.00 1 1 2 32 45 771 2 3 107 108 215 107 110 217 99.54 1 2 3 106 108 214
Live births from adolescent
mothers attended by SBA
Facility based delivery
by adolescent mothers
ages 10-14
Facility based delivery
by adolescent mothers
ages 15-19
Live births from
adolescent mothers
attended by SBA ages 10-
14
Live births from
adolescent mothers
attended by SBA ages 15-
19
Page 30
Maternal
Death ages
10-14
Maternal
Death Ages
15-19
CAR 1,783,914 7,735 1,151 904 2,055 1.15 32 27 59 7.63 7 3 10 4 0 4 3 3 6 41 32 73 9.44 57 42 99 12.80 2 25.86 0 0
Abra 244,800 748 183 164 347 1.42 6 5 11 14.71 0 0 0 0 0 0 0 0 0 6 5 11 14.71 8 7 15 20.05 0 0.00 0 0
Apayao 122,978 703 90 69 159 1.29 2 2 4 5.69 0 0 0 0 0 0 0 0 0 2 2 4 5.69 3 3 6 8.53 1 142.25 0 0Benguet 469,361 1,478 176 115 291 0.62 1 0 1 0.68 0 0 0 0 0 0 0 0 0 4 2 6 4.06 6 4 10 6.77 0 0.00 0 0Ifugao 209,611 716 92 90 182 0.87 1 1 2 2.79 0 0 0 0 0 0 0 0 0 1 2 3 4.19 1 2 3 4.19 0 0.00 0 0
Kalinga 219,077 863 100 86 186 0.85 4 2 6 6.95 0 0 0 0 0 0 0 0 0 6 3 9 10.43 7 4 11 12.75 0 0.00 0 0Mountain Province 154,814 727 131 98 229 1.48 7 7 14 19.26 1 0 1 0 0 0 1 0 1 9 7 16 22.01 11 7 18 24.76 0 0.00 0 0Baguio City 363,274 2,500 379 282 661 1.82 11 10 21 8.40 6 3 9 4 0 4 2 3 5 13 11 24 9.60 21 15 36 14.40 1 40.00 0 0
# of Neonatal Deaths
from Adolescent
Mothers
# of Neonatal Deaths
from Adolescent
Mothers ages 10-14
# of Neonatal Deaths
from Adolescent
Mothers ages 15-19
Male Female Total Male Female Total Male Female Total %% Male Female Total %% Male Female Total No.Total % Male Female Total No. No.
Area
MORTALITY2018 Quarterly Report
Total, Neonatal, Infant, Under - Five and Maternal Death
Second Quarter
Deaths Neonatal Death (0-28 days) Infant Death (0-11 mos) Under - Five Death (0 - 5 yrs)Populatio
n
Live
Births
Maternal Death
Male Female
Page 31
Abortion
CAR 1,783,914 7,735 31 25 56 7.24 22 18 40 0.52 53 43 96 12.32 0 0 0 0.00 82
Abra 244,800 748 1 0 1 1.34 0 0 0 0.00 1 0 1 1.34 0 0 0 0.00 6
Apayao 122,978 703 4 4 8 11.38 0 2 2 0.28 4 6 10 14.06 0 0 0 0.00 12Benguet 469,361 1,478 1 2 3 2.03 0 0 0 0.00 1 2 3 2.03 0 0 0 0.00 8Ifugao 209,611 716 3 1 4 5.59 2 1 3 0.42 5 2 7 9.72 0 0 0 0.00 15
Kalinga 219,077 863 3 4 7 8.11 4 0 4 0.46 7 4 11 12.64 0 0 0 0.00 22Mountain Province 154,814 727 4 4 8 11.00 5 7 12 1.65 9 11 20 27.21 0 0 0 0.00 19Baguio City 363,274 2,500 15 10 25 10.00 11 8 19 0.76 26 18 44 17.43 0 0 0 0.00 0
Total
Fetal Death
Total
Second Quarter
% Male Female Total % Male Female
Early Neonatal Death
MORTALITY2018 Quarterly Report
Fetal, Early Neonatal, Perinatal, Neonatal Tetanus death, Stillbirth and Abortion
Area
Perinatal Death Neonatal Tetanus Death
Total % Male Female Total %Population
Live
Births Male Female
Page 32
Second Quarter
Male Female TotalPrev.
RateMale Female Total %
C A R 1,783,914 12 8 20 0.11 3 5 8 40.00
Abra 244,800 3 4 7 0.29 2 3 5 71.43
Apayao 122,978 2 0 2 0.16 0 0 0 0.00
Benguet 469,361 1 1 2 0.04 0 1 1 50.00
Ifugao 209,611 0 0 0 0.00 0 0 0 0.00
Kalinga 219,076 1 0 1 0.05 0 0 0 0.00
Mt. Province 154,814 0 0 0 0.00 0 0 0 0.00
Baguio City 363,274 5 3 8 0.22 1 1 2 25.00
Table 2K.1 - LeprosyLeprosy Cases, Prevalence Rate and Number of Cases Cured
By Region, Province and CityPhilippines, Quarterly Report 2018
Area Population
Leprosy Cases No. of Leprosy Cases Cured
Page 33
Second Quarter
Male Female Total % Male Female Total %
C A R 0 0 0 0 0.00 0 0 0 0.00 0.00
Abra 0 0 0 0 0.00 0 0 0 0.00 0.00
Apayao 0 0 0 0 0.00 0 0 0 0.00 0.00
Benguet 0 0 0 0 0.00 0 0 0 0.00 0.00
Ifugao 0 0 0 0 0.00 0 0 0 0.00 0.00
Kalinga 0 0 0 0 0.00 0 0 0 0.00 0.00
Mt. Province 0 0 0 0 0.00 0 0 0 0.00 0.00
Baguio City 0 0 0 0 0.00 0 0 0 0.00 0.00
Table 2K.2 - LeprosyNumber of Newly Detected Cases and Case Detection Rate
By Region, Province and CityPhilippines, Quarterly Report 2018
Area
No. of Newly Detected Cases
TotalLess than 15 yrs. old With Grade 2 Disability Case
Detec.
Rate
Page 34
Second Quarter
Male Female Total Male Female Total Male Female TotalC A R 57 23 22 45 5 7 12 0 0 0
Abra 16 6 8 14 0 2 2 0 0 0Apayao 1 1 0 1 0 0 0 0 0 0
Benguet 4 2 1 3 1 0 1 0 0 0
Ifugao 8 2 5 7 0 1 1 0 0 0Kalinga 17 7 4 11 2 4 6 0 0 0
Mt. Province 1 1 0 1 0 0 0 0 0 0
Baguio City 10 4 4 8 2 0 2 0 0 0
Table 2H.1 - TuberculosisSmear Positive (+) Retreatment Cases who got Cured, Relapsed, Treatment Failure and Returned After Default
By Region, Province and CityPhilippines, Quarterly Report 2018
AreaSmear Positive (+) Retreatment Cases who got Cured
TotalRelapsed Treatment Failure Return after default
Page 35
Second Quarter
Male Female Total Male Female Total
C A R 1,783,914 4,906 512 285 797 512 285 797 16.25
Abra 244,800 673 113 62 175 113 62 175 26.00
Apayao 122,978 338 76 41 117 76 41 117 34.60
Benguet 469,361 1,291 57 27 84 57 27 84 6.51
Ifugao 209,611 576 59 31 90 59 31 90 15.61
Kalinga 219,076 602 84 44 128 84 44 128 21.25
Mt. Province 154,814 426 36 16 52 36 16 52 12.21
Baguio City 363,274 999 87 64 151 87 64 151 15.12
Table 2H.2 - TuberculosisTotal Number of TB Cases All Forms Initiated Treatment, Identified and Case Detection Rate
By Region, Province and CityPhilippines, Quarterly Report 2018
Area Population
Eligible
Pop. (TP x
0.275%)
Total no. of TB cases all
forms initiated treatmentTB all forms identified Case
Detection
Rate
Page 36
Second Quarter
C A R 196 226 422 162 171 333 162 171 333 114 106 220 5 8 13
Abra 35 54 89 31 46 77 31 46 77 25 27 52 3 4 7
Apayao 33 22 55 30 24 54 30 24 54 16 12 28 1 0 1
Benguet 28 24 52 23 27 50 23 27 50 13 12 25 0 0 0
Ifugao 15 20 35 21 11 32 21 11 32 9 5 14 1 1 2
Kalinga 32 25 57 28 25 53 28 25 53 24 26 50 0 2 2
Mt. Province 10 16 26 10 13 23 10 13 23 18 11 29 0 0 0
Baguio City 43 65 108 19 25 44 19 25 44 9 13 22 0 1 1
Male Female TotalMale Female Total Male Female TotalTotal
Table 2H.3 - TuberculosisNumber of TB Symptomatics who underwent DSSM, Smear Positive (+) Cases Discovered and Identified, New Smear Positive (+)
Cases Initiated Treatment and Registered, New Smear Positive (+) Retreatment Cases Cured
By Region, Province and City Philippines, 2018
Area
TB symptomatics who
underwent DSSM
Smear positive (+)
discovered and identified
New smear positive (+)
cases initiated
treatment and
registered
New smear positive (+)
cases cured
Smear positive (+)
retreatment cases
cured
Male Female Total Male Female
Page 37
Second Quarter
Male Female Total Male Female Total Male Female Total Male Femal TotalC A R 50 23 22 45 0 0 0 3 2 5 0 0 0
Abra 14 6 8 14 0 0 0 0 0 0 0 0 0Apayao 1 1 0 1 0 0 0 0 0 0 0 0 0Benguet 4 2 1 3 0 0 0 0 1 1 0 0 0Ifugao 8 4 3 7 0 0 0 1 0 1 0 0 0Kalinga 11 6 5 11 0 0 0 0 0 0 0 0 0Mt. Province 2 0 1 1 0 0 0 0 1 1 0 0 0
Baguio City 10 4 4 8 0 0 0 2 0 2 0 0 0
Other Types of TB
Table 2H.4 - TuberculosisNumber of Smear Positive (+) Retreatment Cases Given Treatment and Registered, Relapsed, Treatment Failure,
Returned After Default and Other Types of TB
By Region, Province and City Philippines, Quarterly Report 2018
Area
Smear Positive (+) Retreatment Cases Initiated Treatment and Registered
TotalRelapsed Treatment Failure Returned After default
Page 38
Second Quarter
Male Female Total Male Female Total
C A R 1,783,914 0 0 0 0 0 0 0 0 0 0.00 0.00
Abra 244,800 0 0 0 0 0 0 0 0 0 0.00 0.00
Apayao 122,978 0 0 0 0 0 0 0 0 0 0.00 0.00
Benguet 469,361 0 0 0 0 0 0 0 0 0 0.00 0.00
Ifugao 209,611 0 0 0 0 0 0 0 0 0 0.00 0.00
Kalinga 219,076 0 0 0 0 0 0 0 0 0 0.00 0.00
Mt. Province 154,814 0 0 0 0 0 0 0 0 0 0.00 0.00
Baguio City 363,274 0 0 0 0 0 0 0 0 0 0.00 0.00
<5 yrs. Old ≥ 5 yrs. oldPreg-nant Total
Table 2I.1 - MalariaNumber of Confirmed Malaria Cases by Age Group, Pregnant Women, Morbidity Rate and Annual Parasite Incidence
By Region, Province and CityPhilippines, Quarterly Report 2018
Area Total Pop.Pop. At
risk
Confirmed Malaria Cases by Age group and PregnantMorbi-dity
Rate
Annual
Parasite
Incidence
Page 39
Second Quarter
Male Female Total Male Female Total
C A R 0 0 0 0 0 0 0 0 0 0 0 0 0.00
Abra 0 0 0 0 0 0 0 0 0 0 0 0 0.00
Apayao 0 0 0 0 0 0 0 0 0 0 0 0 0.00
Benguet 0 0 0 0 0 0 0 0 0 0 0 0 0.00
Ifugao 0 0 0 0 0 0 0 0 0 0 0 0 0.00
Kalinga 0 0 0 0 0 0 0 0 0 0 0 0 0.00
Mt. Province 0 0 0 0 0 0 0 0 0 0 0 0 0.00
Baguio City 0 0 0 0 0 0 0 0 0 0 0 0 0.00
Total
Table 2I.2 - MalariaNumber of Malaria Cases Disaggregated by Method, Number Given LLIN and Deaths
By Region, Province and CityPhilippines, Quarterly Report 2018
Area
Confirmed
Malaria
Cases
Malaria Cases Disaggregated by Method No. of
LLIN
given
Malaria DeathsMortality
RateTotalSlide RDT
Male Female
Page 40
Second Quarter
Male Female Total Male Female Total Male Female Total Male Female TotalC A R 0 0 0 0 0 0 0 0 0 0 0 0 0
Abra 0 0 0 0 0 0 0 0 0 0 0 0 0
Apayao 0 0 0 0 0 0 0 0 0 0 0 0 0
Benguet 0 0 0 0 0 0 0 0 0 0 0 0 0
Ifugao 0 0 0 0 0 0 0 0 0 0 0 0 0
Kalinga 0 0 0 0 0 0 0 0 0 0 0 0 0
Mt. Province 0 0 0 0 0 0 0 0 0 0 0 0 0
Baguio City 0 0 0 0 0 0 0 0 0 0 0 0 0
Table 2I.3 - MalariaNumber of Confirmed Malaria Cases Disaggregated by Species and by Region, Province and City
Philippines, 2018
AreaMalaria Cases Disaggregated by Species
TotalP. Falcifarum P. Vivax P. Ovale P. Malariae