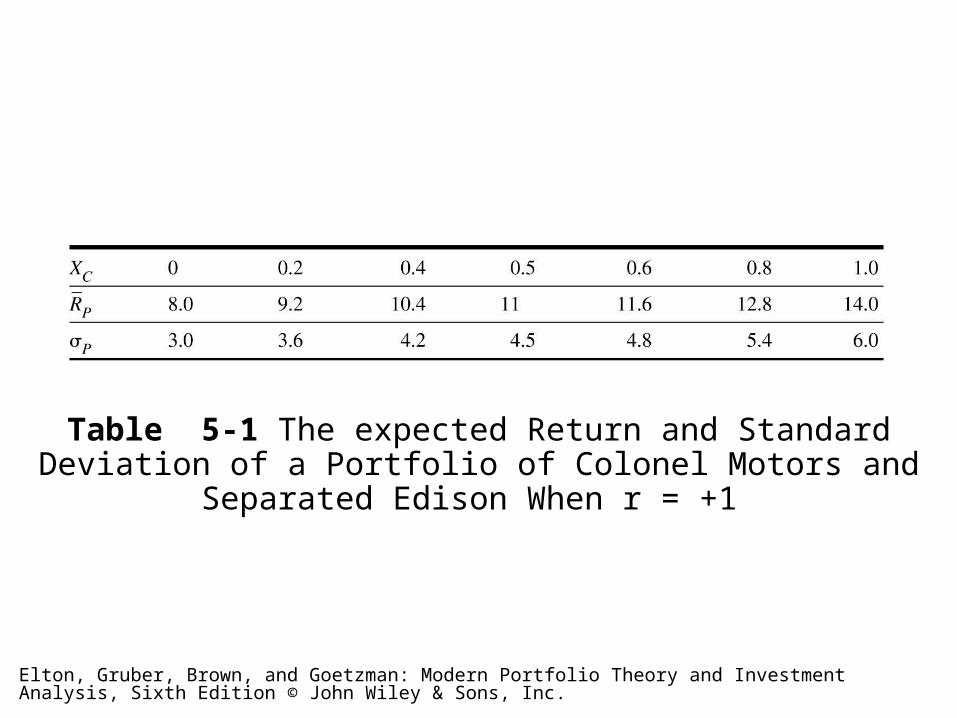
Table 5-1 The expected Return and Standard Deviation of a Portfolio of Colonel Motors and Separated Edison When r = +1
Elton, Gruber, Brown, and Goetzman: Modern Portfolio Theory and Investment Analysis, Sixth Edition © John Wiley & Sons, Inc.
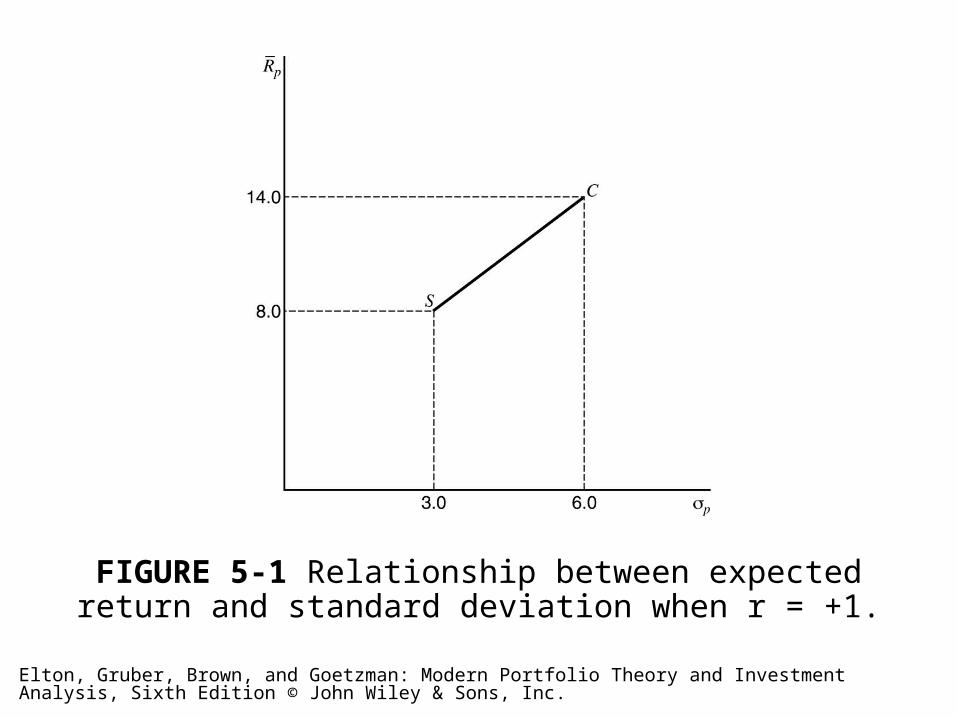
FIGURE 5-1 Relationship between expected return and standard deviation when r = +1.
Elton, Gruber, Brown, and Goetzman: Modern Portfolio Theory and Investment Analysis, Sixth Edition © John Wiley & Sons, Inc.
Table 5-2 The expected Return and Standard Deviation of a Portfolio of Colonel Motors and Separated Edison When r = –1
Elton, Gruber, Brown, and Goetzman: Modern Portfolio Theory and Investment Analysis, Sixth Edition © John Wiley & Sons, Inc.
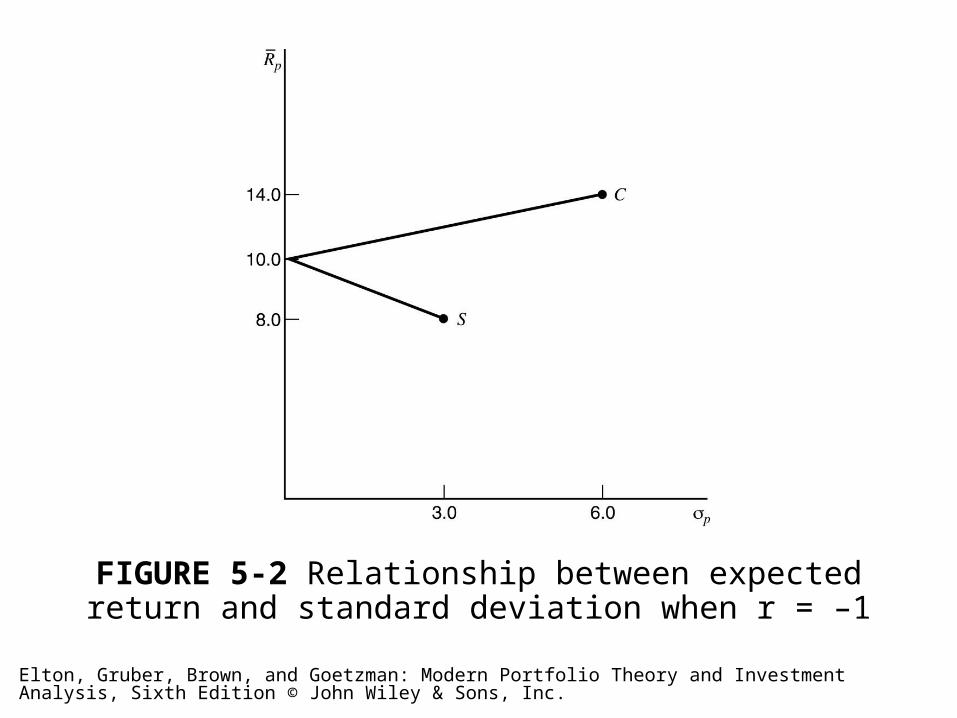
FIGURE 5-2 Relationship between expected return and standard deviation when r = –1
Elton, Gruber, Brown, and Goetzman: Modern Portfolio Theory and Investment Analysis, Sixth Edition © John Wiley & Sons, Inc.
FIGURE 5-3 Relationship between expected return and standard deviation for various correlation coefficients.
Elton, Gruber, Brown, and Goetzman: Modern Portfolio Theory and Investment Analysis, Sixth Edition © John Wiley & Sons, Inc.
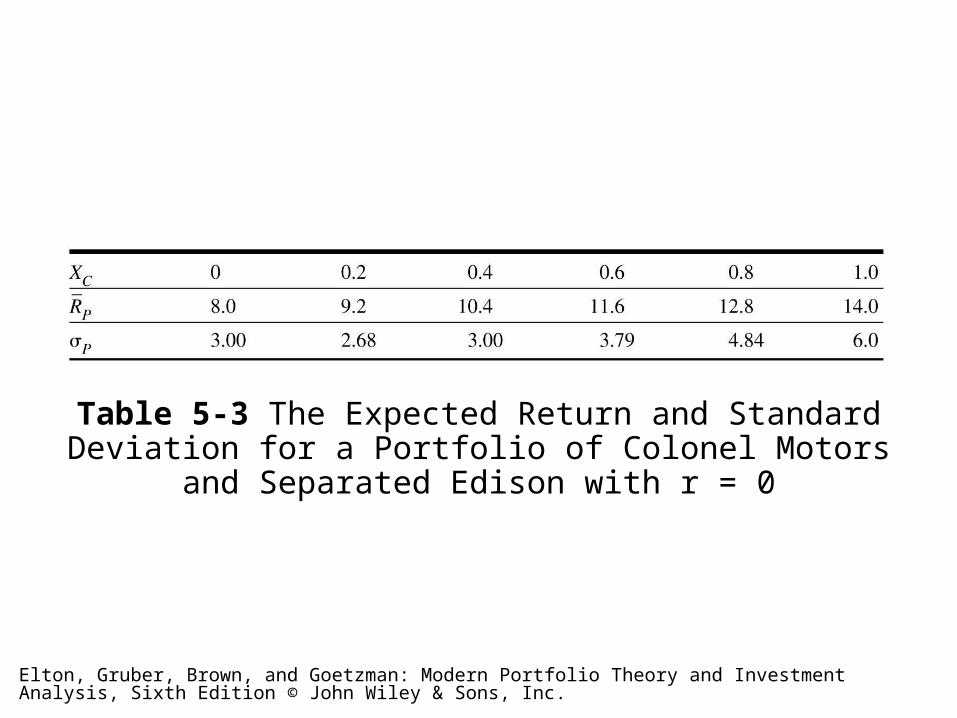
Table 5-3 The Expected Return and Standard Deviation for a Portfolio of Colonel Motors and Separated Edison with r = 0
Elton, Gruber, Brown, and Goetzman: Modern Portfolio Theory and Investment Analysis, Sixth Edition © John Wiley & Sons, Inc.
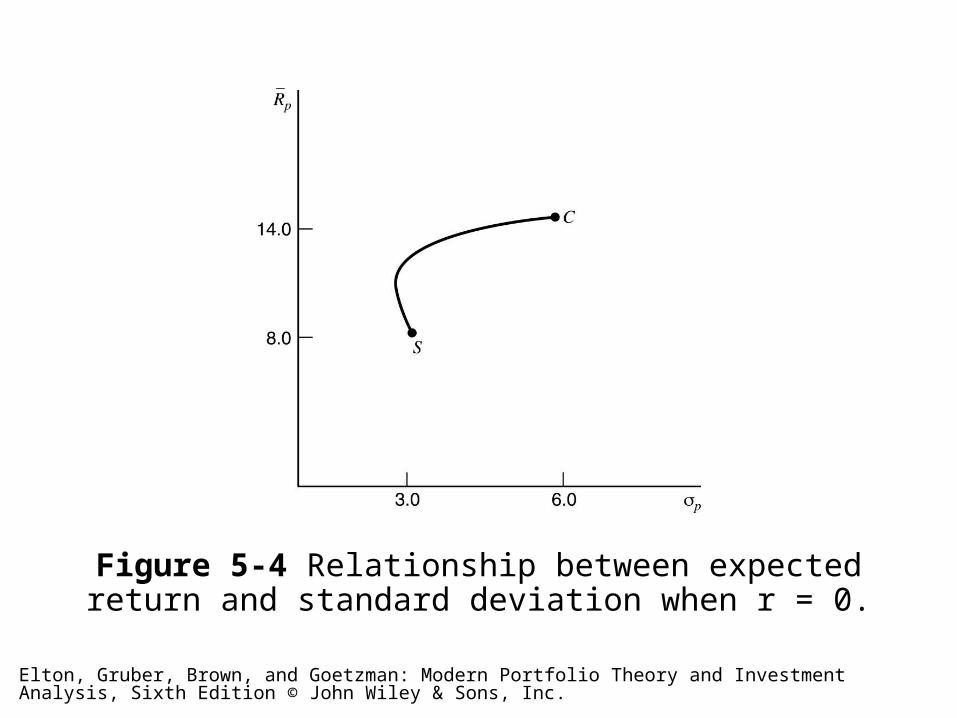
Figure 5-4 Relationship between expected return and standard deviation when r = 0.
Elton, Gruber, Brown, and Goetzman: Modern Portfolio Theory and Investment Analysis, Sixth Edition © John Wiley & Sons, Inc.
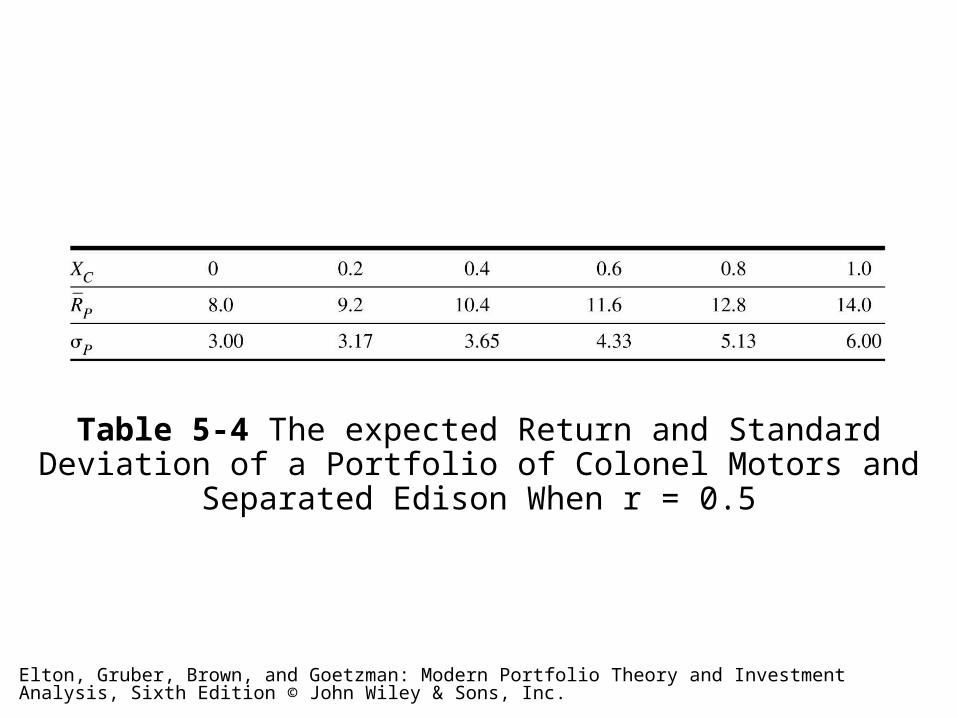
Table 5-4 The expected Return and Standard Deviation of a Portfolio of Colonel Motors and Separated Edison When r = 0.5
Elton, Gruber, Brown, and Goetzman: Modern Portfolio Theory and Investment Analysis, Sixth Edition © John Wiley & Sons, Inc.
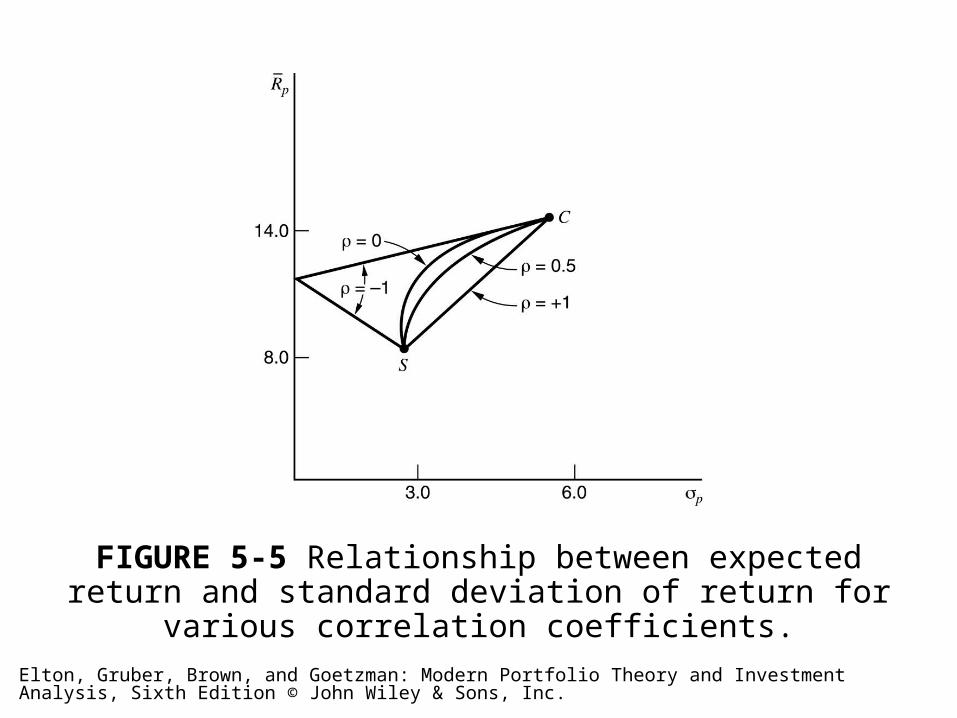
FIGURE 5-5 Relationship between expected return and standard deviation of return for various correlation coefficients.
Elton, Gruber, Brown, and Goetzman: Modern Portfolio Theory and Investment Analysis, Sixth Edition © John Wiley & Sons, Inc.
(Figure continues on next slide)
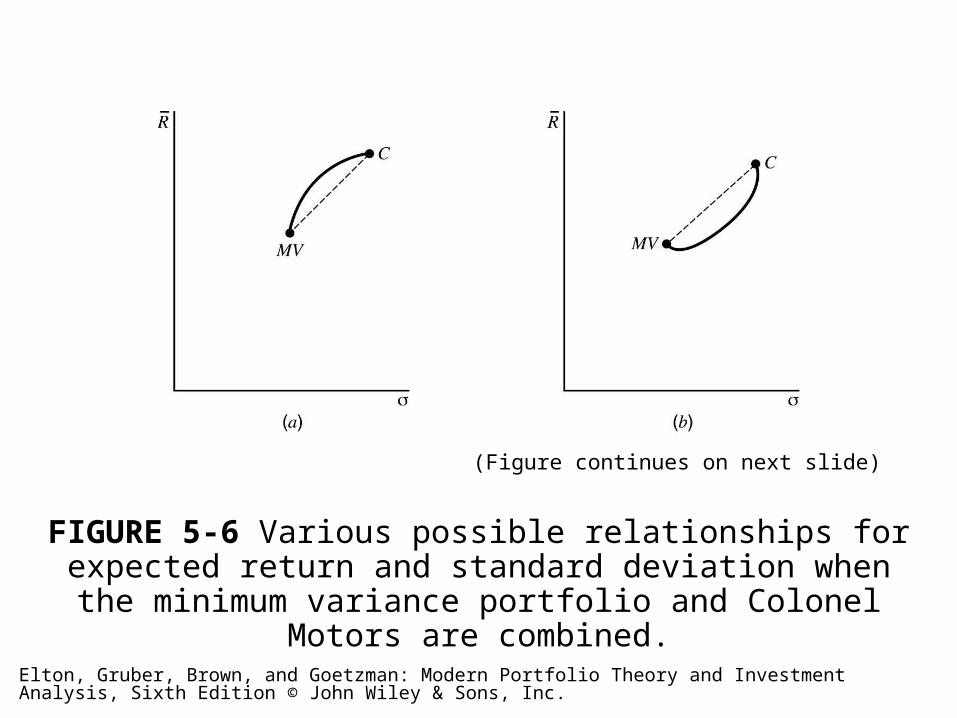
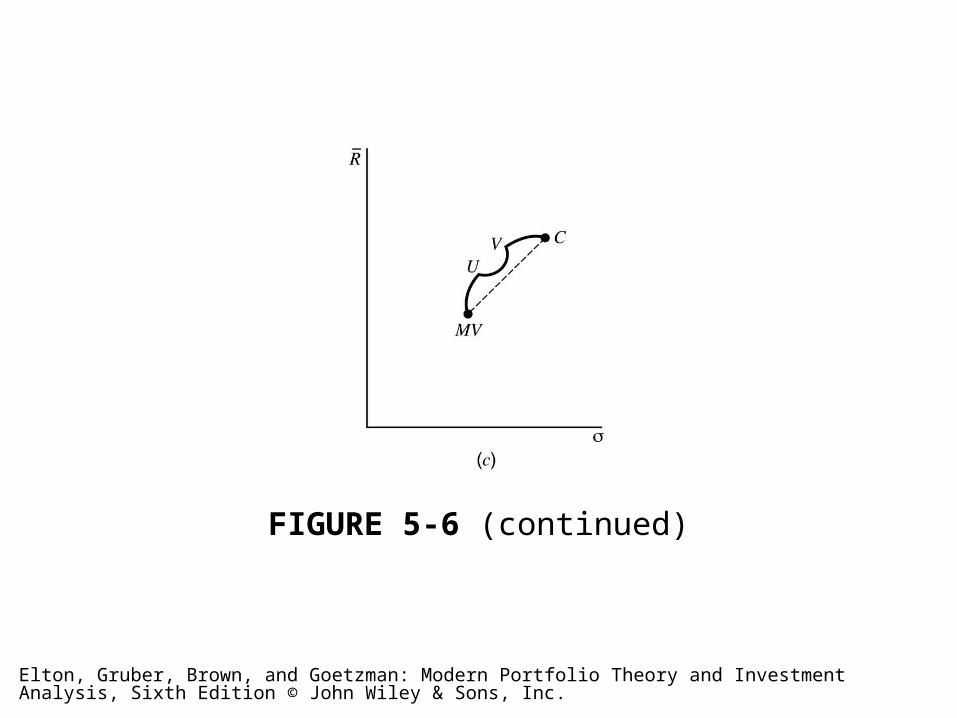
FIGURE 5-6 Various possible relationships for expected return and standard deviation when the minimum variance portfolio and
Colonel Motors are combined.
Elton, Gruber, Brown, and Goetzman: Modern Portfolio Theory and Investment Analysis, Sixth Edition © John Wiley & Sons, Inc.
FIGURE 5-6 (continued)
Elton, Gruber, Brown, and Goetzman: Modern Portfolio Theory and Investment Analysis, Sixth Edition © John Wiley & Sons, Inc.
(Figure continues on next slide)
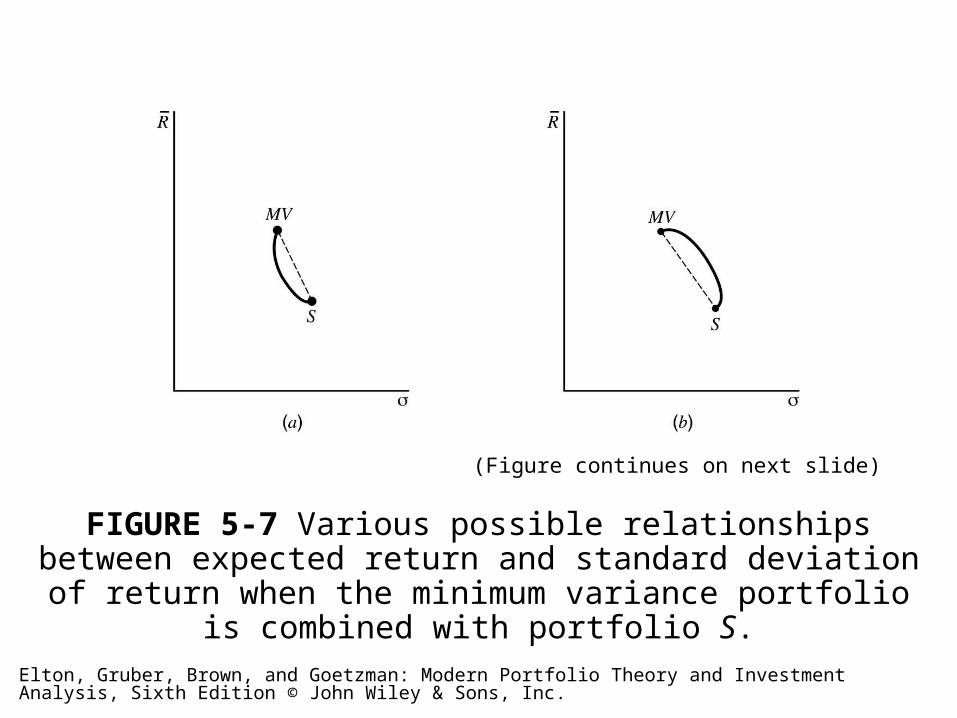
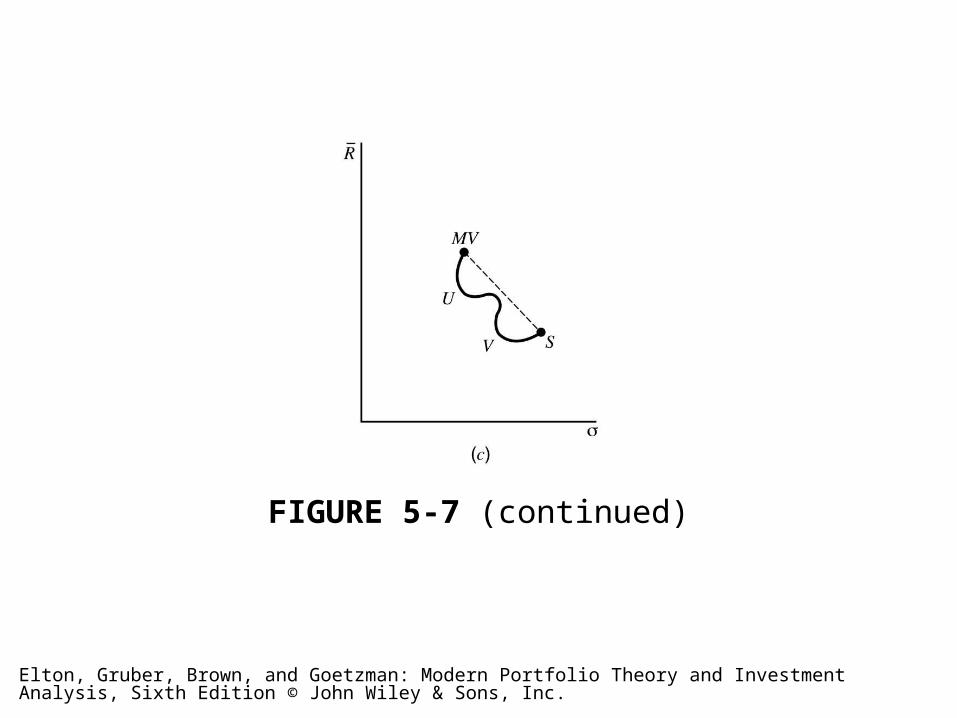
FIGURE 5-7 Various possible relationships between expected return and standard deviation of return when the minimum variance
portfolio is combined with portfolio S.
Elton, Gruber, Brown, and Goetzman: Modern Portfolio Theory and Investment Analysis, Sixth Edition © John Wiley & Sons, Inc.
FIGURE 5-7 (continued)
Elton, Gruber, Brown, and Goetzman: Modern Portfolio Theory and Investment Analysis, Sixth Edition © John Wiley & Sons, Inc.
FIGURE 5-8 Risk and return possibilities for various assets and portfolios.
Elton, Gruber, Brown, and Goetzman: Modern Portfolio Theory and Investment Analysis, Sixth Edition © John Wiley & Sons, Inc.
FIGURE 5-9 The efficient frontier.
Elton, Gruber, Brown, and Goetzman: Modern Portfolio Theory and Investment Analysis, Sixth Edition © John Wiley & Sons, Inc.
FIGURE 5-10 An impossible shape for the efficient frontier.
Elton, Gruber, Brown, and Goetzman: Modern Portfolio Theory and Investment Analysis, Sixth Edition © John Wiley & Sons, Inc.
Table 5-5 The Expected Return and Standard Deviation When Short Sales Are Allowed
Elton, Gruber, Brown, and Goetzman: Modern Portfolio Theory and Investment Analysis, Sixth Edition © John Wiley & Sons, Inc.
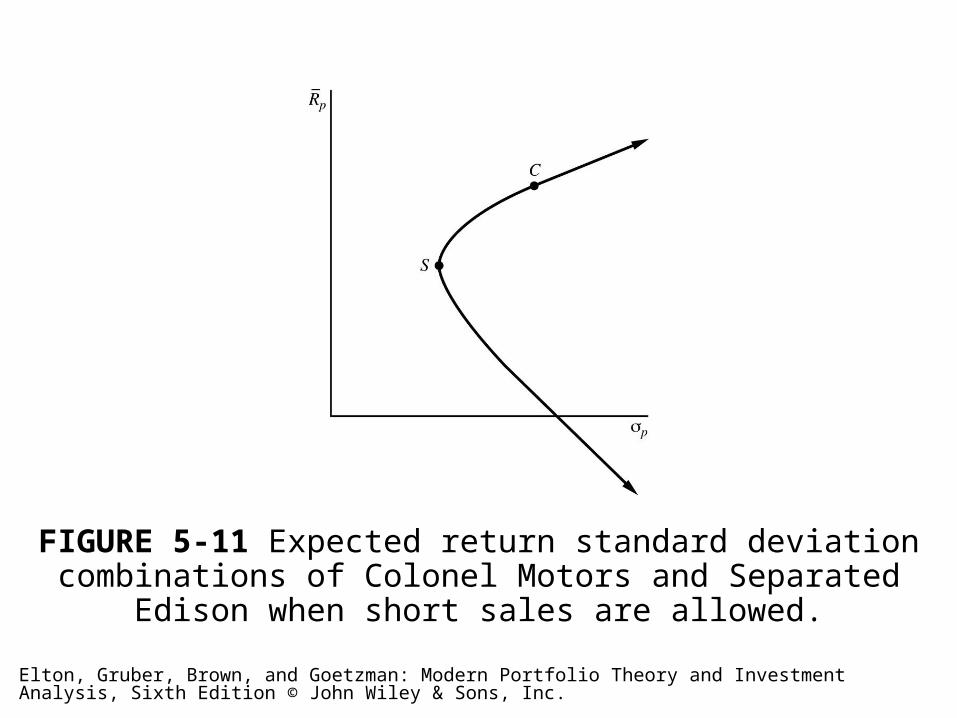
FIGURE 5-11 Expected return standard deviation combinations of Colonel Motors and Separated Edison when short sales are allowed.
Elton, Gruber, Brown, and Goetzman: Modern Portfolio Theory and Investment Analysis, Sixth Edition © John Wiley & Sons, Inc.
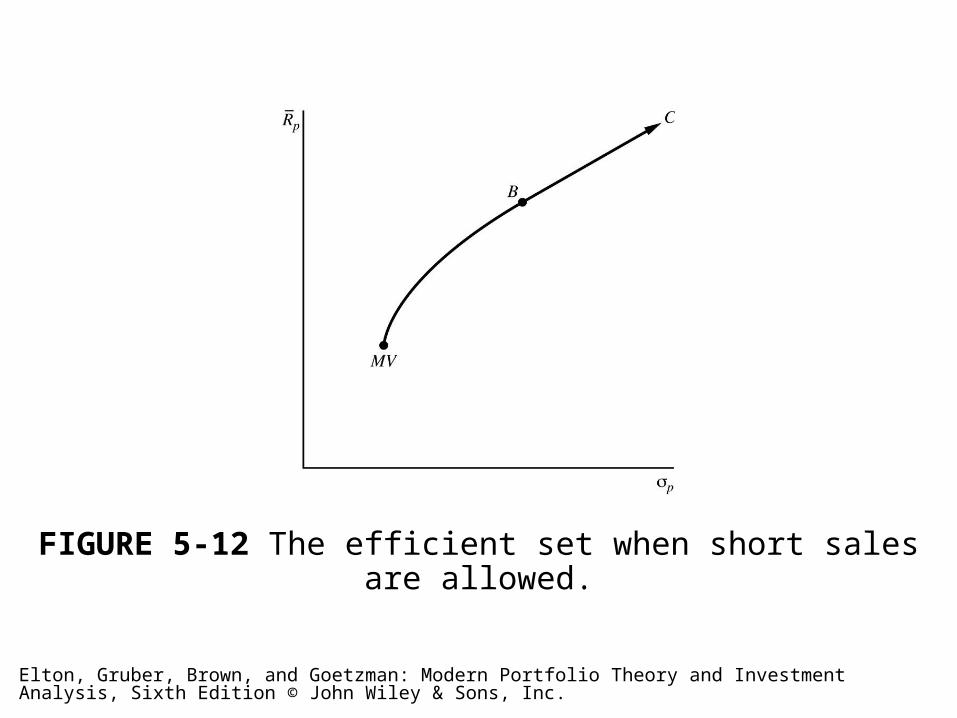
FIGURE 5-12 The efficient set when short sales are allowed.
Elton, Gruber, Brown, and Goetzman: Modern Portfolio Theory and Investment Analysis, Sixth Edition © John Wiley & Sons, Inc.
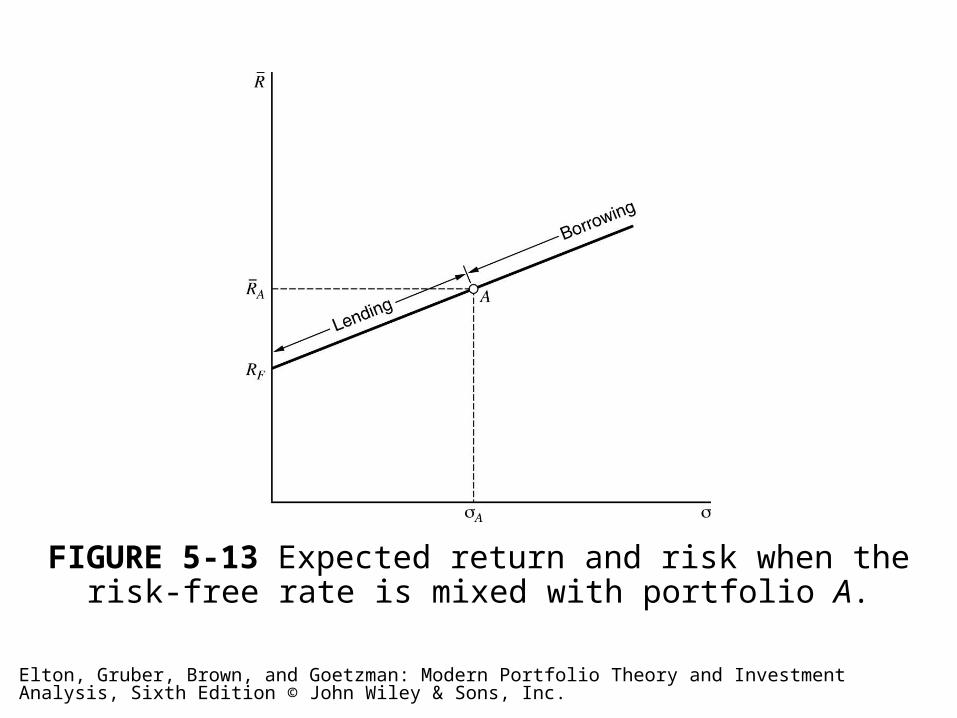
FIGURE 5-13 Expected return and risk when the risk-free rate is mixed with portfolio A.
Elton, Gruber, Brown, and Goetzman: Modern Portfolio Theory and Investment Analysis, Sixth Edition © John Wiley & Sons, Inc.
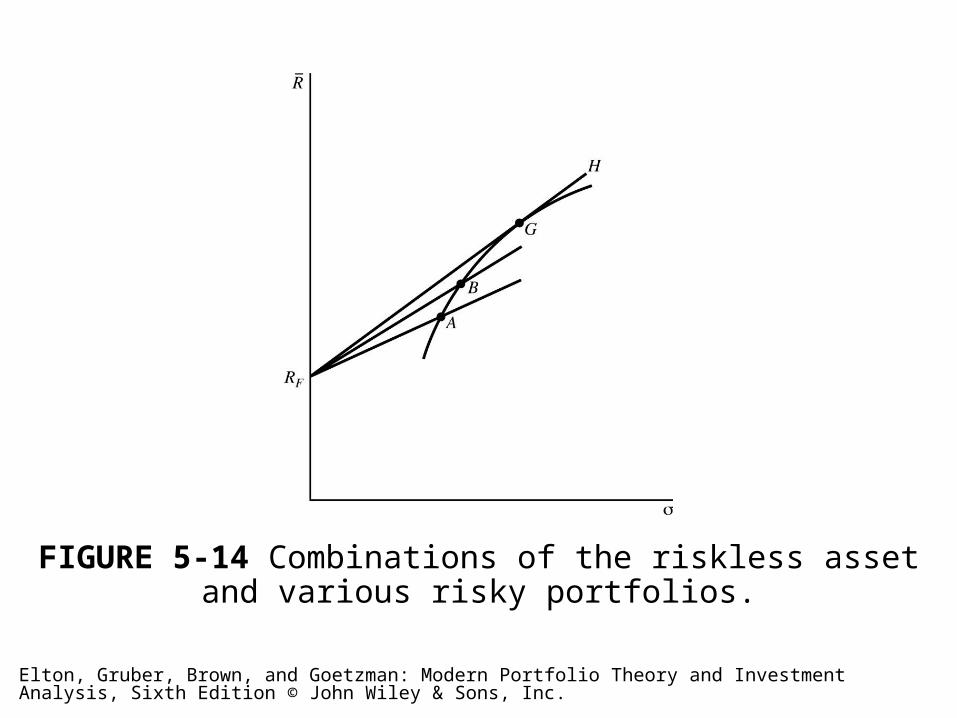
FIGURE 5-14 Combinations of the riskless asset and various risky portfolios.
Elton, Gruber, Brown, and Goetzman: Modern Portfolio Theory and Investment Analysis, Sixth Edition © John Wiley & Sons, Inc.
FIGURE 5-15 The efficient frontier with lending but not borrowing at the riskless rate.
Elton, Gruber, Brown, and Goetzman: Modern Portfolio Theory and Investment Analysis, Sixth Edition © John Wiley & Sons, Inc.
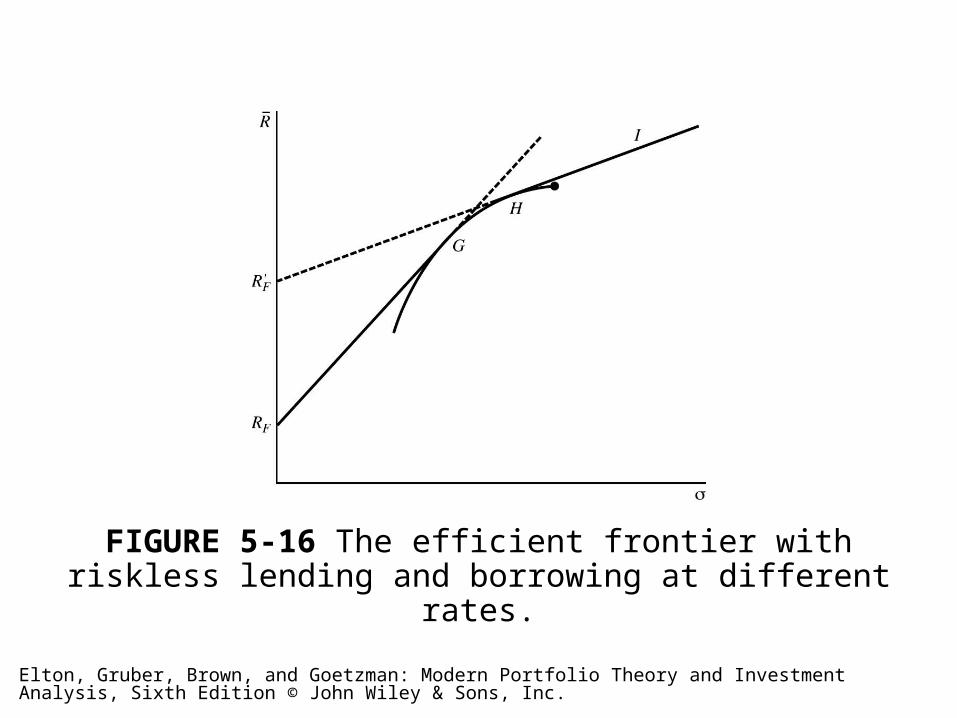
FIGURE 5-16 The efficient frontier with riskless lending and borrowing at different rates.
Elton, Gruber, Brown, and Goetzman: Modern Portfolio Theory and Investment Analysis, Sixth Edition © John Wiley & Sons, Inc.
Table 5-6 Returns with No Inflation Adjustment
Elton, Gruber, Brown, and Goetzman: Modern Portfolio Theory and Investment Analysis, Sixth Edition © John Wiley & Sons, Inc.
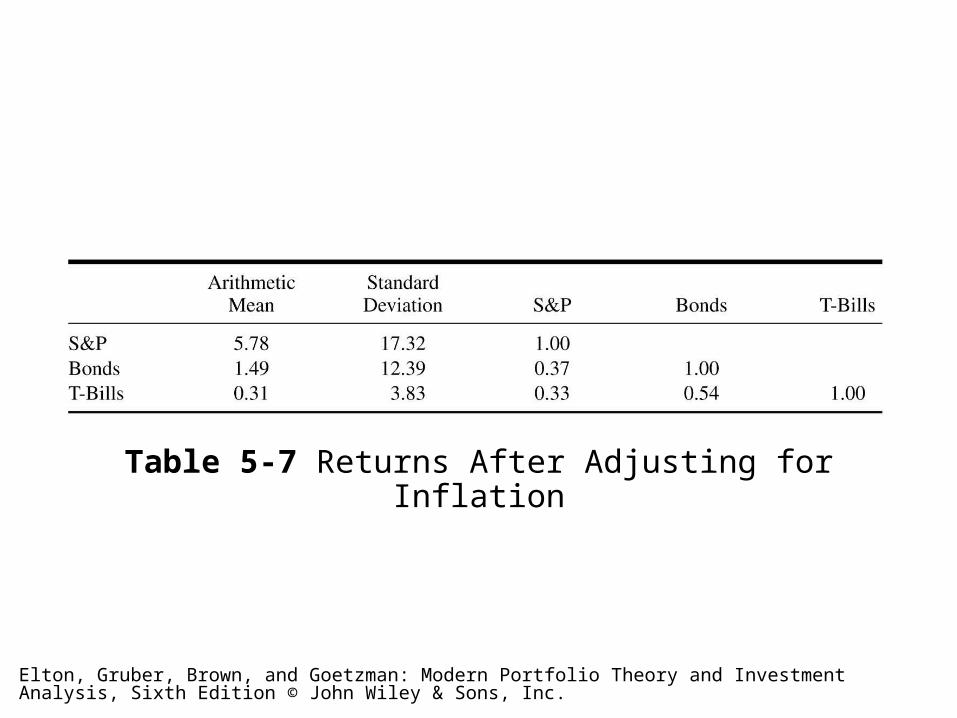
Table 5-7 Returns After Adjusting for Inflation
Elton, Gruber, Brown, and Goetzman: Modern Portfolio Theory and Investment Analysis, Sixth Edition © John Wiley & Sons, Inc.
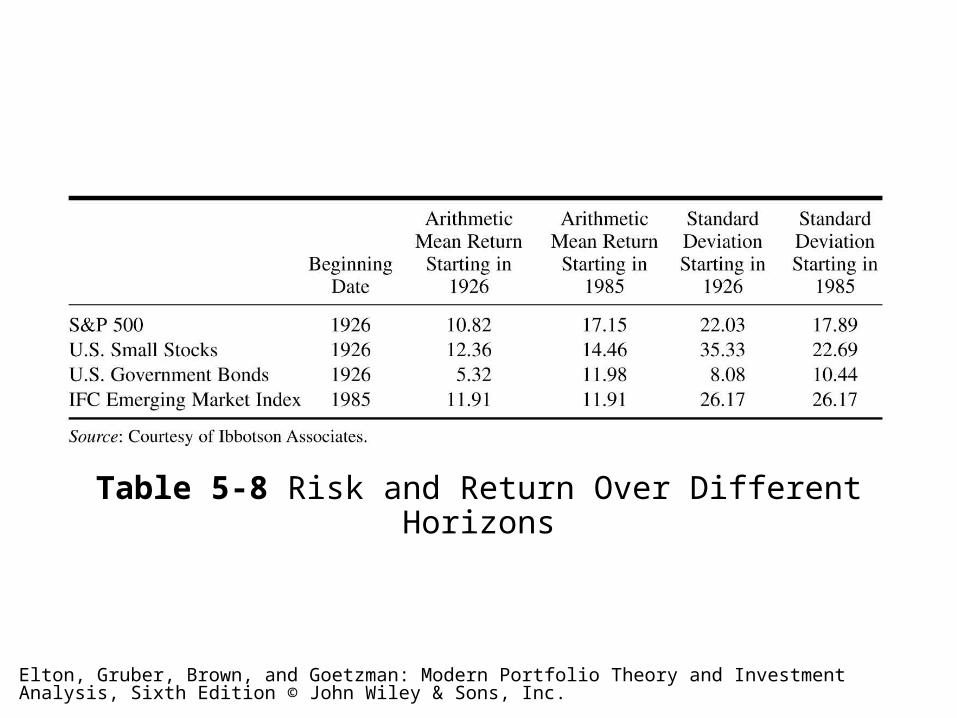
Table 5-8 Risk and Return Over Different Horizons
Elton, Gruber, Brown, and Goetzman: Modern Portfolio Theory and Investment Analysis, Sixth Edition © John Wiley & Sons, Inc.
Table 5-9 Correlation over Different Horizons
Elton, Gruber, Brown, and Goetzman: Modern Portfolio Theory and Investment Analysis, Sixth Edition © John Wiley & Sons, Inc.
Table 5-10 The Effect of Time Horizon on Risk
Elton, Gruber, Brown, and Goetzman: Modern Portfolio Theory and Investment Analysis, Sixth Edition © John Wiley & Sons, Inc.
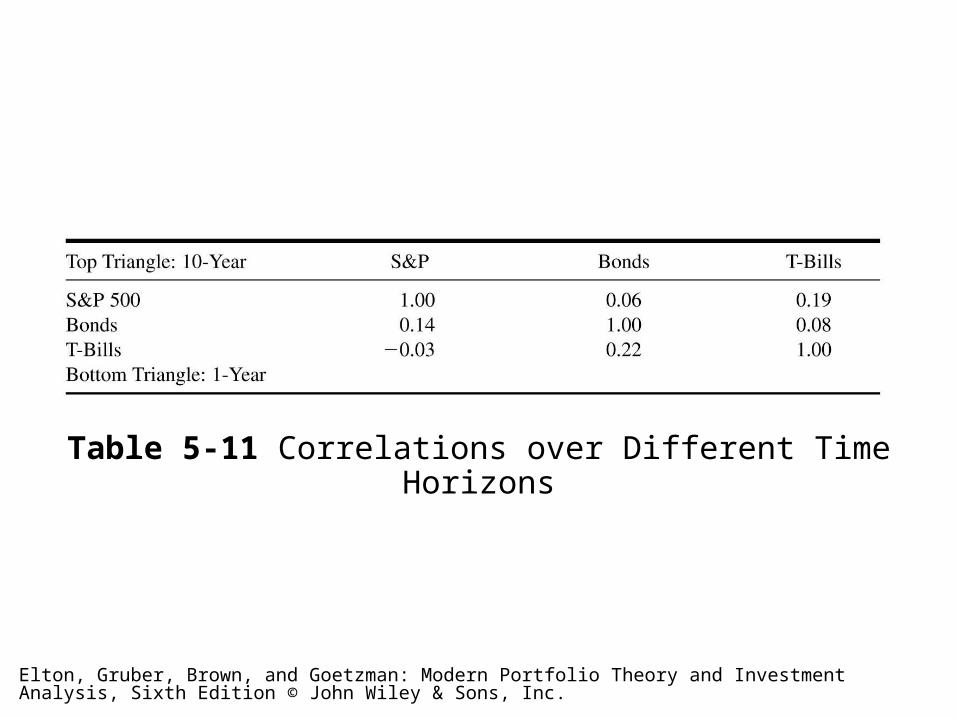
Table 5-11 Correlations over Different Time Horizons
Elton, Gruber, Brown, and Goetzman: Modern Portfolio Theory and Investment Analysis, Sixth Edition © John Wiley & Sons, Inc.
FIGURE 5-17 The efficient frontier.
Elton, Gruber, Brown, and Goetzman: Modern Portfolio Theory and Investment Analysis, Sixth Edition © John Wiley & Sons, Inc.
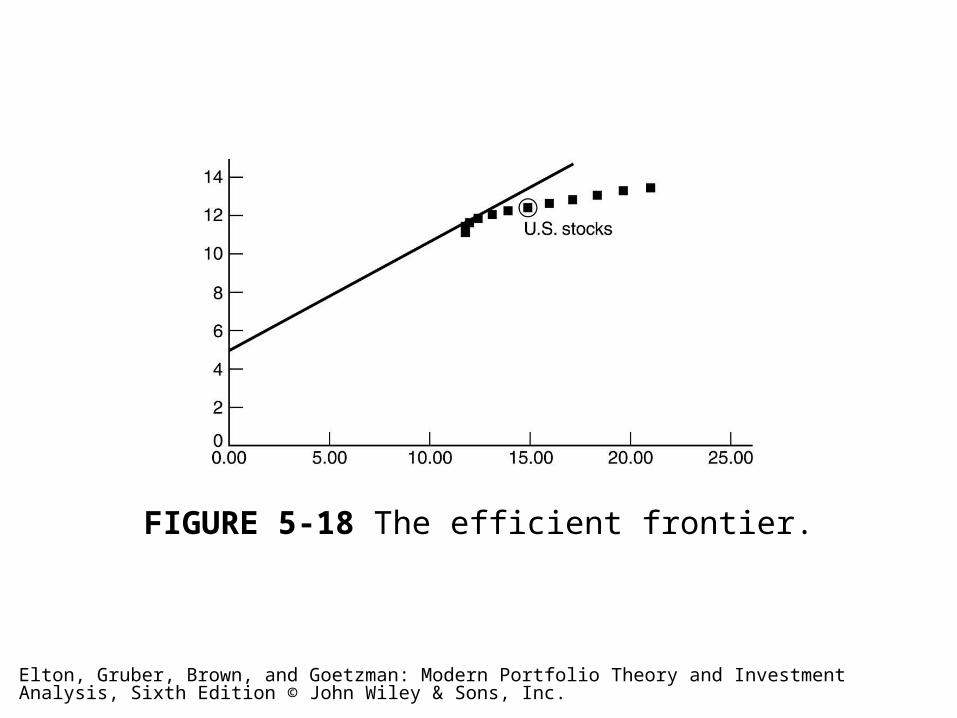
FIGURE 5-18 The efficient frontier.
Elton, Gruber, Brown, and Goetzman: Modern Portfolio Theory and Investment Analysis, Sixth Edition © John Wiley & Sons, Inc.
FIGURE 5-19 Combinations of bonds, domestic stocks, and international stocks.
Elton, Gruber, Brown, and Goetzman: Modern Portfolio Theory and Investment Analysis, Sixth Edition © John Wiley & Sons, Inc.