ESARDA is an association formed to advance and harmonize research and development for safeguards. The Parties to the association are:Areva, FranceATI, AustriaBNFL, United KingdomCEA, FranceCNCAN, RomaniaEDF, FranceENEA, ItalyEuropean CommissionFZJ, GermanyHAEA, HungaryIKI, HungaryIRSN, FranceMITyC, SpainNRPA, NorwaySCK/CEN, BelgiumSellafield Ltd, United KindomSFOE, SwitzerlandSKI, SwedenSTUK, FinlandUKAEA, United KingdomVATESI, LithuaniaWKK, Germany
EditorsC. Versino & L-V. Bril on behalf of ESARDAEC, Joint Research CentreT.P. 210I-21020 Ispra (VA), ItalyTel. +39 0332-789603, Fax. +39 [email protected]
Scientific and technical papers submittedfor publication are reviewed by the EditorialCommittee.
Manuscripts are to be sent to the Editor following the ‘instructions for authors’ available on the ‘Bulletin’ page of the ESARDA website.Photos or diagrams should be of high quality.
Accepted manuscripts are published free of charge.
N.B. Articles and other material in ESARDA Bulletin do not necessarily present the views or policies of ESARDA nor of the European Commission.
ESARDA Bulletin is published jointly by ESARDA and the Joint Research Centre of theEuropean Commission.It is distributed free of charge.
Printed by Ragusa Grafica Moderna srl – Bari, Italy
Table of Content issue n° 38Editorial
A word from the ESARDA Editorial Committee ........................................................ 1B. Autrusson
ESARDA News
Safeguards in Norway – Experiences with Integrated Safeguards ........................ 3 T. SekseApplication of Safeguards in Switzerland ................................................................. 7 B. Leibrecht
Peer reviewed section
C/S in Final Disposal Processes – Swedish and Finnish Perspectives ................. 10 A. Fritzell, T. Honkamaa, P. Karhu, O. Okko, A. Håkansson, G. Dahlin3D Reconstruction in Nuclear Security ..................................................................... 17 G. Boström, M. Fiocco, J.G.M. Gonçalves, D. Puig, V. Sequeira, B. Chartier, R. Kiesser, F. Mariotte, M. Richard, P. ZamoraUse of Imaging for Nuclear Material Control and Accountability ........................... 25 J.A. Mullens, P.A. Hausladen, P. Bingham, D.E. Archer, J.T. MihalczoUranium Enrichment Assay with a LaBr3(Ce) Scintillation Detector: A promising Option for the 2nd Generation of COMPUCEA ..................................... 32 H. Ottmar, P. Amador, H. Eberle, N. Erdmann, H. Schorlé, R. GunninkFluorine as a Safeguards Tool for Age Dating of Uranium Oxyfluoride Particles? .... 40 R. Kips, R. WellumNuclear Forensic Methods in Safeguards ................................................................. 44 K. Mayer, M. Wallenius
Working Groups activities
ESARDA Working Groups activities in 2007 – Summary report ............................. 52Working Group on Gamma Spectrometry Techniques for U/Pu Isotopics ............ 58Wireless Communications for Monitoring Nuclear Material Processes PART II: Wireless In-plant Data Transmission .......................................................... 60 F. Braina, J.G.M. Gonçalves, M. Heppleston, C. Ottesen, B. Schoeneman, K. Tolk, C. Versino
Technical sheets
Nuclear Mass Spectrometry ....................................................................................... 69
More and more, ESARDA is considered as a European forum / think tank for safeguards, non proliferation and related fields. This makes effective communication one of the most important roles for ESARDA. For this reason, an Editorial Committee (Working Group) was established, to be responsible for the following communication activities:
The2007Symposium, the largestevereventofESARDA,washostedby IRSN inAixenProvence,France.Between22and24May2007,themeetingattracted260participantstothreeparallelsessionsdealingwith technical, policy and reviewpapers including, for the first time, sessionsondual use,communication and training. Around 150 papers were presented in a total of 30 sessions, whilst the opportunitywasalsoprovidedforparticipantstostudy23postersanddiscussthemwiththeirauthors.The proceedings of the ESARDA 2007 Symposium were distributed to participants in September2007.
Theobjectivesof theESARDABulletin,firstpublished inOctober1981,havebeenmaintainedanddevelopedbytheEditorialCommittee.TheBulletinisnowpublishedatleasttwiceayear,andincludesarecently-introducedsectionforpeer-reviewedpapers.During2007,threeissuesoftheBulletinwerepublished, including the following new sections:
TheinternetwebsiteisconsideredasalivepublicationofESARDA,updatedregularlybytheSecretary.During 2007, the new version of ESARDA course material, the edited Bulletins, technical sheets and allother informationprovidedby theworkinggroupswereadded to thewebsite.Thewebsitealsopresentsvaluableinformationonsafeguardsconcepts,methodsandequipmenttothosewhomaybeunfamiliarwithsafeguards,andincludesthetextsoffoundingtreaties,nationallawsandaglossary.
The website also includes sections providing news and notification of annual meetings, conferences andsymposia.Indeed,thewebsiteprovidestheprimarymeansforcommunicationonsuchmeetings
A word from the ESARDA Editorial CommitteeB. Autrusson, Chairman
ESARDA BULLETIN, No. 38, June 2008
2
and will include essential practical and organizational information. ESARDA members are encouraged tovisitthewebsiteregularly.
Thewebsiteisalsothecollectivememoryofwhathasbeendone.ItisadatabaseofallmaterialeverpublishedbyESARDA,andtheEditorialcommitteehastheambitionthatthewebsite’s“Library”willbecome a reference centre of data in the field of nuclear safeguards.
Ofcourse,theEditorialCommitteecanonlyworkwiththeinformationprovidedbyESARDAmembers.The Editorial Committee appreciates greatly the time spent by thosewho have contributed to thesuccessofESARDApublicationsover the lastyear,andwouldencourageeveryone tomaintainanactiveinvolvement.TheEditorialCommitteeneedyourfeedback,andanysuggestioniswelcome.
ESARDA BULLETIN, No. 38, June 2008
3
Safeguards in Norway – Experiences with Integrated SafeguardsTonje SekseNorwegian Radiation Protection Authority
Abstract
Norway was among the first countries to have a nu-clear research reactor in operation. JEEP I, a joint project between the Netherlands and Norway, went into operation in 1951.
In the early years of nuclear power there were no safeguards bureau. However, Norway had in the late 1950’s signed an agreement with USA concerning peaceful uses of nuclear energy. The agreement se-cured USA that the nuclear facilities in Norway were not used for military purposes, and provided Nor-way with uranium and other vital equipment for the reactors.
IAEA safeguards was implemented in Norway 1 March 1972. Norway is not part of EURATOM, thus only the bilateral safeguards agreement with the IAEA is enforced.
For Norway the Additional Protocol came into force in 2000, while Integrated Safeguards was imple-mented in 2002. As one of the first countries to have Integrated Safeguards implemented, Norway has a broad experience in this field. This paper will present the nuclear facilities in Norway and discuss the ex-periences with Integrated Safeguards and compare it to traditional safeguards.
1. Nuclear facilities in Norway in the past
Norwayestablishedin1934aplantfortheproduc-tionofheavywaterinthesmallindustrialcentreofRjukan.Theheavywaterplantwasinoperationun-til1988,when itwaspermanentlyshutdown.Theplant was of particular interest to the Germans dur-ing the World War II. Despite the efforts from the Germans tomaximize production and then trans-porttheheavywatertoGermany,theheavywaterneverreachedGermany.TheNorwegianresistancemanaged to sabotage the plant in 1943 and the transportin1944.Today40barrelscontainingheavy
waterisstillrestingonthebottomofTinnsjøen,400m below the surface.
The Institute for Atomic Energy (IFA) was estab-lishedin1948.In1951Norwaywasthesixthcoun-tryintheworldtohavearesearchreactorinopera-tion.OnlytheNuclearWeaponStates(minusChina)andCanadawereearlier.Thereactor,JEEPI,wasa
jointprojectbetweentheNetherlandsandNorway.YellowcakefromtheNetherlands,hiddenawayinUtrechtduringthewar,wasexchangedwithpinsofmetallic uranium from the United Kingdom. The me-tallicuraniumpinswereusedasfuel.Thecapacityof the reactor was 0,2 MW and it was located at Kjeller,just20kmnorth-eastofOslo.
In 1959 the second research reactor came into op-erationinNorway.Thereactorwasa25MWboilingheavywater reactor aimedat researchon naturaluraniumwith heavywater power production. It islocatedinHalden,130kmsouthofOsloandcloseto the Swedish border. Figure 1 shows the reactor hall at present.
Therewashighactivity inthenuclearfield inNor-wayinthe1960’s.Anewresearchreactor,NORA,and a small uranium reprocessing plant came into operationatKjellerin1961.NORAwasa0MWre-searchreactorbuiltforexperimentsinreactorphys-ics.TheIAEAperformeditsveryfirstsafeguardin-spectionatNORAin1962.
ThelastreactorbuiltinNorwaywasJEEPII,whichcameintooperationin1966.JEEPIIisa2MWpoolresearchreactorlocatedatKjeller.JEEPIIwasbuiltto keep up the demand for isotopes for medical and technical purposes, and improve studies in neutron physics.
Sincethe1980’sthediscussionconcerningnuclearpower in Norway has been non existent. Why isthat? The Three Mile Island and Chernobyl acci-dentsdidcertainlynotboosttheinterestfornuclearpower,butNorwayisalsoacountryrichinnaturalenergy resources likehydroelectricpower,oilandgas.
2. Status of nuclear facilities in Norway today
TodaytherearetworesearchreatorsinoperationinNorway.TheyarebothownedandoperatedbytheInstitute for Energy Technology (IFE), former IFA.Figure 2 indicate the localization of the research re-actors.
The Halden boiling water reactor (HBWR) is an in-ternational OECD project that contributes to im-provethesafetyatnuclearplantsaroundtheworldthrough investigation on material science and high burn-up fuel performance. JEEP II produces iso-topesformedicalandtechnicalpurposes.JEEPIIisalso used for neutron transmutation doping of sili-conandresearchinneutronandmaterialsphysics.
MostofthenuclearmaterialinNorwayislocatedatIFE atKjeller and inHalden. There are also smallamounts of nuclear material in other parts of the country, generally consisting of depleted uraniumbeing used for shielding.
3. Material balance areas
Four material balance areas are established in Nor-way.TheJEEP II reactoratKjeller ismaterialbal-anceareaNOA-.NOB-istherestoftheKjellerarea,including among other a pellet production plant, metallurgicallaboratory,andstoragesforfreshandspent fuel. The Halden reactor with facilities like storages for fresh and spent fuel and an instrumen-tationworkshopisorganizedinNOC-.NOD-istherest ofNorway, and includes a lot of small Loca-tions Outside Facilieties (LOFs). The LOFs arespreadalloverNorway.MostoftheseLOFsarein-dustrialradiographycompanieswhichusesdeplet-ed uranium as shielding. In addition there are some smallamountsofnuclearmaterialattheUniversity
Figure 2: Localization of the present nuclear facilities in Norway.
ESARDA BULLETIN, No. 38, June 2008
5
of Oslo, the Norwegian Radiation Protection Au-thority and the Norwegian Museum for IndustryWorkersatRjukan.
4. Norwegian legal framework
Norwayhastwomainlawsthatapplytonuclearen-ergyandradiationprotection. ‘Act on Nuclear En-ergy Activities 12 May 1972’ regulates the licensing regime, general requirements for licences, inspec-tion regime and the legal basis for the regulatorybody.
‘Act on Radiation Protection and Use of Radiation 12 May 2000’ constitutes the legal basis for regulat-ing theuseof ionisingandnon-ionising radiation,radiation protection requirements, medical use of radiation, contingency planning, waste manage-ment and discharges to the environment.
There are two main regulations issued pursuant to theActonNuclearEnergyActivities;
‘Regulations 2 November 1984 on the Physical Pro-tection of Nuclear Material’ and ‘Regulations 12 May 2000 on Possession, Transfer and Transportation of Nuclear Material and Dual-use Equipment’.
According to the act, there shall be an accounting systemfornuclearmaterialsinNorway.IAEAsafe-guards replaced the enforcement of the agreement betweenNorwayandUSAwhenitwasimplement-edinNorway1March1972.AsNorwayisnotpartofEURATOM,onlythebilateralsafeguardsagree-
mentwiththe IAEAisactivelyenforced.However,the agreement with USA is still valid.
TheregulationsonPossession,TransferandTrans-portationofNuclearMaterialandDual-useEquip-mentwasissuedtofacilitatetheAdditionalProtocolcoming into force.
From 1969 IFA was responsible for safeguardingthe nuclearmaterial inNorway through an agree-mentwith theMinistry of ForeignAffairs. This ar-rangement was terminated in June 2004, and the responsibility for safeguards, State System Ac-countancy,wastransferredtotheNRPA.
5. Experiences with the implementation of the Additional Protocol and Integrated Safeguards
ForNorwaytheAdditionalProtocol(AP)cameintoforce16May2000.TheimplementationoftheAPcausedsomemajorchanges in the inspection re-gime. Unannounced inspections and complemen-tary accesses were introduced. Integrated Safe-guards (IS) was implemented in Norway in 2002.Norwaywasatthetimeoneoffewcountriesintheworldtohaveimplementedthisregimefully.
With the implementation of IS the combination of thetraditionalsafeguardsregimeandtheAPshouldbe optimized such that both the economic costs and effective supervision of a country’s nuclearholdings are optimal.
The traditional IAEAregime for inspectingNorwayconsistedinperformingphysicalinventoryverifica-tions at each inspection. With this regime the Hal-densite,NOC-,wasinspected4timesperyear.TheKjellersite,NOA-andNOB-,wereinspected3timesper year. As forNOD-, thismaterial balance areawasinspectedroughlyevery3rdyear.
WiththeimplementationofAPandIS,theIAEAan-nually performs 2-3 unannounced inspections toNorwegian facilities, and thesemay include com-plementaryaccesses.Thereisonephysicalinven-tory verification per year at NOB- and NOC-. AtNOA-thereisatleastonephysicalinventoryverifi-cationevery4thyear,asatNOD-.Concerningtheunannouncedinspections,thereisnormallyoneperyearatNOB-andtwoperyearatNOC-.
6. Integrated safeguards – does it work?
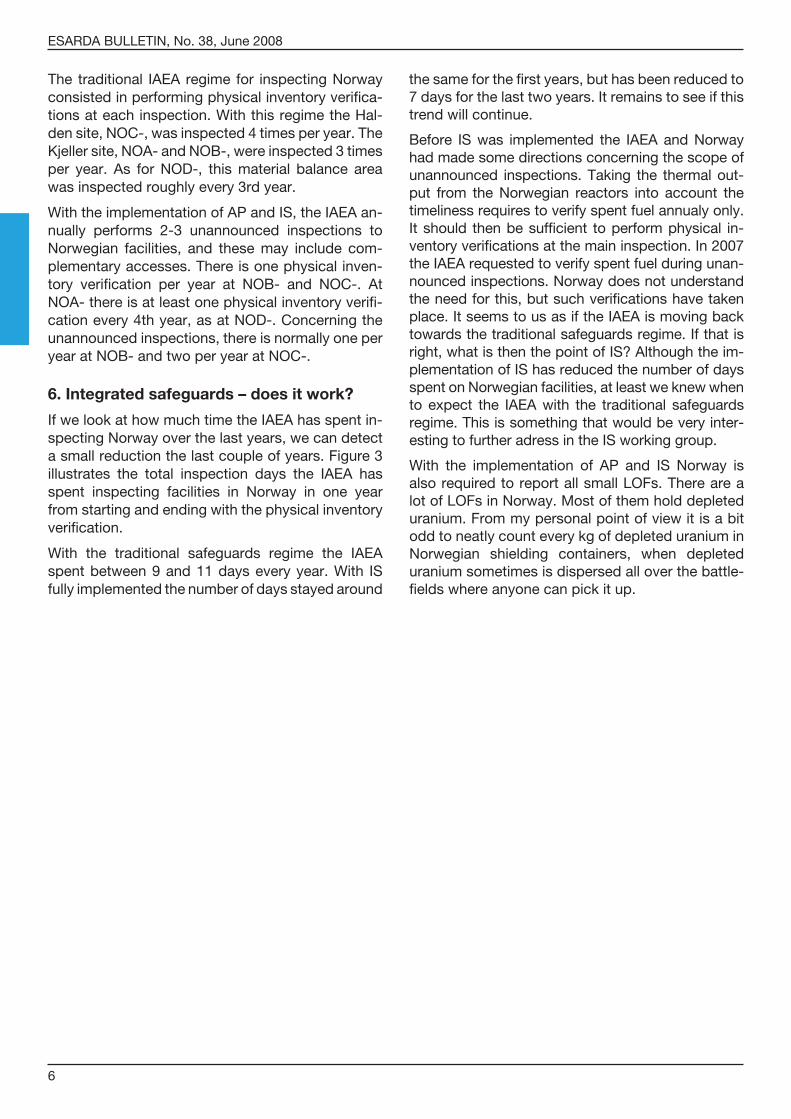
If we look at how much time the IAEA has spent in-spectingNorwayoverthelastyears,wecandetectasmallreductionthelastcoupleofyears.Figure3illustrates the total inspection days the IAEA hasspent inspecting facilities in Norway in one yearfromstartingandendingwiththephysicalinventoryverification.
With the traditional safeguards regime the IAEA spentbetween9and11dayseveryyear.With ISfullyimplementedthenumberofdaysstayedaround
thesameforthefirstyears,buthasbeenreducedto7daysforthelasttwoyears.Itremainstoseeifthistrend will continue.
Before ISwas implemented the IAEAandNorwayhad made some directions concerning the scope of unannounced inspections. Taking the thermal out-put from the Norwegian reactors into account the timelinessrequirestoverifyspentfuelannualyonly.Itshould thenbesufficient toperformphysical in-ventoryverificationsatthemaininspection.In2007theIAEArequestedtoverifyspentfuelduringunan-nouncedinspections.Norwaydoesnotunderstandthe need for this, but such verifications have taken place. It seems to us as if the IAEA is moving back towards the traditional safeguards regime. If that is right, what is then the point of IS? Although the im-plementationofIShasreducedthenumberofdaysspent on Norwegian facilities, at least we knew when to expect the IAEAwith the traditional safeguardsregime.Thisissomethingthatwouldbeveryinter-esting to further adress in the IS working group.
With the implementation of AP and IS Norway isalsorequiredtoreportallsmallLOFs.TherearealotofLOFsinNorway.Mostofthemholddepleteduranium.FrommypersonalpointofviewitisabitoddtoneatlycounteverykgofdepleteduraniuminNorwegian shielding containers, when depleted uranium sometimes is dispersed all over the battle-fieldswhereanyonecanpickitup.
ESARDA BULLETIN, No. 38, June 2008
7
Application of Safeguards in SwitzerlandBärbel Leibrecht Swiss Federal Office of Energy SFOE
Abstract
In Switzerland the responsible body concerning nu-clear material is the Swiss Federal Office of Energy SFOE. The SFOE is enacted as the responsible body for Safeguards since about three decades. The strengthening of safeguards has been stipulated also with the engagement and contribution of Swit-zerland.
This paper is aimed to give a brief overview of the nuclear environment and of the safeguards activities in Switzerland.
1. Introduction
Switzerland signed the Comprehensive Safeguards Agreement with the International Atomic EnergyAgencyIAEAinthelate1960’sandputitinforceonSeptember1978.SincetheverybeginningtheStateSystemofAccountingforandControlofnuclearma-terialSSACwasentrustedtotheSwissFederalOf-ficeofEnergySFOEwhichisresponsibleforallques-tionsconcerningenergypolicy,useandsupply.TheAdditionalProtocolwassignedin2000andratifiedonFebruary2005.TheSwissFederalOfficeofEn-ergyactedastheleadingfederalbodyforimplemen-tation,executionandsupervisionofthisAgreement.
AlthoughSwitzerlandisasmallcountry,itsthenu-clear environment is quite manifold: five nuclear power reactors, three research reactors, two inter-mediate storage installations, one national research centre and one international research centre all are in operation. Moreover, new duties had to be as-sumed and several decommissioned nuclear facili-ties and locations require more concentration, since theAdditionalProtocolwentintoforce.
Beyond this, theSwissSSAC fulfills the followingtasks: participation in elaboration of laws and ordi-nances, formulation of directives and guidelines, involvementinexportcontrolsubjects,grantingoftransportauthorizationandco-operationduringne-gotiation of bilateral agreements with other states.
2. Federal Administration
Switzerlandhasauniquedemocraticsystem.TheGovernment is composed of seven councilors, each
of them being head of a separate Department (Min-istry). The Federal Department of Environment,Transport,EnergyandCommunicationsDETEC isresponsible for providing vital public services like transport routes, communications and electricitynetworks. Every Department has various FederalOfficeswithexpertiseforsolvingthedifferenttech-nicalquestions.TheSwissFederalOfficeofEnergySFOEisprovidingitsexpertiseonthefieldofenergyandistheentrustedbodyforthefulfillingofobliga-tionsresultingfromtheNonProliferationTreaty,theComprehensive Safeguards Agreement and the Ad-ditionalProtocol.
Several reorganizations were made inside of the SFOE since the starting of the accountancy andcontrol of nuclear material. They were reflectingmodification of the main objectives. During theelaboration of nuclear acts and ordinances SSAC was embedded in the Division of Legal Services. With the increasing activities in international and bi-lateral relations, Safeguards became part of the In-ternationalEnergyAffairsSectionbelongingtotheDivisionofEnergyEconomy.
Until the end of 2007 safeguards and nuclear secu-rityweregroupedunderthesameDivisionofLegalServices of SFOE. By decision of the Parliament,and complying with long-standing recommenda-tionsbytheIAEAandtheNEA,anewindependentNuclearSafetyInspectoratewillstartoperationsin2009–untilnowtheNuclearInspectoratehasbeenaunitofSFOE.Inthesamemove,safetyandsecu-ritywillbetransferredtothenewlyfoundedNuclearSafetyInspectorate.
3. Nuclear Environment
Nuclear Reactors
Reactor Type Power MWe In Operation
Beznau-1 PWR 365 1969
Beznau-2 PWR 365 1971
Mühleberg BWR 355 1971
Gösgen PWR 970 1979
Leibstadt BWR 1165 1984
Switzerland has five power reactors as mentioned above at four different locations.
ESARDA BULLETIN, No. 38, June 2008
8
Everyreactor isaseparateMaterialBalanceArea,withthecommonfourKeyMeasuringPointsKMP’s:fresh fuel, core and spent fuel and others. At Gös-genanadditionalKMPistheseparatewetstoragepondbuildingforspentfuelwhichjustwentintoop-eration.
At the very beginning of the accountancy, SFOEprepared the reports for all nuclear installations;then the operators took over their obligations, which is the major part of reporting commitment. NowSSAC processes the reports into the state’s ac-countingsystemandontoIAEA.
Research Reactors
Reactor Type Power Location
Proteus Possibilityforirradiation of fuel elements
0-power Research Centre
PaulScherrerInstitutPSI
Würenlingen
Crocus Self- construction
0-power Swiss Federal Institute of Technology
EPFL
Lausanne
AGN211-P Swimming-pool
0-power UniversityofBasel
There are three research reactors with little output.
Proteus will be reconstructed for new researchprojects.
The other two reactors have no recharges of fuel assemblyduetothesmallcapacity.
During the fist two decades the SSAC carried out reporting for the national research centre, since few years the three sites have assumed their obliga-tions.ReportingofCERN–nuclearmaterial isontheSwiss side only – is carried out by theSwissSSAC.
Intermediate Storage Facilities
Facility Type Capacity Location
Zwilag Storage
for spent fuel and HLW
1 Hot cell
200
casks
Würenlingen
Zwibez Storage
for spent fuel
36
casks
Beznau
Two intermediate storage facilities are in operation. Zwilag is authorized for storage of all kinds of nu-clear and radioactive material. The hot cell is fore-seen for the loading of spent fuel from one cask to anothere.g.incasesealingsystemofthelidislos-ing tightening function. At the moment it is used for transshipping of spent fuel from a small shuttle into a big storage cask, as the big cask can not be load-edinthenuclearpowerplantdirectly.
Zwibez is the storage for spent fuel casks from the twoBeznaureactorsonlyandhasjuststartedop-eration.
Accounting records of Zwilag were prepared for someyearsbyZwibezandhasnowbeenhandedover to the operator, while Zwibez is now preparing reportingfortheirownstoragefacility.
4. Remote Monitoring System
The Remote Monitoring System RMS does notrecord the pictures of the surveillance cameras on a chip,butsendsthemdirectlytoIAEAheadquartersinVienna.Threequarterly inspectionsareomittedbut one or two unannounced inspections are car-riedoutinsteadduringonecalendaryear.Reportingobligationsincrease:inventory,general ledgerandoperationalreporthavetobesenteverymonthin-steadofquarterlyfrequencywiththestandardsur-veillancesystem.
Intwootherfacilities,VaultSaphirandZwilag,theRMS is installed, but neither have the inspection in-tervalsnorthereportingfrequencychanged.
TheIAEAinformedusrecently,thatonlytwofailuresoccurred requiring the re-verificationof spent fuelpond. Disturbances, which demand remedial ac-tion, are still quite common.
5. The way towards Integrated Safeguards
The Comprehensive Safeguards Agreement and the Additional Protocol provide the direction towardsIntegrated Safeguards.
In the middle of 2005, the SSAC provided the Initial Declaration of Switzerland pursuant to the Addition-alProtocolandrenewsitwithannualupdates.Re-
questsforclarificationfillexistinggapsofinforma-tion.Namelyquestionsconcerninghistoricalissuesrequire thorough and time consuming researches andonlyfewquestionshavenotyetbeenansweredcompletely.
ButtheIAEAalreadysignaledthatconclusioncouldbe drawn that neither enrichment nor reprocessing activities have ever been carried out in Switzerland. This is a big step ahead.
6. Conclusions
Starting point of Safeguards was back in 1979. Since then, safeguards in Switzerland have devel-oped together with the renewal of legislation and the entry into force of the Additional Protocol in2005. Big steps forward to Integrated Safeguards could already been achieved and Switzerland islooking forward that broader conclusions will be drawn in the near future.
ESARDA BULLETIN, No. 38, June 2008
10
C/S in Final Disposal Processes – Swedish and Finnish PerspectivesA. Fritzell1, T. Honkamaa2, P. Karhu2, O. Okko2, A. Håkansson1, G. Dahlin3
1 Uppsala University, Uppsala, Sweden2 Finnish Radiation and Nuclear Safety Authority (STUK), Helsinki, Finland3 Swedish Nuclear Power Inspectorate (SKI), Stockholm, Swedene-mail: [email protected]
Abstract
Sweden and Finland have the same strategy for the treatment of the spent fuel from their nuclear power plants: its direct disposal in geological repositories deep in the bedrock. An important consequence of this strategy is that once the spent fuel is emplaced in the repositories, it will be highly inaccessible. This trait is unique among the nuclear facilities that are under safeguards today. For the credibility of safe-guards, the safeguards authorities must ensure that the fuel to be disposed of is verified and that the continuity of knowledge is securely maintained, since no re-verification is feasible if the continuity of knowledge is lost. This highlights the importance of a robust and reliable system of containment and surveillance.
This paper identifies the boundary conditions of such a system, discusses the role of the safeguards authorities and suggests ways of implementation of containment and surveillance in the final disposal processes of Finland and Sweden.
1. Introduction: final disposal in Finland and Sweden
Sweden and Finland are two countries with similar strategies within the field of nuclear power produc-tion.Forexample,bothSwedenandFinlandimple-mentstheonce-throughfuelcyclewherenofuelisreprocessed. This strategy, and the fact that theFennoscandian peninsula has a stable crystallinebedrock, makes geological repositories the natural choice for the disposal of spent nuclear fuel. The similarities between the two countries make close cooperationnotonlypossiblebutalsoclearlyad-vantageous. For this reason, the companies respon-
Sweden and Finland plan to encapsulate the spent fuel in cast iron enforced copper canisters, which willbeemplaced in thegeological repository.Fin-landhasdecidedontherepositorysite,whileSwe-den is in the phase of site selection with two candi-date sites left.
The final disposal procedures in Sweden and Fin-landwilleventuallyrenderthespentfuelunavailablefor verification and identification. The degree of in-accessibilityafterdisposalinthegeologicalreposi-torywillbeuniqueamongallfacilitiespresentlyun-der safeguards in the world and will present an unprecedented challenge for the design of a credi-blesafeguardssystem.Animportantconsequenceoftheinaccessibilityofthespentfuelisthatallsafe-guards issues must be resolved prior to emplace-ment and backfilling.
The disposal process will be continuous with a number of fuel assemblies being prepared for en-capsulation and final disposal each week. Since no such operations take place in the nuclear power in-dustry in Sweden or Finland today, the presentsafeguardssystemneedstobeadjustedtohandlethis new situation. Although continuous processes likeenrichmentandreprocessingexisttodayinoth-er countries, the methodologies there cannot be di-rectly transferred onto the final disposal process.This is due to an important difference: the geologi-calrepositorydoesnothaveanoutflowthatcanbeinvestigated to confirm the presence of all nuclear material.Thisfeaturemakesitnecessarytocreateanew safeguards approach for final disposal of spent nuclear fuel.
In Finland and Sweden alike, there is a common un-derstandingthatcomprehensivenon-destructive-as-
Peer reviewed section
ESARDA BULLETIN, No. 38, June 2008
11
say (NDA)verificationshouldbeperformedprior toencapsulation. NDA measurements provide the op-erators, the safeguards authorities and future genera-tions with understanding of the properties of the dis-posedmaterial,andallowforanobjectiveassessmentof thecorrectnessandcompletenessof theState’sdeclarations.Thecontinuityofknowledge(CoK)mustbe vigilantly maintained after the NDA verification.Hence,arobustandreliablesystemofContainmentand Surveillance (C/S) is of vital importance.
The safeguards challenges of spent nuclear fuel disposalwereidentifiedbytheInternationalAtomicEnergy Agency (IAEA) already at the end of the1980’s,andgenericsafeguardsrequirementswerepresented. [1] However, these did not take into ac-countthesite-specificrequirementsandimplemen-tation practices, e.g. DIQ (Design Information Ques-tionnaire)formsandinspectionroutines.Incrystallinebedrock, the basic safeguards elements are the jointlyappliedDIV(DesignInformationVerification)and C/S functions. The design information of the re-positorywillvarywiththeprogressingdisposalop-eration and the locations of the C/S instruments at thepotentialpathwaystotherepositorymaychangewith time as well. Therefore, the CoK of both design information and of the spent fuel is essential.
This paper addresses the generic application of C/S procedures to spent fuel. It is based on the current views and plans for final disposal in Finland and Sweden.
2. The final disposal process
The Swedish and Finnish final disposal processes both consist of three blocks [2, 3]:
1. Wet interim storage,
2. Encapsulation plant and
3. Geologicalrepository
Presently, the spent fuel is stored in wet interimstorages. These facilities will constitute the starting point of the final disposal process. The encapsula-tionfacilityiseitheradjacenttotheinterimstorage,within the same nuclear site, or further away inwhich case fuel transport to the encapsulation facil-ityisnecessary.InFinlandthetransportisinevita-ble,sincetheLoviisaNPPfuelneedstobetrans-portedtoOlkiluoto,wheretheencapsulationfacilityand the final disposal site is located. Sweden has onecentral interimstorage facility (Clab inOskar-shamn) and the main alternative in Sweden, as pre-sented by the operator, is that the encapsulationfacilityshouldbeconstructed indirectconnectionto Clab, within the same perimeter.
In theencapsulation facility thespent fuelassem-blies will be placed in sealed copper canisters. From a safeguards point of view the encapsulation is a re-batching process where 12 (BWR, VVER) or 4(PWR)fuelassemblies(nuclearfuelitems)areplacedin one canister. The canister thus forms the new fuel itemofinterestforthesafeguardssystemandmustthereforehaveabatchIDthatcanbereadmanuallyor using adequate technical equipment. In this pa-per it is proposed that the new fuel item, the canis-ter, isdefined tobecreated immediatelyafter thecanisterhasbeenfilledandsealedbytheweldingof the lid.
After encapsulation, the spent fuel canisters will be transferred or transported to final disposal tunnels and emplaced in disposal holes, which will be back-filled. The operators want to keep the open rock volumeassmallaspossible,sotheexcavationofnew disposal tunnels and the backfilling of old ones is an ongoing process, concurrent with final dispos-al operations.
3. Boundary conditions for the safeguards system
Afewboundaryconditionsforthesafeguardssys-tem have been identified:
• Thesystemmustbeabletocreateaccuratein-formation about the spent fuel. After emplace-mentandbackfilling the fuelcannotbere-veri-fied, therefore the information and the safeguards conclusion drawn from it must be clear, unam-biguous,acceptedbyallpartiesandwelldocu-mented. This requirement gives the guidance that:- all spent fuel should be subject to verifying
measurements. The NDA technique used should be able to provide credible assurance that no diversion of nuclear material from the measuredassemblyhastakenplace.Thisim-plies that the spent fuel should be verified on at least partial defect level, with acceptable measuring uncertainties. If no such NDA tech-nique is approved for safeguards use at the timearepository istakenintooperation,thebest available technique should be used. In this case, the safeguards system should beprepared,both technicallyandconceptually,for incorporation of new, better technologies, astheyevolve.
- aftertheNDAverification,theCoKshouldbewell maintained. In case of failure, the CoK mustbere-establishedbyuseofanadequatemethod,forexampleNDA.
ESARDA BULLETIN, No. 38, June 2008
12
- thereshouldbeamechanismcreatedthroughwhich the relevant parties (operator, safe-guards authorities, the IAEA) can give their statements and clearances before the mate-rial becomes difficult to access, i.e. before en-capsulation. This brings in the requirement of asufficientbuffercapacitybetweenthefinalverification and the encapsulation/disposal process.
• Thesafeguardsapproachshouldbe feasible inrelation to the use of resources. For instance, the system should not require constant physicalpresence by the safeguards authorities or theIAEA.
• Thesafeguardssystemshouldnotinterferewiththeoperator’sregularactivities,implyingthatthesystem and its componentsmust be robust inthe operating environment. Sufficient amounts of spare parts and components should be made available for all relevant technical systems. Tominimise the intrusiveness of the safeguards systemonoperations,abufferofverifiedfuelas-sembliesreadyfordisposalisbeneficial.Withabuffer, a failure in the NDA equipment could be handled without causing a disruption in the en-capsulation process.
• Thepresentthreemonthoroneyearinspectionintervalisnotafunctioningstrategyforthefinaldisposal process, since the material will become difficulttoaccesscontinuously.Thismakesveri-ficationofinventoryimpossible.
• Backflow of the material in the process chaincouldseverelydisturboperations.Therefore,theIAEA and the safeguards authorities should make agreatefforttoensurea.)thattheC/Ssystemisdesigned with sufficient robustness and redun-dancysothattheprobabilityofalossofCoKisminimised, and b.) that, in case of a loss of CoK, itcouldberestoredbyNDAmeasurementswith-out theneed forabackflowofmaterial.Havingprovidedasafeguardssystemwiththecapabili-ties listed in a.) and b.) the IAEA and the authori-tieswillhavereducedtheprobabilityofasitua-tion requiring a re-take ofmaterial. However, ifthe operator creates conditions such that safe-guardscannotbeeffectivelymaintained,thesitu-ationcannotbeexcluded.Forsuchanevent,TheIAEAshouldretaintheoptiontore-verifymaterialthat has not been emplaced and backfilled.
4. Authority requirements
The Swedish and Finnish safeguards authorities havenotyetissuedanyrequirementsforthesafe-
guardssystemforthefinaldisposalprocesses.Un-der no circumstance can these requirements be less stringent than those (still undefined) of the IAEA. However, some guidelines can be found in the re-sults of the IAEA Consultants Group Meeting of 1995 [3]. The meeting recommendations include: “spentfuel[…]bedisposedofonlyasverifiednu-clear material on which continuity of knowledge(CoK)hasbeenmaintained”.Inthesafeguardster-minology,CoKisconsideredmaintainedaslongastheC/Ssystem thathasbeenappliedon thenu-clear material can be evaluated as acceptable. Due totheintrinsicredundancyofadualC/Ssystem,itproduces an acceptable result also when one part ofitfails.AdualC/Ssystemisthereforethereason-able choice and should be required from the author-ities.Inthiscontextitmayturnouttobefeasibletore-definedualC/Sinsuchawaythatitrequirestwoconclusive positive results in order for a conclusion ofmaintained CoK,making it an “enhanced dualC/S”.
Onanationalleveltheauthorities’concernistopro-vide future generations with credible assurance that the nuclear material declared to be disposed of is actuallyemplacedinthedeclaredlocationandhasthe declared properties. This means that correct and complete records have to be maintained over centuries, which implies two challenges:
• toensurethatcorrectandcompletedocumenta-tion of all nuclear material is created, and
• topreservethisdocumentationsothat it isac-cessible to future generations.
Theauthoritiesshouldthusrequirethatonlyverifiedmaterial,onwhichcontinuityofknowledgehasbeenkept, is allowed to pass through the disposal proc-ess.
Thearchivalchallengemustalsobemet,notonlyinthe sense that the data and information must be available during an unforeseeable time-span butalso with consideration of the authentication of the data.
An important question for the safeguards authori-ties to consider is the ownership and maintenance of safeguards equipment: should the equipment belong to the authorities or the operators? When balancing these alternatives, the authorities will havetobalancetheintegrityofthecollectedinfor-mation against the intrusiveness on operations and resourceefficiency. If theauthoritiesown,operateandmaintainforexampletheNDAequipment,itwillbehighlyresourcedemandingsincetheequipmentwillbeusedcontinuously.Remoteoperationoftheequipment poses large initial costs but could be
ESARDA BULLETIN, No. 38, June 2008
13
more economical in the long run. However, in case of a failure, the operators have to halt operations untilpersonnelfromtheauthorityarriveandrepairtheapparatus.On theotherhand, the integrityoftheimplementedsafeguardssystemcouldbeques-tioned if the operators own, operate and maintain the measuring equipment. A related issue is wheth-er the IAEA can use information from the national authorities’ safeguards systems. These issuesshould be carefully considered by the authoritiesand the IAEA.
5. C/S functions
Possible diversion scenarios are described in theSAGORreports[1].Toprotectagainstthediversionscenarios we propose the following functions for the C/S of a final disposal safeguards system. Itshould be noted that C/S functions are not meant to betheonlysafeguardsmeasuresbutarecomple-mented with other methods.
1. Theassuranceofintegrityandidentityofthefuelelements after the final verification until encapsu-lation is achieved by the constant surveillanceand appropriate sealing of items. Dual C/S (or perhaps“enhanced”DualC/S)isrecommended,as losing CoK at this stage would interrupt the encapsulationprocessandmayrequirere-verifi-cation.Afingerprintingsystemof fuelelementswould make confirmation of CoK more robust and,consequently,requirementsoftheC/Ssys-temscouldberelaxed.Ifthisphaseincludesfueltransportoverlongdistances,atrackingsystemmaybeappropriate.
2. The encapsulation process is performed under constant, uninterrupted surveillance. For moni-toringtheflowintheencapsulationfacility,portalmonitoring is a viable option.
3. The CoK must be maintained also in the tunnel systemoftherepository.Ariskassessmentanal-ysisisnecessarytofindthebestwaytoachievethis. Environmental conditions in the disposal tunnels excavated in the crystalline bedrock inSwedenorFinlandareexpectedtobesuchastoallowfortheuseofportalmonitoringsystemsorother forms of robust radioactivity measure-ments.Monitoringofonly theaccesspoints tothe repository (ramp, lift and ventilation shaftsand drill holes from the site investigation) while viewingthetunnelsystemasa“blackbox”isadesirable safeguards approach because of the relatively low costs for equipment and labour.However,ariskassessmentmaygivetheresultthatthe“blackbox”approachisnotsufficiently
secure. In that case it should be complemented with additional safeguards activities under-ground.Anexampleisthattheemplacementve-hicle could be equipped with a fingerprint reader andapositioningandradiationmonitoringsys-tem to detect any replacement attempts. Afterthecanisterisemplaced,non-C/Sactivitieslikeinspections and environmental sampling could revealanyundeclaredopeningofcanisters.Forthe purpose of monitoring activities in the final disposal tunnels, the performance of portal mon-itoring should be investigated. The monitoring should be sensitive enough to detect the diver-sion of a shielded canister if it is to be of use for safeguards purposes.
6. Process models
The requirements and the performance of a safe-guardssystemcanbeanalysedonlyifthedisposalprocess is known. At the moment the process is not completelydefinedeitherinFinlandorinSweden.Since the Finnish plans are more evolved, this pre-liminarymodeliscreatedfromtheFinnishcase.
6.1Analysisofprocessmodel“FIN-1”
The first safeguards concept for the Finnish final disposal process is proposed in a STUK report [5]. The concept is produced for the process model FIN-1, which is based on the following assump-tions:
• There are interim storages, one of them beingwithin the same site as the planned encapsula-tionplantandgeologicalrepository.
• Final NDA verificationwill be performed at theinterim storages, which have separate pool areas where verified fuel is stored. These pools serve as a buffer zone.
EarlyNDAverificationisabenefittothesafeguardssystembecauseitprovideslargebufferstoragesofverifiedfuelreadytobeintroducedintothefinaldis-posalprocess.A longanalysisperiodalsofollowsfrom the early measurements, which means thatthere is time to draw safeguards conclusions before encapsulation. This makes the system non-intru-sive.
After the NDA verification the challenge is to main-tain the CoK. We propose to develop special finger-printing methods, which would be used simultane-
ESARDA BULLETIN, No. 38, June 2008
14
ouslywiththeNDAverification.A“fingerprint”wouldbe a specific pattern based on a unique physicalcharacteristic of the fuel assembly. This patternshouldbepractically impossibletocounterfeit.Anexample of such a method is reading themicro-structuresofthefuelitemsurfaces[6].Theselectedmethod could be combined with weighing and ra-diationpatternmeasurementsofthefuelassemblyto detect if the integrity of the item has beenbreached.
ThefingerprintingmethodwouldmaketheC/Ssys-tem more robust since the fingerprint would provide identification of the item and evidence that item in-tegrityisintact.However,nosuchsystemisinusetoday.Potentialcandidatesexist,likesurfacescan-ningmethods,whichcanbeusedtouniquelyiden-tifysurfacesorboltsofthefuelassembly.Theread-ing of fingerprints would detect the replacement of anassembly,aswellastheremovalofbolts.Asim-
ilar fingerprinting method could be also used to ver-ifyitsidentityandintegrityofthedisposalcanister.
All buffer storages and fuel movement operations shouldbe continuouslymonitoredwith a camera.Sealingmaybeusedasacomplementarymethod.Forfueltransportstheuseofatrackingsystemisproposed.
Underground operations are challenging to monitor. Ifallaccesspointstotherepositorycanbecompre-hensivelymonitoredbyradiationdetectors,thede-tector network could be a backbone of the safe-guards system.However, the detection capabilityof the radiation detectors should be investigated. The need for other C/S methods or even the use of noveltechnologiescanbeanalysedwhentheproc-ess is better known.
ThesafeguardsprocessesofFIN-1modelarede-scribed in Table 1. Some of the proposed methods areoptional.Furtheranalysisisneeded.
Reliability:medium(MTBF=fewyears).Servicing time less than 1 month.
Asparesystemmayberequired.
Remote monitored.
Assemblyfingerprinting To create an unambiguous fingerprintoftheassemblyforlater identification. The fingerprinting and NDA verification are simultaneous operations. Fingerprinting could alsodetectiftheintegrityoftheassemblyiscompromised.
Surface fingerprinting (or some other identi fication method).
Radiation fingerprinting.
Measuringtheassemblyweight.
Further research is required.
Reliability:medium(MTBF=fewyears).Probabilityoffalsepositivesorfalsenegatives lower than 10-6. Servicing time less than 1 month.
Asparesystemmayberequired.
Remote monitored
Integration with NDA verifier (fingerprinting and verification are simultaneous operations).
Buffer storing of verified assemblies
To maintain CoK during the cask loading.
Camera surveillance. Camerareliabilitymedium(MTBF=fewyears).
Remote monitoring desirable.
Transport cask loading To maintain CoK during the cask loading.
Authenticated fingerprints maintain CoK.
Camera surveillance.
Camerareliabilitymedium(MTBF=fewyears).
Remote monitoring desirable.
Cask transport/transfer To maintain CoK during the transport and to detect covert opening and substitution.
Authenticated fingerprints maintain CoK.
Seals.
Sealreliabilityhigh(MTBF=severalyears).
Remote monitoring desirable.
Cask storing To maintain CoK during the cask storing and to detect covert opening and substitution.
Authenticated fingerprints maintain CoK.
Seals.
Sealreliabilityhigh(MTBF=severalyears).
Remote monitoring desirable.
Cask unloading To maintain CoK during the cask unloading and to detect diversion and substitution.
Authenticated fingerprints maintain CoK.
Camera surveillance.
Camerareliabilityhigh(MTBF=severalyears).
Remote monitoring essential.
ESARDA BULLETIN, No. 38, June 2008
15
Encapsulation process ToverifyCoKoftheassemblies. Verificationoffingerprints. Remote monitoring cameras, inspector presence, portal monitors. All diversion routes should be covered.
Overallreliability:high(MTBF=severalyears).
Servicingtime:fewdays.
Remotemonitoringsystemrequired.
Canister finger printing To create an unambiguous fingerprint from the canister for later identification. Fingerprinting couldalsodetectiftheintegrityof the canister is compromised.
Surface fingerprinting (or other identification method)
or other novel method.
Radiation fingerprinting.
Measuring canister weight.
Further research is required
Overallreliability:high(MTBF=severalyears).
Servicingtime:fewdays.
Remotemonitoringsystemrequired.
Probabilityoffalsepositivesorfalsenegatives lower than 10-6.
Canister transfer to the emplacement hole
To maintain CoK during the transfer.
Authenticated fingerprints maintain CoK.
Portalmonitors.Alldiversion routes should be covered.
Overallreliability:high(MTBF=severalyears).
Servicingtime:fewdays.
Remotemonitoringsystemrequired.
Canister emplacement ToverifyCoKofthecanister. Verificationoffingerprints. Remote monitoring cameras, inspector presence, portal monitors. All diversion routes should be covered.
Overallreliability:high(MTBF=severalyears).
Servicingtime:fewdays.
Remotemonitoringsystemrequired.
Backfilling To detect undeclared removal of the canister
This paper has identified a number of challenges in the disposal process in geological repositories in SwedenandFinlandthatcanberesolvedeitherbyresearcheffortsorbyanalysesanddecisionsmadebythesafeguardsauthorities:
• AnNDAverificationsystemthatwouldsatisfytheneeds for partial defect level verification does not existtoday.Developmentofatomographicveri-fyingtechniquecouldpotentiallysolvethisprob-lem. Such work is done under the IAEA Support ProgramtaskJNT1510,withactiveparticipationbyFinlandandSweden.
• Theperformanceofportalmonitorsforuseinthefinal disposal tunnels needs investigation. If the radiation detectors used as portal monitors can be made sensitive enough to detect the diver-sionofashieldedcanistertheycouldbeimple-
mented with the purpose of monitoring activities intherepository.
• Afingerprintingmethod tobeusedon fuel as-semblies before encapsulation, and on the closed disposal canisters after encapsulation, is desira-ble.Themethodshouldbefastandwithaverylowprobabilityoffalseidentification.
• Foraresourceefficientoperationofsafeguardsequipment, remote monitoring will be needed. This concept will have to be developed further, includingextensivereliabilitytesting.
• A lotofeffort (seeforexample [7]) isbeingputintofindingasecurewayoftransferringinforma-tion to future generations. This research should be closelywatchedby the national safeguardsauthorities, whose task it is to inform the coming generations of the contents of the geological re-positories. A method to authenticate the infor-
ESARDA BULLETIN, No. 38, June 2008
16
mation to be placed in archives is also needed since the correctness of the information is as im-portant as its completeness.
• Thequestionofownershipofsafeguardsequip-ment should be resolved. The IAEA also needs to decide on the possibility of using informationcreatedbythenationalsafeguardsauthorities.
• As has been stressed above, the C/S systemneeds to be both robust and reliable. If the C/S systemwere todeliver inconclusive results theoperation of the final disposal process would be affectednegatively.Amethodologyofdetermin-ingtheC/Ssystem’sabilitytodeliverconclusiveresults is therefore desirable. At Uppsala Univer-sityinSweden,aresearchprojectisplannedthataimsatquantifyingtheabilityofaC/Ssystemtodetect an anomaly and to reveal the courseofactionsleadingtotheanomaly.Suchquantifica-tionwouldprovideapossibilitytologicallycon-nect the important concept of CoK to measura-ble entities. Furthermore, in the ESARDA Working Group on Containment and Surveillance a quali-tativemethodofdeterminingasystem’sAssur-anceandPerformanceisbeingdeveloped.
• InSwedenandFinlandtoday,thesafeguardssys-tem does not operate on continuous processes like the future final disposal process. This means thatthemethodsusedtodayarenotwelladaptedto the future situation where the encapsulation plantand the repositoryare inoperation.Somemethods used abroad in safeguarding continuous processes, like enrichment or reprocessing, could possiblybeimplementedbutthereisoneveryim-portant difference: the enrichment and reprocess-ingplantshaveanout-flow that couldbecom-pared to the in-flow to verify that all nuclearmaterial is accounted for, while the material em-placedintherepositorywillnotbeaccessibleforverification.Thisisacompletelynewtrait,uniqueamongallnuclearfacilitiesinoperationtoday,and
it will demand a concentrated planning and de-sign effort from all instances involved in safe-guards in Sweden and Finland. This means that closeco-operationatalllevels,includingtheau-thorities SKI (Sweden) and STUK (Finland), would be of great benefit for both countries.
• Connected to theprevious item is the issueofmeasuring strategy, measuring accuracy andconfidence levels. To obtain a cost effective safeguardssystemwithpredictablepropertiesitis important to define exactly what should bemeasured, and for what purpose. The measure-mentsshouldthusbeperformedwithrationallydefined limits on accuracies in order to be able to quantify the performance of the implementedsystemasawhole.Thisisimportantinordertobe able to determine with which confidence one maystate that thefinaldisposalprocesses runaccording to regulations and declarations. Hence, we propose that a project addressingthese issues is initiated.
8. References[1] Safeguards for the final disposal of spent fuel in geological re-
[3] SKB: Programme for research, development and demonstra-tion of methods for handling and final disposal of nuclear waste, including societal research, 2004
[4] Report of the consultants group meeting on safeguards for the direct final disposal of spent fuel in geological repositories, STR-305,IAEA,1995
[5] J.Rautjärvi,A.Tiitta,J.Saarinen, Preliminary concept for safe-guarding spent fuel encapsulation plant in Olkiluoto, Finland. PhaseIIIreportonTaskFINA1184oftheFinnishsupportpro-gramtoIAEASafeguards.STUK-YTO-TR187.STUK,Helsinki2002.
[6] J.Buchanan, ‘Fingerprinting’ documents and packaging, Na-turevol.436,2005
[7] Y. de Lusenet, Preservation of digital heritage, European Com-missiononPreservationandAccess,2002
ESARDA BULLETIN, No. 38, June 2008
17
3D Reconstruction in Nuclear SecurityG. Boström, M. Fiocco, J.G.M. Gonçalves, D. Puig, V. SequeiraEuropean Commission – Joint Research CentreInstitute for the Protection and Security of the CitizenI-21020, Ispra, Italy
B. Chartier, R. Kiesser1, F. Mariotte, M. Richard, P. Zamora1
CEA-DAM, Bruyères Le Châtel, Paris, France1 CEA-DAM, CESTA, Barp, France
Abstract
Accurate modelling is gaining increasing importance in security applications. Indeed, realistic and dimen-sionally accurate models of critical areas can be used for prevention and simulation exercises as well as for planning emergency responses once an at-tack is perpetrated. CEA-DAM and EC-JRC en-gaged in a joint exercise involving the simulation of a terrorist attack in an urban area with possible re-lease of radiological substances. JRC was responsi-ble for creating a dimensionally accurate (centimetre accuracy) 3D model from the urban area “as-is” be-fore and after the attack. Further tests involved the automatic 3D detection of changes in both indoors and outdoors environments. The paper describes the principles and technologies behind the genera-tion of photo-realistic and accurate 3D models of wide areas “as-is”, and will discuss the use of those technologies for nuclear security applications.
Keywords: Nuclear Security, 3D Reconstruction,Data Integration, Change Detection
1. Introduction
TheFrenchCommissariatàl’EnergieAtomique,Di-rectiond’ApplicationsMilitaires–CEA-DAM–andtheEuropeanCommission’sJointResearchCentre,InstitutefortheProtectionandSecurityoftheCiti-zen – JRC-IPSC – engaged into informal discus-sionsontechnologiesrelevantforsecurityresearch.From these discussions, JRC’s three dimensionallaser-basedtechnologieswereidentifiedasofinter-esttofuturesecurityapplications.
CEA-DAMinvitedJRC-IPSCtoparticipateinajointexerciseinvolvingthesimulationofaterroristattackin an urban area with possible release of radiologi-cal substances. JRC was responsible for creating a 3Dmodel from theurbanarea “as-is”beforeandafter the attack. To this effect a JRC team travelled totheexercisesiteandmadeaphoto-realisticanddimensionallyaccurate3Dreconstructedmodelus-inglaserrangeandphotographyscanning.3DData
acquired from different viewpoints were registered and integrated with the photographic records into a singlegeometricmodelwithcentimetreaccuracy.Followingthe“attack”,specificspotsoftheurbanarea were again scanned and new models created. Several practical applications of these 3D models arecurrentlybeingconsidered:
a) Documentationoftheareaunderattack–beforeandafter;
b) Detectionofchanges;
c) Geometric input to atmospheric dispersion mod-els;
d) Calibration of atmospheric dispersion models in what concerns the propagation and diffusion of smokeplumesandclouds;
e) Generic platform for the intuitive presentation and integration of data from multiple sources and time-frames(e.g.,groundpenetratingradar,sat-ellite and airborne images and 3D scans, radia-tion and thermal images, CAD data, etc.)
This paper describes the investigations done, in-cluding the results obtained in the experimentalcampaign. It also looks forward in terms of future securityapplications.
2. 3D reconstruction
Threedimensionalreconstruction–3DReconstruc-tion–referstothetechniquesthatallowthecrea-tionofdimensionallyaccurategeometricmodelsofreal environments both indoors and outdoors, in-cluding small objects. For several years JRC hasbeen developing techniques to this effect [1, 2]. Most of the techniques are based on the use of la-ser based instrumentation to generate 3D cloud of pointsoftheobjectorenvironmenttoreconstruct.These clouds of points contain the 3D information as perceived from the sensor. In general, to recon-struct an environmentmore than one single-viewcapturepointisnecessaryassomeobjectshide–i.e.,occlude–others.
ESARDA BULLETIN, No. 38, June 2008
18
Figure1showstwocommercial,off-the-shelf,laserrange scanners that are used for 3D data collection. Whereasthelaserontheleft(Fig.1.a)ismainlyusedfor indoor applications the laser on the right (Fig. 1.b)isgenerallyusedforoutdoorapplications.Thisdivisionismainlytheresultofconsiderationsonac-curacy,spatialresolutionandmaximummeasuredrange. Table 1, illustrates the main features for both instruments.Thereconstructionofsmallobjectsismainly obtained using triangulation based laserscannersthoughthedetailsarebeyondthescopeof this paper.
Onceanenvironmentisscannedthereistheneedto:
a) Get a single coordinate frame to the data from single-viewscans–registration:
b) Combine the data from multiple scans and, even-tually,discard3data
c) Integrateothertypesofdataintothe3Drecon-structed model. Important pieces of data are photos from the environment to create visuallyrealistic models
AlltheaboveoperationsaredoneusingJRC’s3D Reconstructor® software package. Figure 2 de-scribes the architecture/paradigm behind the com-plete and realistic 3D reconstruction of environ-ments. The 3D Reconstructor package implements the different processing blocks.
To illustrate a practical use for 3D Reconstructor technologiesoneshouldmentionitsroutineusebythe InternationalAtomicEnergyAgency (IAEA) fordesign informationverification (DIV)purposes.DIVaimsataccuratelymappinginteriorsofcomplexnu-clear facilitiesundersafeguards.DIVactivitiesareperformedduring thecomplete life cycleof anu-clearfacilitytoconfirmthatitoperatesasdeclaredand is not misused for undeclared nuclear activities [3].
3. Joint nuclear security exercise
CEA’s emergency response project organized aninternal– to theCEA–securityexercise involvingtheparticipationofradiologicalandnuclearexpertsfromseveralsites.Theexercisewastriggeredbyan
2 - 3D RECONSTRUCTION Three dimensional reconstruction – 3D Reconstruction – refers to the techniques that allow the creation of dimensionally accurate geometric models of real environments both indoors and outdoors, including small objects. For several years JRC has been developing techniques to this effect [1, 2]. Most of the techniques are based on the use of laser based instrumentation to generate 3D cloud of points of the object or environment to reconstruct. These clouds of points contain the 3D information as perceived from the sensor. In general, to reconstruct an environment more than one single-view capture point is necessary as some objects hide – i.e., occlude – others.
(a) (b)
Figure 1: (a) Laser scanner on tripod with dolly for indoor operation; (b) Laser scanner mounted on vehicle for outdoor operation.
Figure 1 shows two commercial, off-the-shelf, laser range scanners that are used for 3D data collection. Whereas the laser on the left (Fig. 1.a) is mainly used for indoor applications the laser on the right (Fig. 1.b) is generally used for outdoor applications. This division is mainly the result of considerations on accuracy, spatial resolution and maximum measured range. Table 1, illustrates the main features for both instruments. The reconstruction of small objects is mainly obtained using triangulation based laser scanners though the details are beyond the scope of this paper.
Z+F Imager 6 Riegl Z 420i
Range 1 - 79 m 2 - 250m ( > 10%) or 800m ( > 80%)
Maximum Acquisition Rate 500,000 points per second 12,000 points per second
Accuracy Better than 4 mm 10mm
Scanner Angular View 310° (vert.) by 360° (horiz.) 80° (vert.) by 360° (horiz.)
Output range and reflectance range and reflectance
Eye Safety (Laser Class) Class 3R Class 1
Table 1: Main features of two laser scanners used for 3D modelling
2 - 3D RECONSTRUCTION Three dimensional reconstruction – 3D Reconstruction – refers to the techniques that allow the creation of dimensionally accurate geometric models of real environments both indoors and outdoors, including small objects. For several years JRC has been developing techniques to this effect [1, 2]. Most of the techniques are based on the use of laser based instrumentation to generate 3D cloud of points of the object or environment to reconstruct. These clouds of points contain the 3D information as perceived from the sensor. In general, to reconstruct an environment more than one single-view capture point is necessary as some objects hide – i.e., occlude – others.
(a) (b)
Figure 1: (a) Laser scanner on tripod with dolly for indoor operation; (b) Laser scanner mounted on vehicle for outdoor operation.
Figure 1 shows two commercial, off-the-shelf, laser range scanners that are used for 3D data collection. Whereas the laser on the left (Fig. 1.a) is mainly used for indoor applications the laser on the right (Fig. 1.b) is generally used for outdoor applications. This division is mainly the result of considerations on accuracy, spatial resolution and maximum measured range. Table 1, illustrates the main features for both instruments. The reconstruction of small objects is mainly obtained using triangulation based laser scanners though the details are beyond the scope of this paper.
Z+F Imager 6 Riegl Z 420i
Range 1 - 79 m 2 - 250m ( > 10%) or 800m ( > 80%)
Maximum Acquisition Rate 500,000 points per second 12,000 points per second
Accuracy Better than 4 mm 10mm
Scanner Angular View 310° (vert.) by 360° (horiz.) 80° (vert.) by 360° (horiz.)
‘alarm’indicatingthata“terroristaccidentwithre-lease of radioactive/radiological substances had takenplaceattheCEA-CESTAresearchcentre.”
The“attack”consistedofhavingtwocarsburn/ex-plode in an urban area, with simulated release of several samples of radiological and/or radioactive material. Different teams from different CEA sites immediatelytravelledtoCESTA.Theteamsbroughtwith them a van with NDA and radiological detec-tion equipment, as well as a car equipped for de-tecting radioactive substances in urban environ-ments. All measurements are geographicallyreferencedusingon-boardGPS.
JRC’s participation: During theexercise theJRCteam created 3D models from the urban environ-ment before and after the simulated terrorist at-tacks. This included scans from:
a) an indoorenvironment–warehouse– todocu-mentthepremisesanddetectchanges;
b) theurbanenvironment–outdoors– for3Dsitereconstruction;
c) theburningvehicles–outdoors–toinvestigatethe use of 3D information to model the smoke plumes and clouds.
The following sections will detail the three inde-pendentexercises
4. Indoor environment
Theobjectivesofthisexerciseweretwofold:
i) tocreateadimensionallyaccurateandvisuallyrealistic model of an indoor environment that couldbeusedfordocumentationpurposes;
The warehouse was scanned from ten different po-sitions with the Z+F laser scanner. For each scan a set of seven photographs were taken (total: 70 pho-tos). With both the range and photo images a milli-metreaccuracymodeloftheenvironmentwascre-ated. Figure 3 illustrates the 3D model of the warehouse.
Two more scans were done to detect minor chang-es. It should be noted that none of the changes in-troduced in the environment were known to the team. All changes were detected. Figure 4 shows some of the changes detected in red/orange. These include (a) changing the position of a mobile phone onashelf;(b)changingthepositionsofafewboxeson the shelves; (c) rotating apotwith a plant; (d)changingthepositionofthecrane;(e)changingtheposition of the forklift vehicle.
The total time for acquiring the 3D and visual data for ten modelling scans and two verification ones,
Once an environment is scanned there is the need to: a) Get a single coordinate frame to the data from single-view scans – registration: b) Combine the data from multiple scans and, eventually, discard redundant data c) Integrate other types of data into the 3D reconstructed model. Important pieces of data
are photos from the environment to create visually realistic models
All the above operations are done using JRC’s 3D Reconstructor® software package. Figure 2 describes the architecture/paradigm behind the complete and realistic 3D reconstruction of environments. The 3D Reconstructor package implements the different processing blocks.
Figure 2: System’s Architecture of JRC’s 3D Reconstructor ®
To illustrate a practical use for 3D Reconstructor technologies one should mention its routine use by the International Atomic Energy Agency (IAEA) for design information verification (DIV) purposes. DIV aims at accurately mapping interiors of complex nuclear facilities under safeguards. DIV activities are performed during the complete life cycle of a nuclear facility to confirm that it operates as declared and is not misused for undeclared nuclear activities [3].
3 - JOINT NUCLEAR SECURITY EXERCISE CEA’s emergency response project organized an internal – to the CEA – security exercise involving the participation of radiological and nuclear experts from several sites. The exercise was triggered by an ‘alarm’ indicating that a “terrorist accident with release of radioactive/radiological substances had taken place at the CEA-CESTA research centre.”
The “attack” consisted of having two cars burn/explode in an urban area, with simulated release of several samples of radiological and/or radioactive material. Different teams from different CEA sites immediately travelled to CESTA. The teams brought with them a van with NDA and radiological detection equipment, as well as a car equipped for detecting radioactive substances in urban environments. All measurements are geographically referenced using on-board GPS.
JRC’s participation: During the exercise the JRC team created 3D models from the urban environment before and after the simulated terrorist attacks. This included scans from:
a) an indoor environment – warehouse – to document the premises and detect changes; b) the urban environment – outdoors – for 3D site reconstruction;
c) the burning vehicles – outdoors – to investigate the use of 3D information to model the smoke plumes and clouds.
The following sections will detail the three independent exercises
Figure 3: View of the 3D reconstructed model of a warehouse. Ten laser scans were used to build this
model, taking approximately 60 minutes. All points were measured with an accuracy of 4mm. Light blue indicates areas for which no 3D information is available (i.e., have not been scanned).
4 - INDOOR ENVIRONMENT The objectives of this exercise were twofold:
i) to create a dimensionally accurate and visually realistic model of an indoor environment that could be used for documentation purposes;
ii) to detect minor changes occurring in this quasi-static environment
The warehouse was scanned from ten different positions with the Z+F laser scanner. For each scan a set of seven photographs were taken (total: 70 photos). With both the range and photo images a millimetre accuracy model of the environment was created. Figure 3 illustrates the 3D model of the warehouse.
(a) (b) (c) Figure 4: Detection of changes inside the warehouse. Changes are indicated in red/orange: (a) changes in the shelves area; (b) changes in warehouse’s main hall – three objects were detected: a mobile phone on
the shelf (bottom left), the crane cable (top right) and the forklift (centre-right); (c) false colour code – red corresponds to distance changes larger than 10cm; change in the object in (a) is about 6.5cm.
Figure 3: Viewofthe3Dreconstructedmodelofawarehouse.Tenlaserscanswereusedtobuildthismodel,takingapproximately60minutes.Allpointsweremeasuredwithanaccuracyof4mm.Lightblueindicatesareasforwhichno3D information is available (i.e., have not been scanned).
c) the burning vehicles – outdoors – to investigate the use of 3D information to model the smoke plumes and clouds.
The following sections will detail the three independent exercises
Figure 3: View of the 3D reconstructed model of a warehouse. Ten laser scans were used to build this
model, taking approximately 60 minutes. All points were measured with an accuracy of 4mm. Light blue indicates areas for which no 3D information is available (i.e., have not been scanned).
4 - INDOOR ENVIRONMENT The objectives of this exercise were twofold:
i) to create a dimensionally accurate and visually realistic model of an indoor environment that could be used for documentation purposes;
ii) to detect minor changes occurring in this quasi-static environment
The warehouse was scanned from ten different positions with the Z+F laser scanner. For each scan a set of seven photographs were taken (total: 70 photos). With both the range and photo images a millimetre accuracy model of the environment was created. Figure 3 illustrates the 3D model of the warehouse.
(a) (b) (c) Figure 4: Detection of changes inside the warehouse. Changes are indicated in red/orange: (a) changes in the shelves area; (b) changes in warehouse’s main hall – three objects were detected: a mobile phone on
the shelf (bottom left), the crane cable (top right) and the forklift (centre-right); (c) false colour code – red corresponds to distance changes larger than 10cm; change in the object in (a) is about 6.5cm.
Figure 4: Detection of changes inside the warehouse. Changes are indicated in red/orange: (a) changes in the shelves area;(b)changesinwarehouse’smainhall–threeobjectsweredetected:amobilephoneontheshelf(bottomleft),thecranecable(topright)andtheforklift(centre-right);(c)falsecolourcode–redcorrespondstodistancechangeslargerthan10cm;changeintheobjectin(a)isabout6.5cm.
wasabout90minutes.Processingtimeamountedto about 3 hours.
5. Outdoor urban environment
In this case, and considering the dimensions and complexityofthewideareaenvironmenttheworkwas divided in two parts:
Part I: Build a general overview model of the site –thisobjectiveinvolvedthecreationofa3Dmodelofthesitelayoutas“seen”fromtheexistingwatertowerwhichwasthenupdatedby localscansac-quired on the ground. Figure 5 shows three snap-shots of the site model. The model integrates data
acquired from the water tower and 7 scans acquired at ground level.
Part 2: Document the “terrorist” attack scene – this objective was met by scanning from severalviewpoints– to resolve forpossiblespatialocclu-sions–thestreetwherethe“terrorist”attacktookplace. This was done before and after the attack. Figure6illustratesthesescans.
Given that in a few cases the range of distances was inferior to 50meters, both the indoor and out-doorlaserscanners(seeFigure1)wereused.JRC’s3D Reconstructorsoftwarecaneasilymergeandin-tegrate data from scans with different spatial reso-lution.
ESARDA BULLETIN, No. 38, June 2008
21
6. Plume detection and modelling
Anyexplosionattackisnormallyassociatedwithafire and corresponding smoke. Depending on the explosion,dangerouschemicalsmaybefreedintothe open atmosphere. It is thus of interest to predict how such dangerous cloud will disperse in the air. Thisknowledgeisparticularlyrelevantinurbanar-eas to:(a) help deciding where to concentrate rescue effort
(resource management)(b) time allowing, alert the population
Clouddispersionisacomplexmodellingexercise,especiallyatshortranges,as itdependsonmanyfactors such as, wind direction and speed, air tem-peratureandhumidity,gasestobedispersed,andonthespecific3Dtopologyoftheenvironmentbothwhere theexplosion tookplaceandof itsvicinity.Duringthepreparationofthis jointexercise itwasfoundusefultomakeafewexperimentsinordertoprovidequalitydatatoassisttheatmosphericdis-persion modelling.
3D Modelling of the Environment: the laser scan-ning technique and 3D Reconstuctor software pro-
videeasilyacompletemodellingoftheenvironment“as-is” with an accuracy of about 2cm. Such 3Dmodelcanbeusedasinputinanyshort-rangeat-mospheric dispersion model.
3D Plume Detection and Modelling: Many 3Dscans of the plumes were made in order to find out whether the laser scanning equipment could (i) de-tect the plume itself and (ii) trace its dispersion in terms of both height and orientation.
The two laser scanners – indoors andoutdoors –were used in the experiments. Itwas soon foundouttheindoorsscannercouldnotalwaysdetecttheplumes,probablyduetothesmalldiameterofthelaser beam. Encouraging results were obtained with the outdoor laser.
It was possible to detect the plume, even when it wasverydark(i.e.,correspondingtopoorlaserre-flectance).Itshouldbenotedthatwiththeuseofasingle laser scanner it is possible to detect and map onlyoneofthesidesoftheenvelopeofthesmokeplume. In other words it is not possible to measure either the plume diameter (i.e., thickness) or its den-sity.Further,changingwindspeedsandthechaotic
Two more scans were done to detect minor changes. It should be noted that none of the changes introduced in the environment were known to the team. All changes were detected. Figure 4 shows some of the changes detected in red/orange. These include (a) changing the position of a mobile phone on a shelf; (b) changing the positions of a few boxes on the shelves; (c) rotating a pot with a plant; (d) changing the position of the crane; (e) changing the position of the forklift vehicle.
The total time for acquiring the 3D and visual data for ten modelling scans and two verification ones, was about 90 minutes. Processing time amounted to about 3 hours.
Figure 5: Partial 3D Overview of the CESTA site. Eight laser scans were used to create this model. Each
model point has an accuracy of about 2cm. Processing time amounted to about 3 hours.
5 - OUTDOOR URBAN ENVIRONMENT In this case, and considering the dimensions and complexity of the wide area environment the work was divided in two parts:
Part I: Build a general overview model of the site – this objective involved the creation of a 3D model of the site layout as “seen” from the existing water tower which was then updated by local scans acquired on the ground. Figure 5 shows three snapshots of the site model. The model integrates data acquired from the water tower and 7 scans acquired at ground level.
Part 2: Document the “terrorist” attack scene – this objective was met by scanning from several viewpoints – to resolve for possible spatial occlusions – the street where the “terrorist” attack took place. This was done before and after the attack. Figure 6 illustrates these scans.
Figure 6: View of the scene before the ‘attack’. Figure 6: Viewofthescenebeforethe‘attack’.
ESARDA BULLETIN, No. 38, June 2008
22
behaviouroftheexplosionfiremakesplumedisper-sionahighlydynamic fourdimensionalphenome-non, i.e., the shape and orientation of a plume changeintime.Figure7illustratesthecapabilityforthe 3D detection of the smoke plumes.
7. Future work
Combining 3D models with radiation maps – It is possibletocreatedimensionallyaccurateandpho-to-realistic3Dreconstructedmodelsfromrealenvi-ronments both indoors and outdoors. This repre-sentation can be used in many ways, includingdocumentation, detection of changes and for train-ing purposes.
It is possible to use the 3D models as a human pres-entationand interfacing toolby integrating the3Dmodel with real measurements such as radiation or thermalmaps.Figure9illustratestheresultsofex-perimentsmadeincollaborationwithUSDoE’sOakRidge and Lawrence Livermore National Laborato-ries [4]. In this particular case the 3D model of a room is integrated with both the photographic map and a gamma radiation map. It is possible to see the gammameasurementsproducedbya radioactivesource inside one of the pipes hanging from the ceiling. Such combined representation eases the in-terpretationofthesceneasitallowstheeasyloca-tion of relevant sources, including the accurate and interactive measurements of distances or volumes.
The same principle can be used outdoors integrat-ing3Dandradiationmappingoflargeandcomplexenvironments such as urban areas. Basic 3D data ofanurbanenvironment“as-is”(i.e.,notanideal-ised CAD model) is acquired at the ground level, e.g., using the vehicle of Figure 1.b. This data pro-vide good detail of buildings but fail to describe the roofsorbuildingtops.Airbornedata–bothrangeandphotos–docomplementthedataacquiredatground, i.e., at the street level, and make possible to build complete 3D urban models. Instruments canbeflownaboardaUAV–unmannedaerialvehi-cles, plane or helicopter [5].
Similarly, radiation data can be acquired both atgroundlevelandairborne.Inthefieldofsecurityofspecialevents,CEA-DAMhasusedforseveralyearsbothavehicle–AutoNuc–andahelicopter–Helic-Nuc–equippedwithradiationdetectionequipment[6,7,8].
Radiation data from AutoNuc and HeliNuc (Figure 10)aregeo-referencedbasedononboardGPSsen-sors. These data constitute the radiation baseline for a given scanned area. Indeed, in large and com-plexenvironments,suchasurbanareas,onecan-not expect the radiation reference level to remainconstant in the entire area. The integration of radia-tion maps onto 3D urban models allows for the comparison with subsequent verification scans in order to detect structural and/or radiation changes leading to more detailed or targeted investigations.
Given that in a few cases the range of distances was inferior to 50meters, both the indoor and outdoor laser scanners (see Figure 1) were used. JRC’s 3D Reconstructor software can easily merge and integrate data from scans with different spatial resolution.
6 - PLUME DETECTION AND MODELLING Any explosion attack is normally associated with a fire and corresponding smoke. Depending on the explosion, dangerous chemicals may be freed into the open atmosphere. It is thus of interest to predict how such dangerous cloud will disperse in the air. This knowledge is particularly relevant in urban areas to:
(a) help deciding where to concentrate rescue effort (resource management) (b) time allowing, alert the population
Cloud dispersion is a complex modelling exercise, especially at short ranges, as it depends on many factors such as, wind direction and speed, air temperature and humidity, gases to be dispersed, and on the specific 3D topology of the environment both where the explosion took place and of its vicinity. During the preparation of this joint exercise it was found useful to make a few experiments in order to provide quality data to assist the atmospheric dispersion modelling.
3D Modelling of the Environment: the laser scanning technique and 3D Reconstuctor software provide easily a complete modelling of the environment “as-is” with an accuracy of about 2cm. Such 3D model can be used as input in any short-range atmospheric dispersion model.
3D Plume Detection and Modelling: Many 3D scans of the plumes were made in order to find out whether the laser scanning equipment could (i) detect the plume itself and (ii) trace its dispersion in terms of both height and orientation.
Figure 7: Two snapshots of the 3D model of the smoke plumes emanating from the burning car on the left. The laser scanner is located at the right. The dashed lines indicate the scanning field of view (FoV). Only
the smoke plumes inside the FoV were captured.
Figure 7: Two snapshots of the 3D model of the smoke plumes emanating from the burning car on the left. The laser scannerislocatedattheright.Thedashedlinesindicatethescanningfieldofview(FoV).OnlythesmokeplumesinsidetheFoVwerecaptured.
ESARDA BULLETIN, No. 38, June 2008
23
The two laser scanners – indoors and outdoors – were used in the experiments. It was soon found out the indoors scanner could not always detect the plumes, probably due to the small diameter of the laser beam. Encouraging results were obtained with the outdoor laser.
It was possible to detect the plume, even when it was very dark (i.e., corresponding to poor laser reflectance). It should be noted that with the use of a single laser scanner it is possible to detect and map only one of the sides of the envelope of the smoke plume. In other words it is not possible to measure either the plume diameter (i.e., thickness) or its density. Further, changing wind speeds and the chaotic behaviour of the explosion fire makes plume dispersion a highly dynamic four dimensional phenomenon, i.e., the shape and orientation of a plume change in time. Figure 7 illustrates the capability for the 3D detection of the smoke plumes.
7 - FUTURE WORK: Combining 3D models with radiation maps – It is possible to create dimensionally accurate and photo-realistic 3D reconstructed models from real environments both indoors and outdoors. This representation can be used in many ways, including documentation, detection of changes and for training purposes.
It is possible to use the 3D models as a human presentation and interfacing tool by integrating the 3D model with real measurements such as radiation or thermal maps. Figure 9 illustrates the results of experiments made in collaboration with US DoE’s Oak Ridge and Lawrence Livermore National Laboratories [4]. In this particular case the 3D model of a room is integrated with both the photographic map and a gamma radiation map. It is possible to see the gamma measurements produced by a radioactive source inside one of the pipes hanging from the ceiling. Such combined representation eases the interpretation of the scene as it allows the easy location of relevant sources, including the accurate and interactive measurements of distances or volumes.
Figure 9: Snapshot of the 3D and gamma mapping integrated model. The laboratory room has two pipes hanging from the ceiling. One of the pipes contains a radiation source inside. The positions of the gamma-
The same principle can be used outdoors integrating 3D and radiation mapping of large and complex environments such as urban areas. Basic 3D data of an urban environment “as-is” (i.e., not an idealised CAD model) is acquired at the ground level, e.g., using the vehicle of Figure 1.b. This data provide good detail of buildings but fail to describe the roofs or building tops. Airborne data – both range and photos – do complement the data acquired at ground, i.e., at the street level, and make possible to build complete 3D urban models. Instruments can be flown aboard a UAV – unmanned aerial vehicles, plane or helicopter [5].
Similarly, radiation data can be acquired both at ground level and airborne. In the field of security of special events, CEA-DAM has used for several years both a vehicle – AutoNuc – and a helicopter – HelicNuc – equipped with radiation detection equipment [6, 7, 8].
Radiation data from AutoNuc and HeliNuc (Figure 10) are geo-referenced based on onboard GPS sensors. These data constitute the radiation baseline for a given scanned area. Indeed, in large and complex environments, such as urban areas, one cannot expect the radiation reference level to remain constant in the entire area. The integration of radiation maps onto 3D urban models allows for the comparison with subsequent verification scans in order to detect structural and/or radiation changes leading to more detailed or targeted investigations. The integrated structural and radiation models allow for:
(a) Detection of radiation changes – using the radiation maps as reference;
(b) Detection of structural and geometric changes – using the urban model as reference (i.e., using data from previous 3D scans or from other sources, such as cadastre, GIS or CAD models). Subsequent scans, as part of a verification exercise, can then be used to detect 3D changes occurring at the ground level as well as on building roofs or terraces.
(c) Immediate and easy interpretation of the changes, as the scene is realistically represented by both the geometrical model and its photographic description;
(d) Easy correlation and link to other information sources such as, maps of electricity, gas, water, communication networks or description of buildings’ functions.
(e) Finally, accurate location of the areas to be further investigated
Combining 3D models with Ground Penetrating Radar – GPR is gaining an increasing role as a security sensor. Indeed, its potential to detect cavities, hidden rooms or underground
(b)Detectionofstructuralandgeometricchanges–using the urban model as reference (i.e., using data from previous 3D scans or from other sourc-es, such as cadastre, GIS or CAD models). Sub-sequentscans,aspartofaverificationexercise,can then be used to detect 3D changes occur-ring at the ground level as well as on building roofs or terraces.
(c)Immediateandeasyinterpretationofthechang-es, as the scene is realistically represented by
both the geometrical model and its photographic description;
(d)Easy correlation and link to other informationsourcessuchas,mapsofelectricity,gas,water,communication networks or description of build-ings’functions.
Combining 3D models with Ground Penetrating Radar – GPR is gaining an increasing role as a se-curity sensor. Indeed, its potential to detect cavi-ties, hidden rooms or underground cells in buildings ortunnels inpublicareas ishighlyrelevanttofindhideoutsorplaceswheresuspiciousactivitiesmay
ESARDA BULLETIN, No. 38, June 2008
24
beplanned.Aswithmanyothersophisticatedsen-sors,theoutputofGPRneedstobeinterpretedbyexpertstaff.BothGPRand3Dlaserscannercom-pute distances from the time analysis of an echosignal and their output corresponds to two datasets of 3D points. This parallel suggests that the integra-tionof3DlaserrangedatawithGPRcouldbeben-eficial for the global overview and correct interpre-tationofcomplexscenes.
8. Conclusions
The following capabilities for JRC’s 3Dmodellingsystem–indoorsandoutdoors–weresuccessfullytested during the experiments. It was possible toprovethesystem’s:
(a) Portability:thesystemishighlyportable.Itcanbeeasilypackedandtransportedineitheracaror a plane
(b) Fast deployment:onceanemergencyoccursthesystemcanbe installedandmadeopera-tional in a few minutes
(c) Accuracy: the systemcanmodel a real envi-ronment–bothindoorsand/oroutdoors–andprovide a dimensionally accurate representa-tion (typical accuracies are 3mm indoors and2cm outdoors)
(d) Speed:thesystemonlytakesafewminutestoscan an environment and produce a good qual-itydocumentation
(e) Ease of Processing: all data processing can be done in a normal laptop computer, i.e., there is no need for sophisticated and expensivehardware
Fromthe3Dmodels–eitherarchivedoracquired–itispossibletolauncha3Dscenechangedetec-tion application and detect minor changes in the environment.Thetoolishighlyeffectiveindetectingminute changes, though a detected change might notbenecessarilyassociated toasecurityalarm.Indeed, it isup to thesystem’soperator (e.g., in-spector,policeofficer, securityguard) to interpret
the scene and validate the change. The more infor-mation she or he has available the easier the inter-pretation of the event will be, i.e., the more accurate results will be.
Oneofthelaserscanningsystemsshowedtheca-pabilitytodetectsmokeplumesandmapitsdimen-sion and orientation. Though it was not possible to fully representawholeplume,onecansay,how-ever, that the acquired 3D plume information can be usedasasimplified“ground-truth” representationoftheplume’sbehaviour–dimensionsandorienta-tion. This can be relevant in fine tuning some dis-persion modelling parameters.
Technologies in Safeguards Applications”, IAEA SymposiumonInternationalSafeguards:AddressingVerificationChalleng-es,Vienna,Austria,October16-20,2006.
[2] V.Sequeira,G.Boström,M.Fiocco,D.Puig,J.G.M.Gonçalves,“Outdoor Verification System”, in Proc. INMM 46th AnnualMeeting,Phoenix,Arizona,USA,July10-14,2005.
[3] E.Agboraw,S.Johnson,C.Creusot,S.Poirier,H.Saukkonen,B.Chesnay,V.Sequeira,“IAEAExperienceusingthe3-Dimen-sionalLaserRangeFinder(3DLRF)forDesignInformationVeri-fication(DIV)attheRokkashoReprocessingPlant”,IAEASym-posium on International Safeguards: Addressing VerificationChallenges,Vienna,Austria,October16-20,2006.
[4] L.Mihailescu,K.Vetter,W.Ruhter,D.Chivers,M.Dreicer,C.Coates,S.Smith,J.Hines,A.C.R.Caiado,V.Sequeira,M.Fiocco,andJ.G.M.Gonçalves“CombinedMeasurementswithThree-DimensionalDesignInformationVerificationSystemandGamma Ray Imaging”, Proc. INMM 47th Annual Meeting,Nashville,Tennessee,USA,16-19July2006.
[5] “CombatingNuclearTerrorism–FederalEffortstoRespondtoNuclear andRadiological Threats and to Protect EmergencyResponseCapabilitiescouldbeStrengthened”,GAO–UnitedStatesGovernmentAccountabilityOffice,ReportGAO-06-1015,September2006.
[6] GuillotL.,ProscouraM.I.,MarchandD.–“UtilisationduSys-tème de Détection Gamma Aéroporté HELINUC en Situation AccidentelleouPost-Accidentelle.ApplicationàTchernobyl”,Radioprotection–Colloques,vol.37,C1,2002.
[7] Guillot,L.–“AerialGammaSpectrometryincaseofEmergen-cy: Example of Franco-German ExerciseHelga”, Proc. INSI-NUME 2004 Conference, Albena, 2004.
[8] Guillot,L.,Bourgeois,Ch.–“TheUseoftheAirborneSystemHelinuc for Orphan Sources Search”, Proc. of InternationalConferenceontheSafetyandSecurityofRadioactiveSources,Bordeaux,2005,IAEA-CN-134.
ESARDA BULLETIN, No. 38, June 2008
25
Abstract
The recent addition of imaging to the Nuclear Mate-rials and Identification System (NMIS) using a small portable DT neutron generator with an embedded alpha detector to time and directionally tag neutrons from the DT reaction is discussed. The generator weighs ~35 lbs including power supplies (5x10⁷ n/sec) and operates on 50 watts of power. Thus, the source can be easily moved to a variety of locations within an operational facility with minimum impact or it can be used at a fixed location for example to mon-itor receipts. Imaging with NMIS not only character-izes the detailed shape of a containerized object by transmission tomography but also determines the presence of fissile material by measuring the emitted radiation from induced fission. Imaging measure-ments with a time tagged Cf spontaneous fission source are also discussed. Previous work studies have shown that this type of imaging has a variety of applications other than nuclear material control and accountability (NMC&A). These include nonprolifera-tion applications such as verification of configuration of nuclear weapons/components shipped or re-ceived, warhead authentication behind an informa-tion barrier, and traceability of weapons components both fissile and non fissile in dismantlement and counter terrorism. This paper focuses on the use of imaging for NMC&A. Some of the NMC&A applica-tions discussed include: verifying inventory and re-ceipts, making more accurate holdup measurements especially where thicknesses of materials affect gamma ray spectrometry, determining the shape of unknown configurations of fissile materials where the material type may be known but not the form, determining the oxidation of fissile metal in storage cans, fingerprinting the content of storage contain-ers going into a storage facility, and determining un-known configurations for criticality safety.
Tomographic and radiographic imaging capabilities have been added to the Nuclear Materials Identifi-cation System (NMIS) [1] at Oak Ridge National
Laboratory (ORNL).Thesystemusestransmissionimagingwithatimeanddirectionallytaggedporta-bleDTgenerator[2&3]oratimetaggedCfsponta-neous fission source [4]. Neutrons from the DT gen-erator are more effective on penetrating of hydrogenousmaterialsthanCffissionneutronsbyafactorof~5.However,Cf is adequate for objectswith low attenuation and where measurement time is not a factor. The generator has an additional ad-vantage in that it can be turned off when not in use. Theseimagingcapabilitiessupplementthesystem’sexisting time-correlation (coincidence) measure-ments toquantifyfissilematerialandenhancethesystem’sabilitytoidentifyfissilematerialincontain-ers.Thiscapabilityhasavarietyofapplications inNMC&Asuchasdeterminationof thefissilemassholdupinpipes;especiallyinsituationswhereheavydeposits produce self shielding that make gamma ray spectrometry determinations of hold up havelargeuncertainties.Onesuchholdupmeasurementwassatisfactorilyperformedin1998onthesocalled“hockeystick”depositat theK-29buildingof theformergaseousdiffusionplantatOakRidge[5].ThepresentNMISwithimagingcansatisfyallDOEre-quirements for confirmation of receipt of weapons componentsattheY-12plantanditscontinuedde-velopment will lead to a system that accuratelymeasures the fissilemass inY-12 receipts.Otherthan identification and confirmation of weapons components there a variety of other applicationssuchas:determining the formof legacymaterialssuchashighlyenricheduranium (HEU) in storagecans where the form is not known, fingerprinting the configurations of HEU going into long term storage facilities, determining the fissile mass in plant com-ponents that process oxide and other materialswithout cleaning out the components, comparing the images of fissile materials in shipping containers where the detailed shape is available from the ship-per, determining the amount of oxidizedmetal instorage cans for fissile metal, determining unknown configurationsoffissilematerialsforcriticalitysafe-ty,and identifyingappropriatestandards forotherNMC&Ameasurementsoncanswhereinternalcon-figuration is not known. The present status of this systemisdescribedinthispaperandexamplesof
imagingofobjectswithbothaDTgeneratorandaCf source are presented with some comparisons of results for both sources.
2. Methodology
Figure 1 shows a plot of the time distribution of counts after the DT reaction. Three regions are of interest.Inregion1,thegammaraysfrominducedfission and inelastic neutron scattering are detected firstbecause they travel to thedetectorswith thespeed of light and arrive before the transmitted neu-trons. In region 2, the 14.1MeV transmitted neu-trons arrive at the detector. Region 2 also contains forwardelasticallyscatteredneutronsthathavelit-tlechangeindirectionandenergyforHEU.Finally,inregion3theneutronsandgammaraysfromin-duced fission in the HEU are detected and arrive with an amplitude and time dependence character-istic of the HEU mass and multiplication. Region 2 is used for the imaging measurements, while region 3 is used to distinguish HEU from depleted urani-um (DU).
Imaging with a DT generator consists of measuring the detector counts as a function of time after the DT reaction with the sample between the source and the detectors I(t) and the count rate as a func-tion of time without the sample present I0(t) using the relationship I(t) = I0(t)exp(-μx), where x is the sample thickness, and μ is the attenuation coeffi-cient to obtain the value of μx, the attenuation. The values of I and I0areobtainedbyintegrationofthetransmission peak shown in region 2 of Figure 1 with an empirical correction to remove some scat-tering. This imaging was performed as a function of height using a scanner that could rotate the eight
small1×1×6-in.-thickdetectors15° inthehori-zontal plane to simulate a larger number of detector positions.
The time distribution of counts for 4 plastic scintilla-tors spaced ~100 cm in air from the source for a time tagged Cf spontaneous fission source is shown inFigure2.The initialpeakat the timeofflightofgammarays(~3nanoseconds)fromthesourcefis-siontothedetectoristhepromptgammaraysandisbroadenedbythetimeresolutionofthedetectionsystems for detecting spontaneous fission in thetime tagged source and the event in the detector. Thefollowingpeak(25-80nanoseconds)istheneu-tron distribution whose time dispersion is deter-minedbytheenergydistributionofpromptneutronemitted in spontaneous fission of Cf. Beyond 80nsec, thedistribution ismainly fromneutronscat-teringfromthefloor.Separationofthegammaraysandneutronsallowsbothneutronandgammarayimaging, with neutrons sensitive to light materials andgammarayssensitive toheavymaterials.Forneutron imaging the area near the peak of the neu-trondistributionwasusedwhileforgammaraystheintegral of the gamma peak was used.
The source of preference is the DT generator with embedded alpha detector because of the penetrat-ingcapabilityof14MeVneutrons,shortermeasure-menttime,andabilitytoturnitoffwhennotinuse.
3. Results for DU metal casting with DT generator
AstandardDU-metalannularY-12NationalSecu-rity Complex storage casting in a steel can wasavailableforimagingmeasurementsatORNL.Thiscasting has an outside diameter of 12.70 cm, an in-
2
K-29 building of the former gaseous diffusion plant at Oak Ridge [5]. The present NMIS with imaging can satisfy all DOE requirements for confirmation of receipt of weapons components at the Y-12 plant and its continued development will lead to a system that accurately measures the fissile mass in Y-12 receipts. Other than identification and confirmation of weapons components there a variety of other applications such as: determining the form of legacy materials such as highly enriched uranium (HEU) in storage cans where the form is not known, fingerprinting the configurations of HEU going into long term storage facilities, determining the fissile mass in plant components that process oxide and other materials without cleaning out the components, comparing the images of fissile materials in shipping containers where the detailed shape is available from the shipper, determining the amount of oxidized metal in storage cans for fissile metal, determining unknown configurations of fissile materials for criticality safety, and identifying appropriate standards for other NMC&A measurements on cans where internal configuration is not known. The present status of this system is described in this paper and examples of imaging of objects with both a DT generator and a Cf source are presented with some comparisons of results for both sources. 2. Methodology Figure 1 shows a plot of the time distribution of counts after the DT reaction. Three regions are of interest. In region 1, the gamma rays from induced fission and inelastic neutron scattering are detected first because they travel to the detectors with the speed of light and arrive before the transmitted neutrons. In region 2, the 14.1 MeV transmitted neutrons arrive at the detector. Region 2 also contains forward elastically scattered neutrons that have little change in direction and energy for HEU. Finally, in region 3 the neutrons and gamma rays from induced fission in the HEU are detected and arrive with an amplitude and time dependence characteristic of the HEU mass and multiplication. Region 2 is used for the imaging measurements, while region 3 is used to distinguish HEU from depleted uranium (DU).
Figure 1: Typical time distribution of counts in a plastic scintillator after the DT reaction in a
transmission measurement through a highly enriched uranium metal Imaging with a DT generator consists of measuring the detector counts as a function of time after the DT reaction with the sample between the source and the detectors I(t) and the count rate as a function of time without the sample present I0(t) using the relationship I(t) = I0(t)exp(- x), where x is the sample thickness, and is the attenuation coefficient to obtain the value of x, the attenuation. The values of I and I0 are obtained by integration of the transmission peak shown in region 2 of Figure 1 with an empirical correction to remove some scattering. This imaging was
sidediameterof8.89cm,andaheightofapproxi-mately14cm,withadensityofapproximately18.8g/cm3. The casting was inside a 0.05-cm-thicksealed steel can with an outside dimension of 15.2 cm and a height of 22.9 cm. A photograph of the imaging measurement for the casting on a rotation-al platform is shown in Figure 3, with the DT genera-torontheleftandtheeight1×1×6-in.-thickplasticscintillation detectors on the right.
Initially,averticalscanwasperformedoverthefullheight of the casting, and the results are shown in Figure4.A fullverticalscanatasingleprojectionangleprovidesanoverallpictureoftheobjecttobeimaged and allows the user to choose a particular height to image further. While the vertical scan shown in Figure 4 was obtained with high resolution at each level, these vertical scans can often be tak-enmuchquickerwithfewerpixelsandshorterex-posures without affecting the ability to locate anareaofinterest.Verticalscanscanbeinterpretedinthesamefashionasx-rayimages.TheDUcasting
ontopoftherotationalplatformcanclearlybeseenintheimage.Next,twohigh-resolutionscansweremade at one height through the casting. These pro-jectionswere capturedat two rotational positions90°apart.Forbothpositionsoftherotationalplat-form,the1-in.-squaredetectorswereshifted1/3-in.for successive measurements until the imaging arc wasfullycovered.Measuringwithfinerdetailthanthe 1-in. detector face yields somegain in imageresolution, depending in part on the image recon-struction method used.
Figure 5 shows the attenuation values for each of thesepositionsinbothprojections(0°and270°ro-tational positions). For a cylindrically symmetriccasting,this90°rotationwillconfirmsymmetryanddetermine the position of the casting with respect to thecenterofrotation.Forobjectsthatarenotcylin-dricallysymmetricalabouttheaxisofrotation,moreprojectionsarerequiredtoobtaintheshapeofthecontentsofthecan.TheNMISanalysissoftwarein-cludesamodel-basedfittingalgorithmtodetermine
3
performed as a function of height using a scanner that could rotate the eight small 1 × 1 × 6-in.-thick detectors 15° in the horizontal plane to simulate a larger number of detector positions. The time distribution of counts for 4 plastic scintillators spaced ~100 cm in air from the source for a time tagged Cf spontaneous fission source is shown in Figure 2. The initial peak at the time of flight of gamma rays (~3 nanoseconds) from the source fission to the detector is the prompt gamma rays and is broadened by the time resolution of the detection systems for detecting spontaneous fission in the time tagged source and the event in the detector. The following peak (25-80 nanoseconds) is the neutron distribution whose time dispersion is determined by the energy distribution of prompt neutron emitted in spontaneous fission of Cf. Beyond 80 nsec, the distribution is mainly from neutron scattering from the floor. Separation of the gamma rays and neutrons allows both neutron and gamma ray imaging, with neutrons sensitive to light materials and gamma rays sensitive to heavy materials. For neutron imaging the area near the peak of the neutron distribution was used while for gamma rays the integral of the gamma peak was used.
Figure 2: Typical time distribution of counts from a detector after spontaneous fission of Cf. The
initial peak is from gammas and the subsequent peak is from the neutron distribution. The source of preference is the DT generator with embedded alpha detector because of the penetrating capability of 14 MeV neutrons, shorter measurement time, and ability to turn it off when not in use. 3. Results for DU Metal Casting with DT Generator A standard DU-metal annular Y-12 National Security Complex storage casting in a steel can was available for imaging measurements at ORNL. This casting has an outside diameter of 12.70 cm, an inside diameter of 8.89 cm, and a height of approximately 14 cm, with a density of approximately 18.8 g/cm3. The casting was inside a 0.05-cm-thick sealed steel can with an outside dimension of 15.2 cm and a height of 22.9 cm. A photograph of the imaging
Figure 2: TypicaltimedistributionofcountsfromadetectorafterspontaneousfissionofCf.Theinitialpeakisfromgammas and the subsequent peak is from the neutron distribution.
4
measurement for the casting on a rotational platform is shown in Figure 3, with the DT generator on the left and the eight 1 × 1 × 6-in.-thick plastic scintillation detectors on the right.
Figure 3: Source-uranium metal-casting-detector configuration for imaging
Initially, a vertical scan was performed over the full height of the casting, and the results are shown in Figure 4. A full vertical scan at a single projection angle provides an overall picture of the object to be imaged and allows the user to choose a particular height to image further. While the vertical scan shown in Figure 4 was obtained with high resolution at each level, these vertical scans can often be taken much quicker with fewer pixels and shorter exposures without affecting the ability to locate an area of interest. Vertical scans can be interpreted in the same fashion as x-ray images. The DU casting on top of the rotational platform can clearly be seen in the image. Next, two high-resolution scans were made at one height through the casting. These projections were captured at two rotational positions 90 apart. For both positions of the rotational platform, the 1-in.-square detectors were shifted 1/3-in. for successive measurements until the imaging arc was fully covered. Measuring with finer detail than the 1-in. detector face yields some gain in image resolution, depending in part on the image reconstruction method used. Figure 5 shows the attenuation values for each of these positions in both projections (0° and 270° rotational positions). For a cylindrically symmetric casting, this 90° rotation will confirm symmetry and determine the position of the casting with respect to the center of rotation. For objects that are not cylindrically symmetrical about the axis of rotation, more projections are required to obtain the shape of the contents of the can. The NMIS analysis software includes a model-based fitting algorithm to determine geometric dimensions and attenuation coefficient values. This algorithm begins with the user entering an initial geometry of basic shapes from data such as that shown in Figure 4 and selecting key parameters (positions, sizes, and attenuation coefficients), allowed to vary during the fit. The fit uses an unconstrained nonlinear optimization algorithm in conjunction with a simulation tool based on ray tracing to find a fit of the measured projections to those generated by simulating the geometry. The results of fitting the attenuation projections at 0 and 90 rotational positions are shown in Figure 4, and the dimensions obtained are given in Table 1.
Figure 4: Full scan of DU casting: lag of attenuation versus lateral location and height above the
floor
Figure 5: Attenuation projections at 0 and 90 rotational positions and the results of fitting the data
Parameter Initial guess Final fit Actual dimensionsInner diameter (cm) 10.00 8.56 8.89Outer diameter (cm) 11.00 12.93 12.81Attenuation coefficient (2/cm or cm-1) 0.280 0.202 0.280X offset (cm) 0.00 -0.418 UnknownY offset (cm) 0.00 0.570 Unknown
Table 1: Dimensions in centimeters from fit of casting data set containing two projections 90 apart
The fitted dimensions are close to the actual. These measurements were performed with 1- by 1-in. pixels (detectors). Reduced pixel size would improve the accuracy of the dimensions. The fitted attenuation coefficient (0.202 cm-1) is lower than the actual (0.28 cm-1) because neutrons scattered at small angles from uranium still arrive at the detector and at nearly the same time as the directly transmitted neutrons. With proper correction for scattering, the values of the attenuation coefficients can be fixed for known materials, and more accurate dimensions can be obtained. Based on the X offset in Table 1, the axis of the casting was approximately 0.42 cm farther from the detector array than the axis of rotation. A second set of experiments was
geometric dimensions and attenuation coefficient values. This algorithm begins with the user entering aninitialgeometryofbasicshapesfromdatasuchasthatshowninFigure4andselectingkeyparam-eters (positions, sizes, and attenuation coefficients), allowedtovaryduringthefit.Thefitusesanuncon-strained nonlinear optimization algorithm in con-junctionwithasimulationtoolbasedonraytracingto find a fit of themeasured projections to thosegeneratedbysimulatingthegeometry.Theresultsoffitting theattenuationprojectionsat0°and90°rotational positions are shown in Figure 4, and the dimensions obtained are given in Table 1.
The fitted dimensions are close to the actual. These measurementswereperformedwith1-by1-in.pix-els (detectors).Reducedpixel sizewould improvetheaccuracyofthedimensions.Thefittedattenua-tion coefficient (0.202 cm-1) is lower than the actual (0.28 cm-1) because neutrons scattered at small an-gles from uranium still arrive at the detector and at nearly the same time as the directly transmittedneutrons. With proper correction for scattering, the valuesof theattenuationcoefficientscanbefixedfor known materials, and more accurate dimensions can be obtained. Based on the X offset in Table 1, theaxisofthecastingwasapproximately0.42cm
ESARDA BULLETIN, No. 38, June 2008
29
fartherfromthedetectorarraythantheaxisofrota-tion.AsecondsetofexperimentswasperformedontheDUcastingbyplacingshieldingaroundthecasting. Two different shielding configurations were measured:(1)a1-in.-thickleadboxsurroundingthesteelcanand (2)a1-in.-thick leadboxplus4-in.-thick lead plates and bricks added to the front and backasshowninFigure6.
6
performed on the DU casting by placing shielding around the casting. Two different shielding configurations were measured: (1) a 1-in.-thick lead box surrounding the steel can and (2) a 1-in.-thick lead box plus 4-in.-thick lead plates and bricks added to the front and back as shown in Figure 6.
Figure 6: DU casting within a 1-in.-thick lead box surrounding and 4-in. thickness of lead plates in
front and back In an effort to determine whether the internal components still provide a useful signature, a second set of projections was obtained for just the shielding without the DU casting and used to normalize the projections (I0). The measurement times for the bare casting and the casting with 2 in of lead were 2 minutes and that for the casting with 10 in of lead was 10 minutes. The images for the different configurations of lead shielding are shown in Figure 7. Based on these results, the casting is still distinguishable with 5-in.-thick lead shielding front and back. Thus, the transmission was measured through 10 in. of lead and the casting. This result illustrates that if the shielding or container material is known and available, a measurement of transmission, Io, with the shielding or container in place can normalize out the container and shielding effects.
Figure 7: Various shielded casting configurations and resulting images
(a) Bare DU casting (b) DU + 2-in. Pb (c) DU + 10-in. Pb
In an effort to determine whether the internal com-ponents still provide a useful signature, a second setofprojectionswasobtainedforjusttheshieldingwithout the DU casting and used to normalize the projections(I0). The measurement times for the bare casting and the casting with 2 in of lead were 2 min-utes and that for the casting with 10 in of lead was 10 minutes. The images for the different configura-tions of lead shielding are shown in Figure 7. Based on these results, the casting is still distinguishable with5-in.-thickleadshieldingfrontandback.Thus,the transmission was measured through 10 in. of lead and the casting. This result illustrates that if the
shielding or container material is known and availa-ble, a measurement of transmission, Io, with the shielding or container in place can normalize out the container and shielding effects.
4. Measurement of a 3D object with Cf
Imaging measurements were performed for a vari-etyofobjectsthatwerenotcylindricallysymmetric.Inthiscasetheobjectneedstoberotatedtomeas-uretheprojectionatvariousangles.Onesuchob-jectisshowninFigure8.Thebottomofthisobjectconsistsofan8-in-squareleadwitha6.5-in.-diam.centralholethatis6.75inhigh.Spaced0.5inabovethatisa0.5-in-thick,7-in-squarepieceofPlexiglas.OnthePlexiglasisa3.5-in-high,6.5-in-OD,5.5-in–IDleadpartwhoseoutsidediameterincreasesto7in. for the top 0.75 in. Inside the top piece of lead andrestingonthePlexiglasisa3.5-in.-diam.,2-in.-high polyethylene cylinder adjacent to the insidesurfaceofthelead.ThesefeaturesoftheobjectarevisibleinFigure8.Thiswasacontrivedtestobjectusedfortrainingtotesttheabilitytoimageanun-known3Dobject.Theobjectwastheninsertedintoa drum and located as in Figure 9 between the Cf source (on the left) and16plastic scintillators (onthe right) on a radial arm that could be rotated. The objectwasraisedoffthebottomofthedrumbyalow mass metal ring and plate.
The initial measurements were a vertical scan of the objectinthecontainerwiththearmsupportingthedetectors rotating laterally tosimulateother radialdetector positions. The results of these measure-ments are shown in Figures 10 and 11 where two
6
performed on the DU casting by placing shielding around the casting. Two different shielding configurations were measured: (1) a 1-in.-thick lead box surrounding the steel can and (2) a 1-in.-thick lead box plus 4-in.-thick lead plates and bricks added to the front and back as shown in Figure 6.
Figure 6: DU casting within a 1-in.-thick lead box surrounding and 4-in. thickness of lead plates in
front and back In an effort to determine whether the internal components still provide a useful signature, a second set of projections was obtained for just the shielding without the DU casting and used to normalize the projections (I0). The measurement times for the bare casting and the casting with 2 in of lead were 2 minutes and that for the casting with 10 in of lead was 10 minutes. The images for the different configurations of lead shielding are shown in Figure 7. Based on these results, the casting is still distinguishable with 5-in.-thick lead shielding front and back. Thus, the transmission was measured through 10 in. of lead and the casting. This result illustrates that if the shielding or container material is known and available, a measurement of transmission, Io, with the shielding or container in place can normalize out the container and shielding effects.
Figure 7: Various shielded casting configurations and resulting images
(a) Bare DU casting (b) DU + 2-in. Pb (c) DU + 10-in. PbFigure 7: Variousshieldedcastingconfigurationsandresultingimages.
ESARDA BULLETIN, No. 38, June 2008
30
dimensional plots of the attenuation length are pre-sented. The polyethylene and the Plexiglas areclearlyvisibleintheneutronscanwhereastheyarenot in the gamma scan. This is not the case when imaging with a DT generator which is sensitive to bothlightandheavymaterials[2].
Based on these vertical scans, a detailed image was measured at 2 vertical locations through the middle of the lower lead and through the middle of the pol-yethylene. Since these objects were not cylindri-callysymmetric,thetransmissionwasmeasuredat18 different projection angles. The reconstructedimagesareshowninFigures12and13.Clearly,theconfigurationsofthetestobjectatthe2heightsaredetermined. Future work in imaging testing on 3D objectswillemployanautomatedobjectturntable.TheuseofaDTgeneratorwithpixilatedalphade-tector for this type of measurement will facilitatemuch better imaging through removal of scattering result in shorter measurement time.
5. Applications
The imaging capability of NMIS can enhanceNMC&A:
• Determination of the configuration of items incontainers, and it is ideal for fissile material trans-fersbetweenfacilities.Thiscapabilityisaccom-plishedbyprovidingthedetailedconfigurationofthefissileandnon-fissilecomponentsofanitemunderscrutiny.Theimagescanbecomparedtodrawings provided by the shipper avoidingrepackaging delays to verify the contents of ashipmentthatmaynotbeimmediatelyused.In-duced fission emitted radiation can be evaluated to distinguish fissile from non fissile materials.
• Periodicinventoryconfirmation.• Determination of the form of legacy materials
such as HEU in storage cans where the form is not known.
4. Measurement of a 3D Object with Cf Imaging measurements were performed for a variety of objects that were not cylindrically symmetric. In this case the object needs to be rotated to measure the projection at various angles. One such object is shown in Figure 8. The bottom of this object consists of an 8-in-square lead with a 6.5-in.-diam. central hole that is 6.75 in high. Spaced 0.5 in above that is a 0.5-in-thick, 7-in-square piece of Plexiglas. On the Plexiglas is a 3.5-in-high, 6.5-in-OD, 5.5 -in –ID lead part whose outside diameter increases to 7 in. for the top 0.75 in. Inside the top piece of lead and resting on the Plexiglas is a 3.5-in.-diam., 2-in.-high polyethylene cylinder adjacent to the inside surface of the lead. These features of the object are visible in Figure 8. This was a contrived test object used for training to test the ability to image an unknown 3D object. The object was then inserted into a drum and located as in Figure 9 between the Cf source (on the left) and 16 plastic scintillators (on the right) on a radial arm that could be rotated. The object was raised off the bottom of the drum by a low mass metal ring and plate.
Figure 8: 3D object of lead, aluminum, polyethylene, and Plexiglas
Figure 9: 3D test object in a container on the rotating table between the Cf source on the left and the
detectors on the right
Figure 9: 3D test object in a container on the rotatingtable between the Cf source on the left and the detectors on the right.
The initial measurements were a vertical scan of the object in the container with the arm supporting the detectors rotating laterally to simulate other radial detector positions. The results of these measurements are shown in Figures 10 and 11 where two dimensional plots of the attenuation length are presented. The polyethylene and the Plexiglas are clearly visible in the neutron scan whereas they are not in the gamma scan. This is not the case when imaging with a DT generator which is sensitive to both light and heavy materials [2]. Based on these vertical scans, a detailed image was measured at 2 vertical locations through the middle of the lower lead and through the middle of the polyethylene. Since these objects were not cylindrically symmetric, the transmission was measured at 18 different projection angles. The reconstructed images are shown in Figures 12 and 13. Clearly, the configurations of the test object at the 2 heights are determined. Future work in imaging testing on 3D objects will employ an automated object turntable. The use of a DT generator with pixilated alpha detector for this type of measurement will facilitate much better imaging through removal of scattering result in shorter measurement time.
Figure 10: Neutron radiograph of the test object from the vertical scan
Figure 11: Gamma radiograph of the test object from the vertical scan
tion or to determine appropriate standards for otherNMC&Ameasurements.
• Determinationoftheamountofoxidationoffis-sile metal in cans.
• Providingmoreaccurateholdupmeasurementsin pipes and process applications where the ma-terial and process vessel shape are known and process vessels cannot be emptied. In some cases the density distribution in the containercan bemeasured accurately so that themasscan be inferred to a few percent.
6. Conclusions
TheimagingcapabilityofNMISusingasmallport-able DT generator with an embedded alpha detec-tor can enhance NMC&A for a wide variety ofNMC&Aapplicationsaddressingsuchproblemsasfissile transfers, fissile inventory, unknown fissileconfigurations,oxidationoffissilemetal,andholdup inpipesandprocessvessels, especiallywhentheobjectismanyattenuationlengthsthick.How-ever, for low attenuation length objects, a timetagged Cf spontaneous fission source of prompt neutronsandgammaraysfromfissionmaybemore
useful.This typeof imaginghasavarietyofotheruses such as verification of the configuration of nu-clear weapons/components shipped or received, warhead authentication behind an information bar-rier,traceabilityofbothfissileandnon-fissileweap-ons components/parts during dismantlement, and counter terrorism.
“Physical description of nuclear materials identification system (NMIS) signatures,”Nucl.Inst.andMeth.A450(2000):531.
[2] J.A.Mullens,“Addition of Tomographic Capabilities to NMIS,”Y/LB-16,160, March 2003, http://www1.y12.doe.gov/search/library/documents/pdf/YLB-16160.pdf.
[3] “API120 D-T Neutron Generator User Manual,” Thermo Elec-tronCorporation,5074ListDrive,ColoradoSprings,CO80919,www.thermo.com/neutrongenerators.
[4] J.T.Mihalczo, “The Use of ACalifornium-252 as a Randomly Pulsed Neutron Source for Prompt-Neutron Decay Measure-ments,”Nucl.Sci.&Engr.,53,393-414(1974)
[5] Wyatt,M.S.,etal.1998.“Characterization of an Enriched Ura-nyl Fluoride Deposit in a Valve and Pipe Intersection Using Time-of-Flight Transmission Measurements with 252Cf,” Proc.Inst. of Nuclear Materials Management Meeting, Naples, FL, July26–30,1998.
9
Figure 12: Gamma and neutron images of the test object through the lower lead
Figure 13: Gamma and neutron images through the test object at the height of the polyethylene
5. Applications The imaging capability of NMIS can enhance NMC&A:
Determination of the configuration of items in containers, and it is ideal for fissile material transfers between facilities. This capability is accomplished by providing the detailed configuration of the fissile and non-fissile components of an item under scrutiny. The images can be compared to drawings provided by the shipper avoiding repackaging delays to verify the contents of a shipment that may not be immediately used. Induced fission emitted radiation can be evaluated to distinguish fissile from non fissile materials.
Periodic inventory confirmation. Determination of the form of legacy materials such as HEU in storage cans where the
form is not known. Determination of unknown configurations of fissile materials for criticality safety and
identification or to determine appropriate standards for other NMC&A measurements. Determination of the amount of oxidation of fissile metal in cans. Providing more accurate hold up measurements in pipes and process applications where
the material and process vessel shape are known and process vessels cannot be emptied. In some cases the density distribution in the container can be measured accurately so that the mass can be inferred to a few percent.
Uranium Enrichment Assay with a LaBr3(Ce) Scin-tillation Detector: A Promising Option for the 2nd Generation of COMPUCEAH. Ottmar, P. Amador, H. Eberle, N. Erdmann, H. SchorléEuropean Commission, Joint Research CentreInstitute for Transuranium Elements, P.O. Box 2340D-76125 Karlsruhe, Germany
R. GunninkConsultant, 7913 Jonathan Woods Dr., Ada, MI 49301, USA
Abstract
A careful evaluation of uranium enrichment meas-urements with a 2” x 2” LaBr3(Ce) scintillation de-tector has been carried out in order to test this new type of detector as a room-temperature detector option for future use in the in-field analyses made with COMPUCEA. Spectrum analysis has been made with an adapted version of the NaIGEM analy-sis code. Comparative performance data obtained from measurements with HPGe, NaI(Tl) and LaBr3(Ce) detectors on low-enriched uranium reference sam-ples are presented.
The acronym COMPUCEA (COMbined ProcedureforUraniumConcentrationandEnrichmentAssay)refers to a measurement procedure for the determi-nation of the uranium elemental concentration and 235Uisotopicabundance(“enrichment”)inrelativelysmall samples of unirradiated uranium product ma-terials. The applied measurement techniques in-cludeabsorptionedgespectrometryfortheuraniumconcentrationanalysis,andpassivehigh-resolutiongammaspectrometryforthe235U enrichment deter-mination. The respective measurements are made on site in European Low-Enriched Uranium (LEU)fuelfabricationplantsbyanalystsfromtheInstitutefor Transuranium elements (ITU), Karlsruhe, in sup-portof jointEuratom/IAEASafeguardsinspectionsduringthephysicalinventoryverification(PIV).Thismeasurement support from ITUwithCOMPUCEAduring the PIV campaigns has been provided formore than a decade with the 1st generation of equip-ment, consisting of a radioisotope-based K-edgedensitometer and a HPGe-based high-resolutiongamma spectrometer [1, 2, 3].
nitrogen-cooledHPGedetectorsbyroom-tempera-turedetectorsinordertosimplifytheequipmentforthe in-fieldmeasurements.Thisgoalhasbeenfullyachieved, without loss in performance, for the urani-umconcentrationmeasurementpartofCOMPUCEA,where thechange fromK-edgedensitometry toL-edgedensitometryallowed to replace thepreviousHPGedetectorbyanultrahigh-resolutionSidetec-toroperatedundermodestPeltiercooling[4,5].Asfor the enrichment measurement part of COMPU-CEA, searches for an adequate substitute for the high-resolutionHPGedetectorarestillunderway.
WiththerecentlydiscoveredCe-dopedlanthanumhalide (LaCl3, LaBr3)scintillators[6],anewtypeofscintillation detector is now becoming available, whichisopeningupgoodprospectsforhigh-qualityenrichment measurements with a room temperature detector. In this paper, we report on a performance studyforenrichmentmeasurementswithaLaBr3(Ce) scintillation detector, addressing the specific appli-cationtosmall-sizeuraniumsamplemeasurementsasencountered in the in-fieldanalysesmadewithCOMPUCEA.
2. Enrichment assay in COMPUCEA
Before describing the application of the new LaBr3(Ce) scintillation detector as a potential detector alterna-tive,itmightbehelpfultobrieflyrecapitulatethespe-cific measurement conditions and procedures for the enrichmentmeasurementswithCOMPUCEA.Threemeasurementconditionsultimatelydeterminethecur-rentlyappliedmethod for thegamma-spectrometricenrichment measurement:
1.Thephysicalinventorysamplesprovidedbytheinspectorsareofsmallquantity,typicallyasingleuraniumpelletorafewgramsofoxidepowder.Thisautomaticallyrulesouttheclassicaltypeofenrichment measurement made in the “infinitethickness”geometry.
2. Since the measurements serve the purpose of accountancyverification,theyarecallingforthe
ESARDA BULLETIN, No. 38, June 2008
33
highest possible measurement accuracy withsmall tonegligiblesystematicmeasurementer-rors. It seemed questionable whether this re-quirementcouldbe fullymetby thealternativemeasurement option for enrichment measure-ments based on the intrinsic assay approach[7].
3.TheparallelmeasurementwithCOMPUCEAforthe determination of the uranium element con-tent made by L-absorption edge spectrometryrequires a dissolution of the solid uranium sam-ples, because nondestructive measurement techniques allowing a direct determination of the uranium concentration from a solid uranium sam-plewithhighaccuracyunfortunatelydonotexistup to date.
With the uranium samples prepared in liquid form, theenrichmentmeasurementwithCOMPUCEAfol-lows the procedure of counting the most prominent 235Ugammarayat186keVfromawell-definedvol-umeofsamplesolutioninawell-definedandcali-bratedcountinggeometryasshowninFig.1.Thegamma counting is performed in a well detector to achieve the highest possible detection efficiency.This approach allows accurate enrichment meas-urements, provided (i) the sample volume is kept constant, (ii) the uranium content in the measure-mentsampleisaccuratelyknown,(iii)thematrixofthe measurement solution is well controlled, and (iv) the counting set up is calibrated against represent-ative reference solutions.
2. Enrichment assay in COMPUCEA Before describing the application of the new LaBr3(Ce) scintillation detector as a potential detector alternative, it might be helpful to briefly recapitulate the specific measurement conditions and procedures for the enrichment measurements with COMPUCEA. Three measurement conditions ultimately determine the currently applied method for the gamma-spectrometric enrichment measurement: 1. The physical inventory samples provided by the inspectors are of small quantity, typically a single
uranium pellet or a few grams of oxide powder. This automatically rules out the classical type of enrichment measurement made in the "infinite thickness" geometry.
2. Since the measurements serve the purpose of accountancy verification, they are calling for the highest possible measurement accuracy with small to negligible systematic measurement errors. It seemed questionable whether this requirement could be fully met by the alternative measurement option for enrichment measurements based on the intrinsic assay approach [7].
3. The parallel measurement with COMPUCEA for the determination of the uranium element content made by L-absorption edge spectrometry requires a dissolution of the solid uranium samples, because nondestructive measurement techniques allowing a direct determination of the uranium concentration from a solid uranium sample with high accuracy unfortunately do not exist up to date.
With the uranium samples prepared in liquid form, the enrichment measurement with COMPUCEA follows the procedure of counting the most prominent 235U gamma ray at 186 keV from a well-defined volume of sample solution in a well-defined and calibrated counting geometry as shown in Fig. 1. The gamma counting is performed in a well detector to achieve the highest possible detection efficiency. This approach allows accurate enrichment measurements, provided (i) the sample volume is kept constant, (ii) the uranium content in the measurement sample is accurately known, (iii) the matrix of the measurement solution is well controlled, and (iv) the counting set up is calibrated against representative reference solutions.
Fig. 1: Present counting configuration for the 235U enrichment measurement in COMPUCEA with a HPGe well detector. An exact volume of 2.5 ml of uranium solution, precisely determined with an accuracy of 0.02% from a combined sample weighing and density measurement, is transferred into a cylindrical plastic vial with an inner diameter of 11 mm for counting in the well detector. The uranium concentration of the solution, and hence the amount of uranium in the measurement sample, is known from the parallel densitometry measurement of COMPUCEA with an accuracy better than 0.2%. The uranium concentration and the nitric acidity of the solution matrix are established within narrow limits – through strict procedures followed during sample dissolution and subsequent dilution – at nearly constant values of 200 mgU/ml and 3M HNO3, respectively. Small corrections for gamma self attenuation are applied for samples slightly deviating from these nominal values. These corrections also take into account the additional self attenuation effects caused by gadolinium, if present. Information on the Gd content will in the future be obtained from the L-edge densitometer operated in the XRF mode [4].
Figure 1: Present counting configuration for the 235U enrichmentmeasurement inCOMPUCEAwith aHPGewell detector.
Anexactvolumeof2.5mlofuraniumsolution,pre-ciselydeterminedwithanaccuracyof0.02%fromacombinedsampleweighinganddensitymeasure-ment,istransferredintoacylindricalplasticvialwithan inner diameter of 11 mm for counting in the well detector. The uranium concentration of the solution,
and hence the amount of uranium in the measure-ment sample, is known from the parallel densitom-etrymeasurementofCOMPUCEAwithanaccuracybetter than0.2%.Theuraniumconcentration andthe nitric acidity of the solutionmatrix are estab-lishedwithin narrow limits – through strict proce-dures followed during sample dissolution and sub-sequentdilution–atnearlyconstantvaluesof200mgU/mland3MHNO3,respectively.Smallcorrec-tions for gamma self attenuation are applied for samplesslightlydeviating fromthesenominalval-ues. These corrections also take into account the additionalselfattenuationeffectscausedbygado-linium, if present. Information on the Gd content will inthefuturebeobtainedfromtheL-edgedensitom-eter operated in the XRF mode [4].
Thetypeofdetectoruseduptonowduringthein-field measurements is a 110 cm3HPGewelldetec-torwitha16mmdiameterx40mmdeepwellinthedetectorcap.For3differentunitsofthistypeofde-tector,thedetectionefficiencyfor186keVgammasin the counting configuration shown in Fig. 1 was determined to 26.4, 28.3 and 31.6%. This yieldscountratesbetween57and68cpsper%enrich-mentforthetypicalamountof0.5gofuraniumcon-tained in the 2.5 ml of sample solution. This rate necessitatesacounting timeofabout20-25min-utestoreachameasurementprecisionof0.2%forasampleenrichmentof3%.
Forhighestmeasurement accuracyand reliability,enrichmentmeasurementsmadewith thehigh-re-solvingHPGedetectorundoubtedlyoffer thebestchoice.Practicaldrawbacks for the in-fieldmeas-urements, however, are the need for liquid nitrogen fordetectorcooling,andtherelativelylongcoolingtimesforthewell-typedetector.ForthegivenHPGewell detector it takes about 24 hours before the de-tector has sufficiently cooled down to reach thenominalenergyresolution.Duringtherecentre-de-signoftheCOMPUCEAequipmenttowardsamorecompactandready-to-usetypeofinstrumentationwe have therefore also evaluated detector alterna-tives, which do not require cooling.
The use of CdZnTe solid state detectors has been ruled out a priori because of their small volumes and correspondinglowdetectionefficiency.Realistical-ly,thisleavesonlytheuseofasuitablydimensionedscintillation detector as a viable detector option. In a first approach we have carried out a performance assessmentfromin-fieldmeasurementswitha3”x3”NaI(Tl)welldetector,whichwithits16mmwelldiameter offered the same counting geometry astheHPGewelldetector.Despite themuchpoorer
ESARDA BULLETIN, No. 38, June 2008
34
energy resolution of the NaI detector, the resultsobtained showed acceptable performance [5].
It is a fortunate situation that, with the recent dis-coveryofthenewlanthanumhalidescintillators,thegammaspectroscopycommunity isnowprovidedwith a promising new type of room temperaturescintillation detector with distinctly improved per-formancecompared to thewell-knownNaI(Tl)de-tector.
3. Features of LaBr3(Ce) scintillation detectors
The new cerium-doped lanthanum chloride,LaCl3(Ce), and lanthanum bromide, LaBr3(Ce), scin-tillation detectors, manufactured by Saint-GobainCeramics & Plastics Inc. and now commerciallyavailable under the registered trademarks Bril-LanCe®350 and BrilLanCe®380, respectively [8],have the potential of significantly enhancing theperformance and capabilities of scintillator-basedgammaspectroscopicsystemsinmanyareas.Theapplication to 235U enrichment measurements for Safeguards purposes as discussed in this paper representsjustoneexample.
The production of larger-sized lanthanum halidecrystalshasrapidlyprogressedduringthelast2-3years.Standarddetectorsizesupto3”x3”arenowavailable,althoughdetectorpricesarestillrelativelyhigh (~200 € /cm3).Existingperformancedatashowabout20-30%betterenergyresolutionforthelan-thanum bromide than for the lanthanum chloride detectors. We therefore chose the former one for ourstudies.Someof thenoteworthypracticalad-vantages of the new LaBr3(Ce) scintillator, com-pared to the traditional NaI(Tl) scintillation detector, are:
- Improvedenergyresolution;
- About 10 times faster light output decay, ena-blinghighcountrateapplications;
Table 1 lists comparative values for some pertinent physicalpropertiesofLaBr3(Ce) and NaI(Tl) detec-tors.Comparativedatafortheenergyresolutionaregiven in Table 2. The quoted energy resolutionsweremeasuredfortheactual2”x2”LaBr3(Ce) de-tectorused in thepresentstudy,and foraNaI(Tl)detectorofsamedimensionswithanominalenergyresolutionof6.8%at662keV.Theright-handcol-umn in Table 2 gives the improvement factor for the energyresolutionofferedbytheLaBr3(Ce) detector.
Betterenergyresolutionforthelanthanumbromidedetector is obtainedover thewhole energy rangecovered, with the improvement factor increasing with increasing gamma energy. For the 186 keVgammaray,thelanthanumbromidedetectorofferstwotimesbetterenergyresolutionthantheNaIde-tector.
Property LaBr3(Ce) NaI(Tl)
Crystaldensity(g/cm3)
5.29 3.67
Thicknessfor50%attenuationof662keVgammas(cm)
1.8 2.5
Lightyield(Photons/keV)
63 38
1/edecaytime(ns)
16 250
Temp. coefficient of light output(%/°Cbetween0°and50°C)
<0.02 -0.3
Table 1: Comparison of scintillator detector properties (from [8]).
Energy(keV)
FWHM energy resolution (%) Improvementfactor forLaBr3(Ce)LaBr3(Ce) NaI(Tl)
The spectral appearance of gamma spectra from low-enricheduraniumisdisplayedinFig.2.Thefig-ureshowsspectraforatypicalCOMPUCEAsample(0.5gofuraniumwithanenrichmentof4.4%in2.5mlofnitricacid)takenwith3typesofdetectors:the110 cm3HPGewelldetectorsofarroutinelyusedinCOMPUCEA, a 3”x3” Na(Tl) well detector, and a2”x2”LaBr3(Ce)detector.Themeasurementexam-ple produced with the lanthanum bromide scintilla-tion detector shows a uranium gamma spectrum, in which the main 235Ugammarays(143,163,186,205keV)arereasonablyresolved.
Apeculiarityofthelanthanum-basedscintillatorsisthe presence of an inherent background originating from the electron capture and β-decayofthelong-lived minor La isotope 138La (t1/2=1.05x1011y) to138Ba(66.4%)and138Ce(33.6%,seeschematicde-cayschemeinFig.3).TheBaX-raypeakvisibleinthe LaBr3 spectra in Figs. 2 and 3 results from the EC decay of 138La to 138Ba (the single X-ray peaknear 37.4 keV in fact represents theaccumulated
ESARDA BULLETIN, No. 38, June 2008
35
energygivenoffbytheX-raysintheECprocess).The β-decay to 138Ce, in turn, manifests itself in a beta continuum background with an endpoint en-ergyof255keVasshowninFig.3.Thiscontinuousbetabackgroundoccurring in theenergyrangeofthe 235Ugammaraysnormallyturnsouttobenegli-gible for enrichment measurements on bulk uranium samples, but it may notably contribute (about20-30%)totheComptonandBremsstrahlungback-groundfromthehigh-energy234mPagammaraysinenrichment measurements on small quantities of uranium(1gorlessasinthecaseoftheCOMPU-CEA measurements). This is illustrated in Fig. 3, which shows the magnitude of the internal beta continuum background in relation to the gamma spectrum produced by a 5 ml uranium solutionsample with 1 g of natural uranium (kept at 1 cm distancefromthesurfaceofa2”x2”LaBr3 detec-tor).Fortunately,eveninthecaseofthelow-activityCOMPUCEA samples, the added detector back-groundcomponent in theenergy rangeup to250
keVisproperlyaccountedforinthespectrumeval-uation and has proved to have a negligible effect on theperformanceoftheenrichmentassay(Note:Anelevated detector background due to radiations fromthedecayof138Laalsooccursinhigherenergyregions, outside of the region of interest for enrich-ment measurements).
It should be noted that for the efficient detection of 186keVgamma rays lanthanumbromidecrystalsdonotneedtobethickerthanabout2-2.5cm.A2cm thick LaBr3crystaldopedwith5wt%Cestops95%of186keVphotons.Astandardcrystalthick-nessof1”isthereforemorethanadequateforen-richment measurements. The reduced detector vol-ume would also reduce the internal detector background.
4. Application to enrichment measurements on COMPUCEA samples
Samplecountinginawellcounterasroutinelyprac-ticedsofarintheCOMPUCEAmeasurementswiththeHPGewelldetectornotonlyoffershighdetec-tionefficiency,italsorepresentsacountingconfig-uration being least sensitive to measurement varia-bilities such as sample positioning or small dimensional variations of the sample containers holding the uranium solutions. Since lanthanum bromidedetectorsarenotyetavailableintheformofwelldetectors,adifferentcountinggeometryasshown in Fig. 4 had to be chosen for the test meas-urements with the LaBr3(Ce) detector.
The sample-detector configuration represents acompromisebetweenclosestpossible sample-to-detectordistanceformaximumdetectionefficiency,and desirable larger sample distance for increased immunitytovariationsinsampleandcontainerdi-mensions.Topartlycompensateforthesomewhat
For the 186 keV gamma ray, the lanthanum bromide detector offers two times better energy resolution than the NaI detector.
Property LaBr3(Ce) NaI(Tl) Crystal density
(g/cm3) 5.29 3.67
Thickness for 50% attenuation of 662 keV gammas (cm) 1.8 2.5
Light yield (Photons/keV) 63 38
1/e decay time (ns) 16 250
Temp. coefficient of light output (%/°C between 0° and 50°C) <0.02 -0.3
Table 1. Comparison of scintillator detector properties (from [8]).
FWHM energy resolution (%) Energy
(keV)
LaBr3(Ce) NaI(Tl)
Improvement factor for LaBr3(Ce)
29 59 88 186 662
1001 2614
13.58 9.80 7.55 4.87 2.68 2.09 1.34
20.10 14.65 11.88 9.71 6.50 5.46 3.55
1.48 1.50 1.57 1.99 2.43 2.61 2.65
Table 2. Measured energy resolutions for 2" x 2" LaBr3(Ce) and NaI(Tl) detectors.
The spectral appearance of gamma spectra from low-enriched uranium is displayed in Fig. 2. The figure shows spectra for a typical COMPUCEA sample (0.5 g of uranium with an enrichment of 4.4% in 2.5 ml of nitric acid) taken with 3 types of detectors: the 110 cm3
HPGe well detector so far routinely used in COMPUCEA, a 3"x3" Na(Tl) well detector, and a 2"x2" LaBr3(Ce) detector. The measurement example produced with the lanthanum bromide scintillation detector shows a uranium gamma spectrum, in which the main 235U gamma rays (143, 163, 186, 205 keV) are reasonably resolved.
Fig. 2. Comparison of HPGe, LaBr3(Ce) and NaI(Tl) gamma spectra from a low-enriched uranium sample.
A peculiarity of the lanthanum-based scintillators is the presence of an inherent background originating from the electron capture and -decay of the long-lived minor La isotope 138La (t1/2 = 1.05x10¹¹y) to 138Ba (66.4%) and 138Ce (33.6%, see schematic decay scheme in Fig. 3). The Ba X-ray peak visible in the LaBr3 spectra in Figs. 2 and 3 results from the EC decay of 138La to 138Ba (the single X-ray peak near 37.4 keV in fact represents the accumulated energy given off by the X-rays in the EC process). The -decay to 138Ce, in turn, manifests itself in a beta continuum background with an endpoint energy of 255 keV as shown in Fig. 3. This continuous beta background occurring in the energy range of the 235U gamma rays normally turns out to be negligible for enrichment measurements on bulk uranium samples, but it may notably contribute (about 20-30%) to the Compton and Bremsstrahlung background from the high-energy 234mPa gamma rays in enrichment measurements on small quantities of uranium (1 g or less as in the case of the COMPUCEA measurements). This is illustrated in Fig. 3, which shows the magnitude of the internal beta continuum background in relation to the gamma spectrum produced by a 5 ml uranium solution sample with 1 g of natural uranium (kept at 1 cm distance from the surface of a 2" x 2" LaBr3 detector). Fortunately, even in the case of the low-activity COMPUCEA samples, the added detector background component in the energy range up to 250 keV is properly accounted for in the spectrum evaluation and has proved to have a negligible effect on the performance of the enrichment assay (Note: An elevated detector background due to radiations from the decay of 138La also occurs in higher energy regions, outside of the region of interest for enrichment measurements). It should be noted that for the efficient detection of 186 keV gamma rays lanthanum bromide crystals do not need to be thicker than about 2-2.5 cm. A 2 cm thick LaBr3 crystal doped with 5 wt% Ce stops 95% of 186 keV photons. A standard crystal thickness of 1" is therefore more than adequate for enrichment measurements. The reduced detector volume would also reduce the internal detector background.
Fig. 3. Magnitude of internal background from a 2" x 2" LaBr3 detector in comparison to the gamma spectrum from a 1 g U-nat sample. 4. Application to enrichment measurements on COMPUCEA samples Sample counting in a well counter as routinely practiced so far in the COMPUCEA measurements with the HPGe well detector not only offers high detection efficiency, it also represents a counting configuration being least sensitive to measurement variabilities such as sample positioning or small dimensional variations of the sample containers holding the uranium solutions. Since lanthanum bromide detectors are not yet available in the form of well detectors, a different counting geometry as shown in Fig. 4 had to be chosen for the test measurements with the LaBr3(Ce) detector.
lowerdetectionefficiency,thevolumeoftheurani-um solution was increased from 2.5 ml to 5 ml. For thepolystyrenesamplecontainerwithaninnerdi-ameterof36mmthisyieldsa5mmthicksolutionlayer. The sample was viewed by the detectorthrougha10mmhigh,30mmdiameterPbcollima-tor and a 0.5 mm thick Cu filter.
Table3comparesthecountratesforthe186keVgammas obtained with the configuration shown in Fig. 4 with the corresponding rates measured in the standard 110 cm3GewelldetectorofCOMPUCEA,andwithanalternativelytested3”x3”NaIwellde-tector. It is obvious that the less efficient counting geometryofFig.4provideslowerpeakcountratesthan the well-type configurations. For the sameamountofuraniumthecountingefficiencydecreas-esbyaboutafactorof4.Acountingconfigurationwith significantly enhanced detection efficiency,however, could be realized with available LaBr3 de-tectors in the formof a sandwich-type configura-tion, incorporating, for example, two 2” x 0.75”LaBr3 detectors as sketched in Fig. 5. Such a con-figurationwouldprovidearelativelyrobustandef-ficient countinggeometry, yielding186 keVcountratesofabout150cpsper%enrichmentfroma5mlsampleasindicatedintheright-handcolumnof
Table 3. Graphs showing the expectedmeasure-mentprecisionfromthis186keVcountrateinde-pendence on counting time and enrichment are giveninFig.6.
Fig. 5. Proposed sandwich detector configuration for enhanced detection efficiency. Sample volume 5 ml with 1g of U.
Fig. 6. Expected counting precision for the configuration of Fig.5. 5. Spectrum analysis The method for spectrum analysis applied to the LaBr3 spectra was adopted from that used in the NaIGEM code for 235U enrichment measurements with NaI detectors [7]. In this method, response profiles are computed for each of the components contributing to the 130 - 290 keV region of the spectrum that is analyzed. These responses are then fit to the observed data by the method of least-squares. Two of the components, of course, are spectrum profiles for 235U and 238U. However, other profiles are generated to account for small shifts in the spectrum gain and changes in the detector resolution that may have occurred. The peak structure in the 130 - 290 keV region is primarily due to 235U gamma rays. The principal gamma ray peaks of 235U are: 143.76, 163.37, 182.57, 185.72, 194.94, 202.1, and 205.33 keV. Although gamma rays from 238U and its daughters are very weak in this region, their Compton scattering and Bremsstrahlung radiations do contribute significantly to the background continuum. In the case of the LaBr3 detector the internal background produced by the detector material itself contributes to the background. The principal shape of the gamma ray peaks for both the LaBr3 and NaI detectors is described by Gaussian functions. The 235U response profile is generated using known gamma-ray branching intensities that have been modified to account for attenuation by filters and other materials and by the relative detection efficiency. The equation describing the “background” continuum contains two components. The first accounts for the “step” function associated with the different background levels in front of and after the peaks. The other is a polynomial equation used to describe the shape of the Compton plus Bremsstrahlung continuum associated with the decay of 238U and its daughters, and
Figure 5: Proposedsandwichdetectorconfigurationforenhanceddetectionefficiency.Samplevolume5mlwith1g of U.
Fig. 5. Proposed sandwich detector configuration for enhanced detection efficiency. Sample volume 5 ml with 1g of U.
Fig. 6. Expected counting precision for the configuration of Fig.5. 5. Spectrum analysis The method for spectrum analysis applied to the LaBr3 spectra was adopted from that used in the NaIGEM code for 235U enrichment measurements with NaI detectors [7]. In this method, response profiles are computed for each of the components contributing to the 130 - 290 keV region of the spectrum that is analyzed. These responses are then fit to the observed data by the method of least-squares. Two of the components, of course, are spectrum profiles for 235U and 238U. However, other profiles are generated to account for small shifts in the spectrum gain and changes in the detector resolution that may have occurred. The peak structure in the 130 - 290 keV region is primarily due to 235U gamma rays. The principal gamma ray peaks of 235U are: 143.76, 163.37, 182.57, 185.72, 194.94, 202.1, and 205.33 keV. Although gamma rays from 238U and its daughters are very weak in this region, their Compton scattering and Bremsstrahlung radiations do contribute significantly to the background continuum. In the case of the LaBr3 detector the internal background produced by the detector material itself contributes to the background. The principal shape of the gamma ray peaks for both the LaBr3 and NaI detectors is described by Gaussian functions. The 235U response profile is generated using known gamma-ray branching intensities that have been modified to account for attenuation by filters and other materials and by the relative detection efficiency. The equation describing the “background” continuum contains two components. The first accounts for the “step” function associated with the different background levels in front of and after the peaks. The other is a polynomial equation used to describe the shape of the Compton plus Bremsstrahlung continuum associated with the decay of 238U and its daughters, and
Figure 6: Expectedcountingprecisionfortheconfigura-tion of Fig.5.
5. Spectrum analysis
Themethod for spectrum analysis applied to theLaBr3 spectra was adopted from that used in the NaIGEM code for 235U enrichment measurements with NaI detectors [7]. In this method, response pro-files are computed for each of the components con-tributingtothe130–290keVregionof thespec-trumthatisanalyzed.Theseresponsesarethenfittotheobserveddatabythemethodofleast-squares.Two of the components, of course, are spectrum
Fig. 4. Counting configuration used for the measurements with the LaBr3 detector. The sample-detector configuration represents a compromise between closest possible sample-to-detector distance for maximum detection efficiency, and desirable larger sample distance for increased immunity to variations in sample and container dimensions. To partly compensate for the somewhat lower detection efficiency, the volume of the uranium solution was increased from 2.5 ml to 5 ml. For the polystyrene sample container with an inner diameter of 36 mm this yields a 5 mm thick solution layer. The sample was viewed by the detector through a 10 mm high, 30 mm diameter Pb collimator and a 0.5 mm thick Cu filter. Table 3 compares the count rates for the 186 keV gammas obtained with the configuration shown in Fig. 4 with the corresponding rates measured in the standard 110 cm3
Ge well detector of COMPUCEA, and with an alternatively tested 3" x 3" NaI well detector. It is obvious that the less efficient counting geometry of Fig. 4 provides lower peak count rates than the well-type configurations. For the same amount of uranium the counting efficiency decreases by about a factor of 4. A counting configuration with significantly enhanced detection efficiency, however, could be realized with available LaBr3 detectors in the form of a sandwich-type configuration, incorporating, for example, two 2" x 0.75" LaBr3 detectors as sketched in Fig. 5. Such a configuration would provide a relatively robust and efficient counting geometry, yielding 186 keV count rates of about 150 cps per % enrichment from a 5 ml sample as indicated in the right-hand column of Table 3. Graphs showing the expected measurement precision from this 186 keV count rate in dependence on counting time and enrichment are given in Fig. 6.
Detector/ Configuration
110 cm3 HPGe well (Fig. 1)
3" x 3" NaI well (Fig. 1)
2" x 2" LaBr3
planar (Fig. 4) 2" x 0.75" LaBr3
sandwich (Fig. 5) Sample vol. (ml) 2.5 2.5 5 5
Amount U (g) 0.5 0.5 1 1 Filter 1 mm PE 1 mm Ti 0.5 mm Cu 0.5 mm Cu
186 keV (cps) per % enrichment
60, 65, 72 (rates from 3 units)
109 36 ~ 150 (expected)
Table 3. Comparison of 186 keV peak count rates from different measurement configurations.
Figure 4: Counting configuration used for the measure-ments with the LaBr3 detector.
profiles for 235U and 238U. However, other profiles are generated to account for small shifts in the spec-trum gain and changes in the detector resolution thatmayhaveoccurred.
Thepeakstructure in the130–290keVregion isprimarily due to 235U gamma rays. The principalgamma ray peaks of 235U are: 143.76, 163.37,182.57,185.72,194.94,202.1,and205.33keV.Al-thoughgammaraysfrom238U and its daughters are veryweak inthisregion, theirComptonscatteringand Bremsstrahlung radiations do contribute sig-nificantlytothebackgroundcontinuum.Inthecaseof the LaBr3 detector the internal background pro-ducedbythedetectormaterialitselfcontributestothe background.
The principal shape of the gamma ray peaks forboth the LaBr3 andNaIdetectors isdescribedbyGaussian functions. The 235U response profile is generated using known gamma-ray branching in-tensities that have been modified to account for at-tenuationbyfiltersandothermaterialsandbytherelativedetectionefficiency.Theequationdescrib-ingthe“background”continuumcontainstwocom-ponents.Thefirstaccountsforthe“step”functionassociated with the different background levels in frontofandafterthepeaks.Theotherisapolyno-mial equation used to describe the shape of the Compton plus Bremsstrahlung continuum associ-atedwiththedecayof238U and its daughters, and with the internal background continuum of the LaBr3 detector.Themethodofanalysis is iterative.Con-vergence must first be reached to account for changes in gain and resolution before a final calcu-lationismadetodeterminetheintensityofthe235U response.An example showing the final fit of theprincipal 235U response from the LaBr3 detector is given in Fig. 7. The fitting graph in Fig. 8 shows an-otherfittingoptioninwhichthe186keVpeakisiso-lated from the rest of the 235U response. The LaBr3 spectralresponsesdisplayedinthefigures,ifcom-pared with the corresponding response from a NaI detector shown for comparison in Fig. 9, best illus-trate the kind of spectral improvement gained with a lanthanum bromide detector.
6. Performance
In a perfect enrichment measurement, the regis-tered186keVpeakcountratesareexpectedtobestrictlyproportionaltothe235U isotopic abundance. Thisfeature, ifrealized,notonlysimplifiescalibra-tion,butalsohelpstoreduceand/ortoavoidsys-tematic measurement errors. Achieved strict pro-portionalityprimarilyprovestheabilityoftheappliedmethod forspectrumanalysis toextractunbiased
net peak counts from the measured gamma spec-tra, irrespective of given spectral features like, for example,thedegreeofenergyresolutionorchang-ingpeak-to-backgroundratios.
In order to verify the assumed proportionality, wehavecarriedouthigh-precisionmeasurementsonasetofcarefullycharacteriseduraniumreferenceso-lutions with 6 different grades of 235U enrichment (0.3158,0.7202,1.3802,2.1039,3.2469and4.3138
with the internal background continuum of the LaBr3 detector. The method of analysis is iterative. Convergence must first be reached to account for changes in gain and resolution before a final calculation is made to determine the intensity of the 235U response. An example showing the final fit of the principal 235U response from the LaBr3 detector is given in Fig. 7. The fitting graph in Fig. 8 shows another fitting option in which the 186 keV peak is isolated from the rest of the 235U response. The LaBr3 spectral responses displayed in the figures, if compared with the corresponding response from a NaI detector shown for comparison in Fig. 9, best illustrate the kind of spectral improvement gained with a lanthanum bromide detector.
Fig.7. LaBr3 graph fitting the principal 235U response.
Fig.8. Another fitting version for LaBr3 spectra where the 186 peak is isolated from the rest of the 235U response.
Fig 9. Fitting graph for a NaI spectrum.
Figure 7: LaBr3 graph fitting the principal 235U response.
with the internal background continuum of the LaBr3 detector. The method of analysis is iterative. Convergence must first be reached to account for changes in gain and resolution before a final calculation is made to determine the intensity of the 235U response. An example showing the final fit of the principal 235U response from the LaBr3 detector is given in Fig. 7. The fitting graph in Fig. 8 shows another fitting option in which the 186 keV peak is isolated from the rest of the 235U response. The LaBr3 spectral responses displayed in the figures, if compared with the corresponding response from a NaI detector shown for comparison in Fig. 9, best illustrate the kind of spectral improvement gained with a lanthanum bromide detector.
Fig.7. LaBr3 graph fitting the principal 235U response.
Fig.8. Another fitting version for LaBr3 spectra where the 186 peak is isolated from the rest of the 235U response.
Fig 9. Fitting graph for a NaI spectrum.
Figure 8: Another fitting version for LaBr3 spectra where the 186 peak is isolated from the rest of the 235U re-sponse.
with the internal background continuum of the LaBr3 detector. The method of analysis is iterative. Convergence must first be reached to account for changes in gain and resolution before a final calculation is made to determine the intensity of the 235U response. An example showing the final fit of the principal 235U response from the LaBr3 detector is given in Fig. 7. The fitting graph in Fig. 8 shows another fitting option in which the 186 keV peak is isolated from the rest of the 235U response. The LaBr3 spectral responses displayed in the figures, if compared with the corresponding response from a NaI detector shown for comparison in Fig. 9, best illustrate the kind of spectral improvement gained with a lanthanum bromide detector.
Fig.7. LaBr3 graph fitting the principal 235U response.
Fig.8. Another fitting version for LaBr3 spectra where the 186 peak is isolated from the rest of the 235U response.
Fig 9. Fitting graph for a NaI spectrum.
Figure 9: Fitting graph for a NaI spectrum.
ESARDA BULLETIN, No. 38, June 2008
38
wt% 235U). Comparative measurements were made with 3 different units of the standardCOMPUCEAHPGewelldetector,witha3”x3”NaIwelldetector,andwiththe2”x2”LaBr3 detector. From each of the 6referencesolutions2.5mlaliquotsweretransferredintothecylindricalsamplevialsusedforthecountingin the well detectors (Ge and NaI), and 5 ml aliquots wereloadedintothepolystyrenesamplecontainersfor the counting with the LaBr3 detector in the con-figuration shown in Fig. 4. The combined uncertain-tiesfortheuraniumconcentration(fromgravimetry),for the 235U isotope abundance (from mass spec-trometry),andfromsampleweighingyieldedatotaluncertaintyof0.12%(1s)fortheamountof235U con-tained in the samples with enriched uranium. For the sampleswithdepleted(0.3158%)andnaturalurani-umtheaccuracyofthe235U content was limited to 0.30% and 0.15%, respectively, by the respectiveuncertainties of the mass spectrometry measure-ments for the 235U abundance.
For all gamma measurements, the statistical count-ingerrorforthe186keVgammaswaskeptbelow0.1%. Since the reference solutions did not haveexactly the same uranium concentration (rangingbetween 193 and 201 mgU/ml), small corrections for gamma self attenuation had to be applied to the measured 186 keV count rates. The differentialchange of the count rate as a function of uranium concentration around a reference concentration of 200 mgU/ml has been determined from measure-ments made on samples of same enrichment but different uranium concentration. The observed dif-ferential changes are listed in the 1st row of Table 4. Anothercorrectionmadetothemeasured186keVpeak rates accounted for small contributions of gammarays from 234Paand 234mPato the186keVline from 235U. The respective corrections amount to 0.38%and0.16%forthedepletedandnaturalura-nium samples, and to less than 0.1% for the en-riched uranium materials.
6. Performance In a perfect enrichment measurement, the registered 186 keV peak count rates are expected to be strictly proportional to the 235U isotopic abundance. This feature, if realized, not only simplifies calibration, but also helps to reduce and/or to avoid systematic measurement errors. Achieved strict proportionality primarily proves the ability of the applied method for spectrum analysis to extract unbiased net peak counts from the measured gamma spectra, irrespective of given spectral features like, for example, the degree of energy resolution or changing peak-to-background ratios. In order to verify the assumed proportionality, we have carried out high-precision measurements on a set of carefully characterised uranium reference solutions with 6 different grades of 235U enrichment (0.3158, 0.7202, 1.3802, 2.1039, 3.2469 and 4.3138 wt% 235U). Comparative measurements were made with 3 different units of the standard COMPUCEA HPGe well detector, with a 3" x 3" NaI well detector, and with the 2" x 2" LaBr3 detector. From each of the 6 reference solutions 2.5 ml aliquots were transferred into the cylindrical sample vials used for the counting in the well detectors (Ge and NaI), and 5 ml aliquots were loaded into the polystyrene sample containers for the counting with the LaBr3 detector in the configuration shown in Fig. 4. The combined uncertainties for the uranium concentration (from gravimetry), for the 235U isotope abundance (from mass spectrometry), and from sample weighing yielded a total uncertainty of 0.12% (1s) for the amount of 235U contained in the samples with enriched uranium. For the samples with depleted (0.3158%) and natural uranium the accuracy of the 235U content was limited to 0.30% and 0.15%, respectively, by the respective uncertainties of the mass spectrometry measurements for the 235U abundance. For all gamma measurements, the statistical counting error for the 186 keV gammas was kept below 0.1%. Since the reference solutions did not have exactly the same uranium concentration (ranging between 193 and 201 mgU/ml), small corrections for gamma self attenuation had to be applied to the measured 186 keV count rates. The differential change of the count rate as a function of uranium concentration around a reference concentration of 200 mgU/ml has been determined from measurements made on samples of same enrichment but different uranium concentration. The observed differential changes are listed in the 1st row of Table 4. Another correction made to the measured 186 keV peak rates accounted for small contributions of gamma rays from 234Pa and 234mPa to the 186 keV line from 235U. The respective corrections amount to 0.38% and 0.16% for the depleted and natural uranium samples, and to less than 0.1% for the enriched uranium materials.
Fig. 10. Normalized 186 keV count rate as a function of 235U enrichment. The derived values for the corrected 186 keV count rates per mg 235U, relative to the mean value of the results for the 6 different enrichments, are plotted in Fig. 10. For the sake of clarity, error bars (1s) are only given for the data set obtained with the LaBr3 detector. The same uncertainties also apply to the other data sets (in numbers: 0.32% for the depleted uranium sample, 0.18% for U-nat sample, and 0.13% for the enriched uranium samples). Numbers for the weighted mean values and the weighted standard deviations of the 6 measurement results per detector are given in Table 4.
Thederivedvaluesforthecorrected186keVcountrates per mg 235U, relative to the mean value of the resultsforthe6differentenrichments,areplottedinFig.10.For thesakeofclarity,errorbars (1s)areonlygivenforthedatasetobtainedwiththeLaBr3 detector.Thesameuncertaintiesalsoapplytotheotherdatasets(innumbers:0.32%forthedepleteduranium sample, 0.18% for U-nat sample, and0.13%fortheenricheduraniumsamples).Numbersfor the weighted mean values and the weighted standarddeviationsof the6measurement resultsper detector are given in Table 4.
From a visual inspection of Fig. 10, and from the derived values for the weighted standard deviations, weconclude:(i)thedesiredproportionalitybetween186keVpeakcountrateandenrichmentindeedex-ists, and (ii) the performance of the LaBr3 detector favourably compareswith the performanceof theHPGedetectors.
Another aspect investigated separately concernsthequestionofmeasurementreproducibilityforthecounting configuration chosen for the LaBr3 detec-tor(Fig.4).Wehadnotedthatthedisposablepoly-styrene sample containers used in this measure-ment showed some variations in the bottom thickness of the order of up to 0.1 mm, which at the given sample–to-detector distance of 11 mm willnotablyaffecttheeffectivesolidangle.Forthisrea-sononlysamplecontainersshowingauniformbot-tom thickness within ± 0.01 mm were selected for the enrichment measurements. The results of a re-producibilitytest,consistingofmeasurementson7different sample containers holding the same ura-nium solution, is shown in Fig. 11. Taking into ac-counttheaveragestatisticalcountingerrorof0.06%per individual measurement, the results suggest a measurementreproducibilityofabout0.12%.
7. Outlook
We have demonstrated from our investigations that gamma spectrometry with a lanthanum bromidescintillationdetector,ifusedinconjunctionwiththemodifiedNaIGEMcode for spectrumanalysis, al-lowshigh-accuracyenrichmenturaniummeasure-
ESARDA BULLETIN, No. 38, June 2008
39
ments under the conditions of the COMPUCEAanalyses.We are therefore planning to apply thistypeofdetectorinthe2ndgenerationoftheCOM-PUCEAequipment,meetingthenour initialdesigngoal of having an instrumentation operating onlywithroom-temperaturedetectors.AlsowithaLaBr3 detectoritappearsrealistictokeepthesystematicmeasurementuncertaintyforenrichmentmeasure-ments at the level of 0.2%as set by the interna-tional target values for the present COMPUCEAmeasurementswithahigh-resolutionHPGedetec-tor [10].
[5]S. Abousahl, N. Albert, P. Amador, H. Eberle, H.Ottmar, H.Schorlé,“PerformanceandvalidationofCOMPUCEA2ndgen-erationforuraniummeasurementsinphysicalinventoryverifi-cation”, Proc. Intern. Safeguards Symposium on AddressingVerification Challenges, International Atomic Energy Agency,Vienna,Austria,October16-20,2006.
[9]R.Gunnink,R.Arlt,R.Berndt,“NewGeandNaIAnalysisMeth-ods for Measuring 235U Enrichments”, Proc. 19th Annual ES-ARDASymp.,Montpellier,France,13-15May,1997,431.
[10]H.Aigneretal.“InternationalTargetValues2000forMeasure-ment Uncertainties in Safeguarding Nuclear Materials”, ES-ARDA Bulletin 31, April 2002, 39.
From a visual inspection of Fig. 10, and from the derived values for the weighted standard deviations, we conclude: (i) the desired proportionality between 186 keV peak count rate and enrichment indeed exists, and (ii) the performance of the LaBr3 detector favourably compares with the performance of the HPGe detectors.
Quantity Ge-1 Ge-2 Ge-3 NaI(Tl) LaBr3(Ce)
Self attenuation correction (% per change of 1 gU/l)
0.063 0.068 0.063 0.055 0.038
Weighted mean (186 keV counts/s per mg U-235)
12.057 13.085 14.451 22.830 3.575
Weighted standard deviation (%)
0.124 0.0759 0.125 0.435 0.092
Table 4. Pertinent measurement data from linearity test. Another aspect investigated separately concerns the question of measurement reproducibility for the counting configuration chosen for the LaBr3 detector (Fig. 4). We had noted that the disposable polystyrene sample containers used in this measurement showed some variations in the bottom thickness of the order of up to 0.1 mm, which at the given sample–to-detector distance of 11 mm will notably affect the effective solid angle. For this reason only sample containers showing a uniform bottom thickness within ± 0.01 mm were selected for the enrichment measurements. The results of a reproducibility test, consisting of measurements on 7 different sample containers holding the same uranium solution, is shown in Fig. 11. Taking into account the average statistical counting error of 0.06% per individual measurement, the results suggest a measurement reproducibility of about 0.12%.
Fig. 11. Results of reproducibility measurements on 7 samples of same enrichment. 7. Outlook We have demonstrated from our investigations that gamma spectrometry with a lanthanum bromide scintillation detector, if used in conjunction with the modified NaIGEM code for spectrum analysis, allows high-accuracy enrichment uranium measurements under the conditions of the COMPUCEA analyses. We are therefore planning to apply this type of detector in the 2nd
generation of the COMPUCEA equipment, meeting then our initial design goal of having an instrumentation operating only with room-temperature detectors. Also with a LaBr3 detector it appears realistic to keep the systematic measurement uncertainty for enrichment measurements at the level of 0.2% as set by the international target values for the present COMPUCEA measurements with a high-resolution HPGe detector [10]. References [1] P. Matussek, I. Michel-Piper, H. Ottmar, “A Compact Densitometer for Uranium”, Proc. 13th
ESARDA Symp., Avignon, France, 14-16 May, 1991, 329.
Figure 11: Resultsofreproducibilitymeasurementson7samples of same enrichment.
ESARDA BULLETIN, No. 38, June 2008
40
Abstract
When uranium hexafluoride (UF6) is released into the environment, it reacts with the atmospheric moisture forming uranium oxyfluoride particles and hydrogen fluoride (HF). Fluorine-containing com-pounds such as HF are recognized as signatures for enrichment activities. In this study, the connection between the fluorine in the particles and the age of the particles has been investigated. Establishing this link is not evident, as uranium oxyfluoride particles are highly hygroscopic and little is known about their reaction mechanisms and stability. There are vari-ous environmental factors such as time, humidity and light or heat exposure that could affect the amount of fluorine. Even after the particles are col-lected, the fluorine could decrease further due to sample preparation or storage conditions.
The influence of ultraviolet light exposure combined with the time elapsed after preparation has been in-vestigated on uranium oxyfluoride particles prepared at the Institute for Reference Materials and Meas-urements (EC-JRC-IRMM) using an aerosol deposi-tion chamber. The presence of fluorine in particles was confirmed by energy-dispersive X-ray analysis (EDX). Semi-quantitative information was obtained by evaluating specific peak height ratios obtained by secondary ion mass spectrometry (SIMS). With these measurements, possible correlations existing between the amount of fluorine and the age of a particle could be investigated, taking into account the environmental conditions to which the uranium oxyfluoride particles were exposed.
Environmentalsampling,as introduced in1996aspart of routine INFCIRC-153 safeguards agree-ments and strengthened since the late 1990’s bytheAdditionalProtocol(INFCIRC-540)oftheInter-nationalAtomicEnergyAgency(IAEA),hasprovento be an important safeguards tool in the verification of the absence of undeclared nuclear activities [1, 2].Bywipingsurfacesinoraroundnuclearfacilities,
using small pieces of cotton cloth called swipes, uranium-bearingparticlesarecollectedamongmil-lionsofotherdustparticles.Theanalysisof theseuraniumparticles can reveal key informationonasite’scurrentandpastactivities.Althoughtheem-phasis is currently on the analysis of the uraniumisotopes, a lot of information can be deduced from theparticle’smorphology,surfacestructure,crys-tallinityorelementalcomposition[3].
Uranium-bearingparticlesfromswipesamplestakenat uranium enrichment facilities often contain fluo-rine.Althoughtheseparticlesmayresultfromdepos-its that are formed when adsorbed water and urani-umhexafluoride(UF6) interact,manyofthemresultfrom the gaseous release of small amounts UF6. Ini-tially, uranium oxyfluoride (UO2F2) particles are formed when UF6 reacts with atmospheric moisture. However, there are several variables that affect the particle composition and the amount of fluorinepresent. These include exposure to humidity, heatand light, both during and after particle formation, in addition to the time elapsed since particle forma-tion.
Inthisstudy,weinvestigatedwhethertheanalysisoffluorineinUO2F2 particles could be used to sup-plement information on the uranium isotopic com-position. In particular, if a correlation could be found betweentheamountoffluorineandtheageoftheparticle, the measurement of fluorine in particleswould not only provide information on the likelysource of the particles, i.e. enrichment activities, butalsoontheirhistory.
Theparticlesformedfromuraniumhexafluoridearehighlyhygroscopic,and little isknownabout theirlong-termstability.Beforebeingcollectedonswipestheymayhavebeenexposedtohightemperatures,ahighhumidityorsunlight.Allofthesefactorscouldhave altered their morphology and compositionand, more specifically, their fluorine content. Anystudyofthefluorinecontentofparticlesoriginatingfrom UF6 must therefore take into account the envi-ronmentalparametersthatinfluencetheamountoffluorine.Inthiswork,theeffectsofultraviolet lightandstoragetimeonthefluorinecontentofparticles
Fluorine as a Safeguards Tool for Age Dating of Uranium Oxyfluoride Particles?Ruth Kips, Roger WellumInstitute for Reference Materials and MeasurementsJoint Research Centre, European CommissionRetieseweg 111, 2440 Geel, BelgiumE-mail: [email protected]
ESARDA BULLETIN, No. 38, June 2008
41
prepared under controlled conditionswere exam-ined.
2. Materials and Methods
UO2F2 particles were prepared using an aerosol deposition chamber developed at the Institute for ReferenceMaterialsandMeasurements (EC-JRC-IRMM) (Fig.1). When released into the aerosol dep-osition chamber, the UF6 reacts with the atmos-phericmoisturetoformhydrogenfluoride(HF)andUO2F2 particles [4]:
UF6 + 2H2O→UO2F2 + 4HF
2
found between the amount of fluorine and the age of the particle, the measurement of fluorine in particles would not only provide information on the likely source of the particles, i.e. enrichment activities, but also on their history. The particles formed from uranium hexafluoride are highly hygroscopic, and little is known about their long-term stability. Before being collected on swipes they may have been exposed to high temperatures, a high humidity or sunlight. All of these factors could have altered their morphology and composition and, more specifically, their fluorine content. Any study of the fluorine content of particles originating from UF6 must therefore take into account the environmental parameters that influence the amount of fluorine. In this work, the effects of ultraviolet light and storage time on the fluorine content of particles prepared under controlled conditions were examined. 2. Materials and Methods UO2F2 particles were prepared using an aerosol deposition chamber developed at the Institute for Reference Materials and Measurements (EC-JRC-IRMM) (Fig.1). When released into the aerosol deposition chamber, the UF6 reacts with the atmospheric moisture to form hydrogen fluoride (HF) and UO2F2 particles [4]:
UF6 + 2H2O UO2F2 + 4HF
Figure 1: Aerosol deposition chamber designed at the IRMM for the preparation of UO2F2 particles from the controlled hydrolysis of UF6.
The UO2F2 particles were collected on graphite planchets of 25 mm diameter (Schunk, Germany) at the base of the deposition chamber. It has been demonstrated that the humidity of the air inside the deposition chamber is a determining factor for the particle morphology [4-6]. A dry atmosphere, of less than 15 % relative humidity, results in submicron particles that agglomerate to larger structures of up to 100 micrometers. In contrast, when the relative humidity of the air exceeds 60 %, the particles become more spherical and the degree of agglomeration is lower. Using a high humidity to limit agglomeration, particles of diameters between a few hundred nanometers and 2.5 micrometers were collected, with individual particles separated by a few micrometers (Fig. 2). Such particles were well-suited for direct analysis. As part of the original preparation procedure, the particles were heated for at least 6 hours in an open furnace at 350 ºC to remove excess water and other volatile elements. This heat treatment inevitably removes most of the fluorine in the particles. As a consequence, any existing information between the amount of fluorine and the age of a particle is lost. The heat treatment was therefore omitted from the preparation procedure and freshly prepared particles were measured directly after preparation by SEM-EDX.
Figure 1: Aerosol deposition chamber designed at the IRMM for the preparation of UO2F2 particles from the controlledhydrolysisofUF6.
The UO2F2 particles were collected on graphite planchetsof25mmdiameter(Schunk,Germany)atthe base of the deposition chamber. It has been demonstratedthatthehumidityoftheairinsidethedeposition chamber is a determining factor for the particlemorphology[4-6].Adryatmosphere,oflessthan 15% relative humidity, results in submicronparticles that agglomerate to larger structures of up to 100 micrometers. In contrast, when the relative humidityoftheairexceeds60%,theparticlesbe-come more spherical and the degree of agglomera-tionislower.Usingahighhumiditytolimitagglom-eration, particles of diameters between a few hundred nanometers and 2.5 micrometers were col-lected,withindividualparticlesseparatedbyafewmicrometers(Fig.2).Suchparticleswerewell-suit-edfordirectanalysis.
As part of the original preparation procedure, the particleswereheatedforatleast6hoursinanopenfurnaceat350ºCtoremoveexcesswaterandother
volatileelements.Thisheattreatmentinevitablyre-movesmost of the fluorine in the particles. As aconsequence,anyexistinginformationbetweentheamountoffluorineandtheageofaparticleislost.The heat treatment was therefore omitted from the preparationprocedure and freshlypreparedparti-cles were measured directly after preparation bySEM-EDX.
3
Figure 2: Scanning electron image in secondary electron mode showing uranium particles (white dots) produced in high humidity conditions (> 60 %) on a graphite planchet.
A FEI Quanta 200 3D scanning electron microscope equipped with an Oxford Si(Li) energy-dispersive X-ray detector (SEM-EDX) was used to locate the uranium particles and to determine their elemental composition. The electron acceleration voltage was set to 10 kV. SIMS ion-microprobe measurements were carried out to assess the effect of ultraviolet light and storage time on the relative amount of fluorine on a set of 14 particle samples. For every sample, SIMS ion-microprobe measurements were applied to between 4 and 7 particles. All but one sample contained UO2F2 particles: one sample contained UF4 particles stored in a laboratory environment for more than 2 years. This UF4 sample was used to test the repeatability of SIMS UF4 spectra and their quantitative distinctiveness from UO2F2. The storage time for the UO2F2 particle samples varied between 2 weeks and 29 months. One sample was exposed to ultraviolet light for 3 weeks. At QinetiQ in Malvern (UK), a Cameca IMS 4f SIMS spectrometer was used with 8.5 keV O2
+ primary ion bombardment at a current of 2 nA in a focused spot (estimated diameter 10 µm). The data were obtained by cycling the masses 238 (U), 239 (UH), 254 (UO), 257 (UF), 270 (UO2), 273 (UOF) and 276 (UF2) 10 times each to reveal any ratio variations with sputtering. The mean values of these ion intensity measurements were evaluated relative to the intensity at mass 238 (U). 3. Results The signature of freshly prepared particles was recorded using EDX, to serve as a reference level. Spectra of these freshly prepared particles clearly showed the fluorine K line at 0.677 keV, in addition to the U M (3.17 keV) and M (3.34 keV) X-ray lines (Fig. 3). The fluorine K line was still detected in the EDX spectrum after 3 weeks of ultraviolet light exposure. In contrast, particles subject to a heat treatment of 350 ºC for 6 hours, as originally foreseen in the particle preparation procedure, did not show the characteristic fluorine K line (Fig. 4). Carbon and oxygen were detected in all EDX spectra. The carbon peak was attributed to the graphite planchet substrate, whereas the oxygen peak was partially attributed to the particles, partially to surface contamination and residual gases in the specimen's chamber.
Figure 2: Scanningelectronimageinsecondaryelectronmode showing uranium particles (white dots) produced inhighhumidityconditions(>60%)onagraphiteplan-chet.
A FEI Quanta 200 3D scanning electron microscope equippedwithanOxfordSi(Li)energy-dispersiveX-raydetector(SEM-EDX)wasusedtolocatetheura-nium particles and to determine their elemental composition. The electron acceleration voltage was setto10kV.
SIMS ion-microprobemeasurementswere carriedout to assess the effect of ultraviolet light and stor-agetimeontherelativeamountoffluorineonasetof14particlesamples.Foreverysample,SIMSion-microprobe measurements were applied to between 4 and 7 particles. All but one sample contained UO2F2 particles: one sample contained UF4 parti-cles stored in a laboratory environment for morethan2years.ThisUF4 sample was used to test the repeatabilityofSIMSUF4 spectra and their quanti-tativedistinctivenessfromUO2F2. The storage time for the UO2F2 particle samples varied between 2 weeksand29months.Onesamplewasexposedtoultraviolet light for 3 weeks.
At QinetiQ in Malvern (UK), a Cameca IMS 4f SIMS spectrometerwasusedwith8.5keVO2
+primaryionbombardment at a current of 2 nA in a focused spot (estimated diameter 10 µm). The data were obtained bycyclingthemasses238(U),239(UH),254(UO),257 (UF), 270 (UO2), 273 (UOF) and 276 (UF2) 10 timeseachtorevealanyratiovariationswithsput-
Thesignatureoffreshlypreparedparticleswasre-corded using EDX, to serve as a reference level. Spectraof these freshlypreparedparticlesclearlyshowedthefluorineKαlineat0.677keV,inadditionto the U Mα(3.17keV)andMβ(3.34keV)X-raylines(Fig.3).ThefluorineKα line was still detected in the EDXspectrumafter3weeksofultravioletlightex-posure.Incontrast,particlessubjecttoaheattreat-mentof350ºCfor6hours,asoriginallyforeseeninthe particle preparation procedure, did not show the characteristic fluorine Kα line (Fig. 4). Carbon andoxygenweredetectedinallEDXspectra.Thecarbon peak was attributed to the graphite planchet substrate,whereas theoxygenpeakwaspartiallyattributedtotheparticles,partiallytosurfacecon-tamination and residual gases in the specimen’schamber.
SIMS ion-microprobemeasurementswere carriedout,providinggreatersensitivitythanEDXinmeas-uring fluorine, in a rangeof samples subjected tovariousexposureandstorageconditions.The254(UO)signalswereinherentlystrongforallsamplesduetotheoxygenprimaryionbeamthatwasused.In general, the 254(UO)/238U ion ratio measurements werefairlyreproducible,withavariationofafactor3 between samples. The 270(UO2)/
238Uratiogenerallytracked the 254(UO)/238U ratio.
Incontrasttotheuraniumoxideions,thefluorine-containing uranium ions did show significant differ-encesbetweenthesampletypes,thestoragetimesand thedegreeofexposure toultraviolet light [7].Forsamplesstoredinthelaboratoryforbetween11and16months,the257(UF)/238U ratio was about 10 times lower than for samples that were only 2months old. Similar decreases were observed for the 273(UOF)/238U and 276(UF2)/
238U ratios, which gen-erally tracked the 257(UF)/238U ratio, although the variations in the 276(UF2)/
238U ratio were much more pronounced.
4
Figure 3: Energy-dispersive X-ray spectrum of a uranium-bearing particle prepared by the aerosol deposition chamber showing the U M (3.17 keV) and M (3.34 keV) X-ray lines, in addition to the fluorine K line at 0.677 keV. The other peaks in the spectrum were attributed to oxygen, carbon and sodium.
Figure 4: Energy-dispersive X-ray spectrum of a uranium-bearing particle prepared by the aerosol deposition chamber and heat-treated at 350 °C for 6 hours showing the U M (3.17 keV) and M (3.34 keV) X-ray lines, in addition to carbon, oxygen and sodium. The fluorine K line at 0.677 keV line could no longer be detected in this spectrum.
SIMS ion-microprobe measurements were carried out, providing greater sensitivity than EDX in measuring fluorine, in a range of samples subjected to various exposure and storage conditions. The 254 (UO) signals were inherently strong for all samples due to the oxygen primary ion beam that was used. In general, the 254(UO)/238U ion ratio measurements were fairly reproducible, with a variation of a factor 3 between samples. The 270(UO2)/238U ratio generally tracked the 254(UO)/238U ratio. In contrast to the uranium oxide ions, the fluorine-containing uranium ions did show significant differences between the sample types, the storage times and the degree of exposure to ultraviolet light [7]. For samples stored in the laboratory for between 11 and 16 months, the 257(UF)/238U ratio was about 10 times lower than for samples that were only 2 months old. Similar decreases were observed for the 273(UOF)/238U and 276(UF2)/238U ratios, which generally tracked the 257(UF)/238U ratio, although the variations in the 276(UF2)/238U ratio were much more pronounced. To assess the reduction in the level of fluorine due to exposure to ultraviolet light, particles on a graphite planchet were exposed to ultraviolet light for 3 weeks. Although the sample was only 2 months old at the time of measurement, the 257(UF)/238U ratio had fallen to the level observed for particles that were stored for almost 1 year. This demonstrated that exposure to ultraviolet light significantly accelerated the particle ageing process. Although the SIMS measurements showed distinct differences between samples with different storage or exposure conditions, large particle-to-particle variations within the same sample were also
Figure 3: Energy-dispersiveX-rayspectrumofauranium-bearingparticlepreparedbytheaerosoldepositionchambershowing the U Mα(3.17keV)andMβ(3.34keV)X-raylines,inadditiontothefluorineKαlineat0.677keV.Theotherpeaksinthespectrumwereattributedtooxygen,carbonandsodium.
4
Figure 3: Energy-dispersive X-ray spectrum of a uranium-bearing particle prepared by the aerosol deposition chamber showing the U M (3.17 keV) and M (3.34 keV) X-ray lines, in addition to the fluorine K line at 0.677 keV. The other peaks in the spectrum were attributed to oxygen, carbon and sodium.
Figure 4: Energy-dispersive X-ray spectrum of a uranium-bearing particle prepared by the aerosol deposition chamber and heat-treated at 350 °C for 6 hours showing the U M (3.17 keV) and M (3.34 keV) X-ray lines, in addition to carbon, oxygen and sodium. The fluorine K line at 0.677 keV line could no longer be detected in this spectrum.
SIMS ion-microprobe measurements were carried out, providing greater sensitivity than EDX in measuring fluorine, in a range of samples subjected to various exposure and storage conditions. The 254 (UO) signals were inherently strong for all samples due to the oxygen primary ion beam that was used. In general, the 254(UO)/238U ion ratio measurements were fairly reproducible, with a variation of a factor 3 between samples. The 270(UO2)/238U ratio generally tracked the 254(UO)/238U ratio. In contrast to the uranium oxide ions, the fluorine-containing uranium ions did show significant differences between the sample types, the storage times and the degree of exposure to ultraviolet light [7]. For samples stored in the laboratory for between 11 and 16 months, the 257(UF)/238U ratio was about 10 times lower than for samples that were only 2 months old. Similar decreases were observed for the 273(UOF)/238U and 276(UF2)/238U ratios, which generally tracked the 257(UF)/238U ratio, although the variations in the 276(UF2)/238U ratio were much more pronounced. To assess the reduction in the level of fluorine due to exposure to ultraviolet light, particles on a graphite planchet were exposed to ultraviolet light for 3 weeks. Although the sample was only 2 months old at the time of measurement, the 257(UF)/238U ratio had fallen to the level observed for particles that were stored for almost 1 year. This demonstrated that exposure to ultraviolet light significantly accelerated the particle ageing process. Although the SIMS measurements showed distinct differences between samples with different storage or exposure conditions, large particle-to-particle variations within the same sample were also
Figure 4:Energy-dispersiveX-rayspectrumofauranium-bearingparticlepreparedbytheaerosoldepositionchamberand heat-treated at 350 °C for 6 hours showing the U Mα (3.17 keV) and Mβ (3.34 keV) X-ray lines, in addition to carbon, oxygen and sodium. The fluorine Kα line at 0.677 keV line could no longer be detected in this spectrum.
ESARDA BULLETIN, No. 38, June 2008
43
Toassessthereductionintheleveloffluorineduetoexposuretoultravioletlight,particlesonagraph-iteplanchetwereexposedtoultraviolet light for3weeks.Althoughthesamplewasonly2monthsoldat the time of measurement, the 257(UF)/238U ratio had fallen to the level observed for particles that werestored foralmost1year.Thisdemonstratedthatexposuretoultravioletlightsignificantlyaccel-erated the particle ageing process.
Although the SIMS measurements showed distinct differences between samples with different storage or exposure conditions, large particle-to-particlevariations within the same sample were also ob-served. These were attributed either to variations in theparticlemorphologyor toSIMSmeasurementeffects related to the ionisation and detection effi-ciencies. In some cases, a uniform film of uranium was detected instead of particles. The fact that the UO2F2 particles are highly hygroscopic could ex-plain this observation.
5. Conclusion and outlook
The aerosol deposition chamber produces microm-eter-sized uranium oxyfluoride particles from thecontrolled hydrolysis of UF6. These were used to studytheeffectofstoragetimeandultravioletlightexposureontherelativeamountoffluorineinparti-cles.Alinkbetweentherelativeamountoffluorineand the age of a particle was established, although largeparticle-to-particlevariationswithinthesamesample did occur. Planned transmission electronmicroscopy (TEM) andRamanmeasurementswillgive us more insights into the particle ageing proc-esses.Theresultsofafurtherstudywillbereportedelsewhere [7].
Theobservationthattherelativeamountoffluorinein single particles is an indicator of the time since deposition,andpossiblyoftheenvironmentalinflu-ences, could be important in interpreting the data obtainedfromanalysisofparticlescollectedduringsafeguards inspections.
6. Acknowledgements
TheauthorsacknowledgeA.J.Pidduck,M.R.Houl-ton and J. D. Mace of QinetiQ Malvern, UK for the SIMS measurements and the valuable discussions undertakenwithin the UK Support Programme tothe IAEA.
Special thanks toS.VandenBergheandA.Lee-naers of the Belgian Nuclear Research Centre (SCK•CEN) for theSEM-EDXmeasurements. Theauthors would also like to thankO.Marie and F.PointurieroftheCommissariatàl’EnergieAtomique
(CEA)Bruyères-le-Châtel,Francefortheirsupport.Many thanks toP.VanEspen,M.MoensandW.Dorriné for the SIMS and SEM measurements at AntwerpUniversity.
7. References[1] Donohue,D.L.;Strengthening IAEA safeguards through envi-
ronmental sampling and analysis;JournalofAlloysandCom-pounds;Elsevier;1998;p11-18.
[2] Hedberg,P.M.L.;Ingeneri,K.;Watanabe,M.;Kuno,Y.;Isotopic measurements of U particles by secondary ion mass spectrom-etry (SIMS);Proceedingsof the InstituteofNuclearMaterialsManagementAnnualMeeting,Phoenix,AZUSA;2005.
[3] Stebelkov,V.; Informativeness of morphology analysis of ura-nium microparticles from industrial dust at nuclear plants;Pro-ceedings of theGLOBAL 2005 conference, Tsukuba, Japan,2005.
[4] Pickrell,P.W.;Characterization of the solid, airborne materials created by the interaction of UF6 with atmospheric moisture in a contained volume;UnionCarbideCorporation,NuclearDivi-sion,OakRidgeGaseousDiffusionPlant,OakRidge,Tennes-see,1982,p1-88.
[5] Kips,R.;Leenaers,A.;Tamborini,G.;Betti,M.;VandenBerghe,S.;Wellum,R.;Taylor,P.D.P.;Characterization of uranium par-ticles produced by hydrolysis of UF6 using SEM and SIMS;Mi-croscopy andMicroanalysis; Cambridge University Press; inpublication;2007.
[6] Bostick,W.D.;McCulla,W.H.;Pickrell,P.W.;Sampling, charac-terization and remote sensing of aerosols formed in the atmos-pheric hydrolysis of uranium hexafluoride;JournalofEnviron-mentalScienceandHealthA20;TaylorandFrancis;1985;p369-393.
[7] Kips, R.; Pidduck, A.J.; Houlton, M.R.; Leenaers, A.; Mace,J.D.;Marie,O.; Pointurier, F.; Stefaniak, E.A.; Taylor, P.D.P.;VandenBerghe,S.;VanEspen,P.;VanGrieken,R.;Wellum,R.;The analysis of fluorine in uranium oxyfluoride particles as an indicator of particle age; Submitted to Spectrochimica ActaPartB:AtomicSpectroscopy
ESARDA BULLETIN, No. 38, June 2008
44
Abstract
The introduction of strengthened safeguards, the implementation of the additional protocol (INFCIRC 540) and the nuclear material intercepted from illicit trafficking led to a more investigative character of analytical measurements. The more specific ques-tions will be asked with respect to a given sample, the more investigative analytical methodologies will be required and the more thorough, interpretative and comparative evaluation of results needs to be done. Specific applications, often in combination with only minute amounts of sample call for meth-ods of high sensitivity, low detection limits, high se-lectivity and high accuracy. Consequently, the new sample types triggered the transfer of analytical techniques from the environmental area, materials science and geological or cosmological area to the safeguards community. The selection of the method or combination of methods is done according to the sample and information required. Data interpreta-tion is calling for reference information, comparison samples and thorough understanding of the proc-esses taking place throughout the nuclear fuel cy-cle. Environmental analysis and nuclear forensic sci-ence have experienced during last ten years significant developments in the mentioned area which safeguards can now profit from.
Measurements of nuclear material were the back-boneoftheverificationmeasuresintheearlydayswhen the safeguards agreements, INFCIRC 153 and the Euratom regulation 3227/76, were imple-mented. Consequently, measurement methodswere put in place, which provided information on the uranium, plutonium or thorium content, as well asUandPuisotopiccompositionsinagivenmate-rial. These measurements served the verification of declared amounts of nuclear material. Apart from verificationofthenuclearmaterialaccountancy,theinformation inherent to the nuclear material was neverexploited.
WhentheInternationalAtomicEnergyAgency(IAEA)started introducing strengthened safeguards and the additional protocol was implemented, the man-dateoftheIAEAexpandedfromtheverificationofcorrectness of a state’s declaration to comprisealso the completeness of such declarations. The detection of undeclared nuclear activities or materi-als requires establishing a comprehensive picture of a state’s nuclear activities and checking the con-sistencyofthedeclarationsagainstotherevidence.In consequence, a tremendous need for information at different levels arises in order to enable the evalu-ation required.
Alltypesofinformationsourcescanbedrawnupon:e.g. satellite imagery, design information verifica-tion,on-site inspectionsandsample taking (com-prising nuclear material samples and environmental samples). In the present paper, we discuss the chal-lenges the strengthened safeguards approach brings along, as well as we describe how method-ologiesthatwereinitiallydevelopedfornuclearfo-rensicusecouldbeexploitedinsafeguards.
2. Challenges
2.1. Information
Verification of the absence of undeclared nuclearmaterialoractivitiesisverycomplextask.Thean-swerneedstobecomposedofavarietyofindica-tors, which allow drawing conclusions on the com-pleteness of state’s declaration. The nuclearmaterial and environmental samples taken, provide a useful source of information on the processes ap-plied.Letusrecallinthiscontexttwomainprereq-uisites:
1. The production and processing of nuclear mate-rialleaves(inevitably)tracesintheenvironment.Highlysensitivemeasurementtechniquesasap-pliedintheIAEA’sEnvironmentalSamplingpro-gramme make use of this fact. Depending on the cleanlinessoftheprocessandonthequalityofthe installations, the amount of detectable traces canbe rather small.Many years of experiencegained in environmental sampling and, in partic-ularintheanalysisofsingleparticleshasdemon-
Nuclear Forensic Methods in SafeguardsK. Mayer*, M. WalleniusEuropean Commission, Joint Research CentreInstitute for Transuranium ElementsP.O.Box 2340, 76125 KarlsruheGermany
stratedthepowerofthismethodology.Themainlimitationsofparticleanalysisarecausedbythetiny amounts (few pico grams or even less) ofmaterialavailable inmicrometer-sizedparticles.Moreover, the measurement of minor isotopes in individual particles suffers from poor precision (due to counting statistics) and from molecular interferences.
2. Every production process leaves characteristicpatterns in the material. These measurable pa-rametersvaryasafunctionofstartingmaterial,process parameters, reagents used, storage conditionsorvesselmaterials.Thecomplexityofthe data and the interrelations between individu-alparametersrequireacarefulstep-by-stepap-proach from measurement to data interpreta-tion.
The information obtained through the analysis ofnuclearmaterialmay be divided into two catego-ries: endogenicdata,i.e.datathatisselfexplaining(e.g. the 235U/238U ratio pointing at the enrichment of the material and the intended use), and exogenic data,i.e.datathatcanonlybeunderstoodwiththehelp of reference data (e.g. comparison against data from known material or from model calculations). Thelattertypeofinformationiscertainlymorediffi-cult to understand and requires more resources be-fore a conclusion can be drawn. Chemical impuri-ties, isotopic composition of the nuclear material, isotopic composition of accompanying elementsand microstructure are data which are accessible through measurements and which allow to build in-formation. The information measurements and the respectivedatainterpretationprovideareexpectedto prove (or disprove) the absence of undeclared nuclear activities. The conclusion to be reached at theendofthisevaluationprocessisbasedon“fourC’s”:
• Consistency of information
• Coherence between samples or materials
• Conformity of findings with declared processes
• Comparison of data
In contrast to traditional safeguards, such an evalu-ation is not based on quantities of material, but rather on certain qualities of material such as impu-rities, age, stable isotopes and microstructure.
2.2. Measurement
The challenge in performing measurements of in-vestigative character is twofold: first, a wide spec-trum of parameters needs to be measured; andsecondly,thoseparametersprovidingthemostsig-
nificant information need to be identified. The in-strumental techniques applied for this purpose are wellestablished,e.g.massspectrometry,electronmicroscopy, anionchromatography.However, theanalyticalmethodsneedtobeadaptedtothespe-cific requirements of investigative safeguards anal-ysis.Fordevelopingsuchmethods,onecanbenefitfromexperiencesmade inother fieldsof science,e.g.innuclearforensics,isotopegeologyormate-rial science.
2.3. Data evaluation
Inordertoproperlyevaluatethemeasurementdata,theavailabilityofreferenceinformationisrequired,inparticularforexogenicdata.Tosomeextentthesafeguardscommunitycandrawuponexperienceand use the data available in the geochemical com-munity.Variationsintheisotopiccompositionofthechemical elements have been studied in other con-textsandinsomecasescadastralregistersofiso-topic data are available (e.g. n(18O)/n(16O) ratio inrainwater or lead isotopes in natural lead). Informa-tionrelatedspecificallytonuclearmaterialis,how-ever,lesswidelyavailable,e.g.dataonmetallicim-purities in nuclear fuels are often subject tocommercial confidence. In order to make best use of the additional information obtained through the methods, a comprehensive set of reference data or of reference samples (i.e. samples obtained from known sources and produced though known proc-esses from known starting materials) needs to be established.Inaddition,amultidisciplinaryteamofanalysts isrequiredasthe informationarisesfromdiversescientificareascoveringchemistry,physicsand material science.
3. Characteristic parameters
3.1. Isotopic patterns of U and Pu
Forlongtimethesafeguardscommunityhasmadeuse of the isotopic composition of nuclear material. Increased attention to the minor abundant isotopes in uranium (234U and 236U)was paid only after theintroduction of strengthened safeguards, when the need arose to establish capabilities for distinguish-ingbetweensamplesof(apparently)thesameen-richment. The isotope abundances of 234U and 236U may help to verify coherence between differentsamplesandconsistencywithdeclaredoperations.The presence of small amounts of 236U will indicate acontaminationwith recycleduraniumandhencepoint at reprocessing activities. However, also in natural uranium variations in 236U as well as in 234U abundances have been recorded [1]. At 236U abun-dance levels close to natural abundance (i.e. n(236U)/
ESARDA BULLETIN, No. 38, June 2008
46
n(238U) < 10-9) more sophisticated instrumentation, likeAcceleratorMassSpectrometryisrequired.Thistechniqueisavailableonlyinfewspecializedlabo-ratories. In addition, different enrichment processes may result in slight differences in the 234U abun-dance.
The isotopic composition of uranium and plutonium alsoallowdrawingconclusionsonthereactortypein which the material has been irradiated. Table 1 shows the results of isotope abundance measure-ments (three sub-samples) on a sample seized inthecontextofacriminal investigation.Comparingthemeasuredvaluestoburn-upcalculations,ithasto be noted that uranium and plutonium are not originating from the same reactor type:plutoniumshows an isotopic composition close to an LWR re-actor, while the uranium isotopic composition points at natural uranium fuelled research reactor.
The isotope correlation technique was used in safe-guardsin1970’sfortworeasons:toverifythecon-sistencyofthe isotopicanalysesperformedatthereprocessing plants, and to deduce the amount of specificisotopesbymeasuringotherisotopesandusing established correlations. Lately it was alsoadapted to nuclear forensics. In particular the iso-topic composition of plutonium is a useful indicator ofthereactortypeinwhichthenuclearmaterialwasproduced.Theneutroncapturecross-sectionofthe
individualplutoniumisotopesvaryasafunctionofneutron energy. In consequence, the build up ofplutonium isotopes is different in reactors with dif-ferentneutronenergyspectrum.Inaddition,theini-tial enrichment of 235U is various in different reac-tors. These two parameters are reflected in theisotopic composition of plutonium. Knowing the plutonium isotopic composition, we can draw con-clusionsonthereactortype,wherethePuiscom-ing from (Fig.1).
3.2. Age determination
Age determination of nuclear materials makes use oftheradioactivedecayoftheseelements.Assum-ing a complete separation of the daughter products during the production process (e.g. during chemical purification of the material), we can determine the “age” (i.e. the time that has elapsedbetween thelastchemicaltreatmentofthematerialandtoday)ofthematerialbyquantifying theamountsofparentand daughter nuclides. Age determination of pluto-nium is classically being performed by gammaspectrometryusingthe241Pu/241Am parent/daughter ratio. However, in a few cases it has been noticed that the Am separation has not been complete, thus theagefromthisparent/daughtermaygiveawronganswer. The use of the uranium daughters of 238Pu,239Puand 240Puoffers a consistency check [3], asthese three parent/daughter relations should result
IsotopeIsotopic Composition [Mass%]
Q1.1 Q1.2 Q1.3
234U 0.0159 (8) 0.0158 (8) 0.0158 (8)
235U 0.3480 (70) 0.3501 (70) 0.3406(68)
236U 0.1383 (41) 0.1396(42) 0.1361(41)
238U 99.497 (99) 99.494 (99) 99.507 (99)
238Pu 1.316(26) 1.315(26) 1.321(26)
239Pu 59.66(60) 59.61(60) 59.87(60)
240Pu 28.19 (42) 28.25 (42) 28.06(42)
241Pu 5.30 (10) 5.29 (10) 5.32 (10)
242Pu 5.51 (11) 5.52 (11) 5.42 (11)
Table 1: Isotopic composition of uranium and plutonium in a seized sample containing radioactive liquor. Measurement uncertaintyUC(k=1)isgiveninbracketsandreferstothelasttwodigitsoftheisotopeabundance.
ESARDA BULLETIN, No. 38, June 2008
47
inthesameage–providedtheseparationofurani-um was complete during processing of the materi-al.
Residual amounts of uranium isotopes will lead to biasedresultsinthePuagedetermination.Thede-greeofthebiasisdependentonthePucomposi-tion(weaponsorreactorPu)aswellasonthepar-ent/daughter relation. Fig. 2 shows the relative biasesfortheworstandbestcasesofPumaterials.The bias is a function of the age of the material (the older the material, the more U is produced and the lessanyresidualuraniumwillaffecttheresult)andof the amount of residual uranium after the last chemical separation of the plutonium (the more re-sidual uranium is left in the plutonium sample, the higher the bias will be). As is seen from the model calculations,theparentdaughterratiocanbevery
sensitive to residual amounts of uranium and thus lead to significant biases in the age determination (Fig. 2b). The data in the model calculations were obtainedbycombiningburn-upcalculations,decaycalculationsandisotopemixturecalculations.
Another interesting aspect in the age determination, especiallyinthesafeguardscontext,isthequestionof the age of particles. Age determination of pluto-nium particles has been demonstrated earlier [5]. Age determination of uranium particles proves to be muchmorechallenging,duetothevery longhalf-lives of the uranium isotopes 234U and 235U. Even if the 234U is the lower abundant isotope in U materi-als,duetothe1000-foldshorterhalf-lifetheparentdaughter ratio 234U/230Th is more favourable ratio for the age determination of the uranium than is the 235U/231Paratio.
The particles of interest in swipe samples from en-richmentplantsaretypicallyonlyonemicrometerindiameter. Based on this assumption, we can calcu-late the detection limit for the age determination as a function of the age of the particles and the 235U enrichment.Assumingfurtheradetectionefficiencyof0.5%(i.e.fordetectionof10ionsweneed2000atoms)inthesecondaryionmassspectrometer,weseefromFig.3thatagedeterminationcanonlybesuccessfully performed for particles of highly en-riched uranium.
3.3. Metallic impurities
Metallic impurities are present in nuclear material samplesatvaryingconcentrationlevels.Instartingmaterials (e.g.oreconcentrate)the impuritiesmayhavethecharacterofaccompanyingelementsandarepresent inrelativelyhighconcentrations. In in-termediateproducts(e.g.yellowcake)theconcen-tration of most of the chemical impurities has been drastically reduced. After this, towards the final
F 19
R 2
R R
S R M 9 4 7
S R M 9 4 6 R 1
0,0001
0,001
0,01
0,1
1
0,00001 0,0001 0,001 0,01 0,1Pu-238/tot Pu
Pu-2
42/P
u-24
0
HWR Magno x 1.8 % RBMK P WR 3.5 %36 % MTR FBR 90 % MTR Samples
Figure 1 Pu isotope correlation for different types of reactors [2]. SRM 946 and SRM 947 (both are NBS
certified Pu reference materials) originate apparently from pressurized water reactors, as well as sample RR used in a round robin exercise. F19 and R2 denote seized materials, which can be attributed to an RBMK reactor.
3.2. Age determination Age determination of nuclear materials makes use of the radioactive decay of these elements. Assuming a complete separation of the daughter products during the production process (e.g. during chemical purification of the material), we can determine the “age” (i.e. the time that has elapsed between the last chemical treatment of the material and today) of the material by quantifying the amounts of parent and daughter nuclides. Age determination of plutonium is classically being performed by gamma spectrometry using the 241Pu/241Am parent/daughter ratio. However, in a few cases it has been noticed that the Am separation has not been complete, thus the age from this parent/daughter may give a wrong answer. The use of the uranium daughters of 238Pu, 239Pu and 240Pu offers a consistency check [3], as these three parent/daughter relations should result in the same age – provided the separation of uranium was complete during processing of the material. Residual amounts of uranium isotopes will lead to biased results in the Pu age determination. The degree of the bias is dependent on the Pu composition (weapons or reactor Pu) as well as on the parent/daughter relation. Fig. 2 shows the relative biases for the worst and best cases of Pu materials. The bias is a function of the age of the material (the older the material, the more U is produced and the less any residual uranium will affect the result) and of the amount of residual uranium after the last chemical separation of the plutonium (the more residual uranium is left in the plutonium sample, the higher the bias will be). As is seen from the model calculations, the parent daughter ratio can be very sensitive to residual amounts of uranium and thus lead to significant biases in the
Figure 1: Puisotopecorrelationfordifferenttypesofre-actors[2].SRM946andSRM947(bothareNBScertifiedPu referencematerials)originateapparently frompres-surized water reactors, as well as sample RR used in a roundrobinexercise.F19andR2denoteseizedmateri-als, which can be attributed to an RBMK reactor.
age determination (Fig. 2b). The data in the model calculations were obtained by combining burn-up calculations, decay calculations and isotope mixture calculations.
01234567
Rel
. Bia
s in
cal
cula
ted
age[
%]
20y 10y 7y 5y 3y100
1000
10000
Decay time [y]
ppm
01234567
Rel
. Bia
s in
cal
cula
ted
age[
%]
20y 10y 7y 5y 3y100
1000
10000
Decay time [y]
ppm
Figure 2 Relative bias in the age of reactor grade Pu (a) and weapons grade Pu (b) using the 238Pu/234U
parent daughter ratio as a function of the age and of the amount of residual uranium [4]. Another interesting aspect in the age determination, especially in the safeguards context, is the question of the age of particles. Age determination of plutonium particles has been demonstrated earlier [5]. Age determination of uranium particles proves to be much more challenging, due to the very long half-lives of the uranium isotopes 234U and 235U. Even if the 234U is the lower abundant isotope in U materials, due to the 1000-fold shorter half-life the parent daughter ratio 234U/230Th is more favourable ratio for the age determination of the uranium than is the 235U/231Pa ratio. The particles of interest in swipe samples from enrichment plants are typically only one micrometer in diameter. Based on this assumption, we can calculate the detection limit for the age determination as a function of the age of the particles and the 235U enrichment. Assuming further a detection efficiency of 0.5% (i.e. for detection of 10 ions we need 2000 atoms) in the secondary ion mass spectrometer, we see from Fig. 3 that age determination can only be successfully performed for particles of highly enriched uranium.
0
200
400
600
800
Rel
. Bia
s in
ca
lcul
ated
age
[%]
10y 7y 5y 3y 1y100
1000
10000
Decay time [y]
ppm
0
200
400
600
800
Rel
. Bia
s in
ca
lcul
ated
age
[%]
10y 7y 5y 3y 1y100
1000
10000
Decay time [y]
ppm
a) b)
Figure 2: RelativebiasintheageofreactorgradePu(a)andweaponsgradePu(b)usingthe238Pu/234U parent daugh-ter ratio as a function of the age and of the amount of residual uranium [4].
ESARDA BULLETIN, No. 38, June 2008
48
product, further decrease of impurities is minute if any. Figure 4 showsmetallic impurities in naturaluranium compounds of different origins. Five sam-plesfromthesameorigincanbeclearlyrecognizedthrough their identical pattern of metallic impuri-ties.
13
57
9
11
13
15
Cr
LaMo
Nb
Tl YZr
0,00
2,00
4,00
6,00
8,00
10,00
Con
cent
ratio
n (p
pm)
Sample No.
Element
Figure 4 Selected metallic impurities in intermediate natural uranium products. Samples 1 to 5 are apparently of the same origin.
Although metallic impurities can be used for identifying coherences between samples or batches of material, the systematics behind the impurity patterns are not well understood. This is because the metallic impurities may be carried into the material at different stages of the process. The concentration of some impurities may for instance vary as a function of exposure time to the container material or the storage tank, as they are leached from the surface of the walls. In sample analysis the concentration of such elements appears to be fluctuating randomly. One should, in general, avoid the use of common elements as indicators. Another solution to this dilemma could be, instead of looking at the absolute concentrations of impurities to look at ratios of chemical elements. While the absolute concentration of the impurities may change, the ratio of certain elements will vary only within narrow limits. This applies in particular for elements of similar chemical behaviour, e.g. the rare earth elements [6].
3.4. Stable isotopes In the field of food science and geochemistry, analysis of stable isotopes (e.g. 1H, 2H, 12C, 13C, 16O, 18O) have been successfully applied for a few decades. The principle of the use of stable isotopes is very straightforward: The stable isotope compositions of elements, which are part of a substance, are a function of the origin and history of that substance. That is, two substances which are chemically the same may have different stable isotope compositions if either their origin and/or history differ. This methodology was also introduced recently to nuclear forensics. The application of oxygen isotope ratio measurements for geolocation purposes has been demonstrated several years ago [7]. A correlation between the geographic location of the production site of uranium oxide samples and the variation in the n(18O)/n(16O) could be
Figure 4: Selected metallic impurities in intermediate naturaluraniumproducts.Samples1to5areapparentlyof the same origin.
Althoughmetallicimpuritiescanbeusedforidentify-ing coherences between samples or batches of ma-terial,thesystematicsbehindtheimpuritypatternsare not well understood. This is because the metallic impuritiesmaybecarriedintothematerialatdiffer-ent stages of the process. The concentration of
someimpuritiesmayforinstancevaryasafunctionof exposure time to the container material or thestoragetank,astheyareleachedfromthesurfaceofthewalls. In sample analysis the concentration ofsuchelementsappearstobefluctuatingrandomly.Oneshould, ingeneral,avoid theuseofcommonelements as indicators. Another solution to this di-lemma could be, instead of looking at the absolute concentrations of impurities to look at ratios of chemical elements. While the absolute concentra-tionoftheimpuritiesmaychange,theratioofcer-tainelementswillvaryonlywithinnarrowlimits.Thisapplies in particular for elements of similar chemical behaviour,e.g.therareearthelements[6].
3.4. Stable isotopes
Inthefieldoffoodscienceandgeochemistry,anal-ysisofstableisotopes(e.g.1H, 2H, 12C, 13C, 16O,18O)havebeensuccessfullyappliedforafewdecades.Theprincipleof theuseofstable isotopes isverystraightforward: The stable isotope compositions of elements, which are part of a substance, are a func-tionoftheoriginandhistoryofthatsubstance.Thatis,twosubstanceswhicharechemicallythesamemay have different stable isotope compositions ifeithertheiroriginand/orhistorydiffer.Thismethod-ologywasalsointroducedrecentlytonuclearforen-sics.
The application of oxygen isotope ratiomeasure-ments for geolocation purposes has been demon-stratedseveralyearsago[7].Acorrelationbetweenthe geographic location of the production site of uranium oxide samples and the variation in then(18O)/n(16O) could be established. Moreover, itcould be shown that the method is also applicable toindividualparticles,i.e.theoxygenisotoperatiosestablishedby“bulk”measurementsusingthermalionisationmass spectrometry (TIMS) could be re-produced on individual particles using secondaryionmassspectrometry(SIMS)[8].Thistypeofinfor-mationdoesobviouslynotidentifyaspecificplant,yetitprovidesaparameterforattributingthemate-rial to a region. This can be utilised for instance to distinguish between imported and domestic materi-als.
Another parameter that has been widely used ingeochemistryandinenvironmentalsciencesistheisotopiccompositionoflead.Leadisotopesmaybeprimordial (natural lead)or theymaybeproducedthrough thedecayofuranium isotopes.Thesmallvariations in the isotopic composition of natural lead have been used to locate the origin of some fuel ad-ditives (mainly consisting of tetra-ethyl lead). Theadaptation of this methodology for nuclear safe-
1 um particle of U
1
10
100
1000
10000
100000
0 10 20 30 40 50 60Age [years]
Num
ber o
f Th-
230
atom
s
93%50%5%0.7%
Figure 3 The decay of 234U produces 230Th. The number of 230Th atoms contained in a uranium oxide
particle (with an assumed number of 1010 atoms of uranium) depends on the age of the particle and the initial enrichment.
3.3. Metallic impurities Metallic impurities are present in nuclear material samples at varying concentration levels. In starting materials (e.g. ore concentrate) the impurities may have the character of accompanying elements and are present in relatively high concentrations. In intermediate products (e.g. yellow cake) the concentration of most of the chemical impurities has been drastically reduced. After this, towards the final product, further decrease of impurities is minute if any. Figure 4 shows metallic impurities in natural uranium compounds of different origins. Five samples from the same origin can be clearly recognized through their identical pattern of metallic impurities.
Figure 3: Thedecayof234U produces 230Th. The number of 230Thatomscontainedinauraniumoxideparticle(withan assumed number of 1010 atoms of uranium) depends on the age of the particle and the initial enrichment.
ESARDA BULLETIN, No. 38, June 2008
49
guards and nuclear forensics purposes has been studied [9]. It could be shown that the lead isotopic composition of yellow cake provides useful infor-mation to distinguish between natural uranium ma-terials of different origins. As lead is omnipresent in our environment, special care has to be taken when performing the chemical separation of the lead from theuraniumsamplesinordernottointroduceanynatural lead from dust particles or chemical rea-gents and thus bias the results.
established. Moreover, it could be shown that the method is also applicable to individual particles, i.e. the oxygen isotope ratios established by “bulk” measurements using thermal ionisation mass spectrometry (TIMS) could be reproduced on individual particles using secondary ion mass spectrometry (SIMS) [8]. This type of information does obviously not identify a specific plant, yet it provides a parameter for attributing the material to a region. This can be utilised for instance to distinguish between imported and domestic materials. Another parameter that has been widely used in geochemistry and in environmental sciences is the isotopic composition of lead. Lead isotopes may be primordial (natural lead) or they may be produced through the decay of uranium isotopes. The small variations in the isotopic composition of natural lead have been used to locate the origin of some fuel additives (mainly consisting of tetra-ethyl lead). The adaptation of this methodology for nuclear safeguards and nuclear forensics purposes has been studied [9]. It could be shown that the lead isotopic composition of yellow cake provides useful information to distinguish between natural uranium materials of different origins. As lead is omnipresent in our environment, special care has to be taken when performing the chemical separation of the lead from the uranium samples in order not to introduce any natural lead from dust particles or chemical reagents and thus bias the results.
0
0.02
0.04
0.06
0.08
0.1
0.12
Ran
ger
Roe
ssin
g
Rab
bit L
ake
Bev
erly
-1
Bev
erly
-2
Bev
erly
-3
Bev
erly
-4
Clu
ff La
ke
Gab
on
0
0.02
0.04
0.06
0.08
0.1
0.12
0.14
0.16207Pb/206Pb208Pb/206Pb
Figure 5 Lead isotope ratios observed in yellow cake samples from different mines [9]. Combined
uncertainties, Uc (with k=2) on the ratios n(207Pb)/n(206Pb) and n(208Pb)/n(206Pb) are between 0.000 2 and 0.000 08, thus too small to be visualized on the above graph.
Lead is often used as shielding material for nuclear samples. This may introduce bias in the results as natural lead from the shielding cross-contaminates the lead contained in the sample. There are two possibilities for dealing with this problem: first, one can correct for all contributions from natural lead using the 204Pb as pilot isotope. 204Pb is not contained in radiogenic lead, and may therefore serve as indicator for the amount of natural lead present in a sample. The second option requires the availability of a reference sample from a suspected origin. In this case isotope mixture calculations can be performed,
Figure 5: Lead isotope ratios observed in yellow cakesamples from different mines [9]. Combined uncertain-ties, Uc (with k=2) on the ratios n(207Pb)/n(206Pb) andn(208Pb)/n(206Pb)arebetween0.0002and0.00008,thustoo small to be visualized on the above graph.
Lead is often used as shielding material for nuclear samples.Thismayintroducebiasintheresultsasnaturalleadfromtheshieldingcross-contaminatesthe lead contained in the sample. There are two possibilities for dealing with this problem: first, one :can correct for all contributions from natural lead
using the 204Pb as pilot isotope. 204Pb is not con-tainedinradiogeniclead,andmaythereforeserveas indicator for the amount of natural lead present in a sample. The second option requires the availa-bilityofareferencesamplefromasuspectedorigin.Inthiscaseisotopemixturecalculationscanbeper-formed,assumingabinarymixturebetweennaturallead and the lead contained in the reference sam-ple.AnexampleisgiveninTable2,whereaseizeduranium ore sample had been wrapped in a lead foil. The isotope mixture calculation showed thatthemeasuredisotopiccompositioncanbefullyex-plainedby a binary blend of natural lead and thelead (as measured before) in uranium ore from Joachimsthal (Czech Republic).
Sample 204Pb 206Pb 207Pb 208Pb
Find-25 1.20 33.27 19.32 46.20
Nat.Pb 1.4 24.1 22.1 52.4
Joachimsthal 0.96 45.12 16.56 37.36
Mixture56/44 1.21 33.36 19.67 45.78
Table 2: Lead isotope abundances (mole-%) ofaseizeduraniumoresample(Find-25)andofnaturallead. The lower line shows the results of a blending cal-culation, assuming amixture of 56% natural lead and44%leadfromuraniumorefromJoachimsthalmine.
3.5. Anionic impurities
Aqueous processing of nuclear material is encoun-teredatanumberofstagesinthenuclearfuelcycle.In these processes mineral acids are frequentlyused. They leave anionic impurities (e.g. Cl-, F-, SO4
2-, NO3-) in the material behind, together with
thoseanionsthatwereinitiallypresentinthestart-ing material. We have studied such anionic impuri-ties in yellowcakesamples fromdifferentorigins.Dependingonthetypeoforefromwhichtheurani-umwasextractedandthetypeofprocessappliedas well as the associated chemical reagents used,
assuming a binary mixture between natural lead and the lead contained in the reference sample. An example is given in Table 2, where a seized uranium ore sample had been wrapped in a lead foil. The isotope mixture calculation showed that the measured isotopic composition can be fully explained by a binary blend of natural lead and the lead (as measured before) in uranium ore from Joachimsthal (Czech Republic). Sample 204Pb 206Pb 207Pb 208Pb Find-25 1.20 33.27 19.32 46.20 Nat. Pb 1.4 24.1 22.1 52.4 Joachimsthal 0.96 45.12 16.56 37.36 Mixture 56/44 1.21 33.36 19.67 45.78 Table 2 Lead isotope abundances (mole-%) of a seized uranium ore sample (Find-25) and of natural lead.
The lower line shows the results of a blending calculation, assuming a mixture of 56% natural lead and 44% lead from uranium ore from Joachimsthal mine.
3.2. Anionic impurities Aqueous processing of nuclear material is encountered at a number of stages in the nuclear fuel cycle. In these processes mineral acids are frequently used. They leave anionic impurities (e.g. Cl-, F-, SO4
2-, NO3-) in the material behind, together with those
anions that were initially present in the starting material. We have studied such anionic impurities in yellow cake samples from different origins. Depending on the type of ore from which the uranium was extracted and the type of process applied as well as the associated chemical reagents used, the isotopic patterns generated in the yellow cake are significantly different. These patterns provide additional information for distinguishing materials from different origins or – if appropriate reference data is available – for relating a given material to a specific facility. For data evaluation, the pattern of anionic species is more informative than the actual concentration values. Figure 6 shows examples of chromatograms obtained from yellow cake samples from Germany and Gabon [10].
Figure 6 Anionic impurities in yellow cake samples from a German mine (a) and from a Gabonese mine
the isotopicpatternsgenerated intheyellowcakeare significantly different. These patterns provideadditional information for distinguishing materials fromdifferentoriginsor – if appropriate referencedataisavailable–forrelatingagivenmaterialtoaspecificfacility.Fordataevaluation,thepatternofanionic species is more informative than the actual concentrationvalues.Figure6showsexamplesofchromatogramsobtainedfromyellowcakesamplesfromGermanyandGabon[10].
3.5. Microstructure
Verylittleusehasbeenmadeofmicrostructuralin-formation of nuclear materials in safeguards. This canbeunderstoodbythenatureoftheinformation,i.e. such information is essentially of qualitativecharacter. Still the particle and grain size distribu-tions and the surface structure of the particles are material characteristics that reflect theproductionprocess of the material. These data allow the direct comparison of samples enabling conclusions on
coherence between samples. Fig. 7 shows a com-parison of four UF4 samples. The particles are shapedandsizedverydifferently,thustheycanbeclearly distinguished from each others, indicatingdifferent origins of the four samples in question.
4. Conclusions
The challenges associated with strengthened safe-guardscall formore investigativeanalyticalmeth-ods.Theverificationoftreatycomplianceaccordingto comprehensive safeguards agreements and the additional protocol are associated with a tremen-dousneed for information.Partof the informationrequired for the evaluation of the completeness of a state’sdeclarationisinherenttothenuclearmate-rial. Advanced and investigative measurement methods, such as applied in nuclear forensics, need to be introduced in nuclear safeguards. Conse-quently,wewillseeaconvergenceofnuclearforen-sicandofclassicalsafeguardsanalysis.
3.5. Microstructure Very little use has been made of microstructural information of nuclear materials in safeguards. This can be understood by the nature of the information, i.e. such information is essentially of qualitative character. Still the particle and grain size distributions and the surface structure of the particles are material characteristics that reflect the production process of the material. These data allow the direct comparison of samples enabling conclusions on coherence between samples. Fig. 7 shows a comparison of four UF4 samples. The particles are shaped and sized very differently, thus they can be clearly distinguished from each others, indicating different origins of the four samples in question.
Figure 7 Comparison of microstructure in four UF4 samples.
4. Conclusions The challenges associated with strengthened safeguards call for more investigative analytical methods. The verification of treaty compliance according to comprehensive safeguards agreements and the additional protocol are associated with a tremendous need for information. Part of the information required for the evaluation of the completeness of a state’s declaration is inherent to the nuclear material. Advanced and investigative
Figure 7: Comparison of microstructure in four UF4 samples.
ESARDA BULLETIN, No. 38, June 2008
51
Acknowledgement
ThesupportoftheAustralianSafeguardsandNon-Proliferation Office (ASNO) and the InternationalAtomicEnergyAgency(IAEA)forprovidingsamplesofnaturaluraniumishighlyappreciated.
[9] J. Svedkauskaite-LeGore, K. Mayer, S. Millet, A. Nicholl, G.Rasmussen,D.Baltrunas,Radiochim.Acta95(2007)601-605
[10] V. Badaut, M. Wallenius, K. Mayer, Addressing VerificationChallenges–InternationalSafeguardsSymposium,16-20Oc-tober2006,Vienna,Austria
ESARDA BULLETIN, No. 38, June 2008
52
ESARDA Working Groups activities in 2007
Summary report
Abstract
Working groups are the ‘backbone’ of ESARDA. As last year, the Editorial Committee was pleased to re-ceive and compile in a single report a summary of the ESARDA working group activities and achieve-ments for the year 2007 presented hereafter.
Please note the activities of the NMACAF group are not included here as these were already published in Issue No 37 of the Bulletin; while the 2007 report by the Editorial Committee working group is the Ed-itorial opening the present Issue.
1. Activities of the ESARDA Destructive Analysis Working Group
2. Activities of the Non Destructive Analysis Work-ing Group
3. The ESARDA Working Group on Containment and Surveillance
4. Activities of the ESARDA Working Group on Inte-grated Safeguards
5. The ESARDA Working Group on Verification Technologies and Methodologies
6. ESARDA Working Group Training and Knowl-edge Management
1. Activities of the ESARDA Destructive Analysis Working Group Chairman’sReportbyKlausMayer
The ESARDA Working Group on Standards and TechniquesforDestructiveAnalysis(DA)addressesthe challenges related to the measurement of sam-ples of nuclear material. The methods applied in DA normally involveachange inthenatureofsampleinducedbythemeasurementprocess(i.e.achangeofchemicalorphysicalappearance).Thespectrumofactivitiesoftheworkinggroupreflectsawideva-rietyofmeasurementtechniques,ofsampletypesand also of applications. At present the group con-sists of 48 members and special members from some20organizations.Recently,theworkinggroupexperiencedashift inemphasisof itsactivities. Inaddition to the traditional methods for nuclear ma-
terial measurements, aiming at determining the amounts of nuclearmaterial for accountancy andverification purposes, the group addresses increas-inglymeasurement challenges related to environ-mental sampling and to verification of completeness of declaration, also keeping abreast of the develop-ments in the nuclear forensic area.
Thereviewofinter-laboratoryprogrammes(EQRAIN,SME,REIMEPandNUSIMEP)isaregularactivityofthe working group. During its 2007 meeting, the group noted with satisfaction that most laboratories achievegoodperformanceintheelementassayofnuclearmaterialwhenparticipatingininter-labora-torycomparisons.These inter-laboratorycompari-sons cover traditional materials and techniques, like titration or thermal ionisation mass spectrometryappliedtouranylnitratesolution,butextendalsotoisotope ratio measurements in uranium particles (produced by controlled hydrolysis of UF6) using secondaryionmassspectrometry.Thelatterisor-ganized by IRMM (NUSIMEP-6) and samples arebeing distributed in the first semester 2008. CETA-MAoffersinter-laboratorycomparisonsonuraniumandplutonium(EQRAINUandEQRAINPu)butalsoonmultielementaltraceanalysis(EQRAINTraces).The group also initiated an evaluation of the need for revision of the International Target Values forMeasurementUncertainties (ITV). To this end, theperformancedataobserved in the inter-laboratoryexercisesshallbeexaminedandaworkingpaperwill be discussed at the 2008meeting in Luxem-burg.
With regard to training and education in the specific area of destructive analysis, the group finalized a“TechnicalSheet”onmassspectrometry,describ-ingavarietyofmassspectrometrictechniquesandapplications. Three more technical sheets on Titra-tion,onreferencematerialsandonQualityControlare under preparation. Furthermore, training mate-rialondestructiveanalysisandonnuclearforensicswas drafted in order to support the nuclear safe-guardsandnon-proliferationtrainingcoursewhich
Working Groups activities
ESARDA BULLETIN, No. 38, June 2008
53
the ESARDA WG on Training and Knowledge Man-agement offers at the JRC Ispra site. The group contributedalsotothisyear’strainingcoursewithtwo lectures on nuclear forensics and on destruc-tiveanalysis.
Measurement problems arising from new challeng-es in safeguards and in related areas are addressed. Therefore, the WGDA promotes the use of new pa-rameters for obtaining supplementary informationon nuclear material for forensic and for safeguards purposes. In April 2008 IRMM (Institute for Refer-ence Materials and Measurements in Geel, Belgium) hostedaworkshopon“Minorisotopesinuranium”addressing the challenges and benefits associated with the measurement of minor abundant isotopes in uranium (i.e. 234U and 236U). Increasing use is also made of chemical impurities in nuclear materials. This topic will be addressed in a dedicated work-shop.
2. Activities of the NDA Working Group Chairman’sReportbyPaoloPeerani
An overview of the recent past and present activi-ties of the ESARDA NDA Working Group has been presentedatthe2006IAEAsafeguardConferenceinViennaandthepaperispostedontheESARDAwebsite and available at the following link:
Wewillgivehereasummaryofthemainactivitiescarried out in 2007 and some perspectives on the planned activities for 2008.
During 2007 the WG launched the 3rd and 4th phase of the Multiplicity Benchmark. The first two phases werecompleted in2006and thefinal reportpub-lished in the special issue of the ESARDA Bulletin, number34 (September2006).With respect to theprevious phases, the new benchmark focuses on experimental data instead of synthetic pulse traingeneratedbyMonteCarlosimulations.Themeas-urement campaign has been done on the last week ofJanuaryinthePERLAlabinajointteamincludingJRC,IRSNandLANL,acquiringinparticularthe6reference measurements that have been used for theexercise,usinganAWCCandrepeatingtheac-quisitionswithaconventionalmultiplicityshiftreg-isteranda listmodesystem.The3rd phase is full simulationoftheexercise,whichconsistsinrepro-ducingbyMonteCarlocalculationanddatatreat-menttheexperimentalresults,andthe4th phase is onlydatatreatmentofthelistmodedataacquiredbyIRSN.Themeasurementcampaignalsoallowedaninter-comparisonbetweendifferentdigitalacqui-
sition systems developed or used by JRC, IRSN,LANLandlaterinafollowingtestbyIKI.Theresultswerepublishedinajointpaperpresentedatthe29th ESARDASymposium(Aix-en-Provence,May22nd-24th 2007). The pulse trains and the technical speci-fications of the benchmark were distributed to the participantsinFebruaryanddeliveryofresultswasexpectedinautumn.Indeednotalltheparticipantsprovidedtheiranswersbeforetheendoftheyear,sothecollectionofresultsextendedtothebegin-ningof2008.Thepreliminaryreportofthebench-mark will be presented at the 30th ESARDA Annual meeting(Luxembourg,May27th-29th 2008).
Anotherprojectthatadvancedsignificantlyin2007was the development of a document on “Good Practice Guide for the use of modelling codes in Non Destructive Assay”.Thecollectionofcontrib-utes fromdifferentauthorshasbeenmostlycom-pletedandalreadyassembledinastructureddocu-ment. Most of the chapters have been alreadyreviewed and accepted. Few minor sections are missing and planned to be drafted at the beginning of 2008. The goal is to have the first official com-pleteversionreadyattheannualmeetinginordertohaveitexternallyreviewedandfinallyendorsedbyIAEA, who was the promoter and main requester of this document.
The NDA section of the Syllabus of the ESARDA course on safeguards and non-proliferation has been completed, reviewed and endorsed by theNDA-WGandfinallytransmittedtotheTKM-WG.
A new initiative with potential to open a lot of future activities in the field of gamma spectrometrywasborn during a topical meeting organised by theNDA-WGtogetherwiththeUSsupportprogrammeto the Agency in Aix. During thismeeting the or-ganisation of an international “Working Group on Gamma Spectrometry Techniques for U/Pu Isotop-ic” was proposed following a request of support fromtheAgencyconcerningthesustainabilityandstandardisation of gamma evaluation codes. Where-as the new working group will organise himself in-dependently, it will be intimately interconnectedwiththeESARDANDA-WG,fromwhichitwillprofitof the networking capabilities and of the e-infra-structure (i.e. the website). The Terms of Reference of the new working group have been agreed and are published on this number of the ESARDA Bulletin. ThefirstactivityofthenewworkinggroupwillbeanINMM/ESARDAworkshoptobeheldinOakRidgein November 2008, see link: http://www.inmm.org/events/gamma/index.cfm.
ESARDA BULLETIN, No. 38, June 2008
54
3. The ESARDA Working Group on Contain-ment and Surveillance Chairman’sReportbyBerndRichter
In 2007, the working group had 19 members from R&Destablishments, safeguardsequipmentmanu-facturers, safeguards inspectorates, plant operators, regulatoryagencies,andministries.Theyrepresent-ed the ESARDA organisations: European Commis-sion,FinnishandSwedishnuclearregulatoryauthor-ities,FrenchInstituteforRadiationProtection,SafetyandSecurity,andAREVA,GermanNuclearFuelCy-cle Association and Jülich Research Centre, United Kingdom Safeguards Organisation and SellafieldSafeguards Department. Members from outside ES-ARDA represented the InternationalAtomicEnergyAgency, Argentine-Brazilian safeguards authorityABACC, Canadian Nuclear Safety CommissionCNSC, and US Sandia National Laboratories.
The working group addressed the following issues: performance&assuranceof containment andsur-veillance(C/S)instrumentation,wirelessin-plantdatatransmission, IAEA’s Next Generation SurveillanceSystem,safeguardsforgeologicalrepositories,laserscanning for design information verification at under-ground repositories, JRC Ispra safeguards review station concept, containment verification methods, guidelines for developing sealing and containment verificationsystems, remotemonitoringcentreandactivities in progress at the IAEA.
Recurrentactivitiesare: informationexchangeanddiscussionsonR&Dwithintheworkinggroup,sup-port of the ESARDA working group on Training and Knowledge Management, and support of the ES-ARDA Editorial Committee.
Achievements of the working group are publications in the ESARDA Bulletin and in conference proceed-ings(2006IAEASymposium,2007ESARDASym-posium), and contributions to the ESARDA web site, such as the compendium on C/S instrumentation and,most recently, technical sheets on: radiationmonitoring techniques for monitoring the movement of discharged fuel, JRC ultrasonic seals.
Theworkinggroup’songoingmajorprojectistode-velop amethodology for determining the perform-ance and assurance of the C/S instrumentation. It wasagreedtodoafirsttrialapplicationonadrystor-agefacilityforspentfuelpayingattentiontoissueslike instrument reliability and suitability. It is antici-pated that the method will also help to draw up guidelines for developing sealing and containment verificationsystems.ByMarch2008,theWGwillre-ceiveexampledesigninformationofthedrystoragefacility,arequirementsprofile,specificationsofseal
candidatesandDCM14surveillancesystem,andachecklist for determining the C/S performance. Be-foreMay28,2008,WGmemberareinvitedtoper-form the trial application to determine the perform-ance of C/S instrumentation, so that the results can bediscussedatthenextWGmeeting.
Anotherissueiswirelessin-plantdatatransmission.The first part of a paper was published in ESARDA Bulletin 36, providing specific arguments for con-sidering the use of wireless communications as a complement to fixed cable installations. From asafeguards authority’s point of view, wireless in-plant data transmission is attractive for the ease of installationandtheabilitytorespondtothechang-ing requirements as the inspection approach evolves. However, for wireless technologies to be considered as a viable complement to cables, a number of concerns have to be accounted for. There are specific requirements arising from the plant op-erators’boundaryconditionswhichhavetobead-dressedbeforewirelesstechniquesaredeployablein nuclear facilities. The paper presents an overview ofstate-of-the-artwirelesstechnologiesandmakesa projection on capabilities that are likely to bereached in the near future. The second part is being prepared for publication in ESARDA Bulletin 38. This paper will be dedicated to RF technologies in a safeguardsconcept,toinformationsecurityconsid-erations, and to the integration of wireless technolo-giesintoexistingandnewfacilities.
Spent fuel management: Sweden and Finland co-operateinidentifyingtheC/Sfunctionsrequiredtomaintainthecontinuity-of-knowledgeafterfinalver-ification of the nuclear material in an encapsulation plant. The working group endorsed the following: Anyundeclaredretrievalofspentfuelfromthere-positoryhastobedetected.C/Smayincludesur-veillance, sealing, dual C/S, finger printing, tracking after encapsulation, portal monitoring. Encapsula-tion may take place under surveillance. Surfacescanningofthecaskmaybeforeseen.Performancetestingmay be needed for the portal monitoring.Remotemonitoringmaybeforeseentoreducein-spectioneffort.Reliability testingmaybe required(forrepositoryconditions).
Design information verification (DIV) in an under-groundnuclear repository: theFinnish safeguardsauthority inmakingcertainassumptions regardingfacilitymisuseanddefinitionofrepository,hasde-velopedaconceptforexploration,constructionandimplementationofarepositoryforfinaldisposalofnuclearwasteatOlkiluoto (ONKALOundergroundlaboratory). Laser scanning forDIV during reposi-toryconstructioncouldplayamajorroleinasafe-
ESARDA BULLETIN, No. 38, June 2008
55
guards approach. JRC Ispra has developed a laser scanningtechniqueforDIVandpresentedpromis-ing results of a first scanning campaign at the ONKALO site. If agreeable in a safeguards ap-proach, the plant operator will provide design infor-mation in the form of paper documentation to the IAEA,andtheIAEAwillverifythedeclarationbyla-ser scanning.
Safeguards review station concept: JRC Ispra pre-sented a concept for enhancing theGARS-basedreviewofsurveillanceimages(GARS=GeneralAd-vanced Review Software). To this end, change de-tection, Markov Models, image retrieval, and deci-sion treeanalysiswere introducedandcombined.Keywordsinthesubsequentdiscussionwerecon-firmation of declaration, detection of undeclared operations, shape and size of relevant objects,searchbycontent,timeconsistencychecking,pos-sibility to switch to shorter picture taking interval,cross-triggering of image and radiation data. TheWGfoundthedevelopmentverypromising.
Identification and containment verification: JRC Is-pra demonstrated laser techniques for identification and containment verification of Pu cans andUF6cylinders.
Input was provided to the ESARDA working group on Training and Knowledge Management for the Is-pra Course on Safeguards (a chapter on C/S within thetextbookonsafeguardsforstudents).
The working group will issue further technical sheets on:mailboxsystems,design informationverifica-tion,opticalsurveillancetechniques,andcap-and-wire seals.
The working will further discuss the following top-ics:guidelinesonsealingandidentificationsystems,containment verification methods and techniques, geologicalrepositories,remotesystemcontrol,datareview, trial application on performance of C/S de-vices,interfacebetweensafeguardsandsecurity.
4. Activities of the ESARDA Working Group on Integrated Safeguards Chairman’sReportbyArnoldRezniczek
The ESARDA Working Group on Integrated Safe-guardswascreatedin2000withtheobjectivetopro-videtheSafeguardsCommunitywithexpertadviceonmethodologies and approaches to integrate IN-FCIRC/193 and INFCIRC/540 measures and to presentaforumfortheexchangeofinformation,viewsandexperiencesinthatregard.Itsmembersrepresentinspectorates, national authorities, operators and re-search centres active in the field of safeguards.
Inthefirstyears,theworkinggroupconcentratedonissuesoftheimplementationoftheAdditionalProto-col(AP),whichisaprerequisiteforIntegratedSafe-guards (IS). Later, the emphasis passed over to the discussion of different IS concepts and elements. In2007, the working group had 2 meetings, one in March2007 inAlmeloandone inOctober2007 inIspra. In these meetings we discussed issues like the mailbox concept for enrichment plants, the SNRIconceptforfuelfabricationplants,experienceswithenvironmental sampling, the implementation of IETS principles in power reactors (IETS means Imple-menting Euratom Treaty Safeguards), differencesbetween INFCIRC/193 and INFCIRC/153-typeagreementsandofferingvoluntaryaccesstoloca-tionstothe IAEAaccordingtoarticle8of theAP.Thecentraltasktoprovideaforumforexchangeofinformationalwaysremainsanessentialfunctionofthe working group filling a considerable part of our meeting’stime.
Although all of the 27 EU Member States have an APtotheirsafeguardsagreementinforce,thesta-tusofimplementationofISbytheIAEAisdifferentin the EU. The arrangements for and the implemen-tation of IS seem to be an elaborate process taking more time than thought in the beginning. As of De-cember2007,onlyMemberStates that joined theCommunityin2004orlaterhadISimplementedbe-causetheIAEAhadstartedthisprocessalreadybe-foretheiraccessiontotheCommunity’sSafeguardsAgreement (INFCIRC/193). In the beginning of 2008, someofthe‘old’EUMemberStateswithminornu-clearactivitiesgotIS;fortheStateswithmajornu-clearactivitiesthisprocessisstillunderway.
This diversity induces active discussions and ex-change of information. Both IAEA and the Commu-nity’ssafeguardsservicesareregularlyrepresentedin our meetings and provide the group with informa-tion on the actual status of discussions and devel-opments in their organisations. The group in turn communicates opinions, conceptions and peculiari-ties of operators and national authorities concerned and thus delivers a valuable feedback to the inspec-torates to assess approaches under consideration. Weare expecting further progressbeingmade inthecurrentyeartowardsatimelyimplementationofISinEUMemberStateswithmorecomplexnuclearactivities.
5. The ESARDA Working Group on Verifica-tion Technologies and Methodologies Chairman’sReportbyGotthardStein
advice on modern verification technologies and methodologies and to act as a forum for the ex-change of relevant information in this area. Individ-ual working group members volunteer to prepare discussion and working papers, subgroups are es-tablished, conferences and meetings with special topics are performed, and an important goal is to publishtheresultsofmajoractivities.
A wide range of verification issues in nuclear and non-nucleartreaties,researchanddevelopmentofinnovative verification technologies, synergies be-tween verification regimes or the implementation of advanced verification technologies and approaches constitutestheworkloadoftheVTMgroupandde-termines the agenda of the meetings. The following listservesasanexample for theVTMactivities inthelastyears:
Duringtheyear2007theVTMgrouphadpresenta-tions and discussions in the following fields:
• NovelTechnologiesforIAEASafeguards• LaserEnrichmentMeasurement• Satellite Imagery in Cooperation with GMOSS
and LIDAS• SatelliteandSeismicMonitoring• ProliferationResistance• DiscussionofISTCIssues• Integration of Information for Non-proliferation
Studies
Due to these broad issues and various activities group members have expertise and backgroundfrom laboratories, universities, international organi-sations,nationalauthoritiesandministries,industry,researchcentresandinstitutions.ThecomplexityoftheVTM issuesmade it necessary tocreate sub-groups:
• Subgroup on Environmental Monitoring (Chair:Martin Kalinowski)
ofMassDestructionandMonitoringKyotoPro-tocolProvisions,by(eds.)RudolfAvenhaus,Ni-cholas Kyriakopoulos, Michel Richard andGotthardStein,Springer,July2006.
• International Safeguards and Satellite Imagery:Key Features of the Nuclear Fuel Cycle andComputer-basedAnalysis,by (eds.)BhupendraJasani, Irmgard Niemeyer, Sven Nussbaum,Bernd Richter and Gotthard Stein, Springer, Au-gust 2008.
A further book publication is planned for the com-plexfieldofproliferationresistance.
6. ESARDA Working Group Training and Knowledge Management Chairwoman’sReportby GreetJanssens-Maenhout
The renaissance of nuclear technology urges theparallel development of the necessary human re-sources potential. Technological, economical, legal andpoliticalconsiderationsallflowinthedebateonfuturereactorsystemsandfuelcyclefacilities.Thedecreased number of students going for engineer-ingtheselastyears,moreparticularlyinthenucleararea, led to thecurrent lackofmanagersandex-pertsnecessaryforoperatingacomplextechnicalsystemlikeaNPP.Engineerswhomasteralso ju-ridical aspectsor vice versa juridical expertswhomasteralsoengineeringarescarce.Universityfac-ulties teach their field of competence, either techni-calorjuridicalwithcoursestraditionallyintheiruni-versity faculty. To meet these challenges andstreamline the educational resources, new syner-gieswithinteruniversitycollaborationhavetobeim-agined, as is demonstrated by the EuropeanNu-clear higher Education Network, setup in 2002. A next step is interfaculty collaboration, which wasexploredbetweenthefacultiesofPhysicsandPo-liticalSciencesattheUniversityofFlorencein2007.In addition to this education, the World Nuclear Uni-versity established multidisciplinary training foryoungprofessionalsinsummerschools.
The ESARDA WG TKM supported these initiatives byprovidingtheannualone-weekcourse“NuclearSafeguardsandNonProliferation”,whichishostedbytheJointResearchCentre in Ispra.Thecoursewas taught in the last 4 years to almost 200 stu-dentsandismeanwhilerecognizedbytheacadem-icworld.Theaimistointegratethisascompulsorycourse in the standard curriculum for a Master of Science degree in Nuclear Engineering. The interest
ESARDA BULLETIN, No. 38, June 2008
57
forthecourseissteadilyincreasing(withapeakofseveral thousand visitors of the course website per month) and the demand for participation is ap-proaching a numerus clausus.
The feedback of the students on the course ex-pressedaveryhighsatisfaction,whichisalsoillus-trated by the spontaneous students’ paper ofthanks. In response to the feedback analysis, thecourseequilibriumbetween technicaland juridicalmattersisimprovedbytakingonboardjuridicalex-perts in the pool of lecturers. ESARDA is grateful for the support of the different organizations (IAEA, EURATOM, University of Uppsala, University ofHamburg, University of Liège, AREVA, BNG, SKI,IRSN, JRC), sending and sponsoring the high qual-itylecturers.
IntheEUnomanysimilarmultidisciplinaryeduca-tioninitiativesonsafeguards,non-proliferationandsecurityexistandastrengtheningbycooperationisfostered. The JRC is looking for supporting the In-ternationalSchoolofNuclearLawbytheOECDor-ganized at the University of Montpellier, the newmaster on nuclear material management and con-trolofthefuelcycleinthenon-proliferationregimeattheUniversityofFlorence,andtheeducationandresearchbytheFriedrichvonWeiszäckerCentreforAtoms and Peace at the University of Hamburg.This is completely in line with the IAEA DirectorGeneral, who was promoting during the Conference inFlorenceofOctober2008atwofoldeducationinnucleartechnologyandinnuclearlaw.
Spontaneous feedback of the students on the third ESARDA course, Ispra, 5-9 March 2007
ESARDA BULLETIN, No. 38, June 2008
58
1. Background
In November 2005 an International Workshop on “GammaEvaluationCodesforPlutoniumandUra-nium IsotopeAbundanceMeasurementsbyHigh-Resolution Gamma Spectrometry: Current StatusandFutureChallenges”washeldinKarlsruhe,Ger-many.Thisworkshopwasattendedbymanyoftheprimaryexpertsingammaspectrometrytechniquesincludingmanyoftheinitialcodedevelopers.Oneof the main issues discussed during that meeting was addressing the concerns of the inspectorate authorities (IAEA, Euratom and ABACC) about the standardisationandsustainabilityofgammaevalu-ation codes. Clear guidelines were identified for fu-ture challenges (including technical developments). Asafollow-uptheAgencyissuedaroadmapforfu-ture developments of gamma codes that culminated inthesubmissiontoseveralMSSP’s(US,ECandF)of a request of support in this field.
In parallel a different initiative was carried on under theframeworkoftheUS-DoE/ABACCbilateralsafe-guards cooperation agreement with the establish-ment of an Isotopic Measurements Working Group (focusing only on uranium enrichment measure-ments)gatheringexpertsfromUS,BrazilianandAr-gentinean laboratories with the goal to “test and evaluate existing uranium isotopic and enrichment software through an interactive and cooperative process among users and developers and make recommendations for standardized software that meets regional and international quality assurance (QA) requirements for the safeguards community”.The work under Action Sheet 14 (AS 14) will be suc-cessfullycompletedconcerningtheinitialscopes.
Thereforeit isconsideredbythoseinvolvedinthedevelopment, control and use of these gamma evaluation codes that we should endeavour to con-tinuethepositiveexperienceofAS14,enlargingtheparticipationtotheinternationalcommunity,broad-ening the scope in order to include plutonium iso-topic measurements in order to establish a working group (WG) that would respond the needs ex-pressedbytheAgency.
to look at ESARDA, and in particular to the NDA workinggroupasthecatalyserfortheinstitutionofthis dedicated WG. The proposal to launch the insti-tution of an international Working Group on Gam-ma Spectrometry Techniques for U/Pu Isotopics wasdecidedinameetingorganisedinAix-en-Pro-vence on the 21stofMay2007.
2. Scope
ThescopeoftheWGistoprovideaforumforex-change of information, technical developments, validationandtestingofgammaspectroscopytech-niques used to determine the isotopic composition of uranium and plutonium samples in nuclear safe-guardsapplications.Specifically,butnotexclusive-ly, itwilladdressissuesrelatedtogammaevalua-tion codes, such as their applicability, capabilityand limitations, standardization, sustainability andversion control.
3. Composition
In principle any stakeholder involved in gammaspectrometryapplications,eitherastechniquede-veloperorasanend-user forsafeguardsapplica-tions,canjointheWG.Typicalmembershipwillin-clude: national and international research laboratories, nuclear plant operators, inspection au-thorities, code developers and instrument manufac-turers.
It is recognized that instrument manufacturers have extensiveexperiencewithrespecttointegrationofsuchcodesintocomprehensivemeasurementsys-tems, In addition, it is recognized that commercial entitiescurrentlyprovidesupportandsustainabilityforcodesthattheycurrentlymarket.Therefore,par-ticipation of detector manufacturers is encouraged butstrictlymonitoredtoaddressanyconflictofin-terestbecausethescopeoftheWGispurelyscien-tific and not for profit,. Representatives of the com-mercial companies will be permitted to:
TheWGwillbecoordinatedbytheNDA-WGchair-manandaco-chairmanelectedbytheparticipants,whose main role will be the organization and man-agement of the meetings, distribution of the official documentsproducedbytheWG,establishinglinkswith international institutions and administrative bodiesforprojectfundingsuchastheU.S.DoE,theIAEA, variousMSSP’s and other non-governmentorganizations.
5. Activities
The activities to be performed will be planned and agreedby theWG in the regularmeetings.Theseactivitiescancover,butarenot limited to, anyoffollowing topics:
- set-upandmaintenanceofawebforumfordis-cussions and information repository of gammaspectroscopyrelatedissues,
- organisation of experimental round robins andevaluation benchmarks,
- selection of a commonly agreed platform con-taining a set of gamma reference spectra to be used for test and evaluation of gamma codes,
- maintenance, upgrade and availability of thetesting platform,
- issue guidelines for QA, best practice guides,recommendations on the (application-depend-ant) use of hardware setups and/or evaluation codes,
- propose/sponsorproductionofreferencemate-rial for calibration purposes,
- recommendstandardisationofnucleardata,
- performaversioncontrolofthemaincodes,rec-ommending the last fully-validated version andadvising WG members of the issue of new re-leasesbycheckingthevalidationprocess,
- collect users’ needs and convene them to thedevelopers,
The Joint Research Centre, which is providing the secretariat of ESARDA and hosting the website of theAssociation,willprovidethee-infrastructureforall the WG activities within the ESARDA website.
TheWGshouldmeetindicativelyonceayear(alter-natingEuropeandAmerica)possiblyinconjunctionwith major safeguards events (INMM or ESARDAconferences) in order to minimise the travelling in-conveniences of the WG members. Advance notifi-cation of such meetings will be posted on the web-siteanddistributedtoothernuclearnon-proliferationand nuclear safeguards organizations to ensure the information is disseminated to all personnel who want to attend.
ESARDA BULLETIN, No. 38, June 2008
60
Abstract
The wireless transmission of data from sensors, monitoring both static and dynamic safeguards processes, is highly appealing for the simple fact that there are no wires. In a nuclear safeguards re-gime, this has the implied benefits of low-cost in-stallations, versatile configurations, and the elimina-tion of conduits to inspect. However, with the implied solutions of wireless, we are presented with a new set of problems for system implementation and op-eration management, in particular (i) Radio Frequen-cy (RF) interference and (ii) security in information transmission. These problems are addressable. This paper looks at the clear benefits of wireless tech-nologies and the cautions regarding the possible pitfalls of poorly applied technology, discusses the integration of radio frequency in existing and new facilities, provides high-level considerations for in-formation security, and reviews prospects for the future.
Fromasafeguardsauthority’spointofview,wire-less in-plantdatatransmission isattractivefortheeaseofinstallationandtheabilitytorespondtothechanging requirements as the inspection approach evolves. However, for wireless technologies to be considered as a viable complement to cables, a number of concerns have to be accounted for.
Plantoperatorsmayneedtoimposelimitationsonthe transmission standards proposed to be used in facilitiestoavoidinterferencewiththeirsafetyequip-ment, including physical security systems. Thesafeguardsauthorityneeds tobeguaranteed thatC/S equipment and data transmission processes willnotbeaffectedby theotherexistingRFplantequipment.Assuch,priortoanyRFsystemimple-mentation, the environment where it will be utilized mustbecharacterized(e.g.,byanRFsurvey),con-trolled after installation, and periodically re-as-
sessed. Although preventing interference implies an additional cost to installation and maintenance, it is fair to say that interference is a quitewell under-stoodproblem:proceduresandbestpracticesexistto deal with it as it is a shared issue to several in-dustrial sectors using RF devices.
Forconfidentialityreasons,thesafeguardsdatabe-ingtransmittedmustnotbeavailableforanalysisbya thirdparty. Inaddition, thesafeguardsauthorityrequires data to be authenticated as close to the point of acquisition as possible.
Asageneraltrend,itisnotedthatthedatasecurityprovidedbyRFcommunicationsystemsiscontinu-ouslyimprovingduetotherequirementsofapplica-tions in various industrial sectors. In certain cases, stringent data security requirements imposed bysafeguardsmay be addressed by extreme proto-colsembeddedeitheratsystemleveloratthelow-est level of data acquisition.
In this context, the ESARDA Working Group onContainment and Surveillance addressed the issue ofwirelessin-plantdatatransmissionforsafeguardspurposes and supported the publication of a paper in two parts.
PartI[1]providedspecificargumentsforconsider-ing the use of wireless communications as a com-plement to fixed cable installations. In addition, itpoints to specific requirements arising from the plant operators’ boundary conditions to be ad-dressedforwirelesstechnologiestobedeployablein facilities. Furthermore, it introduces basic con-ceptsunderlyingwirelesscommunication,includingmethods for transmission, issues on power con-sumption,frequency,range,andconsiderationsoninterferenceandnoiseresilience.Finally,partIpre-sented an overview of state-of-the-art wirelesstechnologiesandmakesaprojectiononcapabilitiesthatarelikelytobereachedinthenearfuture.
Hereafter,Part IIof thepapercoverstheprincipalissues regarding information securityandwhyandhow processes and protocols can be implemented to significantly mitigate security and informationconfidence concerns. Another area of discussion is
Wireless Communications for Monitoring Nuclear Material Processes PART II: Wireless In-plant Data TransmissionF. Braina1, J.G.M. Gonçalves2, M. Heppleston3, C. Ottesen4, B. Schoeneman4, K. Tolk4, C. Versino2
1 IRSN, Fontenay-Aux-Roses Cedex, France; 2 European Commission, DG Joint Research Centre, Ispra, Italy; 3 European Commission, DG TREN, Luxembourg; 4 Sandia National Laboratories, Albuquerque, USA
ESARDA BULLETIN, No. 38, June 2008
61
considerations for the integration of wireless tech-nologies into existing nuclear facilities taking into account the RF interferenceproblem,andwaystointegrate support for these technologies into the de-sign phase of new facilities.
2. Information security considerations
Wireless Local Areas Networks (LANs) face the same security challenges as their wired counter-parts and more. Because the medium for wireless is air, wireless LANs have the added issue of securing data that travels the airwaves.
Traditional wired networks use cables to transfer in-formation,whichareprotectedbythebuildingsthatenclose them. To access a wired network, a hacker mustbypassthephysicalsecurityofthebuildingorbreach the firewall.
On theotherhand,wirelessnetworksuse theair,which is an uncontrolled medium. Wireless LAN sig-nals can travel through the walls, ceiling and win-dowsuptothousandsoffeet.Additionally,airwavesareasharedmediumthatallowsanyoneintheprox-imityto‘sniff’thetraffic.
The details of the design of equipment to address the security needs for safeguards applications isbeyondthescopeofthispaperandthissectiononlyprovidesasummary.Foradetaileddiscussion,thereader can refer to [2].
Data must be assured to be authentic if it is to be used for safeguards purposes. It must be known that the data originated from the intended source was not changed in transit, and it is not a repeat or delayedcopyofpreviousdata.
Forexample,ifthepurposeofthesystemistotrackitems, the devices attached to the monitored items must be secure from duplication or impersonation attacksandmustbesecurelyattachedtothemoni-toreditemsothatanyattempttotransferthemoni-toring device to another item will be detected. RF identification(RFID)systemsthatwerenotdesignedspecificallyforsafeguardsapplicationsdonotpro-vide these assurances. There is a trend, however, on more secure protocols [3] to mitigate the set of possible attacks [4] and enable new applications such as the electronic passport. Further considera-tions are presented in Table 1.
Data encryptionprotectsitfromdisclosuretoany-one who is not authorized to receive the informa-tion.Insomecases,thefacilityoperatororthehoststatewillrequirethedatatobeencryptedifthereisachancethedatamightbeinterceptedbypartiesoutsidethefacility.Therefore,datathatistransmit-
tedoverwirelessconnectionswill requireencryp-tion before transmission, in case an adversary isable to intercept the wireless signals. Similar con-cerns exist for regular State-of-Health messages.These messages, often with the same information content,shouldbeunrecognizableassuch,forex-ample,byalwaysappearingdifferentinstructuretoa potential eavesdropper.
Some data must also be protected from disclosure totheoperatorortothestate’sauthority.Forexam-ple,data thatwillbeused toverify theoperator’sdeclaration of activities should not be disclosed to theoperatorbeforehemakeshisdeclaration.Oth-erwise,hecouldmodifyhisdisclosuretomatchtheverification data.
Data must also be cryptographically authenticated beforeanadversaryexposes it topossiblealtera-tion or substitution. Although encrypting the dataduring transmission will give this protection, the datawillagainbevulnerableonceitisdecryptedatthe receiving station. A better approach is to add either a Message Authentication Code (MAC) or a Digital Signature (DS) to the data before it is trans-mitted from the monitoring device.
Theseinformationsecurityconsiderationsareespe-cially importantwhenworkingwithwireless com-munications.Sinceanadversarycanintroducefal-sified data without the need to physically accessthe network cables, attacks can be mounted more easily,sousersarewelladvisedtousestrongau-thentication. Similarly, because an eavesdroppercanlistenintothemessagetrafficfromanywherethewirelesssignalcanbedetected,encryptingsen-sitive data will be required in many systems thatwouldnotnormallyrequireencryptionifwiredcom-munications were used.
In what follows we present a review of data protec-tionoptionsinthesafeguardscontext.
2.1 Utilizing symmetric key data protection tech-niques
In symmetric cryptography[5],thesamekeyisusedatbothendsoftheprocess.Thatis,thekeyusedtoapplytheauthentication informationtothedata isagainusedtoverifyit,andthekeyusedtoencryptthe data is again used to decrypt it. These algo-rithms are compact and fast, making them well-suited for use in small sensor platforms.
Data isprotected fromdisclosurebyastrongen-cryptionalgorithm,suchastheAdvanced Encryp-tion Standard (AES, [6]). Some parts of the datapackets, such as the routing information, might be left unencrypted foroperational reasonswithonly
ESARDA BULLETIN, No. 38, June 2008
62
the sensitive information protected from disclosure. However, care must be taken to ensure that adver-saries cannot draw conclusions that would give them insights into the sensitive information from these unencrypted portions of the transmissions.Forexample,safeguardsauthoritiesmightbetrig-gering a camera from a radiation detector. If the triggersaretheonlymessagespassedfromthede-tector to the camera, adversaries could perform a set of experiments to determine the sensitivity ofthe detector, which could lead to their designing a shield to divert material without detection.
Dataauthenticationisusuallyaccomplishedusingakeyedhashfunctionorencryptionalgorithmtoadda MAC to the data at the sensor. The MAC is calcu-latedusingthedataandasecretkey,thatmustbeheldsecure.Whentheauthenticityofthedatamustbe verified, the same calculation is performed using the same key, and the result is compared to theMAC that was applied at the sensor. This works well whenonlyonepartywillusetheauthenticationin-formation, but it is very difficult to implement se-curely in adata-sharing scheme, since the secretkeymustbeknowntoverifytheauthenticityofthedata. Any party that can verify the data can alsosubstitutebogusdatausingthiskey.
Symmetric key cryptography also requires themovement of secret keys between multiple loca-tionsandtheuseofthesekeysbyalargenumberofusers,greatly increasing the riskofdisclosing thesecretkeytounauthorizedusers.
2.2 Utilizing public key infrastructure for joint use in-formation
Public key cryptography[7]usesapairofkeys:oneforsigningorencrypting thedataandanother forverifyingordecryptingthedata.Knowledgeofonehalfofthekeypairdoesnotallowthedirectcalcula-tion of the other key. Although this calculation istheoreticallypossible,itisconsidereda‘hardprob-lem’.Publickeycryptographycanbeusedforbothencryptionandauthenticationandgreatlysimplifieskeymanagementformostsystems,especiallywhenmultiple parties use the data.
Unfortunately,thecalculationsforpublickeycryp-tographyrequiremuchmorecomputingpowerthanis required for symmetric key algorithms of equalstrength.Until recently, thismeant thatsmallsys-tems, suchas seals that run for yearsusing rela-tivelysmallbatteries,couldnotusepublickeycryp-tography. However, advances in bothmicroprocessortechnologyandcryptographymaketheuseofpublickeycryptographypossibleinthesesystems, especially if Elliptic Curve Cryptography
(ECC) [8] is used. The ECC algorithm has an appeal-ingenergyloaddistributionforitscryptoprocesses.Ofthetotalenergyrequired,one-thirdisconsumedin signing the information and two-thirds is con-sumedintheverificationofthesignature.Forlow-power RF sensor applications, the signing process is performed in the secure sensor housing where energyneedstobeconserved,andtheverificationprocess is performed on a host computer where en-ergyisabundant.
2.3 Message protocol considerations
Alongwithauthenticationandencryptionusagetoprotect message content and integrity, there aremanyprotocol-based mechanisms that can be used to thwart additional insidious attacks. Protocol istheareawheremanycommerciallyusefulwirelesssystemscanpresentvulnerabilitieswhenutilizedforsafeguards applications. Low data rate systems,suchas thosethatmaybeusedtocollectsensordataforsafeguardsapplications,havetheluxuryofaddingprotocol features to increasesecurity.Theadditionoftheseprotocolfeaturesmaypresenthighbandwidthsystems,suchasIEEE802.11(WiFi)[9],withtoomuchoverheadandtoomanyconstraintstobepracticalforthesetypesofapplications.
A subset of the protocol features that have been found togreatly increase the security of lowdataratesystemsincludesthefollowingattributes:
• Time variants:Everymessagecontainsapieceof information that changes with time, such as time of day. This distinctive part of eachmes-sage significantly reduces the possibility of re-peated or counterfeit messages. Time variants addressthepossibilityofanadversarycapturingamessagetoplayitbacksometimeinthefutureto elicit a particular response from the RF device and then utilizing this knowledge to circumvent thesystem’spurpose.
• Counters: There are two counters that are gen-erally included in every message—a messagecounterthatcreatesatotalcountofeverymes-sagethathasbeentransmittedandanup-coun-ter. The purpose of the message counter is to determine if any messages have been missedprior to the latest message. If the count differ-ence (prior message to current message) is small (e.g., two), then themissingmessage issimplyrequested for re-transmission from the sourcedevice to complete the message set. This cir-cumstanceshouldbeveryinfrequent;however,if thisoccursfrequently, itcanbean indicationthat some characteristic in the RF environment has changed and merits investigation. If the dif-
ESARDA BULLETIN, No. 38, June 2008
63
ferencebetweenthecountsisrelativelylarge,itcouldindicatethatanadversaryisattemptingtocauseDenialofService(DOS).Theup-counterisa largecounter (typically4bytes)withanever-increasingvaluethatmaysimplycontainintegerseconds as a value. The current value is com-pared with the previous value from the same verified source to ensure that the current value is larger.Thisfeatureisactuallyanothertimevari-ant theadversarywouldneed to know to suc-cessfullycounterfeitamessage.
• Fixed message field format: Assembling a mes-sage for transmission requires compiling fields of datainanarraythatisthenstreamedoutacrossthe airwaves. If the data fields are assembled in thesameorderforagivenmessagetype,itsig-nificantly reduces the possibility of authentica-tioncollision.Thisapproachmakesithighlyim-probable that the adversary could generate anintelligiblemessagethatwouldmatch thefixedmessage field format with an authentic signature. Additionally, themessagemustaccomplishtheadversary’sintendedpurposetorepresentavi-able attack.
• Minimal command set: To mitigate the possibil-ityofanadversaryinvokingacommandthatmayalter the prescribed operation of a sensor mod-ule,over-the-air featureprogramming isnotal-lowed. Feature programming is typically donepriortodeploymentoveraspecialhardwarecon-nection.Thisconnection iselectricallydisabledafter programming. Internally, the software es-tablishes constraints on buffer sizes and pro-videsbuffersize-monitoringprocessesthatmiti-gate the possibility for buffer overrun attacks.Bufferoverrunattacksattempttoexternallyex-ploitavailablecommandsandcausepre-deter-minedchangesinmemory,whichprovideaben-eficialoutcomefortheadversary.
3. Projections of future wireless communications capabilities
The future of low data rate RF communications will bring forth technologies that will be more integrat-ed, more secure, and will require much less power.
Asanexample,RFtransceiversdemonstrateacon-tinuing trend toward the development of more high-ly integratedRFtransceiversutilizingSystems-on-a-Chip(SoC)[10].Today,itisreasonabletoexpectto design an RF device that utilizes a transceiver integrated circuit with a microprocessor providing directfunctionssuchasencryption,errordetection/recovery,andcollisionavoidance.This is justone
example of the advances seen in RF technologyaimed at guaranteeing a consistent implementation of all these functions, an absolute requirement for future wireless communication that must conform to communication standards.
Table1 listssomepotentialnear-termprojectionsforfuturelowdatarate,low-powerRFcommunica-tions:Ultra-wideband[11],SecureSensorPlatform[12], RuBee [13], ZigBee [14], and SoC [10].
Figure 1 shows a RuBee tadio tag.
Specific advances in RF transmission technologies willnotbetheonlyinfluenceintheoverallperform-ance gains for wireless communications in the near future. These gains will be attributed to other asso-ciatedtechnologyareasaswell.Arecentexampleisthecellphoneindustry.Cellphoneshaveevolvedfromlarge,cumbersomeitemsthatservedonlyonepurpose,tosmall,convenientitemsthathavemanyuses (camera, internet, etc.). This evolution of the cell phone can be attributed to market forces.
4
3. Projections of future wireless communications capabilities
The future of low data rate RF communications will bring forth technologies that will be more integrated, more secure, and will require much less power. As an example, RF transceivers demonstrate a continuing trend toward the development of more highly integrated RF transceivers utilizing Systems-on-a-Chip (SoC) [10]. Today, it is reasonable to expect to design an RF device that utilizes a transceiver integrated circuit with a microprocessor providing direct functions such as encryption, error detection/recovery, and collision avoidance. This is just one example of the advances seen in RF technology aimed at guaranteeing a consistent implementation of all these functions, an absolute requirement for future wireless communication that must conform to communication standards. Table 1 lists some potential near-term projections for future low data rate, low-power RF communications: Ultra-wideband [11], Secure Sensor Platform [12], RuBee [13], ZigBee [14], and SoC [10]. Figure 1 shows a RuBee tadio tag. Specific advances in RF transmission technologies will not be the only influence in the overall performance gains for wireless communications in the near future. These gains will be attributed to other associated technology areas as well. A recent example is the cell phone industry. Cell phones have evolved from large, cumbersome items that served only one purpose, to small, convenient items that have many uses (camera, internet, etc.). This evolution of the cell phone can be attributed to market forces. There is a significant difference between the evolution of cell phones and the technologies discussed here for safeguards applications. Currently, there are estimated to be 2.7 billion cell phone subscribers in the world, representing a huge market. Safeguards technology as discussed in this article is highly specialized and will not likely have a significant market force driving its development. In many cases, however, safeguards applications will be able to leverage off some of the consumer and commercial market developments as well as developments driven by the large sector of industrial control and automation [15]. For example, energy storage densities and the efficiencies of extracting the stored energy are driven greatly by the commercial market. These gains are being leveraged by designers for safeguards applications and will have significant impacts on future safeguards technologies. Longer device life and/or the luxury of simply consuming more energy for more capability (e.g., security processes) will be a designer’s choice. It could be possible that energy for ultra low-power RF devices may be able to be parasitically extracted from the environment and the device could operate indefinitely. Of the presently available radio hardware, the most interesting developments will be in the area of simple, low-cost and low-power SoCs that incorporate the radio, RF packet handling hardware, and a microprocessor for security processes. Furthermore, the incorporation of protocol software in SoCs, such as ZigBee (IEEE 802.15.4) [14], to simplify application development based upon a standard architecture is likely to be quite useful for safeguards instrumentation for data collection. Being able to leverage off the large hardware development effort that has gone into these SoCs seems beneficial. Depending on the specific requirements and whether some performance can be sacrificed, it may also be beneficial to leverage off the development effort that has gone into a standard such as ZigBee. Traditionally, communications protocols between RF devices have been implemented through custom network solutions.
Figure 1: A RuBee Radio Tag (4 bit CPU, 1kB sRam, and lithium battery with expected life of 5 years).
There is a significant difference between the evolu-tion of cell phones and the technologies discussed here for safeguards applications. Currently, thereare estimated to be 2.7 billion cell phone subscrib-ers in the world, representing a huge market. Safe-guards technology as discussed in this article ishighlyspecializedandwillnotlikelyhaveasignifi-cantmarketforcedrivingitsdevelopment.Inmanycases, however, safeguards applications will be able to leverage off some of the consumer and commer-cial market developments as well as developments driven by the large sector of industrial control and automation [15].Forexample,energystorageden-sities and the efficienciesof extracting the storedenergyaredrivengreatlybythecommercialmarket.Thesegainsarebeing leveragedbydesigners forsafeguards applications and will have significant impacts on future safeguards technologies. Longer device life and/or the luxury of simply consumingmoreenergyformorecapability(e.g.,securityproc-esses)willbeadesigner’schoice.Itcouldbepos-sible that energy for ultra low-power RF devices
ESARDA BULLETIN, No. 38, June 2008
64
maybeabletobeparasiticallyextractedfromtheenvironment and the device could operate indefi-nitely.
Ofthepresentlyavailableradiohardware,themostinteresting developments will be in the area of sim-ple,low-costandlow-powerSoCsthatincorporatethe radio, RF packet handling hardware, and a mi-croprocessorforsecurityprocesses.
Furthermore, the incorporation of protocol software in SoCs, such as ZigBee (IEEE 802.15.4) [14], to simplify application development based upon astandardarchitectureislikelytobequiteusefulforsafeguards instrumentation for data collection. Be-ing able to leverage off the large hardware develop-ment effort that has gone into these SoCs seems beneficial. Depending on the specific requirements and whether some performance can be sacrificed, it mayalsobebeneficialtoleverageoffthedevelop-ment effort that has gone into a standard such as ZigBee. Traditionally, communications protocolsbetween RF devices have been implemented through custom network solutions.
RuBee Asset tracking utilizing passive RFID and low bandwidth communication.
Lowspeedinexpensivetechnology.
Long Wave (LW) magnetic signals to transfer information below450kHzandoptimallyat 132 kHz.
Final stages of IEEE development.
ZigBee Currentlysuitableforsimplecontrolnetworks.Mayfindapplication in sensor node applications in the near future, especiallywhenenergystorage densities increase.
Direct sequence spread spectrum (DSSS) with short data packets. 2.4GHz ISM frequencyband.
Requirespowered,full-function units to support mesh networking and frequent communicationactivityrequires more power to maintainconnectivity.
SoC Most RF transceiver sets will utilizedeeplyembeddedprocessors supporting new modulation techniques and securityfeatures.
Thisapproachwilleventuallyfinditswayintovirtuallyalltransmission techniques and protocols.
This is an ongoing trend and will become pervasive in the RFindustry.
Table 1:Near-termRFcommunicationtechnologies.
4. RF modulation: technical considerations for the future
Issues that need to be considered with respect to choosing anRFmodulation type for a low-powersensorapplicationaredirectlyrelatedtomodulation spectral occupancy,1 Bit Error Rate (BER),2 the com-plexity and power consumption of the radio hard-ware,and themodulation’s robustness against in-terference [1].
Modulationtechnologies[16]areaddressingtheseissuesthroughtheevolutionoftechniquesforlow-powerRFapplications. In thepast,On-OffKeyedandAmplitudeShiftKeyed(OOK/ASK)weresimplemodulation techniques utilized in sensor applica-tions,butnowmanysinglechipradiosdesignshavemigratedtoFrequencyModulation(FM).Thisisbe-causeFMofferssignificantlybetterinterferencere-jection.ThereareseveralFMmodulationtypesand
1 SpectraloccupancyorEb/No(Ebeeoverenzero)isthemeasureof signal to noise ratio for a digital communication system. It ismeasured at the input to the receiver and is used as the basic measure of the signal strength.
2 BER is the number of bits per unit time that are incorrect.
ESARDA BULLETIN, No. 38, June 2008
65
associatedderivations.Forexample,MinimumShiftKeying (MSK) is a natural evolution of FM,whichconstrains the transmit spectrum and decreases the spectral occupancy relative to traditional FMtechniques. Binary Phase and Quadrature PhaseShiftKeying(BPSK/QPSK)takethissameapproacha bit further and represent an even lower spectral occupancy.However,notmanysinglechipradioscurrentlysupportthesemodulationtechniques,dueto the added complexity andpower consumptionassociated with the demodulation requirements.
Burstspreadspectrumreceiversaremorecomplexandrequiremorepowerthananyoftheaforemen-tioned receivers, but offers more robust interference rejection.Thisisbecausethetransmissionisspreadoverabroadfrequencyspectrum.TheIEEE802.15.4standard (the hardware underlying ZigBee) speci-fies Direct Sequence Spread Spectrum (DSSS) [17] modulation for communication. The market pull of this standard has driven the commercial develop-ment of new SoCs that implement DSSS modula-tionanddemodulation.AmajordrawbackforDSSSisthatthereceiverdrawsabout50%morepowerthan a similar narrow band FM transceiver. If the RF communicationsystemcanaffordthispowerpen-alty,theIEEE802.15.4maybeagoodsolutionthatprovides the advantages of DSSS.
Ultra-VideBand (UWB) [11] isanothermodulationapproach that is on the RF horizon and could be a candidateforsafeguardsapplication.UWBisalow-energy, short-range, highband-widthRFmodula-tiontechniquethatspreadsthetransmissionenergyover a verywidebandwidth.UWBhas all of thecapabilities that more traditional wireless technolo-gieshaveand,insomeinstances,maybeevenbet-ter.UWBstillmust obey the lawsof physics andthereforewill exhibit the same or similar receivedspectral occupancy as the previously discussedmodulation techniques, but with reduced effective range.
At this point in development, UWB is much more immaturethanthepreviouslydiscussedtraditionalwireless technologies. Most of the development ef-fort forUWB isgoing into very short-range,high-speed data interfaces targeted to replace wired UniversalSerialBusversion2(USB2)andtheHigh-Definition Multimedia Interface (HDMI) for home en-tertainment.Thesystemscurrentlybeingdevelopedare not a good fit for safeguards application, and maynotoffer verymuch leveraging technology inthis area. Presently, the synchronization require-ment in UWB receivers takes more time and con-sumes more power than a traditional radio and is considerably more complex to implement. While
this is not problematic in continuous data transmis-sion, it isasignificantprobleminlow-powerburstcommunications. If UWB moves in the direction of lowerbandwidthandlonger-rangeburstcommuni-cations, it might be able to be considered as a re-placement for traditional radios in these types ofapplications. Recently, the United States FederalCommunications Commission (FCC)3 gave permis-sion for UWB transmissions with limits on transmit-ter power and radiated spectrum. The first realizable UWBapplicationhasbecomeashort-range,high-dataratecablereplacement.ManyUWBdevelop-ers have progressed from the simple, short, low duty-factormonocyclepulsestoamoretraditionalmodulation format called Orthogonal Frequency-DivisionMultiplexing(OFDM).ThismaybethebestwaytoimplementUWB-basedsystemswhilefallingwithin the FCC regulations. Currently this path ofevolution does not represent a good fit with safe-guards instrumentation applications, but this could change in the future.
5. Integration of RF technologies into existing facilities
There are two fundamental problems with estab-lishing reliable RF communications in an existingfacility—interference and path loss.
Interferencesourcescanbeanydevicethatgener-ates Electro-Magnetic Radiation (EMR). This in-cludes equipment with electric motors and welders atoneendofthefrequencyspectrum,toradarandx-raymachinesattheotherend.Allofthisequip-ment can emit broad spectrum RF noise, which causes transmission errors.
Pathlossiscausedbymanyfactors,butthelargestcontributors to loss are distance relative to radiated power and obstructions between the transmission and reception antennas. This consideration is what called the Fresnel zone [18]. Figure 2 depicts a Fres-nel zone under conditions of visual Line-Of-Sight(LOS)withoutanyobstructionsbetweenthetrans-mitterandreceivingantennaandNon-LOS(NLOS)where there are visual obstructions. Obstructionsentering the Fresnel zone of radiation have direct impact on the resulting achievable transmission distance.
Without obstructions, radiated power essentiallydictates the reliable relative transmission distance.4
3 The Federal Communications Commission (FCC) is a United States ofAmericagovernmentagency.
4 Transmissiondistanceisalsofrequency-andequipment-depend-ant;however,forsimplicityofdiscussion,theseaspectsofwirelesscommunication will not be discussed.
ESARDA BULLETIN, No. 38, June 2008
66
It must be stated that not all obstructions induce loss.Tothecontrary,ifanobstructionisreflectiveand in the right location, the phase differences be-tweentheprimaryandreflectedwaves(multi-path)can be supportive and provide signal gain. Howev-er, this is too complicated to predict and should not bedependeduponasasystemfeature.ItisbesttoacceptthattheinfluenceofavisualobstructiononanNLOS linkmay be anything from negligible tocomplete suppression. DSSS-based systems ad-dresstheNLOSsituationbytransmittingoverindi-vidualmultiplefrequencies,whicharereflectedandabsorbed differently across the band; therefore,manyoftheRFnulls(RFshadowsandsubtractivewavephases)areovercomefairlywell.Narrowbandtransmissions require other remedies to address theNLOSissues,suchaspassiverepeaters(highlytechnical) and active repeaters.
7
Path loss is caused by many factors, but the largest contributors to loss are distance relative to radiated power and obstructions between the transmission and reception antennas. This consideration is what called the Fresnel zone [18]. Figure 2 depicts a Fresnel zone under conditions of visual Line-Of-Sight (LOS) without any obstructions between the transmitter and receiving antenna and Non-LOS (NLOS) where there are visual obstructions. Obstructions entering the Fresnel zone of radiation have direct impact on the resulting achievable transmission distance. Without obstructions, radiated power essentially dictates the reliable relative transmission distance.4 It must be stated that not all obstructions induce loss. To the contrary, if an obstruction is reflective and in the right location, the phase differences between the primary and reflected waves (multi-path) can be supportive and provide signal gain. However, this is too complicated to predict and should not be depended upon as a system feature. It is best to accept that the influence of a visual obstruction on an NLOS link may be anything from negligible to complete suppression. DSSS-based systems address the NLOS situation by transmitting over individual multiple frequencies, which are reflected and absorbed differently across the band; therefore, many of the RF nulls (RF shadows and subtractive wave phases) are overcome fairly well. Narrow band transmissions require other remedies to address the NLOS issues, such as passive repeaters (highly technical) and active repeaters. One of the first steps required in an RF system design and deployment would be to characterize the environment. This process should be accomplished through an RF survey conducted by a reputable team specializing in RF system evaluation, and will establish the basis of scope for viable applications. This is done by identifying facility characteristics that impact wireless communications. Some of these characteristics can be taken advantage of in the system design and others will require remedies addressing NLOS shortcomings.
4 Transmission distance is also frequency- and equipment-dependant; however, for simplicity of discussion, these aspects of wireless communication will not be discussed.
Figure 2: Examples of how the Fresnel zone can be disrupted. Figure 2: ExamplesofhowtheFresnelzonecanbedis-rupted.
OneofthefirststepsrequiredinanRFsystemde-signanddeploymentwouldbetocharacterizetheenvironment. This process should be accomplished through an RF survey conducted by a reputable team specializing in RF system evaluation, and will establish the basis of scope for viable applications. This is done by identifying facility characteristicsthat impact wireless communications. Some of
these characteristics can be taken advantage of in thesystemdesignandotherswillrequireremediesaddressingNLOSshortcomings.
6. Designing new facilities for the integration of RF technologies
ThebestapproachtodesigningafacilitytobeRFsupportive can be summarized as the following:
1. establish the operating environment2. control the environment3. monitor the environment.
Generally,thebestofallenvironmentsfordeployinganRF-basedcommunicationsystemwouldbeafa-cilitythatemulatesanemptyFaraday cage [19] (Fig-ure 3). This would provide two of the most valuable attributesofanidealRFoperationalsituation—con-trolled electromagnetic radiation and no absorbing/reflectingobstructions.Obviously,thisfacilitycan-notexistandhaveanypracticalpurpose.
Basically, a Faraday cage is a metallic enclosureconnected to electrical ground that prevents the en-tryorescapeofanelectromagneticfield (EMF). Inthe real world of the RF application space, it is not practical todesignafacilitytobeaFaradaycage.However, to the first order, most nuclear facilities come close. This is because typical constructionconsists of concrete surfaces with rebar as reinforce-ment. All of the rebar is connected together and usu-allyconnected toearthground.Thiscanestablishan RF quiet environment, which is quite suitable for supporting a wide range of RF communications. Fig-ure3depictsasimplerepresentationoftheFaradaycage concept, which shows how reinforced con-cretesurfacescanapproximatethisconcept.
8
6. Designing new facilities for the integration of RF technologies
The best approach to designing a facility to be RF supportive can be summarized as the following:
1. establish the operating environment 2. control the environment 3. monitor the environment.
Generally, the best of all environments for deploying an RF-based communication system would be a facility that emulates an empty Faraday cage [19] (Figure 3). This would provide two of the most valuable attributes of an ideal RF operational situation—controlled electromagnetic radiation and no absorbing/reflecting obstructions. Obviously, this facility cannot exist and have any practical purpose. Basically, a Faraday cage is a metallic enclosure connected to electrical ground that prevents the entry or escape of an electromagnetic field (EMF). In the real world of the RF application space, it is not practical to design a facility to be a Faraday cage. However, to the first order, most nuclear facilities come close. This is because typical construction consists of concrete surfaces with rebar as reinforcement. All of the rebar is connected together and usually connected to earth ground. This can establish an RF quiet environment, which is quite suitable for supporting a wide range of RF communications. Figure 3 depicts a simple representation of the Faraday cage concept, which shows how reinforced concrete surfaces can approximate this concept. Other considerations that can be exploited during the design of a new facility are aspects such as the location of power outlets and Ethernet connections. These can be strategically located to support jump-off points from wired to wireless communications and active repeaters. Active repeaters are quite successful in changing NLOS [20] situations into LOS. To provide near-uniform RF coverage in expansive volumes filled with RF instrumented items, such as active seals or radiation monitors, distributed antenna systems could be integrated into the wall or ceiling designs. Consideration for utilizing non-conductive (good insulator) partitions for subdividing space can allow virtual LOS communication. Once the RF environment is established, it is significantly crucial to control the environment. In other words, it is important that unauthorized RF communications do not take place within the defined environment. This does not imply that other RF communications cannot occur within the area; however, the communications must be compatible with each other, typically operating on different frequency bands. Finally, the best pre-emptive effort to maintain reliable interference-free operation is to periodically monitor the RF emissions. This can be done by utilizing a real-time spectrum analyzer. Today, spectrum analyzers are readily available, handheld, and relatively low cost. Most manufacturers provide software packages that have the analysis tools needed to identify unexpected or unauthorized emission sources, by frequency and power, that could cause communications problems.
Figure 3: Simple representation of a Faraday Cage. Figure 3: SimplerepresentationofaFaradayCage.
Other considerations that can be exploited duringthedesignofanewfacilityareaspectssuchasthelocation of power outlets and Ethernet connections. Thesecanbestrategicallylocatedtosupportjump-off points from wired to wireless communications and active repeaters. Active repeaters are quite suc-
ESARDA BULLETIN, No. 38, June 2008
67
cessful inchangingNLOS[20]situationsintoLOS.Toprovidenear-uniformRFcoverageinexpansivevolumes filled with RF instrumented items, such as active seals or radiation monitors, distributed anten-nasystemscouldbeintegratedintothewallorceil-ingdesigns.Considerationforutilizingnon-conduc-tive (good insulator) partitions for subdividing space canallowvirtualLOScommunication.
OncetheRFenvironmentisestablished,itissignifi-cantly crucial to control the environment. In otherwords, it is important that unauthorized RF commu-nications do not take place within the defined envi-ronment.ThisdoesnotimplythatotherRFcommu-nicationscannotoccurwithinthearea;however,thecommunications must be compatible with each oth-er,typicallyoperatingondifferentfrequencybands.
Finally,thebestpre-emptiveefforttomaintainreli-able interference-free operation is to periodicallymonitortheRFemissions.Thiscanbedonebyuti-lizinga real-timespectrumanalyzer.Today,spec-trumanalyzersarereadilyavailable,handheld,andrelatively low cost. Most manufacturers providesoftware packages that have the analysis toolsneeded to identify unexpected or unauthorizedemission sources, by frequency and power, thatcould cause communications problems.
7. Summary and conclusions
It is clear that the use of wireless communication to transmit data derived from Safeguards instrumenta-tion has a number of advantages. The evolving na-tureinthewaynuclearfacilitiesareusedmeansthatitisquiteoftennecessarytomodifytheexistingin-frastructure. Working in a controlled area to install new cabling and equipment is often difficult, takes a significanttimetorealiseandiscertainlycostly.Thebenefit of wireless data transfer in terms of cost ef-fectiveness is plain to see, provided that a number of technical challenges can be demonstrated as be-ing overcome.
Thefirstrealchallengeisinthesecurityissuesre-lated to data. It is important that the issues related to a free air transmission of data are addressed and that only those persons authorized to exploit thedata can do so. This requirement is primordial as theimagescomingfromcamerasforexamplemayhave physical security considerations associatedwith them. TheOperator and National Authoritiesmustbeactivelyinvolvedinthedesignstageofthesystemtoensurethatnationalsecurityinterestsarenot compromised.
The second challenge relates to the effect on the installedOperatorsafetyorplantcontrolsystems,
often there are strict requirements related to the use ofanyemittingdevicebeinginstalledwithinthefa-cility. It isvital to take intoaccount thepossibilitythat a device could affect theSafetyCritical sys-tems. The importance of this concern should not be underestimated,asitisverydifficulttomodeltheinterferenceofadeviceonothersystems.ThelastthingtheOperatorwantstodiscoveristhatafaulthasbeencreatedduringarealemergency.Itisin-teresting to note that the use of mobile phones in aircraft is being reconsidered and they share thecommon concern noted above.
As a first approach the development of technical solutions which use wireless transmission of data within the facility is themost attractive. The datacould be collected at a consolidator node where it is then transmitted via a Local Area Network (LAN) to a central recording unit. This recording unit could then be used to transmit data to the Inspectors of-fice or Headquarters, via Virtual Private Network(VPN).Usingthisapproachitwouldbepossibletoutilize theOperator installedandmaintained infra-structure as part of the Safeguards infrastructure.
Another consideration is on the choice between customdesignedandbuiltversesCommercial-off-the-shelf(COTS)equipment.ItshouldbenotedthatInspectorateownedsystemsgenerallyhaveanop-erationallifeofbetween5and10years,dependingon the application. In the ‘real’ world technologycanchangeevery2to5yearssuchthatifwerelyonCOTSwemayveryquicklyhaveaproblemwithob-solescence. To train staff, (both technicians and in-spectors), replace instrumentation and obtain the necessaryauthorizationsforuseoversuchashorttimescale are probably beyond the capabilities ofthe Safeguards inspectorates at this moment in time.
TheuseofwirelesscommunicationsbySafeguardsauthoritieshasmanyattractions;thereisalsohow-ever a number of significant challenges which need tobeovercome.Itiscertainthatthistypeoftech-nologywillbecomemoremainstreaminthefutureand therefore easier to implement in nuclear facili-ties. The final solution however needs to be devel-oped in full transparencywith the key actors e.g.Inspectorates,NationalAuthoritiesandOperators.
K.Tolk,C.Versino(2007),Wireless Communications for Moni-toring Nuclear Material Processes – PART I: Context and Tech-nologies,ESARDABulletinNo.36,32-41
[2] K.Tolk,M.Aparo,C.Liguori,A.Capel(2006),Design of Safe-guards Equipment for Authentication,SymposiumonInterna-
[3] T.Karygiannis,B.Eydt,G.Barber,L.Bunn,T.Phillips(2006),Guidance for securing radio frequency identification (RFID) sys-tem, Recommendations of the National institute of standards andTechnology(NIST),SpecialPublication800-98.
[4] Special issue on RFID of ‘Multi-System & internet securitycookbook’,n°33,septembre2007,pp.28-67.
[12] B. Schoeneman, S. Blankenau (2005), Secure Sensor Platform (SSP) for Materials’ Sealing and Monitoring Applications,Proc.ofthe46thAnnualMeetingProc.oftheInstituteofNuclearMa-terials Management.
[20] Non line of sight propagation, http://en.wikipedia.org/wiki/Non-line-of-sight_propagation
ESARDA BULLETIN, No. 38, June 2008
69
Nuclear Mass Spectrometry
1. Objective of the technique
MassspectrometryisthemostcommonlyusedDe-structive Analysis (DA) technique in nuclear safe-guards for measuring the isotopic composition and isotopic amount content (concentration) of uranium, plutonium and other actinides in a sample.
2. Presentation of the technique
2.1. Principle of measurement / Definition of the physical principle
Forananalysisusingamassspectrometeragivensample is first
• introducedintotheionsource(byvarioustech-niques, e.g. gas flow,nebuliser, samplemaga-zine) and
• ionized (by various techniques, e.g. hot metalfilament, plasma, ion beam),
usingmagnetic and or electric field, or time-offlightsystem),and
• detected (by various techniques, e.g. FaradaycupsorSecondaryElectronMultiplier).
Dependingonthetypeofinstrumentandontheap-plication, the detected ion current intensities ob-tainedfromananalysedsamplecanbeusedtocal-culate the elemental or isotopic ratios of the sample from which the elemental or relative isotope abun-dances (isotopic composition) are derived.
Asanexample,inFig.1themassspectrumofanat-uraluraniumsampleisshown.Byrampingthemag-neticfieldstrength,themassrangefromm=233-239a.m.u (atomic mass unit) is scanned through a Fara-
Technical sheetsNUCLEAR MASS SPECTROMETRY
1. Objective of the Technique: Mass spectrometry is the most commonly used Destructive Analysis (DA) technique in nuclear safeguards for measuring the isotopic composition and isotopic amount content (concentration) of uranium, plutonium and other actinides in a sample.
2. Presentation of the Technique 2.1. Principle of measurement / Definition of the physical principle For an analysis using a mass spectrometer a given sample is first
introduced into the ion source (by various techniques, e.g. gas flow, nebuliser, sample magazine) and
ionized (by various techniques, e.g. hot metal filament, plasma, ion beam), The ions of the sample are then
accelerated (usually by high voltage), separated by mass (by various techniques, e.g. using magnetic and or electric field, or
time-of flight system), and detected (by various techniques, e.g. Faraday cups or Secondary Electron Multiplier).
Depending on the type of instrument and on the application, the detected ion current intensities obtained from an analysed sample can be used to calculate the elemental or isotopic ratios of the sample from which the elemental or relative isotope abundances (isotopic composition) are derived. As an example, in Fig.1 the mass spectrum of a natural uranium sample is shown. By ramping the magnetic field strength, the mass range from m=233-239 a.m.u (atomic mass unit) is scanned through a Faraday cup detector. The isotopic abundances are proportional to the measured ion currents displayed on the graph. The ion currents as measured for a sample of natural uranium are displayed in logarithmic scale, in order to cover the large dynamic range of the uranium isotopic abundances.
Fig.1: Mass Spectrum of Natural Uranium
Mass Spectrum of Natural Uranium
1.0E-15
1.0E-14
1.0E-13
1.0E-12
1.0E-11
1.0E-10
1.0E-09
233 234 235 236 237 238 239Isotope Mass (amu)
Ion
Cur
rent
(A) 235U/238U=0.00725
234U/238U=5.4x10-5 236U/238U 1x10-11
238U=Reference Peak
Mass Spectrum of Natural Uranium
1.0E-15
1.0E-14
1.0E-13
1.0E-12
1.0E-11
1.0E-10
1.0E-09
233 234 235 236 237 238 239Isotope Mass (amu)
Ion
Cur
rent
(A) 235U/238U=0.00725
234U/238U=5.4x10-5 236U/238U 1x10-11
238U=Reference Peak
Figure 1: Mass Spectrum of Natural Uranium.
ESARDA BULLETIN, No. 38, June 2008
70
day cup detector. The isotopic abundances areproportionaltothemeasuredioncurrentsdisplayedon the graph. The ion currents as measured for a sampleofnaturaluraniumaredisplayedinlogarith-micscale,inordertocoverthelargedynamicrangeof the uranium isotopic abundances.
Manynuclearmaterialsamplescontaindifferentel-ementswithisotopesofsimilarmass,forexample238U and 238Pu.Insuchcases,eitherthemassspec-trometer must have sufficient mass resolution to be able to distinguish between these isotopes, or the samplemustbetreatedchemically(e.g.byionex-changechromatography) to separate thedifferentelements prior to the mass spectrometric measure-ment.
A second complication in the application of mass spectrometry is the potential presence of massfractionation effects. These arise because different isotopes of the same element do not undergo the processes such as evaporation, ionisation and de-tection at the same rate, for given ion source condi-tions. Depending upon the mass spectrometer used and the procedures applied, mass fractionation ef-fects may need to be corrected for through themeasurement of certified standards and application of a correction factor derived from these standards to all results obtained.
The element amount (concentration) within the sam-plemaybecalculatedthroughaprocessknownasisotopedilutionmassspectrometry(IDMS,seebe-low). This involves the addition of a known amount ofoneparticularisotope(“spike”)oftheelementofinterest. By mass spectrometric determination ofthe isotopic composition of a sample before and af-ter the addition, the change in isotopic composition can be used to calculate the concentration of the element within the original sample.
2.2. Types of mass spectrometers
Inordertocovervariousanalyticalneedsabouthalfadozenofvariantsofmassspectrometryhavebeendeveloped using different combinations of ionisa-tion method, mass separation and detection. This has crystallized in a variety of instrument typeswhich are useful particularly for modern nuclearsafeguards:
• AMSacceleratormassspectrometry[1] is applied in particular, when large isotope abun-dance ratios are to bemeasured, for example236U/238U in natural uranium (Figure 1).
• ICPMS:inductivelycoupledplasmamassspec-trometry [2], is applied formeasuring elementswith high ionisation potential and asmulti-ele-
– ICP-QMS:quadrupole-ICPMS themostcommontypeofICP-MSinroutineelemental quantification. Applied for isotope ratio measurements when no high precision (better 0.1 % RSD) is required. Sometimesequipped with a reaction cell to resolve spec-tral interferences.
– ICP-SFMSsectorfieldICP-MS(alsoreferredtoasHR-ICPMS(highresolutionICPMS)) for ultra low level elemental quantification and isotope ratio measurements. A magnetic sec-tor field ICPMSenables isotope ratiomeas-urement with a precision better than ICP-QMS. The high resolution capabilities allow the resolution of spectral interferences up to a mass resolution of m/Δm of 12.000).
– MC-ICPMS:multi-collector-ICPMS allows simultaneous detection of several iso-topes, thus enabling high precision measure-ments. Modern instruments are equipped with higher mass resolution capabilities (m/Δm of about 4.000) for interference separation (see ICP-SFMS).
• GSMS: gas source mass spectrometry [3] isappliedforhighlyaccurateisotoperatiomeas-urements of gaseous samples, in particular for uranium hexafluoride UF6, an important com-pound in the enrichment process.
• RIMS resonance ionisation mass spectrometry[4] allows the selective ionisation of predefined spe-cieswithinamixtureofelements.RIMSmakesuse of lasers of defined wavelength for the selec-tive ionisation.
• SIMS:secondaryionmassspectrometry[5]allows isotope ratio measurements of individual particles and has found widespread application inparticleanalysisforsafeguards.
• TIMS: thermal ionizationmassspectrometry [6] is themostwidely appliedanalytical techniqueforanalysingsamplesofnuclearmaterial.
A more comprehensive publication about isotope massspectrometryisgivenin[7].
2.3. Analytical tasks in nuclear mass spectrometry and associated types of mass spectrometers
• Elementalabundances: these are most frequent-lydeterminedusingTIMSorICPMSincombina-tion with IDMS (Isotope dilution mass spectrom-
ESARDA BULLETIN, No. 38, June 2008
71
etry [8]: sample ismixedwithcertified isotopicspike, the change in isotopic composition is used to determine elemental amount content)
• Isotopic amount content (isotopic assay): most commonly determined using TIMS, ICPMS,RIMS, in combination with IDMS (Isotope dilu-tionmassspectrometry)
• Isotopeabundance ratios: done using all mass spectrometer types mentioned in section 2.2.,but for particular tasks/sample types particulartypesarebeingusedpreferentially,seetablebe-low:
Foralmostallinstrumenttypesandtechniques,cer-tified reference materials are needed for instrument calibrationand/orqualitycontrol.Inparticular,theymayberequiredinordertocorrectformassfrac-tionation effects. Reference materials certified for isotopic amount content and/or isotopic abundance ratios can be obtained from laboratories specialised in their certification, including the IRMM (http://www.irmm.jrc.be/html/homepage.htm) or NBL(http://www.nbl.doe.gov ).
1 inTIMSusuallybytotalevaporation,tominimizemassfractionationeffects2 AMS has the lowest possible background for 236U3 limited capabilities4 in GSMS using double standard method
ESARDA BULLETIN, No. 38, June 2008
72
31st ESARDA annual meetingVilnius, Lithuania26-28 May, 2009
The 31stESARDAAnnualMeetingwillbeasympo-siumon“SafeguardsandNuclearMaterialManage-ment”. Itwill be held inVilnius, Lithuania, 26-28 May 2009.
Thissymposiumwillbeanopportunityforresearchorganisations, safeguards authorities and nuclear plantoperatorstoexchangeinformationonnewas-pectsofinternationalsafeguardsandnon-prolifera-tionrecentdevelopmentsinsafeguards-relatedre-search activities and their implications for the safeguardscommunity.
Thesymposiumisanticipatedtoincludeanumberofcontributions from internationally-renownedau-thorities in the field.
The following two themes will give direction to the symposium:
• IntegratedsafeguardsandachangingEurope
• Euratomsafeguardsinaglobalcontext
Contributions may cover but are not necessarilylimited to the following topics / disciplines:
• Safeguards concepts (policies, perspectives,limitations, Strengthened and Integrated Safe-guards,StateandRegionalSystems,QualityAs-surance Approach)
• Euratom system: Beyond State level approach(European Union level approach)
• Nuclearsafeguardsimplementation:experience,evaluation; plant specific experience on tech-niques, inspections and operations
• Experience in the implementation of Strength-enedSafeguardssystemsand IntegratedSafe-guards
• Non-proliferationandfutureissues(Cut-offTrea-ty, CTBT and disarmament, excess materials,sub/cross-nationalthreats,etc.)
The abstracts will form the basis for accepting or rejectingcontributionsandallocationbetweenpa-perandpostersessions.TheTechnicalProgrammeCommittee will decide whether or not an accepted
paper will be presented as an oral presentation or as a poster. Authors will be informed of their deci-sionsbytheendofFebruary2009.Thecompendi-um of the accepted abstracts will be available on the ESARDA website and distributed at the meet-ing.
Bysendinganabstract,theauthorsagreetosubmita paper suitable for inclusion in the symposium’sproceedingsandtopresentthatpaperatthesym-posium. The authors are requested to follow the “instructions for authors” available on the ES-ARDA web site for presenting abstracts and full contributions. Final papers / posters must be sub-mittedinelectronicformat(e-mail).
Papers must be submitted electronically no later than: 15 May 2009
The Editorial Committee reserves the right to decline to accept any abstract or paper
Adequate space can be arranged for commercial presentations /exhibitions.For further informationoncommercialdisplays,pleasecontactdirectlythesymposiumsecretariat.
Registration forms,acopyof theprogrammeandfurther information about the meeting will be avail-ableontheESARDAweb-siteinduecourse:
www.jrc.ec.europa.eu/esarda
Call for papers
ESARDA BULLETIN, No. 38, June 2008
74
Sergio Finzi
The ESARDA Secretariat was informed that Sergio Finzi, ESARDA chairman from 1983to1985,passedawayinFebruary2008.
SergioFinziwasbornin1928.HejoinedtheEuropeanCommissionin1960,afterafewyearsspentworking in industry (EDISON,AGIPNucleare)andasAssistant toProfessorSilvestriatthePolitecnicoofMilan.InIspra,hefirstworkedintheDivisionofNuclearTechnology.In1965hewasnominatedDirectoroftheEngineeringDepart-ment,andthenoftheProgrammeManagement.In1974heservedasadinterimDi-rector General of the Ispra site. Until 1982, he was Director of the Applied Science andTechnologyDepartment.InBrussels,hebecameDirectorforNuclearSafetyRe-search(DGXII)first,andthenDirectorforNuclearSafety(DGXI).