Page 1
TABLE OF CONTENTS
EDUCATION
Department of Education ................................................................................................ E 1State Library.................................................................................................................... E 20California State Summer School for the Arts ................................................................ E 25California Occupational Information Coordinating Committee .................................... E 25Commission on Teacher Credentialing........................................................................... E 26California Postsecondary Education Commission ......................................................... E 29University of California .................................................................................................. E 30Hastings College of the Law.......................................................................................... E 45The California State University...................................................................................... E 46Board of Governors of the California Community Colleges ........................................ E 65Student Aid Commission ................................................................................................ E 70
Page 2
Executive Branch
Superintendent of Public Instruction and Directorof Education:
Supt Pub Inst.............................................. 1 1 1 $11,688 $140,256 $140,256Educational Advr to Supt .......................... 1 1 1 7,162–7,746 92,952 92,952Strategic Advr to Supt ............................... 1 1 1 6,832–7,388 88,656 88,656Director-Communications.......................... 1 1 1 6,213–6,719 80,628 80,628Educ Administrator I ................................. 0.8 1 1 5,443–6,618 79,416 79,416Adm Asst II................................................ 1 1 1 3,764–4,576 54,912 54,912Assoc Govtl Prog Analyst ......................... 1 1 1 3,764–4,576 51,180 53,544Info Ofcr I-Spec......................................... 1 1 1 3,764–4,576 54,912 54,912Special Asst to Supt................................... 0.9 1 1 3,786–4,567 45,432 47,700Staff Svcs Analyst-Gen.............................. 1.8 3 3 2,411–3,805 108,481 113,912Exec Asst.................................................... 1 1 1 2,813–3,419 44,156 44,156Ofc Techn-Typing ...................................... 1.9 3 3 2,258–2,745 82,531 86,665Ofc Asst-Typing......................................... 1 2 2 1,835–2,370 48,792 51,228Temporary Help ......................................... 0.6 0.3 0.3 (19,762) 19,762 19,762Overtime..................................................... – – – (53,368) 53,368 53,368
Totals ................................................... 15.0 18.3 18.3 $917,246 $1,045,434 $1,062,067
Executive Management:Chief Deputy-Accountability andAdministration:
Dep Supt-Pub Inst-Fiscal........................... 1 1 1 8,347–9,027 108,324 108,324Educ Prog Consultant ................................ 0.9 1 1 4,898–5,951 71,412 71,412Educ Fiscal Svcs Consultant ..................... – 0.5 0.5 4,898–5,951 29,388 30,858Exec Asst.................................................... 1 1 1 2,813–3,419 44,156 44,156Temporary Help ......................................... 0.3 0.2 0.2 (10,542) 10,542 10,542
Chief Deputy-Policy and Programs:Educ Administrator I ................................. 0.7 1 1 5,443–6,618 77,484 79,188Educ Prog Consultant ................................ 1.1 2 2 4,898–5,951 130,188 133,128Staff Svcs Analyst-Gen.............................. 0.1 1 1 2,411–3,805 33,041 34,601Exec Asst.................................................... 1 1 1 2,813–3,419 43,084 43,084Ofc Techn-Typing ...................................... 0.9 – – 2,258–2,745 – –Ofc Asst-Typing......................................... – 1 1 1,835–2,370 24,000 25,200Temporary Help ......................................... 0.1 – – (2,474) 2,474 2,474
Totals ................................................... 7.1 9.7 9.7 $436,059 $574,093 $582,967
State Board of Education:Exec Director ............................................. 1 1 1 8,347–9,027 105,000 105,000Staff Counsel, SBE.................................... 1 1 1 6,988–8,458 101,496 101,496Asst Exec Director, SBE ........................... – 1 1 6,213–6,719 78,000 78,000Educ Prog Consultant ................................ 0.3 1 1 4,898–5,951 58,776 61,716Prog Analyst............................................... 0.5 1 1 3,786–4,567 45,432 47,700Educ Policy Consultant ............................ 0.5 2 2 3,024–3,675 72,727 76,359Exec Asst.................................................... 0.8 1 1 2,813–3,419 42,852 42,852Exec Secty I............................................... – 1 1 2,585–3,142 31,020 32,568Ofc Techn-Typing ...................................... 1.8 1 1 2,258–2,745 32,940 32,940Temporary Help ......................................... 1.3 0.7 0.7 (43,076) 43,076 43,076Overtime..................................................... – – – (816) 816 816
Totals ................................................... 7.2 10.7 10.7 $410,819 $612,135 $622,523
Totals, Executive Branch ................... 29.3 38.7 38.7 $1,764,124 $2,231,662 $2,267,557
Child, Youth and Family Services Branch
Child, Youth and Family Services BranchManagement:
C.E.A. III ................................................... 1 1 1 7,354–8,108 97,296 97,296Educ Prog Consultant ................................ 0.9 1 1 4,898–5,951 58,776 61,716Exec Asst.................................................... 1 1 1 2,813–3,419 41,028 41,028Overtime..................................................... – – – (274) 274 274
Totals ................................................... 2.9 3.0 3.0 $201,354 $197,374 $200,314
Learning Support and Partnership Division
Learning Support and Partnership DivisionManagement:
C.E.A. II..................................................... 1 1 1 6,687–7,373 88,477 88,477Assoc Govtl Prog Analyst ......................... 0.7 1 1 3,764–4,576 54,912 54,912Exec Secty I............................................... 1 1 1 2,585–3,142 33,488 35,160
SALARY RANGE
EDUCATION E 1
6100 DEPARTMENT OF EDUCATION
ORGANIZATIONAL UNIT NUMBER OF POSITIONS EXPENDITURES
Filled Authorized Proposed Actual Estimated ProposedClassification 1999–00 2000–01 2001–02 1999–00 2000–01 2001–02
123456789
1011121314151617181920212223242526272829303132333435363738394041424344454647484950515253545556575859606162636465666768697071727374757677787980
59—38270
Page 3
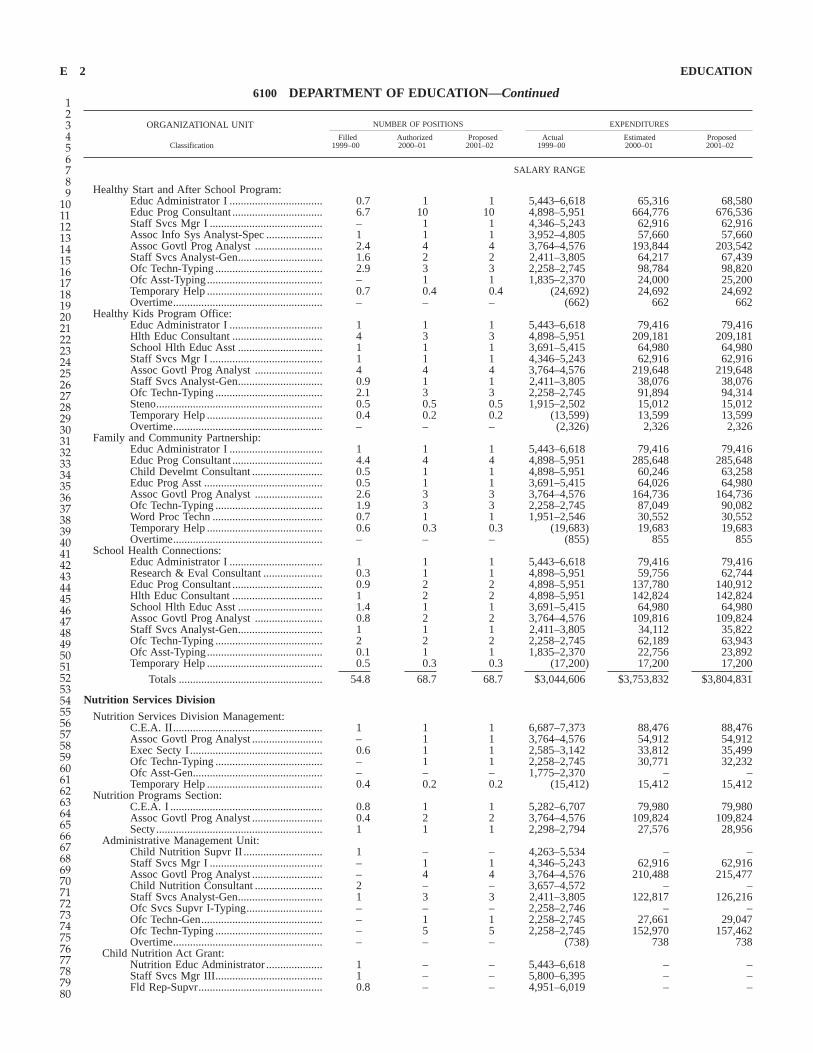
Healthy Start and After School Program:Educ Administrator I ................................. 0.7 1 1 5,443–6,618 65,316 68,580Educ Prog Consultant ................................ 6.7 10 10 4,898–5,951 664,776 676,536Staff Svcs Mgr I ........................................ – 1 1 4,346–5,243 62,916 62,916Assoc Info Sys Analyst-Spec .................... 1 1 1 3,952–4,805 57,660 57,660Assoc Govtl Prog Analyst ........................ 2.4 4 4 3,764–4,576 193,844 203,542Staff Svcs Analyst-Gen.............................. 1.6 2 2 2,411–3,805 64,217 67,439Ofc Techn-Typing ...................................... 2.9 3 3 2,258–2,745 98,784 98,820Ofc Asst-Typing......................................... – 1 1 1,835–2,370 24,000 25,200Temporary Help ......................................... 0.7 0.4 0.4 (24,692) 24,692 24,692Overtime..................................................... – – – (662) 662 662
Healthy Kids Program Office:Educ Administrator I ................................. 1 1 1 5,443–6,618 79,416 79,416Hlth Educ Consultant ................................ 4 3 3 4,898–5,951 209,181 209,181School Hlth Educ Asst .............................. 1 1 1 3,691–5,415 64,980 64,980Staff Svcs Mgr I ........................................ 1 1 1 4,346–5,243 62,916 62,916Assoc Govtl Prog Analyst ........................ 4 4 4 3,764–4,576 219,648 219,648Staff Svcs Analyst-Gen.............................. 0.9 1 1 2,411–3,805 38,076 38,076Ofc Techn-Typing ...................................... 2.1 3 3 2,258–2,745 91,894 94,314Steno........................................................... 0.5 0.5 0.5 1,915–2,502 15,012 15,012Temporary Help ......................................... 0.4 0.2 0.2 (13,599) 13,599 13,599Overtime..................................................... – – – (2,326) 2,326 2,326
Family and Community Partnership:Educ Administrator I ................................. 1 1 1 5,443–6,618 79,416 79,416Educ Prog Consultant ................................ 4.4 4 4 4,898–5,951 285,648 285,648Child Develmt Consultant ......................... 0.5 1 1 4,898–5,951 60,246 63,258Educ Prog Asst .......................................... 0.5 1 1 3,691–5,415 64,026 64,980Assoc Govtl Prog Analyst ........................ 2.6 3 3 3,764–4,576 164,736 164,736Ofc Techn-Typing ...................................... 1.9 3 3 2,258–2,745 87,049 90,082Word Proc Techn ....................................... 0.7 1 1 1,951–2,546 30,552 30,552Temporary Help ......................................... 0.6 0.3 0.3 (19,683) 19,683 19,683Overtime..................................................... – – – (855) 855 855
School Health Connections:Educ Administrator I ................................. 1 1 1 5,443–6,618 79,416 79,416Research & Eval Consultant ..................... 0.3 1 1 4,898–5,951 59,756 62,744Educ Prog Consultant ................................ 0.9 2 2 4,898–5,951 137,780 140,912Hlth Educ Consultant ................................ 1 2 2 4,898–5,951 142,824 142,824School Hlth Educ Asst .............................. 1.4 1 1 3,691–5,415 64,980 64,980Assoc Govtl Prog Analyst ........................ 0.8 2 2 3,764–4,576 109,816 109,824Staff Svcs Analyst-Gen.............................. 1 1 1 2,411–3,805 34,112 35,822Ofc Techn-Typing ...................................... 2 2 2 2,258–2,745 62,189 63,943Ofc Asst-Typing......................................... 0.1 1 1 1,835–2,370 22,756 23,892Temporary Help ......................................... 0.5 0.3 0.3 (17,200) 17,200 17,200
Totals ................................................... 54.8 68.7 68.7 $3,044,606 $3,753,832 $3,804,831
Nutrition Services Division
Nutrition Services Division Management:C.E.A. II..................................................... 1 1 1 6,687–7,373 88,476 88,476Assoc Govtl Prog Analyst ......................... – 1 1 3,764–4,576 54,912 54,912Exec Secty I............................................... 0.6 1 1 2,585–3,142 33,812 35,499Ofc Techn-Typing ...................................... – 1 1 2,258–2,745 30,771 32,232Ofc Asst-Gen.............................................. – – – 1,775–2,370 – –Temporary Help ......................................... 0.4 0.2 0.2 (15,412) 15,412 15,412
Nutrition Programs Section:C.E.A. I ...................................................... 0.8 1 1 5,282–6,707 79,980 79,980Assoc Govtl Prog Analyst ......................... 0.4 2 2 3,764–4,576 109,824 109,824Secty........................................................... 1 1 1 2,298–2,794 27,576 28,956
Administrative Management Unit:Child Nutrition Supvr II ............................ 1 – – 4,263–5,534 – –Staff Svcs Mgr I ........................................ – 1 1 4,346–5,243 62,916 62,916Assoc Govtl Prog Analyst ......................... – 4 4 3,764–4,576 210,488 215,477Child Nutrition Consultant ........................ 2 – – 3,657–4,572 – –Staff Svcs Analyst-Gen.............................. 1 3 3 2,411–3,805 122,817 126,216Ofc Svcs Supvr I-Typing........................... – – – 2,258–2,746 – –Ofc Techn-Gen........................................... – 1 1 2,258–2,745 27,661 29,047Ofc Techn-Typing ...................................... – 5 5 2,258–2,745 152,970 157,462Overtime..................................................... – – – (738) 738 738
Child Nutrition Act Grant:Nutrition Educ Administrator .................... 1 – – 5,443–6,618 – –Staff Svcs Mgr III...................................... 1 – – 5,800–6,395 – –Fld Rep-Supvr............................................ 0.8 – – 4,951–6,019 – –
SALARY RANGE
EDUCATIONE 2
6100 DEPARTMENT OF EDUCATION—Continued
ORGANIZATIONAL UNIT NUMBER OF POSITIONS EXPENDITURES
Filled Authorized Proposed Actual Estimated ProposedClassification 1999–00 2000–01 2001–02 1999–00 2000–01 2001–02
123456789
1011121314151617181920212223242526272829303132333435363738394041424344454647484950515253545556575859606162636465666768697071727374757677787980
Page 4
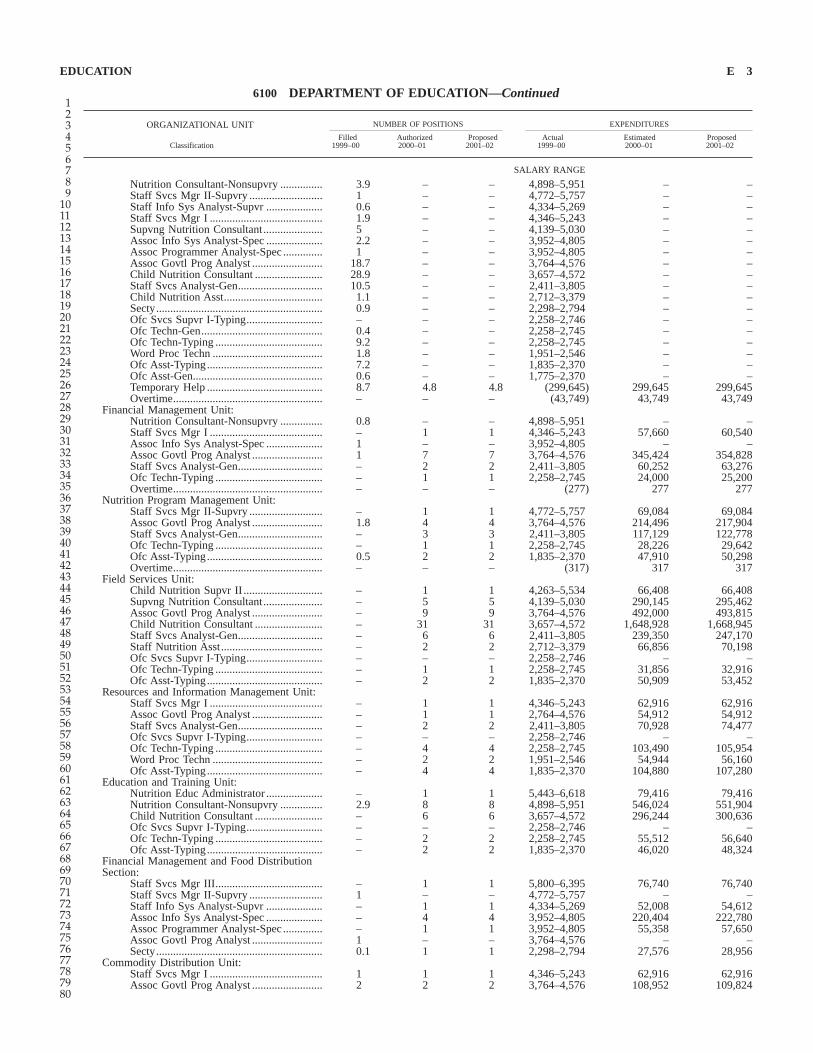
Nutrition Consultant-Nonsupvry ............... 3.9 – – 4,898–5,951 – –Staff Svcs Mgr II-Supvry .......................... 1 – – 4,772–5,757 – –Staff Info Sys Analyst-Supvr .................... 0.6 – – 4,334–5,269 – –Staff Svcs Mgr I ........................................ 1.9 – – 4,346–5,243 – –Supvng Nutrition Consultant..................... 5 – – 4,139–5,030 – –Assoc Info Sys Analyst-Spec .................... 2.2 – – 3,952–4,805 – –Assoc Programmer Analyst-Spec .............. 1 – – 3,952–4,805 – –Assoc Govtl Prog Analyst ......................... 18.7 – – 3,764–4,576 – –Child Nutrition Consultant ........................ 28.9 – – 3,657–4,572 – –Staff Svcs Analyst-Gen.............................. 10.5 – – 2,411–3,805 – –Child Nutrition Asst................................... 1.1 – – 2,712–3,379 – –Secty........................................................... 0.9 – – 2,298–2,794 – –Ofc Svcs Supvr I-Typing........................... – – – 2,258–2,746 – –Ofc Techn-Gen........................................... 0.4 – – 2,258–2,745 – –Ofc Techn-Typing ...................................... 9.2 – – 2,258–2,745 – –Word Proc Techn ....................................... 1.8 – – 1,951–2,546 – –Ofc Asst-Typing......................................... 7.2 – – 1,835–2,370 – –Ofc Asst-Gen.............................................. 0.6 – – 1,775–2,370 – –Temporary Help ......................................... 8.7 4.8 4.8 (299,645) 299,645 299,645Overtime..................................................... – – – (43,749) 43,749 43,749
Financial Management Unit:Nutrition Consultant-Nonsupvry ............... 0.8 – – 4,898–5,951 – –Staff Svcs Mgr I ........................................ – 1 1 4,346–5,243 57,660 60,540Assoc Info Sys Analyst-Spec .................... 1 – – 3,952–4,805 – –Assoc Govtl Prog Analyst ......................... 1 7 7 3,764–4,576 345,424 354,828Staff Svcs Analyst-Gen.............................. – 2 2 2,411–3,805 60,252 63,276Ofc Techn-Typing ...................................... – 1 1 2,258–2,745 24,000 25,200Overtime..................................................... – – – (277) 277 277
Nutrition Program Management Unit:Staff Svcs Mgr II-Supvry .......................... – 1 1 4,772–5,757 69,084 69,084Assoc Govtl Prog Analyst ......................... 1.8 4 4 3,764–4,576 214,496 217,904Staff Svcs Analyst-Gen.............................. – 3 3 2,411–3,805 117,129 122,778Ofc Techn-Typing ...................................... – 1 1 2,258–2,745 28,226 29,642Ofc Asst-Typing......................................... 0.5 2 2 1,835–2,370 47,910 50,298Overtime..................................................... – – – (317) 317 317
Field Services Unit:Child Nutrition Supvr II ............................ – 1 1 4,263–5,534 66,408 66,408Supvng Nutrition Consultant..................... – 5 5 4,139–5,030 290,145 295,462Assoc Govtl Prog Analyst ......................... – 9 9 3,764–4,576 492,000 493,815Child Nutrition Consultant ........................ – 31 31 3,657–4,572 1,648,928 1,668,945Staff Svcs Analyst-Gen.............................. – 6 6 2,411–3,805 239,350 247,170Staff Nutrition Asst.................................... – 2 2 2,712–3,379 66,856 70,198Ofc Svcs Supvr I-Typing........................... – – – 2,258–2,746 – –Ofc Techn-Typing ...................................... – 1 1 2,258–2,745 31,856 32,916Ofc Asst-Typing......................................... – 2 2 1,835–2,370 50,909 53,452
Resources and Information Management Unit:Staff Svcs Mgr I ........................................ – 1 1 4,346–5,243 62,916 62,916Assoc Govtl Prog Analyst ......................... – 1 1 2,764–4,576 54,912 54,912Staff Svcs Analyst-Gen.............................. – 2 2 2,411–3,805 70,928 74,477Ofc Svcs Supvr I-Typing........................... – – – 2,258–2,746 – –Ofc Techn-Typing ...................................... – 4 4 2,258–2,745 103,490 105,954Word Proc Techn ....................................... – 2 2 1,951–2,546 54,944 56,160Ofc Asst-Typing......................................... – 4 4 1,835–2,370 104,880 107,280
Education and Training Unit:Nutrition Educ Administrator .................... – 1 1 5,443–6,618 79,416 79,416Nutrition Consultant-Nonsupvry ............... 2.9 8 8 4,898–5,951 546,024 551,904Child Nutrition Consultant ........................ – 6 6 3,657–4,572 296,244 300,636Ofc Svcs Supvr I-Typing........................... – – – 2,258–2,746 – –Ofc Techn-Typing ...................................... – 2 2 2,258–2,745 55,512 56,640Ofc Asst-Typing......................................... – 2 2 1,835–2,370 46,020 48,324
Financial Management and Food DistributionSection:
Staff Svcs Mgr III...................................... – 1 1 5,800–6,395 76,740 76,740Staff Svcs Mgr II-Supvry .......................... 1 – – 4,772–5,757 – –Staff Info Sys Analyst-Supvr .................... – 1 1 4,334–5,269 52,008 54,612Assoc Info Sys Analyst-Spec .................... – 4 4 3,952–4,805 220,404 222,780Assoc Programmer Analyst-Spec .............. – 1 1 3,952–4,805 55,358 57,650Assoc Govtl Prog Analyst ......................... 1 – – 3,764–4,576 – –Secty........................................................... 0.1 1 1 2,298–2,794 27,576 28,956
Commodity Distribution Unit:Staff Svcs Mgr I ........................................ 1 1 1 4,346–5,243 62,916 62,916Assoc Govtl Prog Analyst ......................... 2 2 2 3,764–4,576 108,952 109,824
SALARY RANGE
EDUCATION E 3
6100 DEPARTMENT OF EDUCATION—Continued
ORGANIZATIONAL UNIT NUMBER OF POSITIONS EXPENDITURES
Filled Authorized Proposed Actual Estimated ProposedClassification 1999–00 2000–01 2001–02 1999–00 2000–01 2001–02
123456789
1011121314151617181920212223242526272829303132333435363738394041424344454647484950515253545556575859606162636465666768697071727374757677787980
Page 5
Child Nutrition Consultant ........................ 1.6 2 2 3,657–4,572 100,212 102,480Staff Svcs Analyst-Gen.............................. 2 2 2 2,411–3,805 72,099 75,707Supvng Acct Clk II.................................... 1 1 1 2,874–3,495 41,940 41,940Ofc Techn-Typing ...................................... 3.5 3 3 2,258–2,745 93,268 94,808Sr Acct Clk ................................................ 2 2 2 2,258–2,745 64,796 65,856Acct Clk II ................................................. 1.8 3 3 2,023–2,461 81,464 84,060Ofc Asst-Typing......................................... 1.5 1 1 1,835–2,370 24,098 25,302Temporary Help ......................................... 0.9 0.5 0.5 (31,447) 31,447 31,447
Food Distribution Unit:Staff Svcs Mgr II-Supvry .......................... – 1 1 4,772–5,757 69,084 69,084Staff Info Sys Analyst-Spec ...................... 0.1 1 1 4,334–5,269 52,008 54,612Staff Svcs Mgr I ........................................ 0.6 1 1 4,346–5,243 52,152 54,756Assoc Govtl Prog Analyst ......................... 3.9 3 3 3,764–4,576 164,736 164,736Ofc Techn-Typing ...................................... 1 1 1 2,258–2,745 32,940 32,940Acct Clk II ................................................. 0.1 – – 2,023–2,461 – –Overtime..................................................... – – – (1,037) 1,037 1,037
Pomona Distribution Center:Asst Info Sys Analyst ................................ 1 1 1 2,658–3,995 47,940 47,940Warehouse Mgr I ....................................... 1 1 1 2,992–3,948 43,140 43,140Materials & Stores Supvr .......................... 1 1 1 2,726–3,595 39,324 39,324Auto Equipt Opr II .................................... 1 1 1 2,856–3,433 37,584 37,584Heavy Truck Driver................................... 2 3 3 2,726–3,276 104,520 106,152Ofc Svcs Supvr II-Gen .............................. 1 1 1 2,527–3,072 36,864 36,864Warehouse Worker ..................................... 4 6 6 2,462–2,927 189,060 192,084Ofc Techn-Typing ...................................... 1 1 1 2,258–2,745 27,096 28,452Sr Acct Clk ................................................ 1 1 1 2,258–2,745 32,940 32,940Acct Clk II ................................................. 2.9 3 3 2,023–2,461 88,336 88,594Temporary Help ......................................... 1.3 0.7 0.7 (44,123) 44,123 44,123Overtime..................................................... – – – (68,154) 68,154 68,154
Sacramento Distribution Center:Staff Svcs Mgr I ........................................ 1 1 1 4,346–5,243 62,916 62,916Asst Info Sys Analyst ................................ 1 1 1 2,658–3,995 47,940 47,940Warehouse Mgr I ....................................... 1 1 1 2,992–3,948 35,904 37,704Heavy Equipt Mechanic ............................ 1 1 1 3,201–3,857 42,156 42,156Materials & Stores Supvr .......................... 1 1 1 2,726–3,595 39,324 39,324Auto Equipt Opr II .................................... 0.9 1 1 2,856–3,433 37,584 37,584Heavy Truck Driver................................... 5.5 9 9 2,726–3,276 313,560 318,456Ofc Svcs Supvr II-Gen .............................. – 1 1 2,527–3,072 30,324 31,836Warehouse Worker ..................................... 3.6 6 6 2,462–2,927 187,218 191,754Ofc Techn-Typing ...................................... 1 1 1 2,258–2,745 32,940 32,940Sr Acct Clk ................................................ 2 2 2 2,258–2,745 64,284 65,856Acct Clk II ................................................. 2 2 2 2,023–2,461 59,064 59,064Temporary Help ......................................... 4.5 2.5 2.5 (154,777) 154,777 154,777Overtime..................................................... – – – (47,042) 47,042 47,042
Totals ................................................... 189.4 220.7 220.7 $8,698,203 $10,087,609 $10,248,613
Child Development Division:C.E.A. II..................................................... 1 1 1 6,687–7,373 83,388 83,388Educ Administrator I ................................. 3.6 4 4 5,443–6,618 308,412 311,676Educ Prog Consultant ................................ 1 1 1 4,898–5,951 71,412 71,412Child Develmt Consultant 1....................... 23.3 34 34 4,898–5,951 2,275,131 2,322,063Sr Info Sys Analyst Supvr......................... 1 – – 4,762–5,794 – –Child Develmt Asst 2 ................................. 3.2 3 2 3,691–5,415 132,876 93,024Staff Svcs Mgr I ........................................ 1 1 1 4,346–5,243 59,595 61,971Ops Research Spec II ................................ 0.2 – – 4,042–4,913 – –Assoc Info Sys Analyst-Spec .................... 0.2 – – 3,952–4,805 – –Assoc Govtl Prog Analyst ......................... 7.5 9 9 3,764–4,576 481,044 485,886Asst Info Sys Analyst ................................ 0.8 – – 2,658–3,995 – –Staff Svcs Analyst-Gen 1 ........................... 3.5 8 8 2,411–3,805 297,517 307,853Educ Consultant......................................... 0.3 – – 2,823–3,450 – –Exec Secty I............................................... 0.8 1 1 2,585–3,142 31,020 32,568Info Sys Techn ........................................... 0.4 – – 2,122–3,046 – –Ofc Techn-Typing ...................................... 8.9 9 9 2,258–2,745 282,475 287,852Ofc Asst-Typing......................................... 1.8 4 4 1,835–2,370 101,640 105,240Ofc Asst-Gen.............................................. 1.3 1 1 1,775–2,370 28,440 28,440Temporary Help ......................................... 2.3 1.3 1.3 (78,719) 78,719 78,719Overtime..................................................... – – – (6,512) 6,512 6,512
Totals ................................................... 62.1 77.3 76.3 $3,513,610 $4,238,181 $4,276,604
CYFS Branch Management Systems:Director, Mgt Sys Analysis Ofc ................ 1 1 1 6,213–6,719 78,288 80,628Child Develmt Consultant 3....................... 0.1 1 – 4,898–5,951 58,776 –
SALARY RANGE
EDUCATIONE 4
6100 DEPARTMENT OF EDUCATION—Continued
ORGANIZATIONAL UNIT NUMBER OF POSITIONS EXPENDITURES
Filled Authorized Proposed Actual Estimated ProposedClassification 1999–00 2000–01 2001–02 1999–00 2000–01 2001–02
123456789
1011121314151617181920212223242526272829303132333435363738394041424344454647484950515253545556575859606162636465666768697071727374757677787980
Page 6
Sr Info Sys Analyst Supvr......................... – 1 1 4,762–5,794 69,528 69,528Research Prog Spec II ............................... – – – 4,542–5,520 – –Ops Research Spec II ................................ – 1 1 4,042–4,913 48,504 50,928Assoc Info Sys Analyst-Spec .................... – 2 2 3,952–4,805 94,848 99,600Assoc Programmer Analyst-Spec 3 ........... 0.1 1 – 3,952–4,805 49,998 –Research Analyst II-Gen 3 ......................... 0.1 2 1 3,952–4,805 104,879 49,800Assoc Govtl Prog Analyst ......................... 0.9 1 1 3,764–4,576 54,912 54,912Asst Info Sys Analyst ................................ 0.3 2 2 2,658–3,995 70,527 74,043Info Sys Techn ........................................... 0.2 – – 2,122–3,046 – –Ofc Svcs Suypvr I-Typing......................... – – – 2,258–2,746 – –Ofc Techn-Typing ...................................... 1.2 3 3 2,258–2,745 87,913 89,314Temporary Help ......................................... 0.4 0.2 0.2 (12,398) 12,398 12,398Overtime..................................................... – – – (4,239) 4,239 4,239
Totals ................................................... 4.3 15.2 12.2 $212,884 $734,810 $585,390
Totals, Child, Youth and FamilyServices Branch................................... 313.5 384.9 380.9 $15,670,657 $19,011,806 $19,115,752
Finance, Technology and Information ServicesBranch
Finance, Technology and Information ServicesBranch Management:
Chief Dep Supt-Pub Inst ........................... 0.2 – – 7,517–8,131 – –Educ Prog Asst .......................................... 0.2 – – 3,691–5,415 – –Exec Asst.................................................... 0.2 – – 2,813–3,419 – –Temporary Help ......................................... 1.3 0.7 0.7 (44,296) 44,296 44,296
Totals ................................................... 1.9 0.7 0.7 $77,315 $44,296 $44,296
Totals, Finance, Technology andInformation Services Branch .............. 1.9 0.7 0.7 $77,315 $44,296 $44,296
Finance, Technology and Administration Branch
Finance, Technology and Administration BranchManagement:
C.E.A. IV ................................................... 1 1 1 7,716–8,505 102,060 102,060Educ Prog Consultant ................................ 0.8 1 1 4,898–5,951 71,412 71,412Staff Svcs Analyst-Gen.............................. 0.4 1 1 2,411–3,805 41,871 43,963Exec Asst.................................................... 1.4 1 1 2,813–3,419 35,630 37,416
Totals ................................................... 3.6 4.0 4.0 $228,054 $250,973 $254,851
Personnel Services Division:Labor Relations Mgr I............................... 1 1 1 5,282–6,825 69,896 69,900C.E.A. I ...................................................... 0.9 1 1 5,282–6,707 63,384 66,552Staff Svcs Mgr II-Supvry .......................... 1 1 1 4,772–5,757 69,084 69,084Staff Svcs Mgr I ........................................ 1 1 1 4,346–5,243 62,916 62,916Trng Ofcr II ............................................... 1 1 1 4,346–5,243 62,916 62,916Labor Relations Analyst ............................ 1 1 1 3,766–4,578 54,936 54,936Assoc Pers Analyst .................................... 8.8 9 9 3,764–4,576 483,810 486,720Trng Ofcr I................................................. 1 1 1 3,764–4,576 54,912 54,912Staff Svcs Analyst-Gen 4 ........................... 1.6 6 6 2,411–3,805 194,474 204,232Pers Svcs Supvr II ..................................... 1 1 1 3,119–3,792 45,504 45,504Pers Svcs Supvr I ...................................... – 1 1 2,865–3,485 41,820 41,820Pers Svcs Spec II....................................... 2 1 1 2,863–3,480 41,760 41,760Pers Svcs Spec I ........................................ 5.9 6 6 2,226–3,222 212,661 219,052Exec Secty I............................................... 1 1 1 2,585–3,142 34,486 36,214Info Sys Techn ........................................... 1 1 1 2,122–3,046 36,432 36,552Ofc Techn-Typing ...................................... 4.1 5 5 2,258–2,745 148,183 153,941Pers Selection Techn.................................. 0.3 1 1 1,951–2,745 23,412 24,588Ofc Asst-Typing......................................... 1.1 1 1 1,835–2,370 24,000 25,200Temporary Help ......................................... 2.4 1.3 1.3 (81,414) 81,414 81,414Overtime..................................................... – – – (5,370) 5,370 5,370
Totals ................................................... 36.1 41.3 41.3 $1,635,486 $1,811,370 $1,843,583
Fiscal and Administration Services Division:Fiscal and Administration Services:
C.E.A. II..................................................... 1 1 1 6,687–7,373 88,476 88,476Acctg Administrator III ............................. 1 1 1 5,800–6,395 76,740 76,740Staff Svcs Mgr III...................................... 1 1 1 5,800–6,395 76,740 76,740Acctg Administrator II............................... 1 1 1 4,772–5,757 69,084 69,084Staff Svcs Mgr II-Supvry .......................... 2.8 3 3 4,772–5,757 206,244 207,252Staff Info Sys Analyst-Spec ...................... 0.9 1 1 4,334–5,269 62,758 63,228Acctg Administrator I-Supvr ..................... 4.5 5 5 4,346–5,243 312,717 314,445
SALARY RANGE
EDUCATION E 5
6100 DEPARTMENT OF EDUCATION—Continued
ORGANIZATIONAL UNIT NUMBER OF POSITIONS EXPENDITURES
Filled Authorized Proposed Actual Estimated ProposedClassification 1999–00 2000–01 2001–02 1999–00 2000–01 2001–02
123456789
1011121314151617181920212223242526272829303132333435363738394041424344454647484950515253545556575859606162636465666768697071727374757677787980
Page 7
Staff Svcs Mgr I ........................................ 3.3 4 4 4,346–5,243 244,296 249,500Staff Adm Analyst ..................................... 1 1 1 4,346–5,243 62,916 62,916Acctg Administrator I-Spec....................... – 0.8 0.8 4,136–5,027 35,434 37,210Assoc Info Sys Analyst-Spec .................... 1.5 3 3 3,952–4,805 156,415 163,615Assoc Adm Analyst-Acctg ........................ 5 5 5 3,952–4,805 288,300 288,300Sr Acctg Ofcr-Supvr .................................. 1 1 1 3,955–4,772 57,264 57,264Sr Acctg Ofcr-Spec.................................... 9.7 10 10 3,764–4,576 532,140 539,242Assoc Bus Mgt Analyst ............................. – 1 1 3,764–4,576 47,940 50,340Assoc Budget Analyst................................ 5.4 3 3 3,764–4,576 163,646 164,736Assoc Govtl Prog Analyst ......................... 8.9 9 9 3,764–4,576 475,780 484,176Bus Svc Ofcr II-Supvr............................... 1 1 1 3,607–4,346 52,152 52,152Acctg Ofcr-Spec......................................... 10.4 12 12 3,287–3,995 519,468 540,436Acctg Analyst............................................. 0.6 1 1 2,658–3,995 41,153 43,213Bus Svc Ofcr I-Spec.................................. 3.4 3 3 3,130–3,805 134,676 136,683Staff Svcs Analyst-Gen.............................. 8.2 14 14 2,411–3,805 527,994 542,877Prop Controller II ...................................... 1 – – 2,821–3,427 – –Budget Techn II ......................................... 1 1 1 2,791–3,394 33,492 35,172Accountant Trainee .................................... 1.6 3 3 2,772–3,210 105,064 110,064Bus Svc Asst-Spec..................................... 4.3 5 5 2,135–3,173 173,548 176,824Accountant I-Spec...................................... 10.3 9 9 2,456–2,985 298,158 304,116Digital Print Opr II .................................... 0.7 2 2 2,453–2,982 71,568 71,568Printing Trades Spec III-Gen .................... 1.3 – – 2,278–2,975 – –Budget Techn I........................................... 0.8 1 1 2,061–2,932 24,732 25,968Mailing Mach Opr II ................................. 1 1 1 2,266–2,752 33,024 33,024Ofc Techn-Gen........................................... 1 1 1 2,258–2,745 32,940 32,940Ofc Techn-Typing ...................................... 1.1 1.5 1.5 2,258–2,745 45,630 47,380Sr Acct Clk ................................................ 5.8 4 4 2,258–2,745 121,666 124,462Acctg Techn ............................................... 3.9 6 6 2,258–2,745 187,988 192,147Digital Print Opr I ..................................... 0.5 1 1 2,231–2,712 28,004 29,403Printing Trades Spec II-Gen...................... 0.8 – – 2,094–2,681 – –Stock Clk.................................................... 1 1 1 2,070–2,517 30,204 30,204Acct Clk II ................................................. 3.9 8 8 2,023–2,461 212,402 220,064Mailing Mach Opr I .................................. – 1 1 1,951–2,370 27,768 28,440Ofc Asst-Typing......................................... 2.9 2 2 1,835–2,370 54,048 55,332Ofc Asst-Gen.............................................. 4.5 4 4 1,775–2,370 95,386 98,731Temporary Help ......................................... 9.3 5.5 5.5 (320,144) 320,144 320,144Overtime..................................................... – – – (80,663) 80,663 80,663
Child Development Fiscal Services:Staff Svcs Mgr I ........................................ 1.8 2 2 4,346–5,243 122,496 125,040Assoc Info Sys Analyst-Spec .................... 2 3 3 3,952–4,805 162,085 165,084Assoc Govtl Prog Analyst ......................... 8.3 11 11 3,764–4,576 555,398 571,692Staff Svcs Analyst-Gen.............................. 4.3 8 8 2,411–3,805 291,463 302,635Ofc Techn-Typing ...................................... 0.4 – – 2,258–2,745 – –Ofc Asst-Typing......................................... 0.4 1 1 1,835–2,370 23,700 24,882Temporary Help ......................................... 0.4 0.2 0.2 (14,531) 14,531 14,531Overtime..................................................... – – – (13,127) 13,127 13,127
Child Care and Nutrition Services:Staff Svcs Mgr II-Supvry .......................... 0.8 1 1 4,772–5,757 68,580 69,084Staff Svcs Mgr I ........................................ 1 1 1 4,346–5,243 61,296 62,916Assoc Govtl Prog Analyst ......................... 1 1 1 3,764–4,576 50,772 53,212Staff Svcs Analyst-Gen.............................. 1 1 1 2,411–3,805 33,560 35,238Sr Acct Clk ................................................ 1.3 1 1 2,258–2,745 32,940 32,940Acctg Techn ............................................... 1 1 1 2,258–2,745 32,940 32,940Acct Clk II ................................................. 2.9 4 4 2,023–2,461 106,117 109,942Ofc Asst-Typing......................................... 0.5 – – 1,835–2,370 – –Ofc Asst-Gen.............................................. 0.2 1 1 1,775–2,370 22,368 23,484Temporary Help ......................................... 0.3 0.2 0.2 (11,937) 11,937 11,937Overtime..................................................... – – – (2,215) 2,215 2,215
Totals ................................................... 155.9 175.2 175.2 $6,907,654 $7,814,287 $7,976,170
School Facilities Planning Division:C.E.A. II..................................................... 1 1 1 6,687–7,373 88,476 88,476Supvng Fld Rep ......................................... 1 1 1 5,443–6,618 79,416 79,416Fld Rep-Spec.............................................. 7.5 8 8 4,898–5,951 546,399 559,418Educ Prog Consultant ................................ 1.8 2 2 4,898–5,951 142,824 142,824Sr Architect ................................................ 1 1 1 4,891–5,943 71,316 71,316Asst Fld Rep II .......................................... 0.8 1 1 3,691–5,415 55,491 58,266Staff Svcs Mgr I ........................................ 1 1 1 4,346–5,243 60,810 62,646Assoc Info Sys Analyst-Spec .................... 0.8 1 1 3,952–4,805 57,660 57,660Assoc Govtl Prog Analyst ......................... 4.7 4 4 3,764–4,576 210,664 214,338Staff Svcs Analyst-Gen.............................. 0.8 2 2 2,411–3,805 72,910 73,260Exec Secty I............................................... 0.7 1 1 2,585–3,142 31,278 32,840
SALARY RANGE
EDUCATIONE 6
6100 DEPARTMENT OF EDUCATION—Continued
ORGANIZATIONAL UNIT NUMBER OF POSITIONS EXPENDITURES
Filled Authorized Proposed Actual Estimated ProposedClassification 1999–00 2000–01 2001–02 1999–00 2000–01 2001–02
123456789
1011121314151617181920212223242526272829303132333435363738394041424344454647484950515253545556575859606162636465666768697071727374757677787980
Page 8
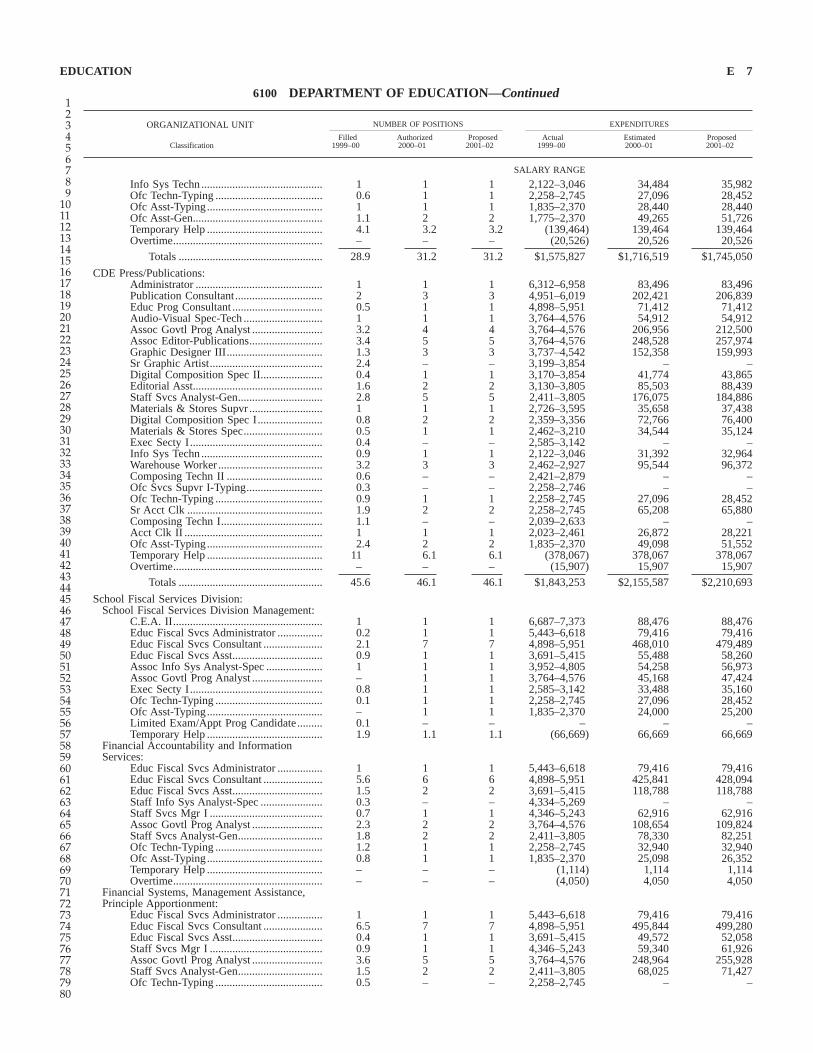
Info Sys Techn ........................................... 1 1 1 2,122–3,046 34,484 35,982Ofc Techn-Typing ...................................... 0.6 1 1 2,258–2,745 27,096 28,452Ofc Asst-Typing......................................... 1 1 1 1,835–2,370 28,440 28,440Ofc Asst-Gen.............................................. 1.1 2 2 1,775–2,370 49,265 51,726Temporary Help ......................................... 4.1 3.2 3.2 (139,464) 139,464 139,464Overtime..................................................... – – – (20,526) 20,526 20,526
Totals ................................................... 28.9 31.2 31.2 $1,575,827 $1,716,519 $1,745,050
CDE Press/Publications:Administrator ............................................. 1 1 1 6,312–6,958 83,496 83,496Publication Consultant............................... 2 3 3 4,951–6,019 202,421 206,839Educ Prog Consultant ................................ 0.5 1 1 4,898–5,951 71,412 71,412Audio-Visual Spec-Tech ............................ 1 1 1 3,764–4,576 54,912 54,912Assoc Govtl Prog Analyst ......................... 3.2 4 4 3,764–4,576 206,956 212,500Assoc Editor-Publications.......................... 3.4 5 5 3,764–4,576 248,528 257,974Graphic Designer III.................................. 1.3 3 3 3,737–4,542 152,358 159,993Sr Graphic Artist........................................ 2.4 – – 3,199–3,854 – –Digital Composition Spec II...................... 0.4 1 1 3,170–3,854 41,774 43,865Editorial Asst.............................................. 1.6 2 2 3,130–3,805 85,503 88,439Staff Svcs Analyst-Gen.............................. 2.8 5 5 2,411–3,805 176,075 184,886Materials & Stores Supvr .......................... 1 1 1 2,726–3,595 35,658 37,438Digital Composition Spec I....................... 0.8 2 2 2,359–3,356 72,766 76,400Materials & Stores Spec............................ 0.5 1 1 2,462–3,210 34,544 35,124Exec Secty I............................................... 0.4 – – 2,585–3,142 – –Info Sys Techn ........................................... 0.9 1 1 2,122–3,046 31,392 32,964Warehouse Worker ..................................... 3.2 3 3 2,462–2,927 95,544 96,372Composing Techn II .................................. 0.6 – – 2,421–2,879 – –Ofc Svcs Supvr I-Typing........................... 0.3 – – 2,258–2,746 – –Ofc Techn-Typing ...................................... 0.9 1 1 2,258–2,745 27,096 28,452Sr Acct Clk ................................................ 1.9 2 2 2,258–2,745 65,208 65,880Composing Techn I.................................... 1.1 – – 2,039–2,633 – –Acct Clk II ................................................. 1 1 1 2,023–2,461 26,872 28,221Ofc Asst-Typing......................................... 2.4 2 2 1,835–2,370 49,098 51,552Temporary Help ......................................... 11 6.1 6.1 (378,067) 378,067 378,067Overtime..................................................... – – – (15,907) 15,907 15,907
Totals ................................................... 45.6 46.1 46.1 $1,843,253 $2,155,587 $2,210,693
School Fiscal Services Division:School Fiscal Services Division Management:
C.E.A. II..................................................... 1 1 1 6,687–7,373 88,476 88,476Educ Fiscal Svcs Administrator ................ 0.2 1 1 5,443–6,618 79,416 79,416Educ Fiscal Svcs Consultant ..................... 2.1 7 7 4,898–5,951 468,010 479,489Educ Fiscal Svcs Asst................................ 0.9 1 1 3,691–5,415 55,488 58,260Assoc Info Sys Analyst-Spec .................... 1 1 1 3,952–4,805 54,258 56,973Assoc Govtl Prog Analyst ......................... – 1 1 3,764–4,576 45,168 47,424Exec Secty I............................................... 0.8 1 1 2,585–3,142 33,488 35,160Ofc Techn-Typing ...................................... 0.1 1 1 2,258–2,745 27,096 28,452Ofc Asst-Typing......................................... – 1 1 1,835–2,370 24,000 25,200Limited Exam/Appt Prog Candidate......... 0.1 – – – – –Temporary Help ......................................... 1.9 1.1 1.1 (66,669) 66,669 66,669
Financial Accountability and InformationServices:
Educ Fiscal Svcs Administrator ................ 1 1 1 5,443–6,618 79,416 79,416Educ Fiscal Svcs Consultant ..................... 5.6 6 6 4,898–5,951 425,841 428,094Educ Fiscal Svcs Asst................................ 1.5 2 2 3,691–5,415 118,788 118,788Staff Info Sys Analyst-Spec ...................... 0.3 – – 4,334–5,269 – –Staff Svcs Mgr I ........................................ 0.7 1 1 4,346–5,243 62,916 62,916Assoc Govtl Prog Analyst ......................... 2.3 2 2 3,764–4,576 108,654 109,824Staff Svcs Analyst-Gen.............................. 1.8 2 2 2,411–3,805 78,330 82,251Ofc Techn-Typing ...................................... 1.2 1 1 2,258–2,745 32,940 32,940Ofc Asst-Typing......................................... 0.8 1 1 1,835–2,370 25,098 26,352Temporary Help ......................................... – – – (1,114) 1,114 1,114Overtime..................................................... – – – (4,050) 4,050 4,050
Financial Systems, Management Assistance,Principle Apportionment:
Educ Fiscal Svcs Administrator ................ 1 1 1 5,443–6,618 79,416 79,416Educ Fiscal Svcs Consultant ..................... 6.5 7 7 4,898–5,951 495,844 499,280Educ Fiscal Svcs Asst................................ 0.4 1 1 3,691–5,415 49,572 52,058Staff Svcs Mgr I ........................................ 0.9 1 1 4,346–5,243 59,340 61,926Assoc Govtl Prog Analyst ......................... 3.6 5 5 3,764–4,576 248,964 255,928Staff Svcs Analyst-Gen.............................. 1.5 2 2 2,411–3,805 68,025 71,427Ofc Techn-Typing ...................................... 0.5 – – 2,258–2,745 – –
SALARY RANGE
EDUCATION E 7
6100 DEPARTMENT OF EDUCATION—Continued
ORGANIZATIONAL UNIT NUMBER OF POSITIONS EXPENDITURES
Filled Authorized Proposed Actual Estimated ProposedClassification 1999–00 2000–01 2001–02 1999–00 2000–01 2001–02
123456789
1011121314151617181920212223242526272829303132333435363738394041424344454647484950515253545556575859606162636465666768697071727374757677787980
Page 9
Ofc Asst-Typing......................................... 0.5 1 1 1,835–2,370 24,294 25,506Temporary Help ......................................... 1.1 0.6 0.6 (37,497) 37,497 37,497Overtime..................................................... – – – (5,807) 5,807 5,807
District Organizations, Transportation andCharter:
Supvng Fld Rep ......................................... 1 1 1 5,443–6,618 79,416 79,416Fld Rep-Spec.............................................. 2.2 2 2 4,898–5,951 142,824 142,824Educ Prog Consultant ................................ 2 3 3 4,898–5,951 214,236 214,236Labor Relations Mgr I............................... 1 1 1 5,282–5,825 69,900 69,900Bus Driver Trng Progs Supvr.................... 1 1 1 4,506–5,476 62,196 64,803Bus Driver Trng Progs Spec ..................... 6.9 7 7 4,082–4,959 408,014 413,523Assoc Govtl Prog Analyst ......................... – 2 2 3,764–4,576 90,900 95,442Staff Svcs Analyst-Gen.............................. 0.9 – – 2,411–3,805 – –Ofc Techn-Typing ...................................... 1 2 2 2,258–2,745 59,762 61,390Ofc Asst-Typing......................................... 2 1 1 1,835–2,370 24,378 25,594Temporary Help ......................................... 0.6 0.3 0.3 (19,558) 19,558 19,558
Special Education Apportionment, CategoricalProgram:
Educ Fiscal Svcs Administrator ................ 0.6 1 1 5,443–6,618 78,974 79,416Educ Fiscal Svcs Consultant ..................... 3.7 3 3 4,898–5,951 211,360 213,723Educ Fiscal Svcs Asst................................ 0.8 2 2 3,691–5,415 107,616 107,616Staff Svcs Mgr I ........................................ 1.8 2 2 4,346–5,243 122,016 124,644Assoc Govtl Prog Analyst ......................... 8 7 7 3,764–4,576 366,555 371,153Staff Svcs Analyst-Gen 5 ........................... 0.5 3 3 2,411–3,805 94,086 98,801Ofc Techn-Typing ...................................... 0.1 1 1 2,258–2,745 27,848 29,246Acctg Techn ............................................... 1 1 1 2,258–2,745 32,940 32,940Ofc Asst-Typing......................................... 0.6 – – 1,835–2,370 – –Temporary Help ......................................... 2 1.1 1.1 (69,261) 69,261 69,261Overtime..................................................... – – – (13,101) 13,101 13,101
Totals ................................................... 77.0 92.1 92.1 $4,289,185 $5,242,916 $5,326,696
Technology Services Division:Education Technology Programs andInformation Systems:
Asst Gen Counsel ...................................... 0.3 – – 8,484–9,511 – –C.E.A. II..................................................... 0.7 1 1 6,687–7,373 83,964 83,964Educ Administrator I ................................. 1 1 1 5,443–6,618 79,416 79,416DP Mgr III 6............................................... 1 2 1.3 5,800–6,395 152,904 99,762Educ Prog Consultant 7 ............................. 3.9 7 5 4,898–5,951 484,836 357,060Sr Info Sys Analyst-Spec .......................... 1 2 2 4,767–5,794 132,838 138,786DP Mgr II................................................... 2 2 2 4,767–5,794 139,056 139,056Staff Programmer Analyst-Supvr .............. 0.8 1 1 4,767–5,794 69,528 69,528Staff Info Sys Analyst-Supvr .................... 1 1 1 4,762–5,794 69,528 69,528Staff Info Sys Analyst-Spec ...................... 2.6 5 5 4,334–5,269 300,599 307,558Staff Info Sys Analyst-Supvr .................... 0.5 1 1 4,334–5,269 52,008 54,612DP Mgr I.................................................... 1 1 1 4,334–5,269 63,228 63,228Staff Programmer Analyst-Spec ................ 3.1 4 4 4,334–5,269 241,032 244,296Staff Programmer Analyst-Supvr .............. 2 2 2 4,334–5,269 125,808 126,456Staff Svcs Mgr I ........................................ 1 1 1 4,346–5,243 60,081 62,241Ops Research Spec II ................................ 0.4 – – 4,042–4,913 – –Assoc Info Sys Analyst-Spec .................... 12.6 14 14 3,952–4,805 774,656 786,995Assoc Programmer Analyst-Spec 8, 9........ 11.7 15 14.9 3,952–4,805 823,194 833,754Assoc Govtl Prog Analyst ......................... 2.8 3 3 3,764–4,576 149,790 154,542Programmer II............................................ 0.8 – – 3,451–4,195 – –Asst Info Sys Analyst ................................ 4.3 5 5 2,658–3,995 202,514 206,540Staff Svcs Analyst-Gen 10, 11 .................... 4.1 5 5 2,411–3,805 181,850 190,949Exec Secty I............................................... 0.3 1 1 2,585–3,142 37,704 37,704Info Sys Techn ........................................... 1 1 1 2,122–3,046 36,552 36,552Ofc Techn-Typing ...................................... 0.9 2 2 2,258–2,745 54,757 57,499Ofc Asst-Typing......................................... 1 1.8 1.8 1,835–2,370 47,640 48,600Temporary Help ......................................... 3.7 2 2 (126,505) 126,505 126,505Overtime..................................................... – – – (55,805) 55,805 55,805
Totals ................................................... 65.5 80.8 78.0 $3,607,415 $4,545,793 $4,430,936
Educational Demographics:Research & Eval Administrator I.............. 1 1 1 5,443–6,618 79,416 79,416Research & Eval Consultant ..................... 1 1 1 4,898–5,951 71,412 71,412Educ Prog Consultant 12 ............................ 1.8 3 3 4,898–5,951 204,191 209,207Educ Prog Asst .......................................... 0.8 – – 3,691–5,415 – –Ops Research Spec II ................................ 0.9 1 1 4,042–4,913 58,956 58,956Research Analyst II-Gen............................ 0.6 – – 3,952–4,805 – –Assoc Govtl Prog Analyst ......................... 2.1 3 3 3,764–4,576 158,880 164,071
SALARY RANGE
EDUCATIONE 8
6100 DEPARTMENT OF EDUCATION—Continued
ORGANIZATIONAL UNIT NUMBER OF POSITIONS EXPENDITURES
Filled Authorized Proposed Actual Estimated ProposedClassification 1999–00 2000–01 2001–02 1999–00 2000–01 2001–02
123456789
1011121314151617181920212223242526272829303132333435363738394041424344454647484950515253545556575859606162636465666768697071727374757677787980
Page 10
Staff Svcs Analyst-Gen.............................. 0.7 1 1 2,411–3,805 29,900 31,400Ofc Techn-Typing ...................................... 0.3 1 1 2,258–2,745 27,322 28,690Temporary Help ......................................... 0.3 0.2 0.2 (11,362) 11,362 11,362
Totals ................................................... 9.5 11.2 11.2 $560,043 $641,439 $654,514
Totals, Finance, Technology andAdministration Branch ........................ 422.1 481.9 479.1 $20,646,917 $24,178,884 $24,442,493
Curriculum and Instructional LeadershipBranch
Curriculum and Instructional Leadership BranchManagement:
Assoc Supt-Pub Inst .................................. 1 1 1 7,517–8,131 97,572 97,572Director-Curr and Textbook ...................... 0.2 – – 6,832–7,388 – –Educ Prog Consultant ................................ 0.8 1 1 4,898–5,951 71,412 71,412Assoc Govtl Prog Analyst ......................... 0.8 1 1 3,764–4,576 50,216 52,730Staff Svcs Analyst-Gen.............................. – – – 2,411–3,805 – –Educ Consultant......................................... 0.8 1 1 2,823–3,450 37,704 37,704Exec Asst.................................................... 0.8 – – 2,813–3,419 – –Exec Secty I............................................... 0.4 – – 2,585–3,142 – –Ofc Techn-Typing ...................................... 0.1 – – 2,258–2,745 – –Ofc Asst-Typing......................................... 0.1 – – 1,835–2,370 – –Temporary Help ......................................... 0.1 – – (1,871) 1,871 1,871Overtime..................................................... – – – (654) 654 654
Totals ................................................... 5.1 4.0 4.0 $284,213 $259,429 $261,943
District and School Support Division:C.E.A. II..................................................... 0.4 – – 6,687–7,373 – –Educ Administrator I ................................. 1.5 – – 5,443–6618 – –Educ Prog Consultant ............................... 4.1 – – 4,898–5,951 – –American Indian Educ Consultant ............ 0.4 – – 4,898–5,951 – –Bi/Migrant Educ Consultant...................... 2.3 – – 4,898–5,951 – –Educ Prog Asst .......................................... 1.3 – – 3,691–5,415 – –Bi/Migrant Educ Assistant......................... 0.3 – – 3,364–4,936 – –Assoc Info Sys Analyst-Spec .................... 0.4 – – 3,952–4,805 – –Assoc Mgt Auditor .................................... 0.2 – – 3,952–4,805 – –Research Analyst II-Gen............................ 0.4 – – 3,952–4,805 – –Assoc Govtl Prog Analyst ......................... 0.7 – – 3,764–4,576 – –Staff Svcs Analyst-Gen.............................. 1.6 – – 2,411–3,805 – –Exec Secty I............................................... 0.4 – – 2,585–3,142 – –Ofc Techn-Typing ...................................... 3.3 – – 2,258–2,745 – –Ofc Asst-Typing......................................... 1.1 – – 1,835–2,370 – –Temporary Help ......................................... 1.5 0.8 0.8 (51,222) 51,222 51,222Overtime..................................................... – – – (13,939) 13,939 13,939
Totals ................................................... 19.9 0.8 0.8 $1,087,402 $65,161 $65,161
Elementary Education Division:C.E.A. II..................................................... 0.4 – – 6,687–7,373 – –Educ Administrator I ................................. 2.2 – – 5,443–6,618 – –Consultant-Mathematics Educ................... 0.4 – – 4,898–5,951 – –Educ Prog Consultant ............................... 6.7 – – 4,898–5,951 – –Bi/Migrant Educ Consultant...................... 2.0 – – 4,898–5,951 – –Educ Prog Asst .......................................... 0.6 – – 3,691–5,415 – –Staff Svcs Mgr I ........................................ 0.4 – – 4,346–5,243 – –Assoc Govtl Analyst .................................. 4.4 – – 3,764–4,576 – –Staff Svcs Analyst-Gen.............................. 2.5 – – 2,411–3,805 – –Exec Secty I............................................... 0.4 – – 2,585–3,142 – –Ofc Techn-Typing ...................................... 6.1 – – 2,258–2,745 – –Steno........................................................... 0.5 – – 1,915–2,502 – –Ofc Asst-Typing......................................... 0.2 – – 1,835–2,370 – –Temporary Help ......................................... 1.3 0.7 0.7 (46,369) 46,369 46,369Overtime..................................................... – – – (5,287) 5,287 5,287
Totals ................................................... 28.1 0.7 0.7 $1,518,701 $51,656 $51,656
Secondary Education Division:C.E.A. II..................................................... 0.3 – – 6,687–7,373 – –Agric Educ Administrator I ....................... 0.4 – – 5,443–6,618 – –Bus Educ Administrator I.......................... 0.4 – – 5,443–6,618 – –Educ Administrator I ................................ 1.8 – – 5,443–6,618 – –Agric Educ Consultant .............................. 2.2 – – 4,898–5,951 – –Hlth Careers Educ Consultant................... 0.4 – – 4,898–5,951 – –Bus Educ Consultant ................................. 1 – – 4,898–5,951 – –
SALARY RANGE
EDUCATION E 9
6100 DEPARTMENT OF EDUCATION—Continued
ORGANIZATIONAL UNIT NUMBER OF POSITIONS EXPENDITURES
Filled Authorized Proposed Actual Estimated ProposedClassification 1999–00 2000–01 2001–02 1999–00 2000–01 2001–02
123456789
1011121314151617181920212223242526272829303132333435363738394041424344454647484950515253545556575859606162636465666768697071727374757677787980
Page 11
Home Economics Educ Consultant........... 1.1 – – 4,898–5,951 – –Fld Rep-Spec.............................................. 0.3 – – 4,898–5,951 – –Educ Prog Consultant ................................ 6.6 – – 4,898–5,951 – –Bi/Migrant Consultant ............................... 0.4 – – 4,898–5,951 – –Assoc Govtl Prog Analyst ......................... 2.5 – – 3,764–4,576 – –Staff Svcs Analyst-Gen.............................. 1.7 – – 2,411–3,805 – –Exec Secty I............................................... 0.4 – – 2,585–3,142 – –Ofc Techn-Typing ...................................... 2.9 – 2,258–2,745 – –Word Proc Techn ....................................... 0.4 – – 1,951–2,546 – –Steno........................................................... 0.6 – – 1,915–2,502 – –Ofc Asst-Typing......................................... 0.5 – – 1,835–2,370 – –Temporary Help ......................................... 0.3 0.2 0.2 (10,275) 10,275 10,275Overtime..................................................... – – – (955) 955 955
Totals ................................................... 24.2 0.2 0.2 $1,430,733 $11,230 $11,230
Career Develop-Workforce Preperation:Educ Administrator I ................................ 1.1 – – 5,443–6,618 – –Hlth Careers Educ Consultant................... 0.4 – – 4,898–5,951 – –Industrial & Tech Educ Consultant........... 1.5 – – 4,898–5,951 – –Educ Prog Consultant ................................ 6.1 – – 4,898–5,951 – –Educ Prog Asst .......................................... 0.4 – – 3,691–5,415 – –Staff Svcs Mgr I ........................................ 0.4 – – 4,346–5,243 – –Assoc Govtl Prog Analyst ......................... 1.7 – – 3,764–4,576 – –Staff Svcs Analyst-Gen.............................. 1.1 – – 2,411–3,805 – –Exec Secty I............................................... 0.4 – – 2,585–3,142 – –Mgt Svcs Techn ......................................... 0.4 – – 2,135–2,932 – –Ofc Techn-Typing ...................................... 1.5 – – 2,258–2,745 – –Ofc Asst-Typing......................................... 1 – – 1,835–2,370 – –Temporary Help ......................................... 2.3 1.3 1.3 (79,922) 79,922 79,922Overtime..................................................... – – – (1,483) 1,483 1,483
Totals ................................................... 18.3 1.3 1.3 $992,632 $81,405 $81,405
Standards and High School DevelopmentDivision:
C.E.A. II..................................................... 0.1 1 1 6,687–7,373 88,477 88,477Agric Educ Administrator I ....................... 0.6 1 1 5,443–6,618 79,416 79,416Bus Educ Administrator I.......................... 0.6 1 1 5,443–6,618 79,416 79,416Educ Administrator I ................................. 2.5 5 5 5,443–6,618 397,080 397,080Agric Educ Consultant .............................. 3.8 7 7 4,898–5,951 499,884 499,884Hlth Careers Educ Consultant................... 1 2 2 4,898–5,951 142,824 142,824Bus Educ Consultant ................................. 1 2 2 4,898–5,951 130,188 133,128Home Economics Educ Consultant........... 1.9 3 3 4,898–5,951 204,540 207,624Industrial & Tech Educ Consultant........... 2.1 3 3 4,898–5,951 214,236 214,236Educ Prog Consultant 13, 16....................... 15.1 31 30 4,898–5,951 2,146,418 2,095,097Bi/Migrant Educ Consultant...................... 1.3 2 2 4,898–5,951 131,388 134,388Educ Prog Asst .......................................... 0.2 – – 3,691–5,415 – –Staff Svcs Mgr I ........................................ 0.6 1 1 4,346–5,243 62,917 62,917Assoc Govtl Prog Analyst ......................... 4.5 7.5 7.5 3,764–4,576 397,663 405,197Staff Svcs Analyst-Gen.............................. 3.2 7.5 7.5 2,411–3,805 268,176 279,325Exec Secty I............................................... 0.6 1 1 2,585–3,142 34,928 36,668Mgt Svcs Techn ......................................... 0.6 1 1 2,135–2,932 35,184 35,184Ofc Svcs Supvr I-Typing........................... – – – 2,258–2,746 – –Ofc Techn-Typing 13 .................................. 4.6 8.5 8.5 2,258–2,745 263,508 267,937Steno........................................................... 0.9 1.5 1.5 1,915–2,502 37,992 39,144Ofc Asst-Typing......................................... 2.2 4 4 1,835–2,370 97,212 102,077Temporary Help ......................................... 1.2 0.7 0.7 (41,728) 41,728 41,728Overtime..................................................... – – – (2,873) 2,873 2,873
Totals ................................................... 48.6 90.7 89.7 $2,877,335 $5,356,048 $5,344,620
Specialized Programs Division:C.E.A. II..................................................... 0.6 1 1 6,687–7,373 88,476 88,476Educ Administrator I ................................. 1.9 3 3 5,443–6,618 239,448 239,448Bi/Migrant Educ Administrator I .............. 0.4 1 1 5,443–6,618 79,416 79,416Educ Prog Consultant ................................ 4.2 11 11 4,898–5,951 786,572 786,732American Indian Educ Consultant ............ 0.6 1 1 4,898–5,951 71,412 71,412Bi/Migrant Educ Consultant...................... 5.8 11 11 4,898–5,951 792,732 792,732Educ Prog Asst .......................................... 2.3 4 4 3,691–5,415 247,003 253,098Assoc Info Sys Analyst-Spec .................... 0.6 1 1 3,952–4,805 57,660 57,660Research Analyst II-Gen............................ 0.6 1 1 3,952–4,805 57,660 57,660Assoc Govtl Prog Analyst ......................... 1.8 2 2 3,764–4,576 109,824 109,824Staff Svcs Analyst-Gen.............................. 3.5 6 6 2,411–3,805 230,291 239,535Exec Secty I............................................... 0.6 1 1 2,585–3,142 37,704 37,704
SALARY RANGE
EDUCATIONE 10
6100 DEPARTMENT OF EDUCATION—Continued
ORGANIZATIONAL UNIT NUMBER OF POSITIONS EXPENDITURES
Filled Authorized Proposed Actual Estimated ProposedClassification 1999–00 2000–01 2001–02 1999–00 2000–01 2001–02
123456789
1011121314151617181920212223242526272829303132333435363738394041424344454647484950515253545556575859606162636465666768697071727374757677787980
Page 12
Ofc Techn-Typing ...................................... 5.5 9 9 2,258–2,745 286,681 291,059Steno........................................................... 0.5 – – 1,915–2,502 – –Ofc Asst-Typing......................................... 1.9 5 5 1,835–2,370 128,298 131,862Temporary Help ......................................... 1.7 0.9 0.9 (58,370) 58,370 58,370Overtime..................................................... – – – (37,071) 37,071 37,071
Totals ................................................... 32.5 57.9 57.9 $1,801,676 $3,308,618 $3,332,059
Education Support and Networks Division:C.E.A. II..................................................... 0.6 2 2 6,687–7,373 151,860 151,860Educ Administrator I ................................. 2.5 4 4 5,443–6,618 318,864 318,864Consultant-Mathemathics Educ................. 0.6 1 1 4,898–5,951 71,412 71,412Educ Prog Consultant ................................ 7.9 22 22 4,898–5,951 1,484,417 1,508,016Bi/Migrant Educ Consultant...................... 1.3 1 1 4,898–5,951 71,412 71,412Educ Prog Asst .......................................... 0.6 1 1 3,691–5,415 64,308 64,980Assoc Govtl Prog Analyst ......................... 2.8 5 5 3,764–4,576 274,287 274,560Staff Svcs Analyst-Gen.............................. 3 5.5 5.5 2,411–3,805 216,541 226,784Exec Secty I............................................... 0.6 1 1 2,585–3,142 37,704 37,704Ofc Techn-Typing ...................................... 5.3 9 9 2,258–2,745 287,376 291,910Word Proc Techn ....................................... 0.6 1 1 1,951–2,546 30,552 30,552Ofc Asst-Typing......................................... – 3 3 1,835–2,370 67,440 70,812Temporary Help ......................................... 0.6 0.3 0.3 (21,761) 21,761 21,761Overtime..................................................... – – – (3,332) 3,332 3,332
Totals ................................................... 26.4 55.8 55.8 $1,495,010 $3,101,266 $3,143,959
Professional Development and CurriculumSupport Division:
C.E.A. II..................................................... 0.5 1 1 6,687–7,373 83,388 83,388Educ Administrator I ................................. 3.1 6 6 5,443–6,618 473,628 476,097Fld Rep-Spec.............................................. 0.4 1 1 4,898–5,951 58,776 61,716Educ Prog Consultant ................................ 11.5 32 32 4,898–5,951 2,189,751 2,216,188Educ Prog Asst .......................................... 0.3 – – 3,691–5,415 – –Assoc Govtl Prog Analyst ........................ 5.9 12.5 12.5 3,764–4,576 628,180 645,398Staff Svcs Analyst-Gen.............................. 2.5 3.5 3.5 2,411–3,805 132,819 137,181Exec Secty I............................................... 0.6 1 1 2,585–3,142 37,704 37,704Ofc Techn-Typing ..................................... 6.2 9 9 2,258–2,745 284,907 291,190Ofc Asst-Typing ........................................ 0.6 4.5 4.5 1,835–2,370 118,774 123,296Temporary Help ......................................... 2.5 1.4 1.4 (85,939) 85,939 85,939Overtime..................................................... – – – (1,153) 1,153 1,153
Totals ................................................... 34.1 71.9 71.9 $1,870,620 $4,095,019 $4,159,250
Curriculum Framework/Instructional Resources:Director-Curr & Textbook ......................... 0.6 1 1 6,832–7,388 81,984 81,984Educ Administrator I ................................. 0.6 2 2 5,443–6,618 155,340 158,319Educ Prog Consultant 14 ............................ 2.7 8 8 4,898–5,951 541,953 551,904Educ Prog Asst 14 ...................................... 0.4 1 1 3,691–5,415 44,292 46,512Staff Svcs Mgr I 14 .................................... 0.6 1 1 4,346–5,243 61,584 61,584Assoc Govtl Prog Analyst ......................... 2.5 4 4 3,764–4,576 205,116 212,616Staff Svcs Analyst-Gen 14.......................... 0.7 3 3 2,411–3,805 107,352 111,341Exec Secty I............................................... 0.3 1 1 2,585–3,142 34,584 36,312Ofc Techn-Typing 14 .................................. 2.6 5 5 2,258–2,745 161,299 162,710Ofc Asst-Typing......................................... 0.4 1 1 1,835–2,370 27,096 28,440Temporary Help ......................................... – – – (44) 44 44Overtime..................................................... – – – (4,539) 4,539 4,539
Totals ................................................... 11.4 27.0 27.0 $620,171 $1,425,183 $1,456,305
Totals, Curriculum and InstructionalLeadership Branch ............................. 248.6 310.3 309.3 $13,978,493 $17,755,015 $17,907,588
Education Equity, Access and Support Branch
Education Equity, Access and Support BranchManagement:
Chief Advr to Supt .................................... 1 1 1 7,517–8,131 97,572 97,572Assoc Govtl Prog Analyst ......................... – 1 1 3,764–4,576 45,168 45,168Exec Asst.................................................... 1.5 1 1 2,813–3,419 35,449 37,219Ofc Techn-Typing ...................................... 1 1 1 2,258–2,745 32,940 32,940
Totals ................................................... 3.5 4.0 4.0 $188,808 $211,129 $212,899
Division of Special Education:Special Education-IDEA:
C.E.A. II..................................................... 0.1 1 1 6,687–7,373 88,476 88,476Educ Administrator I ................................. 3.9 9 9 5,443–6,618 671,184 682,236Research & Eval Consultant ..................... 1.4 2 2 4,898–5,951 141,473 142,824
SALARY RANGE
EDUCATION E 11
6100 DEPARTMENT OF EDUCATION—Continued
ORGANIZATIONAL UNIT NUMBER OF POSITIONS EXPENDITURES
Filled Authorized Proposed Actual Estimated ProposedClassification 1999–00 2000–01 2001–02 1999–00 2000–01 2001–02
123456789
1011121314151617181920212223242526272829303132333435363738394041424344454647484950515253545556575859606162636465666768697071727374757677787980
Page 13
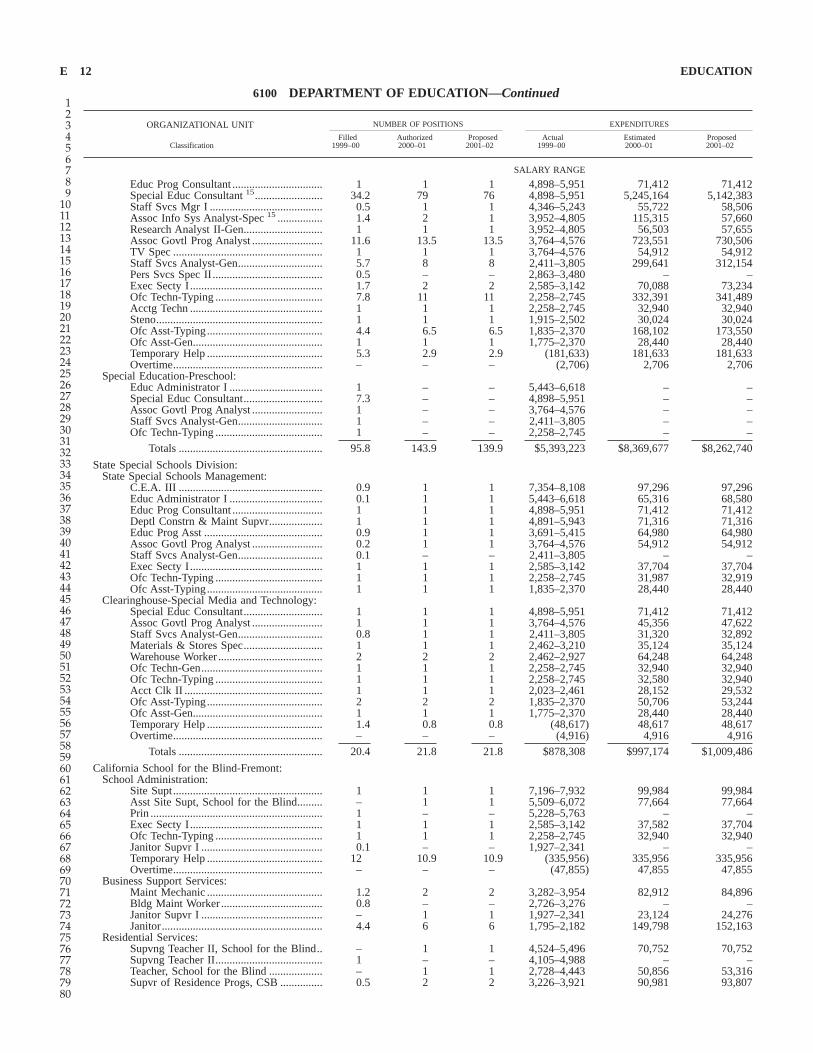
Educ Prog Consultant ................................ 1 1 1 4,898–5,951 71,412 71,412Special Educ Consultant 15........................ 34.2 79 76 4,898–5,951 5,245,164 5,142,383Staff Svcs Mgr I ........................................ 0.5 1 1 4,346–5,243 55,722 58,506Assoc Info Sys Analyst-Spec 15 ................ 1.4 2 1 3,952–4,805 115,315 57,660Research Analyst II-Gen............................ 1 1 1 3,952–4,805 56,503 57,655Assoc Govtl Prog Analyst ......................... 11.6 13.5 13.5 3,764–4,576 723,551 730,506TV Spec ..................................................... 1 1 1 3,764–4,576 54,912 54,912Staff Svcs Analyst-Gen.............................. 5.7 8 8 2,411–3,805 299,641 312,154Pers Svcs Spec II....................................... 0.5 – – 2,863–3,480 – –Exec Secty I............................................... 1.7 2 2 2,585–3,142 70,088 73,234Ofc Techn-Typing ...................................... 7.8 11 11 2,258–2,745 332,391 341,489Acctg Techn ............................................... 1 1 1 2,258–2,745 32,940 32,940Steno........................................................... 1 1 1 1,915–2,502 30,024 30,024Ofc Asst-Typing......................................... 4.4 6.5 6.5 1,835–2,370 168,102 173,550Ofc Asst-Gen.............................................. 1 1 1 1,775–2,370 28,440 28,440Temporary Help ......................................... 5.3 2.9 2.9 (181,633) 181,633 181,633Overtime..................................................... – – – (2,706) 2,706 2,706
Special Education-Preschool:Educ Administrator I ................................. 1 – – 5,443–6,618 – –Special Educ Consultant............................ 7.3 – – 4,898–5,951 – –Assoc Govtl Prog Analyst ......................... 1 – – 3,764–4,576 – –Staff Svcs Analyst-Gen.............................. 1 – – 2,411–3,805 – –Ofc Techn-Typing ...................................... 1 – – 2,258–2,745 – –
Totals ................................................... 95.8 143.9 139.9 $5,393,223 $8,369,677 $8,262,740
State Special Schools Division:State Special Schools Management:
C.E.A. III ................................................... 0.9 1 1 7,354–8,108 97,296 97,296Educ Administrator I ................................. 0.1 1 1 5,443–6,618 65,316 68,580Educ Prog Consultant ................................ 1 1 1 4,898–5,951 71,412 71,412Deptl Constrn & Maint Supvr................... 1 1 1 4,891–5,943 71,316 71,316Educ Prog Asst .......................................... 0.9 1 1 3,691–5,415 64,980 64,980Assoc Govtl Prog Analyst ......................... 0.2 1 1 3,764–4,576 54,912 54,912Staff Svcs Analyst-Gen.............................. 0.1 – – 2,411–3,805 – –Exec Secty I............................................... 1 1 1 2,585–3,142 37,704 37,704Ofc Techn-Typing ...................................... 1 1 1 2,258–2,745 31,987 32,919Ofc Asst-Typing......................................... 1 1 1 1,835–2,370 28,440 28,440
Clearinghouse-Special Media and Technology:Special Educ Consultant............................ 1 1 1 4,898–5,951 71,412 71,412Assoc Govtl Prog Analyst ......................... 1 1 1 3,764–4,576 45,356 47,622Staff Svcs Analyst-Gen.............................. 0.8 1 1 2,411–3,805 31,320 32,892Materials & Stores Spec............................ 1 1 1 2,462–3,210 35,124 35,124Warehouse Worker ..................................... 2 2 2 2,462–2,927 64,248 64,248Ofc Techn-Gen........................................... 1 1 1 2,258–2,745 32,940 32,940Ofc Techn-Typing ...................................... 1 1 1 2,258–2,745 32,580 32,940Acct Clk II ................................................. 1 1 1 2,023–2,461 28,152 29,532Ofc Asst-Typing......................................... 2 2 2 1,835–2,370 50,706 53,244Ofc Asst-Gen.............................................. 1 1 1 1,775–2,370 28,440 28,440Temporary Help ......................................... 1.4 0.8 0.8 (48,617) 48,617 48,617Overtime..................................................... – – – (4,916) 4,916 4,916
Totals ................................................... 20.4 21.8 21.8 $878,308 $997,174 $1,009,486
California School for the Blind-Fremont:School Administration:
Site Supt..................................................... 1 1 1 7,196–7,932 99,984 99,984Asst Site Supt, School for the Blind......... – 1 1 5,509–6,072 77,664 77,664Prin ............................................................. 1 – – 5,228–5,763 – –Exec Secty I............................................... 1 1 1 2,585–3,142 37,582 37,704Ofc Techn-Typing ...................................... 1 1 1 2,258–2,745 32,940 32,940Janitor Supvr I ........................................... 0.1 – – 1,927–2,341 – –Temporary Help ......................................... 12 10.9 10.9 (335,956) 335,956 335,956Overtime..................................................... – – – (47,855) 47,855 47,855
Business Support Services:Maint Mechanic ......................................... 1.2 2 2 3,282–3,954 82,912 84,896Bldg Maint Worker .................................... 0.8 – – 2,726–3,276 – –Janitor Supvr I ........................................... – 1 1 1,927–2,341 23,124 24,276Janitor......................................................... 4.4 6 6 1,795–2,182 149,798 152,163
Residential Services:Supvng Teacher II, School for the Blind.. – 1 1 4,524–5,496 70,752 70,752Supvng Teacher II...................................... 1 – – 4,105–4,988 – –Teacher, School for the Blind ................... – 1 1 2,728–4,443 50,856 53,316Supvr of Residence Progs, CSB ............... 0.5 2 2 3,226–3,921 90,981 93,807
SALARY RANGE
EDUCATIONE 12
6100 DEPARTMENT OF EDUCATION—Continued
ORGANIZATIONAL UNIT NUMBER OF POSITIONS EXPENDITURES
Filled Authorized Proposed Actual Estimated ProposedClassification 1999–00 2000–01 2001–02 1999–00 2000–01 2001–02
123456789
1011121314151617181920212223242526272829303132333435363738394041424344454647484950515253545556575859606162636465666768697071727374757677787980
Page 14
Supvng Counselor, CSB ............................ 1.5 5.5 5.5 2,933–3,527 204,034 212,068Counselor, CSB.......................................... 18 31 31 2,228–3,261 1,110,365 1,134,126Transp Coord ............................................. 0.9 1 1 2,668–3,242 40,104 40,104Supvng Instl Counselor ............................. 0.9 – – 2,686–3,230 – –Instl Counselor........................................... 0.9 – – 2,457–2,942 – –Counselor ................................................... 4 – – 2,267–2,692 – –Night Attendant, CSB................................ 5.1 7 7 1,970–2,395 210,860 210,860Attendant Resident Schools....................... 1.3 – – 1,804–2,091 – –
Educational Services:Supvng Teacher II, School for the Blind.. – 3 3 4,524–5,496 213,456 213,456Supvng Teacher I, School for the Blind ... – 1 1 4,309–5,234 67,608 67,608Supvng Teacher II...................................... 2.8 – – 4,105–4,988 – –Teacher Spec .............................................. 3.8 12 12 4,103–4,985 742,422 756,940Teacher ....................................................... 40 – – 2,728–4,443 – –Teacher, School for the Blind ................... – 35 35 2,728–4,443 1,993,632 2,011,078Library Tech Asst I .................................... 1 1 1 2,371–2,883 34,596 34,596Ofc Techn-Typing ...................................... 2.4 3 3 2,258–2,745 97,474 98,790Teaching Asst ............................................. 7 11 11 1,978–2,405 292,174 302,464Support Svcs Asst-Gen .............................. – 1 1 1,775 21,300 22,368
Pupil Personnel Services:Librarian..................................................... – 1 1 3,589–4,551 43,068 45,216Teacher, School for the Blind ................... – 1 1 2,728–4,443 50,856 53,316
Consolidated Services:Staff Info Sys Analyst-Supvr .................... – 1 1 4,334–5,269 54,756 57,492Bus Mgr I................................................... 0.3 1 1 4,346–5,243 62,916 62,916Assoc Info Sys Analyst-Spec .................... – 1 1 3,952–4,805 49,800 52,296Supvr-Bldg Trades ..................................... – 1 1 3,595–4,545 43,140 45,300Bus Svc Ofcr Supvr................................... 0.3 1 1 3,290–3,955 40,485 42,513Staff Svcs Analyst-Gen.............................. 0.6 1 1 2,411–3,805 45,660 45,660Pers Svcs Spec I ........................................ 1 1 1 2,226–3,222 38,664 38,664Bus Svc Asst-Spec..................................... 0.8 – – 2,135–3,173 – –Ofc Asst-Typing......................................... 2.6 3 3 1,835–2,370 77,812 80,274Security Guard ........................................... 4.3 5 5 1,860–2,259 135,470 136,616
Totals ................................................... 123.5 156.4 156.4 $5,331,760 $6,771,056 $6,876,034
Diagnostic Center, Central California:Administration:
Diagnostic Cntr Director ........................... – 1 1 6,107–6,733 85,596 85,596Supvng Teacher, Diagnostic Cntr.............. – 1 1 5,234–6,359 72,360 75,984Prin ............................................................. 1 – – 5,556–6,127 – –Supvng Teacher II...................................... 0.2 – – 4,681–5,689 – –Staff Info Sys Analyst-Spec ...................... – 1 1 4,334–5,269 60,540 60,540Assoc Info Sys Analyst-Spec .................... 1 – – 3,952–4,805 – –Bus Svc Ofcr II-Supvr............................... 0.8 1 1 3,607–4,346 43,284 45,444Sr Word Proc Techn .................................. 1 1 1 2,346–2,852 34,236 34,236Ofc Techn-Typing ...................................... 1.8 2 2 2,258–2,745 63,219 64,728Word Proc Techn ....................................... 3.9 4 4 1,951–2,546 122,208 122,208Temporary Help ......................................... 0.3 4.4 4.4 (10,686) 10,686 10,686
Assessments and Training Services:Physician & Surgeon ................................. 0.9 1 1 6,447–10,239 77,364 81,228Supvng Teacher, Diagnostic Cntr.............. – 1 1 5,234–6,359 79,248 79,248Supvng Teacher II...................................... 1 – – 4,681–5,689 – –Teacher Spec .............................................. 3.2 – – 4,425–5,377 – –Teacher Spec, Diagnostic Cntr .................. – 16 16 4,425–5,377 1,104,036 1,105,584Teacher-Diagnostic..................................... 10.7 – – 3,097–5,046 – –Registered Nurse........................................ 0.5 0.5 0.5 3,235–4,600 25,026 25,026Word Proc Techn ....................................... 0.1 1 1 1,951–2,546 23,412 24,588Ofc Asst-Typing......................................... 1 1 1 1,835–2,370 28,440 28,440
Plant Operation:Bldg Maint Worker .................................... 1 1 1 2,726–3,276 35,904 35,904Groundskeeper ........................................... 0.9 1 1 2,299–2,856 29,573 30,800Laborer ....................................................... 1 1 1 2,299–2,507 30,084 30,084Security Guard ........................................... 1 1 1 1,860–2,259 28,148 28,148Janitor......................................................... 1 2 2 1,795–2,182 49,304 50,408
Totals ................................................... 32.3 41.9 41.9 $1,699,396 $2,002,668 $2,018,880
Diagnostic Center, Northern California:Administrative Services and ResidentialPrograms:
Diagnostic Cntr Director ........................... – 1 1 6,107–6,733 86,256 86,256Supvng Teacher, Diagnostic Cntr.............. – 2 2 5,234–6,359 158,496 158,496Prin ............................................................. 1 – – 5,556–6,127 – –
SALARY RANGE
EDUCATION E 13
6100 DEPARTMENT OF EDUCATION—Continued
ORGANIZATIONAL UNIT NUMBER OF POSITIONS EXPENDITURES
Filled Authorized Proposed Actual Estimated ProposedClassification 1999–00 2000–01 2001–02 1999–00 2000–01 2001–02
123456789
1011121314151617181920212223242526272829303132333435363738394041424344454647484950515253545556575859606162636465666768697071727374757677787980
Page 15
Supvng Teacher II...................................... 2 – – 4,681–5,689 – –Sr Word Proc Techn .................................. 1 1 1 2,346–2,852 34,236 34,236Temporary Help ......................................... 0.6 5.7 5.7 (31,738) 31,738 31,738
Assessments and Training Services:Physician & Surgeon ................................. 0.6 1 1 6,447–10,239 122,868 122,868Teacher Spec .............................................. 2.8 – – 4,425–5,377 – –Teacher Spec, Diagnostic Cntr .................. – 19 19 4,425–5,377 1,289,259 1,296,666Teacher-Diagnostic..................................... 11.8 – – 3,097–5,046 – –
Business Services:Assoc Info Sys Analyst-Spec .................... 1 1 1 3,952–4,805 58,845 58,845Stationary Engr .......................................... 1 1 1 4,213–4,634 50,556 50,556Acctg Ofcr-Supvr....................................... 1 1 1 3,287–3,995 47,940 47,940Staff Svcs Analyst-Gen.............................. 1 1 1 2,411–3,805 45,660 45,660Pers Svcs Spec I ........................................ 1 1 1 2,226–3,222 38,664 38,664Accountant I-Spec...................................... 1 1 1 2,456–2,985 35,820 35,820Groundskeeper ........................................... 1 1 1 2,299–2,856 31,332 31,332Ofc Techn-Typing ...................................... 1.9 3 3 2,258–2,745 93,312 96,336Med Transcriber......................................... 1 1 1 2,215–2,693 32,316 32,316Word Proc Techn ....................................... 2 3 3 1,951–2,546 77,376 79,728Ofc Asst-Gen.............................................. 1 1 1 1,775–2,370 28,440 28,440Security Guard ........................................... 0.8 1 1 1,860–2,259 28,148 28,148Janitor......................................................... 1 1 1 1,795–2,182 26,184 26,184
Totals ................................................... 34.5 46.7 46.7 $1,835,765 $2,317,446 $2,330,229
Diagnostic Center, Southern California:Administration Services:
Supvng Teacher, Diagnostic Cntr.............. – 1 1 5,234–6,359 79,248 79,248Prin ............................................................. 1 – – 5,556–6,127 – –Sr Info Sys Analyst-Spec .......................... 1 1 1 4,767–5,794 69,528 69,528Supvng Teacher II...................................... 1.1 – – 4,681–5,689 – –Teacher Spec, Diagnostic Cntr .................. – 1 1 4,425–5,377 85,596 85,596Assoc Info Sys Analyst-Spec .................... 1 1 1 3,952–4,805 54,519 57,039Stationary Engr .......................................... 1 1 1 4,213–4,634 50,556 50,556Bus Svc Ofcr II-Supvr............................... 1 1 1 3,607–4,346 49,137 51,214Bldg Maint Worker .................................... 1 1 1 2,726–3,276 34,474 35,904Lead Groundskeeper .................................. 1 1 1 2,400–3,132 34,272 34,272Sr Word Proc Techn .................................. 1 1 1 2,346–2,852 34,236 34,236Ofc Techn-Gen........................................... 1 1 1 2,258–2,745 32,940 32,940Ofc Techn-Typing ...................................... 0.9 2 2 2,258–2,745 59,639 61,511Word Proc Techn ....................................... 1.7 3 3 1,951–2,546 78,836 82,785Ofc Asst-Typing......................................... 0.6 – – 1,835–2,370 – –Security Guard ........................................... 1 1 1 1,860–2,259 28,148 28,148Janitor......................................................... 2 2 2 1,795–2,182 53,408 53,408Temporary Help ......................................... 0.1 2.6 2.6 (3,093) 3,093 3,093
Assessments and Training Services:Physician & Surgeon ................................. 1 1 1 6,447–10,239 122,868 122,868Supvng Teacher, Diagnostic Cntr.............. – 1 1 5,234–6,359 79,248 79,248Supvng Teacher II...................................... 1 – – 4,681–5,689 – –Teacher Spec .............................................. 5.6 – – 4,425–5,377 – –Teacher Spec, Diagnostic Cntr .................. – 18 18 4,425–5,377 1,226,691 1,234,855Teacher-Diagnostic..................................... 9.8 – – 3,097–5,046 – –Registered Nurse........................................ 1 1 1 3,235–4,600 50,052 50,052
Totals ................................................... 34.8 41.6 41.6 $1,927,782 $2,226,489 $2,246,501
California School for the Deaf-Fremont:Administration:
Site Supt, School for the Deaf .................. – 1 1 7,196–7,932 101,184 101,184Site Supt, CSD/DOE ................................. 1 – – 6,717–7,404 – –Bus Mgr II ................................................. 1 1 1 4,864–5,869 71,628 71,628Teacher Spec .............................................. 2 2 2 4,103–4,985 131,640 131,640Assoc Govtl Prog Analyst ......................... 1 1 1 3,764–4,576 56,112 56,112Teacher ....................................................... 1 – – 2,728–4,443 – –Teacher, School for the Deaf..................... – 1 1 2,728–4,443 59,316 59,316Support Svcs Asst-Interpreter.................... 0.5 1 1 2,537–3,519 42,228 42,228Pers Svcs Supvr I ...................................... 1 1 1 2,865–3,485 43,020 43,020Pers Svcs Spec I ........................................ 1.8 2 2 2,226–3,222 67,776 69,168Exec Secty I............................................... 1 1 1 2,585–3,142 38,904 38,904Ofc Techn-Typing ...................................... 1 1 1 2,258–2,745 33,711 34,131Ofc Asst-Typing......................................... 1 1 1 1,835–2,370 27,262 28,400Temporary Help ......................................... 17 5.5 5.5 (438,007) 438,007 438,007Overtime..................................................... – – – (36,356) 36,356 36,356
SALARY RANGE
EDUCATIONE 14
6100 DEPARTMENT OF EDUCATION—Continued
ORGANIZATIONAL UNIT NUMBER OF POSITIONS EXPENDITURES
Filled Authorized Proposed Actual Estimated ProposedClassification 1999–00 2000–01 2001–02 1999–00 2000–01 2001–02
123456789
1011121314151617181920212223242526272829303132333435363738394041424344454647484950515253545556575859606162636465666768697071727374757677787980
Page 16
Division of Support Services:Supvng Teacher II, School for the Deaf ... – 1 1 4,524–5,496 71,952 75,552Chief-Plant Ops I....................................... 1 1 1 4,119–4,970 60,840 60,840Stationary Engr .......................................... 2 3 3 4,213–4,634 151,668 151,668Supvr-Bldg Trades ..................................... 1 1 1 3,595–4,545 50,868 50,868Electrician I................................................ 1.7 2 2 3,276–3,947 86,280 86,280Carpenter I ................................................. 2 2 2 3,132–3,766 82,392 82,392Painter I...................................................... 1.4 3 3 3,132–3,766 120,604 122,436Bldg Maint Worker .................................... 1 1 1 2,726–3,276 35,904 35,904Auto Equipt Opr I...................................... 2 2 2 2,611–3,132 69,744 69,744Groundskeeper ........................................... 0.8 1 1 2,299–2,856 31,332 31,332Janitor Supvr II .......................................... 1 1 1 2,145–2,610 30,810 31,320Janitor Supvr I ........................................... 0.9 1 1 1,927–2,341 29,292 29,292Janitor......................................................... 13.3 15 15 1,795–2,182 367,152 377,638
Division of Instruction:Supvg Teacher III, School for the Deaf.... – 1 1 4,876–5,924 74,808 74,808Prin ............................................................. 0.4 1 1 5,228–5,763 72,108 75,708Supvng Teacher-Fiscal Year Employee..... 1 – – 4,720–5,734 – –Supvng Teacher II, School for the Deaf ... – 7 7 4,524–5,496 501,352 509,164Supvng Teacher I, School for the Deaf .... – 2 2 4,524–5,496 126,516 129,396Staff Info Sys Analyst-Spec ...................... – 1 1 4,334–5,269 47,424 49,800Supvng Teacher II...................................... 7.3 – – 4,105–4,988 – –Teacher Spec .............................................. – 6.5 6.5 4,103–4,985 341,034 358,074Assoc Info Sys Analyst-Spec .................... 0.1 – – 3,952–4,805 – –TV Spec ..................................................... 1 1 1 3,764–4,576 54,912 54,912Supvng Teacher I ....................................... 1 – – 2,730–4,447 – –Teacher ....................................................... 101.6 – – 2,728–4,443 – –Teacher, School for the Deaf..................... – 104.6 104.6 2,728–4,443 5,710,330 5,801,193Support Svcs Asst-Interpreter.................... – 0.5 0.5 2,537–3,519 – –Info Sys Techn ........................................... 1.9 2 2 2,122–3,046 58,936 61,824Ofc Techn-Typing ...................................... 6.8 9 9 2,258–2,745 290,363 296,690Word Proc Techn ....................................... 0.3 1 1 1,951–2,546 26,760 28,096Teaching Asst ............................................. 11.3 21.2 21.2 1,978–2,405 564,949 592,118Ofc Asst-Typing......................................... 2.9 2.5 2.5 1,835–2,370 68,262 69,450Temporary Help ......................................... 6 3 3 (211,942) 211,942 211,942
Division of Pupil Personnel Service:Supvng Teacher III, School for the Deaf.. – 1 1 4,876–5,924 77,112 77,112Supvng Teacher II, School for the Deaf ... – 1 1 4,524–5,496 71,952 71,952Supvng Teacher I, School for the Deaf .... – 1 1 4,524–5,496 68,808 68,808Supvng Teacher II...................................... 3 – – 4,105–4,988 – –Teacher Spec .............................................. 3.8 8.6 8.6 4,103–4,985 552,184 557,456Teacher ....................................................... 11.4 – – 2,728–4,443 – –Teacher, School for the Deaf..................... – 6.9 6.9 2,728–4,443 391,652 396,536Ofc Techn-Typing ...................................... 0.3 – – 2,258–2,745 – –Word Proc Techn ....................................... 0.8 2 2 1,951–2,546 60,420 61,104Ofc Asst-Typing......................................... 0.6 – – 1,835–2,370 – –
Division of Student Life:Supvng Teacher III, School for the Deaf.. – 1 1 4,876–5,924 96,600 96,600Supvng Teacher-Fiscal Year Employee..... 1.1 – – 4,720–5,734 – –Supvr of Residence Progs, CSD ............... 1.3 4 4 3,226–3,921 186,576 189,408Staff Svcs Analyst-Gen.............................. 0.7 1 1 2,411–3,805 30,132 31,644Supvng Counselor, CSD............................ 4.3 11 11 2,933–3,527 472,263 493,635Counselor, CSD ......................................... 33.9 58 58 2,228–3,261 2,103,708 2,159,853Transp Coord ............................................. 1 1 1 2,668–3,242 40,104 40,104Supvng Instl Counselor ............................. 1.9 – – 2,686–3,230 – –Instl Counselor........................................... 3.7 – – 2,457–2,942 – –Dispatcher Clk ........................................... 1 1 1 2,371–2,882 35,766 35,784Ofc Techn-Typing ...................................... 1 1 1 2,258–2,745 34,140 34,140Counselor ................................................... 0.2 – – 2,267–2,692 – –Counselor ................................................... 8.1 – – 2,267–2,692 – –Night Attendant, CSD................................ 9.6 17 17 1,970–2,395 512,388 519,055Attendant Resident Schools....................... 4.6 – – 1,804–2,091 – –
Division of Outreach and Counseling:Supvng Teacher I, School for the Deaf .... – 1 1 4,524–5,496 68,808 68,808Staff Info Sys Analyst-Supvr .................... – 1 1 4,334–5,269 52,008 54,612Supvng Teacher II...................................... 1 – – 4,105–4,988 – –Teacher ....................................................... 3.3 – – 2,728–4,443 – –Teacher, School for the Deaf..................... – 3.5 3.5 2,728–4,443 205,639 206,871Ofc Techn-Typing ...................................... 1 1 1 2,258–2,745 34,140 34,140Temporary Help ......................................... 3.5 2 2 (169,852) 169,852 169,852
SALARY RANGE
EDUCATION E 15
6100 DEPARTMENT OF EDUCATION—Continued
ORGANIZATIONAL UNIT NUMBER OF POSITIONS EXPENDITURES
Filled Authorized Proposed Actual Estimated ProposedClassification 1999–00 2000–01 2001–02 1999–00 2000–01 2001–02
123456789
1011121314151617181920212223242526272829303132333435363738394041424344454647484950515253545556575859606162636465666768697071727374757677787980
Page 17
Consolidated Services:Physician & Surgeon ................................. 0.1 0.1 0.1 6,447–10,239 15,359 15,359Director-Dietetics ....................................... 1 1 1 4,336–5,271 63,252 63,252Acctg Administrator I-Supvr ..................... 1 1 1 4,346–5,243 64,116 64,116Supvng Registered Nurse .......................... 0.5 1 1 3,831–4,613 56,556 56,556Registered Nurse........................................ 4.3 5 5 3,235–4,600 250,380 252,388Acctg Ofcr-Spec......................................... 1 1 1 3,287–3,995 47,940 47,940Supvng Groundskeeper I ........................... 1 1 1 2,726–3,595 39,312 39,312Materials & Stores Spec............................ 2 2 2 2,462–3,210 70,248 70,248Prop Controller I........................................ 1 1 1 2,484–3,018 36,216 36,216Supvng Cook I........................................... 1 2 2 2,483–3,017 67,200 68,688Accountant I-Spec...................................... 1 1 1 2,456–2,985 35,820 35,820Groundskeeper ........................................... 4.3 7 7 2,299–2,856 207,108 212,772Cook II ....................................................... 4.7 6 6 2,276–2,766 195,078 196,554Acctg Techn ............................................... 3.8 5 5 2,258–2,745 158,804 161,284Food Svc Supvr I....................................... 1 2 2 2,114–2,568 56,220 57,492Acct Clk II ................................................. 0.3 1 1 2,023–2,461 24,882 26,124Ofc Asst-Typing......................................... 1.4 1.5 1.5 1,835–2,370 43,774 43,858Svc Asst-Maint........................................... 0.8 1 1 2,123–2,299 26,958 27,588Janitor......................................................... 1 1 1 1,795–2,182 26,184 26,184Food Svc Worker I .................................... 14.9 21.5 21.5 1,766–2,145 515,248 527,915
Totals ................................................... 346.2 401.9 401.9 $14,915,438 $17,750,585 $18,065,675
California School for the Deaf-Riverside:Instructional Administration:
Staff Info Sys Analyst-Supvr .................... – 1 1 4,334–5,269 52,008 54,612Assoc Info Sys Analyst-Spec .................... – 2 2 3,952–4,805 97,248 102,120Teacher ....................................................... 1.9 – – 2,728–4,443 – –Teacher, School for the Deaf..................... – 2 2 2,728–4,443 98,214 102,822Teaching Asst ............................................. 1.7 2 2 1,978–2,405 60,120 60,120
General Services:Site Supt, School for the Deaf .................. – 1 1 7,196–7,932 93,296 95,184Site Supt, CSD/DOE ................................. 1 – – 6,717–7,404 – –Bus Mgr II ................................................. 1 1 1 4,864–5,860 70,428 70,428Director-Dietetics ....................................... 1 1 1 4,336–5,271 63,252 63,252Staff Info Sys Analyst-Spec ...................... – 1 1 4,334–5,269 58,860 61,800Chief Engr I ............................................... 1 1 1 4,645–5,109 55,740 55,740Chief-Plant Ops I....................................... 1 1 1 4,119–4,970 59,640 59,640Assoc Info Sys Analyst-Spec .................... 1 – – 3,952–4,805 – –Sr Acctg Ofcr-Supvr .................................. 1 1 1 3,955–4,772 57,264 57,264Stationary Engr .......................................... 4 4 4 4,213–4,634 202,224 202,224Assoc Pers Analyst .................................... 1 1 1 3,764–4,576 56,112 56,112Supvr-Bldg Trades ..................................... 1 1 1 3,595–4,545 49,668 49,668Electrician I................................................ 1 1 1 3,276–3,947 43,140 43,140Carpenter I ................................................. 2 2 2 3,132–3,766 82,392 82,392Painter I...................................................... 3 3 3 3,132–3,766 123,588 123,588Locksmith I ................................................ 1 1 1 3,132–3,766 41,196 41,196Supvng Groundskeeper I ........................... 1 1 1 2,726–3,595 39,312 39,312Materials & Stores Supvr .......................... 1 1 1 2,726–3,595 39,324 39,324Support Svcs Asst-Interpreter.................... 0.3 1 1 2,537–3,519 43,428 43,428Pers Svcs Supvr I ...................................... 1 1 1 2,865–3,485 41,820 41,820Bldg Maint Worker .................................... 3 3 3 2,726–3,276 107,712 107,712Pers Svcs Spec I ........................................ 2.9 3 3 2,226–3,222 115,992 115,992Exec Secty I............................................... 1 1 1 2,585–3,142 37,128 37,704Auto Equipt Opr I...................................... 1 1 1 2,611–3,132 34,272 34,272Lead Groundskeeper .................................. 1 1 1 2,400–3,132 34,272 34,272Supvng Cook I........................................... 1.8 2 2 2,483–3,017 66,000 67,488Accountant I-Spec...................................... 1.3 2 2 2,456–2,985 66,200 67,720Groundskeeper ........................................... 6.1 7 7 2,299–2,856 212,445 217,002Cook II ....................................................... 2.1 3 3 2,276–2,766 99,576 99,576Ofc Techn-Typing ...................................... 2 2 2 2,258–2,745 66,708 66,768Sr Acct Clk ................................................ 1 1 1 2,258–2,745 32,940 32,940Acctg Techn ............................................... 1.7 1 1 2,258–2,745 32,940 32,940Janitor Supvr II .......................................... 1 1 1 2,145–2,610 31,320 31,320Food Svc Supvr I....................................... 1.8 2 2 2,114–2,568 61,619 61,704Stock Clk.................................................... 1.9 2 2 2,070–2,517 58,037 59,370Laborer ....................................................... 1 1 1 2,299–2,507 30,084 30,084Acct Clk II ................................................. 0.9 1 1 2,023–2,461 29,532 29,532Ofc Asst-Typing......................................... 1 1 1 1,835–2,370 25,992 27,228Security Guard ........................................... 4 6 6 1,860–2,259 155,742 159,311Janitor......................................................... 16.5 19 19 1,795–2,182 480,288 485,976
SALARY RANGE
EDUCATIONE 16
6100 DEPARTMENT OF EDUCATION—Continued
ORGANIZATIONAL UNIT NUMBER OF POSITIONS EXPENDITURES
Filled Authorized Proposed Actual Estimated ProposedClassification 1999–00 2000–01 2001–02 1999–00 2000–01 2001–02
123456789
1011121314151617181920212223242526272829303132333435363738394041424344454647484950515253545556575859606162636465666768697071727374757677787980
Page 18
Food Svc Worker I .................................... 11.4 17 17 1,766–2,145 420,132 428,495Temporary Help ......................................... 34.6 6.7 6.7 (979,074) 979,074 979,074
Instruction and Support Services:Asst Site Supt, School for the Deaf.......... – 1 1 5,509–6,072 75,660 75,660Supvng Teacher III, School for the Deaf.. – 1 1 4,876–5,924 77,088 77,088Prin ............................................................. 1 – – 5,228–5,763 – –Supvng Teacher II, School for the Deaf ... – 6 6 4,524–5,496 424,152 425,616Supvng Teacher I, School for the Deaf .... – 4 4 4,524–5,496 275,232 275,232Supvng Teacher II...................................... 10 – – 4,105–4,988 – –Teacher Spec .............................................. 1.5 11 11 4,103–4,985 643,932 662,952Supvng Teacher I ....................................... 1 – – 2,730–4,447 – –Teacher ....................................................... 104.5 – – 2,728–4,443 – –Teacher, School for the Deaf..................... – 105 105 2,728–4,443 5,670,682 5,758,914Staff Svcs Analyst-Gen.............................. 1 1 1 2,411–3,805 46,860 46,860Supvng Counselor, CSD............................ 0.7 1 1 2,933–3,527 43,524 43,524Support Svcs Asst-Interpreter.................... 1.4 2 2 2,537–3,519 85,853 86,786Supvng Instl Counselor ............................. 0.1 – – 2,686–3,230 – –Ofc Techn-Typing ...................................... 8.6 9 9 2,258–2,745 307,261 311,559Teaching Asst ............................................. 17.9 21 21 1,978–2,405 596,941 613,196Ofc Asst-Typing......................................... 2.8 4.5 4.5 1,835–2,370 117,942 122,235Temporary Help ......................................... 0.7 0.7 0.7 (47,467) 47,467 47,467
Residence Hall Program:Physician & Surgeon ................................. 0.3 0.3 0.3 6,447–10,239 36,860 36,860Supvng Teacher III, School for the Deaf.. – 1 1 4,876–5,924 96,600 96,600Supvng Teacher-Fiscal Year Emp ............. 0.3 – – 4,720–5,734 – –Supvng Teacher II...................................... 0.5 – – 4,105–4,988 – –Supvng Registered Nurse .......................... 1 1 1 3,831–4,613 56,556 56,556Registered Nurse........................................ 3.2 4 4 3,235–4,600 199,360 204,200Supvng Counselor, CSD............................ 4.1 6 6 2,933–3,527 262,288 262,288Counselor, CSD ......................................... 39 60 60 2,228–3,261 2,311,126 2,363,165Transp Coord ............................................. 1 1 1 2,668–3,242 40,104 40,104Supvng Instl Counselor ............................. 1.5 – – 2,686–3,230 – –Instl Counselor........................................... 2.8 – – 2,457–2,942 – –Ofc Techn-Typing ...................................... 1 1 1 2,258–2,745 34,110 34,140Counselor ................................................... 7.8 – – 2,267–2,692 – –School Bus Driver ..................................... 0.2 1.5 1.5 2,135–2,596 45,762 46,434Night Attendant, CSD................................ 8.4 15 15 1,970–2,395 433,154 438,188Attendant Resident Schools....................... 2.1 – – 1,804–2,091 – –
Totals ................................................... 350.3 372.7 372.7 $14,416,039 $16,634,793 $16,877,290
Education Support Systems Division:C.E.A. II..................................................... 1 1 1 6,687–7,373 88,477 88,477Educ Administrator I ................................. 2 3 3 5,443–6,618 238,248 238,248Educ Prog Consultant 16 ............................ 21.6 32 31 4,898–5,951 2,169,423 2,145,447Educ Prog Asst .......................................... 5.1 2 2 3,691–5,415 125,302 128,211Assoc Govtl Prog Analyst ......................... 4.4 6 6 3,764–4,576 309,869 315,288Staff Svcs Analyst-Gen.............................. 3.8 6 6 2,411–3,805 222,277 233,403Exec Secty I............................................... 1 1 1 2,585–3,142 34,872 36,543Ofc Techn-Typing ...................................... 4.8 6 6 2,258–2,745 179,875 187,228Ofc Asst-Typing......................................... 0.9 1 1 1,835–2,370 24,392 25,608Temporary Help ......................................... 2.1 1.1 1.1 (70,982) 70,982 70,982Overtime..................................................... – – – (15,190) 15,190 15,190
Totals ................................................... 46.7 59.1 58.1 $2,732,452 $3,478,907 $3,484,625
Totals, Education Equity, Access andSupport Branch.................................... 1,088.0 1,290.0 1,285.0 $49,318,971 $60,759,924 $61,384,359
Legal and Audits Branch
Audit and Investigations Division:Supvng Mgt Auditor .................................. 1 1 1 5,800–6,395 76,317 76,740Sr Mgt Auditor........................................... 0.8 3 3 4,772–5,757 191,904 198,300Staff Mgt Auditor ...................................... 1.2 – – 4,346–5,243 – –Staff Svcs Mgr I ........................................ 1 1 1 4,346–5,243 62,916 62,916Assoc Mgt Auditor .................................... 29.9 40 40 3,952–4,805 2,177,608 2,208,056Staff Svcs Analyst-Gen.............................. 2 2 2 2,411–3,805 81,911 86,016Ofc Svcs Supvr II-Gen .............................. – 1 1 2,527–3,072 30,324 31,836Ofc Techn-Typing ...................................... 1.4 3 3 2,258–2,745 84,759 88,995Ofc Asst-Typing......................................... 3.1 2 2 1,835–2,370 49,788 52,272Overtime..................................................... – – – (55,245) 55,245 55,245
Totals ................................................... 40.4 53.0 53.0 $2,207,342 $2,810,772 $2,860,376
SALARY RANGE
EDUCATION E 17
6100 DEPARTMENT OF EDUCATION—Continued
ORGANIZATIONAL UNIT NUMBER OF POSITIONS EXPENDITURES
Filled Authorized Proposed Actual Estimated ProposedClassification 1999–00 2000–01 2001–02 1999–00 2000–01 2001–02
123456789
1011121314151617181920212223242526272829303132333435363738394041424344454647484950515253545556575859606162636465666768697071727374757677787980
60—38270
Page 19
Legal Office:C.E.A. V..................................................... 1 1 1 8,166–9,002 115,224 115,224Asst Gen Counsel ...................................... – 1 1 8,484–9,511 103,464 103,464Staff Counsel IV ........................................ 5.4 5 5 6,983–8,622 510,427 516,264Staff Counsel III-Spec ............................... 3.9 4 4 6,320–7,799 356,604 360,396Fld Rep-Spec.............................................. 0.3 – – 4,898–5,951 – –Assoc Govtl Prog Analyst ......................... 1.8 2 2 3,764–4,576 101,960 104,316Staff Svcs Analyst-Gen.............................. 0.2 – – 2,411–3,805 – –Legal Support Supvr I ............................... 1 1 1 3,001–3,649 43,788 43,788Exec Asst.................................................... – 1 1 2,813–3,419 33,756 35,448Legal Secty ................................................ 0.4 1 1 2,600–3,317 39,792 39,804Sr Steno-Legal ........................................... 0.1 – – 2,215–3,317 – –Info Sys Techn ........................................... 0.4 1 1 2,122–3,046 25,994 27,291Sr Typist-Legal........................................... 1.4 2 2 2,215–3,009 63,227 64,716Ofc Asst-Typing......................................... 0.6 – – 1,835–2,370 – –Temporary Help ......................................... 1.9 1.1 1.1 (65,654) 65,654 65,654Overtime..................................................... – – – (70) 70 70
Totals ................................................... 18.4 20.1 20.1 $1,348,751 $1,459,960 $1,476,435
Office of Equal Opportunity:Staff Svcs Mgr II-Supvry .......................... 0.3 1 1 4,772–5,757 66,735 69,084Staff Svcs Mgr I ........................................ 0.8 – – 4,346–5,243 – –Assoc Govtl Prog Analyst ......................... 2.9 3 3 3,764–4,576 154,984 157,248Staff Svcs Analyst-Gen.............................. – 1 1 2,411–3,805 30,021 31,518Temporary Help ......................................... 2.5 1.4 1.4 (87,692) 87,692 87,692
Totals ................................................... 6.5 6.4 6.4 $310,955 $339,432 $345,542
Totals, Legal and Audits Branch ........ 65.3 79.5 79.5 $3,867,048 $4,610,164 $4,682,353
Government Affairs Branch
Governmental Affairs Office:Assoc Supt-Govtl Policy ........................... 1 1 1 7,385–7,986 95,832 95,832Legislative Rep .......................................... 3.7 4 4 5,250–5,755 273,740 276,240Assoc Govtl Prog Analyst ......................... 1.5 2 2 3,764–4,576 109,824 109,824Staff Svcs Analyst-Gen.............................. 1 1 1 2,411–3,805 45,660 45,660Exec Asst.................................................... 0.5 1 1 2,813–3,419 38,820 40,764Exec Secty I............................................... 1 1 1 2,585–3,142 37,704 37,704Info Sys Techn ........................................... 1 1 1 2,122–3,046 36,552 36,552Ofc Techn-Typing ...................................... 1 1 1 2,258–2,745 32,682 32,940
Totals ................................................... 10.7 12.0 12.0 $603,596 $670,814 $675,516
Totals, Government Affairs Branch.... 10.7 12.0 12.0 $603,596 $670,814 $675,516
Accountability Branch
Accountability Branch Management:Chief Dep Supt-Pub Inst ........................... 0.8 1 1 7,517–8,131 90,204 90,204Exec Asst.................................................... 0.7 1 1 2,813–3,419 41,028 41,028
Totals ................................................... 1.5 2.0 2.0 $101,499 $131,232 $131,232
Office of Policy and Evaluation:C.E.A. II..................................................... 1 1 1 6,687–7,373 88,476 88,476Research & Eval Administrator I.............. 1 2 2 5,443–6,618 158,832 158,832Research & Eval Consultant ..................... 6.9 14.5 14.5 4,898–5,951 968,597 986,994Educ Prog Consultant ................................ 1.2 1 1 4,898–5,951 71,412 71,412Research & Eval Asst................................ 2 2 2 3,691–5,415 124,802 127,720Research Analyst II-Gen............................ 2.2 5 5 3,952–4,805 263,118 270,519Assoc Govtl Prog Analyst ......................... 1 1 1 3,764–4,576 52,020 54,228Exec Secty I............................................... 1 1 1 2,585–3,142 37,704 37,704Ofc Techn-Typing ...................................... 1.5 4 4 2,258–2,745 118,524 122,784Ofc Asst-Typing......................................... 1 1 1 1,835–2,370 28,440 28,440Temporary Help ......................................... 0.8 0.4 0.4 (26,710) 26,710 26,710Overtime..................................................... – – – (9,632) 9,632 9,632
Totals ................................................... 19.6 32.9 32.9 $1,193,049 $1,948,267 $1,983,451
Standards and Assessment Division:C.E.A. II..................................................... 0.9 1 1 6,687–7,373 88,476 92,904Research & Eval Administrator I.............. 2.8 3 3 5,443–6,618 224,148 227,412Consultant-Mathematics Educ................... 1 1 1 4,898–5,951 58,776 61,716Research & Eval Consultant ..................... 2.8 5 5 4,898–5,951 319,642 328,486Educ Prog Consultant ................................ 9.9 15 15 4,898–5,951 1,015,937 1,031,028Assoc Govtl Prog Analyst ......................... 3.8 7 7 3,764–4,576 338,759 350,204
SALARY RANGE
EDUCATIONE 18
6100 DEPARTMENT OF EDUCATION—Continued
ORGANIZATIONAL UNIT NUMBER OF POSITIONS EXPENDITURES
Filled Authorized Proposed Actual Estimated ProposedClassification 1999–00 2000–01 2001–02 1999–00 2000–01 2001–02
123456789
1011121314151617181920212223242526272829303132333435363738394041424344454647484950515253545556575859606162636465666768697071727374757677787980
Page 20
Staff Svcs Analyst-Gen.............................. 3.7 2 2 2,411–3,805 65,350 68,619Exec Secty I............................................... 1 1 1 2,585–3,142 31,020 32,568Ofc Techn-Gen........................................... 1 1 1 2,258–2,745 31,725 32,913Ofc Techn-Typing ...................................... 3.6 6 6 2,258–2,745 183,715 187,984Ofc Asst-Typing......................................... 1.5 2 2 1,835–2,370 50,808 53,352Temporary Help ......................................... 2.4 1.3 1.3 (83,510) 83,510 83,510Overtime..................................................... – – – (62,751) 62,751 62,751
Totals ................................................... 34.4 45.3 45.3 $1,943,737 $2,554,617 $2,613,447
School and District Accountability DivisionSchool and District Accountability DivisionManagement:
C.E.A. II..................................................... 0.9 1 1 6,687–7,373 88,476 88,476Educ Prog Consultant ................................ 0.5 1 1 4,898–5,951 58,776 61,716Assoc Govtl Prog Analyst ......................... 0.7 1 1 3,764–4,576 54,040 54,912Staff Svcs Analyst-Gen.............................. 0.1 – – 2,411–3,805 – –Exec Asst.................................................... 0.2 – – 2,813–3,419 – –Exec Secty I............................................... 1 1 1 2,585–3,142 37,704 37,704Temporary Help ......................................... 0.3 0.2 0.2 (11,938) 11,938 11,938
Consolidated Programs Accountability:Educ Administrator I ................................ 0.8 1 1 5,443–6,618 78,108 79,302Educ Prog Consultant ................................ 5.8 9 9 4,898–5,951 617,436 623,316Assoc Govtl Prog Analyst ......................... 1 1 1 3,764–4,576 54,040 54,912Staff Svcs Analyst-Gen.............................. 1 1 1 2,411–3,805 40,920 42,969Ofc Techn-Typing ...................................... 1 1 1 2,258–2,745 32,940 32,940Temporary Help ......................................... 3.4 1.9 1.9 (116,527) 116,527 116,527
Language Proficiency and AcademicAccountability:
Educ Administrator I ................................. 1 1 1 5,443–6,618 65,316 68,580Bi/Migrant Educ Consultant...................... 1.8 7 7 4,898–5,951 488,448 491,388Staff Svcs Analyst-Gen.............................. 1 1 1 2,411–3,805 34,834 35,184Ofc Techn-Typing ...................................... 0.6 1 1 2,258–2,745 27,096 28,452Temporary Help ......................................... 0.6 0.3 0.3 (19,769) 19,769 19,769
Coordinated Compliance Review Management:Educ Administrator I ................................. 1 1 1 5,443–6,618 79,416 79,416Educ Prog Consultant ................................ 1.2 2 2 4,898–5,951 144,024 144,024Assoc Govtl Prog Analyst ......................... 1 1 1 3,764–4,576 54,566 54,912Asst Info Sys Analyst ................................ 0.9 1 1 2,658–3,995 37,752 39,636Secty........................................................... 1 1 1 2,298–2,794 33,528 33,528Temporary Help ......................................... 2.3 1.3 1.3 (78,001) 78,001 78,001
Categorical Programs ComplaintsManagement:
Educ Administrator I ................................. 1 1 1 5,443–6,618 79,416 79,416Educ Prog Consultant ................................ 1.9 2 2 4,898–5,951 142,824 142,824Bi/Migrant Educ Consultant...................... 0.3 2 2 4,898–5,951 130,188 133,128Assoc Mgt Auditor .................................... 0.5 1 1 3,952–4,805 57,660 57,660Staff Svcs Analyst-Gen 17.......................... 0.9 2 1 2,411–3,805 63,819 34,125Ofc Techn-Typing ...................................... 0.5 – – 2,258–2,745 – –Steno........................................................... 1 1 1 1,915–2,502 30,024 30,024Ofc Asst-Typing......................................... – 1 1 1,835–2,370 24,000 25,200Temporary Help ......................................... 0.4 0.2 0.2 (14,548) 14,548 14,548Overtime..................................................... – – – (3,653) 3,653 3,653
Local Accountability Assistant and InformationManagement:
Research & Eval Administrator I.............. 1 1 1 5,443–6,618 79,416 79,416Research & Eval Consultant ..................... 2 3 3 4,898–5,951 188,964 194,844Educ Prog Consultant ................................ 0.1 1 1 4,898–5,951 58,776 61,716Educ Prog Asst .......................................... 0.1 1 1 3,691–5,415 44,292 46,512Staff Info Sys Analyst-Spec ...................... 3 3 3 4,334–5,269 189,684 189,684Assoc Govtl Prog Analyst ......................... 1 1 1 3,764–4,576 54,912 54,912Ofc Techn-Typing ...................................... 1 1 1 2,258–2,745 32,773 32,937Temporary Help ......................................... 0.1 – – (1,773) 1,773 1,773Overtime..................................................... – – – (4,182) 4,182 4,182
School Support Teams:Educ Administrator I ................................. 1 1 1 5,443–6,618 79,416 79,416Bus Educ Consultant ................................. 0.1 – – 4,898–5,951 – –Educ Prog Consultant ................................ 1.6 4 4 4,898–5,951 272,610 275,952Educ Prog Asst .......................................... 0.9 1 1 3,691–5,415 61,045 63,855Assoc Govtl Prog Analyst ......................... 1 1 1 3,764–4,576 54,912 54,912Staff Svcs Analyst-Gen.............................. 1 1 1 2,411–3,805 39,801 41,790Ofc Techn-Typing ...................................... 0.4 1 1 2,258–2,745 27,661 29,042Ofc Asst-Typing......................................... 1.6 1 1 1,835–2,370 24,000 25,200
SALARY RANGE
EDUCATION E 19
6100 DEPARTMENT OF EDUCATION—Continued
ORGANIZATIONAL UNIT NUMBER OF POSITIONS EXPENDITURES
Filled Authorized Proposed Actual Estimated ProposedClassification 1999–00 2000–01 2001–02 1999–00 2000–01 2001–02
123456789
1011121314151617181920212223242526272829303132333435363738394041424344454647484950515253545556575859606162636465666768697071727374757677787980
Page 21
Temporary Help ......................................... 0.2 0.1 0.1 (7,814) 7,814 7,814Overtime..................................................... – – – (652) 652 652
Totals ................................................... 51.7 68.0 67.0 $2,844,780 $4,022,470 $4,042,789
Totals, Accountability Branch............. 107.2 148.2 147.2 $6,083,065 $8,656,586 $8,770,919Four Percent GSI effective 08/31/00 ........ – – – – 4,571,461 5,541,176
TOTALS, AUTHORIZED POSITIONS.................... 2,286.6 2,746.2 2,732.4 $112,010,186 $142,490,612 $144,832,009Regular/Ongoing Positions........................ 2,115.2 2,650.3 2,636.5 105,698,903 135,996,471 138,299,079Temporary Help ......................................... 171.4 95.9 95.9 5,549,852 5,732,710 5,771,499Overtime..................................................... – – – 761,431 761,431 761,431
1 2.0 positions limited-term through June 30, 2002 for Child Development policy program and legislative development.2 1.0 position limited-term through June 30, 2001 for child care capacity building activities.3 3.0 positions limited-term through June 30, 2001 for child care data collection and analysis.4 1.0 position limited-term through June 30, 2002 for Personnel Services Division transaction issues.5 1.0 position limited-term through June 30, 2002 for CalSAFE.6 1.0 position limited-term through October 31, 2001 for PASR (Principal Apportionment System Rewrite) Project. (CY = 1.0, BY = .3).7 2.0 positions limited-term through June 30, 2001 for Technology Literacy Grant Program.8 1.0 position limited-term through May 31, 2002 for PASR Project. (CY = 1.0, BY = .9).9 2.0 positions limited-term through June 30, 2002 for PASR support.10 1.0 position limited-term through June 30, 2002 for Technology Literacy Grant Program.11 2.0 positions limited-term through June 2, 2002 for Digital High Schools.12 1.0 position limited-term through June 30, 2002 for California School Information System.13 3.0 positions limited-term through June 30, 2002 for School to Career Program.14 5.0 positions limited-term through July 31, 2000. (CY = .5, BY = 0). Positions established permanently effective August 1, 2000. (CY = 4.5, BY = 5.0)
for Framework Alignment with State Standards.15 4.0 positions limited-term through June 30, 2001 for Special Education Focused Monitoring.16 2.0 positions limited-term through June 30, 2001 for CalWORKS/ROCP Program.17 1.0 position limited-term through June 30, 2001 for Uniform Complaints Procedures.
6120 STATE LIBRARY
Library AdministrationLibrarian..................................................... 1 1 1 $8,057–8,713 $104,556 $104,556Asst Librarian ............................................ 1 1 1 7,886–8,529 102,348 102,348C.E.A. I ...................................................... 1 1 1 5,282–6,707 80,292 80,292Staff Svcs Mgr II ....................................... – 1 1 4,772–5,757 66,060 69,360Staff Svcs Mgr I ........................................ 2 1 1 4,346–5,243 62,916 62,916Assoc Pers Analyst .................................... 2 3 3 3,764–4,576 152,594 157,248Assoc Govtl Prog Analyst ......................... 0.8 1 1 3,764–4,576 45,168 47,424Bus Svc Ofcr II-Supvr............................... 1 1 1 3,607–4,346 52,152 52,152Acctg Ofcr-Spec......................................... 1 1 1 3,287–3,995 47,940 47,940Staff Svcs Analyst-Gen.............................. 0.6 1 1 2,411–3,805 44,905 45,660Pers Svcs Spec II....................................... 0.4 – – 2,863–3,480 – –Pers Svcs Spec I ........................................ 0.6 1 1 2,226–3,222 35,213 36,978Bus Svc Asst-Spec..................................... 1.8 2 2 2,135–3,173 65,876 69,176Secty........................................................... 0.4 – – 2,298–2,794 – –Ofc Techn-Typing ...................................... 1.6 3 3 2,258–2,745 86,466 90,795Ofc Techn-Gen........................................... 1.1 1 1 2,258–2,745 27,774 29,166Acctg Techn ............................................... 1 2 2 2,258–2,745 63,056 64,558Printing Trades Spec II-Gen...................... 1 1 1 2,094–2,681 29,544 29,544Stock Clk.................................................... 1.2 2 2 2,070–2,517 55,980 57,273Ofc Asst-Gen.............................................. 1 – – 1,775–2,370 – –Pers Techn I ............................................... 0.4 – – 12,930 – –Temporary Help ......................................... – 2 2 32,237 18,954 18,954
Totals, Library Administration .......... 20.9 26.0 26.0 $1,042,757 $1,141,794 $1,166,340
Information Technology
Information Technology-GF:C.E.A. I ...................................................... 1 1 1 5,282–6,707 80,484 80,484Sr Info Sys Analyst-Spec .......................... 1 1 1 4,767–5,794 68,976 69,528Staff Info Sys Analyst-Spec ...................... 1 1 1 4,334–5,269 63,228 63,228Asst Info Sys Analyst ................................ 2 2 2 2,658–3,995 83,716 87,905Info Sys Techn ........................................... – 1 1 2,122–3,046 25,464 26,736Temporary Help ......................................... – 1 1 92 17,601 17,601
Totals ................................................... 5.0 7.0 7.0 $288,107 $339,469 $345,482
SALARY RANGE
EDUCATIONE 20
6100 DEPARTMENT OF EDUCATION—Continued
ORGANIZATIONAL UNIT NUMBER OF POSITIONS EXPENDITURES
Filled Authorized Proposed Actual Estimated ProposedClassification 1999–00 2000–01 2001–02 1999–00 2000–01 2001–02
123456789
1011121314151617181920212223242526272829303132333435363738394041424344454647484950515253545556575859606162636465666768697071727374757677787980
Page 22
ITB-Infrastructure-GF:Assoc Info Sys Analyst-Spec .................... – 1 1 3,952–4,805 57,660 57,660Sr Librarian ................................................ 1 – – 3,903–4,741 – –Assoc Govtl Prog Analyst ......................... 0.1 1 1 3,764–4,576 45,168 47,424Temporary Help ......................................... – – – – 7,000 7,000
Totals ................................................... 1.1 2.0 2.0 $61,250 $109,828 $112,084
Totals, Information Technology ......... 6.1 9.0 9.0 $349,357 $449,297 $457,566
Library Development Services
Library Development Service Bureau:
Library Development Services-GF:C.E.A. II..................................................... 0.9 1 1 6,687–7,373 88,476 88,476C.E.A. I ...................................................... 0.1 – – 5,282–6,707 – –Library Progs Consultant........................... 2.7 4 4 4,898–5,951 272,337 275,952Prin Librarian............................................. 0.1 – – 4,770–5,797 – –Assoc Govtl Prog Analyst ......................... 1 1 1 3,764–4,576 54,905 54,912Ofc Svcs Supvr II-Gen .............................. 1 1 1 2,527–3,072 36,348 36,864Pers Techn I ............................................... – 1 1 2,061–2,932 25,812 27,108Ofc Techn-Typing ...................................... 0.3 1 1 2,258–2,745 27,774 29,166Ofc Asst-Typing......................................... 2.7 2 2 1,835–2,370 51,324 53,892Info Prog Spec III-Literacy ....................... 0.2 – – 11,954 – –
Totals ................................................... 9.0 11.0 11.0 $459,448 $556,976 $566,370
Library Development Services-FF:Library Progs Administrator...................... 0.8 1 1 5,443–6,618 78,108 79,302Library Progs Consultant........................... 4.6 6 6 4,898–5,951 415,836 418,776Prin Librarian............................................. 0.7 – – 4,770–5,797 – –Sr Librarian ................................................ 0.9 1 1 3,903–4,741 56,892 56,892Staff Svcs Analyst-Gen.............................. 0.9 1 1 2,411–3,805 45,660 45,660Ofc Techn-Typing ...................................... 1.9 2 2 2,258–2,745 64,689 65,871Ofc Asst-Typing......................................... 1.5 2 2 1,835–2,370 51,012 52,140Temporary Help ......................................... – 0.4 0.4 264 3,000 3,000
Totals ................................................... 11.3 13.4 13.4 $635,084 $715,197 $721,641
Library of California Program-GF:Library Progs Administrator...................... 0.6 1 1 5,443–6,618 67,220 70,582Library Progs Consultant........................... 1.1 2 2 4,898–5,951 127,048 132,889Prin Librarian............................................. – – – 4,770–5,797 – –Staff Svcs Analyst-Gen.............................. 0.1 1 1 2,411–3,805 28,932 30,384Secty........................................................... 1 1 1 2,298–2,794 33,528 33,528Ofc Techn-Typing ...................................... 1 1 1 2,258–2,745 31,737 32,922Ofc Asst-Typing......................................... 0.8 1 1 1,835–2,370 24,996 26,244Temporary Help ......................................... – – – 366 3,000 3,000
Totals ................................................... 4.6 7.0 7.0 $196,201 $316,461 $329,549
Library of California Administration-GF:Staff Svcs Analyst-Gen.............................. 1 1 1 2,411–3,805 37,446 39,318
Totals ................................................... 1.0 1.0 1.0 $35,634 $37,446 $39,318
California Library Services Act-GF:Assoc Mgt Auditor .................................... 0.9 1 1 3,952–4,805 57,660 57,660Assoc Govtl Prog Analyst ......................... 0.1 – – 3,764–4,576 – –Staff Svcs Analyst-Gen.............................. 1 1 1 2,411–3,805 45,660 45,660Pers Svcs Spec II....................................... 0.1 1 1 2,863–3,480 41,760 41,760Ofc Techn-Typing ...................................... 0.6 1 1 2,258–2,745 32,940 32,940Pers Svcs Spec I ........................................ 0.8 – – 31,777 – –Temporary Help ......................................... – 0.5 0.5 3,269 2,000 2,000
Totals ................................................... 3.5 4.5 4.5 $161,732 $180,020 $180,020
Library Services Technology Act-FF:Staff Svcs Analyst-Gen.............................. 1 1 1 2,411–3,805 45,660 45,660
Totals ................................................... 1.0 1.0 1.0 $44,936 $45,660 $45,660
California Library Services Board-GF:Exec Secty II.............................................. 1 1 1 2,823–3,430 41,160 41,160
Totals ................................................... 1.0 1.0 1.0 $41,118 $41,160 $41,160
Library Technology Assistance-FF:Sr Librarian ................................................ 0.1 1 1 3,903–4,741 46,836 49,176
Totals ................................................... 0.1 1.0 1.0 $4,741 $46,836 $49,176
SALARY RANGE
EDUCATION E 21
6120 STATE LIBRARY—Continued
ORGANIZATIONAL UNIT NUMBER OF POSITIONS EXPENDITURES
Filled Authorized Proposed Actual Estimated ProposedClassification 1999–00 2000–01 2001–02 1999–00 2000–01 2001–02
123456789
1011121314151617181920212223242526272829303132333435363738394041424344454647484950515253545556575859606162636465666768697071727374757677787980
Page 23
Library Service Technology Act-FF:Staff Svcs Analyst-Gen.............................. 0.4 1 1 2,411–3,805 33,440 35,112
Totals ................................................... 0.4 1.0 1.0 $12,981 $33,440 $35,112
English Language and Literacy Program-GF:Library Prog Consultant ............................ – 2 2 4,898–5,951 117,552 123,432Assoc Govtl Prog Analyst ......................... – 1 1 3,764–4,576 45,168 47,424
Totals ................................................... – 3.0 3.0 – $162,720 $170,856
Office of Library Construction Program-BF:C.E.A. I ...................................................... – 1 1 5,282–6,707 63,384 66,552Library Progs Admin ................................. – 1 1 5,443–6,618 65,316 68,580Library Progs Consultant........................... – 4 4 4,898–5,951 235,104 246,864Staff Info Sys Analyst-Spec ...................... – 1 1 4,334–5,269 53,310 55,980Staff Svcs Mgr I ........................................ – 1 1 4,346–5,243 52,152 54,756Assoc Info Sys Analyst-Spec .................... – 1 1 3,952–4,805 48,612 51,048Assoc Govtl Prog Analyst ......................... – 1 1 3,764–4,576 45,168 47,424Exec Secty I............................................... – 1 1 2,585–3,142 31,794 33,384Ofc Techn-Typing ...................................... – 2 2 2,258–2,745 55,548 58,332Temporary Help ......................................... – – – – 28,000 28,000
Totals ................................................... – 13.0 13.0 – $678,388 $710,920
Totals, Library DevelopmentServices .............................................. 31.9 56.9 56.9 $1,591,875 $2,814,304 $2,889,782
State Library Services
State Library Services Bureau-Administration-GF:C.E.A. I ...................................................... 1 1 1 5,282–6,707 80,484 80,484Prin Librarian............................................. 1 1 1 4,770–5,797 73,042 73,042Ofc Techn-Typing ...................................... 1 1 1 2,258–2,745 32,940 32,940Temporary Help ......................................... – – – – 400 400
Totals ................................................... 3.0 3.0 3.0 $189,272 $186,866 $186,866
Library Purchases-GF:Library Tech Asst I .................................... 1.2 2 2 2,371–2,883 65,208 66,738
Totals ................................................... 1.2 2.0 2.0 $38,644 $65,208 $66,738
Library Service Blind and Physical Handicap-FF:Prin Librarian............................................. 1 1 1 4,770–5,797 69,564 69,564Sr Librarian ................................................ 1 1 1 3,903–4,741 56,892 56,892Librarian..................................................... 1 1 1 3,589–4,361 46,156 48,462Staff Svcs Analyst-Gen.............................. – 1 1 2,411–3,805 28,932 30,384Ofc Mach Techn ........................................ 1 1 1 2,793–3,202 38,424 38,424Library Tech Asst II................................... – 1 1 2,615–3,180 34,908 36,650Library Tech Asst I .................................... 0.9 3 3 2,371–2,885 95,820 98,880Ofc Svcs Supvr I-Typing........................... 1 – – 2,258–2,746 – –Ofc Svcs Supvr I-Gen ............................... 0.5 1 1 2,258–2,746 27,786 29,178Printing Trades Spec II-Gen...................... 0.2 – – 2,094–2,681 – –Ofc Mach Techn Trainee ........................... 0.2 – – 2,266–2,464 – –Ofc Asst-Typing......................................... 1.4 – – 1,835–2,370 – –Ofc Asst-Gen.............................................. 9.7 11 11 1,775–2,370 289,197 296,296Temporary Help ......................................... – – – – 2,000 2,000
Totals ................................................... 17.9 21.0 21.0 $600,230 $689,679 $706,730
Library Service Blind and PhysicalHandicap-GF:
Librarian..................................................... 0.5 1 1 3,589–4,361 43,963 46,156Library Tech Asst I .................................... 1.4 3 3 2,371–2,885 91,836 96,426Ofc Mach Techn Trainee ........................... 0.2 1 1 2,266–2,464 27,870 29,058
Totals ................................................... 2.1 5.0 5.0 $67,386 $163,669 $171,640
Library-Government Publication-GF:Supvng Librarian II ................................... 1 1 1 4,338–5,273 60,540 63,276Sr Librarian ................................................ 2.2 3 3 3,903–4,741 161,010 163,370Librarian..................................................... 1.3 1.5 1.5 3,589–4,361 69,234 71,382Library Tech Asst II................................... 1 1 1 2,615–3,180 38,160 38,160Library Tech Asst I .................................... 1.1 3 3 2,371–2,885 92,177 95,957Ofc Techn-Typing ...................................... 0.8 – – 2,258–2,745 – –Ofc Asst-Typing......................................... 1.5 1 1 1,835–2,370 28,440 28,440
SALARY RANGE
EDUCATIONE 22
6120 STATE LIBRARY—Continued
ORGANIZATIONAL UNIT NUMBER OF POSITIONS EXPENDITURES
Filled Authorized Proposed Actual Estimated ProposedClassification 1999–00 2000–01 2001–02 1999–00 2000–01 2001–02
123456789
1011121314151617181920212223242526272829303132333435363738394041424344454647484950515253545556575859606162636465666768697071727374757677787980
Page 24
Ofc Asst-Gen.............................................. 1.8 2 2 1,775–2,370 54,564 55,872Temporary Help ......................................... – – – 1,566 2,089 2,089
Totals ................................................... 10.7 12.5 12.5 $423,272 $506,214 $518,546
Library-Government Publication Staff-GF:Librarian..................................................... – 1 1 3,589–4,361 43,068 45,216Ofc Asst-Typing......................................... – 2 2 1,835–2,370 45,144 47,400
Totals ................................................... – 3.0 3.0 – $88,212 $92,616
Library General Reference-GF:Supvng Librarian II ................................... 1 1 1 4,338–5,273 63,276 63,276Sr Librarian ................................................ 1 1 1 3,903–4,741 56,892 56,892Librarian..................................................... 2.9 3 3 3,589–4,361 156,996 156,996Library Tech Asst II................................... 1 1 1 2,615–3,180 38,160 38,160Library Tech Asst I .................................... 2 2 2 2,371–2,885 69,216 69,216Ofc Asst-Typing......................................... 1.8 2 2 1,835–2,370 56,880 56,880Ofc Asst-Gen.............................................. 4.2 4.5 4.5 1,775–2,370 124,740 126,000
Totals ................................................... 13.9 14.5 14.5 $549,444 $566,160 $567,420
Technical Services:Supvng Librarian II ................................... 2 2 2 4,338–5,273 126,552 126,552Sr Librarian ................................................ 1 1 1 3,903–4,741 56,892 56,892Librarian..................................................... 2 2 2 3,589–4,361 104,664 104,664Acct Techn ................................................. – 1 1 2,258–3,180 30,116 31,618Library Tech Asst I .................................... 4.8 7.5 7.5 2,371–2,883 237,558 245,973Acct Clk II ................................................. 0.6 1 1 2,023–2,461 29,312 29,532Ofc Asst-Typing......................................... 4 1 1 1,835–2,370 28,440 28,440Ofc Asst-Gen.............................................. 0.8 – – 21,330 – –
Totals ................................................... 15.2 15.5 15.5 $587,454 $613,534 $623,671
Catalog Staffing-GF:Librarian..................................................... – 1 1 3,589–4,361 43,068 45,216Library Tech Asst I .................................... – 1 1 2,371–2,885 29,166 30,630
Totals ................................................... – 2.0 2.0 – $72,234 $75,846
Law Library-GF:Sr Librarian ................................................ 1 1 1 3,903–4,741 56,892 56,892Librarian..................................................... 0.6 1 1 3,589–4,361 44,500 46,720Library Tech Asst I .................................... 0.5 1 1 2,371–2,885 30,612 32,142Ofc Asst-Typing......................................... 0.5 – – 1,835–2,370 – –Ofc Asst-Gen.............................................. 1 1 1 1,775–2,370 28,440 28,440
Totals ................................................... 3.6 4.0 4.0 $139,690 $160,444 $164,194
Law Library Special Account:Prin Librarian............................................. 0.8 1 1 4,770–6,377 71,271 74,841Librarian..................................................... 1.2 2 2 3,589–4,361 95,937 98,112Library Tech Asst II................................... – 2 2 2,615–3,180 63,284 66,452Library Tech Asst I .................................... 2 3 3 2,371–2,885 89,301 93,777Ofc Asst-Typing......................................... 1.3 1 1 1,835–2,370 24,792 26,028Ofc Asst-Gen.............................................. 1 – – 1,775–2,370 – –
Totals ................................................... 6.3 9.0 9.0 $234,265 $344,585 $359,210
Library California Section-GF:Supvng Librarian II ................................... 0.8 1 1 4,338–5,273 63,276 63,276Supvng Librarian I..................................... 0.3 1 1 3,944–4,795 57,456 57,456Sr Librarian ................................................ 0.7 – – 3,903–4,741 – –Librarian..................................................... 1 1 1 3,589–4,361 52,332 52,332Library Tech Asst II................................... 1 1 1 2,615–3,180 38,160 38,160Library Tech Asst I .................................... 2 3 3 2,371–2,885 94,736 98,896Ofc Asst-Typing......................................... 3.9 3 3 1,835–2,370 84,098 85,320
Totals ................................................... 9.7 10.0 10.0 $362,118 $390,058 $395,440
Access to California History-GF:Librarian..................................................... – 2 2 3,589–4,361 86,136 90,432Ofc Asst-Typing......................................... – 1 1 1,835–2,370 22,572 23,700
Totals ................................................... – 3.0 3.0 – $108,708 $114,132
California Heritage-GF:Librarian..................................................... 1 1 1 3,589–4,361 49,056 51,504Ofc Asst-Typing......................................... 1 1 1 1,835–2,370 27,432 28,440Ofc Asst-Gen.............................................. 1 1 1 1,775–2,370 28,440 28,440
Totals ................................................... 3.0 3.0 3.0 $99,853 $104,928 $108,384
SALARY RANGE
EDUCATION E 23
6120 STATE LIBRARY—Continued
ORGANIZATIONAL UNIT NUMBER OF POSITIONS EXPENDITURES
Filled Authorized Proposed Actual Estimated ProposedClassification 1999–00 2000–01 2001–02 1999–00 2000–01 2001–02
123456789
1011121314151617181920212223242526272829303132333435363738394041424344454647484950515253545556575859606162636465666768697071727374757677787980
Page 25
Library Sutro Section-GF:Supvng Librarian II ................................... 1 1 1 4,338–5,273 63,276 63,276Librarian..................................................... 2 2 2 3,589–4,361 99,616 101,982Library Tech Asst I .................................... 1 1 1 2,371–2,885 34,620 34,620Ofc Asst-Typing......................................... 2 2.5 2.5 1,835–2,370 65,742 67,610Ofc Asst-Gen.............................................. – – – 1,775–2,370 – –
Totals ................................................... 6.0 6.5 6.5 $249,670 $263,254 $267,488
Preservation Office-GF:Staff Svcs Mgr I ........................................ – – – 4,346–5,243 – –Document Preservation Techn................... 1 1 1 2,332–2,832 33,984 33,984Book Repairer ............................................ 0.7 2 2 1,951–2,370 48,000 50,400
Totals ................................................... 1.7 3.0 3.0 $52,687 $81,984 $84,384
California Photograph Records-GF:C.E.A. I ...................................................... – 1 1 5,282–6,707 63,384 66,552Ofc Techn-Typing ...................................... – 1 1 2,258–2,745 27,774 29,166
Totals ................................................... – 2.0 2.0 – $91,158 $95,718
Research Service Bureau-Executive-GF:Director ...................................................... 1 1 1 7,517–8,131 97,572 97,572Temporary Help ......................................... – – – 6,116 5,000 5,000
Totals ................................................... 1.0 1.0 1.0 $103,688 $102,572 $102,572
Environment-Natural Resources-GF:C.E.A. I ...................................................... 1 1 1 5,282–6,707 79,800 79,800Research Prog Spec II ............................... 1.2 1 1 4,542–5,520 66,240 66,240Research Prog Spec I ................................ 0.4 2 2 4,136–5,027 100,299 105,317Ofc Techn-Typing ...................................... 1 1 1 2,258–2,745 32,940 32,940Staff Svcs Analyst-Gen.............................. 0.4 – – 16,130 – –
Totals ................................................... 4.0 5.0 5.0 $231,054 $279,279 $284,297
Education and Human Service-GF:C.E.A. I ...................................................... 1 1 1 5,282–6,707 80,484 80,484Research Prog Spec II ............................... 1.6 3 3 4,542–5,520 190,784 193,820Research Prog Spec I ................................ 0.7 – – 4,136–5,027 – –Pers Svcs Spec I ........................................ 0.7 1 1 2,226–3,222 38,664 38,664Ofc Techn-Typing ...................................... 1 1 1 2,258–2,745 32,932 32,940
Totals ................................................... 5.0 6.0 6.0 $282,889 $342,864 $345,908
Economics-Government Structure-GF:C.E.A. I ...................................................... 1 1 1 5,282–6,707 80,484 80,484Research Prog Spec II ............................... 2.4 2 2 4,542–5,520 130,311 132,480Research Prog Spec I ................................ 0.1 1 1 4,136–5,027 49,839 52,333Ofc Techn-Typing ...................................... 1 1 1 2,258–2,745 32,940 32,940
Totals ................................................... 4.5 5.0 5.0 $270,051 $293,574 $298,237
General Law-Law Enforcement-GF:C.E.A. I ...................................................... 1 1 1 5,282–6,707 80,484 80,484Research Prog Spec II ............................... 3 3 3 4,542–5,520 198,720 198,720Ofc Techn-Typing ...................................... 1 1 1 2,258–2,745 30,642 32,166
Totals ................................................... 5.0 5.0 5.0 $307,902 $309,846 $311,370
Information Services-GF:Sr Librarian ................................................ 3 3 3 3,903–4,741 170,676 170,676Library Tech Asst I .................................... 2.6 3 3 2,371–2,885 101,083 103,389Temporary Help ......................................... – – – 1,386 2,000 2,000
Totals ................................................... 5.6 6.0 6.0 $257,279 $273,759 $276,065
Increased Workload-GF:Research Prog Spec II ............................... – 4 4 4,542–5,520 218,016 228,912Librarian..................................................... – 1 1 3,589–4,361 43,068 45,216Ofc Techn-Typing ...................................... – 1 1 2,258–2,745 27,774 29,166Temporary Help ......................................... – – – – 6,000 6,000
Totals ................................................... – 6.0 6.0 – $294,858 $309,294
Family Impact-GF:Research Prog Spec II ............................... 0.9 1 1 4,542–5,520 66,240 66,240
Totals ................................................... 0.9 1.0 1.0 $58,218 $66,240 $66,240
SALARY RANGE
EDUCATIONE 24
6120 STATE LIBRARY—Continued
ORGANIZATIONAL UNIT NUMBER OF POSITIONS EXPENDITURES
Filled Authorized Proposed Actual Estimated ProposedClassification 1999–00 2000–01 2001–02 1999–00 2000–01 2001–02
123456789
1011121314151617181920212223242526272829303132333435363738394041424344454647484950515253545556575859606162636465666768697071727374757677787980
Page 26
Government Publication-Staffing-GF:Librarian..................................................... 1 1 1 3,589–4,361 48,858 51,297
Totals ................................................... 1.0 1.0 1.0 $45,431 $48,858 $51,297
California Civil Liberties Act-GF:Library Progs Consultant........................... 0.9 1 1 4,898–5,951 63,001 66,150Info Prog Spec III-Community ................. 0.1 – – 4,918 – –Temporary Help ......................................... – – – 2,010 2,000 2,000
Totals ................................................... 1.0 1.0 1.0 $61,808 $65,001 $68,150
Homepage-GF:Prin Librarian............................................. 1 1 1 4,770–5,797 73,044 73,044Sr Librarian ................................................ 0.4 1 1 3,903–4,741 53,168 55,572Librarian..................................................... 0.5 0.5 0.5 3,589–4,361 23,736 24,924
Totals ................................................... 1.9 2.5 2.5 $117,988 $149,948 $153,540
Administrative Services-GF:C.E.A. III ................................................... 1 1 1 7,354–8,108 97,296 97,296Staff Svcs Mgr I ........................................ 1 1 1 4,346–5,243 62,916 62,916Info Ofcr I-Spec......................................... 1 1 1 3,764–4,576 54,912 54,912Assoc Budget Analyst................................ 1 1 1 3,764–4,576 54,912 54,912Sr Legal Typist........................................... 0.6 1 1 2,215–3,009 36,108 36,108Temporary Help ......................................... – 0.9 0.9 4,763 9,800 9,800
Totals ................................................... 4.6 5.9 5.9 $303,665 $315,944 $315,944
Seismic Retrofit-GF:Librarian..................................................... 0.4 1.5 – 3,589–4,361 65,139 –Ofc Asst-Typing......................................... 0.8 1 – 1,835–2,370 24,196 –Ofc Asst-Gen.............................................. 0.5 1 – 1,775–2,370 21,834 –
Totals ................................................... 1.7 3.5 – $52,523 $111,169 –
Administrative Services-Reimbursement:Research Prog Spec II ............................... 0.2 1 1 4,542–5,520 54,504 57,228
Totals ................................................... 0.2 1.0 1.0 $11,040 $54,504 $57,228
Totals, State Library Services ............ 130.7 168.9 165.4 $5,697,521 $7,205,311 $7,239,165Four Percent GSI effective 8/31/00 .......... – – – – 383,012 387,746
TOTALS, AUTHORIZED POSITIONS.................... 189.6 260.8 257.3 $8,681,510 $11,993,718 $12,140,599Regular/Ongoing Positions........................ 189.6 256.0 252.5 8,629,441 11,884,874 12,031,755Temporary Help/Overtime ......................... – 4.8 4.8 52,069 108,844 108,844
6255 CALIFORNIA STATE SUMMER SCHOOL FOR THE ARTSSummer School for the Arts Program
Director-Summer School-Arts ................... 1 1 1 $5,913–6,395 $76,740 $76,740Dep Director .............................................. 1 1 1 4,951–6,019 72,228 72,228Assoc Govtl Prog Analyst ......................... 1 1 1 3,764–4,576 48,216 50,632Ofc Tech-Typing ........................................ 1 1 1 2,258–2,745 27,096 28,452Ofc Asst-Gen.............................................. – 0.8 0.8 1,835–2,370 16,515 17,341
Totals, Summer School for the ArtsProgram .............................................. 4.0 4.8 4.8 $219,669 $240,795 $245,393
Four Percent GSI effective 8/31/00 .......... – – – – 8,026 9,816
TOTALS, AUTHORIZED POSITIONS.................... 4.0 4.8 4.8 $219,669 $248,821 $255,209Regular/Ongoing Positions........................ 4.0 4.8 4.8 219,669 248,821 255,209Temporary Help ......................................... – – – – – –Overtime..................................................... – – – – – –
6330 CALIFORNIA OCCUPATIONAL INFORMATION COORDINATING COMMITTEEStaff Svcs Mgr II-Mgrl.............................. 0.1 1 1 $5,282–5,825 $69,900 $69,900Ofc Techn-Typing ...................................... 1 1 1 2,258–2,745 32,940 32,940
Totals ................................................... 1.1 2.0 2.0 $38,765 $102,840 $102,840Four Percent GSI effective 8/31/00 .......... – – – – 3,428 4,114
TOTALS, AUTHORIZED POSITIONS.................... 1.1 2.0 2.0 $38,765 $106,268 $106,954Regular/Ongoing Positions........................ 1.1 2.0 2.0 38,765 106,268 106,954
SALARY RANGE
EDUCATION E 25
6120 STATE LIBRARY—Continued
ORGANIZATIONAL UNIT NUMBER OF POSITIONS EXPENDITURES
Filled Authorized Proposed Actual Estimated ProposedClassification 1999–00 2000–01 2001–02 1999–00 2000–01 2001–02
123456789
1011121314151617181920212223242526272829303132333435363738394041424344454647484950515253545556575859606162636465666768697071727374757677787980
Page 27
Administration Division
Executive Office:Commissioner Per Diem............................ – – – $100/day $9,000 $9,000Exec Director ............................................. 1 1 1 9,132–9,877 118,524 118,524Staff Counsel III-Spec ............................... 0.3 0.5 0.5 6,320–7,799 46,794 46,794Staff Svcs Mgr I ........................................ 1 1 1 4,346–5,243 62,916 62,916Exec Asst.................................................... 0.9 1 1 2,813–3,419 33,756 35,448Ofc Techn-Typing ...................................... 0.1 1 1 2,258–2,745 27,209 28,571Ofc Asst-Typing......................................... 1.9 0.5 0.5 1,835–2,370 11,286 11,850Ofc Asst-Gen.............................................. 0.8 – – 23,612 – –Temporary Help ......................................... 0.5 – – (18,264) – –
Totals ................................................... 6.5 5.0 5.0 $341,132 $309,485 $313,103
Office of Governmental Relations:C.E.A. I ...................................................... 1 1 1 5,282–6,825 86,868 86,868Consultant-Teacher Preparation................. 1 1 1 4,898–5,951 71,412 71,412Asst Consultant-Teacher Preparation ........ 1 1 1 3,691–5,415 62,940 64,980Staff Svcs Mgr I ........................................ – 1 1 4,346–5,243 52,152 54,756Assoc Govtl Prog Analyst ......................... 0.5 – – 3,764–4,576 – –Staff Svcs Analyst-Gen.............................. 1.2 1 1 2,411–3,805 28,922 30,384Ofc Techn-Typing ...................................... 0.3 1 1 2,258–2,745 27,435 28,809Overtime..................................................... – – – (1,019) – –
Totals ................................................... 5.0 6.0 6.0 $307,356 $329,729 $337,209
Information Technology and SupportManagement:
C.E.A. I ...................................................... 1 1 1 5,282–6,825 80,340 80,340Consultant-Teacher Preparation................. 0.1 – – 4,898–5,951 – –Assoc Info Sys Analyst-Spec .................... 0.8 1 1 3,952–4,805 57,660 57,660Ofc Techn-Typing ...................................... 1 1 1 2,258–2,745 29,285 30,755Overtime..................................................... – – – (310) – –
Totals ................................................... 2.9 3.0 3.0 $172,315 $167,285 $168,755
Fiscal and Business Services:Staff Svcs Mgr I ........................................ 1 1 1 4,346–5,243 61,756 62,916Assoc Bus Mgt Analyst ............................. 0.8 1 1 3,764–4,576 56,559 56,559Assoc Govtl Prog Analyst ......................... 2.3 2 2 3,764–4,576 109,824 109,824Assoc Govtl Prog Analyst 1....................... – 1 1 3,764–4,576 45,168 47,424Staff Svcs Analyst-Gen.............................. 0.4 1 1 2,411–3,805 40,903 42,947Bus Svc Asst-Spec..................................... 1 1 1 2,135–3,173 38,076 38,076Ofc Techn-Typing ...................................... 0.5 1 1 2,258–2,745 30,488 32,011Ofc Techn-Gen........................................... 1 1 1 2,258–2,745 32,940 32,940Ofc Asst-Typing......................................... 0.5 – – 1,835–2,370 – –Ofc Asst-Gen.............................................. 0.3 1 1 1,775–2,370 28,440 28,440Temporary Help ......................................... 0.1 – – (4,292) – –Overtime..................................................... – – – (19,940) 7,000 7,000
Totals ................................................... 7.9 10.0 10.0 $371,917 $451,154 $458,137
Information Management Systems:Sr Info Sys Analyst-Supvr......................... 1 1 1 4,762–5,794 69,528 69,528Staff Info Sys Analyst-Spec ...................... 2 2 2 4,334–5,269 126,456 126,456Staff Info Sys Analyst-Spec 2.................... – 1 – 4,334–5,269 52,008 –Assoc Programmer Analyst-Spec .............. 1 1 1 3,952–4,805 51,256 53,822Assoc Info Sys Analyst-Spec .................... 2 2 2 3,952–4,805 107,460 109,956Assoc Info Sys Analyst-Spec 2.................. – 1 – 3,952–4,805 47,424 –Programmer II............................................ 1 1 1 3,451–4,195 50,340 50,340Asst Info Sys Analyst ................................ 2.6 3 3 2,658–3,995 116,608 118,948Overtime..................................................... – – – (20,837) 6,000 6,000
Totals ................................................... 9.6 12.0 10.0 $514,732 $627,080 $535,050
Office of Human Resources:Staff Svcs Mgr II-Supvry .......................... 1 1 1 4,772–5,757 69,602 69,084Ofc Techn-Typing ...................................... 0.3 0.5 0.5 2,258–2,745 16,470 16,470
Totals ................................................... 1.3 1.5 1.5 $81,571 $86,072 $85,554
Human Resources Section:Assoc Pers Analyst .................................... 3 3 3 3,764–4,576 165,293 166,383Pers Svcs Spec II....................................... 1 1 1 2,863–3,480 41,760 41,760Pers Svcs Spec I ........................................ 0.3 0.5 0.5 2,226–3,222 18,509 18,684
Totals ................................................... 4.3 4.5 4.5 $215,296 $225,562 $226,827
SALARY RANGE
EDUCATIONE 26
6360 COMMISSION ON TEACHER CREDENTIALING
ORGANIZATIONAL UNIT NUMBER OF POSITIONS EXPENDITURES
Filled Authorized Proposed Actual Estimated ProposedClassification 1999–00 2000–01 2001–02 1999–00 2000–01 2001–02
123456789
1011121314151617181920212223242526272829303132333435363738394041424344454647484950515253545556575859606162636465666768697071727374757677787980
Page 28
Program Operations:Staff Svcs Mgr I ........................................ 0.4 – – 4,346–5,243 – –Staff Mgt Auditor ...................................... 0.5 1 1 4,346–5,243 62,904 62,916Ofc Techn-Typing ...................................... 0.3 – – 2,258–2,745 – –
Totals ................................................... 1.2 1.0 1.0 $66,983 $62,904 $62,916
Totals, Administration Division ......... 38.7 43.0 41.0 $2,071,302 $2,259,271 $2,187,551
Certification, Assignment and Waivers (CAW)Division
CAW Administration:C.E.A. II..................................................... 1 1 1 6,687–7,373 89,066 88,476Staff Svcs Mgr II-Supvry .......................... 1 1 1 4,772–5,757 61,128 64,188Research Analyst II.................................... 0.4 1 1 3,952–4,805 47,424 49,800Secty........................................................... 1 1 1 2,298–2,794 33,528 33,528Overtime..................................................... – – – (399) – –
Totals ................................................... 3.4 4.0 4.0 $210,285 $231,146 $235,992Certification:
Staff Svcs Mgr I ........................................ 1.2 3 3 4,346–5,243 162,444 170,268Assoc Govtl Prog Analyst ......................... 4.4 4 4 3,764–4,576 207,312 212,188Certification Ofcr III.................................. 0.7 – – 3,434–4,139 – –Certification Ofcr II ................................... 2.9 – – 3,130–3,805 – –Recds Mgt Analyst I.................................. 1 1 1 3,130–3,805 44,679 45,660Staff Svcs Analyst-Gen.............................. 14.4 28 28 2,411–3,805 1,068,419 1,108,491Supvng Prog Techn III .............................. 0.7 1 1 2,874–3,495 34,488 36,216Prog Techn II ............................................. 5 4 4 2,258–2,745 120,072 122,784Ofc Techn-Typing ...................................... 1.1 2 2 2,258–2,745 60,149 61,511Ofc Asst-Typing......................................... 1.2 1 1 1,835–2,370 25,098 26,352Certification Ofcr I .................................... 3.7 – – 134,235 – –Temporary Help ......................................... 0.6 0.3 0.3 (23,805) 5,000 5,000Overtime..................................................... – – – (82,003) 51,000 51,000
Totals ................................................... 36.9 44.3 44.3 $1,535,538 $1,778,661 $1,839,470Certification Support:
Ofc Svcs Supvr III-Gen............................. 1 1 1 2,874–3,495 41,940 41,940Ofc Svcs Supvr II-Gen .............................. 1.3 1 1 2,527–3,072 35,736 36,680Ofc Svcs Supvr I-Gen ............................... 0.2 1 1 2,258–2,746 32,976 32,976Ofc Techn-Typing ...................................... 0.8 2 2 2,258–2,745 54,835 57,577Ofc Asst-Gen.............................................. 4.9 5 5 1,775–2,370 131,324 133,627Temporary Help ......................................... 0.3 – – (12,288) – –Overtime..................................................... – – – (7,330) 2,000 2,000
Totals ................................................... 8.5 10.0 10.0 $275,774 $298,811 $304,800
Document Mail Preparation:Ofc Svcs Supvr I-Gen ............................... 0.3 – – 2,258–2,746 – –Ofc Techn-Gen........................................... 0.3 1 1 2,258–2,745 30,364 31,880Ofc Asst-Typing......................................... 1.3 2 2 1,835–2,370 45,144 47,400Ofc Asst-Gen.............................................. 6.3 7 7 1,775–2,370 177,757 183,789Temporary Help ......................................... 0.4 – – (16,149) – –Overtime..................................................... – – – (11,789) 1,000 1,000
Totals ................................................... 8.6 10.0 10.0 $242,462 $254,265 $264,069
Fingerprint-Records Management:Ofc Svcs Supvr II-Gen .............................. 1 1 1 2,527–3,072 36,864 36,864Microfilm Techn II .................................... 1 1 1 2,167–2,633 31,596 31,596Microfilm Techn I...................................... 0.5 0.5 0.5 1,811–2,448 14,688 14,688Ofc Asst-Typing......................................... – 0.5 0.5 1,835–2,370 11,286 11,712Ofc Asst-Gen.............................................. 5 6 6 1,775–2,370 164,034 165,126Temporary Help ......................................... 0.2 – – (8,962) – –Overtime..................................................... – – – (9,219) 2,000 2,000
Totals ................................................... 7.7 9.0 9.0 $242,726 $260,468 $261,986
Cashiering:Ofc Techn-Typing ...................................... 1 1 1 2,258–2,745 32,724 32,940Ofc Asst-Typing......................................... 4.9 6.5 6.5 1,835–2,370 168,668 172,692Temporary Help ......................................... 0.3 1 1 (11,264) 16,000 16,000Overtime..................................................... – – – (9,583) 7,000 7,000
Totals ................................................... 6.2 8.5 8.5 $182,415 $224,392 $228,632
Assignment and Waivers:Consultant-Teacher Preparation................. 1 1 1 4,898–5,951 58,776 61,716Asst Consultant-Teacher Preparation ........ 0.1 1 1 3,691–5,415 56,731 59,563
SALARY RANGE
EDUCATION E 27
6360 COMMISSION ON TEACHER CREDENTIALING—Continued
ORGANIZATIONAL UNIT NUMBER OF POSITIONS EXPENDITURES
Filled Authorized Proposed Actual Estimated ProposedClassification 1999–00 2000–01 2001–02 1999–00 2000–01 2001–02
123456789
1011121314151617181920212223242526272829303132333435363738394041424344454647484950515253545556575859606162636465666768697071727374757677787980
Page 29
Assoc Govtl Prog Analyst ......................... 2.7 2 2 3,764–4,576 93,730 98,422Overtime..................................................... – – – (3,381) – –
Totals ................................................... 3.8 4.0 4.0 $214,139 $209,237 $219,701
Totals, Certification, Assignment andWaivers (CAW) Division ................... 75.1 89.8 89.8 $2,903,339 $3,256,980 $3,354,650
Professional Services Division
Professional Services Administration:C.E.A. III ................................................... 0.3 1 1 7,354–8,108 88,248 88,248C.E.A. II..................................................... 0.4 – – 6,687–7,373 – –Exec Asst.................................................... 0.6 – 1 2,813–3,419 – 35,448Ofc Svcs Supvr II-Gen .............................. 1 1 – 2,527–3,072 36,864 –Temporary Help ......................................... 0.1 – – (3,832) – –Overtime..................................................... – – – (578) – –
Totals ................................................... 2.4 2.0 2.0 $118,177 $125,112 $123,696
Program Evaluation and Research:Teacher Preparation Administrator I ......... 1 1 1 5,443–6,618 79,416 79,416Consultant-Teacher Preparation................. 9.2 13.5 13.5 4,898–5,951 882,531 903,400Asst Consultant-Teacher Preparation ........ 1 2 2 3,691–5,415 104,349 109,467Assoc Govtl Prog Analyst ......................... 0.4 1 1 3,764–4,576 46,108 48,414Staff Svcs Analyst-Gen.............................. 0.9 1 1 2,411–3,805 35,184 35,184Ofc Svcs Supvr II-Gen .............................. 0.1 1 1 2,527–3,072 34,728 36,358Secty........................................................... 0.3 1 1 2,298–2,794 33,528 33,528Ofc Techn-Typing ...................................... 3.9 3 3 2,258–2,745 92,849 95,465
Totals ................................................... 16.8 23.5 23.5 $966,267 $1,308,693 $1,341,232
Examinations and Research:Teacher Preparation Administrator I ......... 1 1 1 5,443–6,618 78,696 79,416Consultant-Teacher Preparation................. 2.5 3.5 3.5 4,898–5,951 237,012 241,722Asst Consultant-Teacher Preparation ........ 1.8 3 3 3,691–5,415 158,231 166,146Research Analyst II-Gen............................ 1.4 1 1 3,952–4,805 57,660 57,660Staff Svcs Analyst-Gen.............................. 0.1 – – 2,411–3,805 – –Ofc Techn-Typing ...................................... 1.8 2 2 2,258–2,745 60,036 61,392
Totals ................................................... 8.6 10.5 10.5 $495,496 $591,635 $606,336
Teacher Development State Funded Programs:Teacher Preparation Administrator I ......... 0.6 1 1 5,443–6,618 75,924 78,903
Totals ................................................... 0.6 1.0 1.0 $43,743 $75,924 $78,903
Troops to Teachers:Asst Consultant-Teacher Preparation ........ 0.6 0.3 – 3,691–5,415 13,371 –Assoc Govtl Prog Analyst ......................... 0.2 – – 3,764–4,576 – –Ofc Techn-Typing ...................................... 0.5 0.3 – 2,258–2,745 6,774 –
Totals ................................................... 1.3 0.6 – $56,626 $20,145 –
Pre-Internship Program:Asst Consultant-Teacher Preparation ........ 1 1 1 3,691–5,415 60,210 63,202Staff Svcs Analyst-Gen.............................. 1 1 1 2,411–3,805 42,796 44,936
Totals ................................................... 2.0 2.0 2.0 $98,098 $103,006 $108,138
Title 2 Grant Program:Consultant-Teacher Preparation................. 0.2 1 1 4,898–5,951 58,776 61,716Assoc Govtl Prog Analyst ......................... 0.5 1 1 3,764–4,576 54,912 54,912Ofc Techn-Typing ...................................... 0.2 1 1 2,258–2,745 27,548 28,928
Totals ................................................... 0.9 3.0 3.0 $45,045 $141,236 $145,556
Totals, Professional ServicesDivision .............................................. 32.6 42.6 42.0 $1,823,452 $2,365,751 $2,403,861
Division of Professional Practices
Professional Practices Administration:Committee of Credential Per Diem .......... – – – $100/day $11,000 $11,000C.E.A. III ................................................... 1 1 1 7,354–8,108 102,060 102,060Adm Asst I................................................. 1 1 1 3,130–3,981 45,295 45,660Secty........................................................... 1 1 1 2,298–2,794 33,528 33,528Overtime..................................................... – – – (853) – –
Totals ................................................... 3.0 3.0 3.0 $190,435 $191,883 $192,248
SALARY RANGE
EDUCATIONE 28
6360 COMMISSION ON TEACHER CREDENTIALING—Continued
ORGANIZATIONAL UNIT NUMBER OF POSITIONS EXPENDITURES
Filled Authorized Proposed Actual Estimated ProposedClassification 1999–00 2000–01 2001–02 1999–00 2000–01 2001–02
123456789
1011121314151617181920212223242526272829303132333435363738394041424344454647484950515253545556575859606162636465666768697071727374757677787980
Page 30
Staff Counsel:Staff Counsel III-Spec ............................... 1 1 1 6,320–7,799 93,484 93,588Staff Counsel.............................................. 1.4 2 2 3,511–6,763 139,956 146,958
Totals ................................................... 2.4 3.0 3.0 $193,455 $233,440 $240,546
Investigation:Supvng Special Investigator II .................. 1 1 1 4,586–5,537 66,444 66,444Assoc Govtl Prog Analyst ......................... 2 2 2 3,764–4,576 106,376 108,952Sr Special Investigator............................... 2 2 2 3,630–4,371 115,368 115,368
Totals ................................................... 5.0 5.0 5.0 $273,449 $288,188 $290,764
Analytical-Technical:Staff Svcs Mgr I ........................................ 1 1 1 4,346–5,243 62,916 62,916Staff Svcs Analyst-Gen.............................. 5 6 6 2,411–3,805 249,947 255,607Supvng Prog Techn II................................ 1 1 1 2,527–3,072 36,864 36,864Prog Techn II ............................................. 6.6 7 7 2,258–2,745 225,044 227,600Ofc Techn-Typing ...................................... 1 1 1 2,258–2,745 31,606 32,920Ofc Asst-Gen.............................................. 1 1 1 1,775–2,370 26,820 28,116
Totals ................................................... 15.6 17.0 17.0 $577,936 $633,197 $644,023
Totals, Division of ProfessionalPractices ............................................. 26.0 28.0 28.0 $1,235,275 $1,346,708 $1,367,581
Office of Policy and Programs
Office of Policy and Programs Administration:C.E.A. II..................................................... 1 1 1 6,687–7,373 88,476 88,476Ofc Techn-Typing ...................................... 1 1 1 2,258–2,745 32,940 32,940
Totals, Office of Policy andPrograms ............................................ 2.0 2.0 2.0 $129,980 $121,416 $121,416
Four Percent GSI effective 8/31/00 .......... – – – – 308,440 373,562
TOTALS, AUTHORIZED POSITIONS.................... 174.4 205.4 202.8 $8,163,348 $9,658,566 $9,808,621Regular/Ongoing Positions........................ 171.9 204.1 201.5 7,891,251 9,541,566 9,691,621Temporary Help ......................................... 2.5 1.3 1.3 98,856 21,000 21,000Overtime..................................................... – – – 167,241 76,000 76,000Per Diem (Comm & Comm of Cred)........ – – – 6,000 20,000 20,000
1 Limited-term through 9-30-02.2 Limited-term through 6-30-01.
6420 CALIFORNIA POSTSECONDARY EDUCATION COMMISSION
Executive Division Director’s OfficeDirector ...................................................... 1 1 1 $12,219 $146,635 $146,635C.E.A. V..................................................... 1 1 1 8,166–9,002 105,960 105,960Commissioners........................................... – – – 100/day 12,000 12,000Chief Assoc Postsecondary Educ .............. 0.5 1 1 6,312–6,958 75,744 79,536Sr Assoc-Postsecondary Educ Studies ...... 0.5 1 1 4,898–5,951 60,246 63,258Exec Secty I............................................... 1.9 1 1 2,585–3,142 37,704 37,704Assoc Postsecondary Educ Studies........... 0.5 – – 26,742 – –Temporary Help ......................................... 0.2 0.1 – 17,488 3,000 –
Governmental Relations:Postsecondary Educ Mgr-C.E.A................ 0.5 1 1 6,939–7,651 89,742 91,812Chief Assoc Postsecondary Educ .............. 0.1 – – 6,312–6,958 – –Sr Assoc-Postsecondary Educ Studies ...... 0.8 4 4 4,898–5,951 278,206 281,964Staff Svcs Analyst-Gen.............................. 1 1 1 2,411–3,805 45,300 45,660Exec Secty I............................................... – 1 1 2,585–3,142 36,972 37,704Assoc Postsecondary Educ Studies........... 0.1 1 1 8,615 64,980 64,980Temporary Help ......................................... 0.2 0.3 – 14,424 6,000 –
Publications-Special Projects:Sr Assoc-Postsecondary Educ Studies ...... 2 1 1 4,898–5,951 71,412 71,412Assoc Postsecondary Educ Studies........... 0.1 – – 3,691–5,415 – –Editorial Techn........................................... 1 1 1 2,567–3,121 37,452 37,452Ofc Techn-Gen........................................... 0.2 1 1 2,258–2,745 29,868 31,356Temporary Help ......................................... 0.1 – – 7,393 – –
Totals, Executive Division Director’sOffice .................................................. 11.7 16.4 16.0 $818,756 $1,101,221 $1,107,433
SALARY RANGE
EDUCATION E 29
6360 COMMISSION ON TEACHER CREDENTIALING—Continued
ORGANIZATIONAL UNIT NUMBER OF POSITIONS EXPENDITURES
Filled Authorized Proposed Actual Estimated ProposedClassification 1999–00 2000–01 2001–02 1999–00 2000–01 2001–02
123456789
1011121314151617181920212223242526272829303132333435363738394041424344454647484950515253545556575859606162636465666768697071727374757677787980
Page 31
Academic Programs—Policy DivisionChief Assoc Postsecondary Educ .............. 1.1 1 1 6,312–6,958 75,744 79,536Sr Assoc-Postsecondary Educ Studies ...... 2.3 4 4 4,898–5,951 261,140 269,839Assoc Postsecondary Educ Studies........... 1.7 4 4 3,691–5,415 177,168 186,048Staff Svcs Analyst-Gen.............................. 0.7 – – 2,411–3,805 – –Mgt Svcs Techn ......................................... 0.6 – – 2,135–2,932 – –Ofc Techn-Typing ...................................... – 1 1 2,258–2,745 34,040 34,260Temporary Help ......................................... 0.6 0.8 1.2 22,634 16,000 25,000
Federal Programs Unit:Chief Assoc Postsecondary Educ .............. 0.9 1 1 6,312–6,958 83,496 83,496Staff Svcs Analyst-Gen.............................. 1.3 1 1 2,411–3,805 37,418 38,076Ofc Techn-Typing ...................................... – 1 1 2,258–2,745 27,096 28,452Temporary Help ......................................... 0.1 – – 7,386 – –
Totals, Academic Programs-PolicyDivision .............................................. 9.3 13.8 14.2 $562,191 $712,102 $744,707
Administrative DivisionC.E.A. I ...................................................... 1 1 1 5,282–6,707 82,908 82,908Sr Acctg Ofcr-Spec.................................... 1 1 1 3,764–4,576 54,912 54,912Assoc Pers Analyst .................................... 0.3 1 1 3,764–4,576 46,812 49,152Pers Svcs Spec I ........................................ – – – 2,226–3,222 – –Bus Svc Asst-Spec..................................... 1 1 1 2,135–3,173 37,908 38,076Ofc Techn-Gen........................................... 0.5 1.5 1.5 2,258–2,745 49,410 49,410Ofc Asst-Gen.............................................. 1 – – 28,440 – –Staff Svcs Analyst-Gen.............................. 0.3 – – 13,952 – –Temporary Help ......................................... 0.6 0.5 0.5 24,399 16,000 17,000
Information Systems:Assoc Postsecondary Educ Studies........... 0.3 1 1 3,691–5,415 53,930 56,628Staff Info Sys Analyst-Supvr .................... 1 1 1 4,334–5,269 60,808 62,748Assoc Programmer Analyst-Spec .............. 1.8 2 2 3,952–4,805 115,320 115,320Assoc Info Sys Analyst-Spec .................... 1.3 2 2 3,952–4,805 97,818 102,720Programmer II............................................ – 1 1 3,451–4,195 41,412 43,488Asst Info Sys Analyst ................................ 1.8 1 1 2,658–3,995 40,986 43,038Staff Svcs Analyst-Gen.............................. – 1 1 2,411–3,805 45,480 45,660Programmer I ............................................. 0.8 1 1 2,791–3,332 36,201 38,014Info Sys Techn ........................................... 1 1 1 2,122–3,046 36,552 36,552Ofc Techn-Typing ...................................... – 1 1 2,258–2,745 32,940 32,940Temporary Help ......................................... 0.2 – – (8,881) – –Overtime..................................................... – – – (4,334) – –
Totals, Administrative Division ......... 13.9 18.0 18.0 $655,317 $849,397 $868,566Four Percent GSI effective 8/31/00 .......... – – – – 88,748 108,828
TOTALS, AUTHORIZED POSITIONS.................... 34.9 48.2 48.2 $2,036,264 $2,751,468 $2,829,534Regular/Ongoing Positions........................ 32.9 46.5 46.5 1,929,325 2,710,468 2,787,534Temporary Help ......................................... 2.0 1.7 1.7 102,605 41,000 42,000Overtime..................................................... – – – 4,334 – –
6440 UNIVERSITY OF CALIFORNIA
BERKELEY CAMPUS
Instruction and Departmental ResearchGeneral Campus:
Academic.................................................... 2,247.8 2,298.9 2,298.9 $157,140,596 $167,977,151 $167,977,151Staff ............................................................ 829.4 928.3 928.3 37,340,169 43,773,691 43,773,691General Assistance..................................... 249.7 273.8 273.8 8,680,878 9,969,907 9,969,907
Health Sciences:Academic.................................................... 101.6 102.4 102.4 8,144,087 8,579,225 8,579,225Staff ............................................................ 51.9 51.2 51.2 2,319,804 2,396,992 2,396,992General Assistance..................................... 23.5 22.9 22.9 908,280 927,044 927,044
TOTALS, INSTRUCTION ANDDEPARTMENTAL RESEARCH............................... 3,503.9 3,677.5 3,677.5 $214,533,814 $233,624,010 $233,624,010
SALARY RANGE
EDUCATIONE 30
6420 CALIFORNIA POSTSECONDARY EDUCATION COMMISSION—Continued
ORGANIZATIONAL UNIT NUMBER OF POSITIONS EXPENDITURES
Filled Authorized Proposed Actual Estimated ProposedClassification 1999–00 2000–01 2001–02 1999–00 2000–01 2001–02
123456789
1011121314151617181920212223242526272829303132333435363738394041424344454647484950515253545556575859606162636465666768697071727374757677787980
Page 32
Summer SessionAcademic.................................................... 2.5 3 3 188,121 235,948 235,948Staff ............................................................ 7.1 6.9 6.9 252,923 264,676 264,676General Assistance..................................... 5.4 6.1 6.1 210,298 248,819 248,819
TOTALS, SUMMER SESSION ................................ 15.0 16.0 16.0 $651,342 $749,443 $749,443
Organized Activities-OtherAcademic.................................................... 31.1 33.6 33.6 2,685,299 3,032,295 3,032,295Staff ............................................................ 137.8 141.3 141.3 7,011,360 7,530,223 7,530,223General Assistance..................................... 96.2 98.6 98.6 3,543,347 3,803,891 3,803,891
TOTALS, ORGANIZED ACTIVITIES-OTHER...... 265.1 273.5 273.5 $13,240,006 $14,366,409 $14,366,409
Organized ResearchGeneral Campus:
Academic.................................................... 199.2 202.7 202.7 16,554,255 17,606,517 17,606,517Staff ............................................................ 205.7 207.3 207.3 8,947,031 9,444,011 9,444,011General Assistance..................................... 123.7 121.7 121.7 4,667,624 4,809,825 4,809,825
Health Sciences:Academic.................................................... 48.8 49.1 49.1 3,772,345 3,967,094 3,967,094General Assistance..................................... 24.7 24.9 24.9 955,905 1,009,322 1,009,322
TOTALS, ORGANIZED RESEARCH ..................... 602.1 605.7 605.7 $34,897,160 $36,836,769 $36,836,769
LibrariesAcademic.................................................... 95.2 99.8 99.8 6,008,709 6,583,763 6,583,763Staff ............................................................ 259.9 263.5 263.5 10,733,329 11,397,809 11,397,809General Assistance..................................... 156.1 157.6 157.6 3,140,524 3,320,994 3,320,994
TOTALS, LIBRARIES .............................................. 511.2 520.9 520.9 $19,882,562 $21,302,566 $21,302,566
University ExtensionAcademic.................................................... 75.8 81.2 81.2 4,602,658 5,153,413 5,153,413Staff ............................................................ 49.7 63.1 63.1 1,819,840 2,420,019 2,420,019General Assistance..................................... 82.4 95.6 95.6 3,350,204 4,071,126 4,071,126
TOTALS, UNIVERSITY EXTENSION ................... 207.9 239.9 239.9 $9,772,702 $11,644,558 $11,644,558
Extension and Public ServiceAcademic.................................................... 18.3 24.5 24.5 1,410,414 1,973,609 1,973,609Staff ............................................................ 123.3 141.6 141.6 5,007,747 6,023,586 6,023,586General Assistance..................................... 153.1 162 162 5,620,886 6,229,557 6,229,557
TOTALS, EXTENSION AND PUBLIC SERVICE.. 294.7 328.1 328.1 $12,039,047 $14,226,752 $14,226,752
Maintenance and Operation of PlantStaff ............................................................ 382.2 392.4 392.4 19,420,488 20,883,872 20,883,872General Assistance..................................... 314.2 323.6 323.6 10,697,501 11,539,773 11,539,773
TOTALS, MAINTENANCE AND OPERATIONOF PLANT................................................................. 696.4 716.0 716.0 $30,117,989 $32,423,645 $32,423,645
Student ServicesAcademic.................................................... 2.6 4.4 4.4 173,022 306,043 306,043Staff ............................................................ 541.3 544.1 544.1 25,588,459 26,939,987 26,939,987General Assistance..................................... 163.8 170.1 170.1 5,599,467 5,814,831 5,814,831
TOTALS, STUDENT SERVICES............................. 707.7 718.6 718.6 $31,360,948 $33,060,861 $33,060,861
Institutional SupportChancellor .................................................. 1 1 1 288,725 294,500 294,500Staff ............................................................ 692.6 695.4 695.4 36,115,440 37,980,238 37,980,238General Assistance..................................... 125.1 130.2 130.2 3,627,540 3,954,377 3,954,377
TOTALS, INSTITUTIONAL SUPPORT .................. 818.7 826.6 826.6 $40,031,705 $42,229,115 $42,229,115
TOTALS, BERKELEY CAMPUS ............................ 7,622.7 7,922.8 7,922.8 $406,527,275 $440,464,128 $440,464,128
SALARY RANGE
EDUCATION E 31
6440 UNIVERSITY OF CALIFORNIA—Continued
ORGANIZATIONAL UNIT NUMBER OF POSITIONS EXPENDITURES
Filled Authorized Proposed Actual Estimated ProposedClassification 1999–00 2000–01 2001–02 1999–00 2000–01 2001–02
123456789
1011121314151617181920212223242526272829303132333435363738394041424344454647484950515253545556575859606162636465666768697071727374757677787980
Page 33
SAN FRANCISCO CAMPUSInstruction and Departmental Research
Health Sciences:Academic.................................................... 426.7 433.4 433.4 $52,535,947 $55,772,772 $55,772,772Provision-Interns & Residents................... – – – 47,530 – –Staff ............................................................ 468.2 490.5 490.5 21,931,656 24,065,318 24,065,318General Assistance..................................... 366.8 339.2 339.2 11,432,805 12,642,112 12,642,112
TOTALS, INSTRUCTION ANDDEPARTMENTAL RESEARCH............................... 1,261.7 1,263.1 1,263.1 $85,947,938 $92,480,202 $92,480,202
Organized Activities-Hospitals and ClinicsStaff ............................................................ 4.5 22 22 232,932 1,192,759 1,192,759General Assistance..................................... 867.5 3,877 3,877 29,512,350 139,147,203 139,147,203
TOTALS, ORGANIZED ACTIVITIES-HOSPITALS AND CLINICS .................................... 872.0 3,899.0 3,899.0 $29,745,282 $140,339,962 $140,339,962
Organized Activities-OtherAcademic.................................................... 79.4 84.5 84.5 7,453,768 8,291,087 8,291,087Staff ............................................................ 547.3 574.4 574.4 25,561,045 28,098,269 28,098,269General Assistance..................................... 171.8 168.1 168.1 5,440,047 5,575,188 5,575,188
TOTALS, ORGANIZED ACTIVITIES-OTHER...... 798.5 827.0 827.0 $38,454,860 $41,964,544 $41,964,544
Organized ResearchHealth Sciences:
Academic.................................................... 112.8 130.5 130.5 7,888,465 9,538,780 9,538,780Staff ............................................................ 156.3 182.7 182.7 6,233,604 7,631,872 7,631,872General Assistance..................................... 72.8 76.6 76.6 2,254,427 2,484,544 2,484,544
TOTALS, ORGANIZED RESEARCH ..................... 341.9 389.8 389.8 $16,376,496 $19,655,196 $19,655,196
LibrariesAcademic.................................................... 12.9 13 13 907,524 955,897 955,897Staff ............................................................ 35.4 39.5 39.5 1,344,899 1,571,796 1,571,796General Assistance..................................... 15 13.1 13.1 262,208 239,849 239,849
TOTALS, LIBRARIES .............................................. 63.3 65.6 65.6 $2,514,631 $2,767,542 $2,767,542
Extension and Public ServiceAcademic.................................................... 5.8 6 6 524,587 567,205 567,205Staff ............................................................ 8.8 12.7 12.7 598,074 904,043 904,043General Assistance..................................... 3.6 1.3 1.3 155,910 58,969 58,969
TOTALS, EXTENSION AND PUBLIC SERVICE.. 18.2 20.0 20.0 $1,278,571 $1,530,217 $1,530,217
Maintenance and Operation of PlantStaff ............................................................ 140.6 148 148 6,443,037 7,103,615 7,103,615General Assistance..................................... 84.5 80 80 3,611,648 3,581,384 3,581,384
TOTALS, MAINTENANCE AND OPERATIONOF PLANT................................................................. 225.1 228.0 228.0 $10,054,685 $10,684,999 $10,684,999
Student ServicesStaff ............................................................ 52.8 54.5 54.5 2,638,268 2,852,296 2,852,296General Assistance..................................... 13 12.1 12.1 552,954 539,068 539,068
TOTALS, STUDENT SERVICES............................. 65.8 66.6 66.6 $3,191,222 $3,391,364 $3,391,364
Institutional SupportChancellor .................................................. 1 1 1 332,075 335,000 335,000Staff ............................................................ 382.7 384.4 384.4 20,823,705 21,886,621 21,886,621General Assistance..................................... 80.5 85.8 85.8 2,305,037 2,595,562 2,595,562
TOTALS, INSTITUTIONAL SUPPORT .................. 464.2 471.2 471.2 $23,460,817 $24,817,183 $24,817,183
TOTALS, SAN FRANCISCO CAMPUS ................. 4,110.7 7,230.3 7,230.3 $211,024,502 $337,631,209 $337,631,209
SALARY RANGE
EDUCATIONE 32
6440 UNIVERSITY OF CALIFORNIA—Continued
ORGANIZATIONAL UNIT NUMBER OF POSITIONS EXPENDITURES
Filled Authorized Proposed Actual Estimated ProposedClassification 1999–00 2000–01 2001–02 1999–00 2000–01 2001–02
123456789
1011121314151617181920212223242526272829303132333435363738394041424344454647484950515253545556575859606162636465666768697071727374757677787980
Page 34
DAVIS CAMPUSInstruction and Departmental Research
General Campus:Academic.................................................... 1,480.9 1,544.4 1,544.4 $101,411,972 $110,540,822 $110,540,822Staff ............................................................ 577.8 641.9 641.9 23,208,493 27,005,321 27,005,321General Assistance..................................... 290.5 293.1 293.1 8,842,344 9,344,362 9,344,362
Health Sciences:Academic.................................................... 517.7 514.8 514.8 65,143,185 67,706,250 67,706,250Provision-Interns & Residents................... – – – 7,242,182 5,141,656 5,141,656Staff ............................................................ 239.1 230.1 230.1 11,036,904 11,124,919 11,124,919General Assistance..................................... 149.8 177.2 177.2 4,819,772 5,971,603 5,971,603
TOTALS, INSTRUCTION ANDDEPARTMENTAL RESEARCH............................... 3,255.8 3,401.5 3,401.5 $221,704,852 $236,834,933 $236,834,933
Summer SessionAcademic.................................................... 1.2 2.5 2.5 88,826 193,419 193,419Staff ............................................................ 4.8 4.3 4.3 196,285 184,173 184,173General Assistance..................................... 5.1 3.2 3.2 206,105 135,451 135,451
TOTALS, SUMMER SESSION ................................ 11.1 10.0 10.0 $491,216 $513,043 $513,043
Organized Activities-Hospitals and ClinicsStaff ............................................................ 38.7 31.4 31.4 4,714,999 4,006,940 4,006,940Provision-Interns & Residents................... – – – 10,122,219 7,058,115 7,058,115General Assistance..................................... 4,467.3 4,438.6 4,438.6 154,609,634 160,897,766 160,897,766
TOTALS, ORGANIZED ACTIVITIES-HOSPITALS AND CLINICS .................................... 4,506.0 4,470.0 4,470.0 $169,446,852 $171,962,821 $171,962,821
Organized Activities-OtherAcademic.................................................... 26.2 30.5 30.5 1,886,563 3,295,457 3,295,457Staff ............................................................ 241.6 243.8 243.8 10,279,863 10,865,173 10,865,173Provision-Interns & Residents................... – – – 1,660,763 1,752,472 1,752,472General Assistance..................................... 126.3 130.8 130.8 3,228,440 3,771,948 3,771,948
TOTALS, ORGANIZED ACTIVITIES-OTHER...... 394.1 405.1 405.1 $17,055,629 $19,685,050 $19,685,050
Organized ResearchGeneral Campus:
Academic.................................................... 270.7 272.2 272.2 22,756,634 23,917,032 23,917,032Staff ............................................................ 226.4 228.9 228.9 9,720,301 10,293,466 10,293,466General Assistance..................................... 140.5 141.8 141.8 4,168,435 4,406,417 4,406,417
Health Sciences:Academic.................................................... 15.7 17.1 17.1 1,466,536 1,669,509 1,669,509Staff ............................................................ 31.7 39.5 39.5 1,335,932 1,743,551 1,743,551General Assistance..................................... 49.6 61 61 1,769,692 2,279,599 2,279,599
TOTALS, ORGANIZED RESEARCH ..................... 734.6 760.5 760.5 $41,217,530 $44,309,574 $44,309,574
LibrariesAcademic.................................................... 51.4 56.1 56.1 3,271,250 3,731,753 3,731,753Staff ............................................................ 198.1 204.4 204.4 6,659,015 7,196,461 7,196,461General Assistance..................................... 78.3 81.4 81.4 1,274,786 1,388,073 1,388,073
TOTALS, LIBRARIES .............................................. 327.8 341.9 341.9 $11,205,051 $12,316,287 $12,316,287
University ExtensionAcademic.................................................... 11.1 11.8 11.8 780,798 867,555 867,555Staff ............................................................ 48.6 52.9 52.9 1,633,434 1,862,231 1,862,231General Assistance..................................... 53.4 56.9 56.9 1,955,944 2,182,931 2,182,931
TOTALS, UNIVERSITY EXTENSION ................... 113.1 121.6 121.6 $4,370,176 $4,912,717 $4,912,717
Extension and Public ServiceAcademic.................................................... 18.6 22.5 22.5 1,162,353 1,469,626 1,469,626Staff ............................................................ 102.2 117.1 117.1 4,075,712 4,891,275 4,891,275General Assistance..................................... 69.5 74.7 74.7 2,218,511 2,497,526 2,497,526
TOTALS, EXTENSION AND PUBLIC SERVICE.. 190.3 214.3 214.3 $7,456,576 $8,858,427 $8,858,427
SALARY RANGE
EDUCATION E 33
6440 UNIVERSITY OF CALIFORNIA—Continued
ORGANIZATIONAL UNIT NUMBER OF POSITIONS EXPENDITURES
Filled Authorized Proposed Actual Estimated ProposedClassification 1999–00 2000–01 2001–02 1999–00 2000–01 2001–02
123456789
1011121314151617181920212223242526272829303132333435363738394041424344454647484950515253545556575859606162636465666768697071727374757677787980
61—38270
Page 35
Maintenance and Operation of PlantStaff ............................................................ 576.8 593.8 593.8 21,178,977 22,836,655 22,836,655General Assistance..................................... 136.2 148.1 148.1 3,164,626 3,604,234 3,604,234
TOTALS, MAINTENANCE AND OPERATIONOF PLANT................................................................. 713.0 741.9 741.9 $24,343,603 $26,440,889 $26,440,889
Student ServicesStaff ............................................................ 361.1 373.9 373.9 15,938,329 17,285,556 17,285,556General Assistance..................................... 132.1 136.1 136.1 2,600,950 2,816,725 2,816,725
TOTALS, STUDENT SERVICES............................. 493.2 510.0 510.0 $18,539,279 $20,102,281 $20,102,281
Institutional SupportChancellor .................................................. 1 1 1 256,775 262,000 262,000Staff ............................................................ 501.9 508.5 508.5 24,922,572 26,447,169 26,447,169General Assistance..................................... 130.4 133.2 133.2 3,393,588 3,630,767 3,630,767
TOTALS, INSTITUTIONAL SUPPORT .................. 633.3 642.7 642.7 $28,572,935 $30,339,936 $30,339,936
TOTALS, DAVIS CAMPUS ..................................... 11,372.3 11,619.5 11,619.5 $544,403,699 $576,275,958 $576,275,958
LOS ANGELES CAMPUSInstruction and Departmental Research
General Campus:Academic.................................................... 2,167.6 2,174.3 2,174.3 $152,684,118 $160,078,715 $160,078,715Staff ............................................................ 759.7 797.1 797.1 35,906,110 39,475,092 39,475,092General Assistance..................................... 392.4 401.1 401.1 16,096,907 17,320,152 17,320,152
Health Sciences:Academic.................................................... 383.9 381.7 381.7 46,116,137 47,924,365 47,924,365Provision-Interns & Residents................... – – – 6,092,600 – –Staff ............................................................ 419.8 408.6 408.6 20,100,431 20,491,506 20,491,506General Assistance..................................... 227.4 233.7 233.7 10,371,136 11,163,674 11,163,674
TOTALS, INSTRUCTION ANDDEPARTMENTAL RESEARCH............................... 4,350.8 4,396.5 4,396.5 $287,367,439 $296,453,504 $296,453,504
Summer SessionAcademic.................................................... 1.3 3 3 120,444 290,513 290,513Staff ............................................................ 14.9 15.4 15.4 630,294 682,323 682,323General Assistance..................................... 9.3 9.6 9.6 375,299 405,768 405,768
TOTALS, SUMMER SESSION ................................ 25.5 28.0 28.0 $1,126,037 $1,378,604 $1,378,604
Organized Activities-Hospitals and ClinicsStaff ............................................................ 68.4 74.7 74.7 2,941,990 3,365,257 3,365,257Provision-Interns & Residents................... – – – 13,319,355 – –General Assistance..................................... 5,115.6 5,079.3 5,079.3 181,337,635 188,585,285 188,585,285
TOTALS, ORGANIZED ACTIVITIES-HOSPITALS AND CLINICS .................................... 5,184.0 5,154.0 5,154.0 $197,598,980 $191,950,542 $191,950,542
Organized Activities-OtherAcademic.................................................... 116.4 121.3 121.3 12,232,719 13,323,854 13,323,854Staff ............................................................ 448.7 449.9 449.9 23,124,113 24,284,971 24,284,971General Assistance..................................... 272.6 277.2 277.2 9,124,399 9,718,164 9,718,164
TOTALS, ORGANIZED ACTIVITIES-OTHER...... 837.7 848.4 848.4 $44,481,231 $47,326,989 $47,326,989
Organized ResearchGeneral Campus:
Academic.................................................... 63.1 63.9 63.9 4,959,547 5,249,440 5,249,440Staff ............................................................ 75.3 76.8 76.8 3,632,097 3,880,040 3,880,040General Assistance..................................... 157.2 158.9 158.9 6,375,482 6,749,894 6,749,894
Health Sciences:Academic.................................................... 41.1 48.6 48.6 3,513,757 4,342,757 4,342,757Provision-Interns & Residents................... – – – 73,880 – –Staff ............................................................ 36.3 41.9 41.9 1,885,780 2,279,875 2,279,875General Assistance..................................... 98.9 116.8 116.8 3,722,632 4,604,783 4,604,783
TOTALS, ORGANIZED RESEARCH ..................... 471.9 506.9 506.9 $24,163,175 $27,106,789 $27,106,789
SALARY RANGE
EDUCATIONE 34
6440 UNIVERSITY OF CALIFORNIA—Continued
ORGANIZATIONAL UNIT NUMBER OF POSITIONS EXPENDITURES
Filled Authorized Proposed Actual Estimated ProposedClassification 1999–00 2000–01 2001–02 1999–00 2000–01 2001–02
123456789
1011121314151617181920212223242526272829303132333435363738394041424344454647484950515253545556575859606162636465666768697071727374757677787980
Page 36
LibrariesAcademic.................................................... 89.9 91.6 91.6 5,870,661 6,252,046 6,252,046Staff ............................................................ 228.4 231.6 231.6 9,358,989 9,939,948 9,939,948General Assistance..................................... 127.5 133.2 133.2 2,973,237 3,253,391 3,253,391
TOTALS, LIBRARIES .............................................. 445.8 456.4 456.4 $18,202,887 $19,445,385 $19,445,385
University ExtensionAcademic.................................................... 21.1 22.6 22.6 1,796,560 2,011,254 2,011,254Staff ............................................................ 259.6 285.1 285.1 10,496,697 12,074,184 12,074,184General Assistance..................................... 153.1 159.4 159.4 6,326,724 6,899,293 6,899,293
TOTALS, UNIVERSITY EXTENSION ................... 433.8 467.1 467.1 $18,619,981 $20,984,731 $20,984,731
Extension and Public ServiceStaff ............................................................ 90.8 98.1 98.1 4,837,740 5,474,422 5,474,422General Assistance..................................... 138.5 162.4 162.4 5,143,986 6,317,548 6,317,548
TOTALS, EXTENSION AND PUBLIC SERVICE.. 229.3 260.5 260.5 $9,981,726 $11,791,970 $11,791,970
Maintenance and Operation of PlantStaff ............................................................ 274.8 281.9 281.9 13,576,673 14,587,614 14,587,614General Assistance..................................... 647.5 659.6 659.6 16,250,100 17,338,419 17,338,419
TOTALS, MAINTENANCE AND OPERATIONOF PLANT................................................................. 922.3 941.5 941.5 $29,826,773 $31,926,033 $31,926,033
Student ServicesStaff ............................................................ 410.1 411.8 411.8 20,712,072 21,783,752 21,783,752General Assistance..................................... 195.7 205.1 205.1 5,646,540 6,198,260 6,198,260
TOTALS, STUDENT SERVICES............................. 605.8 616.9 616.9 $26,358,612 $27,982,012 $27,982,012
Institutional SupportChancellor .................................................. 1 1 1 264,183 294,500 294,500Staff ............................................................ 949.3 953.8 953.8 53,460,038 56,259,475 56,259,475General Assistance..................................... 144.8 151.7 151.7 4,229,191 4,640,736 4,640,736
TOTALS, INSTITUTIONAL SUPPORT .................. 1,095.1 1,106.5 1,106.5 $57,953,412 $61,194,711 $61,194,711
TOTALS, LOS ANGELES CAMPUS ...................... 14,602.0 14,782.7 14,782.7 $715,680,253 $737,541,270 $737,541,270
RIVERSIDE CAMPUSInstruction and Departmental Research
General Campus:Academic.................................................... 719.5 750.8 750.8 $45,538,033 $51,263,909 $51,263,909Staff ............................................................ 345.1 366.2 366.2 13,414,706 15,976,324 15,976,324General Assistance..................................... 190.8 209.1 209.1 6,158,070 7,068,591 7,068,591
Health Sciences:Academic.................................................... 9.1 10.5 10.5 852,829 1,028,512 1,028,512Staff ............................................................ 9.8 11.7 11.7 402,601 503,440 503,440General Assistance..................................... 3.3 3.8 3.8 99,425 119,917 119,917
TOTALS, INSTRUCTION ANDDEPARTMENTAL RESEARCH............................... 1,277.6 1,352.1 1,352.1 $66,465,664 $75,960,693 $75,960,693
Summer SessionStaff ............................................................ 1.5 2 2 103,734 144,867 144,867General Assistance..................................... 1.7 1.5 1.5 63,179 58,388 58,388
TOTALS, SUMMER SESSION ................................ 3.2 3.5 3.5 $166,913 $203,255 $203,255
Organized Activities-OtherStaff ............................................................ 17.7 19.7 19.7 1,008,121 1,175,218 1,175,218General Assistance..................................... 10.5 11.9 11.9 406,623 482,683 482,683
TOTALS, ORGANIZED ACTIVITIES-OTHER...... 28.2 31.6 31.6 $1,414,744 $1,657,901 $1,657,901
Organized ResearchGeneral Campus:
Academic.................................................... 82.3 81.9 81.9 6,917,562 7,195,095 7,195,095Staff ............................................................ 163.1 165.3 165.3 7,098,319 7,535,065 7,535,065General Assistance..................................... 45.9 44.3 44.3 1,785,281 1,804,721 1,804,721
SALARY RANGE
EDUCATION E 35
6440 UNIVERSITY OF CALIFORNIA—Continued
ORGANIZATIONAL UNIT NUMBER OF POSITIONS EXPENDITURES
Filled Authorized Proposed Actual Estimated ProposedClassification 1999–00 2000–01 2001–02 1999–00 2000–01 2001–02
123456789
1011121314151617181920212223242526272829303132333435363738394041424344454647484950515253545556575859606162636465666768697071727374757677787980
Page 37
Health Sciences:Staff ............................................................ 2.9 2.7 2.7 134,705 131,360 131,360General Assistance..................................... 1.8 1.3 1.3 58,188 44,017 44,017
TOTALS, ORGANIZED RESEARCH ..................... 296.0 295.5 295.5 $15,994,055 $16,710,258 $16,710,258
LibrariesAcademic.................................................... 29.4 39.1 39.1 1,862,563 2,589,047 2,589,047Staff ............................................................ 85.3 85.8 85.8 2,789,978 2,939,352 2,939,352General Assistance..................................... 38.9 40.2 40.2 848,136 918,026 918,026
TOTALS, LIBRARIES .............................................. 153.6 165.1 165.1 $5,500,677 $6,446,425 $6,446,425
University ExtensionAcademic.................................................... 8.3 9.6 9.6 586,229 708,696 708,696Staff ............................................................ 38.4 39.1 39.1 1,606,195 1,712,996 1,712,996General Assistance..................................... 25.1 25.3 25.3 912,360 963,220 963,220
TOTALS, UNIVERSITY EXTENSION ................... 71.8 74.0 74.0 $3,104,784 $3,384,912 $3,384,912
Extension and Public ServiceStaff ............................................................ 22.9 28.1 28.1 815,603 1,048,244 1,048,244General Assistance..................................... 29.9 35.8 35.8 797,672 1,000,343 1,000,343
TOTALS, EXTENSION AND PUBLIC SERVICE.. 52.8 63.9 63.9 $1,613,275 $2,048,587 $2,048,587
Maintenance and Operation of PlantStaff ............................................................ 229.7 233.6 233.6 8,097,125 8,624,923 8,624,923General Assistance..................................... 67.7 81.3 81.3 2,069,657 2,432,973 2,432,973
TOTALS, MAINTENANCE AND OPERATIONOF PLANT................................................................. 297.4 314.9 314.9 $10,166,782 $11,057,896 $11,057,896
Student ServicesStaff ............................................................ 117.9 128.5 128.5 4,737,340 5,407,997 5,407,997General Assistance..................................... 65.2 71.7 71.7 2,313,231 2,664,423 2,664,423
TOTALS, STUDENT SERVICES............................. 183.1 200.2 200.2 $7,050,571 $8,072,420 $8,072,420
Institutional SupportChancellor .................................................. 1 1 1 244,750 250,000 250,000Staff ............................................................ 204.9 213.3 213.3 9,736,656 10,616,254 10,616,254General Assistance..................................... 45.8 48.6 48.6 1,343,172 1,492,846 1,492,846
TOTALS, INSTITUTIONAL SUPPORT .................. 251.7 262.9 262.9 $11,324,578 $12,359,100 $12,359,100
TOTALS, RIVERSIDE CAMPUS ............................ 2,615.4 2,763.7 2,763.7 $122,802,043 $137,901,447 $137,901,447
SAN DIEGO CAMPUSInstruction and Departmental Research
General Campus:Academic.................................................... 1,174.1 1,219.6 1,219.6 $76,571,244 $84,133,762 $84,133,762Staff ............................................................ 412.7 487.9 487.9 17,048,559 22,610,406 22,610,406General Assistance..................................... 103.5 149.1 149.1 2,503,652 3,777,668 3,777,668
Health Sciences:Academic.................................................... 274.4 282.7 282.7 33,876,153 36,478,351 36,478,351Staff ............................................................ 161.8 164.2 164.2 6,856,552 7,288,077 7,288,077General Assistance..................................... 54.4 62 62 1,538,691 1,836,779 1,836,779
TOTALS, INSTRUCTION ANDDEPARTMENTAL RESEARCH............................... 2,180.9 2,365.5 2,365.5 $138,394,851 $156,125,043 $156,125,043
Summer SessionStaff ............................................................ 3.5 3.3 3.3 199,546 197,061 197,061General Assistance..................................... 5.3 4.7 4.7 210,265 195,300 195,300
TOTALS, SUMMER SESSION ................................ 8.8 8.0 8.0 $409,811 $392,361 $392,361
Organized Activities-Hospitals and ClinicsProvision-Interns & Residents................... – – – 16,909,384 10,717,427 10,717,427Staff ............................................................ 57.4 51.9 51.9 2,917,882 2,763,349 2,763,349General Assistance..................................... 2,637.6 2,539.1 2,539.1 107,996,532 108,896,317 108,896,317
TOTALS, ORGANIZED ACTIVITIES-HOSPITALS AND CLINICS .................................... 2,695.0 2,591.0 2,591.0 $127,823,798 $122,377,093 $122,377,093
SALARY RANGE
EDUCATIONE 36
6440 UNIVERSITY OF CALIFORNIA—Continued
ORGANIZATIONAL UNIT NUMBER OF POSITIONS EXPENDITURES
Filled Authorized Proposed Actual Estimated ProposedClassification 1999–00 2000–01 2001–02 1999–00 2000–01 2001–02
123456789
1011121314151617181920212223242526272829303132333435363738394041424344454647484950515253545556575859606162636465666768697071727374757677787980
Page 38
Organized Activities-OtherAcademic.................................................... 6.4 7.1 7.1 567,167 657,641 657,641Staff ............................................................ 146.3 150.9 150.9 8,018,532 8,662,681 8,662,681General Assistance..................................... 121.6 123.9 123.9 3,945,149 4,210,307 4,210,307
TOTALS, ORGANIZED ACTIVITIES-OTHER...... 274.3 281.9 281.9 $12,530,848 $13,530,629 $13,530,629
Organized ResearchGeneral Campus:
Academic.................................................... 152.5 155.2 155.2 11,255,209 11,972,224 11,972,224Staff ............................................................ 135.5 134.1 134.1 6,593,431 6,525,807 6,525,807General Assistance..................................... 48.3 52.6 52.6 1,472,432 1,679,525 1,679,525
Health Sciences:Academic.................................................... 16.6 18.1 18.1 1,371,512 1,563,038 1,563,038Staff ............................................................ 13.4 14.7 14.7 535,568 615,375 615,375General Assistance..................................... 34.4 38.6 38.6 1,164,897 1,369,080 1,369,080
TOTALS, ORGANIZED RESEARCH ..................... 400.7 413.3 413.3 $22,393,049 $23,725,049 $23,725,049
LibrariesAcademic.................................................... 46 57.6 57.6 2,796,617 3,660,135 3,660,135Staff ............................................................ 150.1 154.3 154.3 5,787,407 6,231,346 6,231,346General Assistance..................................... 103.3 100.6 100.6 2,479,793 2,529,142 2,529,142
TOTALS, LIBRARIES .............................................. 299.4 312.5 312.5 $11,063,817 $12,420,623 $12,420,623
University ExtensionAcademic.................................................... 12 13.2 13.2 897,254 1,031,591 1,031,591Staff ............................................................ 100.7 105.6 105.6 3,833,632 4,210,730 4,210,730General Assistance..................................... 20.8 21.2 21.2 674,931 720,518 720,518
TOTALS, UNIVERSITY EXTENSION ................... 133.5 140.0 140.0 $5,405,817 $5,962,839 $5,962,839
Extension and Public ServiceStaff ............................................................ 53.9 61.7 61.7 2,714,196 3,254,244 3,254,244General Assistance..................................... 34.2 42.9 42.9 853,010 1,120,722 1,120,722
TOTALS, EXTENSION AND PUBLIC SERVICE.. 88.1 104.6 104.6 $3,567,206 $4,374,966 $4,374,966
Maintenance and Operation of PlantStaff ............................................................ 347.2 369.5 369.5 11,826,229 13,182,372 13,182,372General Assistance..................................... 95.9 97.7 97.7 2,338,907 2,495,752 2,495,752
TOTALS, MAINTENANCE AND OPERATIONOF PLANT................................................................. 443.1 467.2 467.2 $14,165,136 $15,678,124 $15,678,124
Student ServicesStaff ............................................................ 305.8 322.2 322.2 13,086,897 14,442,332 14,442,332General Assistance..................................... 84.6 85.1 85.1 2,130,417 2,244,586 2,244,586
TOTALS, STUDENT SERVICES............................. 390.4 407.3 407.3 $15,217,314 $16,686,918 $16,686,918
Institutional SupportChancellor .................................................. 1 1 1 256,775 262,000 262,000Staff ............................................................ 431.1 438.3 438.3 22,265,203 23,710,061 23,710,061General Assistance..................................... 93.7 95.1 95.1 2,869,059 3,049,952 3,049,952
TOTALS, INSTITUTIONAL SUPPORT .................. 525.8 534.4 534.4 $25,391,037 $27,022,013 $27,022,013
TOTALS, SAN DIEGO CAMPUS ........................... 7,440.0 7,625.7 7,625.7 $376,362,684 $398,295,658 $398,295,658
SANTA CRUZ CAMPUSInstruction and Departmental Research
General Campus:Academic.................................................... 778.8 849.6 849.6 $44,056,643 $50,229,624 $50,229,624Staff ............................................................ 351.6 362.9 362.9 13,607,025 14,710,041 14,710,041General Assistance..................................... 80.2 98.6 98.6 2,046,575 2,635,377 2,635,377
TOTALS, INSTRUCTION ANDDEPARTMENTAL RESEARCH............................... 1,210.6 1,311.1 1,311.1 $59,710,243 $67,575,042 $67,575,042
SALARY RANGE
EDUCATION E 37
6440 UNIVERSITY OF CALIFORNIA—Continued
ORGANIZATIONAL UNIT NUMBER OF POSITIONS EXPENDITURES
Filled Authorized Proposed Actual Estimated ProposedClassification 1999–00 2000–01 2001–02 1999–00 2000–01 2001–02
123456789
1011121314151617181920212223242526272829303132333435363738394041424344454647484950515253545556575859606162636465666768697071727374757677787980
Page 39
Summer SessionAcademic.................................................... 0.8 1.1 1.1 64,605 92,846 92,846Staff ............................................................ 3.1 2.7 2.7 137,096 125,066 125,066General Assistance..................................... 2.1 1.9 1.9 88,868 93,080 93,080
TOTALS, SUMMER SESSION ................................ 6.0 5.7 5.7 $290,569 $310,992 $310,992
Organized Activities-OtherStaff ............................................................ 23.6 25.9 25.9 1,085,433 1,247,680 1,247,680General Assistance..................................... 7.9 8.8 8.8 250,015 291,699 291,699
TOTALS, ORGANIZED ACTIVITIES-OTHER...... 31.5 34.7 34.7 $1,335,448 $1,539,379 $1,539,379
Organized ResearchGeneral Campus:
Academic.................................................... 21.9 22.1 22.1 2,050,361 2,162,609 2,162,609Staff ............................................................ 29.6 28.7 28.7 1,341,107 1,361,966 1,361,966General Assistance..................................... 40.4 39.3 39.3 1,367,805 1,393,631 1,393,631
TOTALS, ORGANIZED RESEARCH ..................... 91.9 90.1 90.1 $4,759,273 $4,918,206 $4,918,206
LibrariesAcademic.................................................... 26.7 32 32 1,624,037 2,034,390 2,034,390Staff ............................................................ 72.9 76.1 76.1 2,790,716 3,051,303 3,051,303General Assistance..................................... 32.7 33 33 747,214 789,812 789,812
TOTALS, LIBRARIES .............................................. 132.3 141.1 141.1 $5,161,967 $5,875,505 $5,875,505
University ExtensionAcademic.................................................... 14.6 14.8 14.8 944,022 1,000,208 1,000,208Staff ............................................................ 32 44.7 44.7 1,297,661 1,898,590 1,898,590General Assistance..................................... 30.2 35.9 35.9 1,100,921 1,370,743 1,370,743
TOTALS, UNIVERSITY EXTENSION ................... 76.8 95.4 95.4 $3,342,604 $4,269,541 $4,269,541
Extension and Public ServiceStaff ............................................................ 53.2 67.7 67.7 2,154,724 2,871,979 2,871,979General Assistance..................................... 35.4 36.1 36.1 945,082 1,009,453 1,009,453
TOTALS, EXTENSION AND PUBLIC SERVICE.. 88.6 103.8 103.8 $3,099,806 $3,881,432 $3,881,432
Maintenance and Operation of PlantStaff ............................................................ 198.8 206.9 206.9 7,069,209 7,705,973 7,705,973General Assistance..................................... 44.9 47.1 47.1 960,998 1,055,868 1,055,868
TOTALS, MAINTENANCE AND OPERATIONOF PLANT................................................................. 243.7 254.0 254.0 $8,030,207 $8,761,841 $8,761,841
Student ServicesStaff ............................................................ 231.5 241.5 241.5 10,095,745 11,031,056 11,031,056General Assistance..................................... 61.7 65.1 65.1 1,503,155 1,661,163 1,661,163
TOTALS, STUDENT SERVICES............................. 293.2 306.6 306.6 $11,598,900 $12,692,219 $12,692,219
Institutional SupportChancellor .................................................. 1 1 1 244,750 250,000 250,000Staff ............................................................ 241.4 247.7 247.7 11,913,976 12,804,366 12,804,366General Assistance..................................... 51.9 54.1 54.1 1,710,209 1,867,203 1,867,203
TOTALS, INSTITUTIONAL SUPPORT .................. 294.3 302.8 302.8 $13,868,935 $14,921,569 $14,921,569
TOTALS, SANTA CRUZ CAMPUS ........................ 2,468.9 2,645.3 2,645.3 $111,197,952 $124,745,726 $124,745,726
SANTA BARBARA CAMPUSInstruction and Departmental Research
General Campus:Academic.................................................... 1,317.3 1,339.4 1,339.4 $78,978,063 $83,932,755 $83,932,755Staff ............................................................ 448.8 498.8 498.8 18,942,681 22,050,966 22,050,966General Assistance..................................... 156.4 186.1 186.1 4,498,843 5,606,903 5,606,903
TOTALS, INSTRUCTION ANDDEPARTMENTAL RESEARCH............................... 1,922.5 2,024.3 2,024.3 $102,419,587 $111,590,624 $111,590,624
SALARY RANGE
EDUCATIONE 38
6440 UNIVERSITY OF CALIFORNIA—Continued
ORGANIZATIONAL UNIT NUMBER OF POSITIONS EXPENDITURES
Filled Authorized Proposed Actual Estimated ProposedClassification 1999–00 2000–01 2001–02 1999–00 2000–01 2001–02
123456789
1011121314151617181920212223242526272829303132333435363738394041424344454647484950515253545556575859606162636465666768697071727374757677787980
Page 40
Summer SessionStaff ............................................................ 7.7 8.5 8.5 372,005 430,121 430,121General Assistance..................................... 4 3.6 3.6 154,471 145,613 145,613
TOTALS, SUMMER SESSION ................................ 11.7 12.1 12.1 $526,476 $575,734 $575,734
Organized Activities-OtherStaff ............................................................ 15.2 17.1 17.1 676,229 796,818 796,818General Assistance..................................... 7.6 9.8 9.8 240,780 325,197 325,197
TOTALS, ORGANIZED ACTIVITIES-OTHER...... 22.8 26.9 26.9 $917,009 $1,122,015 $1,122,015
Organized ResearchGeneral Campus:
Academic.................................................... 2.2 2.1 2.1 210,416 209,930 209,930Staff ............................................................ 29.9 28.8 28.8 1,380,514 1,363,740 1,363,740General Assistance..................................... 24.5 26.6 26.6 736,092 837,067 837,067
TOTALS, ORGANIZED RESEARCH ..................... 56.6 57.5 57.5 $2,327,022 $2,410,737 $2,410,737
LibrariesAcademic.................................................... 38.2 40.5 40.5 2,540,802 2,815,541 2,815,541Staff ............................................................ 112.3 116.4 116.4 3,788,344 4,112,212 4,112,212General Assistance..................................... 70.6 71.3 71.3 1,068,947 1,130,716 1,130,716
TOTALS, LIBRARIES .............................................. 221.1 228.2 228.2 $7,398,093 $8,058,469 $8,058,469
University ExtensionAcademic.................................................... 5.2 6.9 6.9 310,751 430,980 430,980Staff ............................................................ 34.8 35.4 35.4 1,424,092 1,519,907 1,519,907General Assistance..................................... 32.4 38.1 38.1 1,192,567 1,468,843 1,468,843
TOTALS, UNIVERSITY EXTENSION ................... 72.4 80.4 80.4 $2,927,410 $3,419,730 $3,419,730
Extension and Public ServiceStaff ............................................................ 46.8 58.4 58.4 2,027,036 2,649,360 2,649,360General Assistance..................................... 22.2 34.1 34.1 619,175 996,157 996,157
TOTALS, EXTENSION AND PUBLIC SERVICE.. 69.0 92.5 92.5 $2,646,211 $3,645,517 $3,645,517
Maintenance and Operation of PlantStaff ............................................................ 197.2 204.2 204.2 7,174,534 7,781,353 7,781,353General Assistance..................................... 57.1 66.2 66.2 1,454,935 1,766,762 1,766,762
TOTALS, MAINTENANCE AND OPERATIONOF PLANT................................................................. 254.3 270.4 270.4 $8,629,469 $9,548,115 $9,548,115
Student ServicesStaff ............................................................ 267.5 270.1 270.1 11,553,427 12,218,676 12,218,676General Assistance..................................... 127.8 136.4 136.4 3,973,873 4,442,323 4,442,323
TOTALS, STUDENT SERVICES............................. 395.3 406.5 406.5 $15,527,300 $16,660,999 $16,660,999
Institutional SupportChancellor .................................................. 1 1 1 255,775 262,000 262,000Staff ............................................................ 262.9 266.6 266.6 13,331,659 14,160,100 14,160,100General Assistance..................................... 65.5 68.7 68.7 1,709,175 1,877,650 1,877,650
TOTALS, INSTITUTIONAL SUPPORT .................. 329.4 336.3 336.3 $15,296,609 $16,299,750 $16,299,750
TOTALS, SANTA BARBARA CAMPUS................ 3,355.1 3,535.1 3,535.1 $158,615,186 $173,331,690 $173,331,690
IRVINE CAMPUSInstruction and Departmental Research
General Campus:Academic.................................................... 1,066.6 1,083.8 1,083.8 $66,055,957 $70,855,053 $70,855,053Staff ............................................................ 333.8 343.2 343.2 13,930,245 15,001,417 15,001,417General Assistance..................................... 363.6 365.1 365.1 14,016,558 14,741,508 14,741,508
SALARY RANGE
EDUCATION E 39
6440 UNIVERSITY OF CALIFORNIA—Continued
ORGANIZATIONAL UNIT NUMBER OF POSITIONS EXPENDITURES
Filled Authorized Proposed Actual Estimated ProposedClassification 1999–00 2000–01 2001–02 1999–00 2000–01 2001–02
123456789
1011121314151617181920212223242526272829303132333435363738394041424344454647484950515253545556575859606162636465666768697071727374757677787980
Page 41
Health Sciences:Academic.................................................... 231.1 239.5 239.5 26,009,011 28,172,722 28,172,722Staff ............................................................ 99.6 92.5 92.5 4,581,053 4,456,155 4,456,155General Assistance..................................... 259.7 271.2 271.2 10,417,621 11,394,594 11,394,594
TOTALS, INSTRUCTION ANDDEPARTMENTAL RESEARCH............................... 2,354.4 2,395.3 2,395.3 $135,010,445 $144,621,449 $144,621,449
Summer SessionStaff ............................................................ 3.8 3.1 3.1 181,378 154,981 154,981General Assistance..................................... 3.3 3.4 3.4 133,966 144,569 144,569
TOTALS, SUMMER SESSION ................................ 7.1 6.5 6.5 $315,344 $299,550 $299,550
Organized Activities-Hospitals and ClinicsStaff ............................................................ 8.2 10.1 10.1 541,087 698,051 698,051General Assistance..................................... 2,332.8 2,333.9 2,333.9 74,826,543 78,410,252 78,410,252
TOTALS, ORGANIZED ACTIVITIES-HOSPITALS AND CLINICS .................................... 2,341.0 2,344.0 2,344.0 $75,367,630 $79,108,303 $79,108,303
Organized Activities-OtherAcademic.................................................... 12.1 14.7 14.7 525,750 667,592 667,592Staff ............................................................ 19.2 21.8 21.8 1,079,382 1,283,640 1,283,640General Assistance..................................... 39.8 41.6 41.6 1,431,721 1,567,405 1,567,405
TOTALS, ORGANIZED ACTIVITIES-OTHER...... 71.1 78.1 78.1 $3,036,853 $3,518,637 $3,518,637
Organized ResearchGeneral Campus:
Academic.................................................... 4.7 5.1 5.1 459,308 520,925 520,925Staff ............................................................ 5.8 6.3 6.3 242,651 276,062 276,062General Assistance..................................... 37.6 39.5 39.5 1,471,879 1,619,549 1,619,549
Health Sciences:Academic.................................................... 16.7 18.3 18.3 2,016,358 2,309,413 2,309,413General Assistance..................................... 58.3 58.7 58.7 2,221,362 2,342,618 2,342,618
TOTALS, ORGANIZED RESEARCH ..................... 123.1 127.9 127.9 $6,411,558 $7,068,567 $7,068,567
LibrariesAcademic.................................................... 48.1 57.5 57.5 3,143,134 3,927,219 3,927,219Staff ............................................................ 109.7 116.2 116.2 3,967,106 4,401,350 4,401,350General Assistance..................................... 70.8 73.2 73.2 1,142,992 1,237,751 1,237,751
TOTALS, LIBRARIES .............................................. 228.6 246.9 246.9 $8,253,232 $9,566,320 $9,566,320
University ExtensionStaff ............................................................ 56.4 58.1 58.1 2,695,526 2,908,393 2,908,393General Assistance..................................... 46.3 49.3 49.3 2,079,880 2,319,619 2,319,619
TOTALS, UNIVERSITY EXTENSION ................... 102.7 107.4 107.4 $4,775,406 $5,228,012 $5,228,012
Extension and Public ServiceStaff ............................................................ 24.9 35.3 35.3 1,119,184 1,661,841 1,661,841General Assistance..................................... 37.8 47.9 47.9 1,541,207 2,045,584 2,045,584
TOTALS, EXTENSION AND PUBLIC SERVICE.. 62.7 83.2 83.2 $2,660,391 $3,707,425 $3,707,425
Maintenance and Operation of PlantStaff ............................................................ 171.2 187 187 7,691,376 8,799,428 8,799,428General Assistance..................................... 58.4 62.5 62.5 1,724,706 1,933,280 1,933,280
TOTALS, MAINTENANCE AND OPERATIONOF PLANT................................................................. 229.6 249.5 249.5 $9,416,082 $10,732,708 $10,732,708
Student ServicesStaff ............................................................ 219.3 233.8 233.8 11,055,790 12,345,487 12,345,487General Assistance..................................... 91 94.4 94.4 3,178,721 3,453,787 3,453,787
TOTALS, STUDENT SERVICES............................. 310.3 328.2 328.2 $14,234,511 $15,799,274 $15,799,274
SALARY RANGE
EDUCATIONE 40
6440 UNIVERSITY OF CALIFORNIA—Continued
ORGANIZATIONAL UNIT NUMBER OF POSITIONS EXPENDITURES
Filled Authorized Proposed Actual Estimated ProposedClassification 1999–00 2000–01 2001–02 1999–00 2000–01 2001–02
123456789
1011121314151617181920212223242526272829303132333435363738394041424344454647484950515253545556575859606162636465666768697071727374757677787980
Page 42
Institutional SupportChancellor .................................................. 1 1 1 253,700 260,000 260,000Staff ............................................................ 309.8 315.3 315.3 18,180,092 19,379,886 19,379,886General Assistance..................................... 92.1 93.7 93.7 3,767,993 4,015,158 4,015,158
TOTALS, INSTITUTIONAL SUPPORT .................. 402.9 410.0 410.0 $22,201,785 $23,655,044 $23,655,044
TOTALS, IRVINE CAMPUS.................................... 6,233.5 6,377.0 6,377.0 $281,683,237 $303,305,289 $303,305,289
MERCED CAMPUSOrganized Activities-Other
Academic.................................................... 1 1 1 $84,471 $88,290 $88,290Staff ............................................................ 3 3.5 3.5 112,816 265,425 265,425General Assistance..................................... 0.3 – – 11,036 – –
TOTALS, ORGANIZED ACTIVITIES-OTHER...... 4.3 4.5 4.5 $208,323 $353,715 $353,715
University ExtensionAcademic.................................................... 0.8 1 1 31,743 41,472 41,472
TOTALS, UNIVERSITY EXTENSION ................... 0.8 1.0 1.0 $31,743 $41,472 $41,472
Extension and Public ServiceStaff ............................................................ 0.9 4 4 29,668 278,106 278,106General Assistance..................................... 1 – – 55,022 – –
TOTALS, EXTENSION AND PUBLIC SERVICE.. 1.9 4.0 4.0 $84,690 $278,106 $278,106
Institutional SupportChancellor .................................................. 0.9 1 1 214,417 235,000 235,000Staff ............................................................ 16.4 31 31 1,328,199 2,639,036 2,639,036General Assistance..................................... 4.3 0.5 0.5 143,915 17,724 17,724
TOTALS, INSTITUTIONAL SUPPORT .................. 21.6 32.5 32.5 $1,686,531 $2,891,760 $2,891,760
TOTALS, MERCED CAMPUS................................. 28.6 42.0 42.0 $2,011,287 $3,565,053 $3,565,053
AGRICULTURE AND NATURAL RESOURCESOrganized Research
VP-Agriculture and Natural Resources..... 1 1 1 $208,000 $212,000 $212,000Academic.................................................... 26.7 29.5 29.5 2,173,749 2,510,264 2,510,264Staff ............................................................ 80.5 84.2 84.2 3,437,189 3,765,584 3,765,584General Assistance..................................... 29.5 27.3 27.3 1,179,286 1,143,067 1,143,067
TOTALS, ORGANIZED RESEARCH ..................... 137.7 142.0 142.0 $6,998,224 $7,630,915 $7,630,915
Extension and Public ServiceAcademic.................................................... 391.3 410.7 410.7 28,554,100 31,124,418 31,124,418Staff ............................................................ 248.6 274.5 274.5 12,192,985 14,101,449 14,101,449General Assistance..................................... 93.9 112.6 112.6 2,964,846 3,723,817 3,723,817
TOTALS, EXTENSION AND PUBLIC SERVICE.. 733.8 797.8 797.8 $43,711,931 $48,949,684 $48,949,684
Maintenance and Operation of PlantStaff ............................................................ 4.8 6 6 184,692 241,808 241,808General Assistance..................................... 2.7 3.5 3.5 83,369 113,194 113,194
TOTALS, MAINTENANCE AND OPERATIONOF PLANT................................................................. 7.5 9.5 9.5 $268,061 $355,002 $355,002
TOTALS, AGRICULTURE AND NATURALRESOURCES ............................................................. 879.0 949.3 949.3 $50,978,216 $56,935,601 $56,935,601
SALARY RANGE
EDUCATION E 41
6440 UNIVERSITY OF CALIFORNIA—Continued
ORGANIZATIONAL UNIT NUMBER OF POSITIONS EXPENDITURES
Filled Authorized Proposed Actual Estimated ProposedClassification 1999–00 2000–01 2001–02 1999–00 2000–01 2001–02
123456789
1011121314151617181920212223242526272829303132333435363738394041424344454647484950515253545556575859606162636465666768697071727374757677787980
Page 43
OFFICE OF THE PRESIDENT AND UNIVERSITYWIDE PROGRAMSInstruction and Departmental Research
Academic.................................................... 17.4 22.5 22.5 $1,300,086 $1,757,143 $1,757,143Staff ............................................................ 38.3 44.8 44.8 1,584,935 1,941,789 1,941,789General Assistance..................................... 16.6 22.3 22.3 643,824 905,902 905,902
TOTALS, INSTRUCTION ANDDEPARTMENTAL RESEARCH............................... 72.3 89.6 89.6 $3,528,845 $4,604,834 $4,604,834
Organized ActivitiesStaff ............................................................ 123.3 136.6 136.6 5,560,579 6,447,666 6,447,666General Assistance..................................... 16.4 18.5 18.5 544,543 646,868 646,868
TOTALS, ORGANIZED ACTIVITIES..................... 139.7 155.1 155.1 $6,105,122 $7,094,534 $7,094,534
Organized ResearchGeneral Campus:
Academic.................................................... 18.3 20.5 20.5 1,528,168 1,789,250 1,789,250Staff ............................................................ 42.2 46.5 46.5 2,142,036 2,472,171 2,472,171General Assistance..................................... 26.2 26.1 26.1 1,175,486 1,200,045 1,200,045
Health Sciences:Academic.................................................... 15.2 17.5 17.5 1,012,551 1,218,418 1,218,418Staff ............................................................ 40.7 44.2 44.2 2,069,997 2,354,568 2,354,568General Assistance..................................... 34.5 35.8 35.8 1,651,074 1,794,490 1,794,490
TOTALS, ORGANIZED RESEARCH ..................... 177.1 190.6 190.6 $9,579,312 $10,828,942 $10,828,942
LibrariesAcademic.................................................... 2.8 4.5 4.5 259,445 382,756 382,756Staff ............................................................ 104.5 117.8 117.8 6,021,817 7,093,700 7,093,700General Assistance..................................... 23.6 25.2 25.2 532,692 595,776 595,776
TOTALS, LIBRARIES .............................................. 130.9 147.5 147.5 $6,813,954 $8,072,232 $8,072,232
University ExtensionAcademic.................................................... 37.8 43.5 43.5 3,382,124 4,068,042 4,068,042Staff ............................................................ 130.4 152.7 152.7 6,704,986 8,236,486 8,236,486General Assistance..................................... 28.8 32.4 32.4 1,488,084 1,753,461 1,753,461
TOTALS, UNIVERSITY EXTENSION ................... 197.0 228.6 228.6 $11,575,194 $14,057,989 $14,057,989
Extension and Public ServiceAcademic.................................................... 22.4 33.5 33.5 2,003,401 3,131,600 3,131,600Staff ............................................................ 67.2 81.2 81.2 3,924,736 4,967,195 4,967,195General Assistance..................................... 29.2 37.7 37.7 1,485,577 1,949,163 1,949,163
TOTALS, EXTENSION AND PUBLIC SERVICE.. 118.8 152.4 152.4 $7,413,714 $10,047,958 $10,047,958
Student ServicesStaff ............................................................ 32.8 41.5 41.5 1,811,993 2,401,296 2,401,296General Assistance..................................... 10.1 15 15 425,235 661,465 661,465
TOTALS, STUDENT SERVICES............................. 42.9 56.5 56.5 $2,237,228 $3,062,761 $3,062,761
Institutional SupportPresident..................................................... 1 1 1 330,700 337,300 337,300Provost & Sr VP—Academic Affairs ....... 1 1 1 251,750 262,000 262,000Sr VP—Business & Finance ..................... 1 1 1 250,000 270,000 270,000VP—University & External Relations ...... 1 1 1 218,125 222,500 222,500VP—Health Affairs.................................... 0.5 1 1 107,089 280,000 280,000VP—Clinical Services Development ........ 1 1 1 368,750 376,000 376,000VP for Budget ............................................ 1 1 1 186,250 190,000 190,000VP for Financial Mgt................................. 1 1 1 196,850 200,800 200,800VP for Educational Outreach .................... – 1 1 – 200,000 200,000Secty of the Regents.................................. 1 1 1 127,850 130,400 130,400Treasurer of rhe Regents ........................... 1 1 1 271,600 273,600 273,600General Counsel & VP—Legal Affairs .... 1 1 1 264,750 267,000 267,000
SALARY RANGE
EDUCATIONE 42
6440 UNIVERSITY OF CALIFORNIA—Continued
ORGANIZATIONAL UNIT NUMBER OF POSITIONS EXPENDITURES
Filled Authorized Proposed Actual Estimated ProposedClassification 1999–00 2000–01 2001–02 1999–00 2000–01 2001–02
123456789
1011121314151617181920212223242526272829303132333435363738394041424344454647484950515253545556575859606162636465666768697071727374757677787980
Page 44
Staff ............................................................ 379.2 384.5 384.5 24,079,167 25,573,057 25,573,057General Assistance..................................... 76.6 73.8 73.8 3,203,084 3,232,276 3,232,276
TOTALS, INSTITUTIONAL SUPPORT .................. 466.3 470.3 470.3 $29,855,965 $31,814,933 $31,814,933
TOTALS, OFFICE OF THE PRESIDENT ANDUNIVERSITYWIDE PROGRAMS .......................... 1,345.0 1,490.6 1,490.6 $77,109,334 $89,584,183 $89,584,183
TOTALS, AUTHORIZED POSITIONS.................... 62,073.2 66,984.0 66,984.0 $3,058,395,668 $3,379,577,212 $3,379,577,212
6440 UNIVERSITY OF CALIFORNIA
Academic Salary Schedule—University of California(Based on Salary Range Effective July 1, 2000)
STEPSRANK * 1 2 3 4 5 6 7 8 9 *** 10
Regular Academic Ranks:Professor (AY)........................................ 65,400 70,300 76,100 82,600 89,600 97,200 105,600 114,300 124,200Professor ................................................. 76,000 81,500 88,300 95,800 104,000 112,800 122,500 132,600 144,100Associate Professor (AY) ..................... 55,200 58,200 61,500 65,300 70,200Associate Professor............................... 64,000 67,500 71,400 75,900 81,400Assistant Professor (AY) ...................... 44,300 46,800 49,400 52,200 55,100 58,100Assistant Professor ............................... 51,500 54,300 57,300 60,500 63,900 67,400Assistant Professor (Acting) (AY) ...... 42,100 44,500 46,900 49,600Assistant Professor (Acting) ............... 48,900 51,600 54,400 57,500Instructor (AY)....................................... 38,500Instructor ................................................ 44,900Senior Lecturer with Security of
Employment (AY) ............................. 64,272 to 106,704Senior Lecturer with Security of
Employment ..................................... 73,932 to 126,612Lecturer with Security of Employ-
ment (AY) .......................................... 39,504 to 106,704Lecturer with Security of Employ-
ment ................................................... 45,252 to 126,612Senior Lecturer (AY) ........................... 58,500 to 97,020Senior Lecturer ..................................... 67,248 to 115,200Lecturer (AY) ........................................ 28,968 to 97,020Lecturer................................................... 32,916 to 115,200
Regular Academic Ranks—Business/Management and Engineering:
Professor (AY)........................................ 80,300 82,800 87,900 94,300 101,500 109,300 117,100 126,100 137,000Professor ................................................. 93,000 96,100 101,900 109,300 117,700 126,700 135,700 145,300 157,800Associate Professor (AY) ..................... 71,800 74,800 77,900 80,200 82,700Associate Professor............................... 83,200 86,700 90,200 92,900 96,000Assistant Professor (AY) ...................... 58,900 61,900 65,000 68,400 71,700 74,700Assistant Professor ............................... 68,300 71,800 75,500 79,000 83,100 86,600Assistant Professor (Acting) (AY) ...... 56,000 58,800 61,800Assistant Professor (Acting) ............... 64,900 68,200 71,700
Regular Academic Ranks—Law:Professor ................................................. 94,100 100,300 107,300 115,200 123,300 131,600 140,300 149,800 160,800
Regular Academic Ranks—HealthSciences Schools:
Professor (Scale 9)................................. 171,000 183,200 198,700 215,600 234,000 253,800 275,600 298,400 324,200Professor (Scale 0)................................. 76,000 81,500 88,300 95,800 104,000 112,800 122,500 132,600 144,100Professor—SFT-Preclinical................... 92,200 97,000 101,800 108,900 117,600 124,900 133,700 143,100 155,500Professor—SFT-Veterinary Medicine. 92,600 97,000 101,700 108,900 117,700 125,700 133,800 142,800 155,200Associate Professor (Scale 9)............... 144,000 151,900 160,700 170,800 183,200Associate Professor (Scale 0)............... 64,000 67,500 71,400 75,900 81,400Associate Professor—SFT-Preclinical. 79,000 83,200 87,900 92,100 96,900Associate Professor—SFT-Veterinary
Medicine ............................................. 79,100 83,200 87,900 92,100 96,900Assistant Professor (Scale 9) ............... 115,900 122,200 128,900 136,100 143,900 151,800Assistant Professor (Scale 0) ............... 51,500 54,300 57,300 60,500 63,900 67,400Assistant Professor—SFT-Preclinical . 64,800 69,100 72,600 76,600 78,900 83,100
SALARY RANGE
EDUCATION E 43
6440 UNIVERSITY OF CALIFORNIA—Continued
ORGANIZATIONAL UNIT NUMBER OF POSITIONS EXPENDITURES
Filled Authorized Proposed Actual Estimated ProposedClassification 1999–00 2000–01 2001–02 1999–00 2000–01 2001–02
123456789
1011121314151617181920212223242526272829303132333435363738394041424344454647484950515253545556575859606162636465666768697071727374757677787980
Page 45
Academic Salary Schedule—University of California—Continued(Based on Salary Range Effective July 1, 2000)
STEPSRANK * 1 2 3 4 5 6 7 8 9 *** 10
Assistant Professor—SFT-VeterinaryMedicine ............................................. 64,500 69,000 72,800 76,700 79,000 83,200
Assistant Professor—SFT-Preclinical(Acting) ............................................... 61,600 65,600 69,000 72,800
Assistant Professor—SFT-VeterinaryMedicine (Acting) ............................. 61,300 65,600 69,200 72,900
Instructor (Scale 9)................................ 101,000Instructor (Scale 0)................................ 44,900Instructor—SFT-Preclinical.................. 58,100Instructor—SFT-Veterinary
Medicine ............................................. 58,400
Student Titles:Associate in-Graduate Student (AY) . 28,916 to 34,275Associate in-Graduate Student........... 32,143 to 39,341Teaching Assistant (1⁄2 Time) (AY) ..... 13,799Teaching Fellow (1⁄2 Time) (AY) ......... 13,799Reader ..................................................... 10.02–10.56/hr.Remedial Tutor .................................... 10.56–16.32/hr.Research Assistant (1⁄2 Time)............... 14,064Graduate Student Researcher
(1⁄2 Time) ............................................ 14,064 15,156 16,806 18,150 19,362 20,262
Professional Researchers(Non-faculty):
Research** (AY) ..................................... 65,400 70,300 76,100 82,600 89,600 97,200 105,600 114,300 124,200Research**............................................... 67,900 to 144,100Associate Research** (AY) ................... 55,200 58,200 61,500 65,300 70,200Associate Research** ............................ 57,400 to 81,400Assistant Research** (AY).................... 44,300 46,800 49,400 52,200 55,100 58,100Assistant Research** ............................. 46,700 to 67,400Postgraduate Research**...................... 29,700 30,972 32,400 33,768 35,316 36,984
Specialists:Specialist................................................. 56,256 61,836 69,156 77,664 86,976Associate Specialist............................... 43,512 46,536 49,908 52,404Assistant Specialist ............................... 34,536 36,984 39,564Junior Specialist .................................... 29,700 31,668
Coordinators of Public Programs/Continuing Education Specialists:
Coordinator/Specialist VIII ................ 89,800 93,100 96,400 99,900Coordinator/Specialist VII.................. 78,600 81,900 84,700 87,100Coordinator/Specialist VI ................... 69,000 71,400 73,700 76,400Coordinator/Specialist V .................... 60,800 62,800 64,900 66,600Coordinator/Specialist IV ................... 53,100 55,000 56,300 58,700Coordinator/Specialist III ................... 46,200 48,500 49,900 51,500Coordinator/Specialist II..................... 40,800 42,400 43,600 45,000Coordinator/Specialist I ...................... 35,500 36,700 38,400 39,700
Supervisor of Physical Education (AY):Supervisor .............................................. 55,800 59,600 65,100 71,200 77,600 83,600 89,500Associate Supervisor ............................ 47,000 49,600 52,400Assistant Supervisor............................. 38,000 40,200 42,300 44,700 46,900Junior Supervisor.................................. 33,500
Military/Air Science and TacticsAssistant ............................................. 1,277
Interns and Residents:Dentistry/Medicine Post-DDS/MD .. 32,700 36,600 39,900 42,900 45,800 47,300 48,900 50,600 52,200Pharmacy Intern.................................... 17,232Pharmacy Resident............................... 31,248Pharmacy Chief Resident .................... 38,016Veterinary Medicine Intern ................. 24,480
SALARY RANGE
EDUCATIONE 44
6440 UNIVERSITY OF CALIFORNIA—Continued
ORGANIZATIONAL UNIT NUMBER OF POSITIONS EXPENDITURES
Filled Authorized Proposed Actual Estimated ProposedClassification 1999–00 2000–01 2001–02 1999–00 2000–01 2001–02
123456789
1011121314151617181920212223242526272829303132333435363738394041424344454647484950515253545556575859606162636465666768697071727374757677787980
Page 46
Academic Salary Schedule—University of California—Continued(Based on Salary Range Effective July 1, 2000)
STEPSRANK * 1 2 3 4 5 6 7 8 9 *** 10
Veterinary Medicine Resident ............ 33,900 35,448 37,104 38,964Hospital Administration Intern.......... 17,532Dietetic Intern........................................ 13,752
Cooperative Extension Advisors/Specialists:
Advisor/Specialist ................................ 57,900 62,000 68,000 74,400 81,000 88,100 96,900 106,700 115,900Associate Advisor/Specialist .............. 46,000 48,600 51,300 53,700 57,800Assistant Advisor/Specialist .............. 36,900 38,800 41,200 43,200 45,900 48,500Specialist ............................................... 72,100 77,100 83,700 91,500 99,700 108,200 116,700 126,000 136,900Associate Specialist ............................. 60,800 64,300 67,700 72,000 77,000Assistant Specialist .............................. 49,500 52,200 54,900 57,500 60,700 64,200
Supervisors of Teacher Education ......... 35,016 to 58,956
Demonstration Teacher ............................ 33,684 to 56,628
Nursery School Teacher........................... 31,548 to 41,136
Librarians:Associate University Librarian........... 58,800 to 113,500Assistant University Librarian ........... 55,600 to 103,200Librarian ................................................. 54,108 to 99,972Associate Librarian............................... 40,248 to 61,980Assistant Librarian ............................... 32,940 to 42,156
Academic Administration:Academic Administrator VII .............. 82,836 to 116,328Academic Administrator VI................ 74,388 to 103,056Academic Administrator V ................. 66,372 to 90,960Academic Administrator IV................ 58,608 to 81,216Academic Administrator III................ 52,404 to 72,768Academic Administrator II ................. 46,536 to 64,704Academic Administrator I................... 41,496 to 57,408
Academic Coordinators:Academic Coordinator V (AY) ........... 64,704 to 86,976Academic Coordinator V..................... 76,056 to 100,524Academic Coordinator IV (AY).......... 52,404 to 72,768Academic Coordinator IV ................... 61,836 to 84,888Academic Coordinator III (AY) .......... 42,420 to 58,608Academic Coordinator III ................... 49,908 to 69,156Academic Coordinator II (AY) ........... 34,536 to 47,640Academic Coordinator II..................... 40,524 to 56,256Academic Coordinator I (AY)............. 28,488 to 38,760Academic Coordinator I ...................... 33,024 to 45,540
* Period of employment may be for either the academic year (AY) or 12 months.** Designation of specialty completes classification title.
*** Step IX will be effective July 1, 2000.
6600 HASTINGS COLLEGE OF THE LAW
InstructionAcademic.................................................... 73.6 73.1 73.1 $7,149,198 $7,295,793 $7,295,793Staff ............................................................ 21.5 24.8 24.8 912,650 1,091,913 1,091,913Gen Assistance........................................... 10 7 7 280,224 284,951 284,951
Totals, Instruction................................ 105.1 104.9 104.9 $8,342,072 $8,672,657 $8,672,657Public and Professional Services
Academic.................................................... – – – 15,000 15,000 15,000Staff ............................................................ 0.1 1.1 1.1 10,035 37,704 37,704
Totals, Public and ProfessionalServices................................................ 0.1 1.1 1.1 $25,035 $52,704 $52,704
SALARY RANGE
EDUCATION E 45
6440 UNIVERSITY OF CALIFORNIA—Continued
ORGANIZATIONAL UNIT NUMBER OF POSITIONS EXPENDITURES
Filled Authorized Proposed Actual Estimated ProposedClassification 1999–00 2000–01 2001–02 1999–00 2000–01 2001–02
123456789
1011121314151617181920212223242526272829303132333435363738394041424344454647484950515253545556575859606162636465666768697071727374757677787980
Page 47
Academic SupportAcademic.................................................... 11 11 11 759,691 765,856 765,856Staff ............................................................ 11 11.5 11.5 410,034 427,354 427,354Gen Assistance........................................... 3.5 3 3 97,227 151,144 151,144
Totals, Academic Support ................... 25.5 25.5 25.5 $1,266,952 $1,344,354 $1,344,354Student Services
Academic.................................................... 2.2 2.2 2.2 212,076 217,259 217,259Staff ............................................................ 24.1 27.6 27.6 1,124,822 1,270,392 1,270,392Gen Assistance........................................... 6.5 3.7 3.7 149,832 127,535 127,535
Totals, Student Services ...................... 32.8 33.5 33.5 $1,486,730 $1,615,186 $1,615,186Institutional Support
Dean ........................................................... 1 1 1 231,000 206,000 206,000Academic.................................................... 1.5 1.5 1.5 254,771 251,868 251,868Staff ............................................................ 48.8 54.9 54.9 2,731,203 2,946,137 2,946,137Gen Assistance........................................... 4.9 1.8 1.8 134,916 79,459 79,459
Totals, Institutional Support................ 56.2 59.2 59.2 $3,351,890 $3,483,464 $3,483,464Facilities Planning and Operations
Staff ............................................................ 6 6 6 293,883 299,620 299,620
Totals, Facilities Planning andOperations............................................ 6.0 6.0 6.0 $293,883 $299,620 $299,620
TOTALS, AUTHORIZED POSITIONS.................... 225.7 230.2 230.2 $14,766,562 $15,467,985 $15,467,985
6610 CALIFORNIA STATE UNIVERSITYCHANCELLOR’S OFFICE
Instruction:Management and Supervisory ................... 13.3 5 5 $763,241 $406,977 $406,977Support Staff Salaries ................................ 7.8 4 4 273,371 215,511 215,511
TOTALS, INSTRUCTION ....................................... 21.1 9.0 9.0 $1,036,612 $622,488 $622,488Research:
Academic Salaries...................................... – – – – 2,500,000 2,500,000
TOTALS, RESEARCH ............................................. – – – – $2,500,000 $2,500,000Academic Support:
Management and Supervisory ................... 28 35 35 2,240,425 2,749,950 2,749,950Support Staff Salaries ................................ 26.5 34.5 34.5 1,366,093 2,460,344 2,460,344
TOTALS, ACADEMIC SUPPORT .......................... 54.5 69.5 69.5 $3,606,518 $5,210,294 $5,210,294Student Services:
Management and Supervisory ................... 5 7 7 376,518 509,760 509,760Support Staff Salaries ................................ 4.1 3 3 171,946 114,588 114,588
TOTALS, STUDENT SERVICES............................. 9.1 10.0 10.0 $548,464 $624,348 $624,348Institutional Support:
Chancellor of the CSU .............................. 1 1 1 274,418 305,340 305,340Executive Vice Chancellor ........................ 1 2 2 215,508 461,184 461,184Senior Vice Chancellor, AcademicAffairs ........................................................ – 1 1 – 67,585 67,585General Counsel......................................... 1 1 1 180,897 188,664 188,664Vice Chancellor, Business and Finance .... 1 – – 210,564 – –Vice Chancellor, Human Resources.......... 1 1 1 190,572 202,008 202,008Vice Chancellor, UniversityAdvancement.............................................. 1 1 1 171,900 182,208 182,208Academic Salaries...................................... 0.1 – – 89,683 – –Management and Supervisory ................... 159.2 140 140 11,919,641 11,907,517 11,907,517Support Staff Salaries ................................ 135.4 122.6 122.6 6,424,037 6,349,148 6,349,148
TOTALS, INSTITUTIONAL SUPPORT ................. 300.7 269.6 269.6 $19,677,220 $19,663,654 $19,663,654Operation and Maintenance of Plant:
Management and Supervisory ................... 10.9 11 11 795,450 858,396 858,396Support Staff Salaries ................................ 5.2 5 5 196,425 211,534 211,534
TOTALS, OPERATIONS AND MAINTENANCEOF PLANT ................................................................ 16.1 16.0 16.0 $99l,875 $1,069,930 $1,069,930
Reimbursed Activities:Academic Salaries...................................... 0.1 – – 1,156 – –Management and Supervisory ................... 33.7 28 28 2,391,369 1,991,004 1,991,004Support Staff Salaries ................................ 40 37.5 37.5 1,369,817 1,538,844 1,538,844
TOTALS, REIMBURSED ACTIVITIES .................. 73.8 65.5 65.5 $3,762,342 $3,529,848 $3,529,848
SALARY RANGE
EDUCATIONE 46
6600 HASTINGS COLLEGE OF THE LAW—Continued
ORGANIZATIONAL UNIT NUMBER OF POSITIONS EXPENDITURES
Filled Authorized Proposed Actual Estimated ProposedClassification 1999–00 2000–01 2001–02 1999–00 2000–01 2001–02
123456789
1011121314151617181920212223242526272829303132333435363738394041424344454647484950515253545556575859606162636465666768697071727374757677787980
Page 48
Auxiliary Enterprises:Management and Supervisory ................... – – – – – –Support Staff Salaries ................................ 0.5 – – 8,999 – –
TOTALS, AUXILIARY ENTERPRISES .................. 0.5 – – $8,999 – –
TOTALS, CHANCELLOR’S OFFICE ..................... 475.8 439.6 439.6 $29,632,030 $33,220,562 $33,220,562
TRUSTEES AUDIT PROGRAMInstitutional Support:
Management and Supervisory ................... 17.4 16 16 $1,329,711 $1,206,624 $1,206,624Support Staff Salaries ................................ 1.1 1 1 40,409 38,496 38,496
TOTALS, INSTITUTIONAL SUPPORT .................. 18.5 17.0 17.0 $1,370,120 $1,245,120 $1,245,120Reimbursed Activities:
Management and Supervisory ................... 2.7 4 4 177,260 262,008 262,008Support Staff Salaries ................................ 0.1 – – 144 – –
TOTALS, REIMBURSED ACTIVITIES ................. 2.8 4.0 4.0 $177,404 $262,008 $262,008
TOTALS, TRUSTEES AUDIT PROGRAM............. 21.3 21.0 21.0 $1,547,524 $1,507,128 $1,507,128
INTERNATIONAL PROGRAMSInstruction:
Management and Supervisory ................... 1 1 1 $56,400 $387,146 $387,146Support Staff Salaries ................................ 0.8 – – 9,948 – –
TOTALS, INSTRUCTION ........................................ 1.8 1.0 1.0 $66,348 $387,146 $387,146Student Services:
Management and Supervisory ................... 1 1 1 44,400 45,900 45,900Support Staff Salaries ................................ 2 2 2 74,410 73,560 73,560
TOTALS, STUDENT SERVICES............................. 3.0 3.0 3.0 $118,810 $119,460 $119,460Institutional Support:
Management and Supervisory ................... 2.8 2 2 169,713 151,956 151,956Support Staff Salaries ................................ 1.9 2 2 83,994 83,496 83,496
TOTALS, INSTITUTIONAL SUPPORT ................. 4.7 4.0 4.0 $253,707 $235,452 $235,452Reimbursed Activities:
Support Staff Salaries ................................ 0.1 – – 1,732 – –
TOTALS, REIMBURSED ACTIVITIES ................. 0.1 – – $1,732 – –
TOTALS, INTERNATIONAL PROGRAMS............ 9.6 8.0 8.0 $440,597 $742,058 $742,058
CALIFORNIA MARITIME ACADEMY
Instruction:Academic Salaries...................................... 51.9 51 51 $2,900,290 $3,070,678 $3,070,678Management and Supervisory ................... 4.9 9 9 327,883 697,202 697,202Support Staff Salaries ................................ 21.7 15 15 745,765 439,089 439,089
TOTALS, INSTRUCTION ........................................ 78.5 75.0 75.0 $3,973,938 $4,206,969 $4,206,969Academic Support:
Academic Salaries...................................... 1.8 2 2 62,884 101,167 101,167Management and Supervisory ................... 3.2 2 2 228,213 239,961 239,961Support Staff Salaries ................................ 5.8 8 8 205,976 180,001 180,001
TOTALS, ACADEMIC SUPPORT ........................... 10.8 12.0 12.0 $497,073 $521,129 $521,129Student Services:
Academic Salaries...................................... 5.2 – – 226,905 – –Management and Supervisory ................... 6.9 7 7 366,717 409,574 409,574Support Staff Salaries ................................ 16.7 27 27 463,149 906,828 906,828
TOTALS, STUDENT SERVICES............................. 28.8 34.0 34.0 $1,056,771 $1,316,402 $1,316,402
SALARY RANGE
EDUCATION E 47
6610 CALIFORNIA STATE UNIVERSITYCHANCELLOR’S OFFICE—Continued
ORGANIZATIONAL UNIT NUMBER OF POSITIONS EXPENDITURES
Filled Authorized Proposed Actual Estimated ProposedClassification 1999–00 2000–01 2001–02 1999–00 2000–01 2001–02
123456789
1011121314151617181920212223242526272829303132333435363738394041424344454647484950515253545556575859606162636465666768697071727374757677787980
Page 49
Institutional Support:Academic Salaries...................................... 0.6 – – 21,859 – –President..................................................... 1.1 1 1 195,676 142,920 142,920Management and Supervisory ................... 12.3 13 13 925,515 1,022,877 1,022,877Support Staff Salaries ................................ 21.4 25 25 1,102,854 784,230 784,230
TOTALS, INSTITUTIONAL SUPPORT ................. 35.4 39.0 39.0 $2,245,904 $1,950,027 $1,950,027Operation and Maintenance of Plant:
Management and Supervisory ................... 1.5 1 1 98,021 79,512 79,512Support Staff Salaries ................................ 17.9 22 22 660,609 897,603 897,603
TOTALS, OPERATION AND MAINTENANCEOF PLANT................................................................. 19.4 23.0 23.0 $758,630 $977,115 $977,115
Reimbursed Activities:Academic Salaries...................................... 2.5 – – 153,253 – –Management and Supervisory ................... 4.6 4 4 269,835 248,317 248,317Support Staff Salaries ................................ 20 30 30 1,011,853 1,350,150 1,350,150
TOTALS, REIMBURSED ACTIVITIES .................. 27.1 34.0 34.0 $1,434,941 $1,598,467 $1,598,467Auxiliary Enterprises:
Support Staff Salaries ................................ 0.1 – – 114,534 – –
TOTALS, AUXILIARY ENTERPRISES ................. 0.1 – – $114,534 – –Independent Operations:
Support Staff Salaries ................................ 0.2 – – 1,080,857 – –
TOTALS, INDEPENDENT OPERATIONS ............ 0.2 – – $1,080,857 – –
TOTALS, CALIFORNIA STATE UNIVERSITY,CALIFORNIA MARITIME ACADEMY ................. 200.3 217.0 217.0 $11,162,648 $10,570,109 $10,570,109
CALIFORNIA STATE POLYTECHNIC UNIVERSITY, POMONAInstruction:
Academic Salaries...................................... 756.7 978.4 978.4 $51,680,114 $57,413,947 $57,413,947Management and Supervisory ................... 4.3 2 2 298,058 191,818 191,818Support Staff Salaries ................................ 170.6 211.7 211.7 5,652,154 7,892,603 7,892,603
TOTALS, INSTRUCTION ........................................ 931.6 1,192.1 1,192.1 $57,630,326 $65,498,368 $65,498,368Academic Support:
Academic Salaries...................................... 46.1 16.1 16.1 3,248,410 1,324,227 1,324,227Management and Supervisory ................... 31.1 30.5 30.5 2,726,125 2,568,003 2,568,003Support Staff Salaries ................................ 218.2 214.3 214.3 7,907,840 7,545,625 7,545,625
TOTALS, ACADEMIC SUPPORT ........................... 295.4 260.9 260.9 $13,882,375 $11,437,855 $11,437,855Student Services:
Academic Salaries...................................... 18.3 4 4 1,075,573 284,254 284,254Management and Supervisory ................... 33.9 27 27 1,974,642 1,530,910 1,530,910Support Staff Salaries ................................ 221.1 272.6 272.6 8,121,920 10,315,494 10,315,494
TOTALS, STUDENT SERVICES............................. 273.3 303.6 303.6 $11,172,135 $12,130,658 $12,130,658Institutional Support:
Academic Salaries...................................... 1.5 – – 101,967 – –President..................................................... 1 1 1 188,279 199,488 199,488Management and Supervisory ................... 60 47.2 47.2 4,193,645 3,734,049 3,734,049Support Staff Salaries ................................ 180.1 239 239 6,879,262 9,123,967 9,123,967
TOTALS, INSTITUTIONAL SUPPORT .................. 242.6 287.2 287.2 $11,363,153 $13,057,504 $13,057,504Operation and Maintenance of Plant:
Management and Supervisory ................... 12.3 13 13 821,587 809,959 809,959Support Staff Salaries ................................ 117.2 126.5 126.5 4,349,210 4,859,892 4,859,892
TOTALS, OPERATION AND MAINTENANCEOF PLANT................................................................. 129.5 139.5 139.5 $5,170,797 $5,669,851 $5,669,851
Reimbursed Activities:Academic Salaries...................................... 3.5 16.7 16.7 217,228 712,957 712,957Management and Supervisory ................... 4.8 2 2 208,459 120,205 120,205Support Staff Salaries ................................ 17 16.9 16.9 478,084 464,447 464,447
TOTALS, REIMBURSED ACTIVITIES ................. 25.3 35.6 35.6 $903,771 $1,297,609 $1,297,609Auxiliary Enterprises:
Academic Salaries...................................... 1 – – 61,668 – –Management and Supervisory ................... 7.8 – – 424,610 – –Support Staff Salaries ................................ 70 – – 1,885,503 – –
TOTALS, AUXILIARY ENTERPRISES ................. 78.8 – – $2,371,781 – –Independent Operations:
Academic Salaries...................................... 0.1 – – 3,609 – –
SALARY RANGE
EDUCATIONE 48
CALIFORNIA MARITIME ACADEMY—Continued
ORGANIZATIONAL UNIT NUMBER OF POSITIONS EXPENDITURES
Filled Authorized Proposed Actual Estimated ProposedClassification 1999–00 2000–01 2001–02 1999–00 2000–01 2001–02
123456789
1011121314151617181920212223242526272829303132333435363738394041424344454647484950515253545556575859606162636465666768697071727374757677787980
Page 50
Support Staff Salaries ................................ 8.9 – – 391,103 – –
TOTALS, INDEPENDENT OPERATIONS ............ 9.0 – – $394,712 – –
TOTALS, CALIFORNIA STATE UNIVERSITY,POMONA................................................................... 1,985.5 2,218.9 2,218.9 $102,889,050 $109,091,845 $109,091,845
CALIFORNIA POLYTECHNIC STATE UNIVERSITY, SAN LUIS OBISPOInstruction:
Academic Salaries...................................... 822.4 820.8 820.8 $54,932,936 $57,783,548 $57,783,548Management and Supervisory ................... 16 16 16 1,646,665 1,732,300 1,732,300Support Staff Salaries ................................ 256.9 236.7 236.7 7,701,328 7,818,312 7,818,312
TOTALS, INSTRUCTION ........................................ 1,095.3 1,073.5 1,073.5 $64,280,929 $67,334,160 $67,334,160Research:
Support Staff Salaries ................................ 1 – – 14,602 – –
TOTALS, RESEARCH .............................................. 1.0 – – $14,602 – –Public Service:
Academic Salaries...................................... 0.2 – – 12,506 – –Support Staff Salaries ................................ 1 – – 3,565 – –
TOTALS, PUBLIC SERVICE ................................... 1.2 – – $16,071 – –Academic Support:
Academic Salaries...................................... 27.7 26.7 26.7 1,652,815 1,622,002 1,622,002Management and Supervisory ................... 35.1 33 33 3,250,113 3,306,743 3,306,743Support Staff Salaries ................................ 218.7 206.6 206.6 7,271,849 7,425,148 7,425,148
TOTALS, ACADEMIC SUPPORT ........................... 281.5 266.3 266.3 $12,174,777 $12,353,893 $12,353,893Student Services:
Academic Salaries...................................... 34.3 33.2 33.2 1,794,351 1,838,257 1,838,257Management and Supervisory ................... 29.3 21.6 21.6 2,066,714 1,808,760 1,808,760Support Staff Salaries ................................ 211.3 191.2 191.2 7,804,965 7,694,660 7,694,660
TOTALS, STUDENT SERVICES............................. 274.9 246.0 246.0 $11,666,030 $11,341,677 $11,341,677Institutional Support:
Academic Salaries...................................... 1.2 1.1 1.1 54,596 55,903 55,903President..................................................... 1.6 1.6 1.6 231,392 243,426 243,426Management and Supervisory ................... 50.3 47.4 47.4 3,900,247 3,979,243 3,979,243Support Staff Salaries ................................ 207.6 207.5 207.5 7,456,955 7,863,025 7,863,025
TOTALS, INSTITUTIONAL SUPPORT .................. 260.7 257.6 257.6 $11,643,190 $12,141,597 $12,141,597Operation and Maintenance of Plant:
Management and Supervisory ................... 12.6 12.6 12.6 694,671 730,799 730,799Support Staff Salaries ................................ 141.5 141.4 141.4 4,829,805 5,090,466 5,090,466
TOTALS, OPERATION AND MAINTENANCEOF PLANT................................................................. 154.1 154.0 154.0 $5,524,476 $5,821,265 $5,821,265
Reimbursed Activities:Academic Salaries...................................... 24.3 – – 691,231 – –Management and Supervisory ................... 10 – – 480,466 – –Support Staff Salaries ................................ 48.5 – – 1,297,960 – –
TOTALS, REIMBURSED ACTIVITIES ................. 82.8 – – $2,469,657 – –Auxiliary Enterprises:
Management and Supervisory ................... 7.1 – – 464,694 – –Support Staff Salaries ................................ 98.7 – – 3,242,278 – –
TOTALS, AUXILIARY ENTERPRISES .................. 105.8 – – $3,706,972 – –Independent Operations:
Academic Salaries...................................... 0.9 – – 46,711 – –Support Staff Salaries ................................ 2.5 – – 39,396 – –
TOTALS, INDEPENDENT OPERATIONS ............ 3.4 – – $86,107 – –
TOTALS, CALIFORNIA STATE UNIVERSITY,SAN LUIS OBISPO .................................................. 2,260.7 1,997.4 1,997.4 $111,582,811 $108,992,592 $108,992,592
CALIFORNIA STATE UNIVERSITY, BAKERSFIELDInstruction:
Academic Salaries...................................... 292.6 338.7 338.7 $16,674,851 $16,523,456 $16,523,456Management and Supervisory ................... 3.3 – – 205,488 – –Support Staff Salaries ................................ 25.9 216.8 216.8 808,558 3,530,289 3,530,289
TOTALS, INSTRUCTION ........................................ 321.8 555.5 555.5 $17,688,897 $20,053,745 $20,053,745
SALARY RANGE
EDUCATION E 49
CALIFORNIA STATE POLYTECHNIC UNIVERSITY, POMONA—Continued
ORGANIZATIONAL UNIT NUMBER OF POSITIONS EXPENDITURES
Filled Authorized Proposed Actual Estimated ProposedClassification 1999–00 2000–01 2001–02 1999–00 2000–01 2001–02
123456789
1011121314151617181920212223242526272829303132333435363738394041424344454647484950515253545556575859606162636465666768697071727374757677787980
62—38270
Page 51
Research:Support Staff Salaries ................................ 0.5 – – 7,010 – –
TOTALS, RESEARCH .............................................. 0.5 – – $7,010 – –Public Service:
Academic Salaries...................................... 0.1 – – 102 – –Support Staff Salaries ................................ 1.1 – – 106,863 – –
TOTALS, PUBLIC SERVICE ................................... 1.2 – – $106,965 – –Academic Support:
Academic Salaries...................................... 9.4 – – 545,935 – –Management and Supervisory ................... 11.8 18 18 1,011,049 1,522,552 1,522,552Support Staff Salaries ................................ 130.6 108.4 108.4 3,671,660 3,476,629 3,476,629
TOTALS, ACADEMIC SUPPORT ........................... 151.8 126.4 126.4 $5,228,644 $4,999,181 $4,999,181Student Services:
Academic Salaries...................................... 15.2 28 28 902,691 1,180,192 1,180,192Management and Supervisory ................... 11.2 14 14 838,563 1,059,069 1,059,069Support Staff Salaries ................................ 82.7 129 129 2,609,841 3,132,683 3,132,683
TOTALS, STUDENT SERVICES............................. 109.1 171.0 171.0 $4,351,095 $5,371,944 $5,371,944Institutional Support:
Academic Salaries...................................... 0.4 – – 23,623 – –President..................................................... 1 1 1 184,804 184,812 184,812Management and Supervisory ................... 22.2 16 16 1,742,095 1,381,374 1,381,374Support Staff Salaries ................................ 102.4 129.8 129.8 4,489,670 4,123,397 4,123,397
TOTALS, INSTITUTIONAL SUPPORT .................. 126.0 146.8 146.8 $6,440,192 $5,689,583 $5,689,583Operation and Maintenance of Plant:
Management and Supervisory ................... 4.6 6 6 256,272 379,693 379,693Support Staff Salaries ................................ 47.2 64 64 1,594,176 2,020,652 2,020,652
TOTALS, OPERATION AND MAINTENANCEOF PLANT................................................................. 51.8 70.0 70.0 $1,850,448 $2,400,345 $2,400,345
Reimbursed Activities:Academic Salaries...................................... 0.2 6 6 7,906 300,000 300,000Management and Supervisory ................... 0.9 – – 41,928 – –Support Staff Salaries ................................ 35.8 6 6 1,045,625 40,000 40,000
TOTALS, REIMBURSED ACTIVITIES ................. 36.9 12.0 12.0 $1,095,459 $340,000 $340,000Auxiliary Enterprises:
Management and Supervisory ................... 2 – – 188,430 – –Support Staff Salaries ................................ 24.1 – – 735,990 – –
TOTALS, AUXILIARY ENTERPRISES ................. 26.1 – – $924,420 – –
TOTALS, CALIFORNIA STATE UNIVERSITY,BAKERSFIELD ........................................................ 825.2 1,081.7 1,081.7 $37,693,130 $38,854,798 $38,854,798
CALIFORNIA STATE UNIVERSITY, CHICOInstruction:
Academic Salaries...................................... 754.8 776.4 776.4 $45,728,811 $46,828,944 $46,828,944Management and Supervisory ................... 1.5 1.5 1.5 152,904 152,403 152,403Support Staff Salaries ................................ 137.9 153.4 153.4 4,128,354 4,592,092 4,592,092
TOTALS, INSTRUCTION ........................................ 894.2 931.3 931.3 $50,010,069 $51,573,439 $51,573,439Public Service:
Management and Supervisory ................... 1 1 1 66,180 65,963 65,963Support Staff Salaries ................................ 0.4 0.4 0.4 4,591 3,738 3,738
TOTALS, PUBLIC SERVICE ................................... 1.4 1.4 1.4 $70,771 $69,701 $69,701Academic Support:
Academic Salaries...................................... 37.3 37.2 37.2 1,506,784 1,506,892 1,506,892Management and Supervisory ................... 28.3 28.8 28.8 2,362,170 2,354,439 2,354,439Support Staff Salaries ................................ 229.5 258.8 258.8 7,974,226 8,934,662 8,934,662
TOTALS, ACADEMIC SUPPORT ........................... 295.1 324.8 324.8 $11,843,180 $12,795,993 $12,795,993Student Services:
Academic Salaries...................................... 11.4 11.2 11.2 632,467 639,530 639,530Management and Supervisory ................... 21.6 21.8 21.8 1,394,001 1,435,274 1,435,274Support Staff Salaries ................................ 153.1 172.6 172.6 5,620,856 6,485,497 6,485,497
TOTALS, STUDENT SERVICES............................. 186.1 205.6 205.6 $7,647,324 $8,560,301 $8,560,301
SALARY RANGE
EDUCATIONE 50
CALIFORNIA STATE UNIVERSITY, BAKERSFIELD—Continued
ORGANIZATIONAL UNIT NUMBER OF POSITIONS EXPENDITURES
Filled Authorized Proposed Actual Estimated ProposedClassification 1999–00 2000–01 2001–02 1999–00 2000–01 2001–02
123456789
1011121314151617181920212223242526272829303132333435363738394041424344454647484950515253545556575859606162636465666768697071727374757677787980
Page 52
Institutional Support:President..................................................... 1 1 1 188,532 172,821 172,821Management and Supervisory ................... 65.1 66 66 4,521,859 4,516,934 4,516,934Support Staff Salaries ................................ 158.4 183 183 5,923,708 6,823,164 6,823,164
TOTALS, INSTITUTIONAL SUPPORT ................. 224.5 250.0 250.0 $10,634,099 $11,512,919 $11,512,919Operation and Maintenance of Plant:
Management and Supervisory ................... 16.3 16.8 16.8 1,074,515 1,070,998 1,070,998Support Staff Salaries ................................ 132.5 156.6 156.6 4,907,701 5,735,969 5,735,969
TOTALS, OPERATION AND MAINTENANCEOF PLANT ................................................................ 148.8 173.4 173.4 $5,982,216 $6,806,967 $6,806,967
Reimbursed Activities:Academic Salaries...................................... 22.3 22.4 22.4 987,050 1,078,685 1,078,685Management and Supervisory ................... 3.8 3.8 3.8 163,350 181,276 181,276Support Staff Salaries ................................ 81.5 90.3 90.3 1,491,249 1,652,337 1,652,337
TOTALS, REIMBURSED ACTIVITIES .................. 107.6 116.5 116.5 $2,641,649 $2,912,298 $2,912,298Auxiliary Enterprises:
Management and Supervisory ................... 4.9 – – 267,764 – –Support Staff Salaries ................................ 74.2 – – 1,599,452 – –
TOTALS, AUXILIARY ENTERPRISES .................. 79.1 – – $1,867,216 – –
TOTALS, CALIFORNIA STATE UNIVERSITY,CHICO........................................................................ 1,936.8 2,003.0 2,003.0 $90,696,524 $94,231,618 $94,231,618
CALIFORNIA STATE UNIVERSITY, DOMINGUEZ HILLSInstruction:
Academic Salaries...................................... 476.3 446.4 446.4 $26,920,589 $28,000,223 $28,000,223Management and Supervisory ................... 3 – – 190,985 – –Support Staff Salaries ................................ 93.9 91.8 91.8 2,965,373 2,953,489 2,953,489
TOTALS, INSTRUCTION ........................................ 573.2 538.2 538.2 $30,076,947 $30,953,712 $30,953,712Public Service:
Support Staff Salaries ................................ 0.2 – – 9,081 – –
TOTALS, PUBLIC SERVICE ................................... 0.2 – – $9,081 – –Academic Support:
Academic Salaries...................................... 9.9 10 10 691,963 783,902 783,902Management and Supervisory ................... 40.3 32 32 3,041,101 2,868,961 2,868,961Support Staff Salaries ................................ 105.5 131.4 131.4 4,104,355 5,284,166 5,284,166
TOTALS, ACADEMIC SUPPORT ........................... 155.7 173.4 173.4 $7,837,419 $8,937,029 $8,937,029Student Services:
Academic Salaries...................................... 4.6 5.4 5.4 311,221 374,212 374,212Management and Supervisory ................... 17.6 17.5 17.5 1,330,250 1,359,214 1,359,214Support Staff Salaries ................................ 123.4 122 122 4,656,961 5,015,490 5,015,490
TOTALS, STUDENT SERVICES............................. 145.6 144.9 144.9 $6,298,432 $6,748,916 $6,748,916Institutional Support:
President..................................................... 0.9 1 1 141,823 205,932 205,932Management and Supervisory ................... 37.8 37.5 37.5 2,885,489 3,138,030 3,138,030Support Staff Salaries ................................ 108.2 99 99 4,905,465 3,951,990 3,951,990
TOTALS, INSTITUTIONAL SUPPORT ................. 146.9 137.5 137.5 $7,932,777 $7,295,952 $7,295,952Operation and Maintenance of Plant:
Management and Supervisory ................... 19.9 7 7 856,396 427,099 427,099Support Staff Salaries ................................ 59.1 68 68 2,232,805 2,572,518 2,572,518
TOTALS, OPERATION AND MAINTENANCEOF PLANT................................................................. 79.0 75.0 75.0 $3,089,201 $2,999,617 $2,999,617
Reimbursed Activities:Academic Salaries...................................... 11.4 12.4 12.4 438,387 603,602 603,602Management and Supervisory ................... 1.3 – – 111,231 – –Support Staff Salaries ................................ 17.3 34.5 34.5 516,849 1,033,038 1,033,038
TOTALS, REIMBURSED ACTIVITIES .................. 30.0 46.9 46.9 $1,066,467 $1,636,640 $1,636,640Auxiliary Enterprises:
Management and Supervisory ................... 3 – – 196,940 – –Support Staff Salaries ................................ 28.5 – – 793,949 – –
TOTALS, AUXILIARY ENTERPRISES ................. 31.5 – – $990,889 – –
SALARY RANGE
EDUCATION E 51
CALIFORNIA STATE UNIVERSITY, CHICO—Continued
ORGANIZATIONAL UNIT NUMBER OF POSITIONS EXPENDITURES
Filled Authorized Proposed Actual Estimated ProposedClassification 1999–00 2000–01 2001–02 1999–00 2000–01 2001–02
123456789
1011121314151617181920212223242526272829303132333435363738394041424344454647484950515253545556575859606162636465666768697071727374757677787980
Page 53
Independent Operations:Academic Salaries...................................... 1.5 – – 273,491 – –Support Staff Salaries ............................... 2.5 – – 59,398 – –
TOTALS, INDEPENDENT OPERATIONS ............ 4.0 – – $332,889 – –
TOTALS, CALIFORNIA STATE UNIVERSITY,DOMINGUEZ HILLS .............................................. 1,166.1 1,115.9 1,115.9 $57,634,102 $58,571,866 $58,571,866
CALIFORNIA STATE UNIVERSITY, FRESNOInstruction:
Academic Salaries...................................... 868.3 751.1 751.1 $51,453,035 $55,178,527 $55,178,527Management and Supervisory ................... 1.9 2 2 174,454 184,299 184,299Support Staff Salaries ................................ 154.7 157.4 157.4 5,270,794 5,140,647 5,140,647
TOTALS, INSTRUCTION ........................................ 1,024.9 910.5 910.5 $56,898,283 $60,503,473 $60,503,473Public Service:
Management and Supervisory ................... 1 – – 98,688 – –Support Staff Salaries ................................ 25.2 – – 1,079,839 – –
TOTALS, PUBLIC SERVICE ................................... 26.2 – – $1,178,527 – –Academic Support:
Academic Salaries...................................... 47.9 29.2 29.2 2,019,120 2,133,282 2,133,282Management and Supervisory ................... 51.6 54.9 54.9 4,397,404 4,615,985 4,615,985Support Staff Salaries ................................ 396.1 423 423 12,693,566 13,034,610 13,034,610
TOTALS, ACADEMIC SUPPORT ........................... 495.6 507.1 507.1 $19,110,090 $19,783,877 $19,783,877Student Services:
Academic Salaries...................................... 24 36 36 1,072,654 2,082,236 2,082,236Management and Supervisory ................... 20.4 22.8 22.8 1,740,080 1,949,094 1,949,094Support Staff Salaries ................................ 201.5 277 277 6,404,169 8,978,732 8,978,732
TOTALS, STUDENT SERVICES............................. 245.9 335.8 335.8 $9,216,903 $13,010,062 $13,010,062Institutional Support:
President..................................................... 0.4 1 1 84,585 203,004 203,004Management and Supervisory ................... 40.5 35.5 35.5 2,927,647 2,986,000 2,986,000Support Staff Salaries ................................ 161.1 151.5 151.5 4,896,316 5,279,752 5,279,752
TOTALS, INSTITUTIONAL SUPPORT .................. 202.0 188.0 188.0 $7,908,548 $8,468,756 $8,468,756Operation and Maintenance of Plant:
Academic Salaries...................................... 1.1 – – 70,633 – –Management and Supervisory ................... 12.6 7.6 7.6 786,499 635,617 635,617Support Staff Salaries ................................ 133.1 118 118 4,301,014 4,415,063 4,415,063
TOTALS, OPERATION AND MAINTENANCEOF PLANT................................................................. 146.8 125.6 125.6 $5,158,146 $5,050,680 $5,050,680
Reimbursed Activities:Academic Salaries...................................... 8.4 14.6 14.6 1,050,516 1,074,182 1,074,182Management and Supervisory ................... 6.1 5.7 5.7 510,987 483,205 483,205Support Staff Salaries ................................ 13.2 23.3 23.3 830,393 777,520 777,520
TOTALS, REIMBURSED ACTIVITIES .................. 27.7 43.6 43.6 $2,391,896 $2,334,907 $2,334,907Auxiliary Enterprises:
Academic Salaries...................................... 12.7 – – 824,399 – –Management and Supervisory ................... 0.8 – – 39,941 – –Support Staff Salaries ................................ 68.2 – – 2,428,634 – –
TOTALS, AUXILIARY ENTERPRISES ................. 81.7 – – $3,292,974 – –Independent Operations:
Academic Salaries...................................... 0.6 – – 3,894 – –Management and Supervisory ................... 4.4 – – 122,347 – –Support Staff Salaries ................................ 20.8 – – 600,635 – –
TOTALS, INDEPENDENT OPERATIONS ............ 25.8 – – $726,876 – –
TOTALS, CALIFORNIA STATE UNIVERSITY,FRESNO..................................................................... 2,276.6 2,110.6 2,110.6 $105,882,243 $109,151,755 $109,151,755
CALIFORNIA STATE UNIVERSITY, FULLERTONInstruction:
Academic Salaries...................................... 1,219.2 1,328 1,328 $57,986,921 $68,692,752 $68,692,752Management and Supervisory ................... 15.9 18.1 18.1 1,409,640 1,590,674 1,590,674Support Staff Salaries ................................ 212.6 221 221 6,848,964 7,720,619 7,720,619
TOTALS, INSTRUCTION ........................................ 1,447.7 1,567.1 1,567.1 $66,245,525 $78,004,045 $78,004,045
SALARY RANGE
EDUCATIONE 52
CALIFORNIA STATE UNIVERSITY, DOMINGUEZ HILLS—Continued
ORGANIZATIONAL UNIT NUMBER OF POSITIONS EXPENDITURES
Filled Authorized Proposed Actual Estimated ProposedClassification 1999–00 2000–01 2001–02 1999–00 2000–01 2001–02
123456789
1011121314151617181920212223242526272829303132333435363738394041424344454647484950515253545556575859606162636465666768697071727374757677787980
Page 54
Public Service:Support Staff Salaries ................................ 1.8 1.8 1.8 71,955 80,383 80,383
TOTALS, PUBLIC SERVICE .................................. 1.8 1.8 1.8 $71,955 $80,383 $80,383Academic Support:
Academic Salaries...................................... 53.2 58.3 58.3 1,765,133 1,951,856 1,951,856Management and Supervisory ................... 22.2 25.8 25.8 2,158,789 2,409,644 2,409,644Support Staff Salaries ................................ 207.3 212.6 212.6 6,924,647 7,669,453 7,669,453
TOTALS, ACADEMIC SUPPORT .......................... 282.7 296.7 296.7 $10,848,569 $12,030,953 $12,030,953Student Services:
Academic Salaries...................................... 44 46.4 46.4 1,598,137 1,771,734 1,771,734Management and Supervisory ................... 31 34 34 2,167,165 2,435,748 2,435,748Support Staff Salaries ................................ 276.8 283.4 283.4 9,342,767 10,389,886 10,389,886
TOTALS, STUDENT SERVICES............................. 351.8 363.8 363.8 $13,108,069 $14,597,368 $14,597,368Institutional Support:
Academic Salaries...................................... 3.1 3.1 3.1 95,289 103,243 103,243President..................................................... 0.9 1 1 173,718 198,948 198,948Management and Supervisory ................... 68 77.1 77.1 5,193,898 5,863,442 5,863,442Support Staff Salaries ................................ 271.7 284.7 284.7 10,191,986 11,378,859 11,378,859
TOTALS, INSTITUTIONAL SUPPORT .................. 343.7 365.9 365.9 $15,654,891 $17,544,492 $17,544,492Operation and Maintenance of Plant:
Management and Supervisory ................... 10.8 11.9 11.9 635,552 716,820 716,820Support Staff Salaries ................................ 115.5 123.1 123.1 4,084,036 4,614,798 4,614,798
TOTALS, OPERATION AND MAINTENANCEOF PLANT................................................................. 126.3 135.0 135.0 $4,719,588 $5,331,618 $5,331,618
Reimbursed Activities:Academic Salaries...................................... 9.8 9.6 9.6 1,037,014 961,522 961,522Management and Supervisory ................... 2 2 2 124,323 124,323 124,323Support Staff Salaries ................................ 20.2 20.9 20.9 903,782 890,921 890,921
TOTALS, REIMBURSED ACTIVITIES ................. 32.0 32.5 32.5 $2,065,119 $1,976,766 $1,976,766Auxiliary Enterprises:
Management and Supervisory ................... 0.8 – – 60,293 – –Support Staff Salaries ................................ 47 – – 1,248,202 – –
TOTALS, AUXILIARY ENTERPRISES ................. 47.8 – – $1,308,495 – –
TOTALS, CALIFORNIA STATE UNIVERSITY,FULLERTON ............................................................. 2,633.8 2,762.8 2,762.8 $114,022,211 $129,565,625 $129,565,625
CALIFORNIA STATE UNIVERSITY, HAYWARDInstruction:
Academic Salaries...................................... 625.4 597 597 $36,236,587 $36,993,216 $36,993,216Management and Supervisory ................... 15.3 – – 1,506,483 – –Support Staff Salaries ................................ 208.8 101.1 101.1 7,222,212 3,563,591 3,563,591
TOTALS, INSTRUCTION ........................................ 849.5 698.1 698.1 $44,965,282 $40,556,807 $40,556,807Academic Support:
Academic Salaries...................................... 14.8 16.2 16.2 1,139,174 1,214,740 1,214,740Management and Supervisory ................... 11.5 20.5 20.5 1,005,994 2,112,653 2,112,653Support Staff Salaries ................................ 132.8 189.7 189.7 5,108,619 7,493,563 7,493,563
TOTALS, ACADEMIC SUPPORT ........................... 159.1 226.4 226.4 $7,253,787 $10,820,956 $10,820,956Student Services:
Academic Salaries...................................... 0.2 – – 9,449 – –Management and Supervisory ................... 11.1 12.5 12.5 907,709 1,040,867 1,040,867Support Staff Salaries ................................ 159.4 158.6 158.6 5,746,663 5,986,178 5,986,178
TOTALS, STUDENT SERVICES............................. 170.7 171.1 171.1 $6,663,821 $7,027,045 $7,027,045Institutional Support:
Academic Salaries...................................... 1 2 2 90,642 173,390 173,390President..................................................... 1 1 1 177,962 198,546 198,546Management and Supervisory ................... 35.6 37.2 37.2 3,001,364 3,360,191 3,360,191Support Staff Salaries ................................ 149.7 170.1 170.1 5,593,386 7,000,078 7,000,078
TOTALS, INSTITUTIONAL SUPPORT ................. 187.3 210.3 210.3 $8,863,354 $10,732,205 $10,732,205Operation and Maintenance of Plant:
Management and Supervisory ................... 11 13 13 728,296 903,390 903,390Support Staff Salaries ................................ 87.6 89.6 89.6 3,209,475 3,372,660 3,372,660
TOTALS, OPERATION AND MAINTENANCEOF PLANT ................................................................ 98.6 102.6 102.6 $3,937,771 $4,276,050 $4,276,050
SALARY RANGE
EDUCATION E 53
CALIFORNIA STATE UNIVERSITY, FULLERTON—Continued
ORGANIZATIONAL UNIT NUMBER OF POSITIONS EXPENDITURES
Filled Authorized Proposed Actual Estimated ProposedClassification 1999–00 2000–01 2001–02 1999–00 2000–01 2001–02
123456789
1011121314151617181920212223242526272829303132333435363738394041424344454647484950515253545556575859606162636465666768697071727374757677787980
Page 55
Reimbursed Activities:Academic Salaries...................................... 12.9 – – 771,216 – –Management and Supervisory ................... – – – – – –Support Staff Salaries ................................ 18.5 25.2 25.2 773,773 705,000 705,000
TOTALS, REIMBURSED ACTIVITIES .................. 31.4 25.2 25.2 $1,544,989 $705,000 $705,000Auxiliary Enterprises:
Management and Supervisory ................... 0.5 – – 37,266 – –Support Staff Salaries ................................ 23.5 – – 745,605 – –
TOTALS, AUXILIARY ENTERPRISES ................. 24.0 – – $782,871 – –
TOTALS, CALIFORNIA STATE UNIVERSITY,HAYWARD ................................................................ 1,520.6 1,433.7 1,433.7 $74,011,875 $74,118,063 $74,118,063
CALIFORNIA STATE UNIVERSITY, LONG BEACHInstruction:
Academic Salaries...................................... 1,369.8 1,486 1,486 $73,330,796 $77,759,375 $77,759,375Management and Supervisory ................... 9.7 7 7 539,086 413,652 413,652Support Staff Salaries ................................ 284.9 210 210 9,909,156 13,944,339 13,944,339
TOTALS, INSTRUCTION ........................................ 1,664.4 1,703.0 1,703.0 $83,779,038 $92,117,366 $92,117,366Public Service:
Management and Supervisory ................... 1 1 1 96,876 109,861 109,861Support Staff Salaries ................................ 1.3 1 1 30,283 29,996 29,996
TOTALS, PUBLIC SERVICE ................................... 2.3 2.0 2.0 $127,159 $139,857 $139,857Academic Support:
Academic Salaries...................................... 26 10 10 1,689,715 235,349 235,349Management and Supervisory ................... 47.4 53 53 4,101,320 4,576,417 4,576,417Support Staff Salaries ................................ 253.3 164 164 8,453,204 10,819,716 10,819,716
TOTALS, ACADEMIC SUPPORT .......................... 326.7 227.0 227.0 $14,244,239 $15,631,482 $15,631,482Student Services;
Academic Salaries...................................... 39.8 11 11 1,879,897 185,802 185,802Management and Supervisory ................... 42.3 43 43 3,224,578 3,390,132 3,390,132Support Staff Salaries ................................ 347.9 238 238 12,548,407 15,845,468 15,845,468
TOTALS, STUDENT SERVICES ............................ 430.0 292.0 292.0 $17,652,882 $19,421,402 $19,421,402Institutional Support:
Academic Salaries...................................... 35.1 – – 426,143 – –President..................................................... 1 1 1 220,733 236,688 236,688Management and Supervisory ................... 71.5 77 77 5,581,363 5,990,557 5,990,557Support Staff Salaries ................................ 288.2 179 179 9,365,728 11,657,606 11,657,606
TOTALS, INSTITUTIONAL SUPPORT ................. 395.8 257.0 257.0 $15,593,967 $17,884,851 $17,884,851Operation and Maintenance of Plant:
Management and Supervisory ................... 19.8 23 23 1,379,557 1,564,109 1,564,109Support Staff Salaries ................................ 150.1 95 95 5,666,410 6,382,314 6,382,314
TOTALS, OPERATION AND MAINTENANCEOF PLANT................................................................. 169.9 118.0 118.0 $7,045,967 $7,946,423 $7,946,423
Reimbursed Activities:Academic Salaries...................................... 18.3 – – 814,090 – –Management and Supervisory ................... 2.4 – – 89,694 – –Support Staff Salaries ................................ 64.2 – – 1,529,846 – –
TOTALS, REIMBURSED ACTIVITIES .................. 84.9 – – $2,433,630 – –Auxiliary Enterprises:
Management and Supervisory ................... 7 – – 494,054 – –Support Staff Salaries ................................ 98 – – 2,809,770 – –
TOTALS, AUXILIARY ENTERPRISES ................. 105.0 – – $3,303,824 – –
TOTALS, CALIFORNIA STATE UNIVERSITY,LONG BEACH .......................................................... 3,179.0 2,599.0 2,599.0 $144,180,706 $153,141,381 $153,141,381
CALIFORNIA STATE UNIVERSITY, LOS ANGELES
Instruction:Academic Salaries...................................... 747.1 697 697 $47,460,071 $47,700,278 $47,700,278Management and Supervisory ................... 33.2 – – 3,128,555 – –Support Staff Salaries ................................ 169.9 8 8 8,348,029 205,404 205,404
TOTALS, INSTRUCTION ........................................ 950.2 705.0 705.0 $58,936,655 $47,905,682 $47,905,682
SALARY RANGE
EDUCATIONE 54
CALIFORNIA STATE UNIVERSITY, HAYWARD—Continued
ORGANIZATIONAL UNIT NUMBER OF POSITIONS EXPENDITURES
Filled Authorized Proposed Actual Estimated ProposedClassification 1999–00 2000–01 2001–02 1999–00 2000–01 2001–02
123456789
1011121314151617181920212223242526272829303132333435363738394041424344454647484950515253545556575859606162636465666768697071727374757677787980
Page 56
Public Service:Academic Salaries...................................... 1.4 – – 87,694 – –Management and Supervisory ................... 5.8 – – 485,874 – –Support Staff Salaries ................................ 0.1 – – 3,802 – –
TOTALS, PUBLIC SERVICE ................................... 7.3 – – $577,370 – –Academic Support:
Academic Salaries...................................... 17.5 57 57 883,654 2,439,326 2,439,326Management and Supervisory ................... 41 52 52 3,901,094 3,440,330 3,440,330Support Staff Salaries ................................ 83.3 422 422 2,973,229 12,193,946 12,193,946
TOTALS, ACADEMIC SUPPORT ........................... 141.8 531.0 531.0 $7,757,977 $18,073,602 $18,073,602Student Services:
Academic Salaries...................................... – 12 12 – 808,761 808,761Management and Supervisory ................... 18.4 37 37 1,438,167 1,874,279 1,874,279Support Staff Salaries ................................ 108.6 250 250 7,070,506 7,101,849 7,101,849
TOTALS, STUDENT SERVICES............................. 127.0 299.0 299.0 $8,508,673 $9,784,889 $9,784,889Institutional Support:
President..................................................... 1 1 1 216,648 230,736 230,736Management and Supervisory ................... 42.3 38 38 3,793,201 2,744,268 2,744,268Support Staff Salaries ................................ 146.9 197 197 9,178,755 5,866,804 5,866,804
TOTALS, INSTITUTIONAL SUPPORT .................. 190.2 236.0 236.0 $13,188,604 $8,841,808 $8,841,808Operation and Maintenance of Plant:
Management and Supervisory ................... 5.9 12 12 414,189 493,295 493,295Support Staff Salaries ................................ 131.4 163 163 4,768,468 3,073,866 3,073,866
TOTALS, OPERATION AND MAINTENANCEOF PLANT................................................................. 137.3 175.0 175.0 $5,182,657 $3,567,161 $3,567,161
Reimbursed Activities:Academic Salaries...................................... 31 30 30 1,225,159 1,185,127 1,185,127Management and Supervisory ................... 1.2 2 2 104,267 143,320 143,320Support Staff Salaries ................................ 57.5 53 53 1,362,268 954,830 954,830
TOTALS, REIMBURSED ACTIVITIES ................. 89.7 85.0 85.0 $2,691,694 $2,283,277 $2,283,277Auxiliary Enterprises:
Management and Supervisory ................... 1.9 – – 105,340 – –Support Staff Salaries ................................ 47 – – 1,204,145 – –
TOTALS, AUXILIARY ENTERPRISES .................. 48.9 – – $1,309,485 – –
TOTALS, CALIFORNIA STATE UNIVERSITY,LOS ANGELES ........................................................ 1,692.4 2,031.0 2,031.0 $98,153,115 $90,456,419 $90,456,419
CALIFORNIA STATE UNIVERSITY, MONTEREY BAYInstruction:
Academic Salaries...................................... 155.3 156.6 156.6 $7,945,987 $8,497,468 $8,497,468Management and Supervisory ................... 4.9 5.3 5.3 182,597 239,024 239,024Support Staff Salaries ................................ 70.2 83 83 2,173,195 2,189,626 2,189,626
TOTALS, INSTRUCTION ........................................ 230.4 244.9 244.9 $10,301,779 $10,926,118 $10,926,118Academic Support:
Academic Salaries...................................... 7.2 6 6 482,112 384,311 384,311Management and Supervisory ................... 13.4 16.4 16.4 1,232,449 1,491,274 1,491,274Support Staff Salaries ................................ 74.2 92.1 92.1 2,759,272 3,099,070 3,099,070
TOTALS, ACADEMIC SUPPORT ........................... 94.8 114.5 114.5 $4,473,833 $4,974,655 $4,974,655Student Services:
Academic Salaries...................................... 1.3 2.7 2.7 74,548 134,706 134,706Management and Supervisory ................... 11.3 13.8 13.8 744,578 945,229 945,229Support Staff Salaries ................................ 77.7 80.3 80.3 2,067,330 2,125,869 2,125,869
TOTALS, STUDENT SERVICES............................. 90.3 96.8 96.8 $2,886,456 $3,205,804 $3,205,804Institutional Support:
Academic Salaries...................................... 0.2 – – 2,005 – –President..................................................... 1 1 1 190,620 200,231 200,231Management and Supervisory ................... 32.9 39.1 39.1 2,702,966 3,464,590 3,464,590Support Staff Salaries ................................ 93.2 105.5 105.5 3,422,356 3,641,141 3,641,141
TOTALS, INSTITUTIONAL SUPPORT ................. 127.3 145.6 145.6 $6,317,947 $7,305,962 $7,305,962Operation and Maintenance of Plant:
Management and Supervisory ................... 11.2 11.8 11.8 853,639 914,532 914,532Support Staff Salaries ................................ 20.1 30.6 30.6 805,056 1,164,021 1,164,021
TOTALS, OPERATION AND MAINTENANCEOF PLANT................................................................. 31.3 42.4 42.4 $1,658,695 $2,078,553 $2,078,553
SALARY RANGE
EDUCATION E 55
CALIFORNIA STATE UNIVERSITY, LOS ANGELES—Continued
ORGANIZATIONAL UNIT NUMBER OF POSITIONS EXPENDITURES
Filled Authorized Proposed Actual Estimated ProposedClassification 1999–00 2000–01 2001–02 1999–00 2000–01 2001–02
123456789
1011121314151617181920212223242526272829303132333435363738394041424344454647484950515253545556575859606162636465666768697071727374757677787980
Page 57
Reimbursed Activities:Academic Salaries...................................... 6.6 7.8 7.8 40,608 330,086 330,086Management and Supervisory ................... – 1.5 1.5 – 92,296 92,296Support Staff Salaries ................................ 34.7 11.9 11.9 1,012,356 275,212 275,212
TOTALS, REIMBURSED ACTIVITIES ................. 41.3 21.2 21.2 $1,052,964 $697,594 $697,594Auxiliary Enterprises:
Academic Salaries...................................... – – – – – –Support Staff Salaries ................................ 1.1 – – 189,862 – –
TOTALS, AUXILIARY ENTERPRISES .................. 1.1 – – $189,862 – –
TOTALS, CALIFORNIA STATE UNIVERSITY,MONTEREY BAY..................................................... 616.5 665.4 665.4 $26,881,536 $29,188,686 $29,188,686
CALIFORNIA STATE UNIVERSITY, NORTHRIDGEInstruction:
Academic Salaries...................................... 1,118.9 1,160.1 1,160.1 $66,100,076 $69,843,561 $69,843,561Management and Supervisory ................... 2.9 3 3 218,348 227,431 227,431Support Staff Salaries ................................ 312.9 257.2 257.2 9,707,141 8,831,614 8,831,614
TOTALS, INSTRUCTION ........................................ 1,434.7 1,420.3 1,420.3 $76,025,565 $78,902,606 $78,902,606Research:
Academic Salaries...................................... 0.1 – – 11,827 – –Support Staff Salaries ................................ 6.2 5.5 5.5 245,562 194,998 194,998
TOTALS, RESEARCH .............................................. 6.3 5.5 5.5 $257,389 $194,998 $194,998Public Service:
Academic Salaries...................................... 0.1 – – 3,000 – –Management and Supervisory ................... 1.7 1.8 1.8 127,015 135,424 135,424Support Staff Salaries ................................ 5.5 5.3 5.3 233,821 232,506 232,506
TOTALS, PUBLIC SERVICE ................................... 7.3 7.1 7.1 $363,836 $367,930 $367,930Academic Support:
Academic Salaries...................................... 25.1 25 25 1,793,537 1,847,568 1,847,568Management and Supervisory ................... 52.3 55.2 55.2 4,486,862 4,658,326 4,658,326Support Staff Salaries ................................ 264.2 256.1 256.1 8,749,852 8,779,088 8,779,088
TOTALS, ACADEMIC SUPPORT ........................... 341.6 336.3 336.3 $15,030,251 $15,284,982 $15,284,982Student Services:
Academic Salaries...................................... 35.9 37.3 37.3 2,039,954 2,190,126 2,190,126Management and Supervisory ................... 52.8 52.5 52.5 3,993,403 4,148,588 4,148,588Support Staff Salaries ................................ 376.7 362.8 362.8 13,284,505 13,331,900 13,331,900
TOTALS, STUDENT SERVICES............................. 465.4 452.6 452.6 $19,317,862 $19,670,614 $19,670,614Institutional Support:
President .................................................... 0.9 1 1 205,298 200,004 200,004Management and Supervisory .................. 83.6 80.1 80.1 5,796,193 5,919,391 5,919,391Support Staff Salaries ............................... 255.9 237.9 237.9 8,263,320 8,124,061 8,124,061
TOTALS, INSTITUTIONAL SUPPORT ................. 340.4 319.0 319.0 $14,264,811 $14,243,456 $14,243,456Operation and Maintenance of Plant:
Management and Supervisory .................. 17.9 18 18 1,163,664 1,212,073 1,212,073Support Staff Salaries ............................... 196.3 187.8 187.8 6,512,044 6,557,897 6,557,897
TOTALS, OPERATION AND MAINTENANCEOF PLANT ................................................................ 214.2 205.8 205.8 $7,675,708 $7,769,970 $7,769,970
Reimbursed Activities:Academic Salaries...................................... 0.4 27.1 27.1 97,578 1,167,010 1,167,010Management and Supervisory .................. 0.3 4.5 4.5 53,332 214,130 214,130Support Staff Salaries ............................... 55.2 81.9 81.9 2,888,653 2,797,336 2,797,336
TOTALS, REIMBURSED ACTIVITIES ................. 55.9 113.5 113.5 $3,039,563 $4,178,476 $4,178,476Auxiliary Enterprises:
Management and Supervisory .................. 7.2 – – 404,463 – –Support Staff Salaries ............................... 97.3 – – 2,425,396 – –
TOTALS, AUXILIARY ENTERPRISES ................. 104.5 – – $2,829,859 – –Independent Operations:
Management and Supervisory .................. 2.1 – – 144,692 – –Support Staff Salaries ............................... 5.9 – – 236,500 – –
TOTALS, INDEPENDENT OPERATIONS ............ 8.0 – – $381,192 – –
TOTALS, CALIFORNIA STATE UNIVERSITY,NORTHRIDGE ......................................................... 2,978.3 2,860.1 2,860.1 $139,186,036 $140,613,032 $140,613,032
SALARY RANGE
EDUCATIONE 56
CALIFORNIA STATE UNIVERSITY, MONTEREY BAY—Continued
ORGANIZATIONAL UNIT NUMBER OF POSITIONS EXPENDITURES
Filled Authorized Proposed Actual Estimated ProposedClassification 1999–00 2000–01 2001–02 1999–00 2000–01 2001–02
123456789
1011121314151617181920212223242526272829303132333435363738394041424344454647484950515253545556575859606162636465666768697071727374757677787980
Page 58
Instruction:Academic Salaries .................................... 1,082.6 1,014.6 1,014.6 $63,054,613 $67,676,476 $67,676,476Management and Supervisory .................. 9.4 10 10 641,269 742,284 742,284Support Staff Salaries ............................... 289.9 230.1 230.1 8,584,708 8,203,413 8,203,413
TOTALS, INSTRUCTION ........................................ 1,381.9 1,254.7 1,254.7 $72,280,590 $76,622,173 $76,622,173Public Service:
Management and Supervisory .................. 3 – – 271,929 – –Support Staff Salaries ............................... 5.9 – – 154,170 – –
TOTALS, PUBLIC SERVICE .................................. 8.9 – – $426,099 – –Academic Support:
Academic Salaries .................................... 25.9 1.5 1.5 1,916,420 79,692 79,692Management and Supervisory .................. 30 30.5 30.5 2,903,752 3,113,958 3,113,958Support Staff Salaries ............................... 252.6 174.5 174.5 8,159,918 8,310,709 8,310,709
TOTALS, ACADEMIC SUPPORT .......................... 308.5 206.5 206.5 $12,980,090 $11,504,359 $11,504,359Student Services:
Academic Salaries .................................... 32.5 – – 1,712,636 – –Management and Supervisory .................. 23.1 25.5 25.5 1,668,791 1,919,268 1,919,268Support Staff Salaries ............................... 214.3 219.9 219.9 7,184,864 9,625,413 9,625,413
TOTALS, STUDENT SERVICES ............................ 269.9 245.4 245.4 $10,566,291 $11,544,681 $11,544,681Institutional Support:
President .................................................... 1 1 1 212,568 227,448 227,448Management and Supervisory .................. 47.9 44 44 4,267,203 4,193,090 4,193,090Support Staff Salaries ............................... 201.3 210.1 210.1 7,600,192 8,520,736 8,520,736
TOTALS, INSTITUTIONAL SUPPORT ................. 250.2 255.1 255.1 $12,079,963 $12,941,274 $12,941,274Operation and Maintenance of Plant:
Management and Supervisory .................. 17.6 14 14 991,330 876,336 876,336Support Staff Salaries ............................... 149.1 130.6 130.6 4,964,450 4,698,939 4,698,939
TOTALS, OPERATION AND MAINTENANCEOF PLANT ................................................................ 166.7 144.6 144.6 $5,955,780 $5,575,275 $5,575,275
Reimbursed Activities:Academic Salaries .................................... 0.5 15.5 15.5 880,609 821,242 821,242Management and Supervisory .................. 5.6 6.5 6.5 427,319 544,896 544,896Support Staff Salaries ............................... 60.7 34.5 34.5 2,492,521 1,283,124 1,283,124
TOTALS, REIMBURSED ACTIVITIES ................. 66.8 56.5 56.5 $3,800,449 $2,649,262 $2,649,262Auxiliary Enterprises:
Management and Supervisory .................. 6.1 – – 386,741 – –Support Staff Salaries ............................... 95.2 – – 2,993,512 – –
TOTALS, AUXILIARY ENTERPRISES ................. 101.3 – – $3,380,253 – –
TOTALS, CALIFORNIA STATE UNIVERSITY,SACRAMENTO ....................................................... 2,554.2 2,162.8 2,162.8 $121,469,515 $120,837,024 $120,837,024
CALIFORNIA STATE UNIVERSITY, SAN BERNARDINOInstruction:
Academic Salaries .................................... 647.4 503 503 $34,674,714 $33,527,465 $33,527,465Management and Supervisory .................. 16.5 – – 1,982,785 – –Support Staff Salaries ............................... 229.9 5 5 7,205,373 283,962 283,962
TOTALS, INSTRUCTION ....................................... 893.8 508.0 508.0 $43,862,872 $33,811,427 $33,811,427Academic Support:
Academic Salaries .................................... 19.8 22 22 948,393 1,393,022 1,393,022Management and Supervisory .................. 4.2 45 45 334,263 3,518,787 3,518,787Support Staff Salaries ............................... 74.4 181 181 2,310,186 7,937,638 7,937,638
TOTALS, ACADEMIC SUPPORT .......................... 98.4 248.0 248.0 $3,592,842 $12,849,447 $12,849,447Student Services:
Academic Salaries .................................... 6.4 2 2 343,780 149,820 149,820Management and Supervisory .................. 15.9 16 16 1,107,973 1,117,758 1,117,758Support Staff Salaries ............................... 124.2 101.5 101.5 4,147,256 4,554,390 4,554,390
TOTALS, STUDENT SERVICES ............................ 146.5 119.5 119.5 $5,599,009 $5,821,968 $5,821,968Institutional Support:
Academic Salaries .................................... 4 1 1 179,227 68,688 68,688President .................................................... 1 1 1 185,892 198,900 198,900Management and Supervisory .................. 51 35 35 3,579,714 2,799,080 2,799,080Support Staff Salaries ............................... 169.5 112 112 6,311,871 5,755,991 5,755,991
TOTALS, INSTITUTIONAL SUPPORT ................. 225.5 149.0 149.0 $10,256,704 $8,822,659 $8,822,659
SALARY RANGE
EDUCATION E 57
CALIFORNIA STATE UNIVERSITY, SACRAMENTO
ORGANIZATIONAL UNIT NUMBER OF POSITIONS EXPENDITURES
Filled Authorized Proposed Actual Estimated ProposedClassification 1999–00 2000–01 2001–02 1999–00 2000–01 2001–02
123456789
1011121314151617181920212223242526272829303132333435363738394041424344454647484950515253545556575859606162636465666768697071727374757677787980
Page 59
Operation and Maintenance of Plant:Management and Supervisory .................. 12 7 7 638,104 450,596 450,596Support Staff Salaries ............................... 108.2 103 103 3,743,876 3,838,842 3,838,842
TOTALS, OPERATION AND MAINTENANCEOF PLANT ................................................................ 120.2 110.0 110.0 $4,381,980 $4,289,438 $4,289,438
Reimbursed Activities:Academic Salaries .................................... 7.5 16.7 16.7 431,426 794,702 794,702Management and Supervisory .................. 5.9 4 4 281,452 313,760 313,760Support Staff Salaries ............................... 24.6 26 26 505,159 1,316,444 1,316,444
TOTALS, REIMBURSED ACTIVITIES ................. 38.0 46.7 46.7 $1,218,037 $2,424,906 $2,424,906Auxiliary Enterprises:
Academic Salaries .................................... – 34 34 – 1,317,375 1,317,375Management and Supervisory .................. 1.9 5 5 117,926 383,573 383,573Support Staff Salaries ............................... 37.7 60 60 997,263 2,358,288 2,358,288
TOTALS, AUXILIARY ENTERPRISES ................. 39.6 99.0 99.0 $1,115,189 $4,059,236 $4,059,236Receipts:
Academic Salaries .................................... 0.1 – – 35,303 – –Support Staff Salaries ............................... 8.2 – – 575,265 – –
TOTALS, RECEIPTS ................................................ 8.3 – – $610,568 – –
TOTALS, CALIFORNIA STATE UNIVERSITY,SAN BERNARDINO ............................................... 1,570.3 1,280.2 1,280.2 $70,637,201 $72,079,081 $72,079,081
CALIFORNIA STATE UNIVERSITY, SAN MARCOSInstruction:
Academic Salaries .................................... 240.9 282.2 282.2 $12,723,676 $15,338,295 $15,338,295Management and Supervisory .................. 1 1 1 50,589 97,121 97,121Support Staff Salaries ............................... 64.4 66.5 66.5 2,110,056 1,695,355 1,695,355
TOTALS, INSTRUCTION ....................................... 306.3 349.7 349.7 $14,884,321 $17,130,771 $17,130,771Research:
Academic Salaries .................................... – – – – – –Support Staff Salaries ............................... 2.2 – – 22,923 – –
TOTALS, RESEARCH ............................................. 2.2 – – $22,923 – –Public Service:
Support Staff Salaries ............................... – – – 406 – –
TOTALS, PUBLIC SERVICE .................................. – – – $406 – –Academic Support:
Academic Salaries .................................... 14 10.5 10.5 847,270 738,810 738,810Management and Supervisory .................. 16.3 16 16 1,476,567 1,369,955 1,369,955Support Staff Salaries ............................... 98.3 115.4 115.4 3,409,339 3,769,981 3,769,981
TOTALS, ACADEMIC SUPPORT .......................... 128.6 141.9 141.9 $5,733,176 $5,878,746 $5,878,746Student Services:
Academic Salaries .................................... 5.7 3.5 3.5 312,709 238,254 238,254Management and Supervisory .................. 10.8 12 12 758,576 889,405 889,405Support Staff Salaries ............................... 78.3 96 96 2,785,539 2,873,921 2,873,921
TOTALS, STUDENT SERVICES ............................ 94.8 111.5 111.5 $3,856,824 $4,001,580 $4,001,580Institutional Support:
Academic Salaries .................................... 0.1 – – 16,160 – –President .................................................... 1 1 1 183,336 195,307 195,307Management and Supervisory .................. 27.6 28 28 2,236,634 2,458,761 2,458,761Support Staff Salaries ............................... 106.8 144.3 144.3 4,381,710 4,607,797 4,607,797
TOTALS, INSTITUTIONAL SUPPORT ................. 135.5 173.3 173.3 $6,817,840 $7,261,865 $7,261,865Operation and Maintenance of Plant:
Management and Supervisory .................. 6.8 6 6 503,678 467,188 467,188Support Staff Salaries ............................... 26.2 23 23 1,009,773 851,270 851,270
TOTALS, OPERATION AND MAINTENANCEOF PLANT ................................................................ 33.0 29.0 29.0 $1,513,451 $1,318,458 $1,318,458
Reimbursed Activities:Support Staff Salaries ............................... 2.7 3 3 60,624 90,429 90,429
TOTALS, REIMBURSED ACTIVITIES ................. 2.7 3.0 3.0 $60,624 $90,429 $90,429
SALARY RANGE
EDUCATIONE 58
CALIFORNIA STATE UNIVERSITY, SAN BERNARDINO—Continued
ORGANIZATIONAL UNIT NUMBER OF POSITIONS EXPENDITURES
Filled Authorized Proposed Actual Estimated ProposedClassification 1999–00 2000–01 2001–02 1999–00 2000–01 2001–02
123456789
1011121314151617181920212223242526272829303132333435363738394041424344454647484950515253545556575859606162636465666768697071727374757677787980
Page 60
Auxiliary Enterprises:Management and Supervisory .................. 0.1 – – 8,230 – –Support Staff Salaries ............................... 12.1 12.8 12.8 328,656 364,982 364,982
TOTALS, AUXILIARY ENTERPRISES ................. 12.2 12.8 12.8 $336,886 $364,982 $364,982
TOTALS, CALIFORNIA STATE UNIVERSITY,SAN MARCOS ......................................................... 715.3 821.2 821.2 $33,226,451 $36,046,831 $36,046,831
SONOMA STATE UNIVERSITYInstruction:
Academic Salaries...................................... 362.7 372.9 372.9 $20,686,520 $21,962,873 $21,962,873Management and Supervisory ................... 0.8 1 1 64,927 68,905 68,905Support Staff Salaries ................................ 64.4 68.1 68.1 2,263,230 3,239,125 3,239,125
TOTALS, INSTRUCTION ........................................ 427.9 442.0 442.0 $23,014,677 $25,270,903 $25,270,903Research:
Support Staff Salaries ................................ 0.1 – – 1,495 – –
TOTALS, RESEARCH .............................................. 0.1 – – $1,495 – –Academic Support:
Academic Salaries...................................... 11.3 10.5 10.5 742,490 796,174 796,174Management and Supervisory ................... 22.4 21 21 1,836,289 1,826,657 1,826,657Support Staff Salaries ................................ 74.7 65.5 65.5 2,534,584 2,534,372 2,534,372
TOTALS, ACADEMIC SUPPORT ........................... 108.4 97.0 97.0 $5,113,363 $5,157,203 5,157,203Student Services:
Academic Salaries...................................... 16.2 2.5 2.5 758,717 142,203 142,203Management and Supervisory ................... 20.1 18.3 18.3 1,399,388 1,345,467 1,345,467Support Staff Salaries ................................ 86.5 79.2 79.2 3,091,680 3,296,027 3,296,027
TOTALS, STUDENT SERVICES............................. 122.8 100.0 100.0 $5,249,785 $4,783,697 $4,783,697Institutional Support:
Academic Salaries...................................... 0.6 – – 23,381 – –President..................................................... 1 1 1 202,284 202,284 202,284Management and Supervisory ................... 51.6 51 51 3,976,390 4,279,673 4,279,673Support Staff Salaries ................................ 108.5 119.6 119.6 4,311,186 5,093,137 5,093,137
TOTALS, INSTITUTIONAL SUPPORT ................. 161.7 171.6 171.6 $8,513,241 $9,575,094 $9,575,094Operation and Maintenance of Plant:
Management and Supervisory ................... 11.2 11 11 815,223 854,694 854,694Support Staff Salaries ................................ 64.8 88.5 88.5 2,509,990 3,354,482 3,354,482
TOTALS, OPERATION AND MAINTENANCEOF PLANT................................................................. 76.0 99.5 99.5 $3,325,213 $4,209,176 $4,209,176
Reimbursed Activities:Academic Salaries...................................... 0.3 10.1 10.1 374,524 450,000 450,000Management and Supervisory ................... 36.7 18.5 18.5 1,899,057 1,195,902 1,195,902Support Staff Salaries ................................ 103.9 130 130 2,699,769 4,060,672 4,060,672
TOTALS, REIMBURSED ACTIVITIES ................. 140.9 158.6 158.6 $4,973,350 $5,706,574 $5,706,574Auxiliary Enterprises:
Management and Supervisory ................... 2.4 – – 165,985 – –Support Staff Salaries ................................ 6.7 – – 160,286 – –
TOTALS, AUXILIARY ENTERPRISES .................. 9.1 – – $326,271 – –Independent Operations:
Academic Salaries...................................... 0.7 – – 18,937 – –Management and Supervisory ................... 22.5 – – 1,255,358 – –Support Staff Salaries ................................ 92 – – 2,307,271 – –
TOTALS, INDEPENDENT OPERATIONS ............ 115.2 – – $3,581,566 – –
TOTALS, SONOMA STATE UNIVERSITY............ 1,162.1 1,068.7 1,068.7 $54,098,961 $54,702,647 $54,702,647
CALIFORNIA STATE UNIVERSITY, STANISLAUSInstruction:
Academic Salaries...................................... 259.6 269.1 269.1 $14,742,046 $17,012,012 $17,012,012Support Staff Salaries ................................ 88.3 72.2 72.2 3,771,008 2,733,502 2,733,502
TOTALS, INSTRUCTION ........................................ 347.9 341.3 341.3 $18,513,054 $19,745,514 $19,745,514
SALARY RANGE
EDUCATION E 59
CALIFORNIA STATE UNIVERSITY, SAN MARCOS—Continued
ORGANIZATIONAL UNIT NUMBER OF POSITIONS EXPENDITURES
Filled Authorized Proposed Actual Estimated ProposedClassification 1999–00 2000–01 2001–02 1999–00 2000–01 2001–02
123456789
1011121314151617181920212223242526272829303132333435363738394041424344454647484950515253545556575859606162636465666768697071727374757677787980
Page 61
Research:Academic Salaries...................................... 0.3 – – 23,461 – –Management and Supervisory ................... 0.2 – – 14,529 – –Support Staff Salaries ................................ 1.2 – – 28,214 – –
TOTALS, RESEARCH .............................................. 1.7 – – $66,204 – –Academic Support:
Academic Salaries...................................... 8 3.7 3.7 446,192 124,734 124,734Management and Supervisory ................... 11.3 15.9 15.9 1,130,226 1,560,560 1,560,560Support Staff Salaries ................................ 102.5 112.8 112.8 3,865,411 4,325,879 4,325,879
TOTALS, ACADEMIC SUPPORT ........................... 121.8 132.4 132.4 $5,441,829 $6,011,173 $6,011,173Student Services:
Academic Salaries...................................... 6.9 6.2 6.2 383,519 441,391 441,391Management and Supervisory ................... 8.7 10.8 10.8 665,742 844,208 844,208Support Staff Salaries ................................ 84.8 90.3 90.3 3,135,261 3,411,068 3,411,068
TOTALS, STUDENT SERVICES............................. 100.4 107.3 107.3 $4,184,522 $4,696,667 $4,696,667Institutional Support:
Academic Salaries...................................... 0.1 0.1 0.1 4,835 1,721 1,721President..................................................... 1 1 1 184,464 196,920 196,920Management and Supervisory ................... 23 20 20 1,822,358 1,745,613 1,745,613Support Staff Salaries ................................ 101.7 100.3 100.3 3,559,159 4,119,088 4,119,088
TOTALS, INSTITUTIONAL SUPPORT ................. 125.8 121.4 121.4 $5,570,816 $6,063,342 $6,063,342Operation and Maintenance of Plant:
Management and Supervisory ................... 9.9 6 6 662,551 492,341 492,341Support Staff Salaries ................................ 45 51.1 51.1 1,810,797 2,181,940 2,181,940
TOTALS, OPERATION AND MAINTENANCEOF PLANT................................................................. 54.9 57.1 57.1 $2,473,348 $2,674,281 $2,674,281
Reimbursed Activities:Academic Salaries...................................... 4.3 11.9 11.9 277,027 423,894 423,894Management and Supervisory ................... 2.7 – – 195,627 – –Support Staff Salaries ................................ 57.2 51.5 51.5 1,671,716 816,401 816,401
TOTALS, REIMBURSED ACTIVITIES ................. 64.2 63.4 63.4 $2,144,370 $1,240,295 $1,240,295Auxiliary Enterprises:
Management and Supervisory ................... 1 – – 63,024 – –Support Staff Salaries ................................ 13 – – 322,230 – –
TOTALS, AUXILIARY ENTERPRISES .................. 14.0 – – $385,254 – –
TOTALS, CALIFORNIA STATE UNIVERSITY,STANISLAUS ............................................................ 830.7 822.9 822.9 $38,779,397 $40,431,272 $40,431,272
HUMBOLDT STATE UNIVERSITYInstruction:
Academic Salaries...................................... 441.6 417.6 417.6 $26,468,888 $27,005,920 $27,005,920Management and Supervisory ................... 11.4 3 3 914,905 232,560 232,560Support Staff Salaries ................................ 117.8 94.1 94.1 3,556,080 3,533,708 3,533,708
TOTALS, INSTRUCTION ........................................ 570.8 514.7 514.7 $30,939,873 $30,772,188 $30,772,188Academic Support:
Academic Salaries...................................... 13.3 17.4 17.4 966,764 1,228,719 1,228,719Management and Supervisory ................... 16.2 21.8 21.8 1,346,709 1,847,033 1,847,033Support Staff Salaries ................................ 120.8 108.9 108.9 4,109,775 4,507,247 4,507,247
TOTALS, ACADEMIC SUPPORT ........................... 150.3 148.1 148.1 $6,423,248 $7,582,999 $7,582,999Student Services:
Academic Salaries...................................... 4.8 1 1 242,844 64,071 64,071Management and Supervisory ................... 15 13 13 999,373 940,504 940,504Support Staff Salaries ................................ 134.2 133.4 133.4 4,646,252 5,023,542 5,023,542
TOTALS, STUDENT SERVICES............................. 154.0 147.4 147.4 $5,888,469 $6,028,117 $6,028,117Institutional Support:
President..................................................... 1 1 1 186,948 198,165 198,165Management and Supervisory ................... 29.4 38 38 2,307,935 2,928,488 2,928,488Support Staff Salaries ................................ 108.8 91.5 91.5 4,292,304 4,027,556 4,027,556
TOTALS, INSTITUTIONAL SUPPORT .................. 139.2 130.5 130.5 $6,787,187 $7,154,209 $7,154,209Operation and Maintenance of Plant:
Management and Supervisory ................... 9.9 11 11 614,615 695,097 695,097Support Staff Salaries ................................ 96.2 86.6 86.6 3,358,350 3,189,325 3,189,325
TOTALS, OPERATION AND MAINTENANCEOF PLANT................................................................. 106.1 97.6 97.6 $3,972,965 $3,884,422 $3,884,422
SALARY RANGE
EDUCATIONE 60
CALIFORNIA STATE UNIVERSITY, STANISLAUS—Continued
ORGANIZATIONAL UNIT NUMBER OF POSITIONS EXPENDITURES
Filled Authorized Proposed Actual Estimated ProposedClassification 1999–00 2000–01 2001–02 1999–00 2000–01 2001–02
123456789
1011121314151617181920212223242526272829303132333435363738394041424344454647484950515253545556575859606162636465666768697071727374757677787980
Page 62
Reimbursed Activities:Academic Salaries...................................... – – – – – –Support Staff Salaries ................................ 40.4 21 21 1,282,516 656,288 656,288
TOTALS, REIMBURSED ACTIVITIES ................. 40.4 21.0 21.0 $1,282,516 $656,288 $656,288Auxiliary Enterprises:
Management and Supervisory ................... 1.5 – – 96,800 – –Support Staff Salaries ................................ 59.9 – – 1,395,832 – –
TOTALS, AUXILIARY ENTERPRISES .................. 61.4 – – $1,492,632 – –
TOTALS, HUMBOLDT STATE UNIVERSITY ..... 1,222.2 1,059.3 1,059.3 $56,786,890 $56,078,223 $56,078,223
SAN DIEGO STATE UNIVERSITYInstruction:
Academic Salaries...................................... 1,555.8 1,487.2 1,487.2 $80,821,999 $88,779,134 $88,779,134Management and Supervisory ................... 4.4 4 4 341,211 341,089 341,089Support Staff Salaries ................................ 291.2 270.7 270.7 11,858,805 11,797,496 11,797,496
TOTALS, INSTRUCTION ........................................ 1,851.4 1,761.9 1,761.9 $93,022,015 $100,917,719 $100,917,719Research:
Academic Salaries...................................... – – – – – –Support Staff Salaries ................................ 1.2 – – 135,781 – –
TOTALS, RESEARCH .............................................. 1.2 – – $135,781 – –Public Service:
Management and Supervisory ................... 6.7 8 8 608,451 738,992 738,992Support Staff Salaries ................................ 17.5 8.3 8.3 432,949 364,641 364,641
TOTALS, PUBLIC SERVICE ................................... 24.2 16.3 16.3 $1,041,400 $1,103,633 $1,103,633Academic Support:
Academic Salaries...................................... 29.9 48.1 48.1 1,975,671 3,052,361 3,052,361Management and Supervisory ................... 41.8 55.5 55.5 4,193,347 5,229,592 5,229,592Support Staff Salaries ................................ 372.8 401.2 401.2 13,792,294 14,423,687 14,423,687
TOTALS, ACADEMIC SUPPORT ........................... 444.5 504.8 504.8 $19,961,312 $22,705,640 $22,705,640Student Services:
Academic Salaries...................................... 41 43.8 43.8 2,302,212 3,028,327 3,028,327Management and Supervisory ................... 46.7 52 52 3,655,706 4,109,193 4,109,193Support Staff Salaries ................................ 377.3 436.7 436.7 14,385,287 15,642,941 15,642,941
TOTALS, STUDENT SERVICES............................. 465.0 532.5 532.5 $20,343,205 $22,780,461 $22,780,461Institutional Support:
President..................................................... 1 1 1 218,556 222,924 222,924Management and Supervisory ................... 74 75.1 75.1 5,658,709 6,098,851 6,098,851Support Staff Salaries ................................ 288 241.1 241.1 9,493,072 9,493,651 9,493,651
TOTALS, INSTITUTIONAL SUPPORT ................. 363.0 317.2 317.2 $15,370,337 $15,815,426 $15,815,426Operation and Maintenance of Plant:
Management and Supervisory ................... 18.6 16.5 16.5 1,090,082 1,150,164 1,150,164Support Staff Salaries ................................ 235 221.7 221.7 7,917,776 8,213,940 8,213,940
TOTALS, OPERATION AND MAINTENANCEOF PLANT................................................................. 253.6 238.2 238.2 $9,007,858 $9,364,104 $9,364,104
Reimbursed Activities:Academic Salaries...................................... 49.9 89.6 89.6 1,896,155 1,994,100 1,994,100Management and Supervisory ................... 3.5 5.9 5.9 499,025 529,000 529,000Support Staff Salaries ................................ 46.9 102.8 102.8 2,731,533 2,886,100 2,886,100
TOTALS, REIMBURSED ACTIVITIES .................. 100.3 198.3 198.3 $5,126,713 $5,409,200 $5,409,200Auxiliary Enterprises:
Management and Supervisory ................... 6.1 – – 376,497 – –Support Staff Salaries ................................ 115.3 – – 2,858,714 – –
TOTALS, AUXILIARY ENTERPRISES .................. 121.4 – – $3,235,211 – –
TOTALS, SAN DIEGO STATE UNIVERSITY....... 3,624.6 3,569.2 3,569.2 $167,243,832 $178,096,183 $178,096,183
SALARY RANGE
EDUCATION E 61
HUMBOLDT STATE UNIVERSITY—Continued
ORGANIZATIONAL UNIT NUMBER OF POSITIONS EXPENDITURES
Filled Authorized Proposed Actual Estimated ProposedClassification 1999–00 2000–01 2001–02 1999–00 2000–01 2001–02
123456789
1011121314151617181920212223242526272829303132333435363738394041424344454647484950515253545556575859606162636465666768697071727374757677787980
Page 63
Instruction:Academic Salaries...................................... 1,163.7 1,137.7 1,137.7 $68,310,843 $68,778,744 $68,778,744Management and Supervisory ................... 5.2 5 5 400,361 423,601 423,601Support Staff Salaries ................................ 309.9 388 388 9,592,431 15,032,234 15,032,234
TOTALS, INSTRUCTION ........................................ 1,478.8 1,530.7 1,530.7 $78,303,635 $84,234,579 $84,234,579Public Service:
Academic Salaries...................................... 1.3 1 1 88,766 83,888 83,888Management and Supervisory ................... 3.6 3.5 3.5 340,826 355,804 355,804Support Staff Salaries ................................ 14.3 17.6 17.6 451,574 567,012 567,012
TOTALS, PUBLIC SERVICE ................................... 19.2 22.1 22.1 $881,166 $1,006,704 $1,006,704Academic Support:
Academic Salaries...................................... 40.6 30.4 30.4 2,441,616 2,161,109 2,161,109Management and Supervisory ................... 30.8 31 31 3,125,392 3,399,950 3,399,950Support Staff Salaries ................................ 217.9 227 227 7,922,571 9,168,270 9,168,270
TOTALS, ACADEMIC SUPPORT ........................... 289.3 288.4 288.4 $13,489,579 $14,729,329 $14,729,329Student Services:
Academic Salaries...................................... 28.4 24.1 24.1 1,292,824 1,272,786 1,272,786Management and Supervisory ................... 22.4 23 23 1,667,546 1,911,708 1,911,708Support Staff Salaries ................................ 256.4 243.5 243.5 10,088,833 10,148,675 10,148,675
TOTALS, STUDENT SERVICES ............................ 307.2 290.6 290.6 $13,049,203 $13,333,169 $13,333,169Institutional Support:
Academic Salaries...................................... 0.1 – – 2,563 – –President..................................................... 1 1 1 206,768 221,379 221,379Management and Supervisory ................... 63.1 67 67 5,184,394 5,883,456 5,883,456Support Staff Salaries ................................ 298.1 311.4 311.4 11,781,396 12,949,240 12,949,240
TOTALS, INSTITUTIONAL SUPPORT ................. 362.3 379.4 379.4 $17,175,121 $19,054,075 $19,054,075Operation and Maintenance of Plant:
Management and Supervisory ................... 11.4 13 13 937,616 1,128,277 1,128,277Support Staff Salaries ................................ 149.1 153.1 153.1 5,070,531 5,554,113 5,554,113
TOTALS, OPERATION AND MAINTENANCEOF PLANT................................................................. 160.5 166.1 166.1 $6,008,147 $6,682,390 $6,682,390
Reimbursed Activities:Academic Salaries...................................... 0.2 – – 1,431 – –Management and Supervisory ................... 1 1 1 58,798 61,896 61,896Support Staff Salaries ................................ 55.2 62.5 62.5 1,570,341 1,725,781 1,725,781
TOTALS, REIMBURSED ACTIVITIES ................. 56.4 63.5 63.5 $1,630,570 $1,787,677 $1,787,677Auxiliary Enterprises:
Management and Supervisory ................... 4.6 – – 256,293 – –Support Staff Salaries ................................ 96.9 – – 2,643,023 – –
TOTALS, AUXILIARY ENTERPRISES .................. 101.5 – – $2,899,316 – –Independent Operations:
Academic Salaries...................................... 105.5 – – 4,731,810 – –Management and Supervisory ................... 1 – – 67,446 – –Support Staff Salaries ................................ 189.2 – – 5,421,562 – –
TOTALS, INDEPENDENT OPERATIONS ............ 295.7 – – $10,220,818 – –
TOTALS, SAN FRANCISCO STATEUNIVERSITY ............................................................ 3,070.9 2,740.8 2,740.8 $143,657,555 $140,827,923 $140,827,923
SAN JOSE STATE UNIVERSITYInstruction:
Academic Salaries...................................... 1219.2 1,070.3 1,070.3 $71,749,779 $73,304,410 $73,304,410Management and Supervisory ................... 5.4 23 23 247,647 2,539,347 2,539,347Support Staff Salaries ................................ 320.3 276.4 276.4 10,923,775 14,019,627 14,019,627
TOTALS, INSTRUCTION ........................................ 1,544.9 1,369.7 1,369.7 $82,921,201 $89,863,384 $89,863,384Public Service:
Support Staff Salaries ................................ 1.2 – – 45,102 – –
TOTALS, PUBLIC SERVICE ................................... 1.2 – – $45,102 – –Academic Support:
Academic Salaries...................................... 33.7 10.5 10.5 1,229,758 15,806 15,806Management and Supervisory ................... 43.8 9 9 4,014,921 849,388 849,388Support Staff Salaries ................................ 233.3 206.3 206.3 8,529,970 9,175,251 9,175,251
TOTALS, ACADEMIC SUPPORT ........................... 310.8 225.8 225.8 $13,774,649 $10,040,445 $10,040,445
SALARY RANGE
EDUCATIONE 62
SAN FRANCISCO STATE UNIVERSITY
ORGANIZATIONAL UNIT NUMBER OF POSITIONS EXPENDITURES
Filled Authorized Proposed Actual Estimated ProposedClassification 1999–00 2000–01 2001–02 1999–00 2000–01 2001–02
123456789
1011121314151617181920212223242526272829303132333435363738394041424344454647484950515253545556575859606162636465666768697071727374757677787980
Page 64
Student Services:Academic Salaries...................................... 40.7 27 27 2,280,594 1,731,879 1,731,879Management and Supervisory ................... 37.1 32 32 2,780,868 2,644,575 2,644,575Support Staff Salaries ................................ 209.8 255.6 255.6 7,476,601 11,346,116 11,346,116
TOTALS, STUDENT SERVICES............................. 287.6 314.6 314.6 $12,538,063 $15,722,570 $15,722,570Institutional Support:
President..................................................... 0.9 1 1 189,955 213,556 213,556Management and Supervisory ................... 68.1 66.1 66.1 5,546,106 5,622,367 5,622,367Support Staff Salaries ................................ 196.3 203.5 203.5 8,246,062 9,831,244 9,831,244
TOTALS, INSTITUTIONAL SUPPORT ................. 265.3 270.6 270.6 $13,982,123 $15,667,167 $15,667,167Operation and Maintenance of Plant:
Management and Supervisory ................... 42.3 15 15 1,783,587 1,016,977 1,016,977Support Staff Salaries ................................ 154.1 167.6 167.6 5,309,291 6,215,107 6,215,107
TOTALS, OPERATIONS AND MAINTENANCEOF PLANT ................................................................ l96.4 182.6 l82.6 $7,092,878 $7,232,084 $7,232,084
Reimbursed Activities:Academic Salaries...................................... 6.5 – – 369,318 – –Management and Supervisory ................... 10.1 6.4 6.4 555,956 263,522 263,522Support Staff Salaries ................................ 148.1 148 148 5,701,240 3,843,240 3,843,240
TOTALS, REIMBURSED ACTIVITIES .................. 164.7 154.4 154.4 $6,626,514 $4,106,762 $4,106,762Auxiliary Enterprises:
Management and Supervisory ................... 7.7 – – 457,331 – –Support Staff Salaries ................................ 87.9 – – 2,648,262 – –
TOTALS, AUXILIARY ENTERPRISES .................. 95.6 – – $3,105,593 – –
TOTALS, SAN JOSE STATE UNIVERSITY .......... 2,866.5 2,517.7 2,517.7 $140,086,123 $142,632,412 $142,632,412
CALIFORNIA STATE UNIVERSITY, CHANNEL ISLANDSInstruction:
Academic Salaries...................................... – 20 20 – $1,800,000 $1,800,000Support Staff Salaries ................................ – 2 2 – 97,584 97,584
TOTALS, INSTRUCTION ........................................ – 22.0 22.0 – $1,897,584 $1,897,584Academic Support:
Academic Salaries...................................... – 10 10 – 994,256 994,256Support Staff Salaries ................................ – 5 5 – 230,760 230,760
TOTALS, ACADEMIC SUPPORT ........................... – 15.0 15.0 – $1,225,016 $1,225,016Student Services:
Academic Salaries...................................... – 1 1 – 61,644 61,644Support Staff Salaries ................................ – 4 4 – 173,820 173,820
TOTALS, STUDENT SERVICES............................. – 5.0 5.0 – $235,464 $235,464Institutional Support:
Academic Salaries...................................... – 4 4 – 249,112 249,112President..................................................... 1 1 1 158,662 164,244 164,244Management and Supervisory ................... 7.4 11 11 555,097 820,873 820,873Support Staff Salaries ................................ 97.4 49 49 920,340 2,266,586 2,266,586
TOTALS, INSTITUTIONAL SUPPORT ................. 105.8 65.0 65.0 $1,634,099 $3,500,815 $3,500,815Operation and Maintenance of Plant:
Management and Supervisory ................... 6.3 9 9 382,946 552,015 552,015Support Staff Salaries ................................ 34.1 38 38 1,095,868 1,508,120 1,508,120
TOTALS, OPERATION AND MAINTENANCEOF PLANT................................................................. 40.4 47.0 47.0 $1,478,814 $2,060,135 $2,060,135
Reimbursed Activities:Management and Supervisory ................... 1.9 2 2 113,280 118,008 118,008Support Staff Salaries ................................ 4.8 2 2 54,743 64,440 64,440
TOTALS, REIMBURSED ACTIVITIES .................. 6.7 4.0 4.0 $168,023 $182,448 $182,448
TOTALS, CALIFORNIA STATE UNIVERSITY,CHANNEL ISLANDS ............................................... 152.9 158.0 158.0 $3,280,936 $9,101,462 $9,101,462
TOTALS, CALIFORNIA STATE UNIVERSITY..... 41,548.2 39,765.9 39,765.9 $1,974,862,999 $2,032,850,595 $2,032,850,595
SALARY RANGE
EDUCATION E 63
SAN JOSE STATE UNIVERSITY—Continued
ORGANIZATIONAL UNIT NUMBER OF POSITIONS EXPENDITURES
Filled Authorized Proposed Actual Estimated ProposedClassification 1999–00 2000–01 2001–02 1999–00 2000–01 2001–02
123456789
1011121314151617181920212223242526272829303132333435363738394041424344454647484950515253545556575859606162636465666768697071727374757677787980
Page 65
Academic Salary Schedule(Based Upon Salaries Effective July 1, 2000)
RANKINSTRUCTIONAL Steps
FACULTY 1 2 3 4 5 6 7 8Regular Academic Ranks 9 10 11 12 13 14 15 16
17 18 19 20 21 22 23 2425 26 27 28 29 30 31 32
ACADEMIC YEAR APPOINTMENT: a
REGULAR FACULTY:Professor .............................. $60,852 $62,304 $63,756 $65,304 $66,840 $68,460 $70,080 $71,748
73,428 75,228 77,028 78,864 80,736 82,716 84,636 86,65288,716 90,804
Associate Professor............ 48,156 49,320 50,472 51,684 52,872 54,132 55,380 56,73658,056 59,460 60,852 62,304 63,756 65,304 66,840 68,46070,080 71,748 73,428 75,228 77,028 78,864 80,736 82,71684,636 86,652
Assistant Professor ............ 41,940 42,948 43,920 44,964 46,020 47,088 48,156 49,32050,472 51,684 52,872 54,132 55,380 56,736 58,056 59,46060,852 62,304 63,756 65,304 66,840 68,460 70,080 71,74873,428 75,228 77,028 78,864
Instructor ............................. 35,004 35,796 36,564 37,404 38,268 39,144 40,044 40,99241,940 42,948 43,920 44,964 46,020 47,088
Assistant .............................. 29,580 30,204 30,816 31,488 32,172 32,856 33,552 34,284
12-MONTH APPOINTMENTS:REGULAR FACULTY:
Professor .............................. 70,080 71,748 73,428 75,228 77,028 78,864 80,736 82,71684,636 86,652 88,716 90,804 92,952 95,160 97,404 99,744
102,096 104,520
Associate Professor............ 55,380 56,736 58,056 59,460 60,852 62,304 63,756 65,30466,840 68,460 70,080 71,748 73,428 75,228 77,028 78,86480,736 82,716 84,636 86,652 88,716 90,804 92,952 95,16097,404 99,744
Assistant Professor ............ 48,156 49,320 50,472 51,684 52,872 54,132 55,380 56,73658,056 59,460 60,852 62,304 63,756 65,304 66,840 68,46070,080 71,748 73,428 75,228 77,028 78,864 80,736 82,71684,636 86,652 88,716 90,804
Instructor ............................. 40,044 40,992 41,940 42,948 43,920 44,964 46,020 47,08848,156 49,320 50,472 51,684 52,872 54,132
Assistant .............................. 33,552 34,284 35,004 35,796 36,564 37,404 38,268 39,144
Salary Ranges
Lecturer: b
Academic year appointment range L, A–D ....................................... $29,580 through 90,80412-month appointment range L, A–D................................................. 33,552 through 104,520
OTHER ACADEMIC RANKS
Extension Instructional Faculty: c
Professor ................................................................................................... Quarter 37–771 Semester 55–1,156Associate Professor................................................................................. Quarter 37–771 Semester 55–1,156Assistant Professor ................................................................................. Quarter 37–609 Semester 55–914Instructor .................................................................................................. Quarter 37–557 Semester 55–836Assistant ................................................................................................... Quarter 37–464 Semester 55–696
SALARY RANGE
EDUCATIONE 64
6610 THE CALIFORNIA STATE UNIVERSITY
ORGANIZATIONAL UNIT NUMBER OF POSITIONS EXPENDITURES
Filled Authorized Proposed Actual Estimated ProposedClassification 1999–00 2000–01 2001–02 1999–00 2000–01 2001–02
123456789
1011121314151617181920212223242526272829303132333435363738394041424344454647484950515253545556575859606162636465666768697071727374757677787980
Page 66
Salary Ranges
Summer Session Instructional Faculty:Resident Faculty...................................................................................... Quarter 51–1,238 Semester 77–1,857Visiting Faculty—In State...................................................................... Quarter 51–1,359 Semester 77–2,040Visiting Faculty—Out of State.............................................................. 1,237–14,075 Per session
Demonstration Instructional Faculty....................................................... 15–71 Per DemonstrationMusic Studio Instructional Faculty ......................................................... 5.15–39 Per studio lesson per student
Substitute Instructional Faculty:Rate A-Assistant or Instructor.............................................................. 51.00 Lecture; 34.00 Lab or ActivityRate B-Assistant Professor .................................................................... 53.00 Lecture; 36.00 Lab or ActivityRate C-Associate Professor or Professor............................................. 56.00 Lecture; 37.00 Lab or Activity
a Academic year is service for two semesters or three quarters.b Range and rate of pay are dependent upon experience and professional achievements and parallel regular academic rank salaries.c Effective July 1, 2000.
6870 BOARD OF GOVERNORS OF THE CALIFORNIA COMMUNITY COLLEGES
Board of GovernorsBd Stipends ................................................ – – – $34,800 $50,000 $50,000
Totals ................................................... – – – $34,800 $50,000 $50,000
Executive Division
System Advancement and ResourceDevelopment:
Administrator-Voc Educ ............................ 1 1 1 5,437–6,609 79,308 79,308Ofc Techn-Typing ...................................... 1 1 1 2,258–2,745 32,940 32,940Spec-Gen Voc Educ ................................... 0.5 – – 32,190 – –
Totals ................................................... 2.5 2.0 2.0 $142,173 $112,248 $112,248Executive:
Chancellor .................................................. 1 1 1 12,880–14,155 169,860 169,860Chief Dep Chancellor ................................ 1 1 1 9,132–9,877 118,524 118,524Spec-Acad Plan.......................................... 0.6 1 1 4,898–5,951 66,420 69,726Community College Prog Asst II.............. 0.6 1 1 4,457–5,415 57,105 59,961Adm Asst II................................................ 0.4 – – 3,764–4,576 – –Community College Prog Asst I ............... 0.6 1 1 3,691–4,484 49,340 51,810Staff Svcs Analyst-Gen.............................. 0.4 1 1 2,411–3,805 41,541 43,620Exec Secty II.............................................. 0.7 – – 2,813–3,419 – –Exec Secty I............................................... 1 1 1 2,585–3,142 31,020 32,568Ofc Techn-Typing ...................................... 0.2 1 1 2,258–2,745 28,690 30,130Ofc Asst-Typing......................................... 0.8 – – 21,608 – –Temporary Help ......................................... 0.3 – – (13,120) – –Overtime..................................................... – – – (1,082) 1,500 1,500
Totals ................................................... 7.6 8.0 8.0 $543,287 $564,000 $577,699
Fiscal Policy:Vice Chancellor.......................................... 1 1 1 8,347–9,027 108,324 108,324C.E.A. III ................................................... 0.5 – – 7,354–8,108 – –Spec-Gen Voc Educ ................................... 0.5 1 1 4,898–5,951 71,412 71,412Staff Svcs Analyst-Gen.............................. 1 1 1 2,411–3,805 42,450 44,574Overtime..................................................... – – – (1,300) – –
Totals ................................................... 3.0 3.0 3.0 $237,923 $222,186 $224,310
Totals, Executive Division ................. 13.1 13.0 13.0 $923,383 $898,434 $914,257
Legal Affairs-ContractsC.E.A. III ................................................... 1 1 1 7,354–8,108 97,296 97,296Staff Counsel.............................................. 2 2 2 3,511–6,763 141,328 145,124Sr Legal Analyst ........................................ 1 1 1 3,952–4,805 55,647 57,660Assoc Govtl Prog Analyst ......................... 1.5 1 1 3,764–4,576 54,912 54,912Legal Secty ................................................ 0.4 1 1 2,600–3,317 37,920 37,920
SALARY RANGE
EDUCATION E 65
6610 THE CALIFORNIA STATE UNIVERSITY—Continued
ORGANIZATIONAL UNIT NUMBER OF POSITIONS EXPENDITURES
Filled Authorized Proposed Actual Estimated ProposedClassification 1999–00 2000–01 2001–02 1999–00 2000–01 2001–02
123456789
1011121314151617181920212223242526272829303132333435363738394041424344454647484950515253545556575859606162636465666768697071727374757677787980
63—38270
Page 67
Ofc Techn-Typing ...................................... 1 1 1 2,258–2,745 32,940 32,940Temporary Help ......................................... 0.6 – – (27,600) – –Overtime..................................................... – – – (1,184) 1,694 1,694
Totals, Legal Affairs-Contracts .......... 7.5 7.0 7.0 $446,638 $421,737 $427,546
College Facilities and Fiscal Affairs Division
Fiscal Services:Spec-Fiscal Plan......................................... 3.5 4 4 4,898–5,951 262,992 269,004Staff Finance Budget Analyst.................... 0.7 – – 4,563–5,505 – –Community College Prog Asst II.............. 1 2 2 4,457–5,415 119,802 122,544Financial Examiner III............................... 1 1 1 3,952–4,805 57,660 57,660Community College Prog Asst I ............... 1.7 1 1 3,691–4,484 49,008 51,464Ofc Techn-Typing ...................................... 0.7 1 1 2,258–2,745 27,096 28,452Temporary Help ......................................... 0.1 – – (5,823) – –
Totals ................................................... 8.7 9.0 9.0 $518,109 $516,558 $529,124
Facilities Planning and Utilization:Director, College Facility & Fiscal Affs... – 1 1 6,832–7,388 88,656 88,656Administrator-Plan/Utilization................... 1 – – 5,437–6,609 – –Spec-Plan & Utilization............................. 6.9 7 7 4,898–5,951 476,420 485,960Community College Prog Asst I ............... 1.7 2 2 3,691–4,484 98,194 101,872Ofc Techn-Typing ...................................... 1 1 1 2,258–2,745 32,940 32,940
Totals ................................................... 10.6 11.0 11.0 $653,444 $696,210 $709,428
Totals, College Facilities and FiscalAffairs Division ................................. 19.3 20.0 20.0 $1,171,553 $1,212,768 $1,238,552
Student Services-Special Programs Division
Middle College High School:Spec-Student Svcs...................................... 0.1 0.5 0.5 4,898–5,951 29,388 30,858
Totals ................................................... 0.1 0.5 0.5 $5,951 $29,388 $30,858
Student Financial Aid:Spec-Student Svcs...................................... 2 2 2 4,898–5,951 134,413 137,562Community College Prog Asst I ............... 1 1 1 3,691–4,484 51,180 53,176Ofc Techn-Typing ...................................... 1 1 1 2,258–2,745 32,940 32,940Overtime..................................................... – – – (133) – –
Totals ................................................... 4.0 4.0 4.0 $213,226 $218,533 $223,678
EOPS:Spec-Student Svcs...................................... 3.3 4 4 4,898–5,951 266,952 273,152Community College Prog Asst I ............... 1 1 1 3,691–4,484 53,682 53,808Ofc Techn-Typing ...................................... 2 2 2 2,258–2,745 65,880 65,880Overtime..................................................... – – – (2,208) – –
Totals ................................................... 6.3 7.0 7.0 $343,095 $386,514 $392,840
Transfer and Articulation-DSPS:Spec-Student Svcs...................................... 1.2 3 3 4,898–5,951 183,162 192,315Temporary Help ......................................... – – – (1,373) – –
Totals ................................................... 1.2 3.0 3.0 $77,169 $183,162 $192,315
Foster Parent:Spec-Student Svcs...................................... 2 2 2 4,898–5,951 138,372 141,700Community College Prog Asst II.............. – 1 1 4,457–5,415 53,484 56,160Community College Prog Asst I ............... 1.2 1 1 3,691–4,484 52,800 53,808Ofc Techn-Typing ...................................... 0.6 1 1 2,258–2,745 27,096 28,452
Totals ................................................... 3.8 5.0 5.0 $211,004 $271,752 $280,120
Matriculation:Spec-Student Svcs...................................... 1.5 2 2 4,898–5,951 132,696 135,759Community College Prog Asst I ............... 1.8 2 2 3,691–4,484 107,616 107,616Staff Svcs Analyst-Gen.............................. 1 1 1 2,411–3,805 41,320 43,388Ofc Techn-Typing ...................................... 1 1 1 2,258–2,745 30,142 31,650Overtime..................................................... – – – (1,207) – –
Totals ................................................... 5.3 6.0 6.0 $270,134 $311,774 $318,413
Student Services-Administration:Vice Chancellor.......................................... – 1 1 7,681–8,308 92,172 92,172Administrator-Student Svcs ....................... 2 2 2 5,437–6,609 154,296 158,040Spec-Student Svcs...................................... – 2 2 4,898–5,951 117,552 123,432Community College Prog Asst II.............. 0.8 1 1 4,457–5,415 58,846 61,786
SALARY RANGE
EDUCATIONE 66
6870 BOARD OF GOVERNORS OF THE CALIFORNIA COMMUNITY COLLEGES—Continued
ORGANIZATIONAL UNIT NUMBER OF POSITIONS EXPENDITURES
Filled Authorized Proposed Actual Estimated ProposedClassification 1999–00 2000–01 2001–02 1999–00 2000–01 2001–02
123456789
1011121314151617181920212223242526272829303132333435363738394041424344454647484950515253545556575859606162636465666768697071727374757677787980
Page 68
Exec Secty I............................................... 0.7 1 1 2,585–3,142 31,020 32,568Temporary Help ......................................... 0.5 0.8 0.8 (22,226) 10,000 10,000
Totals ................................................... 4.0 7.8 7.8 $250,397 $463,886 $477,998
CalWORKs:Spec-Student Svcs...................................... 2.5 3 3 4,898–5,951 197,418 203,697Community College Prog Asst I ............... 1 1 1 3,691–4,484 49,742 52,158Ofc Techn-Typing ...................................... 1 1 1 2,258–2,745 29,523 31,005Temporary Help ......................................... 0.6 – – (23,804) – –
Totals ................................................... 5.1 5.0 5.0 $273,629 $276,683 $286,860
AMERICORPS:Administrator-Student Svcs 1 .................... 1 1 – 5,437–6,609 77,940 –Spec-Student Svcs 2 ................................... 1.5 2 2 4,898–5,951 138,849 142,824Community College Prog Asst II.............. 2.2 – – 4,457–5,415 – –Community College Prog Asst I 2, 3 ......... 0.8 3.5 2 3,691–4,484 167,892 96,544Ofc Techn-Typing 4.................................... 0.9 1 1 2,258–2,745 32,936 32,940Staff Svcs Analyst-Gen.............................. 0.5 – – 22,666 – –Temporary Help ......................................... 0.6 – – (24,776) – –Overtime..................................................... – – – (5,671) – –
Totals ................................................... 7.5 7.5 5.0 $434,993 $417,617 $272,308
Totals, Student Services-SpecialProgram Division ............................... 37.3 45.8 43.3 $2,079,598 $2,559,309 $2,475,390
Human Resources Division
Human Resources:Vice Chancellor.......................................... 1 1 1 7,681–8,308 99,696 99,696Spec-Emp & Cert ...................................... 3.4 4 4 4,898–5,951 283,022 285,302Community College Prog Asst II 4 ........... 1.4 2 2 4,457–5,415 119,421 122,310Assoc Govtl Prog Analyst ......................... 0.5 1 1 3,764–4,576 54,912 54,912Exec Secty I............................................... 0.9 1 1 2,585–3,142 37,704 37,704Mgt Svcs Techn ......................................... 1 1 1 2,135–2,932 35,184 35,184Ofc Techn-Typing ...................................... 0.7 1 1 2,258–2,745 28,226 29,642Temporary Help ......................................... – – – (691) – –Overtime..................................................... – – – (1,383) – –
Totals ................................................... 8.9 11.0 11.0 $535,537 $658,165 $664,750
Totals, Human Resources Division ... 8.9 11.0 11.0 $535,537 $658,165 $664,750
Educational Services and EconomicDevelopment Division
Educational Services and EconomicDevelopment:
Spec Library Plan Develmt ....................... 1 1 1 4,898–5,951 71,412 71,412
Totals ................................................... 1.0 1.0 1.0 $71,412 $71,412 $71,412
Curriculum Standards and Instructional Services:Administrator-Acad.................................... 1 1 1 5,437–6,609 79,308 79,308Spec-Acad Plan.......................................... 1.8 2 2 4,898–5,951 142,824 142,824Staff Svcs Analyst-Gen.............................. 1.8 2 2 2,411–3,805 72,922 79,376Overtime..................................................... – – – (3,322) – –
Totals ................................................... 4.6 5.0 5.0 $276,276 $295,054 $301,508
Instructional Resources and Technology:Administrator-Acad.................................... 1 1 1 5,437–6,609 79,308 79,308Spec-Acad Plan.......................................... 2 2 2 4,898–5,951 142,824 142,824Spec-Student Svcs...................................... 1 1 1 4,898–5,951 71,412 71,412Spec-Info Sys & Analysis 4....................... 1 1 1 4,898–5,951 71,412 71,412Community College Prog Asst II.............. 2 4 4 4,457–5,415 228,576 239,591Telecomm Sys Mgr I-Spec 4 ..................... 1 1 1 4,136–5,027 60,324 60,324Telecomm Sys Analyst II .......................... 1 1 1 3,764–4,576 47,820 50,216Community College Prog Asst I ............... 1 1 1 3,691–4,484 53,808 53,808Staff Svcs Analyst-Gen.............................. 2 2 2 2,411–3,805 88,456 90,596Sr Steno...................................................... 1 1 1 2,298–2,795 33,540 33,540Ofc Techn-Typing 4.................................... 1.6 2 2 2,258–2,745 65,868 65,880Temporary Help ......................................... 1.5 0.8 0.8 (62,118) 10,000 10,000Overtime..................................................... – – – (6,061) – –
Totals ................................................... 16.1 17.8 17.8 $878,960 $953,348 $968,911
SALARY RANGE
EDUCATION E 67
6870 BOARD OF GOVERNORS OF THE CALIFORNIA COMMUNITY COLLEGES—Continued
ORGANIZATIONAL UNIT NUMBER OF POSITIONS EXPENDITURES
Filled Authorized Proposed Actual Estimated ProposedClassification 1999–00 2000–01 2001–02 1999–00 2000–01 2001–02
123456789
1011121314151617181920212223242526272829303132333435363738394041424344454647484950515253545556575859606162636465666768697071727374757677787980
Page 69
Economic Development:Vice Chancellor.......................................... – 1 1 7,681–8,308 92,172 92,172Administrator-Voc Educ ............................ 2.6 4 4 5,437–6,609 287,052 295,632Spec-Gen Voc Educ ................................... 8.5 11 11 4,898–5,951 757,345 766,140Community College Prog Asst II 5 ........... 8.4 9 9 4,457–5,415 549,546 564,920Community College Prog Asst I ............... 2 2 2 3,691–4,484 89,694 94,188Staff Svcs Analyst-Gen 4 ........................... 2.2 3 3 2,411–3,805 120,177 126,449Ofc Techn-Typing 4.................................... 4 4 4 2,258–2,745 129,003 130,953Ofc Asst-Typing......................................... 1 2 2 1,835–2,370 51,012 52,440Temporary Help ......................................... 3.6 1.1 1.1 (152,952) 15,000 15,000Overtime..................................................... – – – (16,818) – –
Totals ................................................... 32.3 37.1 37.1 $1,811,127 $2,091,001 $2,137,894
Virtual University Center:Spec-Acad Plan.......................................... – – – 4,898–5,951 – –Community College Prog Asst II.............. 1 1 1 4,457–5,415 56,628 59,460Ofc Techn-Typing ...................................... 1 1 1 2,258–2,745 32,940 32,940Temporary Help ......................................... – – – (1,667) – –
Totals ................................................... 2.0 2.0 2.0 $88,537 $89,568 $92,400
Totals, Educational Services andEconomic Development Division ...... 56.0 62.9 62.9 $3,126,312 $3,500,383 $3,572,125
Policy, Planning and External Affairs Division
Policy Analysis and Development:C.E.A. III ................................................... 1 1 1 7,354–8,108 97,296 97,296Ofc Techn-Typing ...................................... 1 1 1 2,258–2,745 27,096 28,452Staff Svcs Analyst-Gen.............................. 0.3 – – 11,292 – –
Totals ................................................... 2.3 2.0 2.0 $141,117 $124,392 $125,748
Research and Analysis:Administrator-Acad.................................... 0.9 1 1 5,437–6,609 74,988 78,732Spec-Info Sys & Analysis 4....................... 3.2 5 5 4,898–5,951 319,152 327,972Assoc Postsecondary Educ Studies 4 ........ 1 1 1 3,691–5,415 44,292 46,512Community College Prog Asst I ............... 1 1 1 3,691–4,484 53,808 53,808Temporary Help ......................................... 1 – – (41,657) – –
Totals ................................................... 7.1 8.0 8.0 $453,320 $492,240 $507,024
Strategic Communications and Publications:Digital Composition Spec II...................... – 2 2 3,170–3,854 81,238 89,570Staff Svcs Analyst-Gen.............................. 0.6 – – 2,411–3,805 – –Composing Techn II .................................. 1 – – 2,421–2,879 – –Composing Techn I.................................... 0.4 – – 2,039–2,633 – –Overtime..................................................... – – – (1,220) 1,500 1,500
Totals ................................................... 2.0 2.0 2.0 $68,288 $82,738 $91,070
MIS-Development Information Services:DP Mgr II................................................... 1 1 1 4,767–5,794 69,528 69,528Community College Prog Asst II 6 ........... – 1 1 4,457–5,415 53,484 56,160Staff Programmer Analyst-Spec ................ 1 1 1 4,334–5,269 63,228 63,228Assoc Info Sys Analyst-Spec .................... – 1 1 3,952–4,805 57,660 57,660Assoc Programmer Analyst-Spec .............. 5.4 6 6 3,952–4,805 309,536 322,149Research Analyst II-Gen............................ 1 – – 3,952–4,805 – –Ofc Techn-Typing ...................................... 1 1 1 2,258–2,745 31,187 32,436Temporary Help ......................................... 1 – – (41,011) – –
Totals ................................................... 10.4 11.0 11.0 $542,138 $584,623 $601,161
MIS-Operations-Network:Sr Info Sys Analyst-Spec .......................... 1 1 1 4,767–5,794 69,528 69,528Staff Info Sys Analyst-Supvr .................... 1 1 1 4,334–5,269 63,228 63,228Staff Info Sys Analyst-Spec ...................... 0.6 1 1 4,334–5,269 63,228 63,228Assoc Info Sys Analyst-Spec .................... 2.2 2 2 3,952–4,805 100,868 105,920Info Sys Techn ........................................... 1.8 2 2 2,122–3,046 73,104 73,104
Totals ................................................... 6.6 7.0 7.0 $346,029 $369,956 $375,008
MIS-Systems Support Unit:Administrator-Acad.................................... 0.9 1 1 5,437–6,609 68,040 71,448Spec-Info Sys & Analysis ......................... 2.8 3 3 4,898–5,951 203,364 206,388Assoc Info Sys Analyst-Spec .................... 1 1 1 3,952–4,805 57,660 57,660Community College Prog Asst I ............... 1.6 2 2 3,691–4,484 103,148 105,618Ofc Asst-Typing......................................... 0.5 0.5 0.5 1,835–2,370 14,220 14,220
SALARY RANGE
EDUCATIONE 68
6870 BOARD OF GOVERNORS OF THE CALIFORNIA COMMUNITY COLLEGES—Continued
ORGANIZATIONAL UNIT NUMBER OF POSITIONS EXPENDITURES
Filled Authorized Proposed Actual Estimated ProposedClassification 1999–00 2000–01 2001–02 1999–00 2000–01 2001–02
123456789
1011121314151617181920212223242526272829303132333435363738394041424344454647484950515253545556575859606162636465666768697071727374757677787980
Page 70
Staff Svcs Analyst-Gen.............................. 0.4 – – 18,861 – –Temporary Help ......................................... 0.2 – – (10,199) – –
Totals ................................................... 7.4 7.5 7.5 $448,964 $446,432 $455,334
Governmental Relations:Vice Chancellor.......................................... 1 1 1 8,347–9,027 108,324 108,324Administrator-Acad.................................... 1 1 1 5,437–6,609 79,308 79,308Community College Prog Asst II.............. 1 1 1 4,457–5,415 64,980 64,980Community College Prog Asst I ............... 0.9 1 1 3,691–4,484 44,292 46,512Staff Svcs Analyst-Gen.............................. 1 1 1 2,411–3,805 39,608 41,585Exec Secty I............................................... 0.9 1 1 2,585–3,142 32,840 34,486Temporary Help ......................................... 0.5 – – (19,287) – –Overtime..................................................... – – – (1,354) – –
Totals ................................................... 6.3 6.0 6.0 $367,769 $369,352 $375,195
External Affairs:Info Ofcr I-Spec......................................... 1 1 1 3,764–4,576 54,912 54,912Assoc Govtl Prog Analyst ......................... 0.3 1 1 3,764–4,576 54,694 54,912Temporary Help ......................................... 0.7 – – (31,320) – –Overtime..................................................... – – – (898) – –
Totals ................................................... 2.0 2.0 2.0 $100,068 $109,606 $109,824
Totals, Policy, Planning and ExternalAffairs Division ................................. 44.1 45.5 45.5 $2,467,693 $2,579,339 $2,640,364
Internal Operations Division
Grants Administration:Assoc Govtl Prog Analyst ......................... 1 1 1 3,764–4,576 54,912 54,912Staff Svcs Analyst-Gen.............................. 2.3 3 3 2,411–3,805 116,424 124,460Ofc Asst-Typing......................................... 0.9 1 1 1,835–2,370 24,276 25,488Temporary Help ......................................... 0.3 – – (14,599) – –Overtime..................................................... – – – (810) – –
Totals ................................................... 4.5 5.0 5.0 $186,900 $195,612 $204,860
Accounting-Nonfederal:Sr Acctg Ofcr-Spec.................................... 1 1 1 3,764–4,576 53,880 54,912Temporary Help ......................................... 0.6 0.4 0.4 (24,237) 5,000 5,000Overtime..................................................... – – – (6,068) 7,000 7,000
Totals ................................................... 1.6 1.4 1.4 $81,893 $65,880 $66,912
Accounting-Federal:Sr Acctg Ofcr-Spec.................................... 0.7 1 1 3,764–4,576 51,048 53,604Acctg Ofcr-Spec......................................... 0.7 – – 3,287–3,995 – –Accountant Trainee .................................... 1 2 2 2,772–3,210 66,945 70,302Acctg Techn ............................................... 0.1 0.5 0.5 2,258–2,745 14,228 14,939Temporary Help ......................................... 1.2 4.1 4.1 (50,972) 54,000 54,000Overtime..................................................... – – – (3,364) 5,000 5,000
Totals ................................................... 3.7 7.6 7.6 $157,579 $191,221 $197,845
Personnel Services:Staff Svcs Mgr I ........................................ 1 1 1 4,346–5,243 62,916 62,916Assoc Pers Analyst .................................... 0.4 1 1 3,764–4,576 54,912 54,912Staff Svcs Analyst-Gen.............................. 2 2 2 2,411–3,805 81,275 85,462Ofc Techn-Typing ...................................... 0.9 1 1 2,258–2,745 32,940 32,940Temporary Help ......................................... 0.3 – – (12,736) – –Overtime..................................................... – – – (1,004) 1,000 1,000
Totals ................................................... 4.6 5.0 5.0 $204,160 $233,043 $237,230
Accounting:Acctg Administrator I-Supvr ..................... 1 1 1 4,346–5,243 62,916 62,916Sr Acctg Ofcr-Supvr .................................. 1 1 1 3,955–4,772 57,264 57,264Accountant Trainee .................................... 0.4 – – 2,772–3,210 – –Mgt Svcs Techn ......................................... 1 1 1 2,135–2,932 27,276 29,658Acctg Techn ............................................... 0.8 1 1 2,258–2,745 27,209 28,571Acct Clk II ................................................. 0.1 1 1 2,023–2,461 24,983 26,230Temporary Help ......................................... 0.3 – – (10,772) – –Overtime..................................................... – – – (5,105) 11,000 11,000
Totals ................................................... 4.6 5.0 5.0 $206,274 $210,648 $215,639
SALARY RANGE
EDUCATION E 69
6870 BOARD OF GOVERNORS OF THE CALIFORNIA COMMUNITY COLLEGES—Continued
ORGANIZATIONAL UNIT NUMBER OF POSITIONS EXPENDITURES
Filled Authorized Proposed Actual Estimated ProposedClassification 1999–00 2000–01 2001–02 1999–00 2000–01 2001–02
123456789
1011121314151617181920212223242526272829303132333435363738394041424344454647484950515253545556575859606162636465666768697071727374757677787980
Page 71
Reproduction:Sr Printing Trades Spec-Gen..................... 1 1 1 2,610–3,112 37,344 37,344Printing Trades Spec II-Gen...................... 0.9 2 2 2,094–2,681 50,256 52,776Overtime..................................................... – – – (1,975) 2,000 2,000
Totals ................................................... 1.9 3.0 3.0 $66,148 $89,600 $92,120
Budgets:Staff Svcs Mgr I ........................................ 1 1 1 4,346–5,243 62,916 62,916Assoc Budget Analyst................................ 2 2 2 3,764–4,576 109,824 109,824Overtime..................................................... – – – (4,228) 5,000 5,000
Totals ................................................... 3.0 3.0 3.0 $176,696 $177,740 $177,740
Business Services:Bus Svc Ofcr I-Spec.................................. 0.8 1 1 3,130–3,805 41,084 43,142Bus Svc Asst-Spec..................................... 0.8 1 1 2,135–3,173 34,934 35,184Overtime..................................................... – – – (306) – –
Totals ................................................... 1.6 2.0 2.0 $60,920 $76,018 $78,326
Internal Operations:C.E.A. I ...................................................... 0.5 1 1 5,282–6,707 80,484 80,484
Totals ................................................... 0.5 1.0 1.0 $43,241 $80,484 $80,484
Totals, Internal Operations Division . 26.0 33.0 33.0 $1,183,811 $1,320,246 $1,351,156Four Percent GSI effective 8/31/00 .......... – – – – 437,112 529,938
TOTALS, AUTHORIZED POSITIONS.................... 212.2 238.2 235.7 $11,969,325 $13,637,493 $13,864,078Regular/Ongoing Positions........................ 198.3 231.0 228.5 11,274,884 13,454,666 13,680,624Temporary Help ......................................... 13.9 7.2 7.2 592,940 97,133 97,760Overtime..................................................... – – – 66,701 35,694 35,694Board Stipends ........................................... – – – 34,800 50,000 50,000
1 1 limited-term position expires 6/30/01.2 2 limited-term positions expire 6/30/02.3 1 and one-half limited-term positions expire 6/30/01.4 1 limited-term position expires 6/30/02.5 4 limited-term positions expire 6/30/02.6 1 limited-term position expires 6/30/03.
7980 STUDENT AID COMMISSION
Student Aid Commission
Executive:Exec Director ............................................. 1 1 1 $9,132–9,877 $118,524 $118,524C.E.A. III ................................................... 1 1 1 7,354–8,108 100,212 100,212Adm Asst I................................................. 1 1 1 3,130–3,981 45,008 45,660Ofc Techn-Typing ...................................... 1 1 1 2,258–2,745 32,940 32,940Overtime..................................................... – – – (83) 83 83
Totals ................................................... 4.0 4.0 4.0 $294,773 $296,767 $297,419
Commissioners:Adm Asst II................................................ 1 1 1 3,764–4,576 51,048 53,604Commission Stipend (Temporary Help) ... – – – (14,200) 27,000 27,000Temporary Help ......................................... – – – (200) – –Overtime..................................................... – – – (3,287) 3,287 3,287
Totals ................................................... 1.0 1.0 1.0 $67,257 $81,335 $83,891
Legal Services:Staff Counsel III-Spec ............................... 1 1 1 6,320–7,799 75,840 79,632Mgt Svcs Techn ......................................... 1 1 1 2,135–2,932 32,100 33,704Overtime..................................................... – – – (21) 21 21
Totals ................................................... 2.0 2.0 2.0 $125,565 $107,961 $113,357
Internal Audits:Sr Mgt Auditor........................................... 1 1 1 4,772–5,757 69,084 69,084Assoc Mgt Auditor .................................... 1 1 1 3,952–4,805 57,660 57,660
Totals ................................................... 2.0 2.0 2.0 $127,925 $126,744 $126,744
SALARY RANGE
EDUCATIONE 70
6870 BOARD OF GOVERNORS OF THE CALIFORNIA COMMUNITY COLLEGES—Continued
ORGANIZATIONAL UNIT NUMBER OF POSITIONS EXPENDITURES
Filled Authorized Proposed Actual Estimated ProposedClassification 1999–00 2000–01 2001–02 1999–00 2000–01 2001–02
123456789
1011121314151617181920212223242526272829303132333435363738394041424344454647484950515253545556575859606162636465666768697071727374757677787980
Page 72
Management Services:Staff Svcs Mgr II-Supvry .......................... 1 1 1 4,772–5,757 69,084 69,084Staff Svcs Mgr I ........................................ 1.4 2 2 4,346–5,243 121,776 124,446Sr Acctg Ofcr-Spec.................................... 2 2 2 3,764–4,576 104,574 108,285Assoc Pers Analyst .................................... 0.6 – – 3,764–4,576 – –Assoc Govtl Prog Analyst ......................... 0.4 1 1 3,764–4,576 46,108 48,414Assoc Budget Analyst................................ 0.6 1 1 3,764–4,576 52,020 54,228Staff Svcs Analyst-Gen.............................. 1.8 1 1 2,411–3,805 45,660 45,660Pers Svcs Spec II....................................... 0.3 1 1 2,863–3,480 41,760 41,760Pers Techn II-Spec..................................... 0.8 – – 2,791–3,394 – –Accountant I-Spec...................................... 0.7 1 1 2,456–2,985 34,036 35,408Acctg Techn ............................................... 1.3 1 1 2,258–2,745 31,395 32,652Ofc Techn-Typing ...................................... 1 1 1 2,258–2,745 32,940 32,940Overtime..................................................... – – – (4,980) 4,980 4,980
Totals ................................................... 11.9 12.0 12.0 $559,436 $584,333 $597,857
Program Compliance:Staff Mgt Auditor ...................................... – 1 1 4,346–5,243 52,152 54,756Assoc Mgt Auditor .................................... 3 3 3 3,952–4,805 166,940 172,348Staff Svcs Mgt Auditor.............................. 1 1 1 2,658–3,995 40,920 42,969Staff Svcs Analyst-Gen.............................. 1 1 1 2,411–3,805 40,800 42,840
Totals ................................................... 5.0 6.0 6.0 $237,692 $300,812 $312,913
Information Technology Services:C.E.A. I ...................................................... 0.8 1 1 5,282–6,707 72,540 72,540Staff Programmer Analyst-Spec ................ 2 2 2 4,334–5,269 126,456 126,456Staff Info Sys Analyst-Spec ...................... 1 1 1 4,334–5,269 63,228 63,228Assoc Programmer Analyst-Spec .............. 1.5 4 4 3,952–4,805 208,317 214,912Assoc Info Sys Analyst-Spec .................... 2.7 1 1 3,952–4,805 57,660 57,660Asst Info Sys Analyst ................................ 1 1 1 2,658–3,995 40,920 42,969Info Sys Techn ........................................... 1 1 1 2,122–3,046 32,745 34,386Ofc Techn-Typing ...................................... – 1 1 2,258–2,745 27,096 28,452Temporary Help ......................................... 0.2 – – (6,848) – –Overtime..................................................... – – – (43,875) 43,875 43,875
Totals ................................................... 10.2 12.0 12.0 $600,782 $672,837 $684,478
Policy, Research and Legislation:C.E.A. I ...................................................... 1 1 1 5,282–6,707 69,072 69,072Research Prog Spec I ................................ – 1 1 4,136–5,027 49,632 52,116Financial Aid Mgr I................................... 1 1 1 4,139–4,992 59,904 59,904Assoc Finance Budget Analyst.................. 0.3 1 1 3,954–4,807 54,730 57,456Research Analyst II-Gen............................ 1 1 1 3,952–4,805 57,660 57,660Assoc Govtl Prog Analyst ......................... 1.9 3 3 3,764–4,576 151,666 156,960Assoc Financial Aid Analyst ..................... 1.8 – – 3,764–4,576 – –Mgt Svcs Techn ......................................... – 1 1 2,135–2,932 25,620 26,904Ofc Techn-Typing ...................................... 0.3 1 1 2,258–2,745 27,096 28,452Overtime..................................................... – – – (27,349) 27,349 27,349
Totals ................................................... 7.3 10.0 10.0 $425,493 $522,729 $535,873
Grant Services:C.E.A. I ...................................................... – 1 1 5,282–6,707 72,540 72,540Financial Aid Mgr II.................................. 1 – – 4,545–5,484 – –Financial Aid Mgr I................................... 1.2 3 3 4,139–4,992 176,981 182,770Assoc Info Sys Analyst-Spec .................... 0.8 2 2 3,952–4,805 115,320 115,320Assoc Financial Aid Analyst ..................... 10.7 13 13 3,764–4,576 664,245 682,087Financial Aid Analyst ................................ 1 1 1 2,610–3,805 40,449 42,469Supvng Prog Techn II................................ 0.1 1 1 2,527–3,072 36,028 36,864Mgt Svcs Techn ......................................... 3.9 4 4 2,135–2,932 134,976 137,824Supvng Prog Techn I ................................. 0.9 – – 2,349–2,853 – –Prog Techn II ............................................. 0.3 4 4 2,258–2,745 128,592 131,760Ofc Techn-Typing ...................................... 0.6 – – 2,258–2,745 – –Ofc Techn-Gen........................................... 1 1 1 2,258–2,745 32,940 32,940Prog Techn ................................................. 10.1 12.3 12.3 1,951–2,546 321,565 332,243Ofc Asst-Typing......................................... 0.5 3 3 1,835–2,370 67,716 71,100Temporary Help ......................................... 1.2 2.2 2.2 (59,673) 107,626 107,626Overtime..................................................... – – – (83,371) 83,371 83,371
Totals ................................................... 33.3 47.5 47.5 $1,454,622 $1,982,349 $2,028,914
Outreach and Training:Financial Aid Mgr I................................... 0.4 1 1 4,139–4,992 59,396 59,904Assoc Financial Aid Analyst ..................... 1.3 3 3 3,764–4,576 164,082 164,736Assoc Govtl Prog Analyst ......................... – 1 1 3,764–4,576 45,168 47,424
SALARY RANGE
EDUCATION E 71
7980 STUDENT AID COMMISSION—Continued
ORGANIZATIONAL UNIT NUMBER OF POSITIONS EXPENDITURES
Filled Authorized Proposed Actual Estimated ProposedClassification 1999–00 2000–01 2001–02 1999–00 2000–01 2001–02
123456789
1011121314151617181920212223242526272829303132333435363738394041424344454647484950515253545556575859606162636465666768697071727374757677787980
Page 73
Staff Svcs Analyst-Gen.............................. – 1 1 2,411–3,805 28,932 30,384Ofc Techn-Typing ...................................... – 1 1 2,258–2,745 27,096 32,940Overtime..................................................... – – – (436) 436 436
Totals ................................................... 1.7 7.0 7.0 $91,869 $325,110 $335,824
Loan Program Oversight:Sr Mgt Auditor........................................... 1 1 1 4,772–5,757 69,084 69,084Assoc Info Sys Analyst-Spec .................... – 1 1 3,952–4,805 47,424 49,800Assoc Acctg Analyst.................................. 1 1 1 3,952–4,805 55,141 57,660Assoc Govtl Prog Analyst ......................... – 1 1 3,764–4,576 45,168 47,424Staff Svcs Analyst-Gen.............................. 1 1 1 2,411–3,805 33,976 35,678Ofc Techn-Typing ...................................... 0.7 1 1 2,258–2,745 28,113 29,523Overtime..................................................... – – – (1,028) 1,028 1,028
Totals ................................................... 3.7 6.0 6.0 $175,750 $279,934 $290,197
Scholarshare Trust:C.E.A. III ................................................... 0.4 – – 7,354–8,108 – –Staff Svcs Mgr I ........................................ 0.5 – – 4,346–5,243 – –Assoc Govtl Prog Analyst ......................... – – – 3,764–4,576 – –Ofc Techn-Typing ...................................... – – – 2,258–2,745 – –Temporary Help ......................................... 0.2 – – (113) – –Overtime..................................................... – – – (7,630) – –
Totals ................................................... 1.1 – – $78,496 – –
Totals, Student Aid Commission ........ 83.2 109.5 109.5 $4,239,660 $5,280,911 $5,407,467
EDFUND
Executive:Assoc Financial Aid Analyst ..................... 0.5 1 1 3,764–4,576 54,912 54,912
Totals ................................................... 0.5 1.0 1.0 $24,690 $54,912 $54,912
General Counsel:Financial Aid Mgr I................................... 0.8 1 1 4,139–4,992 59,904 59,904Assoc Govtl Prog Analyst ......................... 0.8 1 1 3,764–4,576 49,206 51,672
Totals ................................................... 1.6 2.0 2.0 $81,648 $109,110 $111,576
Legal and Compliance Division:Financial Aid Mgr I................................... 0.3 – – 4,139–4,992 – –Staff Svcs Analyst-Gen.............................. 0.3 – – 2,411–3,805 – –Ofc Techn-Typing ...................................... – – – 2,258–2,745 – –
Totals ................................................... 0.6 – – $27,141 – –
Program Oversight:Staff Mgt Auditor ...................................... 0.8 1 1 4,346–5,243 62,916 62,916Assoc Mgt Auditor .................................... 0.8 1 1 3,952–4,805 57,651 57,660Overtime..................................................... – – – (658) 658 658
Totals ................................................... 1.6 2.0 2.0 $89,957 $121,225 $121,234
Program Oversight Branch:Staff Mgt Auditor ...................................... 0.3 – – 4,346–5,243 – –Assoc Mgt Auditor .................................... 0.3 – – 3,952–4,805 – –Overtime..................................................... – – – (139) – –
Totals ................................................... 0.6 – – $29,593 – –
Communications:Research Writer.......................................... 0.4 0.5 0.5 3,764–4,576 27,456 27,456Assoc Govtl Prog Analyst ......................... 2.6 2.5 2.5 3,764–4,576 134,456 137,062Asst Info Sys Analyst ................................ 0.8 1 1 2,658–3,995 42,277 44,393Overtime..................................................... – – – (7,597) 7,597 7,597
Totals ................................................... 3.8 4.0 4.0 $200,050 $211,786 $216,508
Communications Branch:Research Writer.......................................... 0.1 – – 3,764–4,576 – –Assoc Govtl Prog Analyst ......................... 0.9 – – 3,764–4,576 – –Asst Info Sys Analyst ................................ 0.3 – – 2,658–3,995 – –Overtime..................................................... – – – (1,932) – –
Totals ................................................... 1.3 – – $64,923 – –
Research and Policy Analysis:Sr Consultant-Student Loan ...................... 0.8 1 1 4,989–6,064 72,768 72,768Research Prog Spec I ................................ 0.5 1 1 4,136–5,027 60,318 60,324
SALARY RANGE
EDUCATIONE 72
7980 STUDENT AID COMMISSION—Continued
ORGANIZATIONAL UNIT NUMBER OF POSITIONS EXPENDITURES
Filled Authorized Proposed Actual Estimated ProposedClassification 1999–00 2000–01 2001–02 1999–00 2000–01 2001–02
123456789
1011121314151617181920212223242526272829303132333435363738394041424344454647484950515253545556575859606162636465666768697071727374757677787980
Page 74
Ofc Techn-Typing ...................................... 0.8 1 1 2,258–2,745 32,940 32,940Overtime..................................................... – – – (922) 922 922
Totals ................................................... 2.1 3.0 3.0 $111,971 $166,948 $166,954
Research and Policy Analysis Branch:Sr Consultant-Student Loan ...................... 0.5 – – 4,989–6,064 – –Ofc Techn-Typing ...................................... 0.3 – – 2,258–2,745 – –
Totals ................................................... 0.8 – – $44,391 – –
Administration and Support Services:Assoc Info Sys Analyst-Spec .................... 0.8 1 1 3,952–4,805 50,008 52,514Asst Info Sys Analyst ................................ 0.8 1 1 2,658–3,995 47,940 47,940Overtime..................................................... – – – (965) 965 965
Totals ................................................... 1.6 2.0 2.0 $72,823 $98,913 $101,419
Manager Financial Report and FinancialAnalysis:
Acctg Administrator I-Supvr ..................... 0.4 1 1 4,346–5,243 62,916 62,916Staff Svcs Mgr I ........................................ 0.3 – – 4,346–5,243 – –
Totals ................................................... 0.7 1.0 1.0 $47,587 $62,916 $62,916
Manager Cash Management and FinancialServices:
Acctg Administrator I-Supvr ..................... 0.8 1 1 4,346–5,243 62,916 62,916
Totals ................................................... 0.8 1.0 1.0 $48,397 $62,916 $62,916
Financial Reports-Budgets:Assoc Adm Analyst-Acctg ........................ 0.3 – – 3,952–4,805 – –Sr Acctg Ofcr-Spec.................................... 0.3 – – 3,764–4,576 – –Assoc Budget Analyst................................ 0.3 – – 3,764–4,576 – –Overtime..................................................... – – – (1,675) – –
Totals ................................................... 0.9 – – $39,127 – –
Financial Analysis:Staff Svcs Mgr I ........................................ – – – 4,346–5,243 – –Assoc Adm Analyst-Acctg ........................ 0.3 1 1 3,952–4,805 47,424 49,800Overtime..................................................... – – – (291) 291 291
Totals ................................................... 0.3 1.0 1.0 $14,669 $47,715 $50,091
FAPS-Transition:Staff Svcs Mgr I ........................................ 0.3 – – 4,346–5,243 – –Assoc Adm Analyst-Acctg ........................ 0.3 – – 3,952–4,805 – –
Totals ................................................... 0.6 – – $30,033 – –
Subrogation-Online Credit:Prog Techn ................................................. 0.3 – – 1,951–2,546 – –
Totals ................................................... 0.3 – – $6,997 – –
Subrogation:Prog Techn ................................................. 1.5 2 2 1,951–2,546 60,301 61,047
Totals ................................................... 1.5 2.0 2.0 $43,665 $60,301 $61,047
Loan Consolidation:Ofc Techn-Typing ...................................... 0.3 – – 2,258–2,745 – –Acctg Techn ............................................... 0.2 – – 2,258–2,745 – –Prog Techn ................................................. 0.5 – – 1,951–2,546 – –
Totals ................................................... 1.0 – – $31,318 – –
Loan Consolidations:Acctg Techn ............................................... 0.7 1 1 2,258–2,745 32,940 32,940Ofc Techn-Typing ...................................... 0.3 – – 2,258–2,745 – –Prog Techn ................................................. 0.8 1 1 1,951–2,546 30,552 30,552Overtime..................................................... – – – (110) 110 110
Totals ................................................... 1.8 2.0 2.0 $56,768 $63,602 $63,602
Payment History:Mgt Svcs Techn ......................................... 0.1 – – 2,135–2,932 – –Acctg Techn ............................................... 0.3 – – 2,258–2,745 – –Prog Techn ................................................. 0.2 – – 1,951–2,546 – –
Totals ................................................... 0.6 – – $17,586 – –
SALARY RANGE
EDUCATION E 73
7980 STUDENT AID COMMISSION—Continued
ORGANIZATIONAL UNIT NUMBER OF POSITIONS EXPENDITURES
Filled Authorized Proposed Actual Estimated ProposedClassification 1999–00 2000–01 2001–02 1999–00 2000–01 2001–02
123456789
1011121314151617181920212223242526272829303132333435363738394041424344454647484950515253545556575859606162636465666768697071727374757677787980
Page 75
Payment Histories:Acctg Techn ............................................... 0.8 1 1 2,258–2,745 32,940 32,940Prog Techn ................................................. 0.8 1 1 1,951–2,546 30,552 30,552
Totals ................................................... 1.6 2.0 2.0 $47,619 $63,492 $63,492
Systems DB and Desktop Support:Assoc Info Sys Analyst-Spec .................... 0.8 1 1 3,952–4,805 57,660 57,660
Totals ................................................... 0.8 1.0 1.0 $43,208 $57,660 $57,660
Accounts Receivable:Acctg Administrator I-Supvr ..................... 0.3 – – 4,346–5,243 – –Staff Svcs Analyst-Gen.............................. 0.3 – – 2,411–3,805 – –Acctg Techn ............................................... 0.3 – – 2,258–2,745 – –
Totals ................................................... 0.9 – – $33,857 – –
Cash Management:Assoc Govtl Prog Analyst ......................... 0.7 1 1 3,764–4,576 46,672 49,008Staff Svcs Analyst-Gen.............................. 0.1 – – 2,411–3,805 – –Accountant Trainee .................................... 0.6 1 1 2,772–3,210 38,520 38,520Acctg Techn ............................................... 0.1 – – 2,258–2,745 – –Overtime..................................................... – – – (261) 261 261
Totals ................................................... 1.5 2.0 2.0 $58,762 $85,453 $87,789
AP-Refunds, CADS, Repurchase:Accountant Trainee .................................... 0.3 – – 2,772–3,210 – –Overtime..................................................... – – – (842) – –
Totals ................................................... 0.3 – – $11,328 – –
AP-Vendor:Sr Acctg Ofcr-Spec.................................... 0.3 – – 3,764–4,576 – –Accountant Trainee .................................... 0.3 – – 2,772–3,210 – –Acct Clk II ................................................. 0.3 – – 2,023–2,461 – –Overtime..................................................... – – – (688) – –
Totals ................................................... 0.9 – – $30,814 – –
Accounts Payable:Accountant Trainee .................................... 0.2 – – 2,772–3,210 – –Acct Clk II ................................................. 0.3 – – 2,023–2,461 – –
Totals ................................................... 0.5 – – $16,028 – –
Human Resources-Training:Staff Svcs Analyst-Gen.............................. 0.1 – – 2,411–3,805 – –
Totals ................................................... 0.1 – – $2,455 – –
Human Resources-Training:Staff Svcs Analyst-Gen.............................. 0.8 1 1 2,411–3,805 38,076 38,076Overtime..................................................... – – – (27) 27 27
Totals ................................................... 0.8 1.0 1.0 $28,541 $38,103 $38,103
Human Resources-Personnel Services:Staff Svcs Mgr I ........................................ 0.3 – – 4,346–5,243 – –Labor Relations Analyst ............................ 0.3 – – 3,766–4,578 – –Assoc Pers Analyst .................................... 0.5 – – 3,764–4,576 – –Pers Svcs Spec II....................................... 0.3 – – 2,863–3,480 – –Ofc Techn-Typing ...................................... 0.1 – – 2,258–2,745 – –Temporary Help ......................................... 0.1 – – (4,394) – –
Totals ................................................... 1.6 – – $73,768 – –
Human Resources-Personnel Services:Staff Svcs Mgr I ........................................ 0.8 1 1 4,346–5,243 62,916 62,916Labor Relations Analyst ............................ 0.8 1 1 3,766–4,578 54,936 54,936Assoc Pers Analyst .................................... 0.9 1 1 3,764–4,576 54,912 54,912Staff Svcs Analyst-Gen.............................. 0.5 1 1 2,411–3,805 44,754 45,660Pers Svcs Spec II....................................... 0.3 – – 2,863–3,480 – –Pers Svcs Spec I ........................................ 0.3 0.5 0.5 2,226–3,222 17,724 18,420Ofc Techn-Typing ...................................... 0.1 – – 2,258–2,745 – –Temporary Help ......................................... 0.4 0.6 0.6 (13,319) 17,846 17,846Overtime..................................................... – – – (413) 413 413
Totals ................................................... 4.1 5.1 5.1 $198,448 $253,501 $255,103
SALARY RANGE
EDUCATIONE 74
7980 STUDENT AID COMMISSION—Continued
ORGANIZATIONAL UNIT NUMBER OF POSITIONS EXPENDITURES
Filled Authorized Proposed Actual Estimated ProposedClassification 1999–00 2000–01 2001–02 1999–00 2000–01 2001–02
123456789
1011121314151617181920212223242526272829303132333435363738394041424344454647484950515253545556575859606162636465666768697071727374757677787980
Page 76
Business Services Office:Staff Svcs Mgr II-Supvry .......................... 0.3 – – 4,772–5,757 – –Sr Special Investigator............................... 0.3 – – 3,630–4,371 – –Bus Svc Ofcr II-Supvr............................... 0.3 – – 3,607–4,346 – –Bus Svc Asst-Spec..................................... 0.3 – – 2,135–3,173 – –Mailing Machines Supvr ........................... 0.3 – – 2,452–2,980 – –Warehouse Worker ..................................... 0.2 – – 2,462–2,927 – –Mailing Mach Opr II ................................. 0.3 – – 2,266–2,752 – –Overtime..................................................... – – – (846) – –
Totals ................................................... 2.0 – – $77,311 – –
Business Services:Assoc Mgt Analyst .................................... 0.8 1 1 3,764–4,576 54,912 54,912Assoc Govtl Prog Analyst ........................ – 1 1 3,764–4,576 54,912 54,912Sr Special Investigator............................... 0.2 – – 3,630–4,371 – –Bus Svc Ofcr II-Supvr............................... 0.8 1 1 3,607–4,346 52,152 52,152Bus Svc Ofcr I-Spec.................................. 0.6 1 1 3,130–3,805 38,659 40,592Bus Svc Asst-Spec..................................... 0.8 1 1 2,135–3,173 37,856 38,076Mailing Machines Supvr ........................... 0.2 – – 2,452–2,980 – –Warehouse Worker ..................................... 0.1 – – 2,462–2,927 – –Mailing Mach Opr II ................................. 0.8 1 1 2,266–2,752 33,024 33,024Overtime..................................................... – – – (6,044) 6,044 6,044
Totals ................................................... 4.3 6.0 6.0 $179,835 $277,559 $279,712
Security and Risk Management Office:Staff Svcs Mgr I ........................................ 0.3 – – 4,346–5,243 – –
Totals ................................................... 0.3 – – $15,729 – –
Security and Risk Management:Staff Svcs Mgr I ........................................ 0.8 1 1 4,346–5,243 62,916 62,916
Totals ................................................... 0.8 1.0 1.0 $48,397 $62,916 $62,916
Imaging and Records Management Office:Staff Svcs Mgr I ........................................ 0.3 – – 4,346–5,243 – –Assoc Govtl Prog Analyst ......................... 0.3 – – 3,764–4,576 – –Recds Mgt Analyst I.................................. 0.3 – – 3,130–3,805 – –Ofc Techn-Typing ...................................... 0.3 – – 2,258–2,745 – –Bus Svc Asst-Spec..................................... 0.3 – – 2,258–2,745 – –Ofc Asst-Gen.............................................. 0.3 – – 1,775–2,370 – –
Totals ................................................... 1.8 – – $62,710 – –
Records and Microfilm:Staff Svcs Mgr I ........................................ 0.8 1 1 4,346–5,243 60,783 62,916Assoc Govtl Prog Analyst ......................... 0.8 1 1 3,764–4,576 52,296 54,912Recds Mgt Analyst I.................................. 0.8 1 1 3,130–3,805 45,660 45,660Bus Svc Asst-Spec..................................... 0.8 1 1 2,135–3,173 38,076 38,076Ofc Techn-Typing ...................................... 0.8 1 1 2,258–2,745 32,940 32,940Ofc Asst-Gen.............................................. 0.7 1 1 1,775–2,370 28,440 28,440
Totals ................................................... 4.7 6.0 6.0 $189,594 $258,195 $262,944
Loan Services Branch:Assoc Financial Aid Analyst ..................... 1 – – 3,764–4,576 – –Overtime..................................................... – – – (616) – –
Totals ................................................... 1.0 – – $50,461 – –
Loan Services:Assoc Financial Aid Analyst ..................... 2.3 3 3 3,764–4,576 153,918 158,880Overtime..................................................... – – – (2,001) 2,001 2,001
Totals ................................................... 2.3 3.0 3.0 $114,287 $155,919 $160,881
Customer Relations-In State:
Client Services, Long Beach:Ofc Techn-Typing ...................................... 0.3 – – 2,258–2,745 – –
Totals ................................................... 0.3 – – $8,235 – –
Customer Relations Long Beach:Ofc Techn-Typing ...................................... 0.8 1 1 2,258–2,745 32,940 32,940
Totals ................................................... 0.8 1.0 1.0 $24,705 $32,940 $32,940
Client Services, Bay Area:Assoc Financial Aid Analyst ..................... 0.3 – – 3,764–4,576 – –
Totals ................................................... 0.3 – – $12,658 – –
SALARY RANGE
EDUCATION E 75
7980 STUDENT AID COMMISSION—Continued
ORGANIZATIONAL UNIT NUMBER OF POSITIONS EXPENDITURES
Filled Authorized Proposed Actual Estimated ProposedClassification 1999–00 2000–01 2001–02 1999–00 2000–01 2001–02
123456789
1011121314151617181920212223242526272829303132333435363738394041424344454647484950515253545556575859606162636465666768697071727374757677787980
Page 77
Customer Relations Bay Area:Assoc Financial Aid Analyst ..................... 0.5 1 1 3,764–4,576 45,168 47,424Overtime..................................................... – – – (867) 867 867
Totals ................................................... 0.5 1.0 1.0 $26,668 $46,035 $48,291
AVP Business Operations:Staff Svcs Mgr II-Supvry .......................... 0.8 1 1 4,772–5,757 69,084 69,084
Totals ................................................... 0.8 1.0 1.0 $53,141 $69,084 $69,084
Loan D and L Information Office:Financial Aid Mgr I................................... 0.3 – – 4,139–4,992 – –Research Analyst II-Gen............................ 0.3 – – 3,952–4,805 – –Assoc Financial Aid Analyst ..................... 0.3 – – 3,764–4,576 – –
Totals ................................................... 0.9 – – $42,906 – –
Loan Detail Information Office:Financial Aid Mgr I................................... 0.8 1 1 4,139–4,992 59,904 59,904Research Analyst II-Gen............................ 0.8 2 2 3,952–4,805 105,084 107,460Assoc Financial Aid Analyst ..................... 0.8 1 1 3,764–4,576 54,912 54,912Financial Aid Analyst ................................ 0.1 1 1 2,610–3,805 40,100 42,104
Totals ................................................... 2.5 5.0 5.0 $134,024 $260,000 $264,380
Origination and Guarantee Services:Assoc Financial Aid Analyst ..................... 0.5 – – 3,764–4,576 – –Financial Aid Analyst ................................ 0.6 – – 2,610–3,805 – –Overtime..................................................... – – – (8,507) – –
Totals ................................................... 1.1 – – $62,871 – –
VP Default Management:Financial Aid Mgr II.................................. 0.5 1 1 4,545–5,484 65,808 65,808
Totals ................................................... 0.5 1.0 1.0 $32,904 $65,808 $65,808
Default Asset Management-AVP:Financial Aid Mgr II.................................. 0.5 – – 4,545–5,484 – –
Totals ................................................... 0.5 – – $31,937 – –
AVP Default Asset Management:Financial Aid Mgr II.................................. 1 1 1 4,545–5,484 65,566 65,808
Totals ................................................... 1.0 1.0 1.0 $65,296 $65,566 $65,808
Internal Collections Office:Assoc Financial Aid Analyst ..................... 0.8 – – 3,764–4,576 – –Mgt Svcs Techn ......................................... 1.3 – – 2,135–2,932 – –Ofc Techn-Typing ...................................... 0.3 – – 2,258–2,745 – –Prog Techn ................................................. 0.3 – – 1,951–2,546 – –Overtime..................................................... – – – (3,496) – –
Totals ................................................... 2.7 – – $106,666 – –
Internal Collections:Assoc Financial Aid Analyst ..................... 1.9 4 4 3,764–4,576 203,532 208,218Financial Aid Analyst ................................ 0.5 – – 2,610–3,805 – –Mgt Svcs Techn ......................................... 2.6 4 4 2,135–2,932 128,988 131,926Supvng Prog Techn I ................................. – – – 2,349–2,853 – –Ofc Techn-Typing ...................................... 0.7 1 1 2,258–2,745 32,940 32,940Prog Techn ................................................. 0.2 – – 1,951–2,546 – –
Totals ................................................... 5.9 9.0 9.0 $237,642 $365,460 $373,084
Collection Contract Management:Assoc Mgt Auditor .................................... 0.3 – – 3,952–4,805 – –Assoc Financial Aid Analyst ..................... 0.5 – – 3,764–4,576 – –Financial Aid Analyst ................................ 0.3 – – 2,610–3,805 – –Ofc Techn-Typing ...................................... 0.3 – – 2,258–2,745 – –
Totals ................................................... 1.4 – – $59,361 – –
External Relations:Assoc Mgt Auditor .................................... 0.2 1 1 3,952–4,805 47,424 49,800Assoc Financial Aid Analyst ..................... 1.5 2 2 3,764–4,576 109,824 109,824Financial Aid Analyst ................................ 0.8 1 1 2,610–3,805 45,660 45,660Mgt Svcs Techn ......................................... 0.6 1 1 2,135–2,932 34,934 35,184Ofc Techn-Typing ...................................... 0.2 – – 2,258–2,745 – –
Totals ................................................... 3.3 5.0 5.0 $152,167 $237,842 $240,468
SALARY RANGE
EDUCATIONE 76
7980 STUDENT AID COMMISSION—Continued
ORGANIZATIONAL UNIT NUMBER OF POSITIONS EXPENDITURES
Filled Authorized Proposed Actual Estimated ProposedClassification 1999–00 2000–01 2001–02 1999–00 2000–01 2001–02
123456789
1011121314151617181920212223242526272829303132333435363738394041424344454647484950515253545556575859606162636465666768697071727374757677787980
Page 78
AW Garnishment:Financial Aid Mgr I................................... 0.3 – – 4,139–4,992 – –Assoc Financial Aid Analyst ..................... 0.3 – – 3,764–4,576 – –Financial Aid Analyst ................................ 0.8 – – 2,610–3,805 – –Staff Svcs Analyst-Gen.............................. 0.2 – – 2,411–3,805 – –Ofc Techn-Typing ...................................... 0.3 – – 2,258–2,745 – –Overtime..................................................... – – – (5,382) – –
Totals ................................................... 1.9 – – $80,536 – –
Rehabilitations:Assoc Financial Aid Analyst ..................... 2.8 4 4 3,764–4,576 208,632 213,584Financial Aid Analyst ............................... – 1 1 2,610–3,805 35,940 37,740Mgt Svcs Techn ......................................... 0.8 – – 2,135–2,932 – –Overtime..................................................... – – – (15,599) 15,599 15,599
Totals ................................................... 3.6 5.0 5.0 $182,757 $260,171 $266,923
Default Prevention-Claims-Post Default ServicesBranch:
Financial Aid Mgr II.................................. 0.3 – – 4,545–5,484 – –Assoc Financial Aid Analyst ..................... 0.3 – – 3,764–4,576 – –
Totals ................................................... 0.6 – – $30,078 – –
AVP Claims and Resolution Services:Financial Aid Mgr II.................................. 0.5 1 1 4,545–5,484 54,540 57,264Assoc Financial Aid Analyst ..................... 0.5 – – 3,764–4,576 – –
Totals ................................................... 1.0 1.0 1.0 $61,592 $54,540 $57,264
Default Prevention Office:Assoc Info Sys Analyst-Spec .................... 0.3 – – 3,952–4,805 – –Assoc Financial Aid Analyst ..................... 0.1 – – 3,764–4,576 – –Financial Aid Analyst ................................ 0.4 – – 2,610–3,805 – –Staff Svcs Analyst-Gen.............................. 0.3 – – 2,411–3,805 – –Supvng Prog Techn I ................................. 0.3 – – 2,349–2,853 – –Ofc Techn-Typing ...................................... 0.3 – – 2,258–2,745 – –Prog Techn ................................................. 1.5 – – 1,951–2,546 – –Word Proc Techn ....................................... 0.2 – – 1,951–2,546 – –Temporary Help ......................................... 0.2 – – (5,957) – –Overtime..................................................... – – – (1,672) – –
Totals ................................................... 3.6 – – $123,402 – –
Default Prevention:Assoc Info Sys Analyst-Spec .................... 0.7 – – 3,952–4,805 – –Assoc Financial Aid Analyst ..................... 0.4 1 1 3,764–4,576 54,912 54,912Financial Aid Analyst ................................ 1.1 1.5 1.5 2,610–3,805 67,221 68,399Staff Svcs Analyst-Gen.............................. 0.8 1 1 2,411–3,805 37,606 38,076Supvng Prog Techn I ................................. 0.8 1 1 2,349–2,853 34,236 34,236Ofc Techn-Typing ...................................... 0.8 1 1 2,258–2,745 32,940 32,940Word Proc Techn ....................................... 0.6 1 1 1,951–2,546 30,552 30,552Prog Techn ................................................. 4.3 6 6 1,951–2,546 174,779 177,344Temporary Help ......................................... 0.5 0.8 0.8 (17,378) 22,035 22,035Overtime..................................................... – – – (9,977) 9,977 9,977
Totals ................................................... 10.0 13.3 13.3 $359,900 $464,258 $468,471
Claims Adjudication Office:Assoc Financial Aid Analyst ..................... 0.5 – – 3,764–4,576 – –Financial Aid Analyst ................................ 0.2 – – 2,610–3,805 – –Mgt Svcs Techn ......................................... 0.5 – – 2,135–2,932 – –Prog Techn ................................................. 1.6 – – 1,951–2,546 – –Temporary Help ......................................... – – – (324) – –Overtime..................................................... – – – (1,091) – –
Totals ................................................... 2.8 – – $100,936 – –
Claims:Assoc Financial Aid Analyst ..................... 1.5 2 2 3,764–4,576 102,534 104,920Financial Aid Analyst ................................ 0.7 0.8 0.8 2,610–3,805 25,056 26,314Mgt Svcs Techn ......................................... 1.5 2 2 2,135–2,932 70,368 70,368Prog Techn ................................................. 4.2 5.6 5.6 1,951–2,546 164,539 165,739Temporary Help ......................................... 0.3 0.8 0.8 (9,982) 20,505 20,505Overtime..................................................... – – – (2,439) 2,439 2,439
Totals ................................................... 8.2 11.2 11.2 $294,988 $385,441 $390,285
SALARY RANGE
EDUCATION E 77
7980 STUDENT AID COMMISSION—Continued
ORGANIZATIONAL UNIT NUMBER OF POSITIONS EXPENDITURES
Filled Authorized Proposed Actual Estimated ProposedClassification 1999–00 2000–01 2001–02 1999–00 2000–01 2001–02
123456789
1011121314151617181920212223242526272829303132333435363738394041424344454647484950515253545556575859606162636465666768697071727374757677787980
Page 79
Post Default Services Office:Financial Aid Mgr I................................... 0.3 – – 4,139–4,992 – –Assoc Financial Aid Analyst ..................... 0.3 – – 3,764–4,576 – –Financial Aid Analyst ................................ 0.8 – – 2,610–3,805 – –Mgt Svcs Techn ......................................... 0.5 – – 2,135–2,932 – –Ofc Techn-Typing ...................................... 0.3 – – 2,258–2,745 – –Prog Techn ................................................. 1.9 – – 1,951–2,546 – –Temporary Help ........................................ 0.3 – – (9,960) – –Overtime..................................................... – – – (971) – –
Totals ................................................... 4.4 – – $149,105 – –
Post Default Services:Financial Aid Mgr I................................... 0.5 1 1 4,139–4,992 49,668 52,152Assoc Financial Aid Analyst ..................... 0.8 1 1 3,764–4,576 54,912 54,912Financial Aid Analyst ................................ 2.7 3 3 2,610–3,805 128,478 132,230Mgt Svcs Techn ......................................... 1 1 1 2,135–2,932 32,428 34,052Ofc Techn-Typing ...................................... 0.8 1 1 2,258–2,745 30,116 31,618Prog Techn ................................................. 5.2 8 8 1,951–2,546 238,544 243,494Temporary Help ........................................ 0.5 0.8 0.8 (15,990) 20,505 20,505
Totals ................................................... 11.5 15.8 15.8 $399,968 $554,651 $568,963
Origination and Guarantee Services:Assoc Financial Aid Analyst ..................... 1.5 2 2 3,764–4,576 109,824 109,824Financial Aid Analyst ................................ 1.9 3 3 2,610–3,805 121,380 124,212Prog Techn ................................................. – 2 2 1,951–2,546 48,000 50,400Overtime..................................................... – – – (13,046) 13,046 13,046
Totals ................................................... 3.4 7.0 7.0 $176,799 $292,250 $297,482
Technical Solutions and Networks:Staff Programmer Analyst-Spec ................ 0.3 – – 4,334–5,269 – –Assoc Info Sys Analyst-Spec .................... 0.3 – – 3,952–4,805 – –Overtime ................................................... – – – (1,131) – –
Totals ................................................... 0.6 – – $31,119 – –
Administration Wage Garnishment:Financial Aid Mgr I................................... 0.8 1 1 4,139–4,992 59,904 59,904Assoc Financial Aid Analyst ..................... 0.8 1 1 3,764–4,576 49,206 51,672Financial Aid Analyst ................................ 1.5 2 2 2,610–3,805 81,310 85,380Ofc Techn-Typing ...................................... 0.8 1 1 2,258–2,745 30,505 32,030Overtime..................................................... – – – (1,426) 1,426 1,426
Totals ................................................... 3.9 5.0 5.0 $170,287 $222,351 $230,412
Technical Solutions and Service-Solutions:Assoc Info Sys Analyst-Spec .................... 0.5 – – 3,952–4,805 – –Assoc Adm Analyst-Acctg ........................ 0.3 – – 3,952–4,805 – –Asst Info Sys Analyst ................................ 0.3 – – 2,658–3,995 – –
Totals ................................................... 1.1 – – $51,090 – –
Financial Aid Solutions and Technical Project:Financial Aid Mgr I................................... – – – 4,139–4,992 – –Assoc Financial Aid Analyst ..................... 0.3 – – 3,764–4,576 – –Staff Svcs Analyst-Gen.............................. 0.1 – – 2,411–3,805 – –Exec Asst.................................................... 0.1 – – 2,813–3,419 – –
Totals ................................................... 0.5 – – $23,615 – –
Process Analysis and Applications Development:Staff Programmer Analyst-Spec ................ 0.8 1 1 4,334–5,269 63,228 63,228Assoc Adm Analyst-Acctg ........................ 0.8 1 1 3,952–4,805 57,660 57,660Assoc Info Sys Analyst-Spec .................... 1 3 3 3,952–4,805 170,690 172,980Overtime..................................................... – – – (2,135) 2,135 2,135
Totals ................................................... 2.6 5.0 5.0 $144,830 $293,713 $296,003
Financial Reporting:Assoc Adm Analyst-Acctg ........................ 0.8 1 1 3,952–4,805 57,660 57,660Sr Acctg Ofcr-Spec.................................... 0.8 1 1 3,764–4,576 50,632 53,168Assoc Budget Analyst................................ 0.8 1 1 3,764–4,576 48,216 50,632Overtime..................................................... – – – (3,280) 3,280 3,280
Totals .................................................. 2.4 3.0 3.0 $118,476 $159,788 $164,740
Totals, EDFUND................................. 137.9 138.4 138.4 $5,917,145 $6,143,040 $6,242,181Four Percent GSI effective 8/31/00 .......... – – – – 373,011 456,685
TOTALS, AUTHORIZED POSITIONS.................... 221.1 247.9 247.9 $10,156,805 $11,796,962 $12,106,333
SALARY RANGE
EDUCATIONE 78
7980 STUDENT AID COMMISSION—Continued
ORGANIZATIONAL UNIT NUMBER OF POSITIONS EXPENDITURES
Filled Authorized Proposed Actual Estimated ProposedClassification 1999–00 2000–01 2001–02 1999–00 2000–01 2001–02
123456789
1011121314151617181920212223242526272829303132333435363738394041424344454647484950515253545556575859606162636465666768697071727374757677787980
Page 80
Regular/Ongoing Positions........................ 217.2 242.7 242.7 9,729,361 11,341,774 11,649,708Temporary Help ......................................... 3.9 5.2 5.2 165,855 222,700 224,137Overtime..................................................... – – – 261,589 232,488 232,488
Continuously vacant positions abolished by theState Controller per Government CodeSection 12439
Internal Collections:Assoc Financial Aid Analyst ..................... – 1 1 $3,764–4,576 – –
Administration Wage Garnishment:Staff Svcs Analyst-Gen.............................. – 1 1 2,411–3,805 – –
Default Prevention:Financial Aid Analyst ................................ – 0.5 0.5 2,610–3,805 – –
Customer Relations-In State:Ofc Techn-Typing ...................................... – 1 1 2,258–2,745 – –
Default Prevention Office:Mgt Svcs Techn ......................................... – 1 1 2,135–2,932 – –
Grant Services:Ofc Techn-Typing ...................................... – 0.5 0.5 2,258–2,745 – –
Loan Program Oversight:Ofc Techn-Typing ...................................... – 0.5 0.5 2,258–2,745 – –
Systems DB and Desktop Support:Assoc Info Sys Analyst-Spec .................... – 1 1 3,952–4,805 – –
Human Resources-Training:Staff Svcs Analyst...................................... – 1 1 2,411–3,805 – –
SALARY RANGE
EDUCATION E 79
7980 STUDENT AID COMMISSION—Continued
ORGANIZATIONAL UNIT NUMBER OF POSITIONS EXPENDITURES
Filled Authorized Proposed Actual Estimated ProposedClassification 1999–00 2000–01 2001–02 1999–00 2000–01 2001–02
123456789
1011121314151617181920212223242526272829303132333435363738394041424344454647484950515253545556575859606162636465666768697071727374757677787980