Section 3: Overview of Service Area Sections City of London 2019 Corporate Asset Management Plan 38 Table of Contents Cityscape Structure of the AMP Levels of Service Asset Lifecycle Management Strategy Forecasted Infrastructure Gap Discussion Conclusions State of Local Infrastructure 3.1 STRUCTURE OF THE CORPORATE AMP Figure 3.1 Corporate Asset Management (CAM) Plan Structure The Corporate AMP is structured to provide consistency to stakeholders who are engaged with the document. Description of the AMP sections is provided below and illustrated in figure 3.1. 1. An Introductory Section outlining the City’s Vision, mission and Values. It also provides an overview of the CAM program, Ontario regulations for Asset Management Planning, the AMP scope, etc. 2. A brief section overview describes the six parts that are documented for each service area (asset category) • State of infrastructure • Levels of Service • Asset lifecycle management strategy • Forecasted Infrastructure Gap • Discussion • Conclusions 3. A series of separate sections for each infrastructure service area reviews the content for each of the six major Parts list above. 4. A financing strategy section setting out the approaches to ensuring that the appropriate funds are available and provides multiple alternatives. 5. A Conclusion and Recommendations section aggregates the AMP findings into an overall picture and provide recommendations CONCLUSION AND RECOMMENDATIONS SERVICE AREA SECTIONS State of Infrastructure • Asset Hierarchy • Asset Inventory • Replacement Value • Asset Condition • Estimated Useful life Levels of Service (LOS) • Customers’ Values • Corporate LOS • Community LOS • Technical LOS Lifecycle Management Strategy • Non-Infrastructure • Maintain and Operate • Renew • Growth • Service Improvements • Decommission Forecasted Infrastructure Gap • Required LC activities • Current Funding • Addition RV availability • Funding Gap Discussion • Current & Future Challenges • 2014 – 2019 AMPs Conclusions • Overall Conclusions • Current and Recommended Annual Reinvestment rates INTRODUCTION FINANCIAL STRATEGIES Alternative 1 Alternative 2 Alternative 3 • Assessing Capital and Operating Needs • Using Debt Effectively • Apportioning Reserves and Reserve Fund • Receiving Third Party Contributions • Addressing Infrastructure Gap – Eliminating vs. Mitigating Outlines the City’s Vision, Mission, and Values - CAM Program - Alignment with Ontario’s Regulations, - Scope • Summary of Conclusions • 2014 AMP Recommendations Progress • 2014 - 2019 AMPs comparison • O.Reg Compliance phases • Recommendations
Transcript
Section 3: Overview of Service Area Sections
City of London 2019 Corporate Asset Management Plan 38
Table of Contents Cityscape
Structure of
the AMP
Levels
of
Service
Asset Lifecycle
Management
Strategy
Forecasted
Infrastructure
Gap
Discussion ConclusionsState of Local
Infrastructure
3.1 STRUCTURE OF THE CORPORATE AMP
Figure 3.1 Corporate Asset Management (CAM) Plan Structure
The Corporate AMP is structured to
provide consistency to stakeholders who
are engaged with the document.
Description of the AMP sections is
provided below and illustrated in figure
3.1.
1. An Introductory Section outlining the
City’s Vision, mission and Values. It
also provides an overview of the
CAM program, Ontario regulations for
Asset Management Planning, the
AMP scope, etc.
2. A brief section overview describes
the six parts that are documented for
each service area (asset category)
• State of infrastructure
• Levels of Service
• Asset lifecycle management
strategy
• Forecasted Infrastructure Gap
• Discussion
• Conclusions
3. A series of separate sections for each
infrastructure service area reviews
the content for each of the six major
Parts list above.
4. A financing strategy section setting
out the approaches to ensuring that
the appropriate funds are available
and provides multiple alternatives.
5. A Conclusion and Recommendations
section aggregates the AMP findings
into an overall picture and provide
recommendationsCONCLUSION AND RECOMMENDATIONS
SERVICE AREA SECTIONS
State of
Infrastructure
• Asset Hierarchy
• Asset Inventory
• Replacement Value
• Asset Condition
• Estimated Useful life
Levels of
Service (LOS)
• Customers’ Values
• Corporate LOS
• Community LOS
• Technical LOS
Lifecycle
Management
Strategy
• Non-Infrastructure
• Maintain and Operate
• Renew
• Growth
• Service Improvements
• Decommission
Forecasted
Infrastructure Gap
• Required LC activities
• Current Funding
• Addition RV availability
• Funding Gap
Discussion
• Current & Future
Challenges
• 2014 – 2019
AMPs
Conclusions
• Overall
Conclusions
• Current and
Recommended
Annual
Reinvestment
rates
INTRODUCTION
FINANCIAL STRATEGIESAlternative 1 Alternative 2 Alternative 3
• Assessing Capital and Operating
Needs
• Using Debt Effectively
• Apportioning Reserves and Reserve
Fund
• Receiving Third Party
Contributions
• Addressing Infrastructure Gap –
Eliminating vs. Mitigating
Outlines the City’s Vision, Mission, and Values - CAM Program - Alignment with Ontario’s Regulations, - Scope
City of London 2019 Corporate Asset Management Plan 39
Table of Contents Cityscape
Structure of
the AMP
Levels
of
Service
Asset Lifecycle
Management
Strategy
Forecasted
Infrastructure
Gap
Discussion ConclusionsState of Local
Infrastructure
The State of Local Infrastructure part for each Service Area includes the following information:
1. A summary of the inventory of assets that support the services area, including quantities
and replacement costs.
2. An estimate of the replacement value of the assets. Not all of our assets are replaced
(i.e. some are continually rehabilitated), but a replacement value estimate provides a
foundational benchmark to understand the magnitude of the infrastructure that supports
each service area.
3. A summary of the average age and an age distribution as a proportion of estimated useful
life of the assets that support the service area.
4. An overview of the proportion of the current condition of the assets that support each
service area (i.e. % of assets in very good through very poor condition (or not assessed)
weighted by replacement value).
5. A description of the data sources used to populate the State of Local Infrastructure
information, including any relevant condition assessment policies/practices.
Condition ratings were given to every asset using a five-point rating scale as shown in Table 3.1.
A five-point rating scale was used to align with that employed by the National Infrastructure
Report Card produced by the Federation of Canadian Municipalities (FCM), the Canadian
Society for Civil Engineering (CSCE), and the Canadian Construction Association (CCA). In
addition to providing a sound basis for assessment, this will allow us to benchmark the results
against the values presented in this document.
Part 1 – State of Local Infrastructure
Table 3.1 Condition Scale and Definitions
Grade Summary Definition
1Very Good
Fit for the future
The infrastructure in the system or network is generally in very
good condition, typically new or recently rehabilitated. A few
elements show general signs of deterioration that require
attention.
2
Good
Adequate for
now
The infrastructure in the system or network is in good condition;
some elements show general signs of deterioration that require
attention. A few elements exhibit significant deficiencies.
3
Fair
Requires
attention
The infrastructure in the system or network is in fair condition; it
shows general signs of deterioration and requires attention. Some
elements exhibit significant deficiencies.
4Poor
At risk
The infrastructure in the system or network is in poor condition
and mostly below standard, with many elements approaching the
end of their service life. A large portion of the system exhibits
significant deterioration.
5
Very Poor
Unfit for
sustained
service
The infrastructure in the system or network is in unacceptable
condition with widespread signs of advanced deterioration. Many
components in the system exhibit signs of imminent failure, which
is affecting service.
- Not Assessed
This category is reserved for assets where data is either missing,
not updated, or cannot be considered reliable. Flagging his data
helps the departments identify where gaps in information exist and
allows them to develop assessment plans to improve future data
reliability and accuracy.
Service London Counter – Bostwick Centre
Section 3: Overview of Service Area Sections
City of London 2019 Corporate Asset Management Plan 40
Table of Contents Cityscape
Structure of
the AMP
Levels
of
Service
Asset Lifecycle
Management
Strategy
Forecasted
Infrastructure
Gap
Discussion ConclusionsState of Local
Infrastructure
Part 2 – Levels of Service
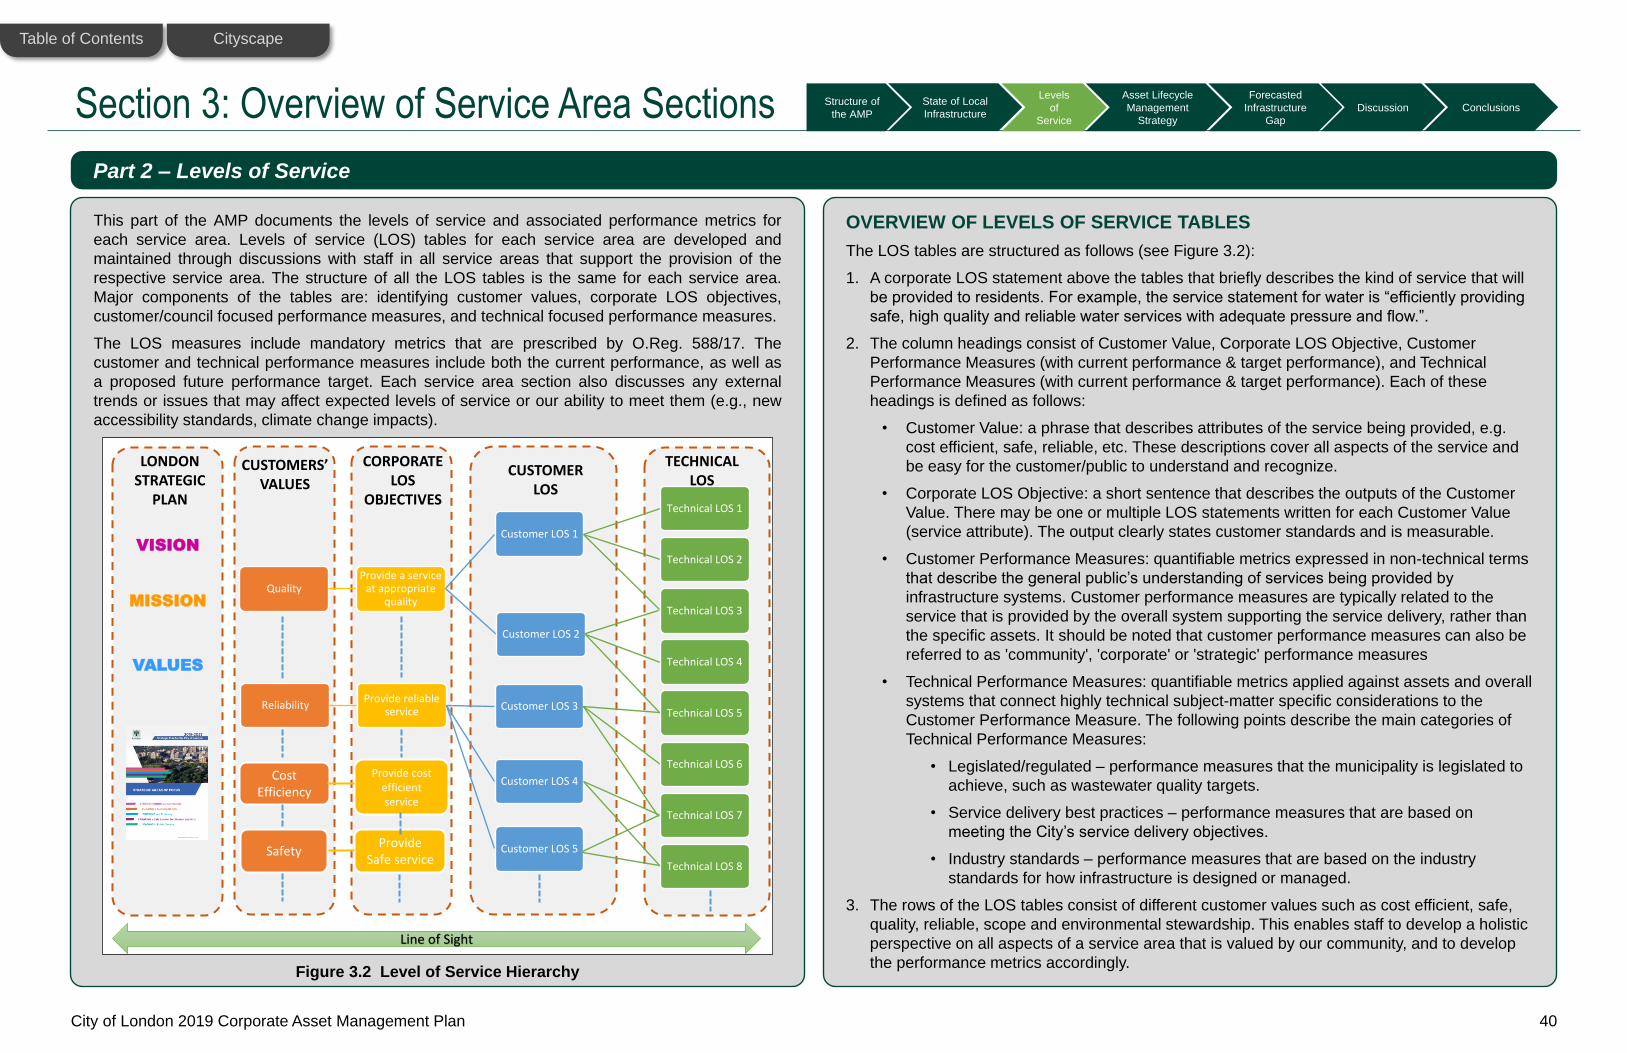
This part of the AMP documents the levels of service and associated performance metrics for
each service area. Levels of service (LOS) tables for each service area are developed and
maintained through discussions with staff in all service areas that support the provision of the
respective service area. The structure of all the LOS tables is the same for each service area.
Major components of the tables are: identifying customer values, corporate LOS objectives,
customer/council focused performance measures, and technical focused performance measures.
The LOS measures include mandatory metrics that are prescribed by O.Reg. 588/17. The
customer and technical performance measures include both the current performance, as well as
a proposed future performance target. Each service area section also discusses any external
trends or issues that may affect expected levels of service or our ability to meet them (e.g., new
accessibility standards, climate change impacts).
OVERVIEW OF LEVELS OF SERVICE TABLES
The LOS tables are structured as follows (see Figure 3.2):
1. A corporate LOS statement above the tables that briefly describes the kind of service that will
be provided to residents. For example, the service statement for water is “efficiently providing
safe, high quality and reliable water services with adequate pressure and flow.”.
2. The column headings consist of Customer Value, Corporate LOS Objective, Customer
Performance Measures (with current performance & target performance), and Technical
Performance Measures (with current performance & target performance). Each of these
headings is defined as follows:
• Customer Value: a phrase that describes attributes of the service being provided, e.g.
cost efficient, safe, reliable, etc. These descriptions cover all aspects of the service and
be easy for the customer/public to understand and recognize.
• Corporate LOS Objective: a short sentence that describes the outputs of the Customer
Value. There may be one or multiple LOS statements written for each Customer Value
(service attribute). The output clearly states customer standards and is measurable.
• Customer Performance Measures: quantifiable metrics expressed in non-technical terms
that describe the general public’s understanding of services being provided by
infrastructure systems. Customer performance measures are typically related to the
service that is provided by the overall system supporting the service delivery, rather than
the specific assets. It should be noted that customer performance measures can also be
referred to as 'community', 'corporate' or 'strategic' performance measures
• Technical Performance Measures: quantifiable metrics applied against assets and overall
systems that connect highly technical subject-matter specific considerations to the
Customer Performance Measure. The following points describe the main categories of
Technical Performance Measures:
• Legislated/regulated – performance measures that the municipality is legislated to
achieve, such as wastewater quality targets.
• Service delivery best practices – performance measures that are based on
meeting the City’s service delivery objectives.
• Industry standards – performance measures that are based on the industry
standards for how infrastructure is designed or managed.
3. The rows of the LOS tables consist of different customer values such as cost efficient, safe,
quality, reliable, scope and environmental stewardship. This enables staff to develop a holistic
perspective on all aspects of a service area that is valued by our community, and to develop
the performance metrics accordingly.Figure 3.2 Level of Service Hierarchy
QualityProvide a service
at appropriate quality
Customer LOS 1
Technical LOS 1
Technical LOS 2
Technical LOS 3
Customer LOS 2
Technical LOS 4
Technical LOS 5Reliability
Provide reliable service Customer LOS 3
Technical LOS 6
Customer LOS 4
Technical LOS 7
Technical LOS 8
Customer LOS 5
CUSTOMERS’ VALUES
CORPORATE LOS
OBJECTIVES
CUSTOMERLOS
TECHNICAL LOS
Line of Sight
Cost Efficiency
Provide cost efficient service
SafetyProvide
Safe service
LONDON STRATEGIC
PLAN
MISSION
VISION
VALUES
Section 3: Overview of Service Area Sections
City of London 2019 Corporate Asset Management Plan 41
Table of Contents Cityscape
Structure of
the AMP
Levels
of
Service
Asset Lifecycle
Management
Strategy
Forecasted
Infrastructure
Gap
Discussion ConclusionsState of Local
Infrastructure
2. The Optimal Budget to maintain the LOS provided by each asset category is forecasted by
analyzing the cost of the lifecycle activities that are required to achieve the ideal condition
profile. Many of the LOS metrics are not feasible to confidently forecast on an individual
basis, and therefore the approach to understand the cost to sustain the current LOS is to
achieve the Ideal Condition Profile over the future 20-year planning horizon. Staff then
consider the optimal blend of each lifecycle activity to achieve the lowest lifecycle cost
management strategy that balances costs and with the forecasted change in the condition
profile of each asset type.
POPULATING THE LEVELS OF SERVICE TABLES
Current Performance: The current performance is identified/calculated for all metrics for which
data is available.
Target Performance: for some metrics a target performance has been established by staff. In
some cases this is a more generic target that uses an up/down arrow, while in others a more
specific target is included. It should be noted that by July 1, 2024 our Amp will be required to
identify targets for each LOS metric that we have identified in our LOS tables.
TRENDING PERFORMANCE
We strive to maintain consistency in our LOS tables. This enables us to complete trending over
time to understand how changing our lifecycle management strategy or expenditure levels are
impacts our LOS metrics.
Part 3 – Asset Lifecycle Management Strategy
The asset lifecycle management strategy is the set of planned actions that will enable the assets
to provide the desired levels of service in a sustainable way, while managing risk, at the lowest
lifecycle cost (e.g., through preventative action). This part of the AMP describes the asset
lifecycle activities applied to the asset category, the optimal budget to achieve the ideal condition
profile to maintain the current LOS, and the condition profile expected from the current budget.
The approach to these three areas is described below.
1. The asset lifecycle management activities are the range of actions funded through the
operating or capital budget that are practiced on the asset category. Asset lifecycle activities
are generally grouped into the categories in Table 2.5. Each service area section also
documents the risks associated with each lifecycle activity.
Lifecycle
ActivityDescription Examples
Non-
Infrastructure
Actions or policies that can lower costs
or extend asset life
Better integrated infrastructure
planning and land use planning,
demand management, process
optimization, managed failures
Maintenance
Regularly scheduled inspection and
maintenance, or more significant repair
and activities associated with
unexpected events
Sewer spot repairs, fixing potholes
RehabilitationSignificant treatments designed to
extend the life of the asset.
Structural lining of sewers, road
resurfacing
Replacement
Activities that are expected to occur
once an asset has reached the end of
its useful life and renewal/ rehabilitation
is no longer an option
Vehicles replacement, road
reconstruction
Disposal
Activities associated with disposing of
an asset once it has reached the end
of its useful life, or is otherwise no
longer needed by the municipality
Salvage of equipment
Growth/Service
Improvement
Planned activities required to extend
services to previously unserviced areas
- or expand services to meet growth
demands
New recreation centre to service
new subdivision
Table 3.2 Typical Asset Lifecycle Activities
Canada Games Aquatic Centre - Wonderland Road N.
Section 3: Overview of Service Area Sections
City of London 2019 Corporate Asset Management Plan 42
Table of Contents Cityscape
Structure of
the AMP
Levels
of
Service
Asset Lifecycle
Management
Strategy
Forecasted
Infrastructure
Gap
Discussion ConclusionsState of Local
Infrastructure
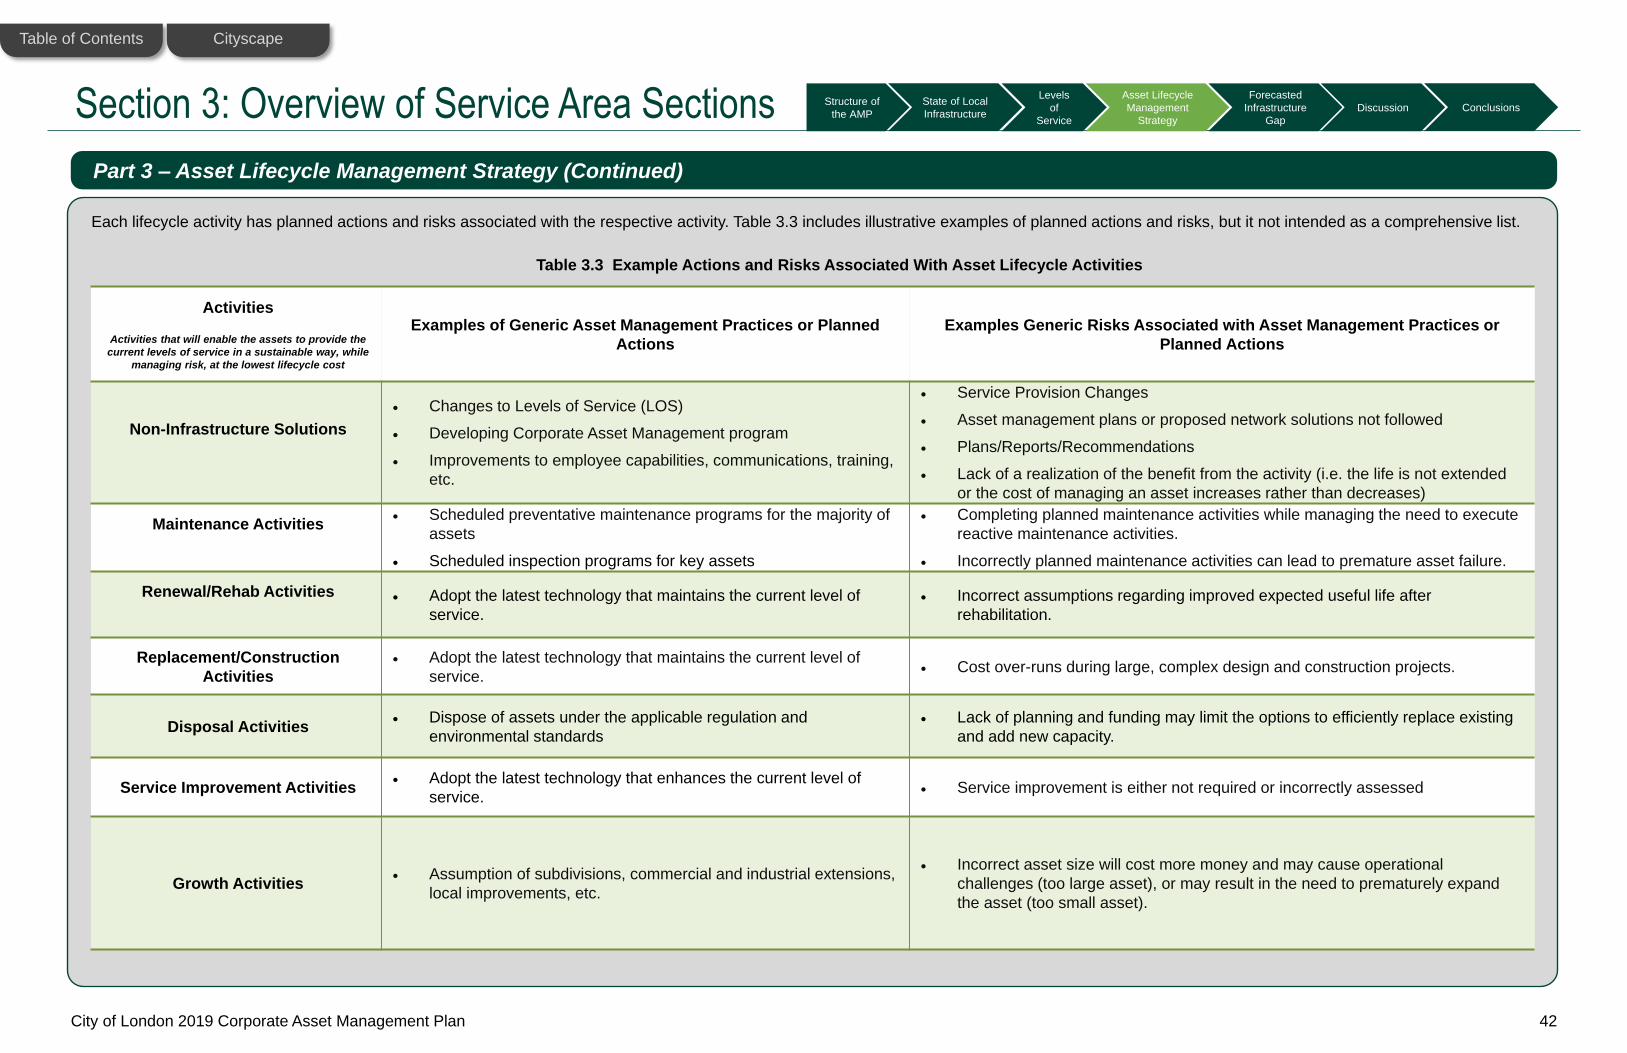
Each lifecycle activity has planned actions and risks associated with the respective activity. Table 3.3 includes illustrative examples of planned actions and risks, but it not intended as a comprehensive list.
Activities
Activities that will enable the assets to provide the
current levels of service in a sustainable way, while
managing risk, at the lowest lifecycle cost
Examples of Generic Asset Management Practices or Planned
Actions
Examples Generic Risks Associated with Asset Management Practices or
Planned Actions
Non-Infrastructure Solutions
Changes to Levels of Service (LOS)
Developing Corporate Asset Management program
Improvements to employee capabilities, communications, training,
etc.
Service Provision Changes
Asset management plans or proposed network solutions not followed
Plans/Reports/Recommendations
Lack of a realization of the benefit from the activity (i.e. the life is not extended
or the cost of managing an asset increases rather than decreases)
Maintenance Activities Scheduled preventative maintenance programs for the majority of
assets
Scheduled inspection programs for key assets
Completing planned maintenance activities while managing the need to execute
reactive maintenance activities.
Incorrectly planned maintenance activities can lead to premature asset failure.
Renewal/Rehab Activities Adopt the latest technology that maintains the current level of
service.
Incorrect assumptions regarding improved expected useful life after
rehabilitation.
Replacement/Construction
Activities
Adopt the latest technology that maintains the current level of
service. Cost over-runs during large, complex design and construction projects.
Disposal Activities Dispose of assets under the applicable regulation and
environmental standards
Lack of planning and funding may limit the options to efficiently replace existing
and add new capacity.
Service Improvement Activities Adopt the latest technology that enhances the current level of
service. Service improvement is either not required or incorrectly assessed
Growth Activities Assumption of subdivisions, commercial and industrial extensions,
local improvements, etc.
Incorrect asset size will cost more money and may cause operational
challenges (too large asset), or may result in the need to prematurely expand
the asset (too small asset).
Part 3 – Asset Lifecycle Management Strategy (Continued)
Table 3.3 Example Actions and Risks Associated With Asset Lifecycle Activities
Section 3: Overview of Service Area Sections
City of London 2019 Corporate Asset Management Plan 43
Table of Contents Cityscape
Structure of
the AMP
Levels
of
Service
Asset Lifecycle
Management
Strategy
Forecasted
Infrastructure
Gap
Discussion ConclusionsState of Local
Infrastructure
The cost of identified Lifecycle activities are summarized in Tables 3.4 and 3.5. Current funding
for operating budgets is presented as the average of the budgeted 2016 and 2017 fiscal years.
Service Improvements activities are analyzed using planned expenditures identified through a
review of the capital budget.
*(Non-infrastructure solutions and maintenance/operating)
** (Rehabilitation, Renewal, Replacement, and Disposal Activities)
Growth activities are based on the approved 2019 DC Background Study.
Table 3.4 Typical Current Lifecycle (Operating and Capital), and Service Improvement
(Capital) Budgets
Part 3 – Asset Lifecycle Management Strategy (Continued)