44


TABLE OF CONTENTS
About the Survey 1
Press Release 3
Perceptions of Higher Education 7
Attitudes and Policy Preferences 17
Regional Map 26
Methodology 27
Questionnaire and Results 29


ABOUT THE SURVEY
The PPIC Statewide Survey series provides policymakers, the media, and the general public with objective, advocacy-free information on the perceptions, opinions, and public policy preferences of California residents. Inaugurated in April 1998, this is the 81st PPIC Statewide Survey in a series that has generated a database that includes the responses of more than 172,000 Californians. The current survey, made possible with funding provided by The William and Flora Hewlett Foundation, is the first PPIC Statewide Survey on the topic of public higher education.
This survey seeks to inform state policymakers, encourage discussion, and raise public awareness about a variety of higher education issues. Higher education in California comprises the third largest spending area of the state budget – over $14 billion. It is guided by a master plan adopted in 1960, which calls for making a college education available to every qualified high school graduate. Currently, 3.5 million students take part in California’s higher education system, which includes the California Community College (CCC) system, California State University (CSU) system, and the University of California (UC) system. These institutions are charged with diverse missions, including providing basic career and life skills, offering postsecondary and graduate instruction, and pursuing research and development to enhance and serve the well-being of the state’s residents as well as advance the state’s economy. Today, higher education faces many challenges, including the state’s rapid population growth, projections on future needs for college-educated workers, the rising costs of a college education, and government funding in the context of state budget constraints.
This survey presents the responses of 2,503 adult residents throughout the state. We asked about the following topics:
Perceptions of California’s public college and university system, including the quality, accessibility, and availability of higher education today; whether changes are needed to improve the higher education system and what most needs improvement; approval ratings of the governor and legislature on their handling of California’s higher education system; perceptions of the adequacy and efficiency of funding for higher education; societal trends in higher education; affordability of higher education; ratings of UC, CSU, and CCC, and general awareness of these institutions and their funding levels; and perceived opportunities for getting a college education across different socioeconomic and demographic groups.
Attitudes and policy preferences, including support for increasing state and federal funding to make California’s higher education system more affordable to students; importance and ratings of California’s community college system for students; adequacy of current state funding levels for higher education and preferences for increasing state funding; importance of higher education to the state’s quality of life and economic well-being in the next 20 years, including the perceived need for college-educated workers; and importance of investment in higher education and confidence in the state’s ability to plan for the future of higher education.
Variations in perceptions, attitudes, and preferences regarding California’s public colleges and universities across the five major regions of the state (Central Valley, San Francisco Bay Area, Los Angeles County, Inland Empire, and Orange/San Diego counties), among Asians, blacks, Latinos, and non-Hispanic whites, across socioeconomic and political groups, and among parents of children age 18 or younger.
Copies of this report may be ordered online (www.ppic.org) or by phone (415-291-4400). For questions about the survey, please contact [email protected]. View our searchable PPIC Statewide Survey database online at http://www.ppic.org/main/survAdvancedSearch.asp.
1


PRESS RELEASE
Para ver este comunicado de prensa en español, por favor visite nuestra página de internet: http://www.ppic.org/main/pressreleaseindex.asp
PPIC STATEWIDE SURVEY: CALIFORNIANS AND HIGHER EDUCATION California’s Higher Education Angst RESIDENTS SEE COLLEGE AS ESSENTIAL BUT ACCESS ELUSIVE, COSTS RISING, AND STATE SYSTEM UNDERFUNDED; PARENTS BEHIND IN COLLEGE SAVINGS FOR CHILDREN
SAN FRANCISCO, California, October 31, 2007 — Most Californians believe that a college education is necessary for individual success, but they also believe it is out of reach for many—including a large proportion of people who are highly qualified and motivated. And the implications for the state’s future seem clear to them, according to a survey released today by the Public Policy Institute of California (PPIC) with funding from The William and Flora Hewlett Foundation.
Nearly two-thirds (64%) of Californians say a person must have a college education to succeed in today’s workplace; only about one-third (34%) say there are other ways to succeed. Nationally, the stakes evidently don’t seem as high: Half of U.S. adults (50%) say college is necessary, but half (49%) say there are other paths to success (Public Agenda/National Center for Public Policy and Higher Education, 2007). In Californians’ minds, the state’s economic vitality is also closely tied to higher education, with three-fourths (76%) calling the state’s college system “very important” to California’s future. This reflects the belief of most residents (68%) that the state’s economy will need a higher percentage of college-educated workers in 20 years.
In disconcerting contrast, over half (56%) of Californians think that getting a college education is more difficult than it was 10 years ago. And a strong majority (65%) say that many residents who are qualified don’t have the opportunity to attend college. Pluralities across demographic groups think California will suffer from a shortage of college-educated workers in the future. “This makes for a high-anxiety issue,” says PPIC president and CEO Mark Baldassare. “People are saying that the very thing they need to be successful, that their children need to be successful, and that the state needs to be successful, may not be attainable.”
COLLEGE CONUNDRUM: AFFORDING ACCESS…
The pessimistic attitudes seem related to questions of accessibility—specifically in terms of cost. An overwhelming share (84%) of residents say that affording college is at least somewhat of a problem for students today, with 53 percent calling it a big problem. In fact, two-thirds of adults think that the cost of college prevents qualified, motivated students from pursuing higher education. Student costs, tuition, and fees are most often cited (35%) as the number one problem facing the state’s public colleges, far outpacing other issues (not enough government funding 14%, immigrants 6%, administrative costs/salaries/waste 5%).
Californians also think the price of college is outpacing other costs: Six in ten (61%) adults – and the same share of parents with children age 18 or under – say college prices are going up faster than prices of other things. This perception is reflected in the clear-cut anxiety among parents with children age 18 or under: Forty-three percent say they are very worried and 32 percent say they are somewhat worried about being able to afford college for their youngest child. Across most of the survey’s affordability questions,
3
Californians and Higher Education
parents are more anxious than residents overall. Still, nine in ten California parents hope their child will be a college graduate.
Perceptions on affordability also differ – sometimes sharply – between people of various income levels. For example, when it comes to whether cost prevents qualified students from going to college, those households making under $40,000 a year are far more likely to believe it does than those making $80,000 or more a year (75% and 56%, respectively). Racial and ethnic differences also emerge: Latino parents (53%) are far more likely than white parents (35%) to be very worried about affording a college education for their youngest child.
… AND GETTING ACCESS
The survey also reveals stark differences across demographic groups in attitudes about the broader opportunity to attend college. Sixty percent of all adults say accessibility to higher education is at least somewhat of a problem, but whites (56%) are much less likely than blacks (67%) to hold this view. When asked if the vast majority of people who are qualified to go to college have the opportunity to do so, 42 percent of Asians and 40 percent of whites say yes, while 82 percent of Latinos and 75 percent of blacks say no.
One of the widest racial and ethnic chasms emerges over whether qualified minority students have more or less opportunity to attend college: Most blacks (62%), Latinos (53%), and Asians (46%) believe they have less opportunity, while only about one-quarter (28%) of whites agree. This question also elicits different responses from different income groups; for example, households making under $40,000 are more likely (45%) than those making over $80,000 (34%) to say minority students have less opportunity.
Generally, Californians are more likely to believe low-income students, regardless of their ethnic background, have less opportunity (58%) than qualified students of a particular ethnic or minority group (39%) to go to college.
MONEY IN THE BANK… OR NOT?
Adding to angst over the accessibility and affordability of college, seven in ten (71%) do not believe families do a good job of saving for their children’s education today – a view shared by most parents with children age 18 or under (68%). In fact, parents with children age 18 or under are dissatisfied with their progress. Over half (55%) say they are behind where they should be, while only 9 percent say they are ahead, and one-third (33%) say they are at the right point. Lower (67%) and middle-income (64%) parents are much more likely than higher-income (43%) parents to say they are behind in their child’s college savings. Indeed, only one in four parents with incomes under $40,000 (25%) and incomes between $40,000 and $80,000 (28%) say they are about where they should be in their savings. Scant numbers in either bracket say they are ahead.
“There’s a real disconnect here – parents overwhelmingly think college is necessary for success, want their own child to go to college, are clearly worried about being able to afford college, yet don’t – or can’t – save at the rate they think they should,” says Baldassare.
A MATTER OF QUALITY: HIGHER EDUCATION BESTS K-12
While many Californians may question the accessibility and affordability of college, they are largely pleased with the job that the state systems of higher education are doing. Two-thirds say that the California Community College system (66%), the California State University system (66%), and the University of California system (67%) are doing good or excellent jobs. Ratings among likely voters and parents are similar or slightly higher.
4 PPIC Statewide Survey

Press Release
Residents give much higher quality ratings to higher education than to K-12 education in California. Only 18 percent of adults and 16 percent of parents with children age 18 or under think the quality of education in California’s public colleges is a big problem. When the PPIC Statewide Survey asked this same question about the K-12 system in April 2007, about half (52%) of adults said education quality was a big problem. Looked at another way, substantial shares of adults (43%) say education quality is not much of a problem in colleges, but only 15 percent of adults said the same about the K-12 system.
Higher levels of satisfaction don’t, however, prevent residents from seeing room for improvement. Close to half (45%) say the state’s higher education system needs minor changes, and four in 10 (39%) say it needs major changes. The latter number seems directly linked to affordability: Seventy percent of those who believe major changes are needed also say affordability is a big problem.
FAILING GRADES FOR GOVERNMENT, STATE LEADERS; FOLLOW THE FUNDING
Although they believe changes are needed, Californians aren’t putting much stock in the state government’s ability to make those changes. More than eight in ten (85%) adults and nearly nine in ten (88%) likely voters say they have only some, very little, or no confidence in the state government’s ability to plan for the future of higher education. Consistent with that judgment, both Governor Schwarzenegger and the state legislature receive low approval ratings when it comes to their handling of public colleges and universities (all adults 34% and 29%, likely voters 37% and 26%, respectively). For the governor, this is much lower than his overall approval ratings (51% adults, 59% likely voters).
What would improve public opinion about the state’s handling of higher education? More and better managed funding may be one way. Majorities of adults (57%) and likely voters (55%) do not think the current level of funding for higher education is high enough. Almost identical majorities (57% adults, 54% likely voters) would support spending more state money to keep college tuition and fees down, even if it meant less money for other programs. “In past PPIC surveys, higher education has ranked relatively high on the public’s list of funding priorities,” says Baldassare. However, when asked how to improve the system, half of adults (50%) and likely voters (51%) favor a combination of both increased funding and a better use of existing funds—only 9 percent of adults favored increasing state funding alone.
If the issue of increased funding did make it to the state ballot, success would depend on who’s footing the bill. A strong majority (62%) of likely voters say they would support raising the income tax paid by the wealthiest Californians; an even stronger majority (73%) would oppose raising the state sales tax to provide additional funding for higher education. And the ever-popular bond approach? If a bond measure appeared on the 2008 ballot to pay for construction projects in the higher education system, 56 percent of likely voters would support it.
A LITTLE KNOWLEDGE…
Are Californians basing their policy and other judgments about the state’s higher education system on accurate information? Partly. Almost six in 10 (57%) residents correctly identified the University of California system as the branch of higher education with the steepest tuition and fees. A significant share (42%) also correctly named the California Community College system as the branch that enrolls the most students. But on one key question – which branch receives the most per student funding from the government – there were far more “don’t knows” (44%) than correct answers of the University of California (22%). Similar numbers of residents erroneously believe that the California State University system (18%) and the California Community College system (16%) receive the most per student funding from the state government.
October 2007 5

Californians and Higher Education
6 PPIC Statewide Survey
MORE KEY FINDINGS
Latinos’ college focus — Page 14 Of all racial and ethnic groups, Latinos are the most likely (79%) to say a college education is necessary for success in the workplace. In comparison, only 55 percent of whites say the same.
Drowning in debt — Page 18 Three in four residents (74%) believe students today have to take on too much debt in student loans to pay for their college education.
Community colleges crucial… — Page 21 Huge majorities of Californians say it is very important to them that the state’s community colleges include career technical or vocational education (76%) and prepare students to transfer to four-year institutions (81%).
… And doing a good job… — Page 21 Seven in ten state residents say community colleges are doing a good or excellent job in career technical training (70%), and a good or excellent job in preparing students to transfer to four -year colleges (71%).
Worth it and worthy… — Page 35 A whopping 92 percent of Californians who have attended college think that getting a higher education was money and time well spent. And in a nod to the state’s system, 82 percent would recommend one of the California’s public colleges or universities to a friend or family member.
ABOUT THE SURVEY
This edition of the PPIC Statewide Survey is the first to focus on the topic of public higher education. It is supported by funding from The William and Flora Hewlett Foundation. This survey is intended to raise public awareness, inform decisionmakers, and stimulate public discussions about Californians’ attitudes toward a variety of higher education issues. Findings are based on a telephone survey of 2,503 California adult residents interviewed between October 10 and 23, 2007. Interviews were conducted in English, Spanish, Mandarin, Cantonese, Vietnamese, and Korean. The sampling error for the total sample is +/- 2%. The sampling error for subgroups is larger. For more information on methodology, see page 27.
Mark Baldassare is president and CEO of PPIC, where he holds the Arjay and Frances Fearing Miller Chair in Public Policy. He is founder of the PPIC Statewide Survey, which he has directed since 1998.
PPIC is a private, nonprofit organization dedicated to informing and improving public policy in California through independent, objective, nonpartisan research on major economic, social, and political issues. The institute was established in 1994 with an endowment from William R. Hewlett. PPIC does not take or support positions on any ballot measure or on any local, state, or federal legislation, nor does it endorse, support, or oppose any political parties or candidates for public office.
This report will appear on PPIC’s website (www.ppic.org) after 10 p.m. on October 31.
###

PERCEPTIONS OF HIGHER EDUCATION
52
18
2834
15
43
0
20
40
60
80
K-12* Higher Education
Per
cent
all
adul
ts
Big problem
Somewhat of a problem
Not much of a problem
Quality of Education in California?
*PPIC, April 2007
46
32
48
65
0
20
40
60
80
California 2000* California 2007
Per
cent
all
adul
ts
Majority have the opportunity
Many don't have the opportunity
Access to Higher Education
*Public Agenda/National Center, 2000
50
64
49
34
0
20
40
60
80
United States* California
Per
cent
all
adul
ts
College is necessaryMany other ways to succeed
Is a College Education Necessary?
*Public Agenda/National Center, 2007
KEY FINDINGS
Student costs and affordability (35%) top the list of the most important issues facing California’s public colleges and universities in all demographic, racial/ethnic, political, and regional groups. (page 8)
Half of Californians (53%) say affordability is a big problem, 24 percent perceive accessibility as a big problem, but just 18 percent think educational quality is a big problem in California’s public colleges and universities today. Over eight in 10 residents say that changes (39% major, 45% minor) are needed in California’s higher education system. (pages 9, 10)
Six in 10 likely voters approve of the governor’s overall job performance, but they are divided on his handling of the state’s higher education system. Half of likely voters disapprove of the legislature, both overall and in its handling of the state’s higher education system. (page 11)
Solid majorities of Californians across demographic, political, and regional groups give positive ratings to the state’s three higher education systems, but many lack knowledge about relative costs, funding, and student population sizes. (pages 12, 13)
Most residents think that a college education is necessary for work success (64%), but that getting a college education has become more difficult (56%), college prices are going up at a faster rate than other things (61%), and many who are qualified to go to college don’t have the opportunity (65%). (pages 14, 15)
One in 10 say that more spending alone will improve higher education, while half say that both more funding and better use of existing funding is needed. (page 16)
7

Californians and Higher Education
MOST IMPORTANT ISSUE
When asked to name the most important issue facing California’s public colleges and universities today, costs and affordability are first on the list (35%), followed by not enough government funding (14%). Fewer than one in 10 adults say immigrants (6%), or administrative costs, salaries, and waste (5%), or name any other issue as their top concern.
Student cost is the top issue named by residents in all political and demographic groups. Democrats (42%) are more likely than independents (35%) or Republicans (34%) to name student cost. Blacks (50%) are more likely than other racial/ethnic groups and women (40%) are more likely than men (30%) to name student cost. One in three parents of children age 18 or younger (35%) cite student cost as the most important issue, while 13 percent say not enough government funding.
Men (17%) are more likely than women (11%) to say that not enough government funding is the most important issue. Government funding is also more likely to be named by college graduates (18%) than by those with some college (12%) or a high school education (10%). Latinos (11%) are more likely than those in other racial/ethnic groups, and Republicans (9%) are more likely than other voter groups, to name immigrants as the most important issue.
“What do you think is the most important issue facing California’s public colleges and universities today?”
Issues mentioned by at least 5% of all adults Student costs, affordability, tuition, fees
Not enough government
funding Immigrants
Administrative costs, salaries,
waste
All Adults 35% 14% 6% 5%
Likely Voters 40 15 5 5
Democrat 42 16 4 5
Republican 34 13 9 5 Party
Independent 35 14 5 5
Asians 36 12 3 3
Blacks 50 12 2 1
Latinos 26 11 11 5 Race/Ethnicity
Whites 39 15 5 5
Men 30 17 7 6 Gender
Women 40 11 6 4
18-34 35 14 6 4
35-54 36 13 7 5 Age
55 and older 33 14 6 5
Under $40,000 28 13 9 5
$40,000 to under $80,000 43 13 5 3 Income
$80,000 or more 38 15 5 6
HS or less 26 10 10 5
Some college 42 12 4 4 Education
College graduate 37 18 4 5
Parents of Children Age 18 or Younger 35 13 8 4
8 PPIC Statewide Survey

Perceptions of Higher Education
OVERALL CONDITIONS
When asked about the overall condition of three aspects of California’s public colleges and universities today, Californians are much more likely to cite the affordability of education (53%) as a big problem for students than to name the accessibility (24%) or the quality (18%) of education as a big problem.
Over eight in 10 Californians view overall affordability as a big (53%) or somewhat of a problem (31%). Parents of children age 18 or younger hold similar views. Those with a household income of $80,000 or more are less likely than those with lower incomes to say affordability is a big problem.
Democrats (62%) are more likely than independents (52%) and Republicans (45%) to perceive that affordability is a big problem. Women (57%) are more likely than men (50%) to hold this view. Across regions, residents of Orange/San Diego counties (44%) are less likely than others to view affordability as a big problem. Blacks (69%) are more likely than Latinos (59%), whites (51%), and especially Asians (37%) to say that affordability is a big problem today.
“How about the overall affordability of education for students in California’s public colleges and universities today?”
Income All Adults
Less than $40,000 $40,000 to under $80,000
$80,000 or more
Parents of Children Age
18 or Younger
Big problem 53% 57% 57% 48% 54%
Somewhat of a problem 31 29 29 33 30
Not much of a problem 14 11 13 18 14
Don't know 2 3 1 1 2
Six in 10 Californians think overall accessibility is a big problem (24%) or somewhat of a problem (36%). Parents of children age 18 or younger hold similar views. Blacks (33%) and Latinos (28%) are more likely than whites (21%) and Asians (18%) to see accessibility as a big problem. Women (28%) are more likely than men (20%) to hold this view.
Democrats (27%) and independents (24%) are more likely than Republicans (18%) to say accessibility is a big problem for students. Residents in the Central Valley and Orange/San Diego counties (20% each) are less likely than others to say it is a big problem. The belief that accessibility is a big problem increases with age, but decreases with higher education and income.
“How about the overall accessibility of education for students in California’s public colleges and universities today?”
Race/Ethnicity All Adults
Asians Blacks Latinos Whites
Parents of Children Age
18 or Younger
Big problem 24% 18% 33% 28% 21% 23%
Somewhat of a problem 36 38 34 38 35 38
Not much of a problem 37 40 31 31 40 37
Don't know 3 4 2 3 4 2
October 2007 9

Californians and Higher Education
OVERALL CONDITIONS (CONTINUED)
About half of Californians view the overall quality of education in California’s public colleges and universities as a big (18%) or somewhat of a problem (34%). Parents of children age 18 or younger hold similar views. College graduates (13%) are less likely than others to say quality is a big problem. Men (17%) and women (18%) hold similar views on this issue. Blacks (25%) are more likely than other racial/ethnic groups to say the quality of public higher education is a big problem.
Fewer than one in five Democrats (16%), independents (17%), or Republicans (18%) say quality is a big problem. Across regions, one in five or fewer say it is a big problem. This belief declines with higher income. Views are similar among those who have attended a California public college or university and those who have not.
“How about the overall quality of education in California’s public colleges and universities today?”
Over eight in 10 Californians say that the higher education system in California needs major (39%) or minor changes (45%), while only 12 percent say it is fine the way it is. Across racial/ethnic groups, Latinos (53%) and blacks (41%) are more likely than whites (31%) and Asians (26%) to say that major changes are needed. Across age groups, about four in 10 residents say major changes are needed.
Over eight in 10 parents of children age 18 or younger believe that major (41%) or minor changes (44%) are needed. Democrats (40%) are more likely than independents (35%) and Republicans (30%) to say that major changes are needed. The belief that major changes are needed is greater among women (43%) than men (35%) and decreases as education and income increase.
Of those who say that major changes are needed in California’s higher education system, 70 percent say that affordability is a big problem, 42 percent say accessibility is a big problem, and 34 percent say that quality is a big problem.
“Overall, do you think the higher education system in California—including public colleges and universities—is in need of major changes, minor changes, or that it is basically fine the way it is?”
Education All Adults
HS or less Some College College Grad
Parents of Children Age
18 or Younger
Big problem 18% 22% 18% 13% 16%
Somewhat of a problem 34 35 36 31 34
Not much of a problem 43 36 41 51 45
Don't know 5 7 5 5 5
Race/Ethnicity All Adults
Asians Blacks Latinos Whites
Parents of Children Age
18 or Younger
Major changes 39% 26% 41% 53% 31% 41%
Minor changes 45 51 50 31 53 44
Fine the way it is 12 15 7 13 12 12
Don't know 4 8 2 3 4 3
10 PPIC Statewide Survey

Perceptions of Higher Education
ELECTED OFFICIALS’ APPROVAL RATINGS
Today, half of Californians (51%) and six in 10 likely voters (59%) approve of the way Governor Schwarzenegger is handling his job overall. Since January, his ratings have declined somewhat among all adults (58% to 51%), but they have remained similar among likely voters (61% to 59%). Seven in 10 Republicans (69%) and 56 percent of independents approve, while Democrats are divided (46% approve, 43% disapprove). Residents of Orange/San Diego counties (59%) are the most approving, followed by those in the Central Valley (55%), the Inland Empire (53%), the San Francisco Bay Area (53%), and Los Angeles (43%). Asians (64%) and whites (61%) are more approving than blacks (40%) and Latinos (34%).
When asked about the governor’s handling of California’s public college and university system, the approval ratings are mixed among all adults (34% approve, 39% disapprove) and likely voters (37% approve, 37% disapprove). Significant percentages of Californians have no opinion of his handling of this issue. About half of Republicans (51%) approve, compared to 33 percent of independents and 25 percent of Democrats. Fewer than four in 10 residents across regions approve of the governor on this issue. Asians (43%) and whites (38%) are more approving than Latinos and blacks (27% each).
“Overall, do you approve or disapprove of the way that Arnold Schwarzenegger is handling…”
Approval ratings of the state legislature are not as positive as the governor’s ratings. Only one in three residents (33%) and likely voters (32%) approve of the way the legislature is handling its job. Since January, the legislature’s approval ratings have declined somewhat among all adults (40% to 33%) and likely voters (37% to 32%). Democrats (36%) and independents (35%) are more approving than Republicans (26%). Roughly one in three across regions approve of the legislature. On the issue of handling California’s public college and university system, fewer than three in 10 residents (29%) and likely voters (26%) approve, and fewer than three in ten across parties approve. Again, significant percentages have no opinion regarding the legislature’s handling of public colleges and universities.
“Overall, do you approve or disapprove of the way that the California Legislature is handling…”
Party
All Adults Dem Rep Ind
Likely Voters
Approve 33% 36% 26% 35% 32%
Disapprove 50 48 60 51 54 … its job?
Don't know 17 16 14 14 14
Approve 29 26 26 29 26
Disapprove 47 54 44 48 49
… California’s public college and university system?
Don't know 24 20 30 23 25
Party
All Adults Dem Rep Ind
Likely Voters
Approve 51% 46% 69% 56% 59%
Disapprove 37 43 23 32 32 … his job as governor of California?
Don't know 12 11 8 12 9
Approve 34 25 51 33 37
Disapprove 39 50 21 38 37
… California’s public college and university system?
Don't know 27 25 28 29 26
October 2007 11

Californians and Higher Education
INSTITUTIONAL KNOWLEDGE
How familiar are Californians with some of the basic facts about the three branches of California’s public college and university system? Today, the University of California (UC) system has the highest state tuition of the three systems, followed by the California State University (CSU) system and the California Community College (CCC) system. About six in 10 Californians (57%) correctly identify the UC system as having the highest state tuition and fees, while about one in four are unsure.
In recent years, the CCC system has had the highest enrollment, followed by the CSU system and the UC system. When asked which system has the most students enrolled, four in 10 Californians (42%) correctly identify the CCC system, while about three in 10 (28%) are unsure.
Today, the UC system has the highest dollar amount of per student funding from the state government, but only 22 percent of Californians correctly name the UC system, while 44 percent are unsure.
“Do you happen to know which branch has the…”
INSTITUTIONAL RATINGS
California’s public colleges and universities receive positive marks from many Californians. Two in three Californians say that the CCC system (66%), the CSU system (66%), and the UC system (67%) are doing an excellent or good job overall. Far fewer Californians give each branch a not so good or poor rating, while relatively few (i.e., between 8% and 13%) say they don’t know.
“Overall, is the _____________ doing an excellent, good, not so good, or poor job?”
…highest state tuition and fees?
…most students enrolled?
…highest dollar amount of per student funding from the state
government?
California Community College system 4% 42% 16%
California State University system 16 21 18
University of California system 57 9 22
Don't know 23 28 44
California Community College system California State University system University of California system
Excellent 14% 9% 15%
Good 52 57 52
Not so good 21 18 17
Poor 5 3 4
Don't know 8 13 12
The CCC system receives high marks from all Californians (66%), parents of children age 18 or younger (68%), and likely voters (70%). Across regions, residents in Orange/San Diego counties (72%) and the San Francisco Bay Area (70%) give the most positive assessment, while residents in Los Angeles (60%) are the least positive. Across political groups, Republicans (74%) are more likely than Democrats (66%) and independents (65%) to give positive ratings. Whites (72%) and Asians (64%) are more likely than Latinos (60%) and blacks (56%) to offer an excellent or good rating. Positive assessments of the CCC system increase with higher education and income. At least eight in 10 Californians who give positive reviews to the UC or the CSU system give the CCC system high marks as well.
12 PPIC Statewide Survey

Perceptions of Higher Education
INSTITUTIONAL RATINGS (CONTINUED)
The CSU system also receives high marks. Two in three Californians (66%), 69 percent of parents of children age 18 or younger, and 70 percent of likely voters give excellent or good ratings to the CSU system. Asians (74%), whites (69%), and Latinos (64%) are more likely than blacks (54%) to give positive marks. Across regions, over six in 10 give positive assessments, as do about seven in 10 across parties. Men (69%) are somewhat more likely than women (64%) to give positive marks, and CSU ratings rise as education and income increase. Once again, a large majority of Californians who give positive reviews to the CCC or the UC system also give the CSU system high marks.
Finally, the UC system receives positive ratings from a strong majority of all Californians (67%), parents of children age 18 or younger (71%), and likely voters (71%). Asians (81%) are more likely than whites (69%), Latinos (64%), or blacks (55%) to offer positive assessments. Across regions, residents of Orange/San Diego counties (73%) and the San Francisco Bay Area (72%) are most likely to give positive ratings; however, six in 10 in the other regions also offer positive assessments. Majorities across parties give high marks to the UC system, with Democrats (73%) more likely than Republicans (68%) and independents (64%) to do so. Excellent or good ratings of the UC system rise as education and income increase. Again, more than eight in 10 residents who give positive assessments to the CCC or the CSU system also give positive marks to the UC system.
“Overall, is the _____________ doing an excellent, good, not so good, or poor job?”
% saying excellent/good California Community College system
California State University system
University of California system
All Adults 66% 66% 67%
Likely Voters 70 70 71
Asians 64 74 81
Blacks 56 54 55
Latinos 60 64 64 Race/Ethnicity
Whites 72 69 69
Central Valley 66 67 65
San Francisco Bay Area 70 68 72
Los Angeles 60 62 62
Orange/San Diego 72 69 73
Region
Inland Empire 67 68 65
Less than $40,000 60 60 61
$40,000 to under $80,000 73 69 69 Income
$80,000 or more 70 76 76
HS or less 62 60 59
Some college 67 66 64 Education
College graduate 70 74 78
Parents of Children Age 18 or Younger 68 69 71
October 2007 13

Californians and Higher Education
SOCIETAL TRENDS IN HIGHER EDUCATION
Over six in 10 California residents (64%) and likely voters (61%) believe a college education is necessary to succeed in today’s work world, while 34 percent of residents and 38 percent of likely voters believe there are many ways to succeed in the work world without a college education. In a survey conducted in 1996 by Public Agenda and the California Higher Education Policy Center (“Public Agenda/CHEPC”), California residents expressed nearly identical attitudes in a similar question (64% necessary, 32% not necessary). Today, Californians are much more likely than adults nationwide to believe in the necessity of a college education: A survey conducted this year by Public Agenda and the National Center for Public Policy and Higher Education (“Public Agenda/National Center”), found that adults nationwide are divided on the issue (50% necessary, 49% other ways to succeed).
Still, not all Californians place equal importance on a college education. For instance, Latinos (79%) are the most likely to believe college is essential, followed by Asians (72%), blacks (68%), and whites (55%). Foreign-born adults are far more likely than U.S.-born adults (81% to 57%), and parents of children age 18 or younger are far more likely than others (71% to 59%), to place high importance on college education. Two in three Democrats (68%) and independents (67%) think college is necessary, while 53 percent of Republicans do. The belief in the necessity of a college education is held by over six in 10 adults across education and income groups and is higher among adults under 55 (68%) than older adults (56%).
“Do you think that a college education is necessary for a person to be successful in today’s work world, or do you think that there are many ways to succeed in today’s work world without a college education?”
While most Californians believe college is essential to success in today’s work world, over half (56%) say getting a college education today is more difficult than it was 10 years ago. Another 24 percent say it is about as difficult as it was 10 years ago, while just 13 percent say it is less difficult today. In 1996, a similar proportion of California residents (54%) believed that it was more difficult to get a college education at that time than it was 10 years prior, according to the Public Agenda/CHEPC survey. Today, blacks and Latinos (68% each) are far more likely than whites (50%) or Asians (48%) to express this view. Lower-income residents, those with less education, and parents of children age 18 or younger are more likely than others to agree. Over six in 10 Democrats (63%) believe this, compared to 50 percent of independents and 46 percent of Republicans. Among those who say college is necessary in today’s work world, 61 percent say it has become more difficult to get a college education today.
“In your view, has getting a college education become more difficult than it was 10 years ago, less difficult than it was 10 years ago, or is it about as difficult as it was 10 years ago?”
Race/Ethnicity
All Adults Asians Blacks Latinos Whites
Parents of Children Age
18 or Younger
College is necessary 64% 72% 68% 79% 55% 71%
Many other ways to succeed 34 27 32 20 43 28
Don't know 2 1 - 1 2 1
Race/Ethnicity All
Adults Asians Blacks Latinos Whites
Parents of Children Age
18 or Younger
More difficult 56% 48% 68% 68% 50% 60%
Less difficult 13 17 9 13 12 13
About as difficult 24 21 14 15 31 22
Don't know 7 14 9 4 7 5
14 PPIC Statewide Survey
Perceptions of Higher Education
SOCIETAL TRENDS IN HIGHER EDUCATION (CONTINUED)
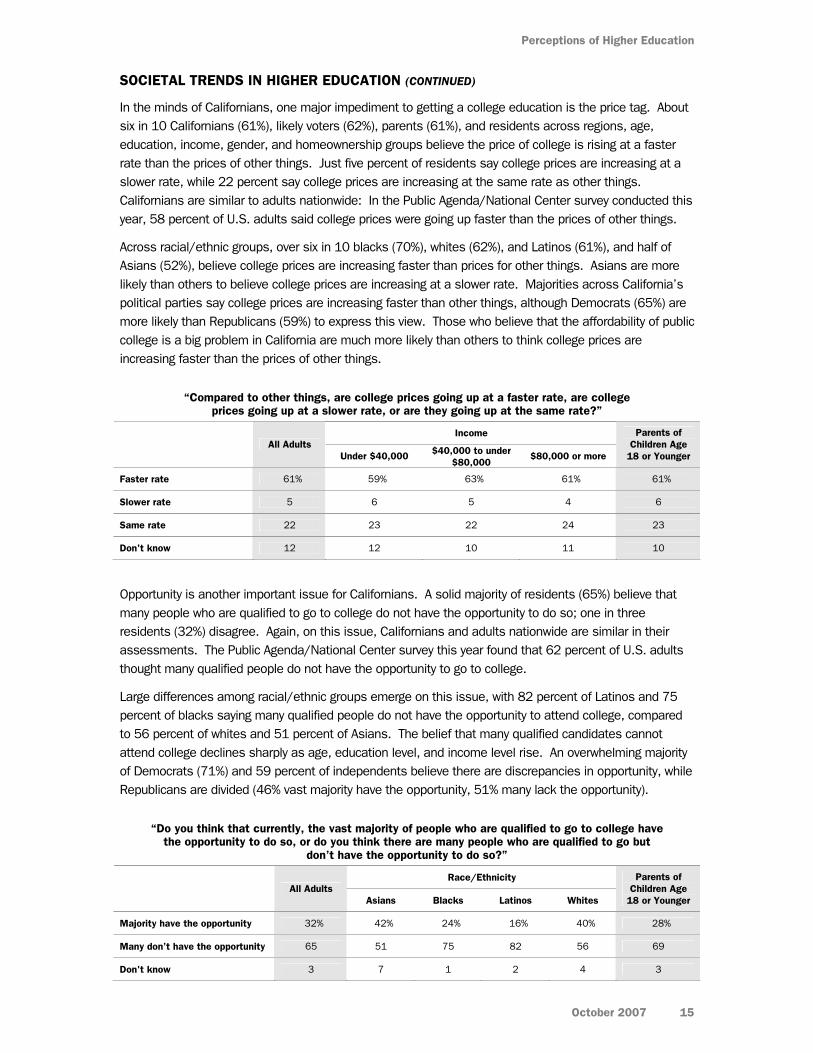
In the minds of Californians, one major impediment to getting a college education is the price tag. About six in 10 Californians (61%), likely voters (62%), parents (61%), and residents across regions, age, education, income, gender, and homeownership groups believe the price of college is rising at a faster rate than the prices of other things. Just five percent of residents say college prices are increasing at a slower rate, while 22 percent say college prices are increasing at the same rate as other things. Californians are similar to adults nationwide: In the Public Agenda/National Center survey conducted this year, 58 percent of U.S. adults said college prices were going up faster than the prices of other things.
Across racial/ethnic groups, over six in 10 blacks (70%), whites (62%), and Latinos (61%), and half of Asians (52%), believe college prices are increasing faster than prices for other things. Asians are more likely than others to believe college prices are increasing at a slower rate. Majorities across California’s political parties say college prices are increasing faster than other things, although Democrats (65%) are more likely than Republicans (59%) to express this view. Those who believe that the affordability of public college is a big problem in California are much more likely than others to think college prices are increasing faster than the prices of other things.
“Compared to other things, are college prices going up at a faster rate, are college prices going up at a slower rate, or are they going up at the same rate?”
Opportunity is another important issue for Californians. A solid majority of residents (65%) believe that many people who are qualified to go to college do not have the opportunity to do so; one in three residents (32%) disagree. Again, on this issue, Californians and adults nationwide are similar in their assessments. The Public Agenda/National Center survey this year found that 62 percent of U.S. adults thought many qualified people do not have the opportunity to go to college.
Large differences among racial/ethnic groups emerge on this issue, with 82 percent of Latinos and 75 percent of blacks saying many qualified people do not have the opportunity to attend college, compared to 56 percent of whites and 51 percent of Asians. The belief that many qualified candidates cannot attend college declines sharply as age, education level, and income level rise. An overwhelming majority of Democrats (71%) and 59 percent of independents believe there are discrepancies in opportunity, while Republicans are divided (46% vast majority have the opportunity, 51% many lack the opportunity).
“Do you think that currently, the vast majority of people who are qualified to go to college have the opportunity to do so, or do you think there are many people who are qualified to go but
don’t have the opportunity to do so?”
Income All Adults
Under $40,000 $40,000 to under $80,000
$80,000 or more
Parents of Children Age
18 or Younger
Faster rate 61% 59% 63% 61% 61%
Slower rate 5 6 5 4 6
Same rate 22 23 22 24 23
Don't know 12 12 10 11 10
Race/Ethnicity All Adults
Asians Blacks Latinos Whites
Parents of Children Age
18 or Younger
Majority have the opportunity 32% 42% 24% 16% 40% 28%
Many don’t have the opportunity 65 51 75 82 56 69
Don't know 3 7 1 2 4 3
October 2007 15

Californians and Higher Education
16 PPIC Statewide Survey
ADEQUACY AND EFFICIENCY OF STATE FUNDING
When residents are asked what they think would lead to positive changes in California’s higher education system, most agree that additional state funding would lead to major improvements (69%) and that better use of existing state funds would lead to major improvements (83%). When asked to choose among these approaches and a combination of the two, 50 percent choose a combination of the two, 39 percent choose better fiscal management, and just 9 percent choose increasing state funds. When a similar question was asked about the state’s K-12 public education system in PPIC’s April survey, residents gave similar responses: 48 percent chose a dual approach, 37 percent said better fiscal management, and 11 percent said additional funding.
Across political parties today, a solid majority of Democrats (62%) and about half of independents (53%) believe a combined approach is needed to improve California’s higher education system. A majority of Republicans (58%) believe that existing state funds need to be used more wisely. About half of parents of children age 18 or younger and residents across regional, gender, and income groups believe improvements will result from a dual approach. Pluralities in other demographic groups express the same viewpoint. This perception increases with higher education and decreases with age. Blacks (59%) are more likely than whites (51%), Asians (50%), or Latinos (48%) to believe the dual approach would work best. Among any demographic or political group, additional funding alone is the least popular approach for significantly improving the higher education system.
“To significantly improve California’s higher education system, which of the following statements do you agree with the most? (1) We need to use existing state funds more
wisely, (2) We need to increase the amount of state funding, or (3) We need to use existing state funds more wisely and increase the amount of state funding.”
Use funds more wisely
Increase state funding
Both Don't know
All Adults 39% 9% 50% 2%
Likely Voters 42 6 51 1
Democrat 28 10 62 -
Republican 58 5 36 1 Party
Independent 40 5 53 2
Asians 37 10 50 3
Blacks 26 15 59 -
Latinos 34 16 48 2 Race/Ethnicity
Whites 43 5 51 1
18-34 34 11 54 1
35-54 38 9 51 2 Age
55 and older 44 7 45 4
Under $40,000 36 12 49 3
$40,000 to under $80,000 38 9 51 2 Income
$80,000 or more 42 6 51 1
Parents of Children Age 18 or Younger 38 11 50 1

ATTITUDES AND POLICY PREFERENCES
46
58
1813
34
27
0
20
40
60
80
United States* California
Per
cent
all
adul
ts
Less opportunity
More opportunityAbout the same opportunity
College Opportunities for Qualified Students From Low-Income Families
*Public Agenda/National Center, 2007
62
26
36
73
0
20
40
60
80
100
Tax on Wealthy State Sales Tax
Per
cent
like
ly v
oter
s
Favor
Oppose
Raising State Revenues for Higher Education
2924
6471
0
20
40
60
80
100
California 2000* California 2007
Per
cent
all
adul
ts
Agree
Disagree
Most Families Do a Good Job of Saving for Their Children's College Education
*Public Agenda/National Center, 2000
KEY FINDINGS
Sixty-six percent of Californians agree that the price of a college education keeps qualified and motivated students from going to college, while just 24 percent say families today do a good job of saving for their children’s college education. (page 18)
Many residents say the opportunity to get a college education is unequal: 58 percent of all adults think qualified students from low-income families have less opportunity than others, and most non-whites believe that racial and ethnic minorities have less opportunity than others. (page 19)
While over half of all adults (57%) want more state funding to keep down tuition and fees, overwhelming majorities favor increasing government funding for students through work study (86%), grants and scholarships (83%), and students loans (78%). (page 20)
Strong majorities say California’s community colleges have an important role in both training students for jobs and preparing students to transfer to four-year colleges; most give them positive ratings in these two areas. (page 21)
A majority of likely voters say there is not enough state funding for California’s higher education system and would support a state bond to pay for construction projects. (page 22)
Three in four residents think California’s higher education system is very important to the future quality of life and economic vitality of the state, but just 14 percent say they have a great deal of confidence in the state’s ability to plan for the future of higher education. (pages 23, 24)
Over four in 10 parents with children age 18 or younger (43%) are very worried about being able to afford college for their youngest child, and 55 percent say they are behind in saving for their children’s college education. (page 25)
17

Californians and Higher Education
ROLE OF STUDENT FINANCES
Echoing their view that student cost is the most important issue facing the state’s public colleges and universities today, Californians (66%) and parents of children age 18 or younger (70%) overwhelmingly agree that the price of a college education keeps students who are qualified and motivated to go to college from doing so. Majorities in all regions hold this view, with agreement highest in the Inland Empire (71%) and lowest in Orange/San Diego counties (59%). Blacks and Latinos are especially likely to think cost keeps motivated students from attending college, but strong majorities in all racial/ethnic groups agree. Democrats (72%) are more likely than independents (66%) and Republicans (57%) to say the price of college can be prohibitive. This perception drops sharply as income rises. Concern about the effect of college costs is significantly higher among residents with only a high school diploma (73%) or some college (71%) than among college graduates (58%). Women (70%) are more likely than men (63%) to agree.
“The price of a college education keeps students who are qualified and motivated to go to college from doing so.”
In addition, most Californians think families are not doing a good job of saving for their children’s college education. Only one in four (24%) thinks most families today are putting away enough money to send their children to college, while seven in 10 (71%) disagree. Among parents with children age 18 or younger, 68 percent think families are failing to save enough for college. A majority of residents in all income groups think families are not doing a good job of saving for their children’s education, with those in the highest income group especially likely to hold this view (84%). In a 2000 report by Public Agenda/National Center, Californians were somewhat more likely to think families were doing a good job of saving for their children’s college education (29% agree, 64% disagree), and the perceptions of Americans nationwide were similar at that time (28% agree, 65% disagree). Across racial/ethnic groups, Latinos (47%) are far more likely than Asians (30%), blacks (15%), and whites (12%) to believe that families today are doing a good job saving for their children’s college education.
“Most families today do a good job of saving for their children’s college education.”
Race/Ethnicity All Adults
Asians Blacks Latinos Whites
Parents of Children Age
18 or Younger
Agree 66% 66% 77% 76% 61% 70%
Disagree 31 29 21 22 36 28
Don't know 3 5 2 2 3 2
Income All Adults
Under $40,000 $40,000 to under $80,000
$80,000 or more
Parents of Children Age
18 or Younger
Agree 24% 41% 16% 11% 29%
Disagree 71 54 81 84 68
Don't know 5 5 3 5 3
Three in four residents (74%) believe students have to take on too much debt in student loans to pay for their college education, while only 22 percent disagree. Among parents with children age 18 or younger, 71 percent think students have to borrow too much. Majorities in all racial/ethnic groups agree, with blacks (92%) most likely to think students have to borrow too much money. When considering education and income, this belief is highest among residents with some college education (81%) and those with household incomes between $40,000 and $80,000 (81%). Californians’ views are similar to adults nationwide, according to the 2007 survey by Public Agenda/National Center (78% agree, 20% disagree).
18 PPIC Statewide Survey

Attitudes and Policy Preferences
DISPARITIES IN COLLEGE OPPORTUNITIES
In addition to concerns about the cost of attending college, residents also believe that opportunities to attend college are unequal. Most believe that qualified students from low-income families, regardless of their ethnic background, have less opportunity than other groups (58%). Residents are divided when it comes to ethnic or racial minorities (39% say less opportunity, 40% say about the same opportunity), and most (54%) think students from middle-class families, regardless of their ethnicity, have about the same opportunity as others to get a college education. Views of the opportunities for older students who are returning to school for retraining are similar, with 54 percent of Californians saying that returning students have about the same opportunity as others. Nationally, the 2007 Public Agenda/National Center survey found that 46 percent of Americans believe low-income students have fewer opportunities to attend college, compared to 26 percent perceiving limited opportunities for older students, 25 percent for middle-class students, and 24 percent for ethnic/racial minorities.
“Do you think ____________ have less opportunity, more opportunity, or about the same opportunity as others to get a college education?”
The perception that qualified low-income students have less opportunity than others to get a college education is widespread among all racial and demographic groups. Residents with household incomes below $40,000 (61%), blacks (74%), and people under age 35 (62%) are the most likely to agree. A majority of Democrats (68%) and independents (56%) hold this view, compared to 44 percent of Republicans.
…qualified students from low-income
families, regardless of their ethnic background
…qualified students who are ethnic or
racial minorities, such as blacks or Latinos
…qualified students from middle-class
families, regardless of their ethnic background
…people who are older and are going back to school for
retraining
Less opportunity 58% 39% 28% 25%
More opportunity 13 19 16 17
About the same opportunity
27 40 54 54
Don't know 2 2 2 4
% saying “less opportunity” …qualified students from low-income families, regardless of
their ethnic background
…qualified students who are ethnic or racial minorities, such as blacks or Latinos
All Adults 58% 39%
Under $40,000 61 45
$40,000 to under $80,000 59 38 Income
$80,000 or more 55 34
Asians 62 46
Blacks 74 62
Latinos 62 53 Race/Ethnicity
Whites 55 28
Parents of Children Age 18 or Younger 57 40
Whites (28%) are much less likely than blacks (62%), Latinos (53%), and Asians (46%), to say qualified ethnic/racial minorities have less opportunity than others. The perception that minorities have less opportunity declines with age and income. Democrats (47%) are considerably more likely than independents (31%) or Republicans (22%) to think minorities have fewer opportunities to get a college education.
October 2007 19

Californians and Higher Education
ROLE OF GOVERNMENT POLICY
In the wake of public concern about the cost of a college education, many Californians appear to be willing to increase state spending on higher education. Fifty-seven percent of all residents and 54 percent of likely voters are in favor of directing more state money toward the cost of tuition, even if it means less money for other state programs. Democrats (62%) and independents (59%) are more likely than Republicans (44%) to favor spending more state money in this area.
Across racial/ethnic groups, at least half of residents favor subsidizing tuition costs, even if other programs receive less money. Favor for increasing state spending on higher education, even at the cost of other state programs, declines with higher age, education, and income.
“How about spending more state government money to keep down tuition and fee costs, even if it means less money for other state programs?”
There are several other ways in which the state and federal government could make California’s public colleges and universities more affordable to students. Among the plans most favored by residents is increasing work-study opportunities for students to earn money while in college (86%) and increasing government funding available for scholarships and grants (83%). Increasing government funding for student loans also receives considerable support (78%).
Increasing the funding available for scholarships and grants is highly favored across all racial/ethnic groups, although Latinos (90%) and blacks (89%) are more likely than Asians (85%) and whites (79%) to favor this proposal. Democrats (92%) and independents (80%) are far more likely than Republicans (68%) to support this proposal, and women (86%) are more likely than men (80%) to favor it. Support declines with increasing age and income.
“How about increasing government funding available for scholarships or grants for students?”
Party All Adults
Dem Rep Ind Likely Voters
Favor 57% 62% 44% 59% 54%
Oppose 36 30 50 33 39
Don’t know 7 8 6 8 7
Race/Ethnicity All Adults
Asians Blacks Latinos Whites Likely Voters
Favor 83% 85% 89% 90% 79% 79%
Oppose 15 13 10 9 19 19
Don’t know 2 2 1 1 2 2
Strong majorities of residents across all demographic and political groups favor increasing government funding for work-study opportunities and student loans. Across racial/ethnic groups, blacks, Latinos, and Asians are somewhat more likely than whites to favor increasing government funding for work-study programs. Democrats are somewhat more likely than independents and far more likely than Republicans to favor additional government funding for both proposals. The percentage of residents supporting these proposals declines with increasing age and income.
20 PPIC Statewide Survey

Attitudes and Policy Preferences
ROLE OF COMMUNITY COLLEGES
Today, over 70 percent of California’s public higher education enrollment is in the California Community College (CCC) system, according to the California Postsecondary Education Commission (CPEC). This system serves over 2.5 million full and part-time students. CCCs were assigned several specific missions in the California Master Plan for Higher Education, adopted in 1960. We asked Californians to evaluate two of these CCC goals: providing career technical or vocational education and offering coursework that will help prepare students to transfer to four-year colleges and universities.
Seventy-six percent of residents − and at least two in three residents across all regional, political, and demographic groups − say it is very important that community colleges include career technical or vocational education. Agreement is similar among men (75%) and women (76%), and support for this goal increases with higher age, education, and income.
Over eight in 10 residents (81%) and likely voters (85%) say that it is very important for community colleges to include classes that will prepare students to transfer to four-year colleges and universities. The perceived importance of this role for community colleges is very high among blacks (90%), whites (83%), and Latinos (81%), but lower among Asians (67%). The percentage of residents rating this goal as very important is high across all regional, political, and demographic groups and increases with education.
“How important to you is it that community colleges include…?”
Overall, most residents give excellent or good ratings to the state’s community college system when it comes to training students for technical or vocational jobs (70%) and preparing students to transfer to four-year institutions (71%). In the case of job training, residents across all regions and political groups give high ratings to the community colleges. Latinos (79%) are the most likely to give positive ratings, followed by whites (68%), Asians (62%), and blacks (60%). When it comes to preparing students to transfer to four-year institutions, strong majorities of residents across all regional, political, and demographic groups give excellent or good ratings to the CCC system. However, Latinos (76%), Asians (72%), and whites (70%) offer more positive ratings than blacks (59%).
“How would you rate California’s community colleges overall in achieving the following goals?”
…career technical or vocational education …classes that prepare students to transfer to four-year colleges and universities
Very important 76% 81%
Somewhat important 20 15
Not too important 2 2
Not at all important 1 1
Don't know 1 1
Training students for career technical or vocational jobs
Preparing students to transfer to four-year colleges and universities
Excellent 16% 15%
Good 54 56
Not so good 15 15
Poor 3 3
Don't know 12 11
October 2007 21

Californians and Higher Education
STATE BUDGET AND REVENUES
Higher education comprises the third largest spending area of the state budget, with a current budget of over $14.9 billion. How do residents feel about this level of funding? A majority of adults (57%) and likely voters (55%) say that the current funding level is not enough, with about three in 10 saying it is just enough and one in 10 saying it is more than enough. Across political parties, Democrats (69%) and independents (53%) are far more likely than Republicans (39%) to say the current funding level is not enough. Across racial/ethnic groups, blacks (82%) are the most likely to say the current level of funding is not enough, followed by Latinos (63%), whites (53%), and Asians (45%). In our April survey, fewer than half of all adults (48%) and likely voters (46%) said that state funding for their local K-12 public schools was inadequate.
“Do you think the current level of state funding for California’s higher education system is…?”
Most Californians would support a hypothetical state bond measure to pay for construction projects in California’s higher education system. Sixty-four percent of residents and 56 percent of likely voters would vote yes if such a bond measure were on the state ballot in 2008. Support for this measure is higher among Democrats (73%) and independents (58%) than among Republicans (46%), and support declines as age, education, and income increase. These findings are similar to those in our April survey, in which we asked about support for a hypothetical local bond measure to pay for K-12 school construction projects (favored by 66% of all adults, 58% of likely voters).
“If there was a bond measure on the state ballot in 2008 to pay for construction projects in California’s higher education system, would you vote yes or no?”
Party All Adults
Dem Rep Ind Likely Voters
More than enough 7% 3% 15% 7% 9%
Just enough 28 21 39 31 29
Not enough 57 69 39 53 55
Don’t know 8 7 7 9 7
Party All Adults
Dem Rep Ind Likely Voters
Yes 64% 73% 46% 58% 56%
No 28 20 46 31 35
Don’t know 8 7 8 11 9
Most Californians believe that additional funding would improve the quality of the state’s higher education system, but their support for new revenues is conditional on who pays. A hypothetical proposal to increase funding for higher education by raising the top rate of the state income tax paid by the wealthiest Californians receives solid majority support among all adults (65%) and likely voters (62%). However, far more Democrats (80%) and independents (62%) than Republicans (43%) favor this proposal. Across regional and demographic groups, support for increasing the state taxes paid by the wealthiest Californians for this purpose is favored by nearly six in 10 or more residents.
In contrast, a strong majority of residents (72%) and likely voters (73%) oppose a hypothetical proposal to raise the state sales tax to provide additional funding for California’s higher education system. Strong majorities across all regional, political, and demographic groups oppose this proposal.
22 PPIC Statewide Survey

Attitudes and Policy Preferences
HIGHER EDUCATION AND CALIFORNIA’S FUTURE
Over nine in 10 residents from all regional, political, and demographic groups say that California’s higher education system is very or somewhat important to the quality of life and economic vitality of the state over the next 20 years. Three in four adults and likely voters say it is very important. Across political parties, Democrats (84%) are more likely than independents (79%) and Republicans (65%) to say that the higher education system is very important to the state’s future. Across regions, San Francisco Bay Area residents are the most likely to hold this view. Across racial/ethnic groups, Latinos and blacks are most likely to say that the higher education system is very important to the state’s future.
“In general, how important is California’s higher education system to the quality of life and economic vitality of the state over the next 20 years?”
Race/Ethnicity All Adults
Asians Blacks Latinos Whites Likely Voters
Very important 76% 68% 80% 81% 75% 77%
Somewhat important 20 26 14 16 21 19
Not too important 2 2 3 2 2 2
Not at all important 1 - 2 1 1 1
Don’t know 1 4 1 - 1 1
Recent PPIC research has found that the state’s demand for college-educated workers will continue to rise, while projections indicate there will be a lack of college-educated residents to meet this need. What are residents’ views on this issue? Over two in three adults and likely voters (68% each) believe that if current trends continue, the state’s economy will need a higher percentage of college-educated workers in 20 years. About one in five in each group say the same percentage will be needed, while fewer than one in 10 say a lower percentage will be needed. Majorities in all political and demographic groups recognize the need for more college-educated workers, but Democrats (75%) are more likely to express this view than independents (69%) or Republicans (59%). Latinos (78%) and blacks (74%) are more likely than whites (65%) and Asians (51%) to believe the state will need a more-educated workforce. Nearly seven in 10 residents across gender, education, and income groups share this opinion.
“In thinking ahead 20 years, if current trends continue do you think California’s economy will need a higher percentage, a lower percentage, or about the same percentage of college-educated workers as today?”
Turning from the issue of need to what the state will have, a majority of residents (52%) and likely voters (55%) believe there will not be enough college-educated residents to fill the jobs and skills likely to be in demand in 20 years. Another three in 10 think there will be just enough college-educated residents to meet demand. Pluralities across political and demographic groups believe there will be a lack of college-educated residents, but independents (57%) and Democrats (56%) are more pessimistic than Republicans (48%).
Race/Ethnicity
All Adults Asians Blacks Latinos Whites
Likely Voters
Higher percentage 68% 51% 74% 78% 65% 68%
Lower percentage 8 18 9 6 7 6
About the same percentage 24 16 14 25 23 21
Don’t know 3 7 1 2 3 3
October 2007 23

Californians and Higher Education
HIGHER EDUCATION AND CALIFORNIA’S FUTURE (CONTINUED)
Blacks (62%) are more likely than whites (53%), Latinos (50%), and Asians (44%) to believe that the state will not have enough college-educated residents to meet future demands. Women are slightly more likely than men (54% to 49%) to hold this view. The belief that there will be a shortfall of educated workers increases as education and income levels rise. Among those who believe the state will need a higher percentage of college-educated workers, 58 percent do not think there will be enough.
Given this perceived mismatch between supply and demand, how important do residents think it is for the state to invest more public funds in increasing the capacity of public colleges and universities? Eighty-six percent of residents say increased spending is very (51%) or somewhat (35%) important. Likely voters are somewhat less likely to say very important (46%). Democrats (60%) and independents (54%) are far more likely than Republicans (30%) to say this investment in higher education is very important. Strong majorities across regions and demographic groups say spending more to increase capacity is at least somewhat important.
“In thinking ahead 20 years, how important do you think it is for the state government to be spending more public funds to increase capacity in public colleges and universities?”
Party
Just 14 percent of residents say they have a great deal of confidence in the state government’s ability to plan for the future of California’s higher education system and 43 percent say they have only some confidence. Four in 10 adults express very little (30%) or no confidence (12%) in the state government. Likely voters hold similar views of the situation. Democrats, Republicans, and independents are in agreement on this issue, with pluralities in each group saying they have only some confidence in the state government’s ability to plan for the future, and fewer than one in seven say they have a great deal of confidence. While pluralities of residents across racial/ethnic groups say they have only some confidence in the state government, Latinos are the most likely racial/ethnic group to say they have a great deal of confidence (23%), and blacks are the most likely to have very little or no confidence (53%).
“How much confidence do you have in the state government’s ability to plan for the future of California’s higher education system?”
All Adults Dem Rep Ind
Likely Voters
Very important 51% 60% 30% 54% 46%
Somewhat important 35 30 49 35 39
Not too important 8 5 11 5 8
Not at all important 4 2 8 4 5
Don’t know 2 3 2 2 2
Party All Adults
Dem Rep Likely Voters
Ind
A great deal 14% 12% 8% 11% 13%
43 48 44 44 Only some 47
Very little 30 28 28 34 28
None 12 9 15 12 13
Don’t know 1 2 1 2 1
24 PPIC Statewide Survey

Attitudes and Policy Preferences
October 2007 25
PARENTAL EXPECTATIONS AND CONCERNS
California parents of children age 18 or younger express high hopes for their children’s educational future. When asked to think about their youngest or only child, nine in 10 parents express hope that this child will be a college graduate (43%) or attain a post-graduate degree (46%). The percentage of parents hoping their child will attain higher education was similar in our April 2005 survey (47% college degree, 41% post-graduate degree). Most parents in all political and demographic groups hope their child will obtain a college education; however, white parents are far more likely than Latino parents (51% to 36%) to hope their child will obtain a post-graduate degree. Hopes for advanced degrees increase with parents’ education and income.
Although most parents hope their child will attend college, most are worried about whether they will be able to afford it. Three in four parents are very (43%) or somewhat worried (32%) about affording the cost of college for their youngest child. Latino parents (53%) are more likely than white parents (35%) to be very worried, as are foreign-born parents (52%) compared to U.S.-born parents (37%). Parents in the Inland Empire (52%) are more likely to be very worried than parents in the Central Valley (45%), Los Angeles (44%), the San Francisco Bay Area (37%), and Orange/San Diego counties (35%). Parents who rent their homes (57%) are also more likely to be very worried than parents who own their homes (34%). The percentage of parents who are very worried about affording a college education for their child declines as income and education levels rise.
“How worried are you about being able to afford a college education for your youngest child?”
Race/Ethnicity* Asked only of parents with children age 18 or younger
All Parents of Children Age 18
or Younger Latinos Whites
Very worried 43% 53% 35%
Somewhat worried 32 31 34
Not too worried 12 9 15
Not at all worried 13 7 16
*The sample sizes of Asian parents and black parents are too small for separate analysis
When it comes to the progress they have made in saving to help pay for their children’s college education, most parents (55%) feel they are behind, while one in three (33%) feel they are just about where they should be. Only one in 10 (9%) feel they are ahead in their efforts to save money. California parents (55%) are more likely than parents nationwide (48%) to feel they are behind in saving for their children’s college education, according to a February 2007 ABC News poll. In California today, Latino parents (63%) are more likely than white parents (50%) to feel they are behind in saving. The perception of being ahead or saving at about the right pace increases with higher education and income levels.
“How do you feel about the progress, if any that you have made so far in saving to help pay for your child’s college education?”
Income All Parents of Asked only of parents with Children Age 18
$40,000 to under children age 18 or younger or Younger Less than $40,000 $80,000 or more
$80,000
Ahead 9% 4% 6% 12%
Behind 55 67 64 43
Just about where you should be 33 25 28 43
Haven’t started yet/will not be 1 2 1 1
saving (volunteered)
Don't know 2 2 1 1

REGIONAL MAP
26

METHODOLOGY
The PPIC Statewide Survey is directed by Mark Baldassare, president and CEO and survey director at the Public Policy Institute of California, with assistance in research and writing from Jennifer Paluch, project manager for this survey, and survey research associates Dean Bonner and Sonja Petek. This survey was conducted with funding from The William and Flora Hewlett Foundation and benefited from discussions with foundation staff, grantees, and policy experts; however, the survey methods, questions, and content of this report were solely determined by Mark Baldassare.
The findings in this report are based on a telephone survey of 2,503 California adult residents interviewed from October 10 to 23, 2007. Interviewing took place on weekday nights and weekend days, using a computer-generated random sample of telephone numbers that ensured that both listed and unlisted numbers were called. All telephone exchanges in California were eligible. Telephone numbers in the survey sample were called up to six times to increase the likelihood of reaching eligible households. Once a household was reached, an adult respondent (age 18 or older) was randomly chosen for interviewing using the “last birthday method” to avoid biases in age and gender. Interviews took an average of 18 minutes to complete. Interviewing was conducted in English, Spanish, Chinese (Mandarin and Cantonese), Vietnamese, and Korean. We chose these languages because Spanish is the dominant language among non-English speaking adults in California, followed in prevalence by the three Asian languages. Accent on Languages translated the survey into Spanish with assistance from Renatta DeFever. Schulman, Ronca & Bucuvalas, Inc. translated the survey into Chinese, Vietnamese, and Korean, and conducted the telephone interviewing for this survey. We used recent U.S. Census and state data to compare the demographic characteristics of the survey sample with those of California’s adult population. The survey sample was closely comparable to the census and state figures. The survey data in this report were statistically weighted to account for any demographic differences.
The sampling error for the total sample of 2,503 adults is +/- 2 percent at the 95 percent confidence level. This means that 95 times out of 100, the results will be within 2 percentage points of what they would be if all adults in California were interviewed. The sampling error for subgroups is larger: For the 1,928 registered voters, it is +/- 2.5 percent; for the 1,447 likely voters, it is +/- 3 percent; for the 1,081 parents of children age 18 or under, it is +/- 3 percent. Sampling error is only one type of error to which surveys are subject. Results may also be affected by factors such as question wording, question order, and survey timing.
Throughout the report, we refer to five geographic regions, accounting for approximately 90 percent of the state population. “Central Valley” includes Butte, Colusa, El Dorado, Fresno, Glenn, Kern, Kings, Madera, Merced, Placer, Sacramento, San Joaquin, Shasta, Stanislaus, Sutter, Tehama, Tulare, Yolo, and Yuba counties. “San Francisco Bay Area” includes Alameda, Contra Costa, Marin, Napa, San Francisco, San Mateo, Santa Clara, Solano, and Sonoma counties. “Los Angeles” refers to Los Angeles County, “Inland Empire” includes Riverside and San Bernardino counties, and “Orange/San Diego” refers to Orange and San Diego counties. Residents from other geographic areas are included in the statewide results reported for all adults, registered voters, and likely voters. However, sample sizes for these less populated areas are not large enough to report separately in tables and text. We present specific results for respondents in the statewide sample in four self-identified racial/ethnic groups: Asian, black, Latino, and non-Hispanic white. We also compare the opinions of registered Democrats, Republicans, and independents (i.e., registered as “decline to state”) and we analyze the responses of likely voters—those who are the most likely to participate in the state’s elections. We compare current PPIC Statewide Survey results to those in national surveys by ABC News and national and state surveys by Public Agenda
27

and the California Higher Education Policy Center (“Public Agenda/CHEPC”) and by Public Agenda and the National Center for Public Policy and Higher Education (“Public Agenda/National Center”).
28 PPIC Statewide Survey
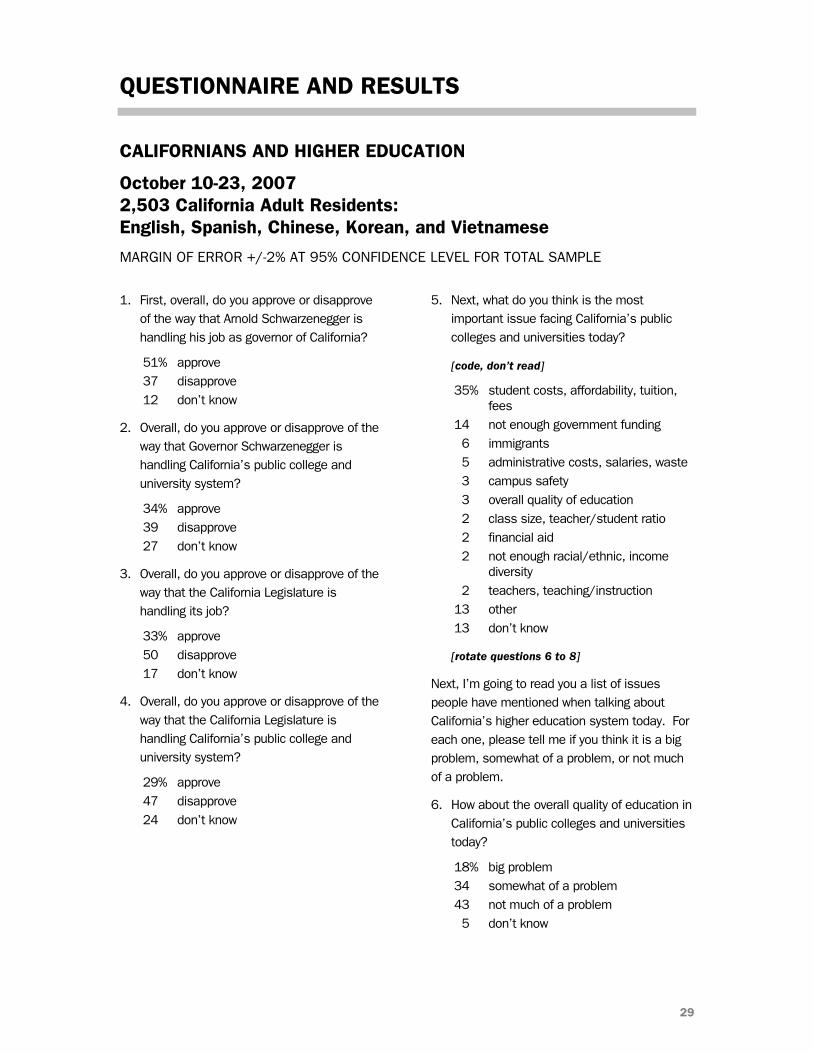
QUESTIONNAIRE AND RESULTS
CALIFORNIANS AND HIGHER EDUCATION
October 10-23, 2007 2,503 California Adult Residents: English, Spanish, Chinese, Korean, and Vietnamese
MARGIN OF ERROR +/-2% AT 95% CONFIDENCE LEVEL FOR TOTAL SAMPLE
1. First, overall, do you approve or disapprove of the way that Arnold Schwarzenegger is handling his job as governor of California?
51% approve 37 disapprove 12 don’t know
2. Overall, do you approve or disapprove of the way that Governor Schwarzenegger is handling California’s public college and university system?
34% approve 39 disapprove 27 don’t know
3. Overall, do you approve or disapprove of the way that the California Legislature is handling its job?
33% approve 50 disapprove 17 don’t know
4. Overall, do you approve or disapprove of the way that the California Legislature is handling California’s public college and university system?
29% approve 47 disapprove 24 don’t know
5. Next, what do you think is the most important issue facing California’s public colleges and universities today?
[code, don’t read]
35% student costs, affordability, tuition, fees
14 not enough government funding 6 immigrants 5 administrative costs, salaries, waste 3 campus safety 3 overall quality of education 2 class size, teacher/student ratio 2 financial aid 2 not enough racial/ethnic, income
diversity 2 teachers, teaching/instruction 13 other 13 don’t know
[rotate questions 6 to 8]
Next, I’m going to read you a list of issues people have mentioned when talking about California’s higher education system today. For each one, please tell me if you think it is a big problem, somewhat of a problem, or not much of a problem.
6. How about the overall quality of education in California’s public colleges and universities today?
18% big problem 34 somewhat of a problem 43 not much of a problem 5 don’t know
29

Californians and Higher Education
7. How about the overall affordability of education for students in California’s public colleges and universities today?
53% big problem 31 somewhat of a problem 14 not much of a problem 2 don’t know
8. How about the overall accessibility of education for students in California’s public colleges and universities today?
24% big problem 36 somewhat of a problem 37 not much of a problem 3 don’t know
9. Overall, do you think the higher education system in California—including public colleges and universities—is in need of major changes, minor changes, or that it is basically fine the way it is?
39% major changes 45 minor changes 12 fine the way it is 4 don’t know
As you may know, California’s higher education system has three branches— the California Community College system, the California State University system, and the University of California system.
[rotate questions 10 to 12]
10. Overall, is the California Community College system doing an excellent, good, not so good, or poor job?
14% excellent 52 good 21 not so good 5 poor 8 don’t know
11. Overall, is the California State University system doing an excellent, good, not so good, or poor job?
9% excellent 57 good 18 not so good 3 poor 13 don’t know
12. Overall, is the University of California system doing an excellent, good, not so good, or poor job?
15% excellent 52 good 17 not so good 4 poor 12 don’t know
Next,
[rotate questions 13 to 15]
13. Do you happen to know which branch has the highest state tuition and fees?
[rotate responses]
4% California Community College system 16 California State University system 57 University of California system 23 don’t know
14. Do you happen to know which branch has the most students enrolled?
[rotate responses]
42% California Community College system 21 California State University system 9 University of California system 28 don’t know
15. Do you happen to know which branch has the highest dollar amount of per student funding from the state government?
[rotate responses]
16% California Community College system 18 California State University system 22 University of California system 44 don’t know
30 PPIC Statewide Survey

Questionnaire and Results
In general, do you agree or disagree with the following statements? First,
[rotate questions 16 and 17]
16. Additional state funding would lead to major improvements in California’s higher education system.
69% agree 27 disagree 4 don’t know
Next,
17. Better use of existing state funds would lead to major improvements in California’s higher education system.
83% agree 12 disagree 5 don’t know
18. To significantly improve California’s higher education system, which of the following statements do you agree with the most? [rotate responses 1 and 2] (1) We need to use existing state funds more wisely, [or] (2) We need to increase the amount of state funding, [or] (3) We need to use existing state funds more wisely and increase the amount of state funding.
39% use funds more wisely 9 increase state funding 50 both 2 don’t know
[rotate questions 19 to 22]
19. Do you think that a college education is necessary for a person to be successful in today’s work world, or do you think that there are many ways to succeed in today’s work world without a college education?
64% college is necessary 34 many other ways to succeed 2 don’t know
20. In your view, has getting a college education become more difficult than it was 10 years ago, less difficult than it was 10 years ago, or is it about as difficult as it was 10 years ago ?
56% more difficult 13 less difficult 24 about as difficult 7 don’t know
21. Next, compared to other things, are college prices going up at a faster rate, are college prices going up at a slower rate, or are they going up at the same rate?
61% faster rate 5 slower rate 22 same rate 12 don’t know
22. Do you think that currently, the vast majority of people who are qualified to go to college have the opportunity to do so, or do you think there are many people who are qualified to go but don’t have the opportunity to do so?
32% majority have the opportunity 65 many don’t have the opportunity 3 don’t know
Next, please say if you agree or disagree with the following statements.
[rotate questions 23 to 25]
23. The price of a college education keeps students who are qualified and motivated to go to college from doing so.
66% agree 31 disagree 3 don’t know
24. Students have to borrow too much money to pay for their college education.
74% agree 22 disagree 4 don’t know
October 2007 31
Californians and Higher Education
25. Most families today do a good job of saving for their children’s college education.
24% agree 71 disagree 5 don’t know
Next, please tell me if you think the following groups of people have less opportunity, more opportunity, or about the same opportunity as others to get a college education.
[rotate questions 26 to 28a]
26. Do you think qualified students from low-income families, regardless of their ethnic background, have [rotate responses 1 and 2] [1] less opportunity, [2] more opportunity, [or] about the same opportunity as others to get a college education?
58% less opportunity 13 more opportunity 27 about the same 2 don’t know
27. Do you think qualified students from middle-class families, regardless of their ethnic background, have [rotate responses 1 and 2] [1] less opportunity, [2] more opportunity, [or] about the same opportunity as others to get a college education?
28% less opportunity 16 more opportunity 54 about the same 2 don’t know
28. Do you think qualified students who are ethnic or racial minorities, such as blacks or Latinos, have [rotate responses 1 and 2] [1] less opportunity, [2] more opportunity, [or] about the same opportunity as others to get a college education?
39% less opportunity 19 more opportunity 40 about the same 2 don’t know
28a.Do you think people who are older and are going back to school for retraining, have [rotate responses 1 and 2] [1] less opportunity, [2] more opportunity, [or] about the same opportunity as others to get a college education?
25% less opportunity 17 more opportunity 54 about the same 4 don’t know
I am going to read you several ways that the federal and state government can make California’s higher education system more affordable to students. For each of the following, please say if you favor or oppose the proposal.
[rotate questions 29 to 32]
29.How about increasing government funding available for work-study opportunities for students to earn money while in college?
86% favor 12 oppose 2 don’t know
30. How about increasing government funding available for student loans?
78% favor 20 oppose 2 don’t know
31.How about increasing government funding available for scholarships or grants for students?
83% favor 15 oppose 2 don’t know
32.How about spending more state government money to keep down tuition and fee costs, even if it means less money for other state programs?
57% favor 36 oppose 7 don’t know
32 PPIC Statewide Survey

Questionnaire and Results
On another issue, concerning California’s community college system,
[rotate questions 33 and 34]
33. How important to you is it that community colleges include career technical or vocational education?
76% very important 20 somewhat important 2 not too important 1 not at all important 1 don’t know
34. How important to you is it that community colleges include classes that prepare students to transfer to four-year colleges and universities?
81% very important 15 somewhat important 2 not too important 1 not at all important 1 don’t know
Next, please tell me how you would rate California’s community colleges overall in achieving the following goals.
[rotate questions 35 and 36]
35. How about in preparing students to transfer to four-year colleges and universities? Are California community colleges doing an excellent, good, not so good, or poor job?
15% excellent 56 good 15 not so good 3 poor 11 don’t know
36. How about in training students for career technical or vocational jobs? Are California community colleges doing an excellent, good, not so good, or poor job?
16% excellent 54 good 15 not so good 3 poor 12 don’t know
37. Next, do you think the current level of state funding for California’s higher education system is more than enough, just enough, or not enough?
7% more than enough 28 just enough 57 not enough 8 don’t know
38. If there was a bond measure on the state ballot in 2008 to pay for construction projects in California’s higher education system, would you vote yes or no?
64% yes 28 no 8 don’t know
Here are some ideas that have been suggested to raise state revenues to provide additional funding for California’s higher education system. For each of the following, please say if you favor or oppose the proposal.
[rotate questions 39 and 40]
39. How about raising the top rate of the state income tax paid by the wealthiest Californians?
65% favor 32 oppose 3 don’t know
40. How about raising the state sales tax?
26% favor 72 oppose 2 don’t know
41. Next, in general, how important is California’s higher education system to the quality of life and economic vitality of the state over the next 20 years?
76% very important 20 somewhat important 2 not too important 1 not at all important 1 don’t know
October 2007 33
Californians and Higher Education
42. In thinking ahead 20 years, if current trends continue do you think California’s economy will need [rotate responses 1 and 2] (1) a higher percentage, (2) a lower percentage, [or] about the same percentage of college- educated workers as today?
68% higher percentage 8 lower percentage 21 about the same percentage 3 don’t know
43. In thinking ahead 20 years, if current trends continue, do you think California will have [rotate responses 1 and 2] (1) more than enough, (2) not enough, [or] just enough college-educated residents needed for the jobs and skills likely to be in demand?
14% more than enough 52 not enough 29 just enough 5 don’t know
44. In thinking ahead 20 years, how important do you think it is for the state government to be spending more public funds to increase capacity in public colleges and universities?
51% very important 35 somewhat important 8 not too important 4 not at all important 2 don’t know
45. How much confidence do you have in the state government’s ability to plan for the future of California’s higher education system?
14% a great deal 43 only some 30 very little 12 none 1 don’t know
46. On another topic, some people are registered to vote and others are not. Are you absolutely certain that you are registered to vote?
77% yes [ask q46a] 22 no [skip to q47] 1 don’t know [skip to q47]
46a.Are you registered as a Democrat, a Republican, another party, or as an independent?
42% Democrat [skip to q48] 33 Republican [skip to q48] 5 another party (specify) [skip to q48] 20 independent [ask q47]
47. Do you think of yourself as closer to the Republican Party or Democratic Party?
24% Republican Party 42 Democratic Party 27 neither (volunteered) 7 don’t know
48. Generally speaking, how much interest would you say you have in politics?
28% great deal 39 fair amount 25 only a little 7 none 1 don’t know
49. Would you consider yourself to be politically:
[read list, rotate order top to bottom]
11% very liberal 19 somewhat liberal 33 middle-of-the-road 24 somewhat conservative 11 very conservative 2 don’t know
34 PPIC Statewide Survey

Questionnaire and Results
October 2007 35
[d1-d4b: demographic questions]
[questions d4c to d4e asked only of parents
of children age 18 or younger]
d4c.What do you hope will be the highest grade level that your youngest child will achieve: some high school, high school graduate, some college, college graduate, or a graduate degree after college?
1% some high school 4 high school graduate 4 some college 43 college graduate 46 a graduate degree after college 2 don’t know
d4d.How worried are you about being able to afford a college education for your youngest child?
43% very worried 32 somewhat worried 12 not too worried 13 not at all worried
d4e.How do you feel about the progress, if any, that you have made so far in saving to help pay for your child’s college education – do you feel you are ahead, behind, or just about where you should be at this point?
9% ahead 55 behind 33 just about where you should be 1 haven’t started yet/will not be saving
(volunteered) 2 don’t know
[d5-d6: demographic questions]
[questions d6a and d6b asked only of
residents with at least some college
education]
d6a.Do you think that getting a college education was money and time well spent, or not?
92% yes 7 no 1 don’t know
d6b.Would you recommend one of California’s public colleges and universities to a friend or family member who was considering which college to attend?
82% yes 12 no 6 don’t know
[d6c-d11: demographic questions]


PPIC STATEWIDE SURVEY ADVISORY COMMITTEE
Ruben Barrales President and Chief Executive Officer San Diego Regional Chamber of Commerce
Angela Blackwell Founder and Chief Executive Officer PolicyLink
Paul Brest President The William and Flora Hewlett Foundation
Mollyann Brodie Vice President Kaiser Family Foundation
Bruce E. Cain Director Institute of Governmental Studies University of California, Berkeley
James E. Canales President The James Irvine Foundation
Jon Cohen Director of Polling The Washington Post
Matthew K. Fong Special Counsel Sheppard, Mullin, Richter & Hampton, LLP
Russell Hancock President and Chief Executive Officer Joint Venture Silicon Valley Network
William Hauck President California Business Roundtable
Sherry Bebitch Jeffe Senior Scholar School of Policy, Planning, and Development University of Southern California
Carol S. Larson President and Chief Executive Officer The David and Lucile Packard Foundation
Monica Lozano Publisher and Chief Executive Officer La Opinión
Donna Lucas Chief Executive Officer Lucas Public Affairs
Dan Rosenheim News Director KPIX-TV
Carol Stogsdill President Stogsdill Consulting
Cathy Taylor Vice President and Editorial Commentary Director Orange County Register
Raymond L. Watson Vice Chairman of the Board Emeritus The Irvine Company
Carol Whiteside President Great Valley Center
The PPIC Statewide Survey Advisory Committee is a diverse group of experts who provide advice on survey issues.
However, survey methods, questions, content, and timing are determined solely by PPIC.

PUBLIC POLICY INSTITUTE OF CALIFORNIA
BOARD OF DIRECTORS
Thomas C. Sutton, Chair Retired Chairman and Chief Executive Officer Pacific Life Insurance Company
Mark Baldassare President and Chief Executive Officer Public Policy Institute of California
Ruben Barrales President and Chief Executive Officer San Diego Regional Chamber of Commerce
Linda Griego President and Chief Executive Officer Griego Enterprises, Inc.
Edward K. Hamilton Chairman Hamilton, Rabinovitz & Alschuler, Inc.
Gary K. Hart Former State Senator and Secretary of Education State of California
Walter B. Hewlett Director Center for Computer Assisted Research in the Humanities
Donna Lucas Chief Executive Officer Lucas Public Affairs
Leon E. Panetta Director The Leon & Sylvia Panetta Institute for Public Policy
Ki Suh Park Design and Managing Partner Gruen Associates
Constance L. Rice Co-Director The Advancement Project
Raymond L. Watson Vice Chairman of the Board Emeritus The Irvine Company
Carol Whiteside President Great Valley Center

Copyright © 2007 by Public Policy Institute of CaliforniaAll rights reservedSan Francisco, CA
Short sections of text, not to exceed three paragraphs, may be quoted without written permission provided that full attribution is given to the source and the above copyright notice is included.

PUBLIC POLICY INSTITUTE OF CALIFORNIA500 Washington Street, Suite 800 San Francisco, California 94111phone: 415.291.4400 fax: 415.291.4401
PPIC SACRAmENTO CENTERSenator Office Building1121 L Street, Suite 801Sacramento, California 95814phone: 916.440.1120fax: 916.440.1121
www.ppic.org [email protected]


