TABLE OF CONTENTS HSBC Mutual Funds HSBC Canadian Money Market Fund HSBC U.S. Dollar Money Market Fund HSBC Mortgage Fund HSBC Canadian Bond Fund HSBC Emerging Markets Debt Fund HSBC Monthly Income Fund HSBC U.S. Dollar Monthly Income Fund HSBC Canadian Balanced Fund HSBC Dividend Fund HSBC Equity Fund HSBC Small Cap Growth Fund HSBC Global Equity Fund HSBC U.S. Equity Fund HSBC European Fund HSBC AsiaPacific Fund HSBC Global Real Estate Equity Fund HSBC Chinese Equity Fund HSBC Indian Equity Fund HSBC Emerging Markets Fund HSBC BRIC Equity Fund HSBC World Selection Diversified Conservative Fund HSBC World Selection Diversified Moderate Conservative Fund HSBC World Selection Diversified Balanced Fund HSBC World Selection Diversified Growth Fund HSBC World Selection Diversified Aggressive Growth Fund
Transcript
TABLE OF CONTENTS
HSBC Mutual Funds
HSBC Canadian Money Market Fund
HSBC U.S. Dollar Money Market Fund
HSBC Mortgage Fund
HSBC Canadian Bond Fund
HSBC Emerging Markets Debt Fund
HSBC Monthly Income Fund
HSBC U.S. Dollar Monthly Income Fund
HSBC Canadian Balanced Fund
HSBC Dividend Fund
HSBC Equity Fund
HSBC Small Cap Growth Fund
HSBC Global Equity Fund
HSBC U.S. Equity Fund
HSBC European Fund
HSBC AsiaPacific Fund
HSBC Global Real Estate Equity Fund
HSBC Chinese Equity Fund
HSBC Indian Equity Fund
HSBC Emerging Markets Fund
HSBC BRIC Equity Fund
HSBC World Selection Diversified Conservative Fund
HSBC World Selection Diversified Moderate Conservative Fund
HSBC World Selection Diversified Balanced Fund
HSBC World Selection Diversified Growth Fund
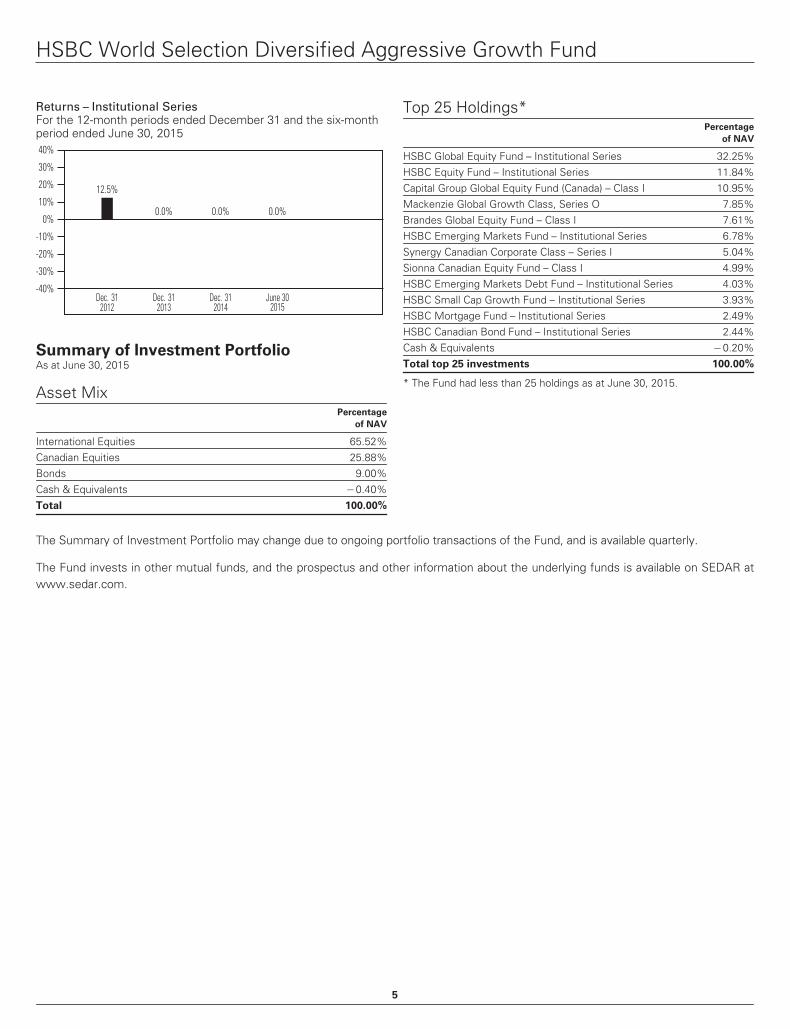
HSBC World Selection Diversified Aggressive Growth Fund
HSBC Mutual Funds
Interim Management Report of Fund Performance
for the six months ended June 30, 2015
HSBC Mutual Funds
Interim Report to Unitholders
for the six months ended June 30, 2015
HSBC Mutual Funds
Interim Report to Unitholders
Interim Management Report of Fund Performance
for the six months ended June 30, 2015
A NOTE ON FORWARD-LOOKING STATEMENTS
This report may contain forward-looking statements about the Fund, including its strategy, expected performance and condition. Forward-lookingstatements include statements that are predictive in nature that depend upon or refer to future events or conditions, or that include words such as“expects,” “anticipates,” “intends,” “plans,” “believes,” “estimates” or negative versions thereof and similar expressions. In addition, any statement thatmay be made concerning future performance, strategies or prospects, and possible future Fund action, is also a forward-looking statement. Forward-lookingstatements are based on current expectations and projections about future events and are inherently subject to, among other things, risks, uncertaintiesand assumptions about the Fund and economic factors.
Forward-looking statements are not guarantees of future performance, and actual events and results could differ materially from those expressed or impliedin any forward-looking statements made by the Fund. Any number of important factors could contribute to these digressions, including, but not limited to,general economic, political and market factors in North America and internationally, interest and foreign exchange rates, global equity and capital markets,business competition, technological change, changes in government regulations, unexpected judicial or regulatory proceedings, and catastrophic events.
We stress that the above-mentioned list of important factors is not exhaustive. We encourage you to consider these and other factors carefully beforemaking any investment decisions and we urge you to avoid placing undue reliance on forward-looking statements. Further, you should be aware of the factthat the Fund has no specific intention of updating any forward-looking statements, whether as a result of new information, future events or otherwise.
Sources: HSBC Global Asset Management (Canada) Limited, Bloomberg, MSCI, FTSE TMX Global Debt Capital Markets Inc., Bank of Canada.
Neither MSCI nor any other party involved in or related to compiling, computing or creating the MSCI data makes any express or implied warranties orrepresentations with respect to such data (or the results to be obtained by the use thereof), and all such parties hereby expressly disclaim all warranties oforiginality, accuracy, completeness, merchantability or fitness for a particular purpose with respect to any of such data. Without limiting any of theforegoing, in no event shall MSCI, any of its affiliates or any third party involved in or related to compiling, computing or creating the data have any liabilityfor any direct, indirect, special, punitive, consequential or any other damages (including lost profits), even if notified of the possibility of such damages. Nofurther distribution or dissemination of the MSCI data is permitted without MSCI’s express written consent.
FTSE TMX Global Debt Capital Markets Inc. (“FTDCM”), FTSE International Limited (“FTSE”), the London Stock Exchange Group companies (the“Exchange”) or TSX Inc. (“TSX” and together with FTDCM, FTSE and the Exchange, the “Licensor Parties”). The Licensor Parties make no warranty orrepresentation whatsoever, expressly or impliedly, either as to the results to be obtained from the use of the FTSE TMX Canada Index and/or the figure atwhich the said Index stands at any particular time on any particular day or otherwise. The Index is compiled and calculated by FTDCM and all copyright inthe Index values and constituent lists vests in FTDCM. The Licensor Parties shall not be liable (whether in negligence or otherwise) to any person for anyerror in the Index and the Licensor Parties shall not be under any obligation to advise any person of any error therein. “TMX” is a trade mark of TSX Inc. andis used under licence. “FTSE®” is a trade mark of FTSE International Limited and is used by FTDCM under licence.
Unauthorized reproduction, distribution, transmission or publication without our prior written consent is strictly prohibited.
How to reach us
VancouverHSBC Global Asset Management (Canada) Limited3rd Floor, 885 West Georgia StreetVancouver, BC V6C 3E8
Tel: 1-888-390-3333Fax: 604-669-2756
TorontoSuite 300 – 70 York StreetToronto, ON M5J 1S9
MontrealSuite 300 – 2001 McGill College AvenueMontreal, QC H3A 1G1
For more information
You can find more information about HSBC Mutual Funds in the Fund’s Simplified Prospectus, Annual Information Form,Annual and Semi-Annual Report and Fund Facts. You can get a copy of these documents, as well as the Fund’s FinancialStatements, at no cost by calling 1-888-390-3333, by contacting your authorized dealer or by visiting our website atwww.hsbc.ca/investment-resources.
These documents and other information about the HSBC Mutual Funds, such as information circulars and materialcontracts, are also available at www.sedar.com.
Copies of the Annual Report and Semi-Annual Report, Simplified Prospectus, Annual Information Form, Annual andInterim Management Report of Fund Performance and Fund Facts are available on our website at www.hsbc.ca/investment-resources.
Issued byHSBC Global Asset Management (Canada) Limited (2
015-
08)R
RD
HSBC CanadianMoney Market Fund
Interim Management Report of Fund Performance
for the six months ended June 30, 2015
HSBC Canadian Money Market Fund
Management Discussion of Fund PerformanceIn this document, you and your refer to the unitholder of the Fund;we, us and our refer to HSBC Global Asset Management (Canada)Limited; and the Fund refers to the HSBC Canadian Money MarketFund.
We are the manager, trustee and primary investment advisor ofthe Fund.
IntroductionThis Interim Management Report of Fund Performance containsfinancial highlights but does not contain the complete annual or semi-annual financial statements of the investment fund. You may obtain acopy of the Fund’s annual or semi-annual financial statements at yourrequest, at no cost, by calling us toll-free at 1-888-390-3333, by visitingour website at www.hsbc.ca/investment-resources, by visiting theSEDAR website at www.sedar.com or by writing to us at:
Corporate SecretaryHSBC Global Asset Management (Canada) Limited3rd Floor, 885 West Georgia StreetVancouver, BC V6C 3E8
You may also contact us using one of these methods to request acopy of the Fund’s proxy voting policies and procedures, proxyvoting disclosure record or quarterly statement of investmentportfolio.
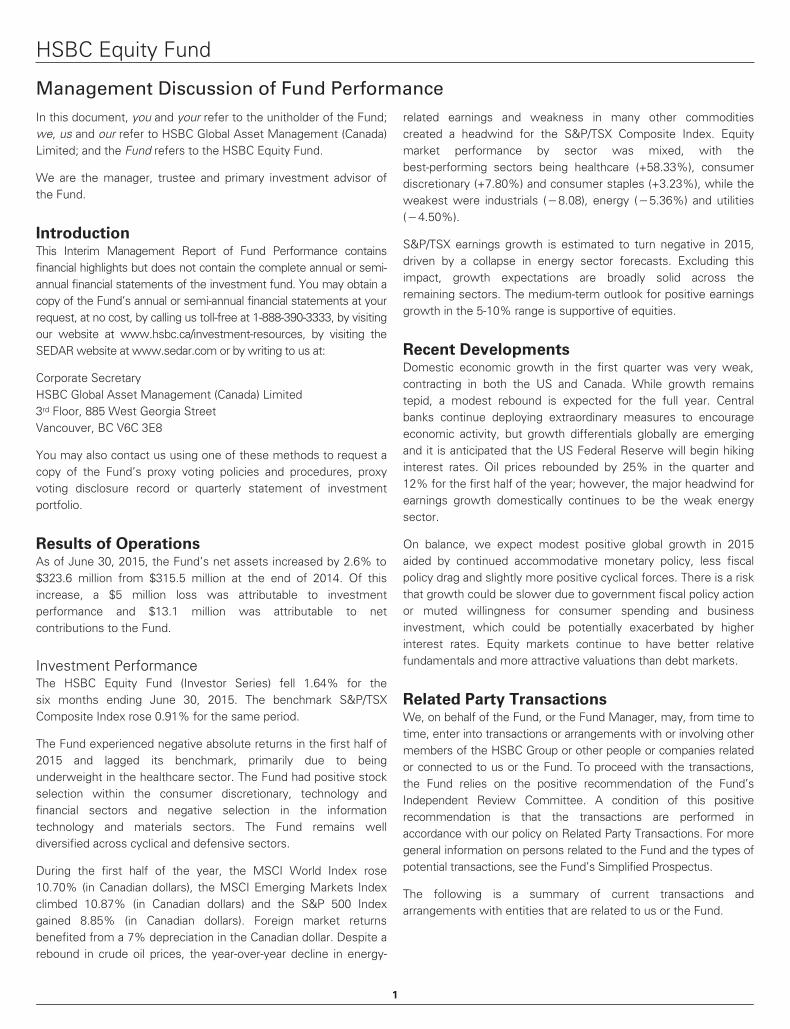
Results of OperationsAs of June 30, 2015, the Fund’s net assets decreased by 2.1% to$211.3 million from $215.9 million at the end of 2014. Of thisdecrease, a $0.4 million gain was attributable to investmentperformance and $5 million was attributable to net withdrawalsfrom Fund.
Investment PerformanceThe HSBC Canadian Money Market Fund (Investor Series) rose0.03% for the six months ending June 30, 2015. The benchmark,50% FTSE TMX Canada 30-Day Treasury Bill Index (50%) and theFTSE TMX Canada 60-Day Treasury Bill Index (50%), rose 0.35%over the same period.
A defensive position in corporate debt was taken over the period,with a focus on high-quality issues where credit risk and liquidityrisk were minimized. This protected the Fund’s primary objectivesof preserving capital and providing liquidity. The return, over andabove alternative government notes, from the defensive corporateposition was modest over the six months but generallycommensurate with the reduced level of risk. An allocation tocorporate notes is usually positive for performance due to thehigher yields they can offer over government-backed alternatives.However, these notes come with additional risks that may beunsuitable for the Fund at any level of compensation.
We work within an extensive network of global credit researchanalysts to ensure that a prudent security selection process is inplace. We also look to add value by adjusting the weighted-average-maturity (or duration) of the Fund’s holdings relative to itsbenchmark. For the first half of the year, the Fund’s duration wastargeted close to its blended 45-day benchmark, mitigating anyrelative interest rate risk.
Recent DevelopmentsThe Bank of Canada’s January 25-basis-point rate cut was taken toaid the economy’s transition to non-energy manufacturing growth,while cushioning it from the near-term energy sector hit.Economic activity did contract over the first four months of theyear as energy sector investment was reduced in response tolower oil prices. As the year unfolds, other segments of theeconomy should strengthen and provide an important offset,supported by an improving US outlook and weaker Canadiandollar.
Recent readings on consumer price inflation remain muted and theoutlook continues to be quite benign, as the recent upward pricepressures appear to be temporary, wage pressures remaingenerally tame and surveyed inflation expectations remain well-anchored within the Bank of Canada’s 1-3% target range. Amodest growth outlook and soft underlying price pressures shouldallow the Bank of Canada to remain on hold or potentially cut ratesagain later in the year.
The Fund remains focused on high-quality government andcorporate issues where liquidity risk and credit risk are minimized.The Fund’s primary objectives are to preserve capital and provideliquidity.
Related Party TransactionsWe, on behalf of the Fund, or the Fund Manager, may, from time totime, enter into transactions or arrangements with or involving othermembers of the HSBC Group or other people or companies relatedor connected to us or the Fund. To proceed with the transactions,the Fund relies on the positive recommendation of the Fund’sIndependent Review Committee. A condition of this positiverecommendation is that the transactions are performed inaccordance with our policy on Related Party Transactions. For moregeneral information on persons related to the Fund and the types ofpotential transactions, see the Fund’s Simplified Prospectus.
The following is a summary of current transactions andarrangements with entities that are related to us or the Fund.
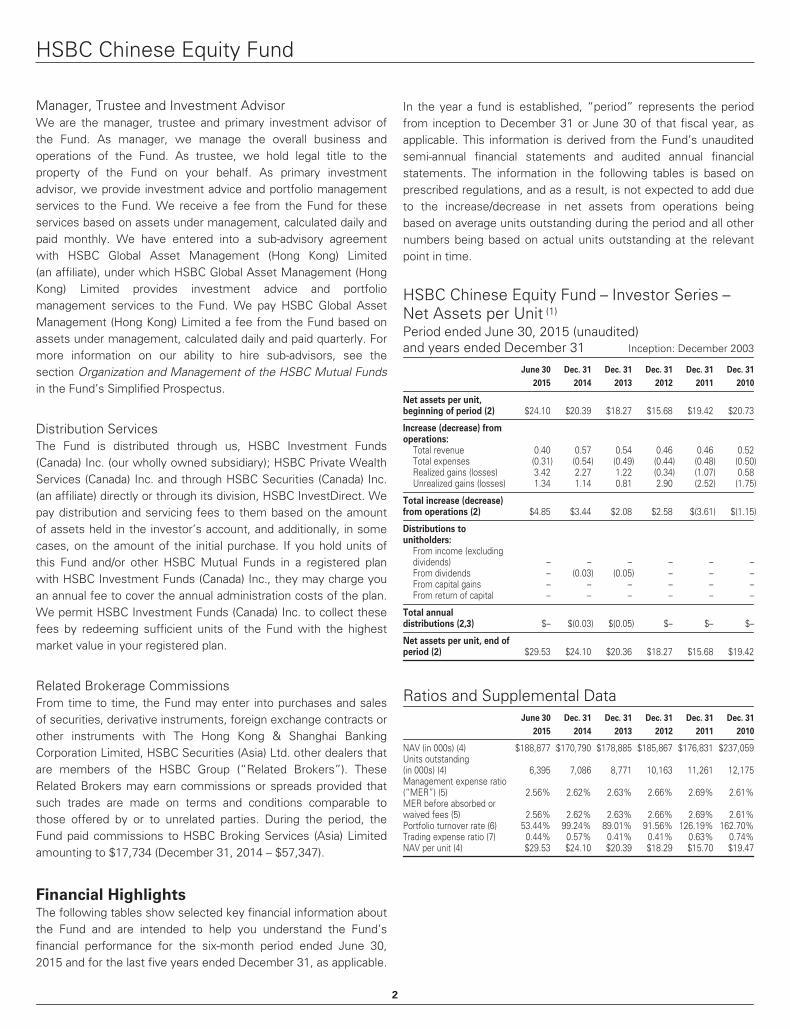
Manager, Trustee and Investment AdvisorWe are the manager, trustee and primary investment advisor of theFund. As manager, we manage the overall business and operationsof the Fund. As trustee, we hold legal title to the property of the
1
HSBC Canadian Money Market Fund
Fund on your behalf. As primary investment advisor, we provideinvestment advice and portfolio management services to the Fund.We receive a fee from the Fund for these services based on assetsunder management, calculated daily and paid monthly.
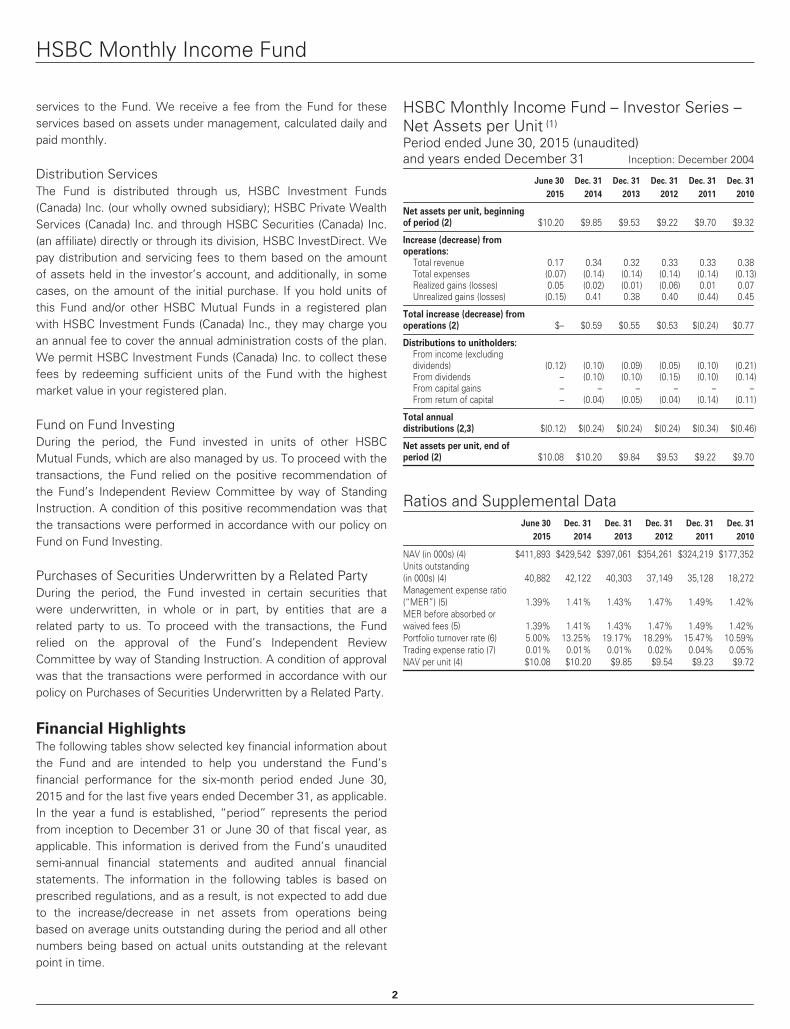
Distribution ServicesThe Fund is distributed through us, HSBC Investment Funds(Canada) Inc. (our wholly owned subsidiary); HSBC Private WealthServices (Canada) Inc. and through HSBC Securities (Canada) Inc.(an affiliate) directly or through its division, HSBC InvestDirect. Wepay distribution and servicing fees to them based on the amountof assets held in the investor’s account, and additionally, in somecases, on the amount of the initial purchase. If you hold units ofthis Fund and/or other HSBC Mutual Funds in a registered planwith HSBC Investment Funds (Canada) Inc., they may charge youan annual fee to cover the annual administration costs of the plan.We permit HSBC Investment Funds (Canada) Inc. to collect thesefees by redeeming sufficient units of the Fund with the highestmarket value in your registered plan.
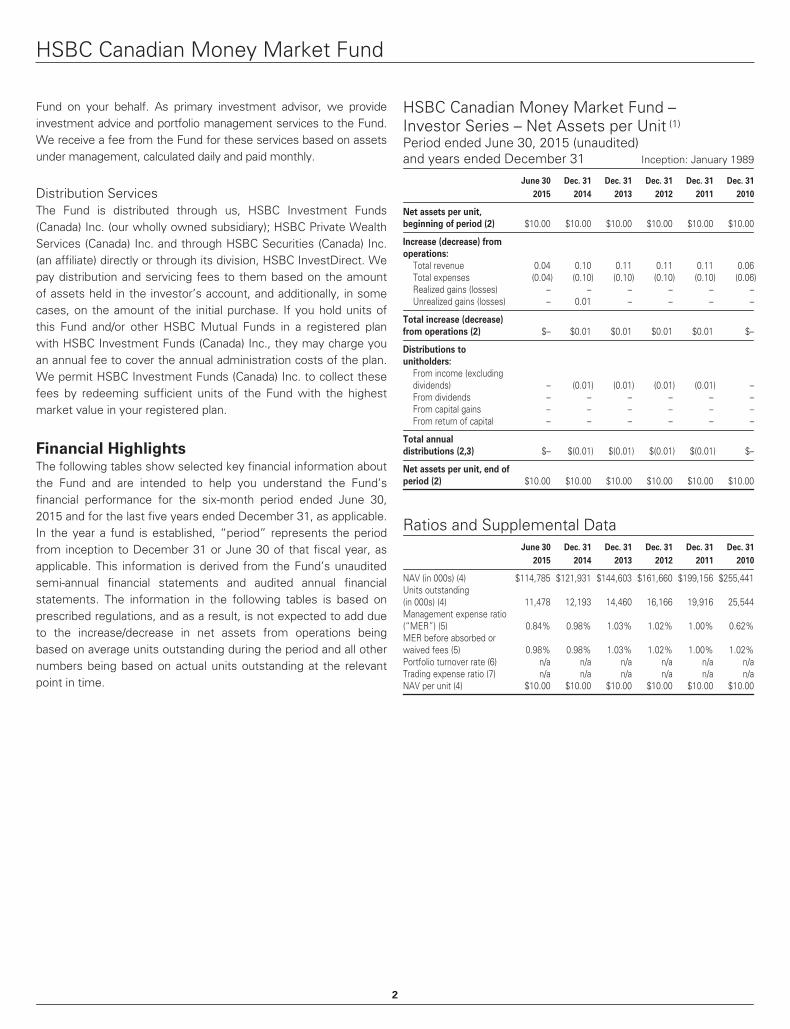
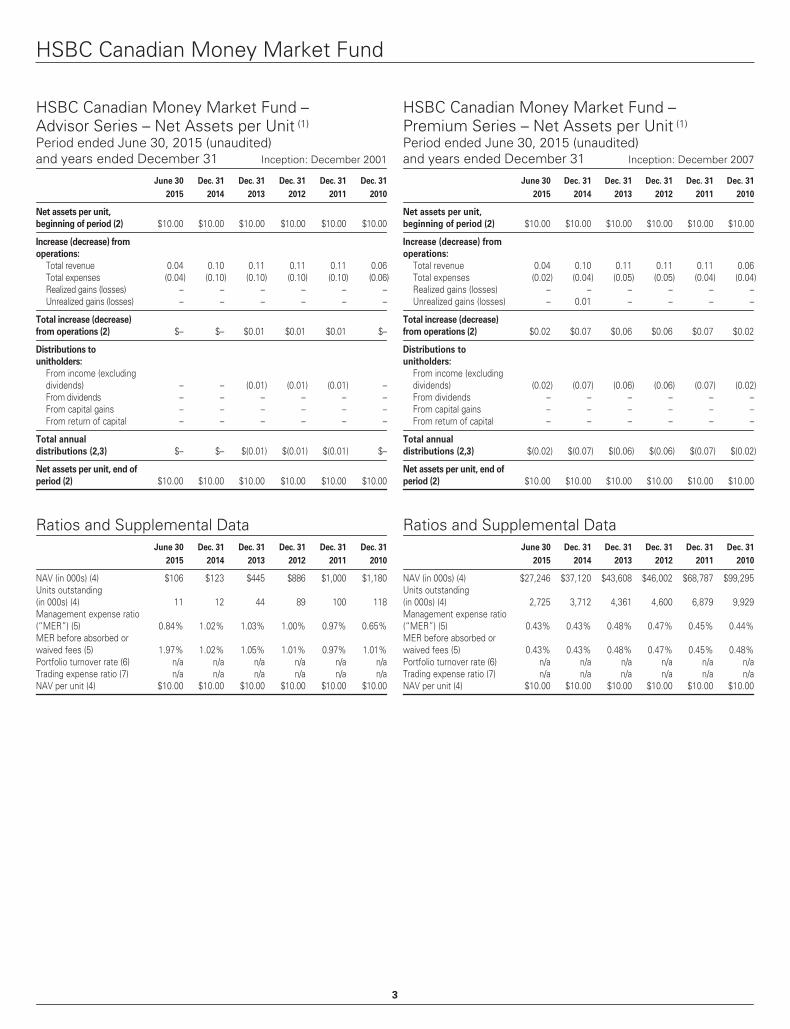
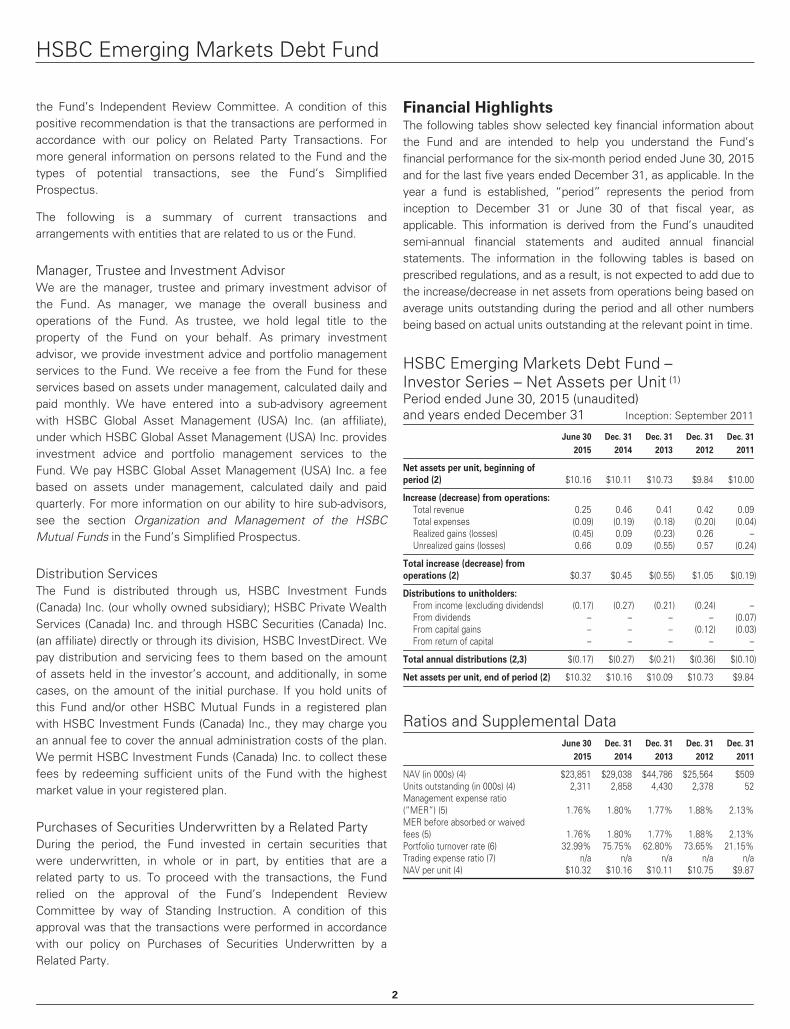
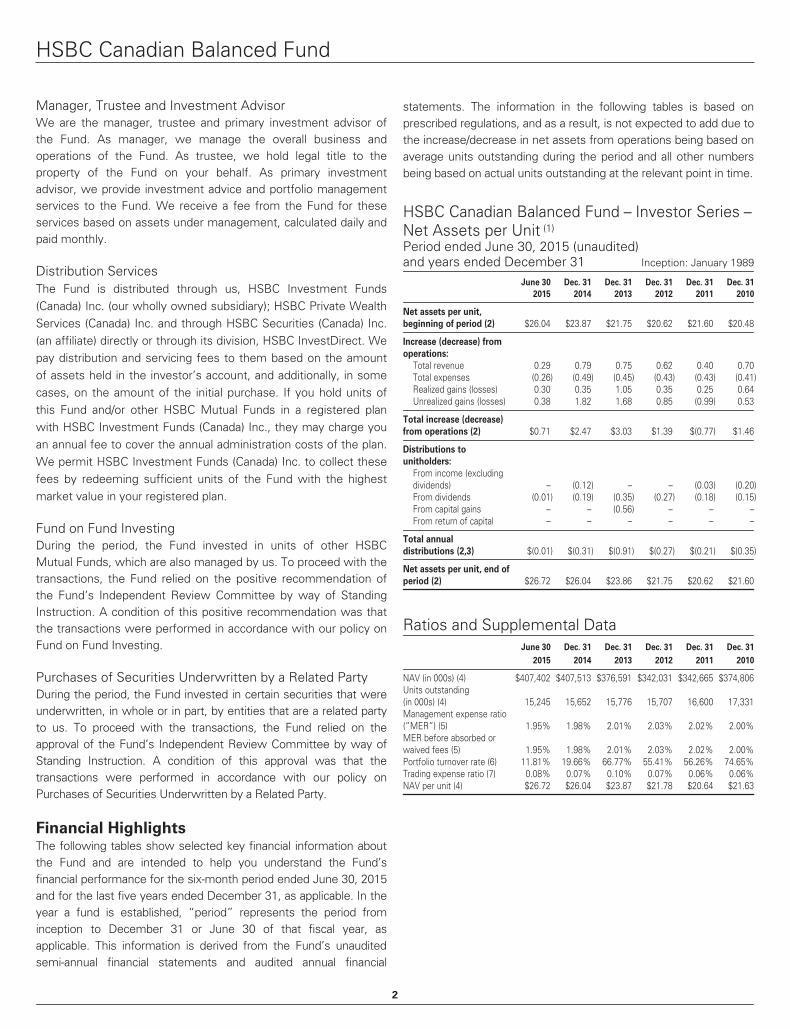
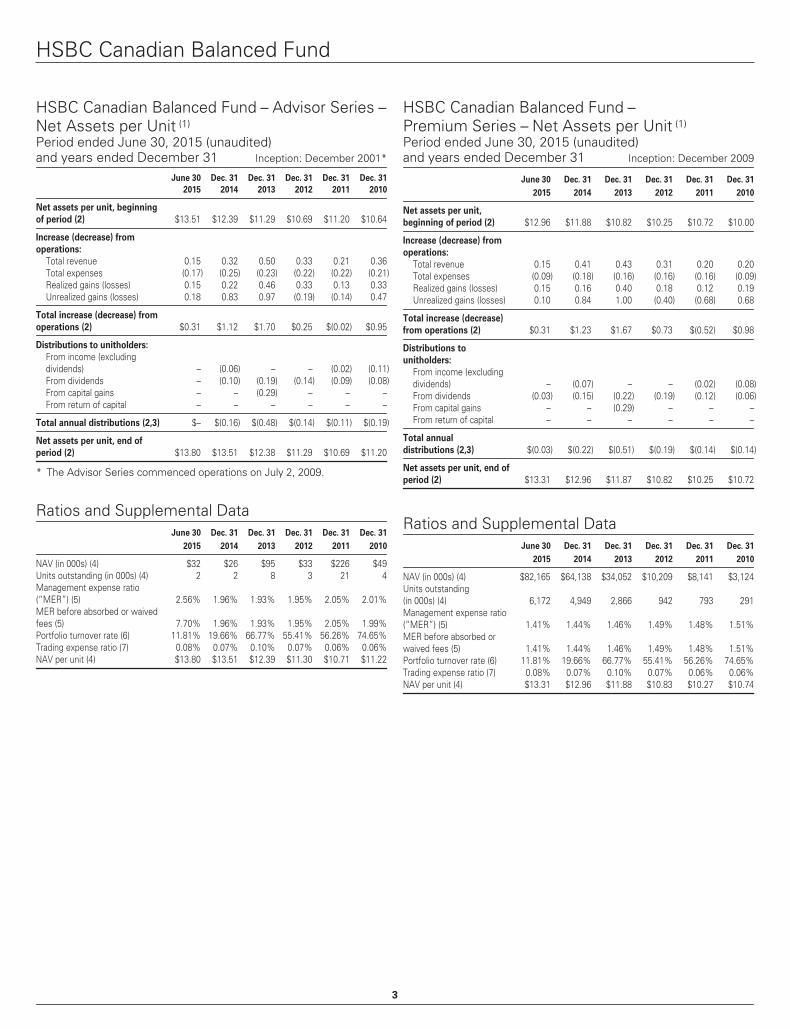
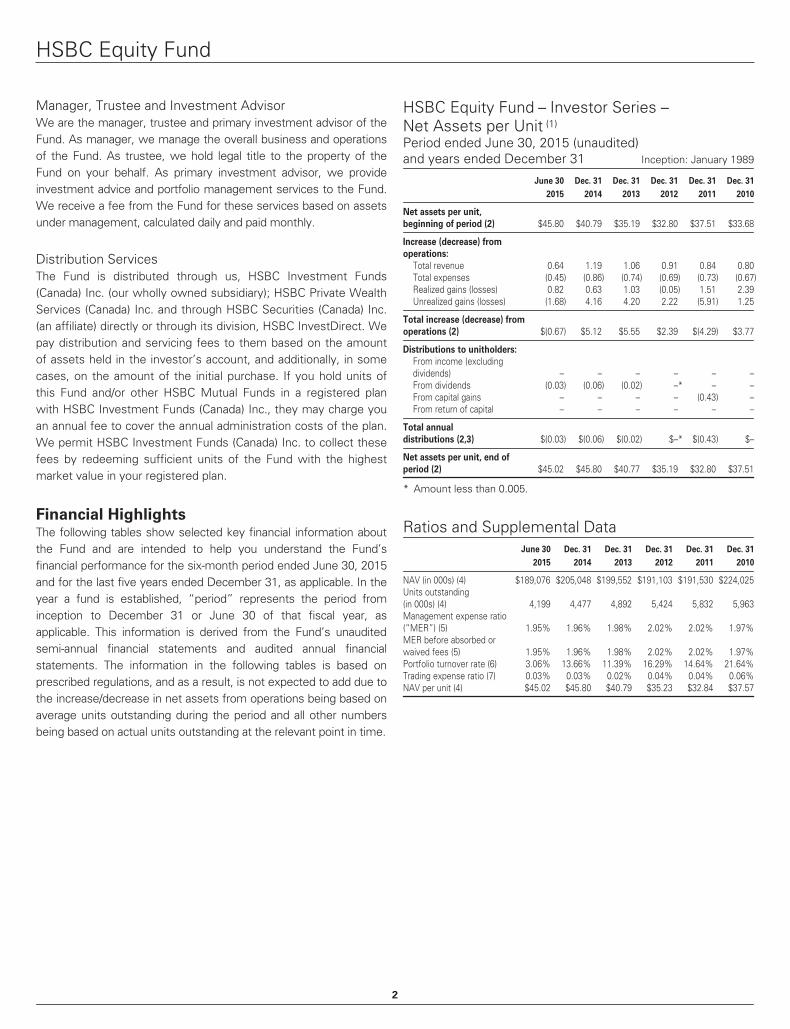
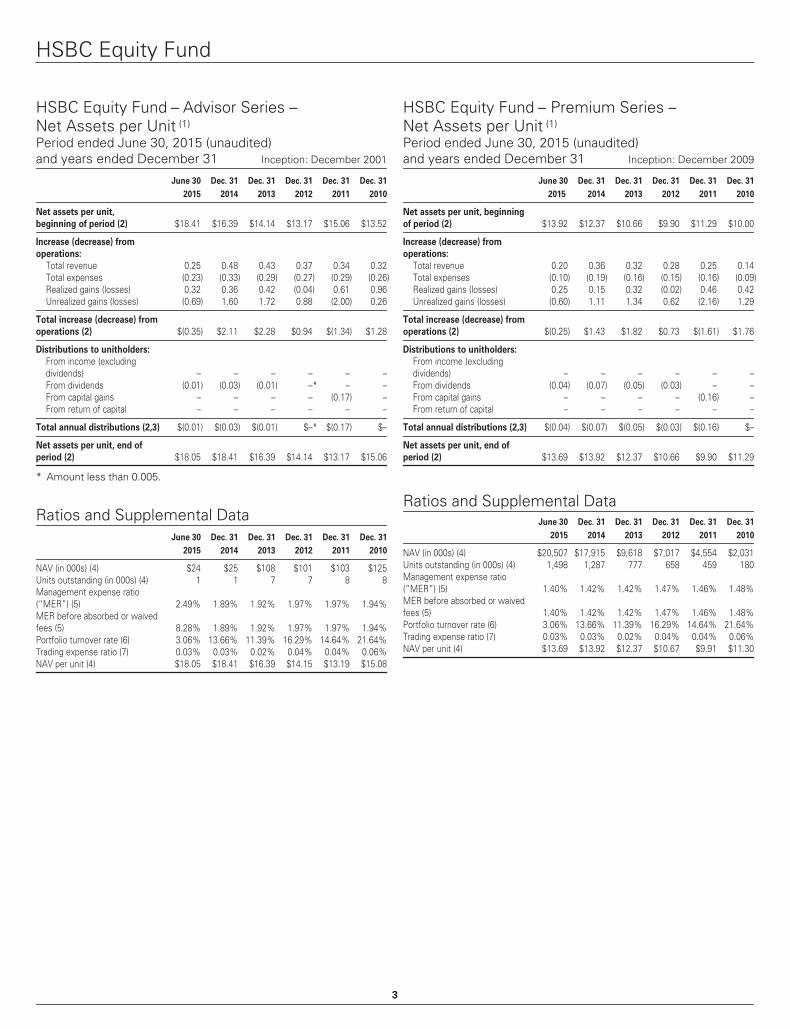
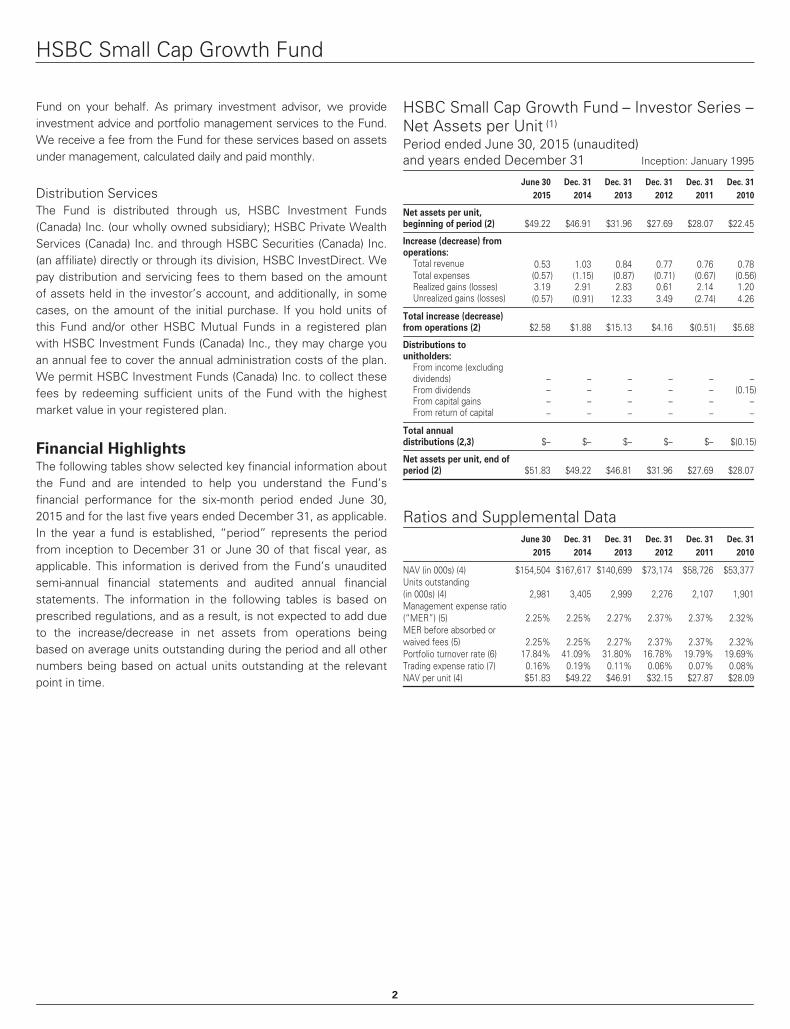
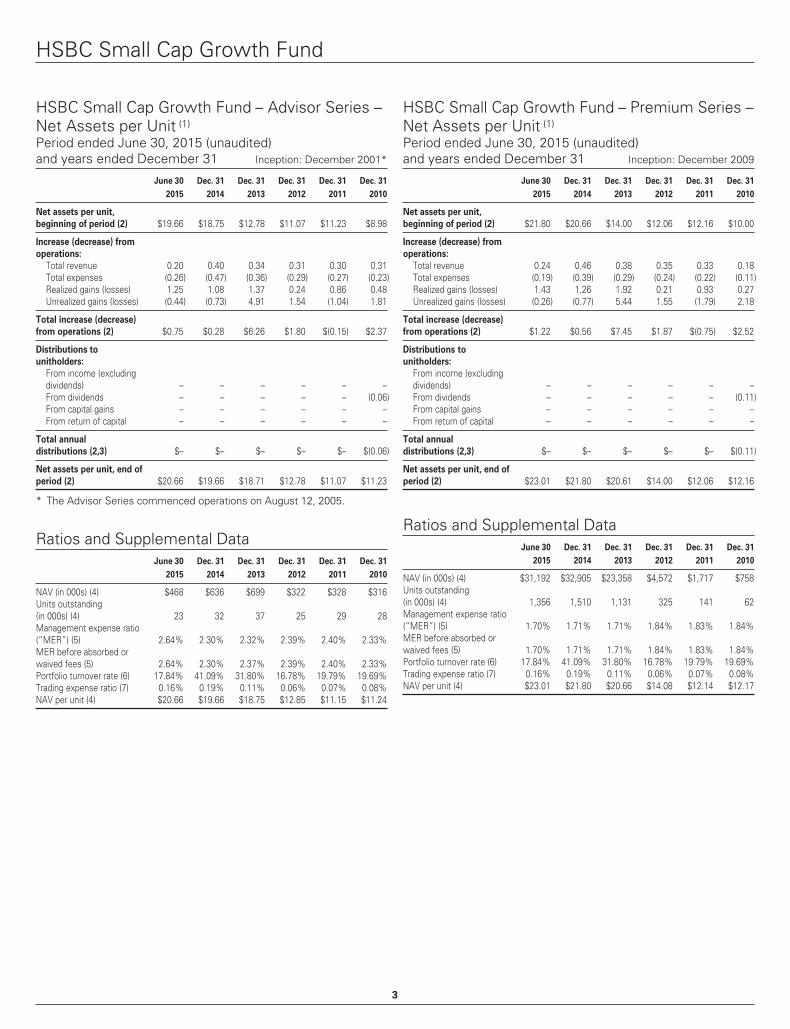
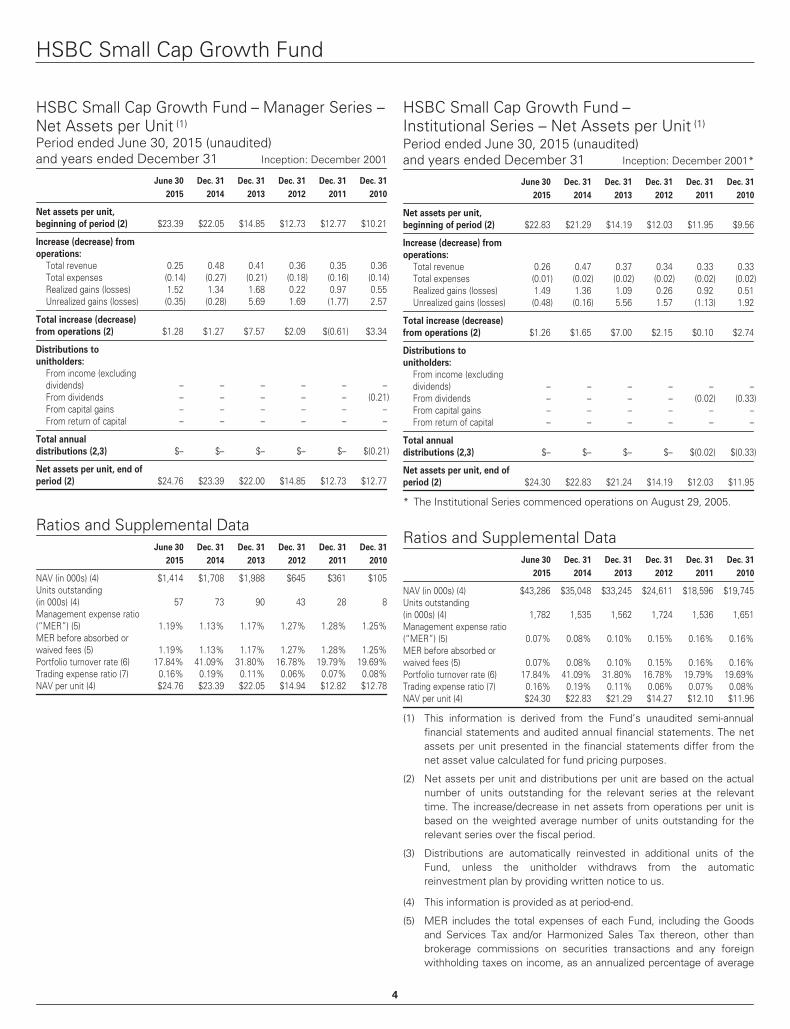
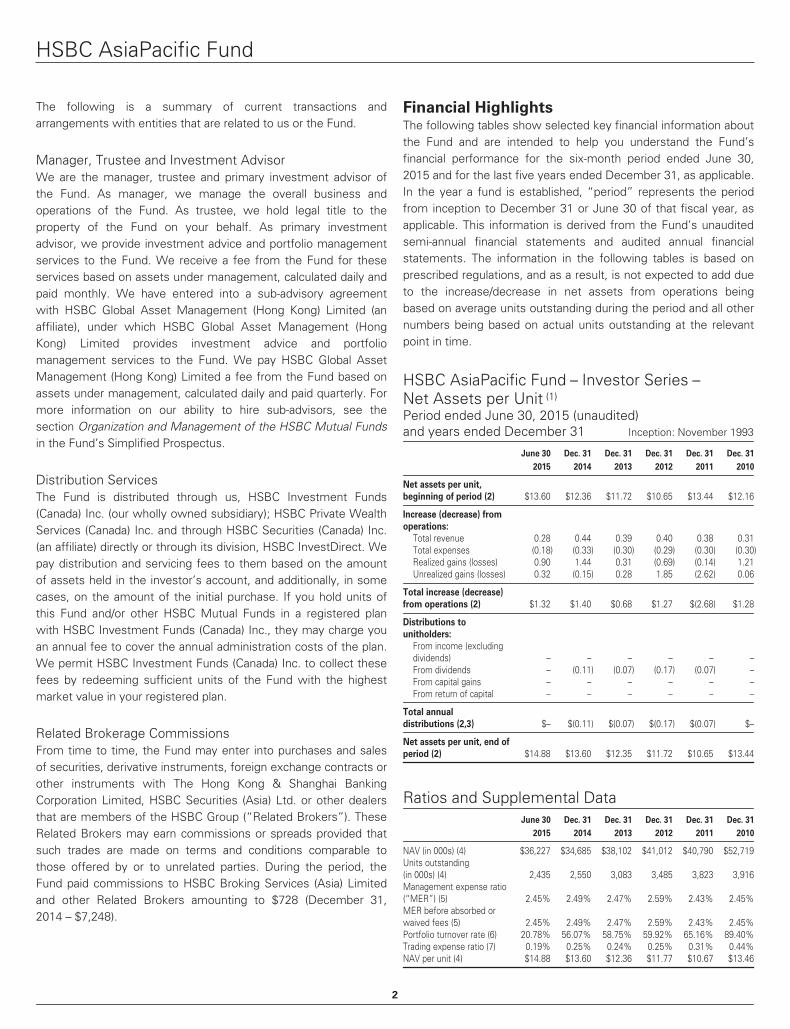
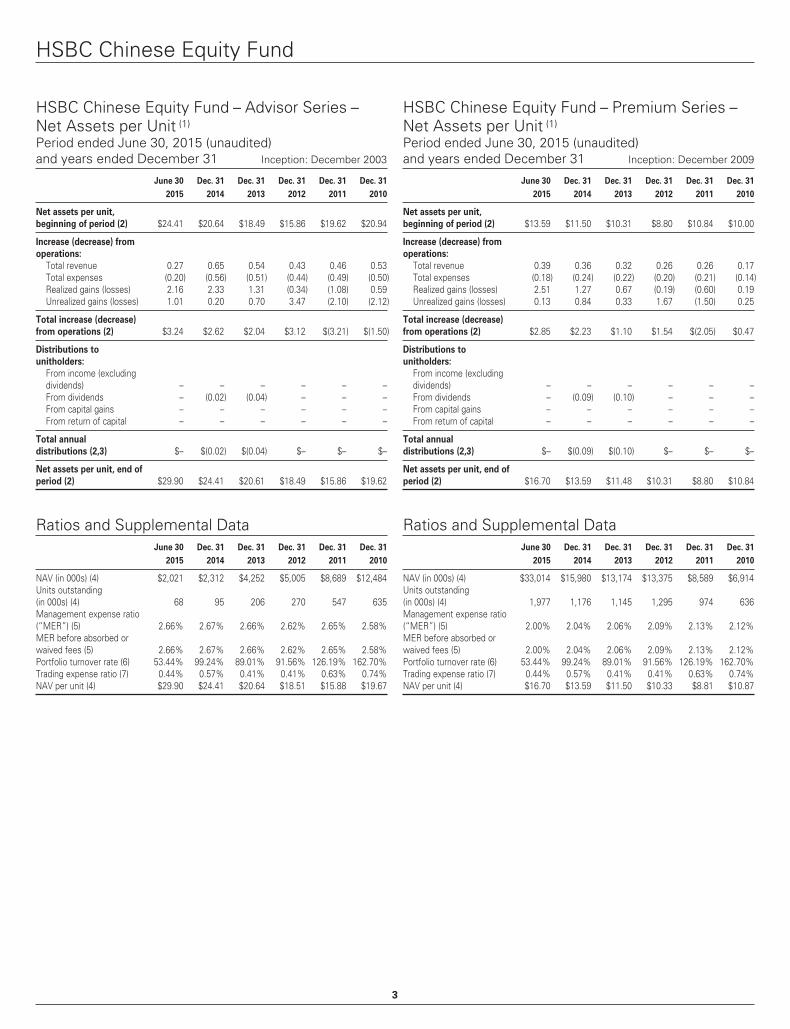
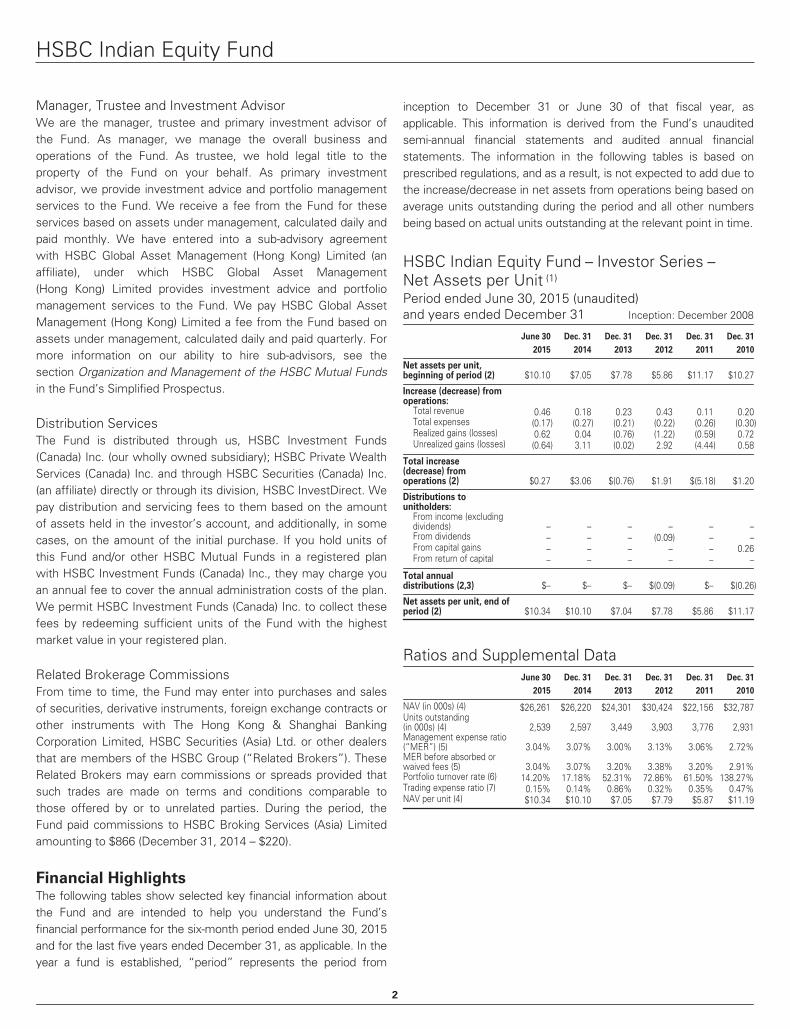
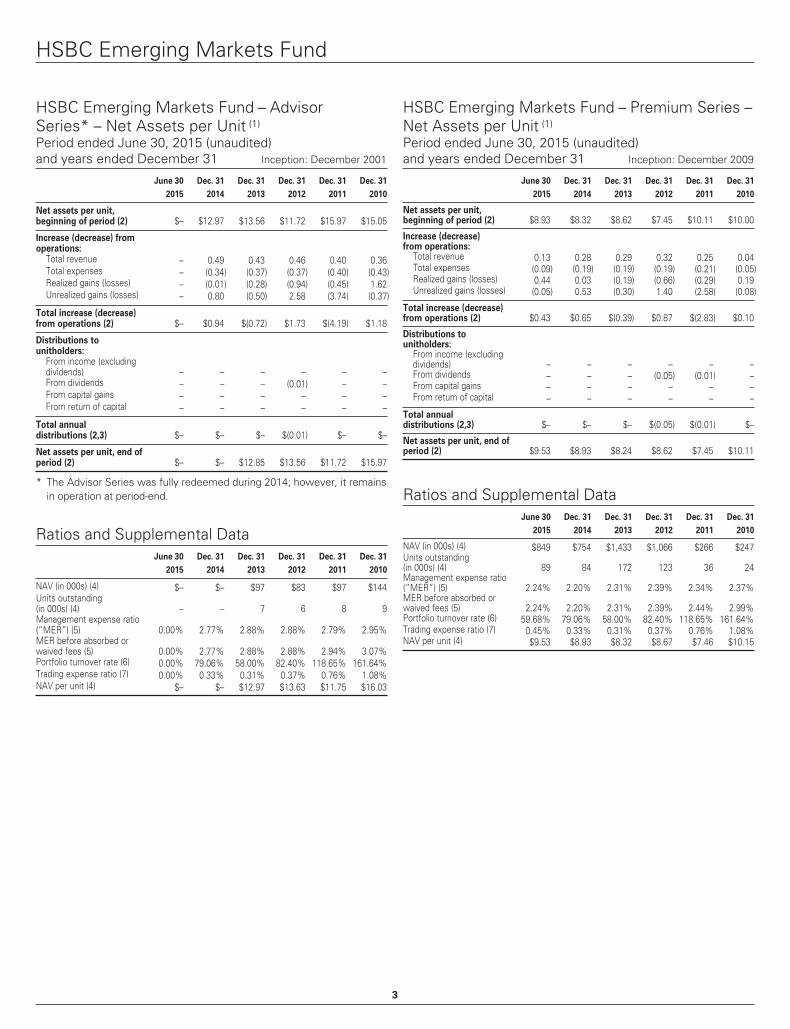
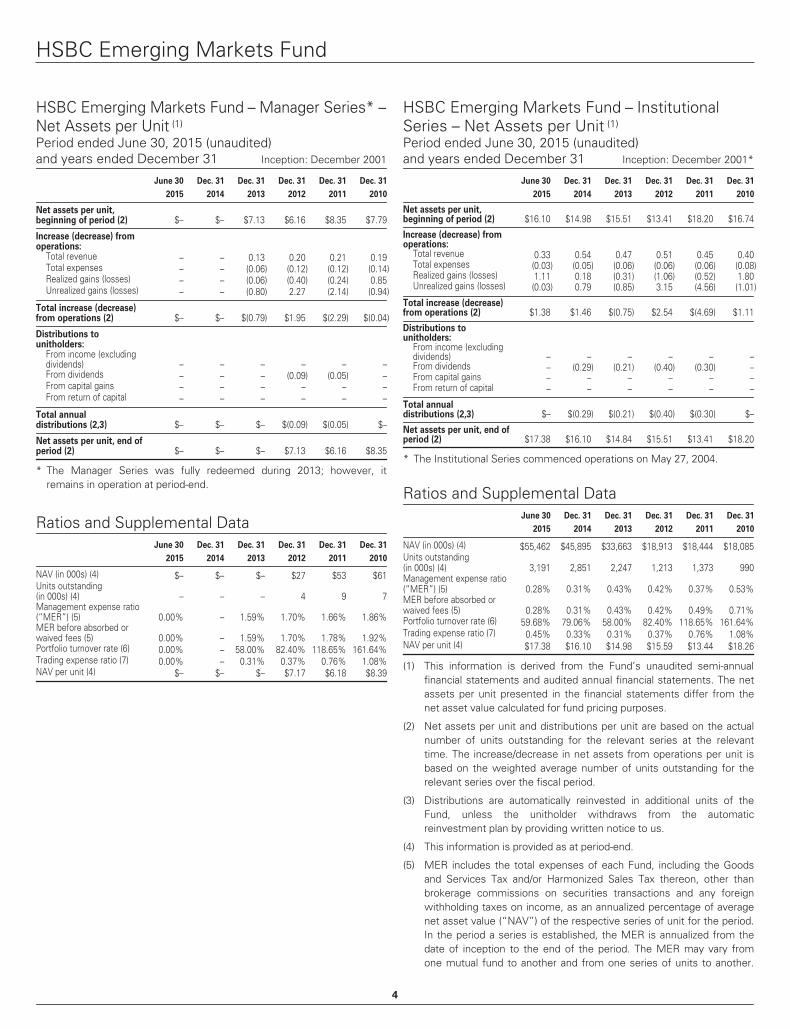
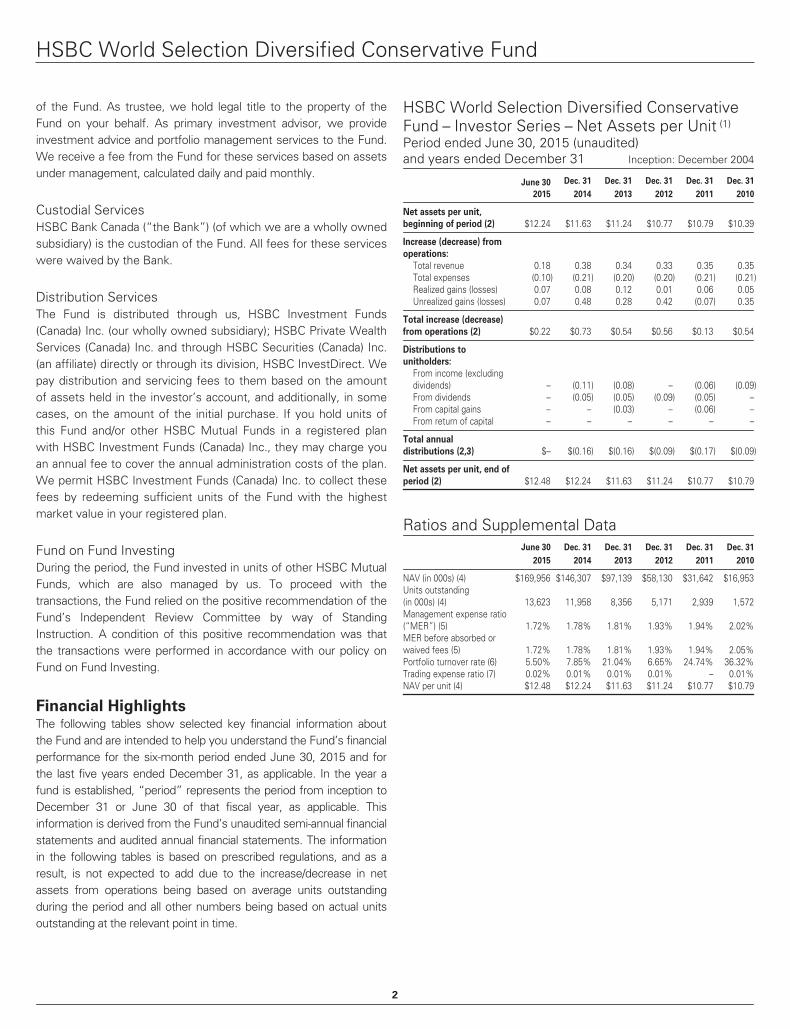
Financial HighlightsThe following tables show selected key financial information aboutthe Fund and are intended to help you understand the Fund’sfinancial performance for the six-month period ended June 30,2015 and for the last five years ended December 31, as applicable.In the year a fund is established, “period” represents the periodfrom inception to December 31 or June 30 of that fiscal year, asapplicable. This information is derived from the Fund’s unauditedsemi-annual financial statements and audited annual financialstatements. The information in the following tables is based onprescribed regulations, and as a result, is not expected to add dueto the increase/decrease in net assets from operations beingbased on average units outstanding during the period and all othernumbers being based on actual units outstanding at the relevantpoint in time.
HSBC Canadian Money Market Fund –Investor Series – Net Assets per Unit (1)
Period ended June 30, 2015 (unaudited)and years ended December 31 Inception: January 1989
June 30
2015
Dec. 31
2014
Dec. 31
2013
Dec. 31
2012
Dec. 31
2011
Dec. 31
2010
Net assets per unit,
beginning of period (2) $10.00 $10.00 $10.00 $10.00 $10.00 $10.00
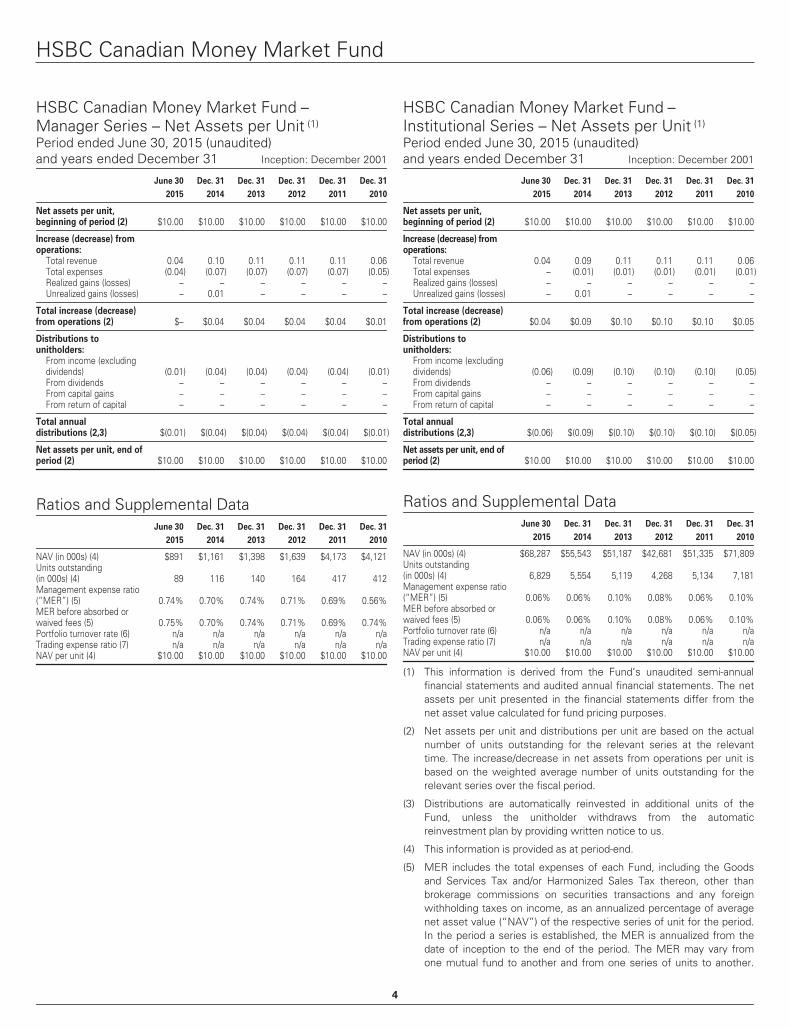
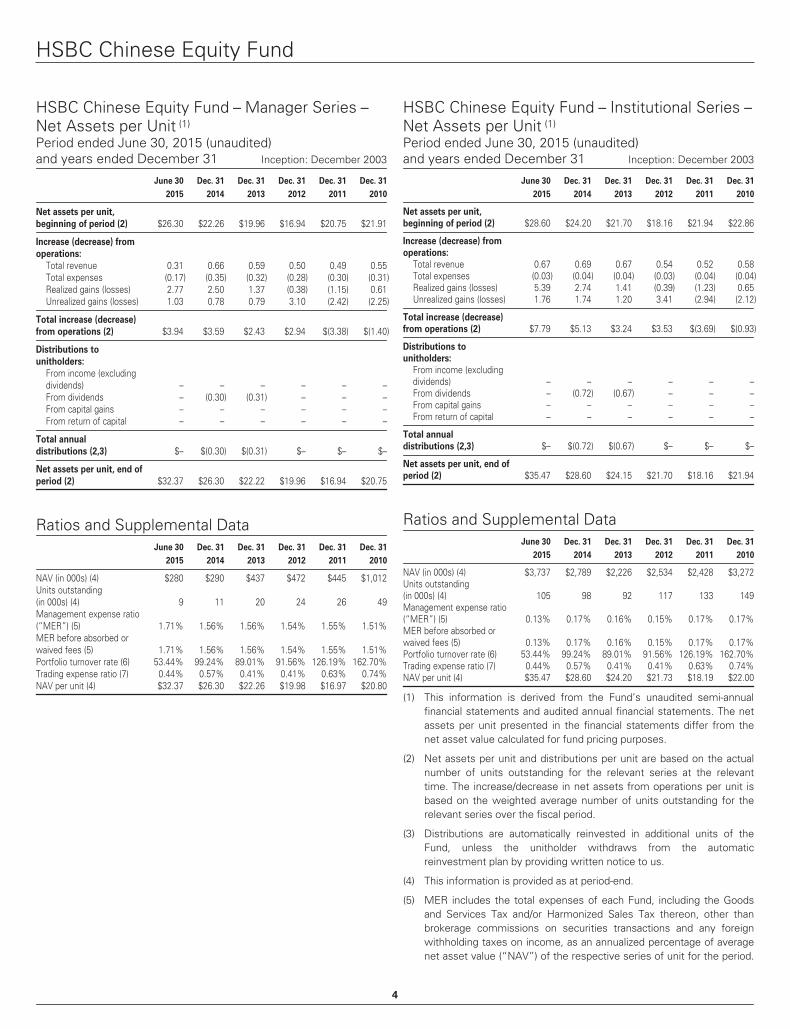
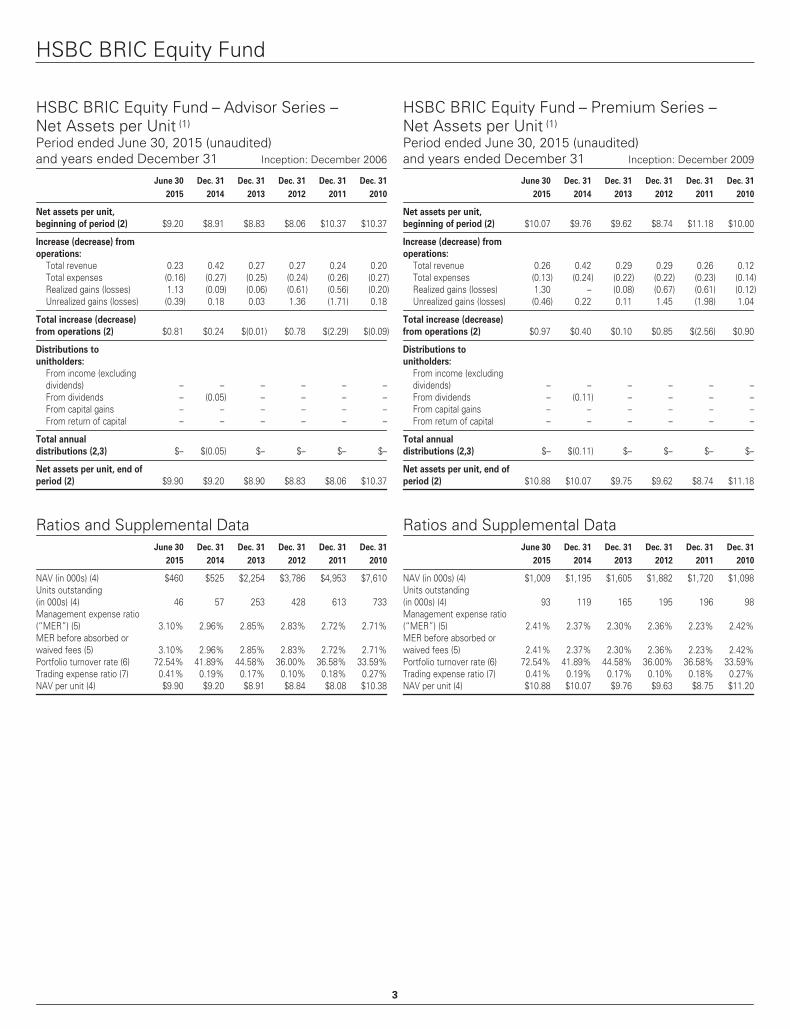
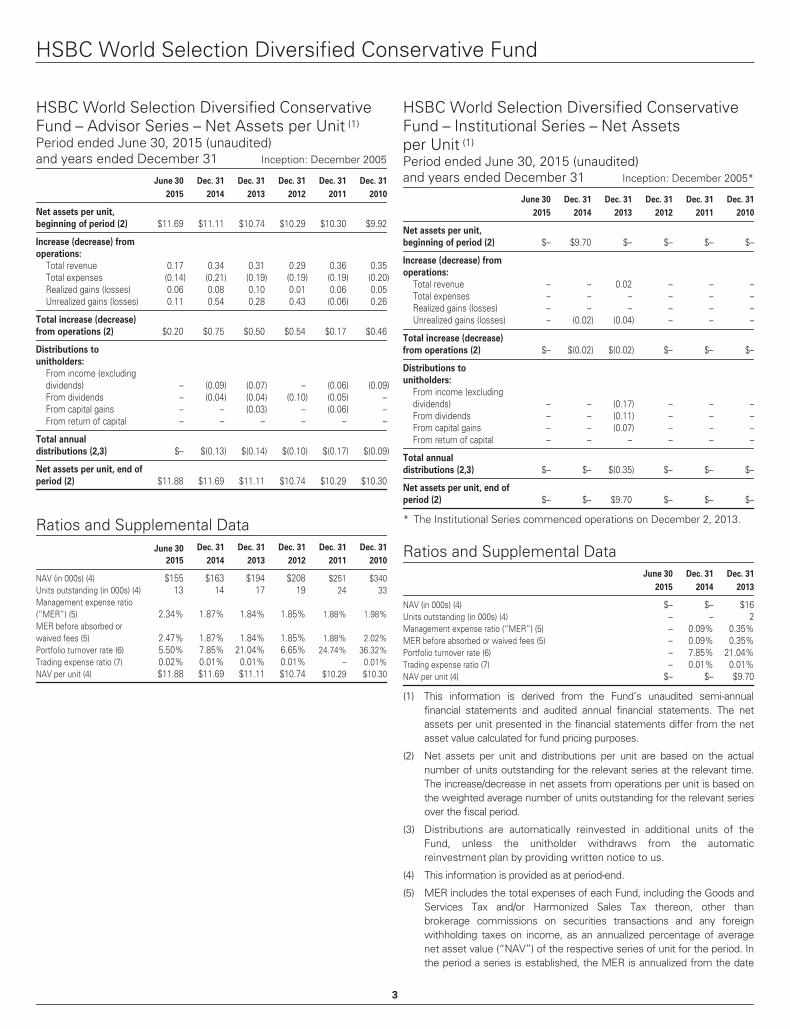
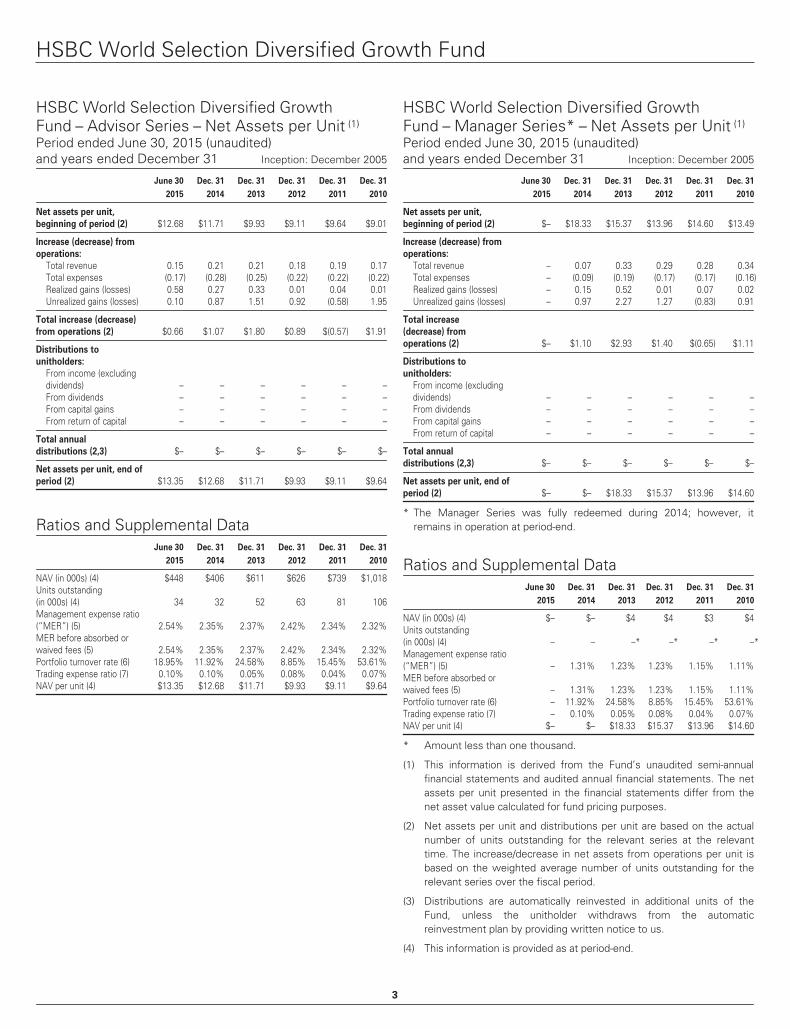
(1) This information is derived from the Fund’s unaudited semi-annualfinancial statements and audited annual financial statements. The netassets per unit presented in the financial statements differ from thenet asset value calculated for fund pricing purposes.
(2) Net assets per unit and distributions per unit are based on the actualnumber of units outstanding for the relevant series at the relevanttime. The increase/decrease in net assets from operations per unit isbased on the weighted average number of units outstanding for therelevant series over the fiscal period.
(3) Distributions are automatically reinvested in additional units of theFund, unless the unitholder withdraws from the automaticreinvestment plan by providing written notice to us.
(4) This information is provided as at period-end.
(5) MER includes the total expenses of each Fund, including the Goodsand Services Tax and/or Harmonized Sales Tax thereon, other thanbrokerage commissions on securities transactions and any foreignwithholding taxes on income, as an annualized percentage of averagenet asset value (“NAV”) of the respective series of unit for the period.In the period a series is established, the MER is annualized from thedate of inception to the end of the period. The MER may vary fromone mutual fund to another and from one series of units to another.
4
HSBC Canadian Money Market Fund
We may have waived or absorbed certain fees and expensesotherwise payable by the Fund. The amount of expenses absorbed orwaived is at the discretion of and can be terminated at any time by us.
(6) The Fund’s portfolio turnover rate indicates how actively the Fund’sportfolio advisor manages its portfolio investments. A portfolio turnoverrate of 100% is equivalent to the Fund buying and selling all of thesecurities in its portfolio once in the course of the period. The higher theFund’s portfolio turnover rate in a period, the greater the trading costspayable by the Fund in the period, and the greater the chance of aninvestor receiving taxable capital gains in the period. There is notnecessarily a relationship between a high turnover rate and theperformance of the Fund. The rate is calculated based on the lesser ofpurchases or sales of securities divided by the average weighted marketvalue of the portfolio securities, excluding short-term securities.
(7) The trading expense ratio represents commissions and other portfoliotransaction costs expressed as an annualized percentage of dailyaverage net asset value during the period.
Management FeesFor the six months ended June 30, 2015, the Fund paid usmanagement fees of $556,699. The management fee for eachseries is calculated as a percentage of the daily net asset value forthat series. The fees are reduced, where required, so that thesefees do not duplicate fees payable by mutual funds in which theFund invests for the same service.
The Fund’s management fees were used by us to pay costs formanaging the investment portfolio, providing investment analysisand recommendations, making investment decisions, makingbrokerage arrangements for the purchase and sale of theinvestment portfolio and providing other services. Themanagement fees also funded commission payments and othercompensation to sales representatives and registered dealers andbrokers (collectively “distribution costs”), including HSBC BankCanada, for units of the Fund bought and held by unitholders.Finally, we used management fees to pay for additional marketingand distribution services to the Fund.
For the six months ended June 30, 2015, approximately 45% ofthe total management fees collected from all HSBC Mutual Fundswere used to fund distribution costs. In comparison, for the Fund,such distribution costs represented 45% of the management feescollected. This may vary by series depending on the assetsinvested in each of the series.
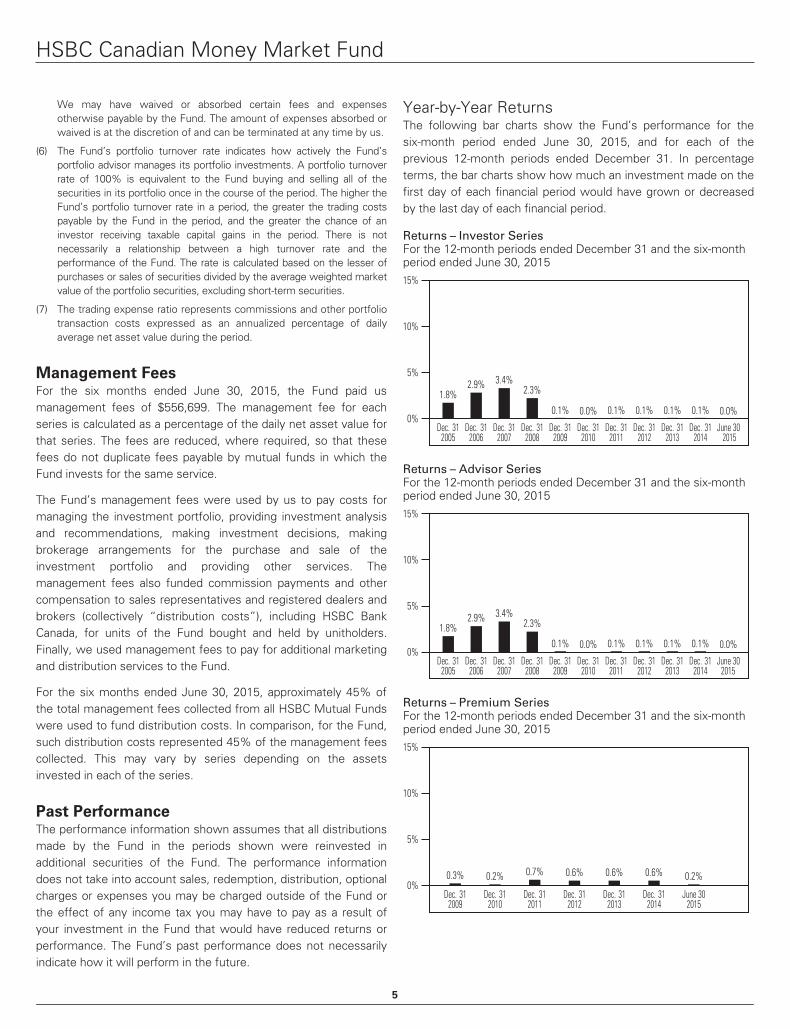
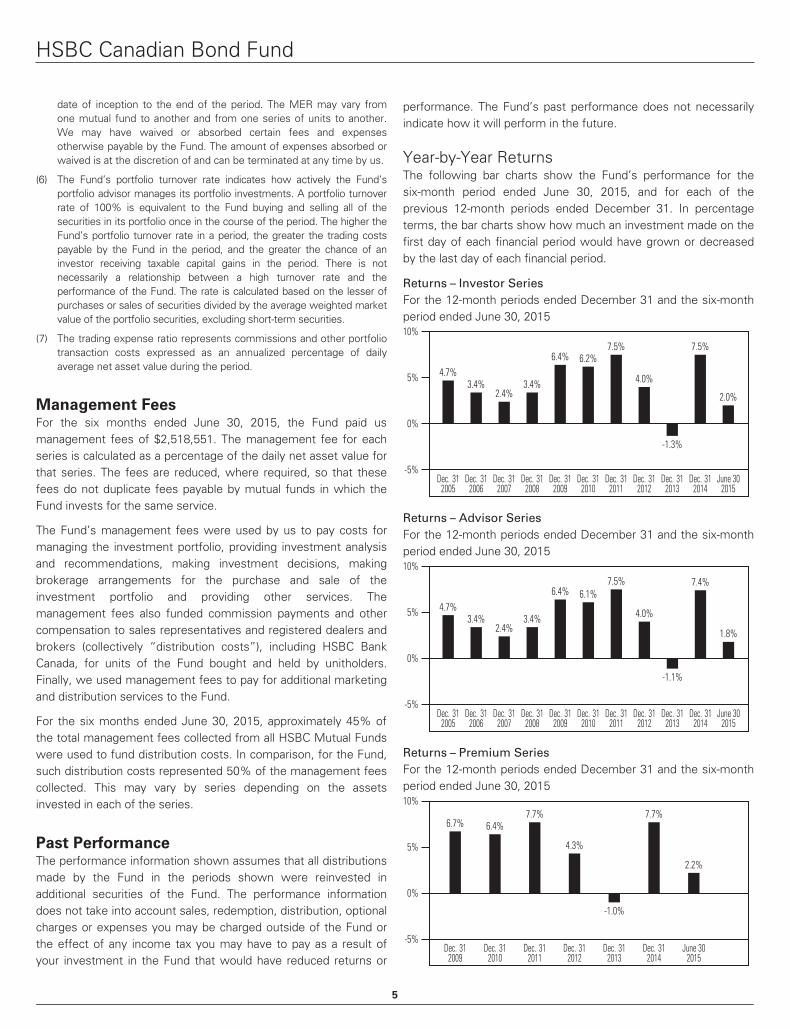
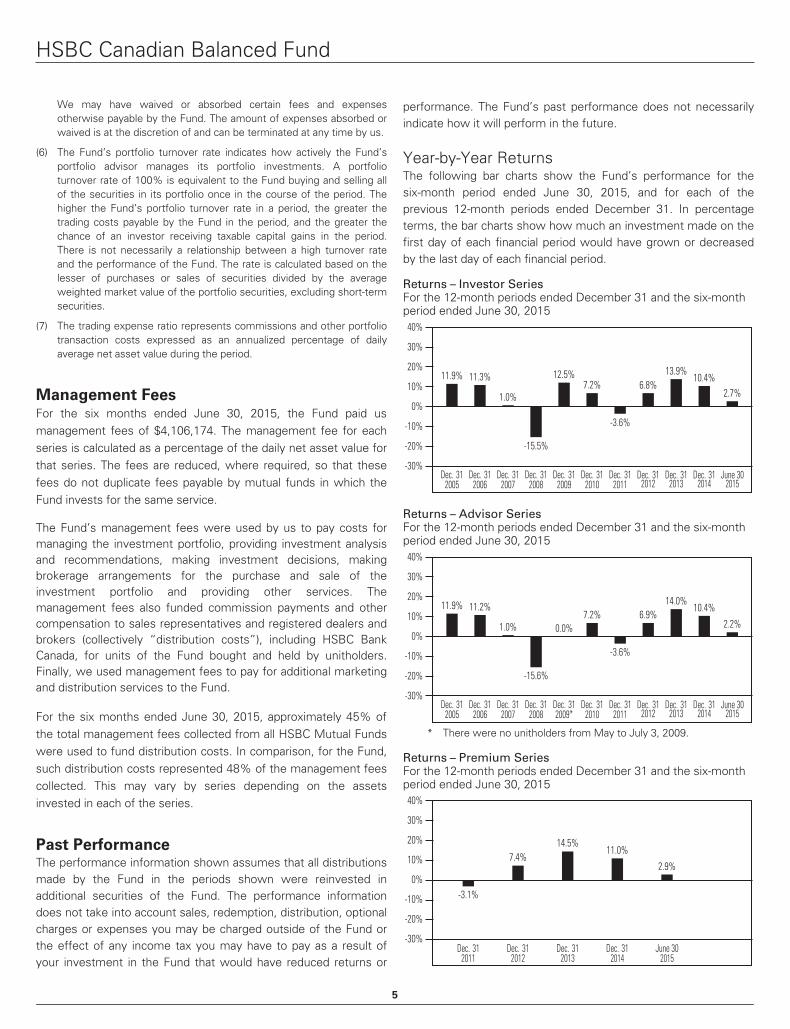
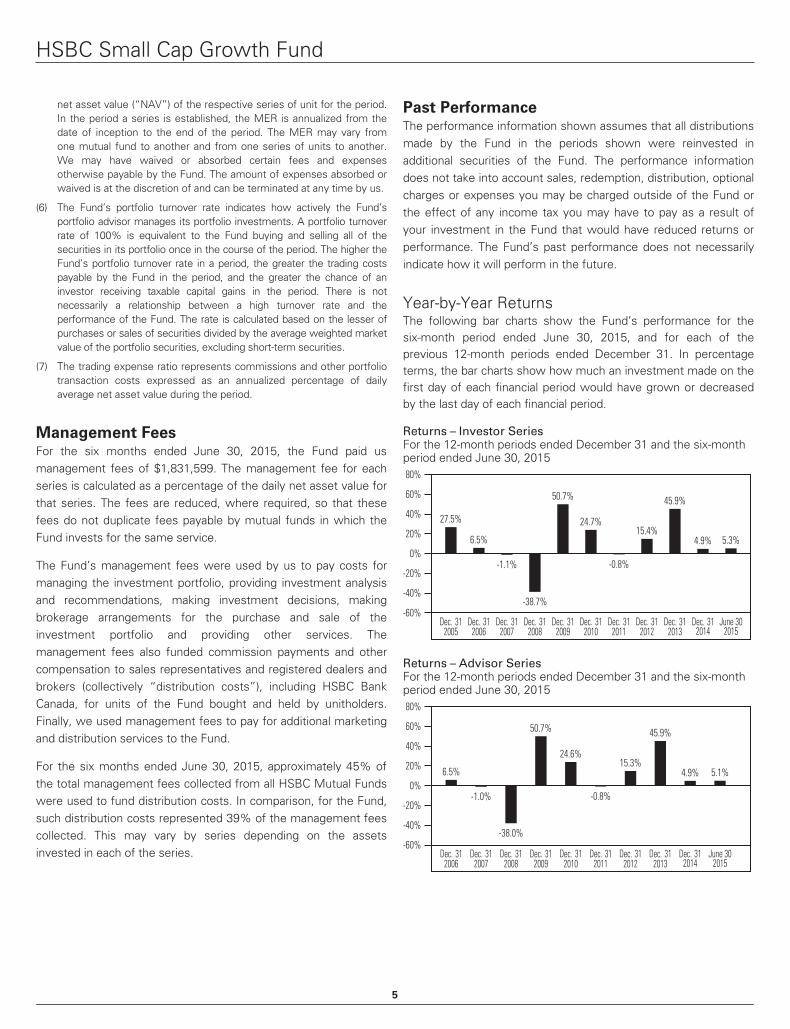
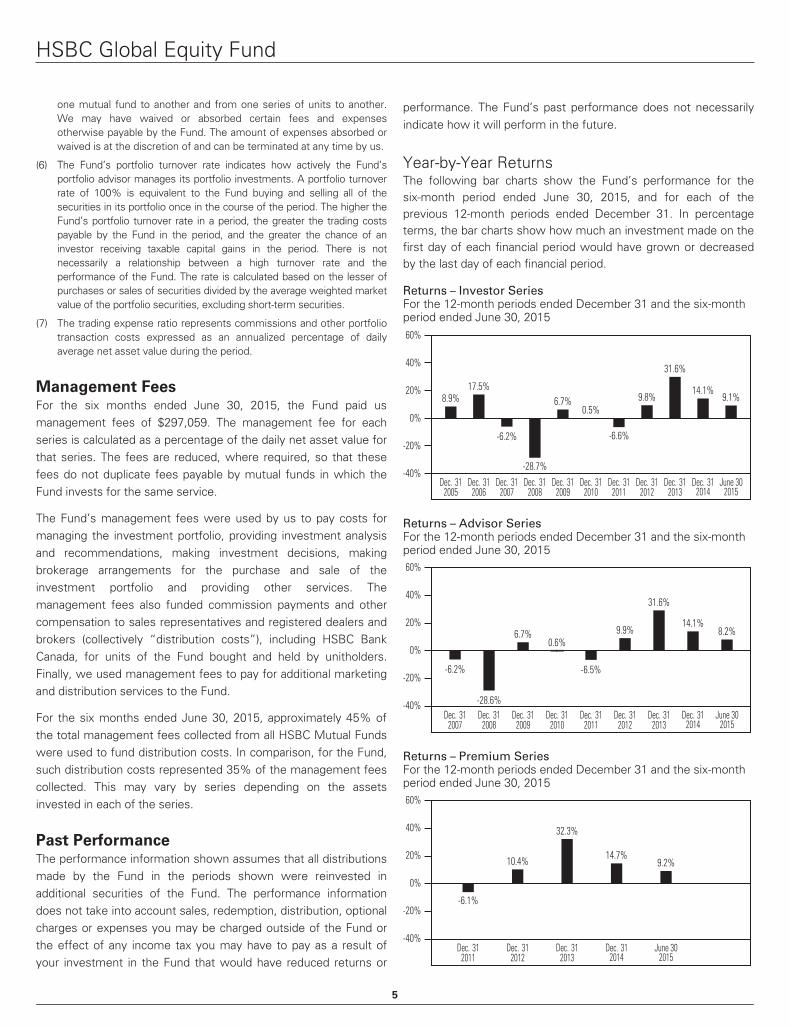
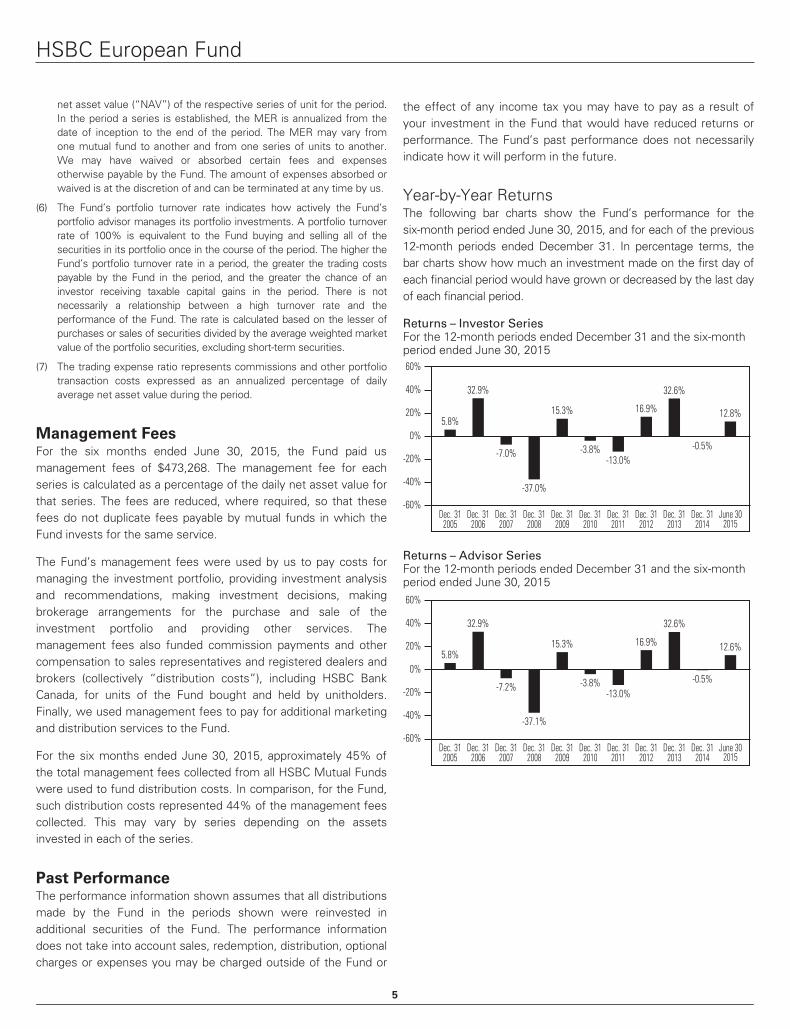
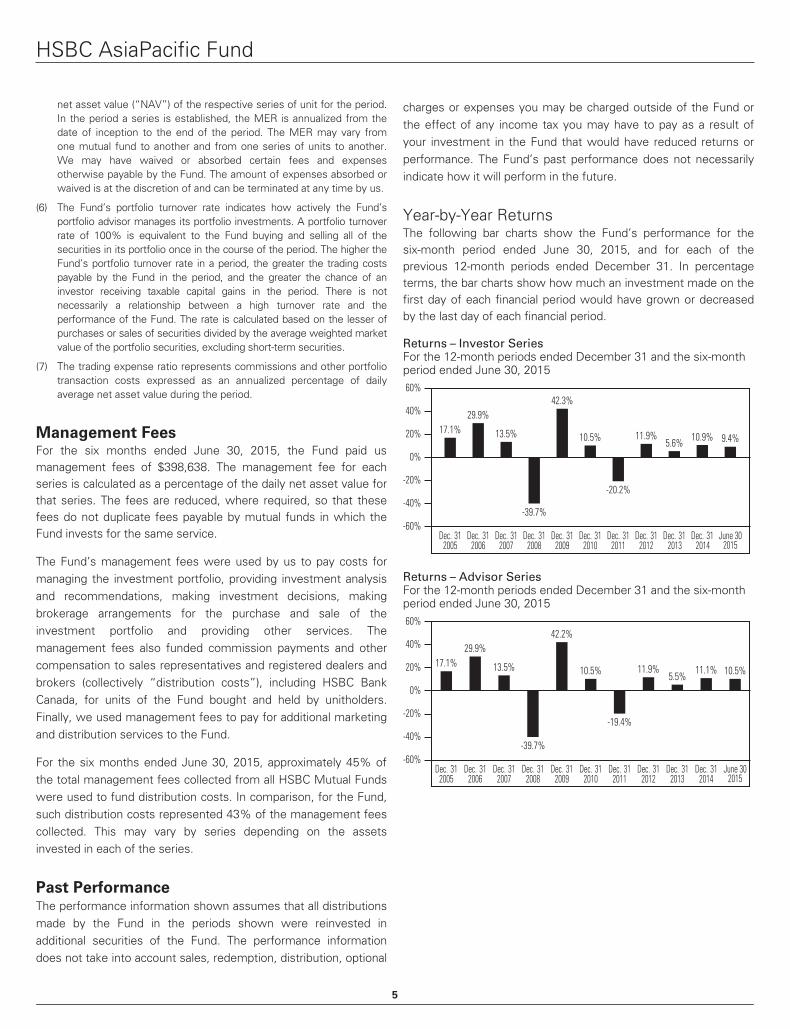
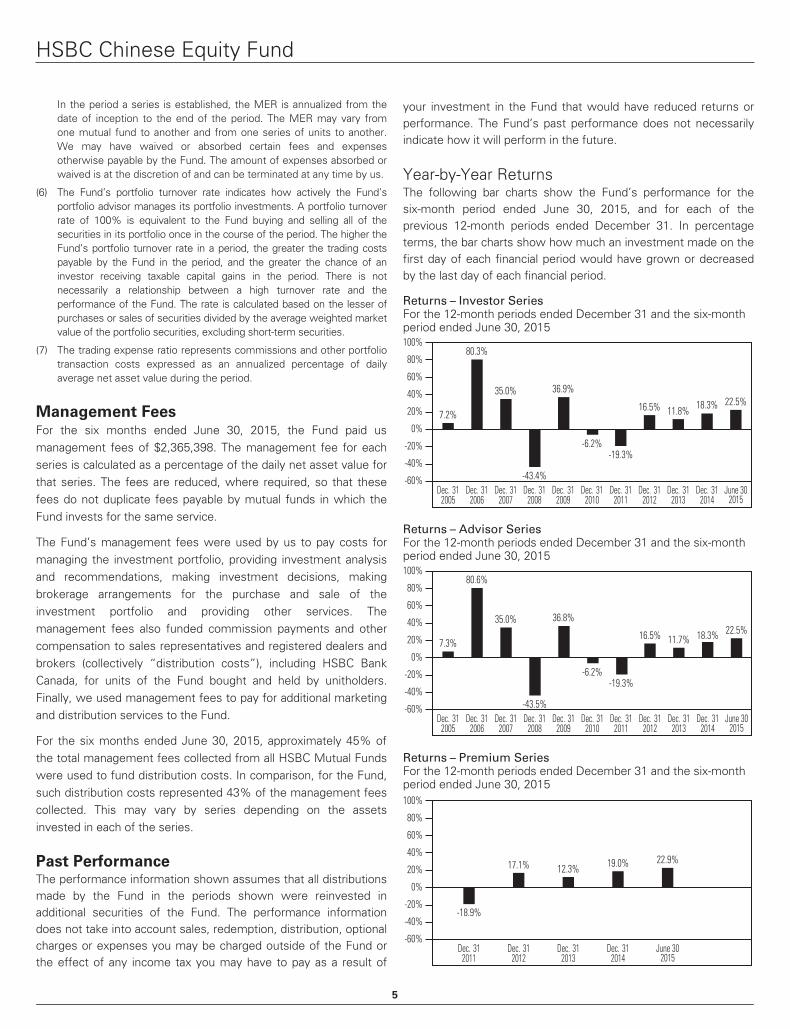
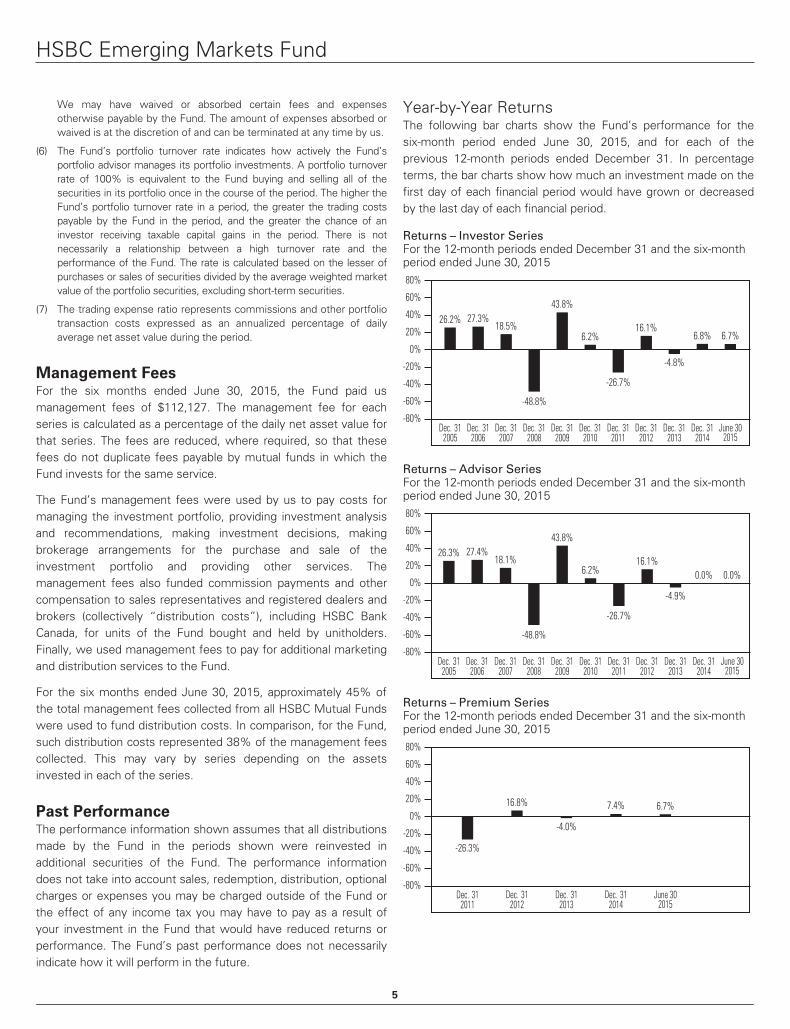
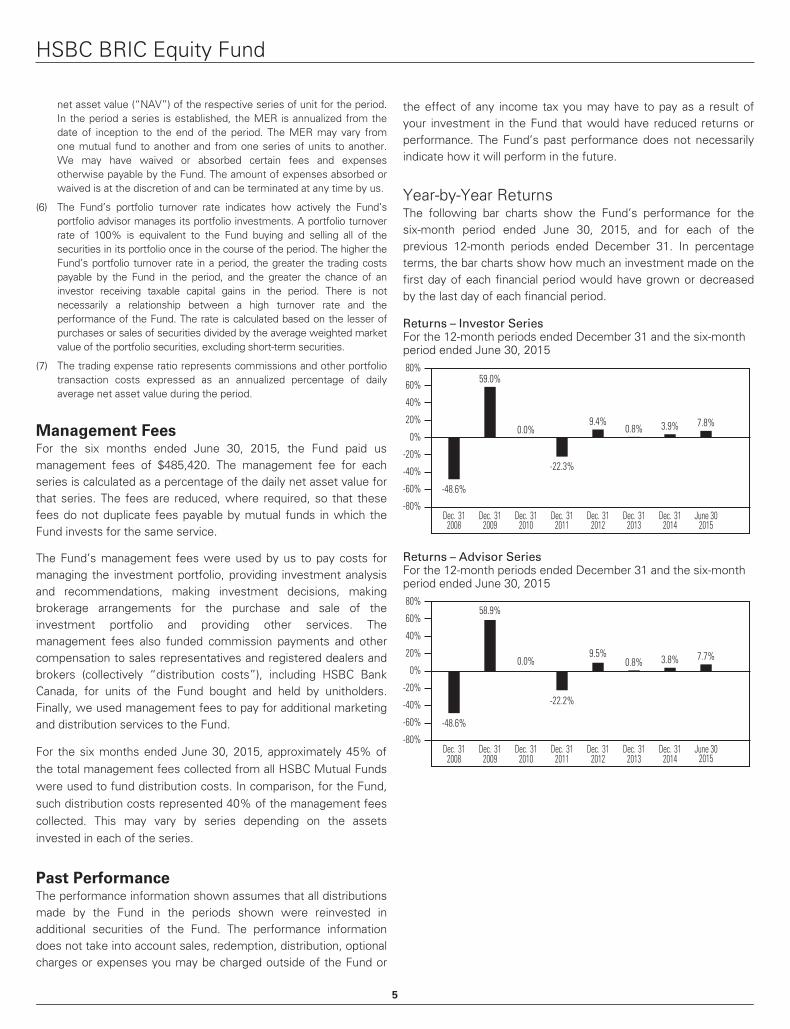
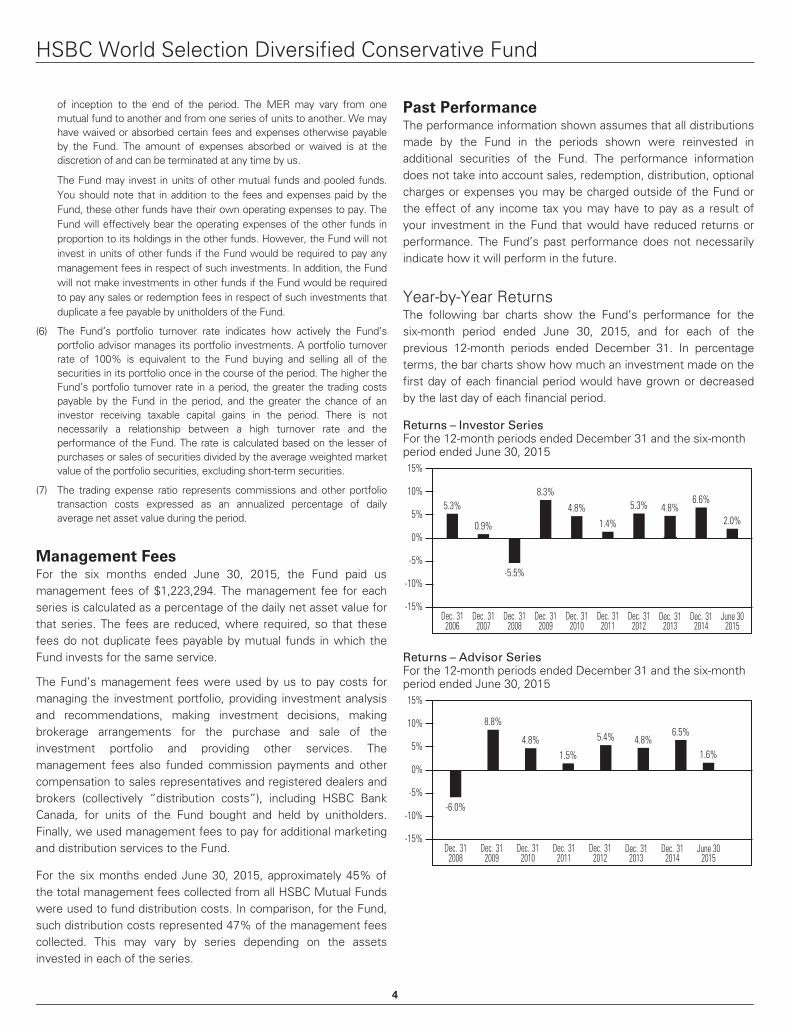
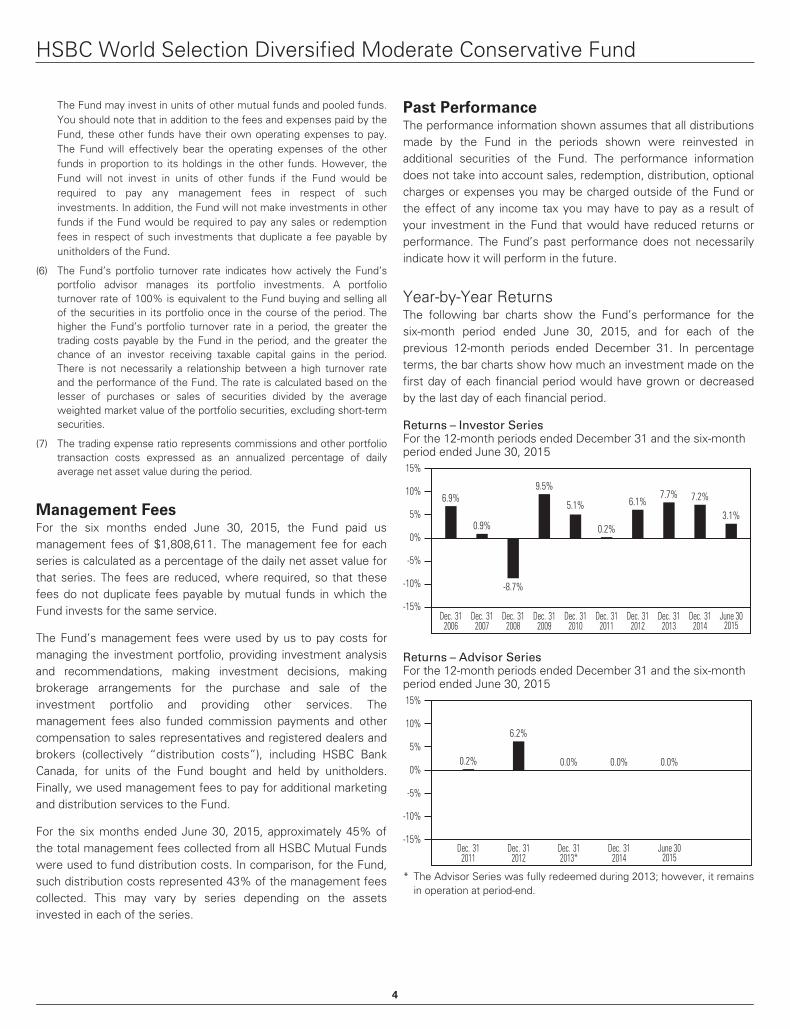
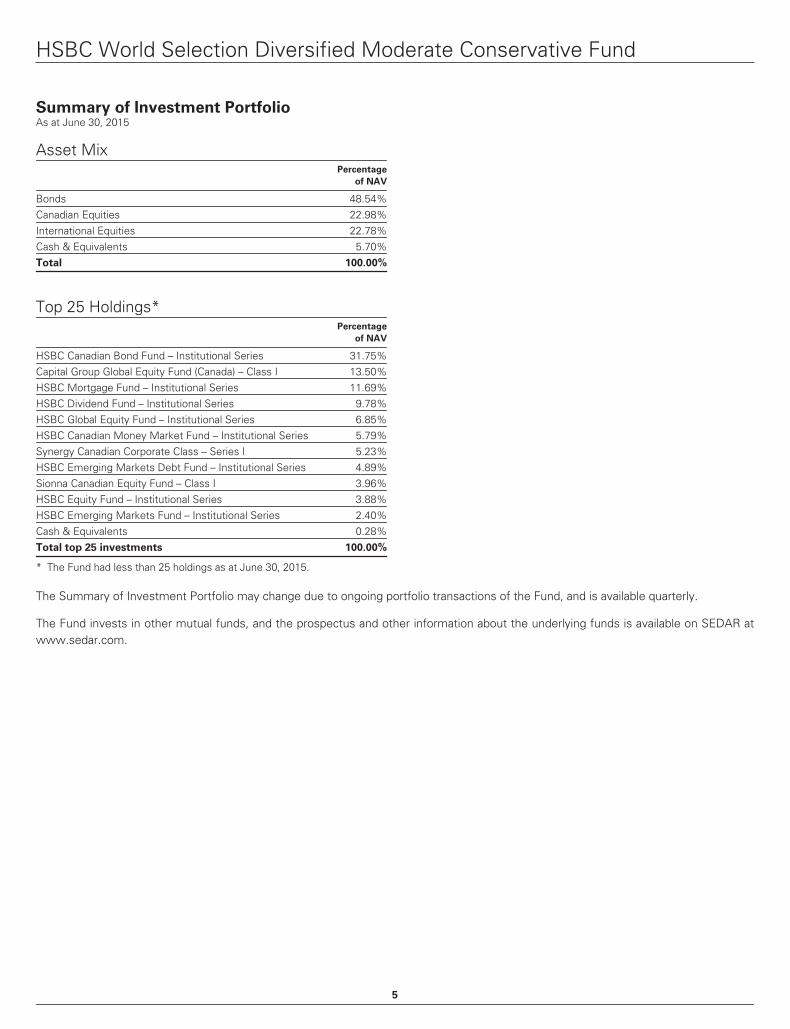
Past PerformanceThe performance information shown assumes that all distributionsmade by the Fund in the periods shown were reinvested inadditional securities of the Fund. The performance informationdoes not take into account sales, redemption, distribution, optionalcharges or expenses you may be charged outside of the Fund orthe effect of any income tax you may have to pay as a result ofyour investment in the Fund that would have reduced returns orperformance. The Fund’s past performance does not necessarilyindicate how it will perform in the future.
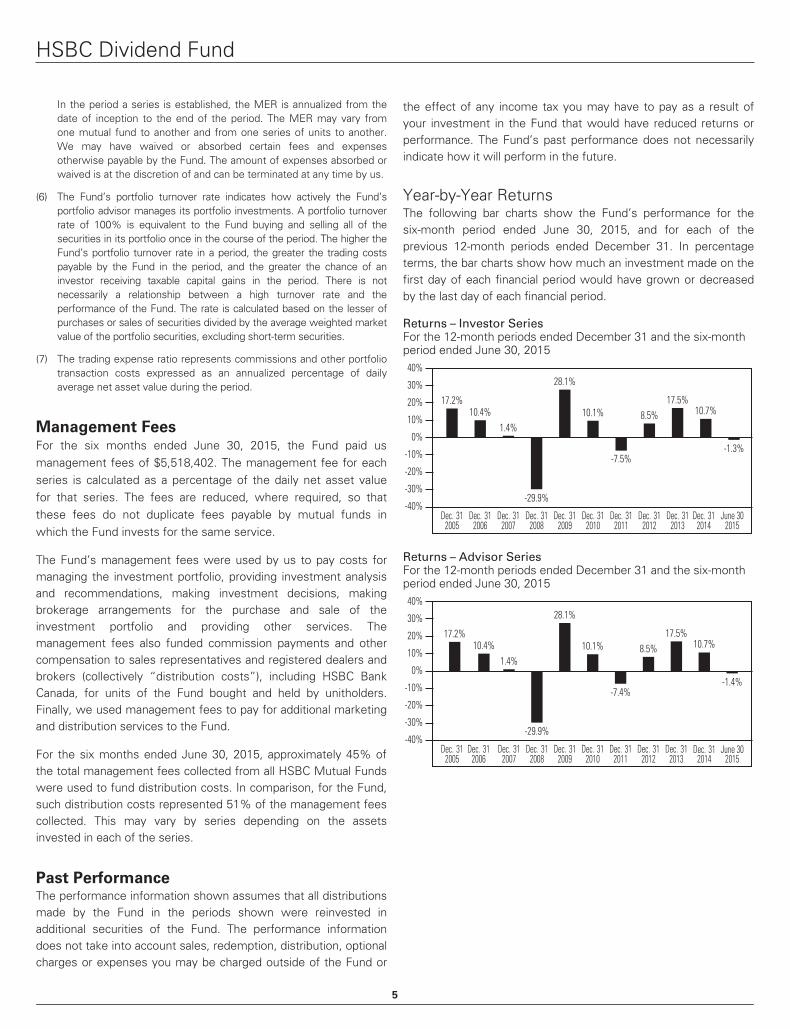
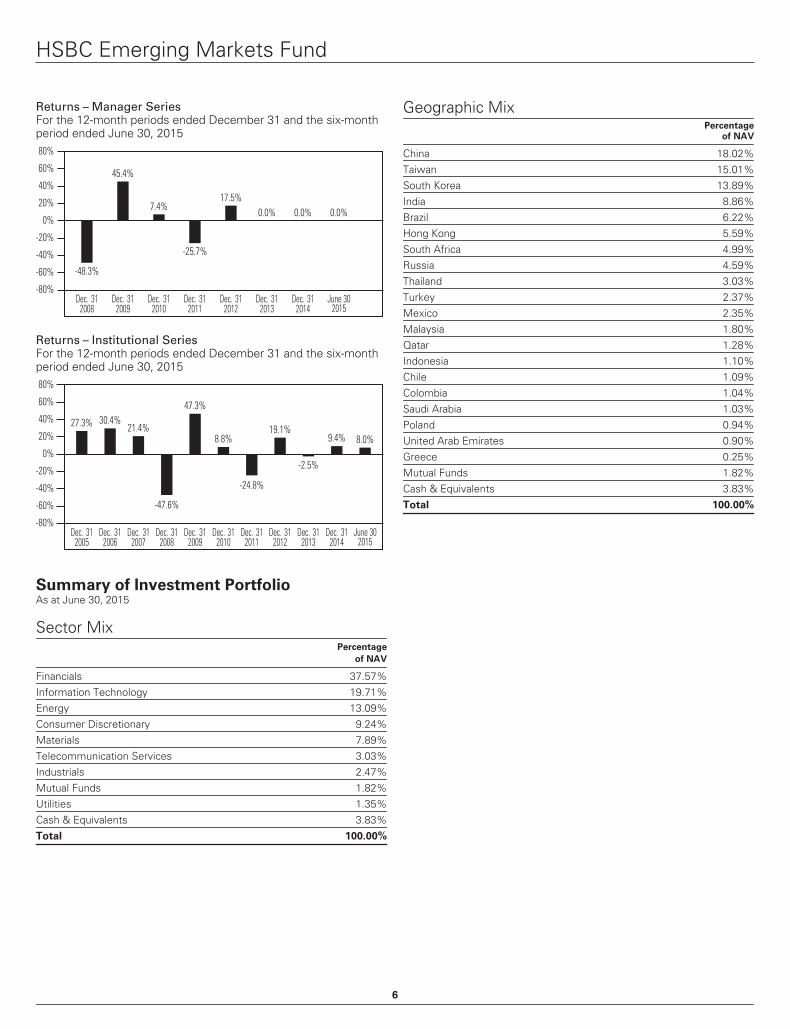
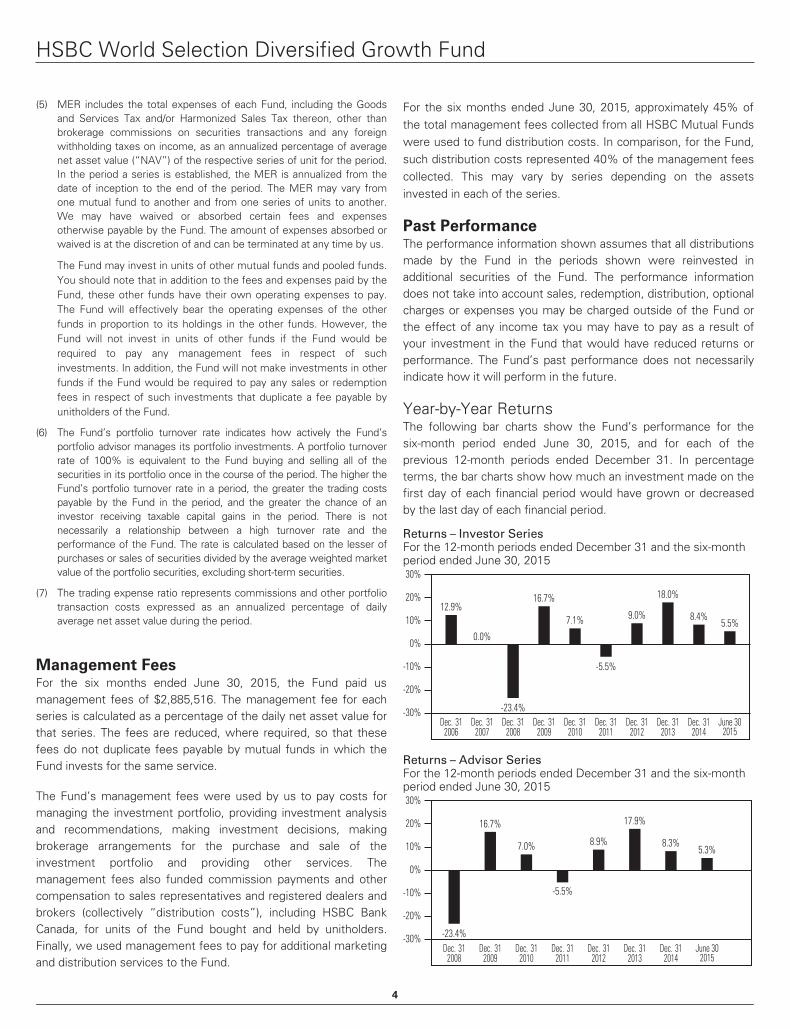
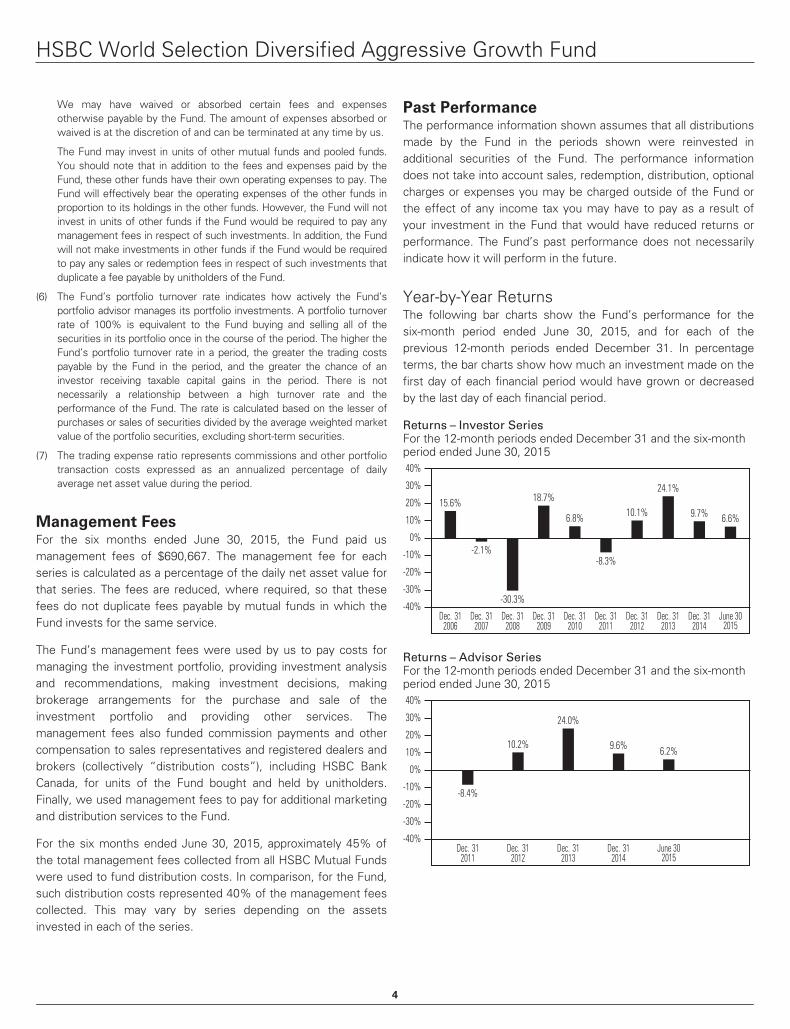
Year-by-Year ReturnsThe following bar charts show the Fund’s performance for thesix-month period ended June 30, 2015, and for each of theprevious 12-month periods ended December 31. In percentageterms, the bar charts show how much an investment made on thefirst day of each financial period would have grown or decreasedby the last day of each financial period.
Returns – Investor SeriesFor the 12-month periods ended December 31 and the six-monthperiod ended June 30, 201515%
10%
5%
0%
1.8%
Dec. 312005
2.9%
Dec. 312006
3.4%
Dec. 312007
2.3%
Dec. 312008
0.1%
Dec. 312009
0.0%0.0%
Dec. 312010
June 302015
Dec. 312013
0.1%
Dec. 312014
0.1%0.1%
Dec. 312012
0.1%
Dec. 312011
Returns – Advisor SeriesFor the 12-month periods ended December 31 and the six-monthperiod ended June 30, 201515%
10%
5%
0%
1.8%2.9% 3.4%
2.3%
0.1% 0.0% 0.0%0.1%
Dec. 312005
Dec. 312006
Dec. 312007
Dec. 312008
Dec. 312009
Dec. 312010
June 302015
Dec. 312014
Dec. 312013
0.1% 0.1% 0.1%
Dec. 312012
Dec. 312011
Returns – Premium SeriesFor the 12-month periods ended December 31 and the six-monthperiod ended June 30, 201515%
10%
5%
0%0.3% 0.2% 0.2%0.7% 0.6% 0.6% 0.6%
Dec. 312009
Dec. 312010
Dec. 312011
Dec. 312012
Dec. 312013
Dec. 312014
June 302015
5
HSBC Canadian Money Market Fund
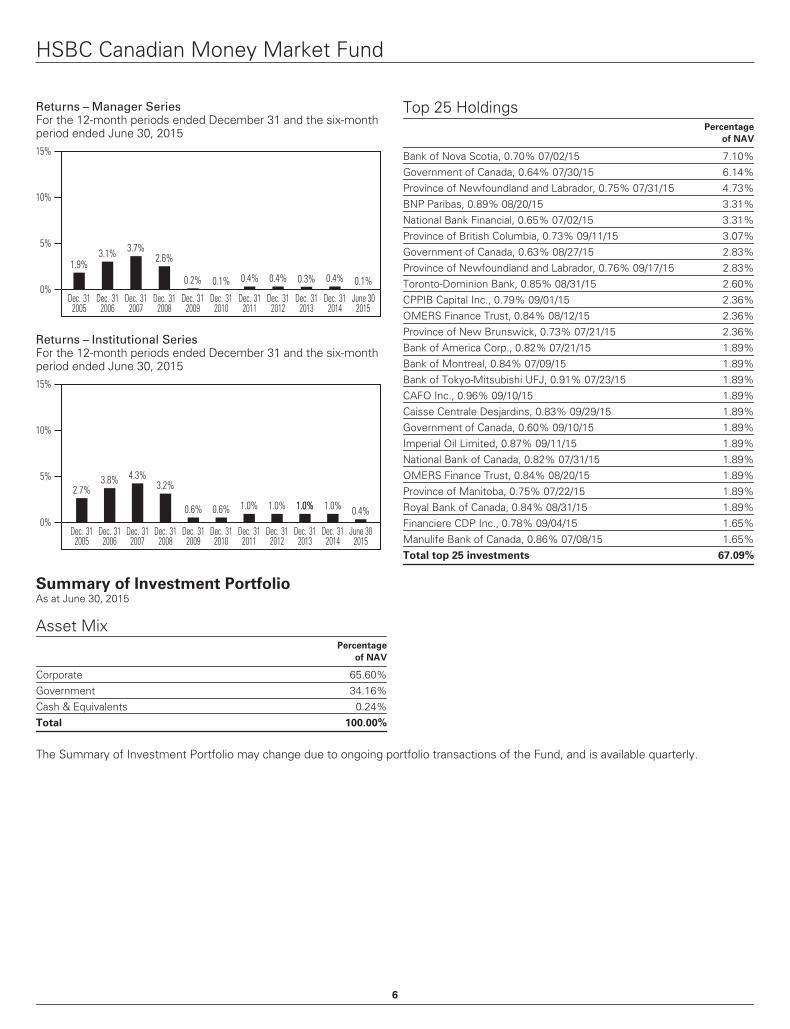
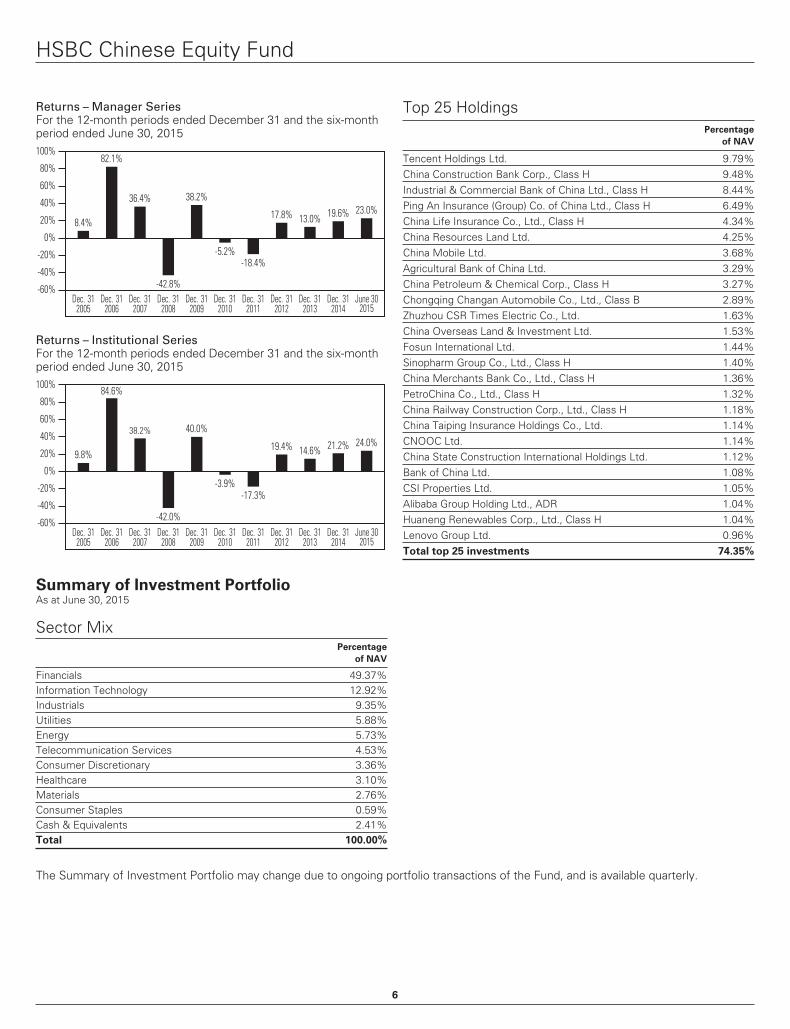
Returns – Manager SeriesFor the 12-month periods ended December 31 and the six-monthperiod ended June 30, 201515%
10%
5%
0%
1.9%3.1% 3.7%
2.6%
0.2% 0.1% 0.1%0.4%
Dec. 312005
Dec. 312006
Dec. 312007
Dec. 312008
Dec. 312009
Dec. 312010
June 302015
Dec. 312013
0.4%
Dec. 312014
0.4%0.3%
Dec. 312012
Dec. 312011
Returns – Institutional SeriesFor the 12-month periods ended December 31 and the six-monthperiod ended June 30, 201515%
10%
5%
0%
2.7%3.8% 4.3%
3.2%
0.6% 0.6% 0.4%1.0%
Dec. 312005
Dec. 312006
Dec. 312007
Dec. 312008
Dec. 312009
Dec. 312010
Dec. 312011
June 302015
Dec. 312014
1.0%
Dec. 312013
1.0%1.0% 1.0%
Dec. 312012
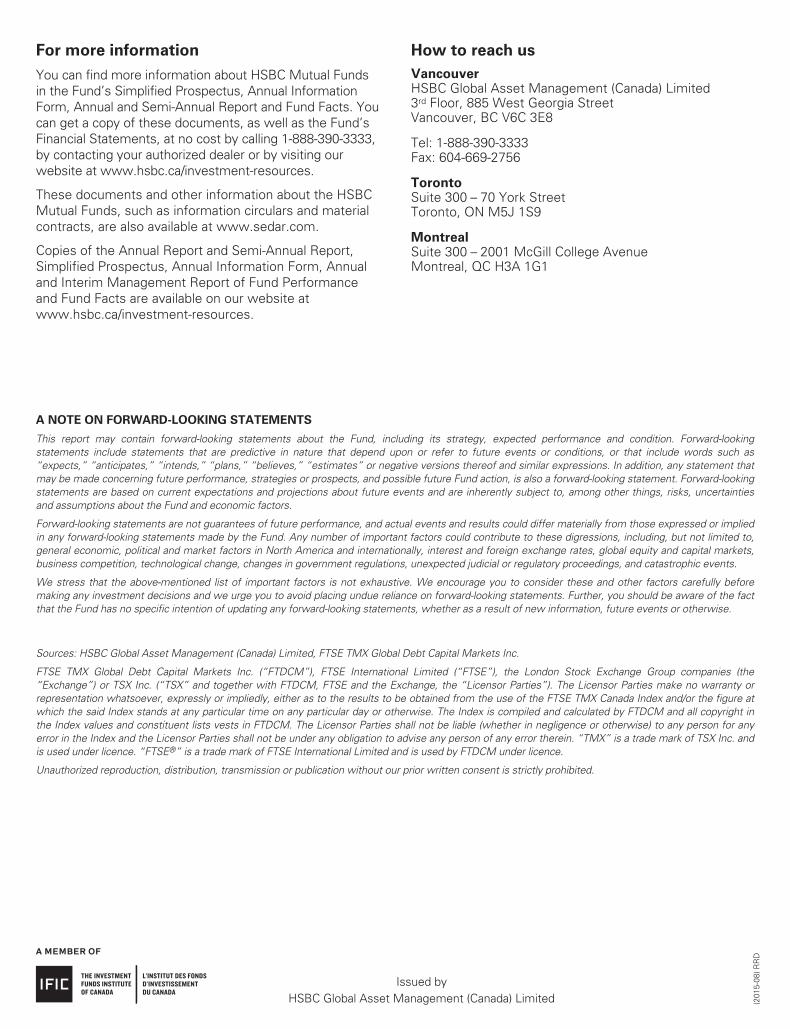
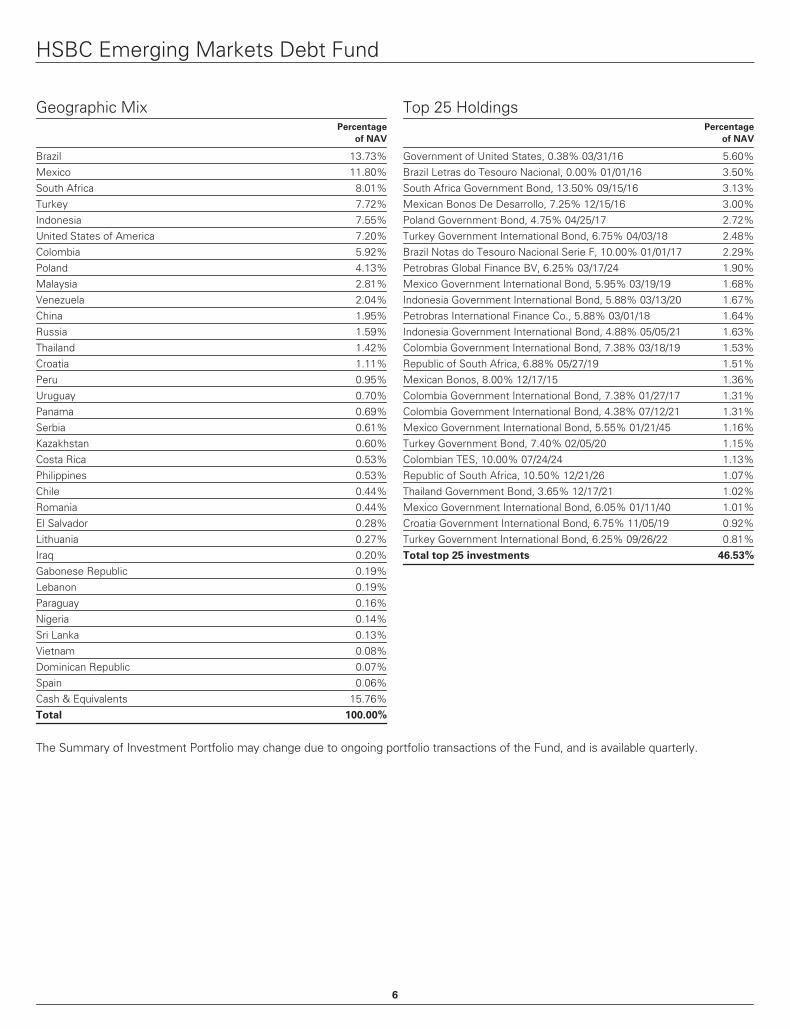
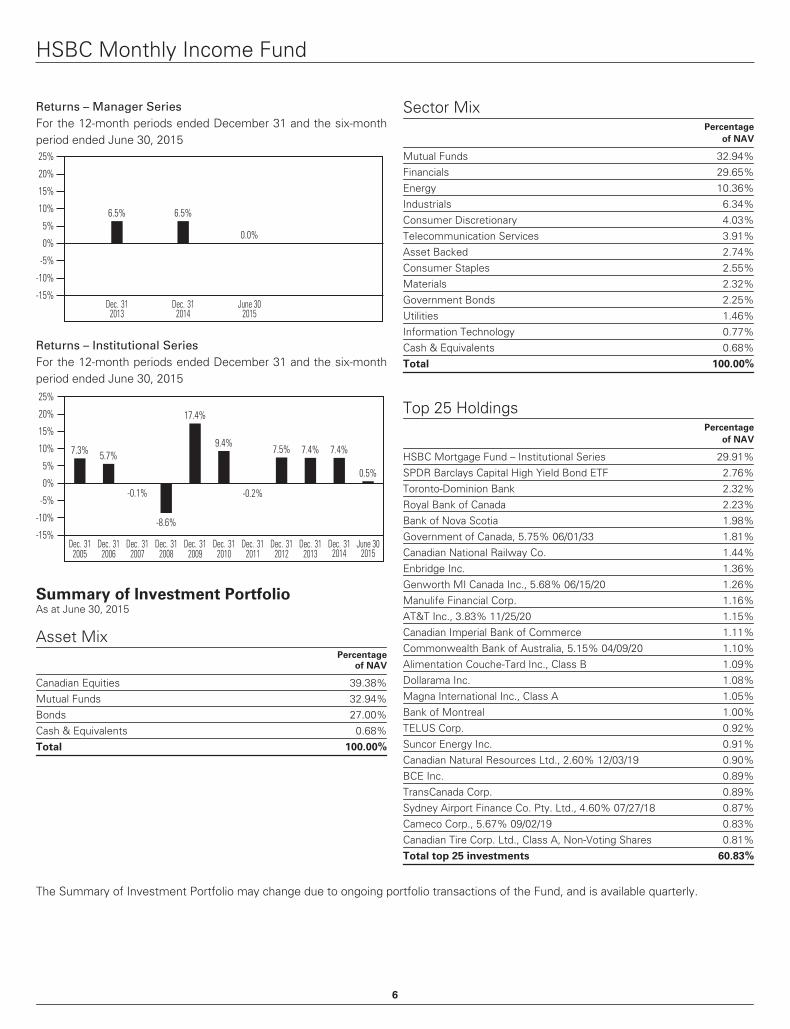
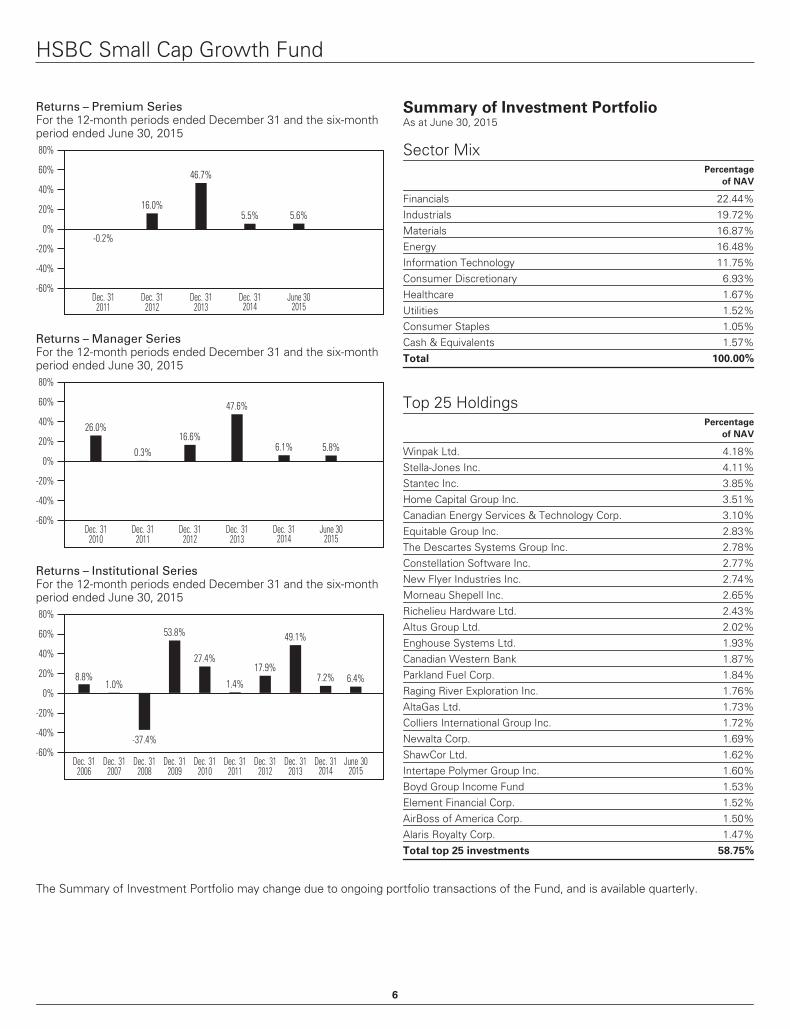
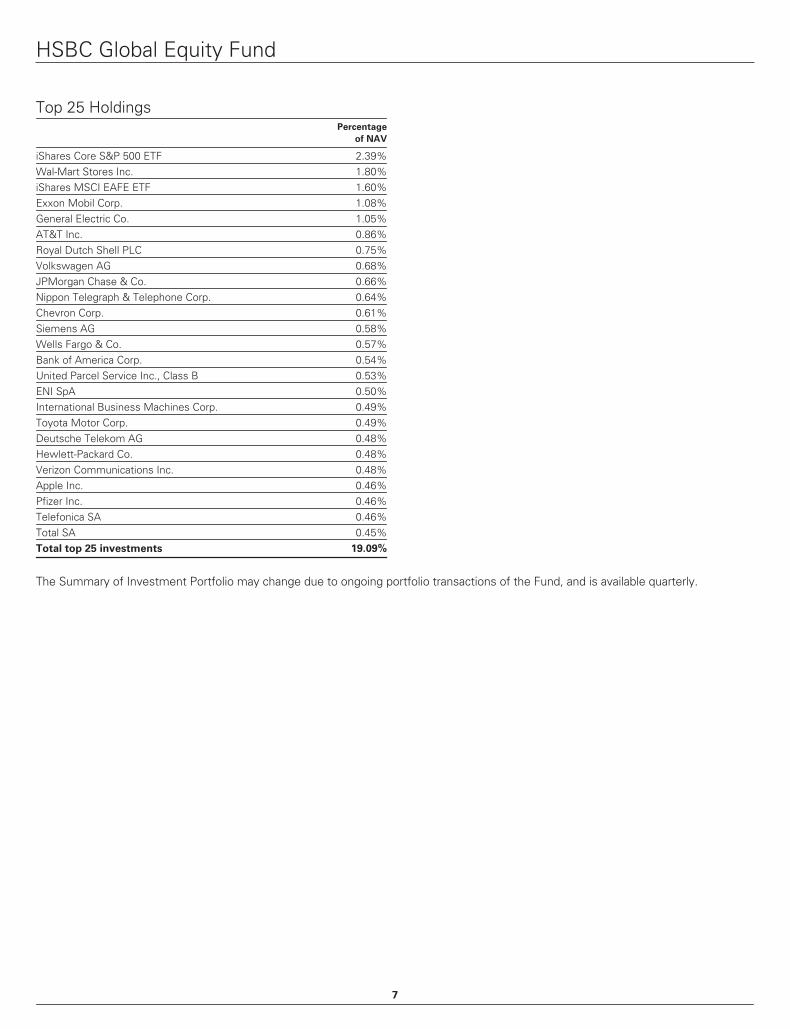
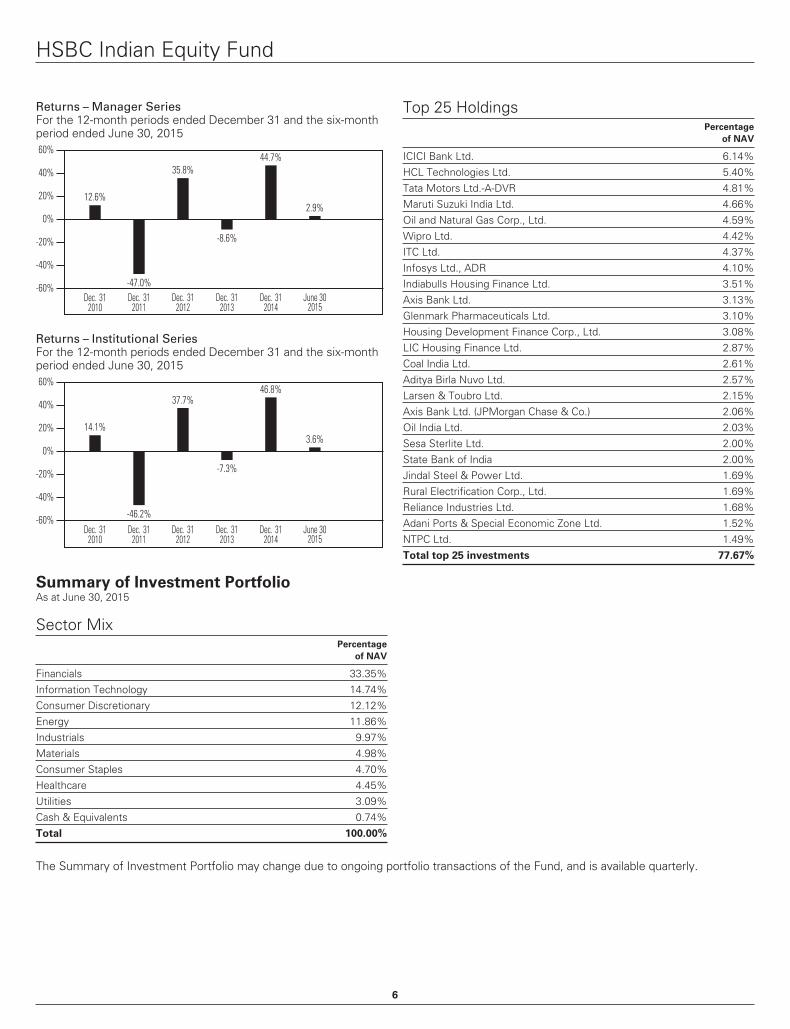
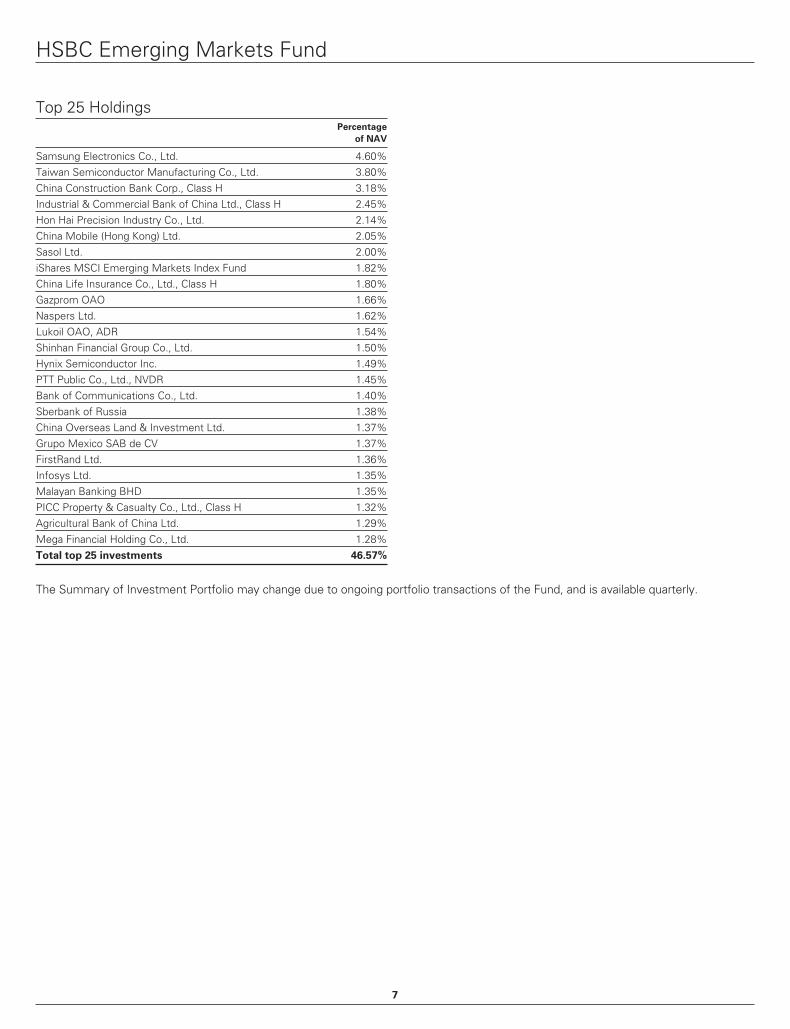
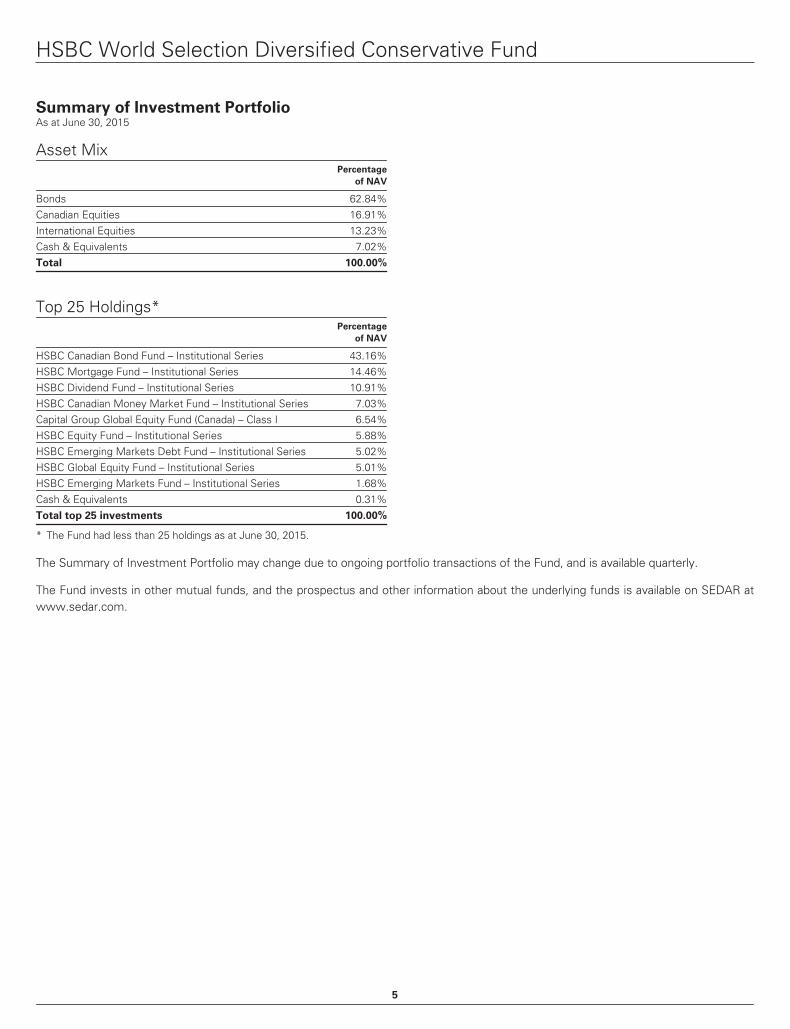
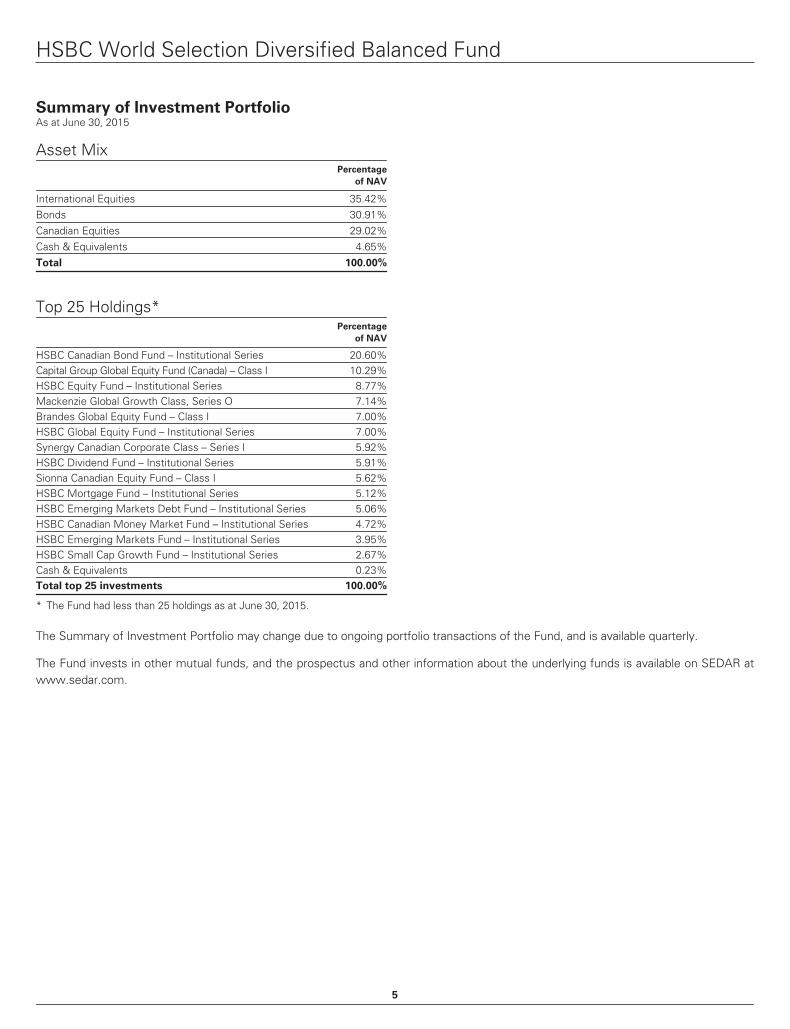
Summary of Investment PortfolioAs at June 30, 2015
Bank of Nova Scotia, 0.70% 07/02/15 7.10%Government of Canada, 0.64% 07/30/15 6.14%Province of Newfoundland and Labrador, 0.75% 07/31/15 4.73%BNP Paribas, 0.89% 08/20/15 3.31%National Bank Financial, 0.65% 07/02/15 3.31%Province of British Columbia, 0.73% 09/11/15 3.07%Government of Canada, 0.63% 08/27/15 2.83%Province of Newfoundland and Labrador, 0.76% 09/17/15 2.83%Toronto-Dominion Bank, 0.85% 08/31/15 2.60%CPPIB Capital Inc., 0.79% 09/01/15 2.36%OMERS Finance Trust, 0.84% 08/12/15 2.36%Province of New Brunswick, 0.73% 07/21/15 2.36%Bank of America Corp., 0.82% 07/21/15 1.89%Bank of Montreal, 0.84% 07/09/15 1.89%Bank of Tokyo-Mitsubishi UFJ, 0.91% 07/23/15 1.89%CAFO Inc., 0.96% 09/10/15 1.89%Caisse Centrale Desjardins, 0.83% 09/29/15 1.89%Government of Canada, 0.60% 09/10/15 1.89%Imperial Oil Limited, 0.87% 09/11/15 1.89%National Bank of Canada, 0.82% 07/31/15 1.89%OMERS Finance Trust, 0.84% 08/20/15 1.89%Province of Manitoba, 0.75% 07/22/15 1.89%Royal Bank of Canada, 0.84% 08/31/15 1.89%Financiere CDP Inc., 0.78% 09/04/15 1.65%Manulife Bank of Canada, 0.86% 07/08/15 1.65%Total top 25 investments 67.09%
The Summary of Investment Portfolio may change due to ongoing portfolio transactions of the Fund, and is available quarterly.
6
For more information
You can find more information about HSBC Mutual Fundsin the Fund’s Simplified Prospectus, Annual InformationForm, Annual and Semi-Annual Report and Fund Facts. Youcan get a copy of these documents, as well as the Fund’sFinancial Statements, at no cost by calling 1-888-390-3333,by contacting your authorized dealer or by visiting ourwebsite at www.hsbc.ca/investment-resources.
These documents and other information about the HSBCMutual Funds, such as information circulars and materialcontracts, are also available at www.sedar.com.
Copies of the Annual Report and Semi-Annual Report,Simplified Prospectus, Annual Information Form, Annualand Interim Management Report of Fund Performanceand Fund Facts are available on our website atwww.hsbc.ca/investment-resources.
How to reach us
VancouverHSBC Global Asset Management (Canada) Limited3rd Floor, 885 West Georgia StreetVancouver, BC V6C 3E8
Tel: 1-888-390-3333Fax: 604-669-2756
TorontoSuite 300 – 70 York StreetToronto, ON M5J 1S9
MontrealSuite 300 – 2001 McGill College AvenueMontreal, QC H3A 1G1
A NOTE ON FORWARD-LOOKING STATEMENTS
This report may contain forward-looking statements about the Fund, including its strategy, expected performance and condition. Forward-lookingstatements include statements that are predictive in nature that depend upon or refer to future events or conditions, or that include words such as“expects,” “anticipates,” “intends,” “plans,” “believes,” “estimates” or negative versions thereof and similar expressions. In addition, any statement thatmay be made concerning future performance, strategies or prospects, and possible future Fund action, is also a forward-looking statement. Forward-lookingstatements are based on current expectations and projections about future events and are inherently subject to, among other things, risks, uncertaintiesand assumptions about the Fund and economic factors.
Forward-looking statements are not guarantees of future performance, and actual events and results could differ materially from those expressed or impliedin any forward-looking statements made by the Fund. Any number of important factors could contribute to these digressions, including, but not limited to,general economic, political and market factors in North America and internationally, interest and foreign exchange rates, global equity and capital markets,business competition, technological change, changes in government regulations, unexpected judicial or regulatory proceedings, and catastrophic events.
We stress that the above-mentioned list of important factors is not exhaustive. We encourage you to consider these and other factors carefully beforemaking any investment decisions and we urge you to avoid placing undue reliance on forward-looking statements. Further, you should be aware of the factthat the Fund has no specific intention of updating any forward-looking statements, whether as a result of new information, future events or otherwise.
Sources: HSBC Global Asset Management (Canada) Limited, FTSE TMX Global Debt Capital Markets Inc.
FTSE TMX Global Debt Capital Markets Inc. (“FTDCM”), FTSE International Limited (“FTSE”), the London Stock Exchange Group companies (the“Exchange”) or TSX Inc. (“TSX” and together with FTDCM, FTSE and the Exchange, the “Licensor Parties”). The Licensor Parties make no warranty orrepresentation whatsoever, expressly or impliedly, either as to the results to be obtained from the use of the FTSE TMX Canada Index and/or the figure atwhich the said Index stands at any particular time on any particular day or otherwise. The Index is compiled and calculated by FTDCM and all copyright inthe Index values and constituent lists vests in FTDCM. The Licensor Parties shall not be liable (whether in negligence or otherwise) to any person for anyerror in the Index and the Licensor Parties shall not be under any obligation to advise any person of any error therein. “TMX” is a trade mark of TSX Inc. andis used under licence. “FTSE®” is a trade mark of FTSE International Limited and is used by FTDCM under licence.
Unauthorized reproduction, distribution, transmission or publication without our prior written consent is strictly prohibited.
Issued byHSBC Global Asset Management (Canada) Limited (2
015-
08)R
RD
HSBC U.S. DollarMoney Market Fund
Interim Management Report of Fund Performance
for the six months ended June 30, 2015
HSBC U.S. Dollar Money Market Fund
Management Discussion of Fund PerformanceIn this document, you and your refer to the unitholder of the Fund;we, us and our refer to HSBC Global Asset Management (Canada)Limited; and the Fund refers to the HSBC U.S. Dollar MoneyMarket Fund.
We are the manager, trustee and primary investment advisor ofthe Fund.
IntroductionThis Interim Management Report of Fund Performance containsfinancial highlights but does not contain the complete annual or semi-annual financial statements of the investment fund. You may obtain acopy of the Fund’s annual or semi-annual financial statements at yourrequest, at no cost, by calling us toll-free at 1-888-390-3333, byvisiting our website at www.hsbc.ca/investment-resources, byvisiting the SEDAR website at www.sedar.com or by writing to us at:
Corporate SecretaryHSBC Global Asset Management (Canada) Limited3rd Floor, 885 West Georgia StreetVancouver, BC V6C 3E8
You may also contact us using one of these methods to request acopy of the Fund’s proxy voting policies and procedures, proxyvoting disclosure record or quarterly statement of investmentportfolio.
Results of OperationsAs of June 30, 2015, the Fund’s net assets decreased by 14.5%to $50.6 million from $59.2 million at the end of 2014. Of thisdecrease, a $8.6 million was attributable to net withdrawals fromFund.
Investment PerformanceThe HSBC U.S. Dollar Money Market Fund (Investor Series) rose0.01% for the six months ending June 30, 2015. The benchmark,75% Citigroup 1-month Treasury Bill Index (75%) and the Citigroup3-month Treasury Bill Index (25%), also rose 0.01% over the sameperiod.
A defensive position versus the corporate debt sector was takenover the period, with a focus on high-quality issues where creditrisk and liquidity risk were minimized. This protected the Fund’sprimary objectives of preserving capital and providing liquidity. Thereturn, over and above alternative government notes, from thedefensive corporate position was modest over the six months butgenerally commensurate with the reduced level of risk. Anallocation to corporate notes is usually positive for performancedue to the higher yields they can offer over government-backedalternatives. However, these notes come with additional risks thatmay be unsuitable for the Fund at any level of compensation.
We work within an extensive network of global credit researchanalysts to ensure that a prudent security selection process is inplace. We also look to add value by adjusting the weighted-average-maturity (or duration) of the Fund’s holdings relative to itsbenchmark. For the first half of the year, the Fund’s duration wastargeted to its blended 45-day benchmark, mitigating any relativeinterest rate risk.
Recent DevelopmentsThe Federal Open Market Committee (FOMC) held a neutral policystance over the first half of 2015. It paused from purchasing orselling assets and raising or lowering rates, and held the size of itsbalance sheet by continuing the existing policy of reinvestingprincipal payments from its holdings.
Strengthening economic growth momentum and reduced riskssurrounding its outlook have provided a better environment for theFOMC to finally take its foot off the accelerator, but furtherprogress is still required. Labour market conditions continue toimprove, but weak labour-force participation and other labour-market indicators continue to indicate underutilization of labourresources. Inflation remained muted and under some downwardpressure in the first half of 2015 from lower energy prices. Thisdecline in inflation has allowed FOMC policymakers to remainpatient in their path to further normalizing monetary policy. Basedon their policy guidance and our outlook for the US economy, weexpect the FOMC will begin to gradually increase its target rangefor the federal funds rate before year-end.
Related Party TransactionsWe, on behalf of the Fund, or the Fund Manager, may, from timeto time, enter into transactions or arrangements with or involvingother members of the HSBC Group or other people or companiesrelated or connected to us or the Fund. To proceed with thetransactions, the Fund relies on the positive recommendation ofthe Fund’s Independent Review Committee. A condition of thispositive recommendation is that the transactions are performed inaccordance with our policy on Related Party Transactions. Formore general information on persons related to the Fund and thetypes of potential transactions, see the Fund’s SimplifiedProspectus.
The following is a summary of current transactions andarrangements with entities that are related to us or the Fund.
Manager, Trustee and Investment AdvisorWe are the manager, trustee and primary investment advisor of theFund. As manager, we manage the overall business and operationsof the Fund. As trustee, we hold legal title to the property of theFund on your behalf. As primary investment advisor, we provideinvestment advice and portfolio management services to the Fund.
1
HSBC U.S. Dollar Money Market Fund
We receive a fee from the Fund for these services based on assetsunder management, calculated daily and paid monthly.
Distribution ServicesThe Fund is distributed through us, HSBC Investment Funds(Canada) Inc. (our wholly owned subsidiary); HSBC Private WealthServices (Canada) Inc. and through HSBC Securities (Canada) Inc.(an affiliate) directly or through its division, HSBC InvestDirect. Wepay distribution and servicing fees to them based on the amountof assets held in the investor’s account, and additionally, in somecases, on the amount of the initial purchase. If you hold units ofthis Fund and/or other HSBC Mutual Funds in a registered planwith HSBC Investment Funds (Canada) Inc., they may charge youan annual fee to cover the annual administration costs of the plan.We permit HSBC Investment Funds (Canada) Inc. to collect thesefees by redeeming sufficient units of the Fund with the highestmarket value in your registered plan.
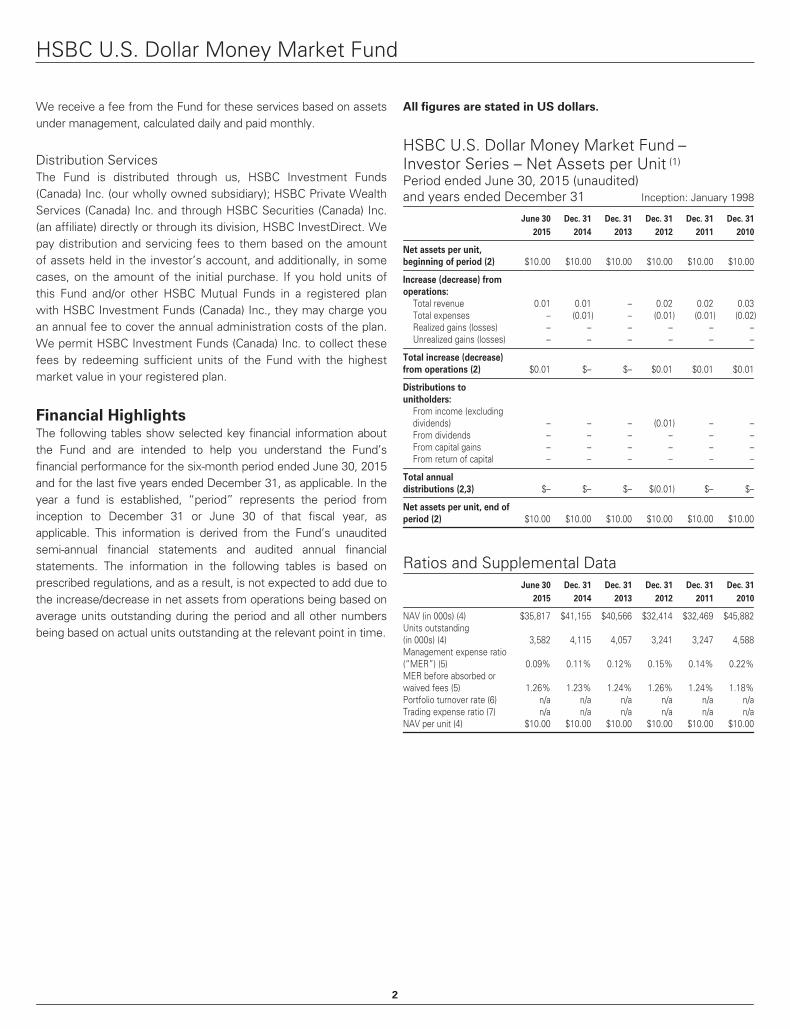
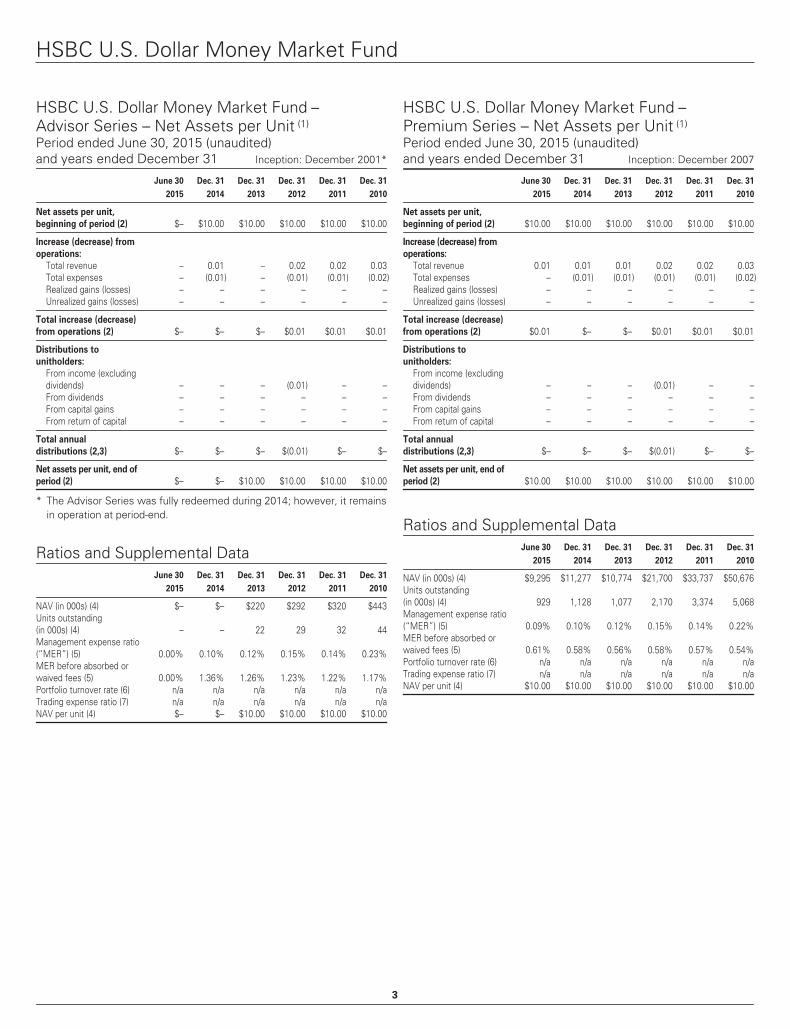
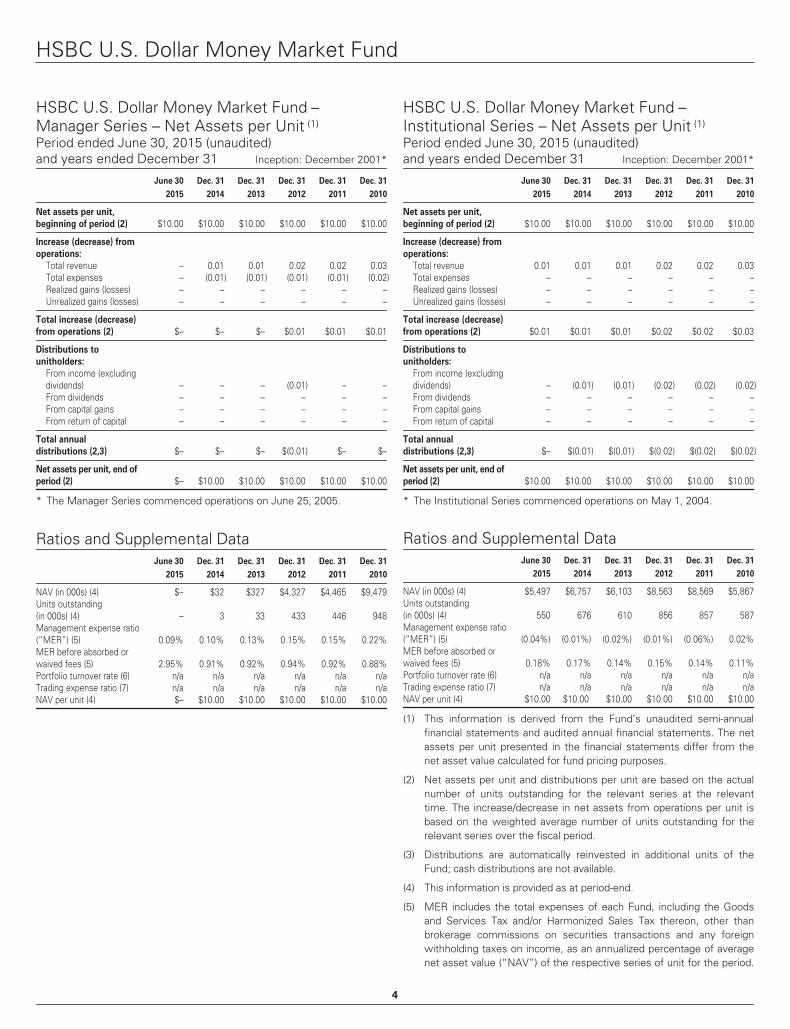
Financial HighlightsThe following tables show selected key financial information aboutthe Fund and are intended to help you understand the Fund’sfinancial performance for the six-month period ended June 30, 2015and for the last five years ended December 31, as applicable. In theyear a fund is established, “period” represents the period frominception to December 31 or June 30 of that fiscal year, asapplicable. This information is derived from the Fund’s unauditedsemi-annual financial statements and audited annual financialstatements. The information in the following tables is based onprescribed regulations, and as a result, is not expected to add due tothe increase/decrease in net assets from operations being based onaverage units outstanding during the period and all other numbersbeing based on actual units outstanding at the relevant point in time.
All figures are stated in US dollars.
HSBC U.S. Dollar Money Market Fund –Investor Series – Net Assets per Unit (1)
Period ended June 30, 2015 (unaudited)and years ended December 31 Inception: January 1998
June 30
2015
Dec. 31
2014
Dec. 31
2013
Dec. 31
2012
Dec. 31
2011
Dec. 31
2010
Net assets per unit,
beginning of period (2) $10.00 $10.00 $10.00 $10.00 $10.00 $10.00
(1) This information is derived from the Fund’s unaudited semi-annualfinancial statements and audited annual financial statements. The netassets per unit presented in the financial statements differ from thenet asset value calculated for fund pricing purposes.
(2) Net assets per unit and distributions per unit are based on the actualnumber of units outstanding for the relevant series at the relevanttime. The increase/decrease in net assets from operations per unit isbased on the weighted average number of units outstanding for therelevant series over the fiscal period.
(3) Distributions are automatically reinvested in additional units of theFund; cash distributions are not available.
(4) This information is provided as at period-end.
(5) MER includes the total expenses of each Fund, including the Goodsand Services Tax and/or Harmonized Sales Tax thereon, other thanbrokerage commissions on securities transactions and any foreignwithholding taxes on income, as an annualized percentage of averagenet asset value (“NAV”) of the respective series of unit for the period.
4
HSBC U.S. Dollar Money Market Fund
In the period a series is established, the MER is annualized from thedate of inception to the end of the period. The MER may vary fromone mutual fund to another and from one series of units to another. Inthe year, we waived certain fees and expenses otherwise payable bythis Fund. We will continue to waive management and operating feesuntil such time as market yields rise above the MER of the Fund.
(6) The Fund’s portfolio turnover rate indicates how actively the Fund’sportfolio advisor manages its portfolio investments. A portfolio turnoverrate of 100% is equivalent to the Fund buying and selling all of thesecurities in its portfolio once in the course of the period. The higher theFund’s portfolio turnover rate in a period, the greater the trading costspayable by the Fund in the period, and the greater the chance of aninvestor receiving taxable capital gains in the period. There is notnecessarily a relationship between a high turnover rate and theperformance of the Fund. The rate is calculated based on the lesser ofpurchases or sales of securities divided by the average weighted marketvalue of the portfolio securities, excluding short-term securities.
(7) The trading expense ratio represents commissions and other portfoliotransaction costs expressed as an annualized percentage of dailyaverage net asset value during the period.
Management FeesFor the six months ended June 30, 2015, the Fund paid usmanagement fees of $210,347. The management fee for eachseries is calculated as a percentage of the daily net asset value forthat series. The fees are reduced, where required, so that thesefees do not duplicate fees payable by mutual funds in which theFund invests for the same service.
The Fund’s management fees were used by us to pay costs formanaging the investment portfolio, providing investment analysisand recommendations, making investment decisions, makingbrokerage arrangements for the purchase and sale of theinvestment portfolio and providing other services. Themanagement fees also funded commission payments and othercompensation to sales representatives and registered dealers andbrokers (collectively “distribution costs”), including HSBC BankCanada, for units of the Fund bought and held by unitholders.Finally, we used management fees to pay for additional marketingand distribution services to the Fund.
For the six months ended June 30, 2015, approximately 45% ofthe total management fees collected from all HSBC Mutual Fundswere used to fund distribution costs. In comparison, for the Fund,such distribution costs represented 29% of the management feescollected. This may vary by series depending on the assetsinvested in each of the series.
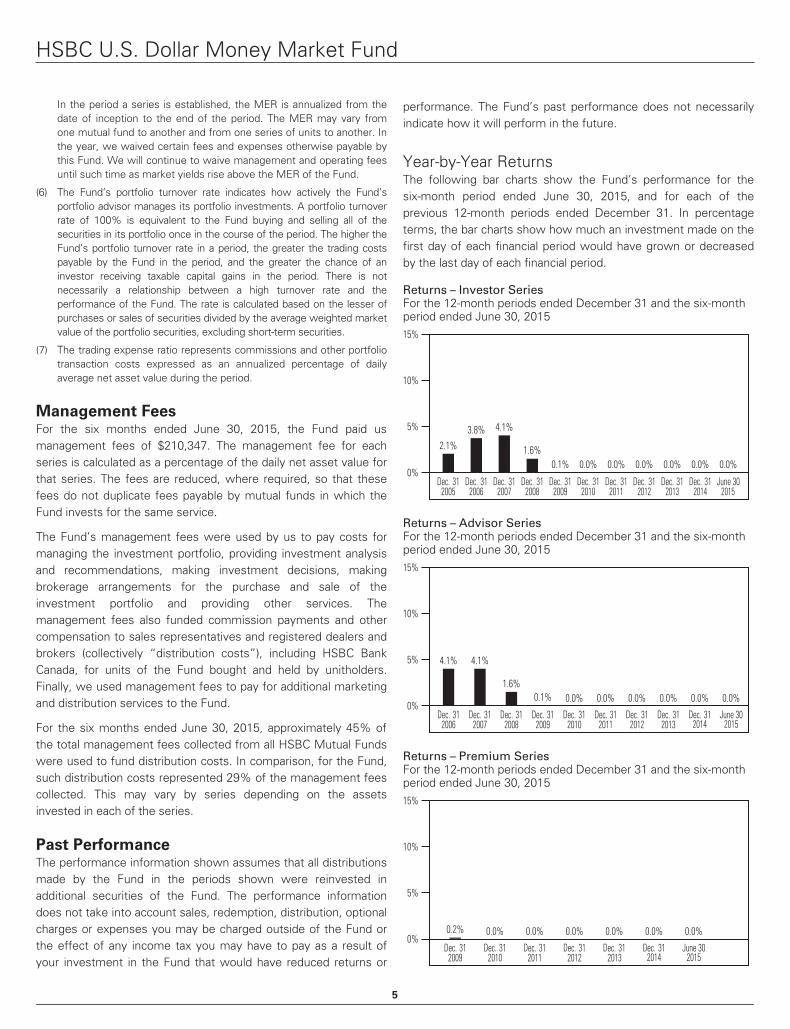
Past PerformanceThe performance information shown assumes that all distributionsmade by the Fund in the periods shown were reinvested inadditional securities of the Fund. The performance informationdoes not take into account sales, redemption, distribution, optionalcharges or expenses you may be charged outside of the Fund orthe effect of any income tax you may have to pay as a result ofyour investment in the Fund that would have reduced returns or
performance. The Fund’s past performance does not necessarilyindicate how it will perform in the future.
Year-by-Year ReturnsThe following bar charts show the Fund’s performance for thesix-month period ended June 30, 2015, and for each of theprevious 12-month periods ended December 31. In percentageterms, the bar charts show how much an investment made on thefirst day of each financial period would have grown or decreasedby the last day of each financial period.
Returns – Investor SeriesFor the 12-month periods ended December 31 and the six-monthperiod ended June 30, 201515%
10%
5%
0%0.0% 0.0% 0.0% 0.0% 0.0%
2.1%3.8% 4.1%
1.6%0.1% 0.0%
Dec. 312005
Dec. 312006
Dec. 312007
Dec. 312008
Dec. 312009
Dec. 312010
June 302015
Dec. 312014
Dec. 312013
Dec. 312012
Dec. 312011
Returns – Advisor SeriesFor the 12-month periods ended December 31 and the six-monthperiod ended June 30, 201515%
10%
5%
0%
4.1%
1.6%0.1% 0.0%
Dec. 312006
Dec. 312007
Dec. 312008
Dec. 312009
Dec. 312010
Dec. 312011
0.0% 0.0% 0.0% 0.0% 0.0%
Dec. 312012
4.1%
Dec. 312013
June 302015
Dec. 312014
Returns – Premium SeriesFor the 12-month periods ended December 31 and the six-monthperiod ended June 30, 201515%
10%
5%
0%0.2% 0.0% 0.0% 0.0% 0.0% 0.0% 0.0%
Dec. 312009
Dec. 312010
Dec. 312011
Dec. 312012
Dec. 312013
Dec. 312014
June 302015
5
HSBC U.S. Dollar Money Market Fund
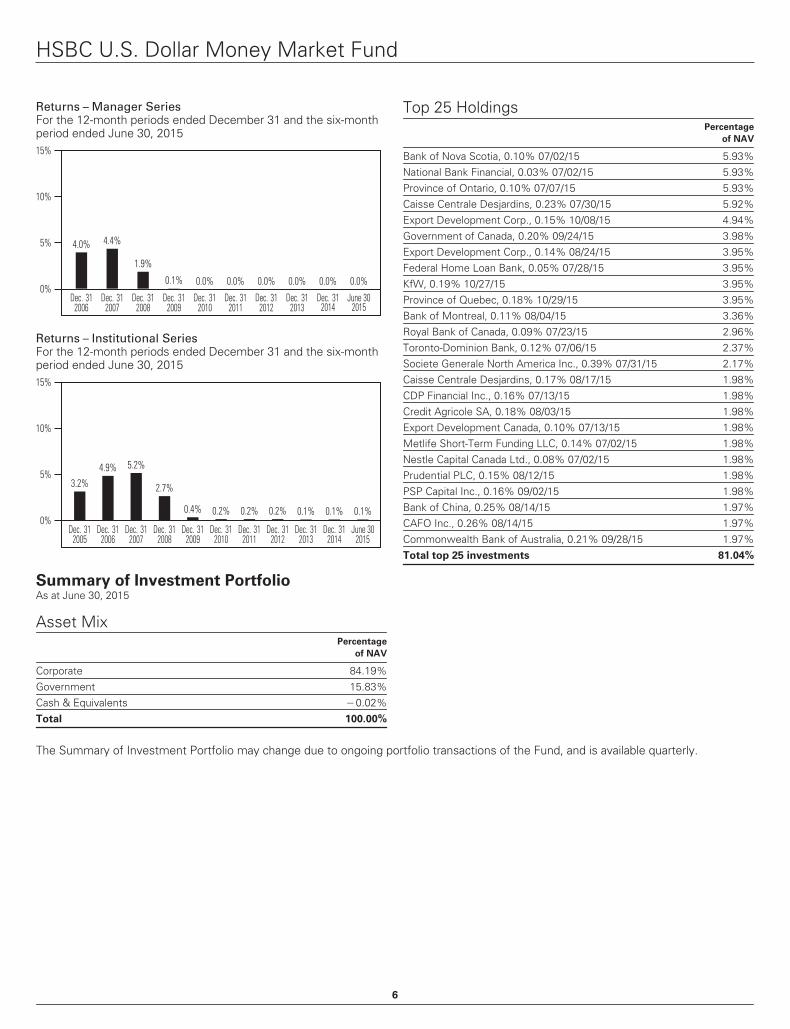
Returns – Manager SeriesFor the 12-month periods ended December 31 and the six-monthperiod ended June 30, 201515%
10%
5%
0%
4.0% 4.4%
1.9%
0.1% 0.0% 0.0% 0.0% 0.0% 0.0% 0.0%
Dec. 312006
Dec. 312007
Dec. 312008
Dec. 312009
Dec. 312010
Dec. 312011
Dec. 312012
Dec. 312013
June 302015
Dec. 312014
Returns – Institutional SeriesFor the 12-month periods ended December 31 and the six-monthperiod ended June 30, 201515%
10%
5%
0%
3.2%4.9% 5.2%
2.7%
0.4% 0.2% 0.2%
Dec. 312005
Dec. 312006
Dec. 312007
Dec. 312008
Dec. 312009
Dec. 312010
Dec. 312011
Dec. 312013
June 302015
Dec. 312014
0.2% 0.1% 0.1% 0.1%
Dec. 312012
Summary of Investment PortfolioAs at June 30, 2015
Bank of Nova Scotia, 0.10% 07/02/15 5.93%National Bank Financial, 0.03% 07/02/15 5.93%Province of Ontario, 0.10% 07/07/15 5.93%Caisse Centrale Desjardins, 0.23% 07/30/15 5.92%Export Development Corp., 0.15% 10/08/15 4.94%Government of Canada, 0.20% 09/24/15 3.98%Export Development Corp., 0.14% 08/24/15 3.95%Federal Home Loan Bank, 0.05% 07/28/15 3.95%KfW, 0.19% 10/27/15 3.95%Province of Quebec, 0.18% 10/29/15 3.95%Bank of Montreal, 0.11% 08/04/15 3.36%Royal Bank of Canada, 0.09% 07/23/15 2.96%Toronto-Dominion Bank, 0.12% 07/06/15 2.37%Societe Generale North America Inc., 0.39% 07/31/15 2.17%Caisse Centrale Desjardins, 0.17% 08/17/15 1.98%CDP Financial Inc., 0.16% 07/13/15 1.98%Credit Agricole SA, 0.18% 08/03/15 1.98%Export Development Canada, 0.10% 07/13/15 1.98%Metlife Short-Term Funding LLC, 0.14% 07/02/15 1.98%Nestle Capital Canada Ltd., 0.08% 07/02/15 1.98%Prudential PLC, 0.15% 08/12/15 1.98%PSP Capital Inc., 0.16% 09/02/15 1.98%Bank of China, 0.25% 08/14/15 1.97%CAFO Inc., 0.26% 08/14/15 1.97%Commonwealth Bank of Australia, 0.21% 09/28/15 1.97%Total top 25 investments 81.04%
The Summary of Investment Portfolio may change due to ongoing portfolio transactions of the Fund, and is available quarterly.
6
For more information
You can find more information about HSBC Mutual Fundsin the Fund’s Simplified Prospectus, Annual InformationForm, Annual and Semi-Annual Report and Fund Facts. Youcan get a copy of these documents, as well as the Fund’sFinancial Statements, at no cost by calling 1-888-390-3333,by contacting your authorized dealer or by visiting ourwebsite at www.hsbc.ca/investment-resources.
These documents and other information about the HSBCMutual Funds, such as information circulars and materialcontracts, are also available at www.sedar.com.
Copies of the Annual Report and Semi-Annual Report,Simplified Prospectus, Annual Information Form, Annualand Interim Management Report of Fund Performanceand Fund Facts are available on our website atwww.hsbc.ca/investment-resources.
How to reach us
VancouverHSBC Global Asset Management (Canada) Limited3rd Floor, 885 West Georgia StreetVancouver, BC V6C 3E8
Tel: 1-888-390-3333Fax: 604-669-2756
TorontoSuite 300 – 70 York StreetToronto, ON M5J 1S9
MontrealSuite 300 – 2001 McGill College AvenueMontreal, QC H3A 1G1
A NOTE ON FORWARD-LOOKING STATEMENTS
This report may contain forward-looking statements about the Fund, including its strategy, expected performance and condition. Forward-lookingstatements include statements that are predictive in nature that depend upon or refer to future events or conditions, or that include words such as“expects,” “anticipates,” “intends,” “plans,” “believes,” “estimates” or negative versions thereof and similar expressions. In addition, any statement thatmay be made concerning future performance, strategies or prospects, and possible future Fund action, is also a forward-looking statement. Forward-lookingstatements are based on current expectations and projections about future events and are inherently subject to, among other things, risks, uncertaintiesand assumptions about the Fund and economic factors.
Forward-looking statements are not guarantees of future performance, and actual events and results could differ materially from those expressed or impliedin any forward-looking statements made by the Fund. Any number of important factors could contribute to these digressions, including, but not limited to,general economic, political and market factors in North America and internationally, interest and foreign exchange rates, global equity and capital markets,business competition, technological change, changes in government regulations, unexpected judicial or regulatory proceedings, and catastrophic events.
We stress that the above-mentioned list of important factors is not exhaustive. We encourage you to consider these and other factors carefully beforemaking any investment decisions and we urge you to avoid placing undue reliance on forward-looking statements. Further, you should be aware of the factthat the Fund has no specific intention of updating any forward-looking statements, whether as a result of new information, future events or otherwise.
Sources: HSBC Global Asset Management (Canada) Limited, Bloomberg.
Unauthorized reproduction, distribution, transmission or publication without our prior written consent is strictly prohibited.
Issued byHSBC Global Asset Management (Canada) Limited (2
015-
08)R
RD
HSBC Mortgage Fund
Interim Management Report of Fund Performance
for the six months ended June 30, 2015
HSBC Mortgage Fund
Management Discussion of Fund PerformanceIn this document, you and your refer to the unitholder of the Fund;we, us and our refer to HSBC Global Asset Management (Canada)Limited; and the Fund refers to the HSBC Mortgage Fund.
We are the manager, trustee and primary investment advisor ofthe Fund.
IntroductionThis Interim Management Report of Fund Performance containsfinancial highlights but does not contain the complete annual or semi-annual financial statements of the investment fund. You may obtain acopy of the Fund’s annual or semi-annual financial statements at yourrequest, at no cost, by calling us toll-free at 1-888-390-3333, by visitingour website at www.hsbc.ca/investment-resources, by visiting theSEDAR website at www.sedar.com or by writing to us at:
Corporate SecretaryHSBC Global Asset Management (Canada) Limited3rd Floor, 885 West Georgia StreetVancouver, BC V6C 3E8
You may also contact us using one of these methods to request acopy of the Fund’s proxy voting policies and procedures, proxyvoting disclosure record or quarterly statement of investmentportfolio.
Results of OperationsAs of June 30, 2015, the Fund’s net assets increased by 3% to$2,500.7 million from $2,427.4 million at the end of 2014. Of thisincrease, a $29.5 million gain was attributable to investmentperformance and $43.8 million was attributable to netcontributions to the Fund.
Investment PerformanceThe HSBC Mortgage Fund (Investor Series) rose 0.63% for thesix months ending June 30, 2015, while the benchmark FTSE TMXCanada Short-Term Bond Index rose 2.11% over the same period.
The relatively high running yield of the Fund continues to be apositive for returns, and will help to offset some of the negativeimpacts if mortgage rates move higher. Portfolio duration isconservatively positioned below two years. Generational lows inyields, expectations for improving global growth and theapproaching start to the US Federal Reserve tightening cycle allput upward pressure on yields in the second quarter. The five-yearGovernment of Canada bond yield, commonly looked at as a proxyfor the broad short-term market, rose by 6 basis points in thesecond quarter but has declined 52 basis points year-to-date.
Short-term federal government debt outperformed provincial debtbut underperformed corporate debt in the second quarter.Year-to-date, federal government, provincial government and
corporate bonds returned 1.89%, 2.18% and 2.37%, respectively,according to the FTSE TMX Canada Market Indexes.
Broad posted mortgage rates were unchanged on the quarter,with the yield on the FTSE TMX Canada Residential MortgageIndex steady at 3.39%. The yield differential between five-yearfixed mortgage rates and the five-year Government of Canadabond narrowed slightly in the second quarter from 398 basispoints to 382 basis points. Mortgages outperformed short-termgovernment bonds in the second quarter, but only recouped someof the underperformance experienced in the first quarter.
Recent DevelopmentsWe believe that mortgage rates represent very attractive value atcurrent levels, with the yield spread near multi-year highs andmuch wider than its historical average. Asset quality in theCanadian residential mortgage market remains very strong. Thecurrent average delinquency rate across the country is about0.28%, down slightly year-to-date and close to the lower end of itslong-term range.
At this point, with longer-term yields expected to rise modestlyover the next year, the objective will be to maintain the Fund’sinterest rate exposure below the benchmark in the near term.Potential risks to our central outlook include disappointing globalgrowth, further weakness in commodity prices and heightenedgeopolitical concerns in the eurozone. In the short term, we feelthat valuations in the mortgage market are attractive, particularlywhen compared with money market securities, and will continueto invest excess cash on opportunities. The average term of theFund remains conservative at less than two years.
The Fund obtained the positive recommendation of the Fund’sIndependent Review Committee and the approval of theunitholders represented by the majority of the votes cast at aspecial meeting of unitholders held on May 28, 2015 to include asan operating expense of the Fund a fee paid by the Fund to HSBCBank Canada (“the Bank”). This fee is in consideration of theadministration services the Bank provides to the Fund on themortgages the Fund purchases from the Bank. The Fee will beeffective July 1, 2015.
Related Party TransactionsWe, on behalf of the Fund, or the Fund Manager, may, from timeto time, enter into transactions or arrangements with or involvingother members of the HSBC Group or other people or companiesrelated or connected to us or the Fund. To proceed with thetransactions, the Fund relies on the positive recommendation ofthe Fund’s Independent Review Committee. A condition of thispositive recommendation is that the transactions are performed inaccordance with our policy on Related Party Transactions. For
1
HSBC Mortgage Fund
more general information on persons related to the Fund and thetypes of potential transactions, see the Fund’s SimplifiedProspectus.
The following is a summary of current transactions andarrangements with entities that are related to us or the Fund.
Manager, Trustee and Investment AdvisorWe are the manager, trustee and primary investment advisor of theFund. As manager, we manage the overall business and operationsof the Fund. As trustee, we hold legal title to the property of theFund on your behalf. As primary investment advisor, we provideinvestment advice and portfolio management services to the Fund.We receive a fee from the Fund for these services based on assetsunder management, calculated daily and paid monthly.
Mortgage Sale and Administration ServicesThe HSBC Mortgage Fund purchases its mortgages from HSBCBank Canada (“the Bank”) (of which we are a wholly ownedsubsidiary) and its subsidiary, HSBC Mortgage Corporation (Canada)(“Mortgage Corp.”), at an amount that will produce a yield to theHSBC Mortgage Fund of not more than 1/4 of 1% less than theinterest rate at which the Bank or Mortgage Corp. is making asimilar commitment at the time of purchase. The lesser yield of 1/4of 1% is in consideration of the agreement by the Bank torepurchase the mortgages under certain circumstances. This feeamounted to $2,151,815 on June 30, 2015 (December 31, 2014,$4,471,966).
To proceed with the transactions, the Fund relied on the approvalof the Fund’s Independent Review Committee by way of StandingInstruction. A condition of this approval was that the transactionswere performed in accordance with National Policy No. 29 and inaccordance with all requirements of various relief orders that havebeen granted to us by the regulators in relation to these kinds oftransactions.
In addition, pursuant to an agreement between us, the Bank andthe Fund, the Fund will pay the Bank a fee for the administrationof the mortgages purchased from the Bank, which will be accruedand paid daily as an expense to the Fund. The Fund obtained thepositive recommendation of the Fund’s Independent ReviewCommittee and the approval of the majority of the votes cast at aspecial meeting of unitholders held on May 28, 2015 in order toproceed with the administration fee. The administration fee will beeffective July 1, 2015 and is equal to 0.10% annually, of the valueof the mortgages purchased from the Bank. During the period, thefund paid nil fees to the Bank (December 31, 2014, $0).
Distribution ServicesThe Fund is distributed through us, HSBC Investment Funds(Canada) Inc. (our wholly owned subsidiary); HSBC Private Wealth
Services (Canada) Inc. and through HSBC Securities (Canada) Inc.(an affiliate) directly or through its division, HSBC InvestDirect. Wepay distribution and servicing fees to them based on the amountof assets held in the investor’s account, and additionally, in somecases, on the amount of the initial purchase. If you hold units ofthis Fund and/or other HSBC Mutual Funds in a registered planwith HSBC Investment Funds (Canada) Inc., they may charge youan annual fee to cover the annual administration costs of the plan.We permit HSBC Investment Funds (Canada) Inc. to collect thesefees by redeeming sufficient units of the Fund with the highestmarket value in your registered plan.
Purchases of Securities Underwritten by a Related PartyDuring the period, the Fund invested in certain securities thatwere underwritten, in whole or in part, by entities that are arelated party to us. To proceed with the transactions, the Fundrelied on the approval of the Fund’s Independent ReviewCommittee by way of Standing Instruction. A condition of thisapproval was that the transactions were performed in accordancewith our policy on Purchases of Securities Underwritten by aRelated Party.
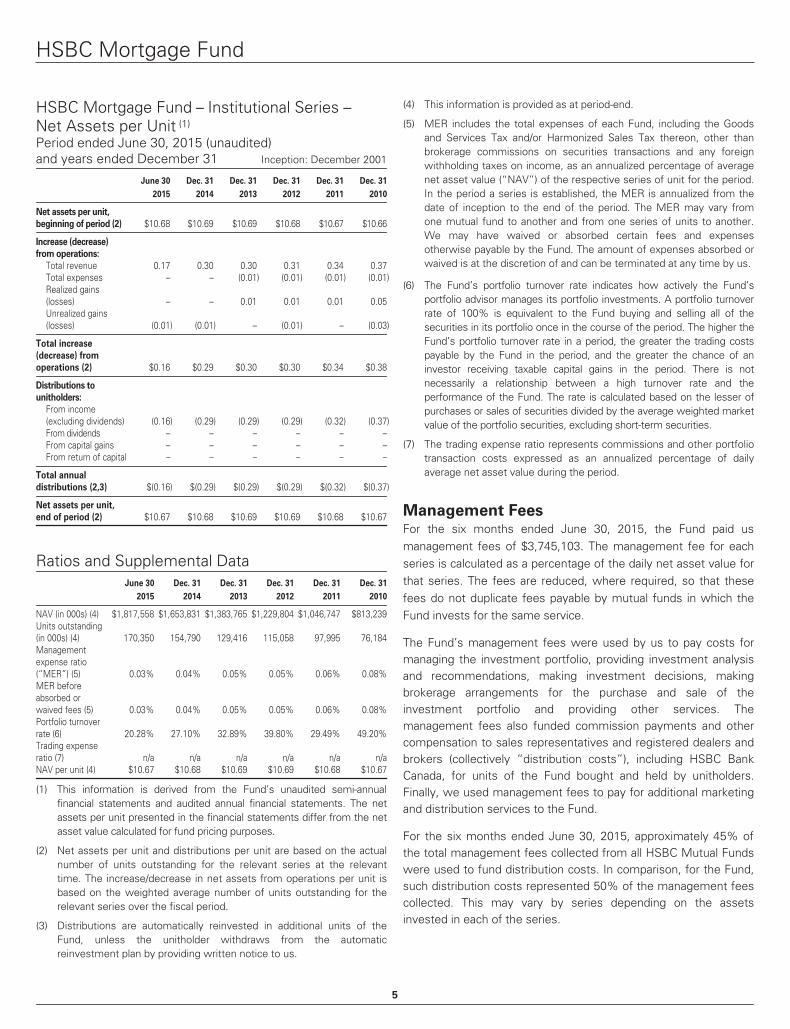
Financial HighlightsThe following tables show selected key financial information aboutthe Fund and are intended to help you understand the Fund’sfinancial performance for the six-month period ended June 30,2015 and for the last five years ended December 31, as applicable.In the year a fund is established, “period” represents the periodfrom inception to December 31 or June 30 of that fiscal year, asapplicable. This information is derived from the Fund’s unauditedsemi-annual financial statements and audited annual financialstatements. The information in the following tables is based onprescribed regulations, and as a result, is not expected to add dueto the increase/decrease in net assets from operations beingbased on average units outstanding during the period and all othernumbers being based on actual units outstanding at the relevantpoint in time.
2
HSBC Mortgage Fund
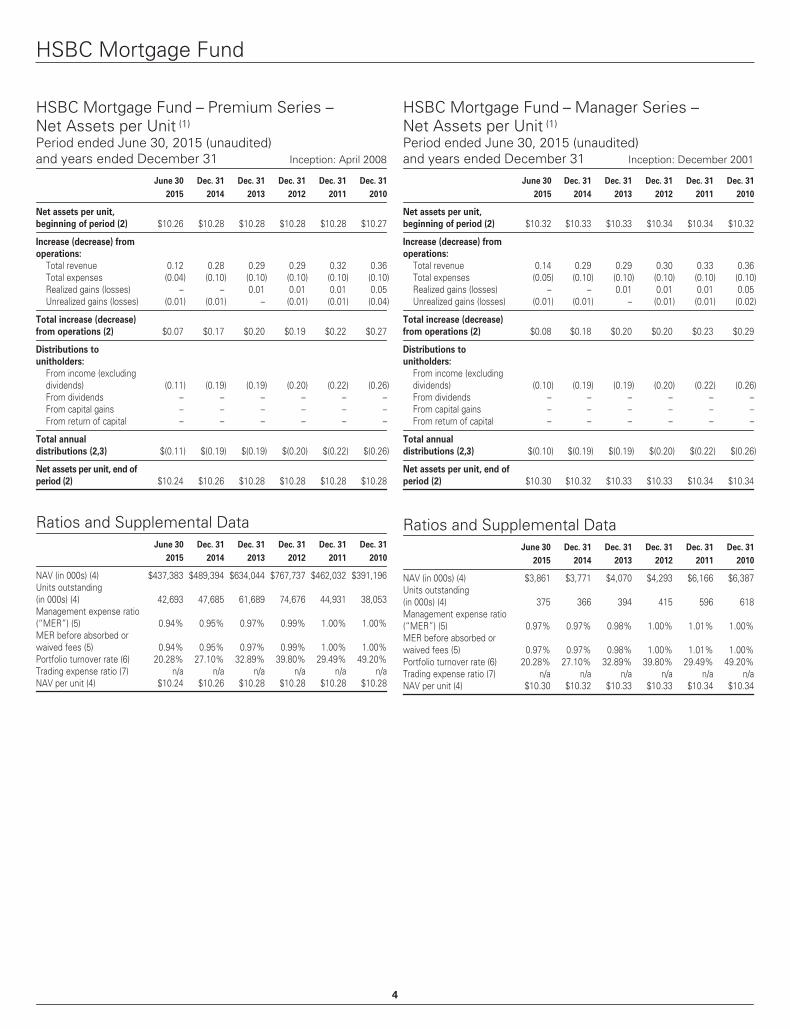
HSBC Mortgage Fund – Investor Series –Net Assets per Unit (1)
Period ended June 30, 2015 (unaudited)and years ended December 31 Inception: December 1992
June 30
2015
Dec. 31
2014
Dec. 31
2013
Dec. 31
2012
Dec. 31
2011
Dec. 31
2010
Net assets per unit,
beginning of period (2) $11.59 $11.60 $11.60 $11.60 $11.59 $11.58
(1) This information is derived from the Fund’s unaudited semi-annualfinancial statements and audited annual financial statements. The netassets per unit presented in the financial statements differ from the netasset value calculated for fund pricing purposes.
(2) Net assets per unit and distributions per unit are based on the actualnumber of units outstanding for the relevant series at the relevanttime. The increase/decrease in net assets from operations per unit isbased on the weighted average number of units outstanding for therelevant series over the fiscal period.
(3) Distributions are automatically reinvested in additional units of theFund, unless the unitholder withdraws from the automaticreinvestment plan by providing written notice to us.
(4) This information is provided as at period-end.
(5) MER includes the total expenses of each Fund, including the Goodsand Services Tax and/or Harmonized Sales Tax thereon, other thanbrokerage commissions on securities transactions and any foreignwithholding taxes on income, as an annualized percentage of averagenet asset value (“NAV”) of the respective series of unit for the period.In the period a series is established, the MER is annualized from thedate of inception to the end of the period. The MER may vary fromone mutual fund to another and from one series of units to another.We may have waived or absorbed certain fees and expensesotherwise payable by the Fund. The amount of expenses absorbed orwaived is at the discretion of and can be terminated at any time by us.
(6) The Fund’s portfolio turnover rate indicates how actively the Fund’sportfolio advisor manages its portfolio investments. A portfolio turnoverrate of 100% is equivalent to the Fund buying and selling all of thesecurities in its portfolio once in the course of the period. The higher theFund’s portfolio turnover rate in a period, the greater the trading costspayable by the Fund in the period, and the greater the chance of aninvestor receiving taxable capital gains in the period. There is notnecessarily a relationship between a high turnover rate and theperformance of the Fund. The rate is calculated based on the lesser ofpurchases or sales of securities divided by the average weighted marketvalue of the portfolio securities, excluding short-term securities.
(7) The trading expense ratio represents commissions and other portfoliotransaction costs expressed as an annualized percentage of dailyaverage net asset value during the period.
Management FeesFor the six months ended June 30, 2015, the Fund paid usmanagement fees of $3,745,103. The management fee for eachseries is calculated as a percentage of the daily net asset value forthat series. The fees are reduced, where required, so that thesefees do not duplicate fees payable by mutual funds in which theFund invests for the same service.
The Fund’s management fees were used by us to pay costs formanaging the investment portfolio, providing investment analysisand recommendations, making investment decisions, makingbrokerage arrangements for the purchase and sale of theinvestment portfolio and providing other services. Themanagement fees also funded commission payments and othercompensation to sales representatives and registered dealers andbrokers (collectively “distribution costs”), including HSBC BankCanada, for units of the Fund bought and held by unitholders.Finally, we used management fees to pay for additional marketingand distribution services to the Fund.
For the six months ended June 30, 2015, approximately 45% ofthe total management fees collected from all HSBC Mutual Fundswere used to fund distribution costs. In comparison, for the Fund,such distribution costs represented 50% of the management feescollected. This may vary by series depending on the assetsinvested in each of the series.
5
HSBC Mortgage Fund
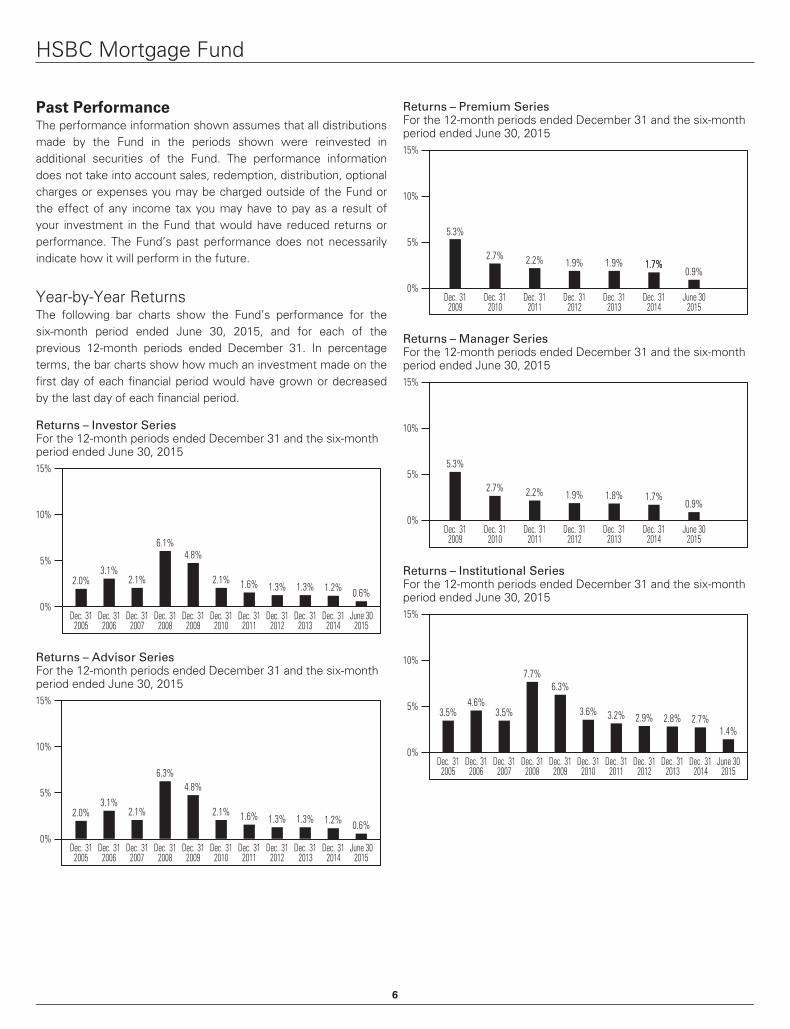
Past PerformanceThe performance information shown assumes that all distributionsmade by the Fund in the periods shown were reinvested inadditional securities of the Fund. The performance informationdoes not take into account sales, redemption, distribution, optionalcharges or expenses you may be charged outside of the Fund orthe effect of any income tax you may have to pay as a result ofyour investment in the Fund that would have reduced returns orperformance. The Fund’s past performance does not necessarilyindicate how it will perform in the future.
Year-by-Year ReturnsThe following bar charts show the Fund’s performance for thesix-month period ended June 30, 2015, and for each of theprevious 12-month periods ended December 31. In percentageterms, the bar charts show how much an investment made on thefirst day of each financial period would have grown or decreasedby the last day of each financial period.
Returns – Investor SeriesFor the 12-month periods ended December 31 and the six-monthperiod ended June 30, 201515%
10%
5%
0%
2.0%3.1%
2.1%
6.1%4.8%
2.1%
Dec. 312005
Dec. 312006
Dec. 312007
Dec. 312008
Dec. 312009
Dec. 312010
Dec. 312012
1.6% 1.3% 1.3% 1.2% 0.6%
Dec. 312013
June 302015
Dec. 312014
Dec. 312011
Returns – Advisor SeriesFor the 12-month periods ended December 31 and the six-monthperiod ended June 30, 2015
1.2% 0.6%
15%
10%
5%
0%
2.0%3.1%
2.1%
6.3%4.8%
2.1% 1.6% 1.3% 1.3%
Dec. 312005
Dec. 312006
Dec. 312007
Dec. 312008
Dec. 312009
Dec. 312010
Dec. 312011
Dec. 312012
Dec. 312013
June 302015
Dec. 312014
Returns – Premium SeriesFor the 12-month periods ended December 31 and the six-monthperiod ended June 30, 201515%
10%
5%
0%
5.3%
2.7% 2.2%
Dec. 312009
Dec. 312010
Dec. 312011
Dec. 312013
Dec. 312014
1.9% 1.9% 1.7%1.7%0.9%
June 302015
Dec. 312012
Returns – Manager SeriesFor the 12-month periods ended December 31 and the six-monthperiod ended June 30, 2015
1.7%0.9%
15%
10%
5%
0%
5.3%
2.7% 2.2% 1.9% 1.8%
Dec. 312009
Dec. 312010
Dec. 312011
Dec. 312013
Dec. 312014
June 302015
Dec. 312012
Returns – Institutional SeriesFor the 12-month periods ended December 31 and the six-monthperiod ended June 30, 201515%
10%
5%
0%
3.5%4.6%
3.5%
7.7%6.3%
3.6% 3.2% 2.9% 2.8% 2.7%1.4%
Dec. 312005
Dec. 312006
Dec. 312007
Dec. 312008
Dec. 312009
Dec. 312010
Dec. 312011
Dec. 312012
Dec. 312013
June 302015
Dec. 312014
6
HSBC Mortgage Fund
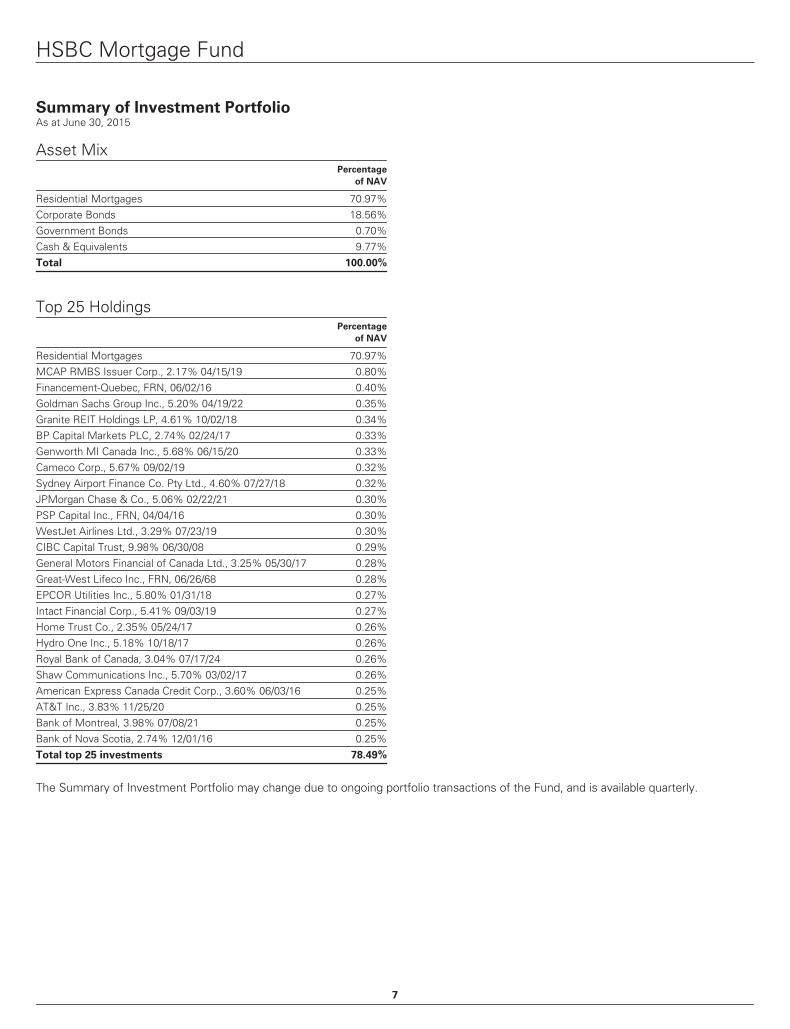
Summary of Investment PortfolioAs at June 30, 2015
The Summary of Investment Portfolio may change due to ongoing portfolio transactions of the Fund, and is available quarterly.
7
For more information
You can find more information about HSBC Mutual Fundsin the Fund’s Simplified Prospectus, Annual InformationForm, Annual and Semi-Annual Report and Fund Facts. Youcan get a copy of these documents, as well as the Fund’sFinancial Statements, at no cost by calling 1-888-390-3333,by contacting your authorized dealer or by visiting ourwebsite at www.hsbc.ca/investment-resources.
These documents and other information about the HSBCMutual Funds, such as information circulars and materialcontracts, are also available at www.sedar.com.
Copies of the Annual Report and Semi-Annual Report,Simplified Prospectus, Annual Information Form, Annualand Interim Management Report of Fund Performanceand Fund Facts are available on our website atwww.hsbc.ca/investment-resources.
How to reach us
VancouverHSBC Global Asset Management (Canada) Limited3rd Floor, 885 West Georgia StreetVancouver, BC V6C 3E8
Tel: 1-888-390-3333Fax: 604-669-2756
TorontoSuite 300 – 70 York StreetToronto, ON M5J 1S9
MontrealSuite 300 – 2001 McGill College AvenueMontreal, QC H3A 1G1
A NOTE ON FORWARD-LOOKING STATEMENTS
This report may contain forward-looking statements about the Fund, including its strategy, expected performance and condition. Forward-lookingstatements include statements that are predictive in nature that depend upon or refer to future events or conditions, or that include words such as“expects,” “anticipates,” “intends,” “plans,” “believes,” “estimates” or negative versions thereof and similar expressions. In addition, any statement thatmay be made concerning future performance, strategies or prospects, and possible future Fund action, is also a forward-looking statement. Forward-lookingstatements are based on current expectations and projections about future events and are inherently subject to, among other things, risks, uncertaintiesand assumptions about the Fund and economic factors.
Forward-looking statements are not guarantees of future performance, and actual events and results could differ materially from those expressed or impliedin any forward-looking statements made by the Fund. Any number of important factors could contribute to these digressions, including, but not limited to,general economic, political and market factors in North America and internationally, interest and foreign exchange rates, global equity and capital markets,business competition, technological change, changes in government regulations, unexpected judicial or regulatory proceedings, and catastrophic events.
We stress that the above-mentioned list of important factors is not exhaustive. We encourage you to consider these and other factors carefully beforemaking any investment decisions and we urge you to avoid placing undue reliance on forward-looking statements. Further, you should be aware of the factthat the Fund has no specific intention of updating any forward-looking statements, whether as a result of new information, future events or otherwise.
Sources: HSBC Global Asset Management (Canada) Limited, FTSE TMX Global Debt Capital Markets Inc.
FTSE TMX Global Debt Capital Markets Inc. (“FTDCM”), FTSE International Limited (“FTSE”), the London Stock Exchange Group companies (the“Exchange”) or TSX Inc. (“TSX” and together with FTDCM, FTSE and the Exchange, the “Licensor Parties”). The Licensor Parties make no warranty orrepresentation whatsoever, expressly or impliedly, either as to the results to be obtained from the use of the FTSE TMX Canada Index and/or the figure atwhich the said Index stands at any particular time on any particular day or otherwise. The Index is compiled and calculated by FTDCM and all copyright inthe Index values and constituent lists vests in FTDCM. The Licensor Parties shall not be liable (whether in negligence or otherwise) to any person for anyerror in the Index and the Licensor Parties shall not be under any obligation to advise any person of any error therein. “TMX” is a trade mark of TSX Inc. andis used under licence. “FTSE®” is a trade mark of FTSE International Limited and is used by FTDCM under licence.
Unauthorized reproduction, distribution, transmission or publication without our prior written consent is strictly prohibited.
Issued byHSBC Global Asset Management (Canada) Limited (2
015-
08)R
RD
HSBC Canadian Bond Fund
Interim Management Report of Fund Performance
for the six months ended June 30, 2015
HSBC Canadian Bond Fund
Management Discussion of Fund PerformanceIn this document, you and your refer to the unitholder of the Fund;we, us and our refer to HSBC Global Asset Management (Canada)Limited; and the Fund refers to the HSBC Canadian Bond Fund.
We are the manager, trustee and primary investment advisor ofthe Fund.
IntroductionThis Interim Management Report of Fund Performance containsfinancial highlights but does not contain the complete annual or semi-annual financial statements of the investment fund. You may obtain acopy of the Fund’s annual or semi-annual financial statements at yourrequest, at no cost, by calling us toll-free at 1-888-390-3333, by visitingour website at www.hsbc.ca/investment-resources, by visiting theSEDAR website at www.sedar.com or by writing to us at:
Corporate SecretaryHSBC Global Asset Management (Canada) Limited3rd Floor, 885 West Georgia StreetVancouver, BC V6C 3E8
You may also contact us using one of these methods to request acopy of the Fund’s proxy voting policies and procedures, proxy votingdisclosure record or quarterly statement of investment portfolio.
Results of OperationsAs of June 30, 2015, the Fund’s net assets increased by 1% to$849 million from $840.8 million at the end of 2014. Of thisincrease, a $19 million gain was attributable to investmentperformance and $10.8 million was attributable to net withdrawalsfrom Fund.
Investment PerformanceThe HSBC Canadian Bond Fund (Investor Series) rose 2.04% forthe six months ending June 30, 2015, while the benchmarkFTSE TMX Canada Universe Bond Index rose 2.37% over thesame period. The Fund’s overweight position in corporate bondshad a positive impact on relative performance, as did its highrunning yield. Duration, which was shorter than the benchmark,had a negative impact on the Fund’s relative performance year-to-date.
One of the most surprising developments in financial markets overthe course of 2014 was the sharp decline in global bond yields.Since the end of 2014, the overall yield in the Canadian bondmarket has fallen from 2.23% to 1.96%. There continued to besome divergence in the performance between the differentsectors of the market in the first half of 2015. Corporate bonds2.24% outperformed Government of Canada bonds2.08% slightly, while provincial bonds 2.84% were the best-performing sector due to their longer average term-to-maturity.
After having steepened dramatically in the first quarter, followingthe Bank of Canada’s surprise cut in the overnight rate, the yield
curve flattened in the second quarter. The difference betweentwo-year and 30-year Government of Canada yields widened to182 basis points from 148 basis points at the start of the secondquarter. The yield differential stood at 132 basis points at the startof the year. The Bank of Canada cited the sharp sell-off in energyprices, and the potential shock to the Canadian economy, as aprimary driver for the rate cut. Expectations surrounding the Bankof Canada’s course of action for 2015 and beyond are drivingvolatility.
Recent DevelopmentsAs expected, lower energy prices put short-term pressure onNorth American economies early in 2015. Growth in both the USand Canada contracted in the first quarter, and has been slow torebound in the second quarter, as business investment and tradehave been disappointing. HSBC forecasts 2015 growth of 2.2% inthe US, 1.4% in Canada and 2.4% globally. Reasonable growth inemerging economies and accommodative monetary policy and aresilient consumer in the developed world should supportcontinued progress toward achieving potential growth rates.
We fully expect the US Federal Reserve to take a gradual,measured approach to unwinding monetary stimulus, starting inlate 2015. For the Canadian economy the additional stimulusprovided by the Bank of Canada, coupled with the depreciation ofthe Canadian dollar, should provide a boost to growth later in theyear. Further, with household balance sheets in good shape,stability in the housing and labour markets and lower energy coststhe consumer is expected to remain a key engine of growth.Potential risks to our central outlook include disappointing globalgrowth, further weakness in commodity prices and heightenedgeopolitical concerns in the eurozone.
Related Party TransactionsWe, on behalf of the Fund, or the Fund Manager, may, from time totime, enter into transactions or arrangements with or involving othermembers of the HSBC Group or other people or companies relatedor connected to us or the Fund. To proceed with the transactions,the Fund relies on the positive recommendation of the Fund’sIndependent Review Committee. A condition of this positiverecommendation is that the transactions are performed inaccordance with our policy on Related Party Transactions. For moregeneral information on persons related to the Fund and the types ofpotential transactions, see the Fund’s Simplified Prospectus.
The following is a summary of current transactions andarrangements with entities that are related to us or the Fund.
Manager, Trustee and Investment AdvisorWe are the manager, trustee and primary investment advisor of theFund. As manager, we manage the overall business and operationsof the Fund. As trustee, we hold legal title to the property of the
1
HSBC Canadian Bond Fund
Fund on your behalf. As primary investment advisor, we provideinvestment advice and portfolio management services to the Fund.We receive a fee from the Fund for these services based on assetsunder management, calculated daily and paid monthly.
Distribution ServicesThe Fund is distributed through us, HSBC Investment Funds(Canada) Inc. (our wholly owned subsidiary); HSBC Private WealthServices (Canada) Inc. and through HSBC Securities (Canada) Inc.(an affiliate) directly or through its division, HSBC InvestDirect. Wepay distribution and servicing fees to them based on the amountof assets held in the investor’s account, and additionally, in somecases, on the amount of the initial purchase. If you hold units ofthis Fund and/or other HSBC Mutual Funds in a registered planwith HSBC Investment Funds (Canada) Inc., they may charge youan annual fee to cover the annual administration costs of the plan.We permit HSBC Investment Funds (Canada) Inc. to collect thesefees by redeeming sufficient units of the Fund with the highestmarket value in your registered plan.
Fund on Fund InvestingDuring the period, the Fund invested in units of other HSBC MutualFunds, which are also managed by us. To proceed with thetransactions, the Fund relied on the positive recommendation of theFund’s Independent Review Committee by way of StandingInstruction. A condition of this positive recommendation was thatthe transactions were performed in accordance with our policy onFund on Fund Investing.
Purchases of Securities Underwritten by a Related PartyDuring the period, the Fund invested in certain securities thatwere underwritten, in whole or in part, by entities that are arelated party to us. To proceed with the transactions, the Fundrelied on the approval of the Fund’s Independent ReviewCommittee by way of Standing Instruction. A condition of thisapproval was that the transactions were performed in accordancewith our policy on Purchases of Securities Underwritten by aRelated Party.
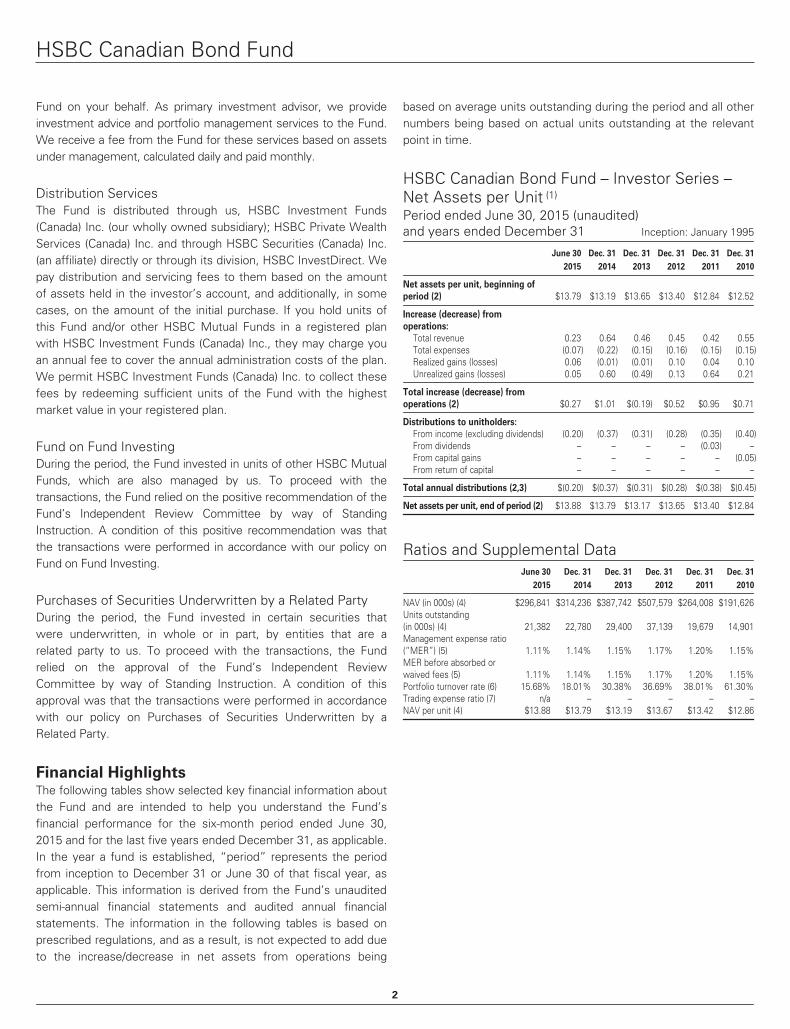
Financial HighlightsThe following tables show selected key financial information aboutthe Fund and are intended to help you understand the Fund’sfinancial performance for the six-month period ended June 30,2015 and for the last five years ended December 31, as applicable.In the year a fund is established, “period” represents the periodfrom inception to December 31 or June 30 of that fiscal year, asapplicable. This information is derived from the Fund’s unauditedsemi-annual financial statements and audited annual financialstatements. The information in the following tables is based onprescribed regulations, and as a result, is not expected to add dueto the increase/decrease in net assets from operations being
based on average units outstanding during the period and all othernumbers being based on actual units outstanding at the relevantpoint in time.
HSBC Canadian Bond Fund – Investor Series –Net Assets per Unit (1)
Period ended June 30, 2015 (unaudited)and years ended December 31 Inception: January 1995
June 30
2015
Dec. 31
2014
Dec. 31
2013
Dec. 31
2012
Dec. 31
2011
Dec. 31
2010
Net assets per unit, beginning of
period (2) $13.79 $13.19 $13.65 $13.40 $12.84 $12.52
(1) This information is derived from the Fund’s unaudited semi-annualfinancial statements and audited annual financial statements. The netassets per unit presented in the financial statements differ from thenet asset value calculated for fund pricing purposes.
(2) Net assets per unit and distributions per unit are based on the actualnumber of units outstanding for the relevant series at the relevanttime. The increase/decrease in net assets from operations per unit isbased on the weighted average number of units outstanding for therelevant series over the fiscal period.
(3) Distributions are automatically reinvested in additional units of theFund, unless the unitholder withdraws from the automaticreinvestment plan by providing written notice to us.
(4) This information is provided as at period-end.
(5) MER includes the total expenses of each Fund, including the Goodsand Services Tax and/or Harmonized Sales Tax thereon, other thanbrokerage commissions on securities transactions and any foreignwithholding taxes on income, as an annualized percentage of averagenet asset value (“NAV”) of the respective series of unit for the period.In the period a series is established, the MER is annualized from the
4
HSBC Canadian Bond Fund
date of inception to the end of the period. The MER may vary fromone mutual fund to another and from one series of units to another.We may have waived or absorbed certain fees and expensesotherwise payable by the Fund. The amount of expenses absorbed orwaived is at the discretion of and can be terminated at any time by us.
(6) The Fund’s portfolio turnover rate indicates how actively the Fund’sportfolio advisor manages its portfolio investments. A portfolio turnoverrate of 100% is equivalent to the Fund buying and selling all of thesecurities in its portfolio once in the course of the period. The higher theFund’s portfolio turnover rate in a period, the greater the trading costspayable by the Fund in the period, and the greater the chance of aninvestor receiving taxable capital gains in the period. There is notnecessarily a relationship between a high turnover rate and theperformance of the Fund. The rate is calculated based on the lesser ofpurchases or sales of securities divided by the average weighted marketvalue of the portfolio securities, excluding short-term securities.
(7) The trading expense ratio represents commissions and other portfoliotransaction costs expressed as an annualized percentage of dailyaverage net asset value during the period.
Management FeesFor the six months ended June 30, 2015, the Fund paid usmanagement fees of $2,518,551. The management fee for eachseries is calculated as a percentage of the daily net asset value forthat series. The fees are reduced, where required, so that thesefees do not duplicate fees payable by mutual funds in which theFund invests for the same service.
The Fund’s management fees were used by us to pay costs formanaging the investment portfolio, providing investment analysisand recommendations, making investment decisions, makingbrokerage arrangements for the purchase and sale of theinvestment portfolio and providing other services. Themanagement fees also funded commission payments and othercompensation to sales representatives and registered dealers andbrokers (collectively “distribution costs”), including HSBC BankCanada, for units of the Fund bought and held by unitholders.Finally, we used management fees to pay for additional marketingand distribution services to the Fund.
For the six months ended June 30, 2015, approximately 45% ofthe total management fees collected from all HSBC Mutual Fundswere used to fund distribution costs. In comparison, for the Fund,such distribution costs represented 50% of the management feescollected. This may vary by series depending on the assetsinvested in each of the series.
Past PerformanceThe performance information shown assumes that all distributionsmade by the Fund in the periods shown were reinvested inadditional securities of the Fund. The performance informationdoes not take into account sales, redemption, distribution, optionalcharges or expenses you may be charged outside of the Fund orthe effect of any income tax you may have to pay as a result ofyour investment in the Fund that would have reduced returns or
performance. The Fund’s past performance does not necessarilyindicate how it will perform in the future.
Year-by-Year ReturnsThe following bar charts show the Fund’s performance for thesix-month period ended June 30, 2015, and for each of theprevious 12-month periods ended December 31. In percentageterms, the bar charts show how much an investment made on thefirst day of each financial period would have grown or decreasedby the last day of each financial period.
Returns – Investor SeriesFor the 12-month periods ended December 31 and the six-monthperiod ended June 30, 201510%
0%
Dec. 312005
Dec. 312006
Dec. 312007
Dec. 312008
Dec. 312009
Dec. 312010
Dec. 312011
4.7%3.4%
2.4%3.4%
6.4% 6.2%7.5% 7.5%
2.0%
4.0%
-1.3%
Dec. 312012
Dec. 312013
June 302015
Dec. 312014
5%
-5%
Returns – Advisor SeriesFor the 12-month periods ended December 31 and the six-monthperiod ended June 30, 201510%
0%
Dec. 312005
Dec. 312006
Dec. 312007
Dec. 312008
Dec. 312009
Dec. 312010
Dec. 312011
4.7%3.4%
2.4%3.4%
6.4% 6.1%7.5% 7.4%
1.8%
4.0%
-1.1%
Dec. 312012
Dec. 312013
June 302015
Dec. 312014
5%
-5%
Returns – Premium SeriesFor the 12-month periods ended December 31 and the six-monthperiod ended June 30, 201510%
5%
0%
-5%
6.7% 6.4%7.7% 7.7%
2.2%
4.3%
-1.0%
Dec. 312009
Dec. 312010
Dec. 312011
Dec. 312012
Dec. 312013
Dec. 312014
June 302015
5
HSBC Canadian Bond Fund
Returns – Manager SeriesFor the 12-month periods ended December 31 and the six-monthperiod ended June 30, 201510%
0%
Dec. 312005
Dec. 312006
Dec. 312007
Dec. 312008
Dec. 312009
Dec. 312010
Dec. 312011
5.2%4.0%
3.0%4.0%
6.9% 6.7%8.1% 8.0%
2.1%
4.6%
-0.7%
Dec. 312012
Dec. 312013
June 302015
Dec. 312014
5%
-5%
Returns – Institutional SeriesFor the 12-month periods ended December 31 and the six-monthperiod ended June 30, 201510%
0%
5.8%4.5%
3.5%4.5%
7.5% 7.3%8.6% 8.6%
2.6%
5.2%
-0.2%
5%
-5%Dec. 31
2005Dec. 31
2006Dec. 31
2007Dec. 31
2008Dec. 31
2009Dec. 31
2010Dec. 31
2011Dec. 31
2013June 30
2015Dec. 31
2014Dec. 31
2012
Summary of Investment PortfolioAs at June 30, 2015
HSBC Mortgage Fund – Institutional Series 9.82%Province of Ontario, 5.60% 06/02/35 6.88%Province of Ontario, 2.85% 06/02/23 4.51%CDP Financial Inc., 4.60% 07/15/20 4.09%Province of British Columbia, 4.70% 06/18/37 3.31%SPDR Barclays Capital High Yield Bond ETF 2.64%Province of Ontario, 3.45% 06/02/45 2.29%BHP Billiton Finance Ltd., 3.23% 05/15/23 2.22%Cameco Corp., 5.67% 09/02/19 2.05%AT&T Inc., 3.83% 11/25/20 1.97%Heathrow Funding Ltd., 4.00% 07/03/19 1.94%Province of Ontario Generic Coupon Strip, 12/02/20 1.93%Commonwealth Bank of Australia, 5.15% 04/09/20 1.90%Province of Saskatchewan, 5.00% 03/05/37 1.83%TMX Group Ltd., 3.25% 10/03/18 1.82%Merrill Lynch & Co. Inc., 5.29% 05/30/22 1.75%Province of British Columbia, 5.70% 06/18/29 1.75%Brookfield Asset Management Inc., 5.30% 03/01/21 1.68%Province of New Brunswick, 3.55% 06/03/43 1.55%Intact Financial Corp., 5.41% 09/03/19 1.44%Husky Energy Inc., 5.00% 03/12/20 1.39%BP Capital Markets PLC, 3.50% 11/09/20 1.33%Manulife Financial Corp., 7.77% 04/08/19 1.33%WestJet Airlines Ltd., 3.29% 07/23/19 1.29%Genworth MI Canada Inc., 5.68% 06/15/20 1.27%Total top 25 investments 63.98%
The Summary of Investment Portfolio may change due to ongoing portfolio transactions of the Fund, and is available quarterly.
6
For more information
You can find more information about HSBC Mutual Fundsin the Fund’s Simplified Prospectus, Annual InformationForm, Annual and Semi-Annual Report and Fund Facts. Youcan get a copy of these documents, as well as the Fund’sFinancial Statements, at no cost by calling 1-888-390-3333,by contacting your authorized dealer or by visiting ourwebsite at www.hsbc.ca/investment-resources.
These documents and other information about the HSBCMutual Funds, such as information circulars and materialcontracts, are also available at www.sedar.com.
Copies of the Annual Report and Semi-Annual Report,Simplified Prospectus, Annual Information Form, Annualand Interim Management Report of Fund Performanceand Fund Facts are available on our website atwww.hsbc.ca/investment-resources.
How to reach us
VancouverHSBC Global Asset Management (Canada) Limited3rd Floor, 885 West Georgia StreetVancouver, BC V6C 3E8
Tel: 1-888-390-3333Fax: 604-669-2756
TorontoSuite 300 – 70 York StreetToronto, ON M5J 1S9
MontrealSuite 300 – 2001 McGill College AvenueMontreal, QC H3A 1G1
A NOTE ON FORWARD-LOOKING STATEMENTS
This report may contain forward-looking statements about the Fund, including its strategy, expected performance and condition. Forward-lookingstatements include statements that are predictive in nature that depend upon or refer to future events or conditions, or that include words such as“expects,” “anticipates,” “intends,” “plans,” “believes,” “estimates” or negative versions thereof and similar expressions. In addition, any statement thatmay be made concerning future performance, strategies or prospects, and possible future Fund action, is also a forward-looking statement. Forward-lookingstatements are based on current expectations and projections about future events and are inherently subject to, among other things, risks, uncertaintiesand assumptions about the Fund and economic factors.
Forward-looking statements are not guarantees of future performance, and actual events and results could differ materially from those expressed or impliedin any forward-looking statements made by the Fund. Any number of important factors could contribute to these digressions, including, but not limited to,general economic, political and market factors in North America and internationally, interest and foreign exchange rates, global equity and capital markets,business competition, technological change, changes in government regulations, unexpected judicial or regulatory proceedings, and catastrophic events.
We stress that the above-mentioned list of important factors is not exhaustive. We encourage you to consider these and other factors carefully beforemaking any investment decisions and we urge you to avoid placing undue reliance on forward-looking statements. Further, you should be aware of the factthat the Fund has no specific intention of updating any forward-looking statements, whether as a result of new information, future events or otherwise.
Sources: HSBC Global Asset Management (Canada) Limited, FTSE TMX Global Debt Capital Markets Inc.
FTSE TMX Global Debt Capital Markets Inc. (“FTDCM”), FTSE International Limited (“FTSE”), the London Stock Exchange Group companies (the“Exchange”) or TSX Inc. (“TSX” and together with FTDCM, FTSE and the Exchange, the “Licensor Parties”). The Licensor Parties make no warranty orrepresentation whatsoever, expressly or impliedly, either as to the results to be obtained from the use of the FTSE TMX Canada Index and/or the figure atwhich the said Index stands at any particular time on any particular day or otherwise. The Index is compiled and calculated by FTDCM and all copyright inthe Index values and constituent lists vests in FTDCM. The Licensor Parties shall not be liable (whether in negligence or otherwise) to any person for anyerror in the Index and the Licensor Parties shall not be under any obligation to advise any person of any error therein. “TMX” is a trade mark of TSX Inc. andis used under licence. “FTSE®” is a trade mark of FTSE International Limited and is used by FTDCM under licence.
Unauthorized reproduction, distribution, transmission or publication without our prior written consent is strictly prohibited.
Issued byHSBC Global Asset Management (Canada) Limited (2
015-
08)R
RD
HSBC Emerging Markets Debt Fund
Interim Management Report of Fund Performance
for the six months ended June 30, 2015
HSBC Emerging Markets Debt Fund
Management Discussion of Fund PerformanceIn this document, you and your refer to the unitholder of the Fund;we, us and our refer to HSBC Global Asset Management (Canada)Limited; and the Fund refers to the HSBC Emerging Markets DebtFund.
We are the manager, trustee and primary investment advisor ofthe Fund. We have hired HSBC Global Asset Management (USA)Inc. as the sub-advisor to provide portfolio management andinvestment advisory services to the Fund. For an explanation ofthe relationship between us and the sub-advisor, see thesection Selection of Sub-Advisors in the Fund’s SimplifiedProspectus.
IntroductionThis Interim Management Report of Fund Performance containsfinancial highlights but does not contain the complete annual or semi-annual financial statements of the investment fund. You may obtain acopy of the Fund’s annual or semi-annual financial statements at yourrequest, at no cost, by calling us toll-free at 1-888-390-3333, by visitingour website at www.hsbc.ca/investment-resources, by visiting theSEDAR website at www.sedar.com or by writing to us at:
Corporate SecretaryHSBC Global Asset Management (Canada) Limited3rd Floor, 885 West Georgia StreetVancouver, BC V6C 3E8
You may also contact us using one of these methods to request acopy of the Fund’s proxy voting policies and procedures, proxyvoting disclosure record or quarterly statement of investmentportfolio.
Results of OperationsAs of June 30, 2015, the Fund’s net assets increased by 22.4% to$333.9 million from $272.9 million at the end of 2014. Of thisincrease, a $11.3 million gain was attributable to investmentperformance and $49.7 million was attributable to netcontributions to the Fund.
Investment PerformanceThe HSBC Emerging Markets Debt Fund (Investor Series), rose3.29% for the six months ending June 30, 2015. The benchmarkwas up 3.11% for the same period. The benchmark is a weightedcomposite consisting of the JP Morgan Emerging Markets BondIndex – Global (in US dollars) (50%), the JP Morgan Global BondIndex – Emerging Markets Global Diversified Unhedged (inCanadian dollars) (25%) and the JP Morgan Emerging LocalMarkets Index Plus (in Canadian dollars) (25%).
The Fund outperformed the benchmark during the first half of2015, driven by an allocation to shorter-dated securities in high-quality countries and exposure to local currencies. The Fund’s
exposure to short-dated securities in Brazil, Colombia, Turkey andSouth Africa contributed to performance as shorter-datedmaturities outperformed amid rising US Treasury yields. TheFund’s exposure to the Turkish lira and Brazilian real alsocontributed to the overall return.
The underweight to Ukraine contributed to performance asUkraine’s external bonds underperformed as the country entereddebt restructuring talks with bondholders. The overweight to theRussian ruble in the first quarter significantly contributed toperformance as the currency recovered following the sell-off inlate 2014.
Among high-yield issuers, the overweight exposure to Venezueladetracted, particularly in the first quarter, as the continued declinein oil prices further fuelled concerns about Venezuela’s ability toservice its external obligations. The underweight to Argentinadetracted from relative performance. Despite deterioratingeconomic fundamentals and limited access to capital markets,Argentine bonds continued to remain resilient in the first half ofthe year. They were supported by investors’ expectations for moremarket-friendly policymaking following the presidential election inOctober.
Recent DevelopmentsThe combination of deteriorating fundamentals in select emergingmarket countries, the ongoing economic rebalancing in China andthe prospect of monetary policy normalization in the US paints acomplicated picture for emerging markets. As a result, in the hard-currency portion of the Fund, the Fund Manager has beenfocusing their investments in countries that meet the followingcriteria: floating currency regimes, which should allow the countryto absorb external shocks; high levels of external reserves and aproven track record of orthodox monetary and fiscal policies.
While currency valuations have improved over the past severalmonths, the Fund Manager has reduced their currency exposurefollowing deterioration in market positioning and an increase ininterest rate volatility in developed markets. They maintain anunderweight in local duration in select countries, with the beliefthat local currency yields are likely to come under pressure toincrease. Many emerging market countries will have to respond torising inflationary pressures resulting from a foreign exchangedepreciation pass-through effect as well as the potential threat ofcapital outflows as US interest rates rise.
Related Party TransactionsWe, on behalf of the Fund, or the Fund Manager, may, from timeto time, enter into transactions or arrangements with or involvingother members of the HSBC Group or other people or companiesrelated or connected to us or the Fund. To proceed with thetransactions, the Fund relies on the positive recommendation of
1
HSBC Emerging Markets Debt Fund
the Fund’s Independent Review Committee. A condition of thispositive recommendation is that the transactions are performed inaccordance with our policy on Related Party Transactions. Formore general information on persons related to the Fund and thetypes of potential transactions, see the Fund’s SimplifiedProspectus.
The following is a summary of current transactions andarrangements with entities that are related to us or the Fund.
Manager, Trustee and Investment AdvisorWe are the manager, trustee and primary investment advisor ofthe Fund. As manager, we manage the overall business andoperations of the Fund. As trustee, we hold legal title to theproperty of the Fund on your behalf. As primary investmentadvisor, we provide investment advice and portfolio managementservices to the Fund. We receive a fee from the Fund for theseservices based on assets under management, calculated daily andpaid monthly. We have entered into a sub-advisory agreementwith HSBC Global Asset Management (USA) Inc. (an affiliate),under which HSBC Global Asset Management (USA) Inc. providesinvestment advice and portfolio management services to theFund. We pay HSBC Global Asset Management (USA) Inc. a feebased on assets under management, calculated daily and paidquarterly. For more information on our ability to hire sub-advisors,see the section Organization and Management of the HSBCMutual Funds in the Fund’s Simplified Prospectus.
Distribution ServicesThe Fund is distributed through us, HSBC Investment Funds(Canada) Inc. (our wholly owned subsidiary); HSBC Private WealthServices (Canada) Inc. and through HSBC Securities (Canada) Inc.(an affiliate) directly or through its division, HSBC InvestDirect. Wepay distribution and servicing fees to them based on the amountof assets held in the investor’s account, and additionally, in somecases, on the amount of the initial purchase. If you hold units ofthis Fund and/or other HSBC Mutual Funds in a registered planwith HSBC Investment Funds (Canada) Inc., they may charge youan annual fee to cover the annual administration costs of the plan.We permit HSBC Investment Funds (Canada) Inc. to collect thesefees by redeeming sufficient units of the Fund with the highestmarket value in your registered plan.
Purchases of Securities Underwritten by a Related PartyDuring the period, the Fund invested in certain securities thatwere underwritten, in whole or in part, by entities that are arelated party to us. To proceed with the transactions, the Fundrelied on the approval of the Fund’s Independent ReviewCommittee by way of Standing Instruction. A condition of thisapproval was that the transactions were performed in accordancewith our policy on Purchases of Securities Underwritten by aRelated Party.
Financial HighlightsThe following tables show selected key financial information aboutthe Fund and are intended to help you understand the Fund’sfinancial performance for the six-month period ended June 30, 2015and for the last five years ended December 31, as applicable. In theyear a fund is established, “period” represents the period frominception to December 31 or June 30 of that fiscal year, asapplicable. This information is derived from the Fund’s unauditedsemi-annual financial statements and audited annual financialstatements. The information in the following tables is based onprescribed regulations, and as a result, is not expected to add due tothe increase/decrease in net assets from operations being based onaverage units outstanding during the period and all other numbersbeing based on actual units outstanding at the relevant point in time.
HSBC Emerging Markets Debt Fund –Investor Series – Net Assets per Unit (1)
Period ended June 30, 2015 (unaudited)and years ended December 31 Inception: September 2011
From income (excluding dividends) (0.26) (0.45) (0.37) (0.41) –From dividends – – – – (0.07)From capital gains – – – (0.13) (0.03)From return of capital – – – – –
Total annual distributions (2,3) $(0.26) $(0.45) $(0.37) $(0.54) $(0.10)
Net assets per unit, end of period (2) $10.35 $10.19 $10.13 $10.76 $9.88
Ratios and Supplemental DataJune 30
2015
Dec. 31
2014
Dec. 31
2013
Dec. 31
2012
Dec. 31
2011
NAV (in 000s) (4) $300,311 $229,849 $221,486 $124,018 $86,465Units outstanding (in 000s) (4) 29,008 22,554 21,831 11,499 8,721Management expense ratio(“MER”) (5) 0.12% 0.17% 0.14% 0.17% 0.40%MER before absorbed or waivedfees (5) 0.12% 0.17% 0.14% 0.17% 0.40%Portfolio turnover rate (6) 32.99% 75.75% 62.80% 73.65% 21.15%Trading expense ratio (7) n/a n/a n/a n/a n/aNAV per unit (4) $10.35 $10.19 $10.15 $10.78 $9.91
(1) This information is derived from the Fund’s unaudited semi-annualfinancial statements and audited annual financial statements. The netassets per unit presented in the financial statements differ from thenet asset value calculated for fund pricing purposes.
(2) Net assets per unit and distributions per unit are based on the actualnumber of units outstanding for the relevant series at the relevanttime. The increase/decrease in net assets from operations per unit isbased on the weighted average number of units outstanding for therelevant series over the fiscal period.
(3) Distributions are automatically reinvested in additional units of theFund, unless the unitholder withdraws from the automaticreinvestment plan by providing written notice to us.
(4) This information is provided as at period-end.
(5) MER includes the total expenses of each Fund, including the Goodsand Services Tax and/or Harmonized Sales Tax thereon, other thanbrokerage commissions on securities transactions and any foreignwithholding taxes on income, as an annualized percentage of averagenet asset value (“NAV”) of the respective series of unit for the period.In the period a series is established, the MER is annualized from thedate of inception to the end of the period. The MER may vary fromone mutual fund to another and from one series of units to another.We may have waived or absorbed certain fees and expensesotherwise payable by the Fund. The amount of expenses absorbed orwaived is at the discretion of and can be terminated at any time by us.
(6) The Fund’s portfolio turnover rate indicates how actively the Fund’sportfolio advisor manages its portfolio investments. A portfolioturnover rate of 100% is equivalent to the Fund buying and selling allof the securities in its portfolio once in the course of the period. Thehigher the Fund’s portfolio turnover rate in a period, the greater thetrading costs payable by the Fund in the period, and the greater thechance of an investor receiving taxable capital gains in the period.There is not necessarily a relationship between a high turnover rateand the performance of the Fund. The rate is calculated based on thelesser of purchases or sales of securities divided by the averageweighted market value of the portfolio securities, excluding short-termsecurities.
(7) The trading expense ratio represents commissions and other portfoliotransaction costs expressed as an annualized percentage of dailyaverage net asset value during the period.
Management FeesFor the six months ended June 30, 2015, the Fund paid usmanagement fees of $269,733. The management fee for eachseries is calculated as a percentage of the daily net asset value forthat series. The fees are reduced, where required, so that thesefees do not duplicate fees payable by mutual funds in which theFund invests for the same service.
The Fund’s management fees were used by us to pay costs formanaging the investment portfolio, providing investment analysisand recommendations, making investment decisions, makingbrokerage arrangements for the purchase and sale of theinvestment portfolio and providing other services. Themanagement fees also funded commission payments and othercompensation to sales representatives and registered dealers andbrokers (collectively “distribution costs”), including HSBC BankCanada, for units of the Fund bought and held by unitholders.Finally, we used management fees to pay for additional marketingand distribution services to the Fund.
For the six months ended June 30, 2015, approximately 45% ofthe total management fees collected from all HSBC Mutual Fundswere used to fund distribution costs. In comparison, for the Fund,such distribution costs represented 14% of the management feescollected. This may vary by series depending on the assetsinvested in each of the series.
Past PerformanceThe performance information shown assumes that all distributionsmade by the Fund in the periods shown were reinvested inadditional securities of the Fund. The performance informationdoes not take into account sales, redemption, distribution, optionalcharges or expenses you may be charged outside of the Fund orthe effect of any income tax you may have to pay as a result ofyour investment in the Fund that would have reduced returns orperformance. The Fund’s past performance does not necessarilyindicate how it will perform in the future.
4
HSBC Emerging Markets Debt Fund
Year-by-Year ReturnsThe following bar charts show the Fund’s performance for thesix-month period ended June 30, 2015, and for each of theprevious 12-month periods ended December 31. In percentageterms, the bar charts show how much an investment made on thefirst day of each financial period would have grown or decreasedby the last day of each financial period.
Returns – Investor SeriesFor the 12-month periods ended December 31 and the six-monthperiod ended June 30, 201520%
10%
-10%Dec. 31
2012Dec. 31
2013Dec. 31
2014June 30
2015
12.7%
3.2% 3.3%
-4.1%
0%
Returns – Advisor SeriesFor the 12-month periods ended December 31 and the six-monthperiod ended June 30, 201520%
10%
-10%Dec. 31
2012Dec. 31
2013Dec. 31
2014June 30
2015
12.7%
3.2%
-4.1%
0%
3.4%
Returns – Premium SeriesFor the 12-month periods ended December 31 and the six-monthperiod ended June 30, 201520%
10%
-10%Dec. 31
2012Dec. 31
2013Dec. 31
2014June 30
2015
13.2%
-3.7%
0%
3.5% 3.5%
Returns – Manager SeriesFor the 12-month periods ended December 31 and the six-monthperiod ended June 30, 201520%
10%
-10%Dec. 31
2012Dec. 31
2013Dec. 31
2014June 30
2015
14.0%
-3.5%
0%
3.8%0.9%
Returns – Institutional SeriesFor the 12-month periods ended December 31 and the six-monthperiod ended June 30, 201520%
10%
-10%Dec. 31
2012Dec. 31
2013Dec. 31
2014June 30
2015
14.7%
4.9% 4.1%
-2.5%
0%
Summary of Investment PortfolioAs at June 30, 2015
Brazil 13.73%Mexico 11.80%South Africa 8.01%Turkey 7.72%Indonesia 7.55%United States of America 7.20%Colombia 5.92%Poland 4.13%Malaysia 2.81%Venezuela 2.04%China 1.95%Russia 1.59%Thailand 1.42%Croatia 1.11%Peru 0.95%Uruguay 0.70%Panama 0.69%Serbia 0.61%Kazakhstan 0.60%Costa Rica 0.53%Philippines 0.53%Chile 0.44%Romania 0.44%El Salvador 0.28%Lithuania 0.27%Iraq 0.20%Gabonese Republic 0.19%Lebanon 0.19%Paraguay 0.16%Nigeria 0.14%Sri Lanka 0.13%Vietnam 0.08%Dominican Republic 0.07%Spain 0.06%Cash & Equivalents 15.76%Total 100.00%
Top 25 HoldingsPercentage
of NAV
Government of United States, 0.38% 03/31/16 5.60%Brazil Letras do Tesouro Nacional, 0.00% 01/01/16 3.50%South Africa Government Bond, 13.50% 09/15/16 3.13%Mexican Bonos De Desarrollo, 7.25% 12/15/16 3.00%Poland Government Bond, 4.75% 04/25/17 2.72%Turkey Government International Bond, 6.75% 04/03/18 2.48%Brazil Notas do Tesouro Nacional Serie F, 10.00% 01/01/17 2.29%Petrobras Global Finance BV, 6.25% 03/17/24 1.90%Mexico Government International Bond, 5.95% 03/19/19 1.68%Indonesia Government International Bond, 5.88% 03/13/20 1.67%Petrobras International Finance Co., 5.88% 03/01/18 1.64%Indonesia Government International Bond, 4.88% 05/05/21 1.63%Colombia Government International Bond, 7.38% 03/18/19 1.53%Republic of South Africa, 6.88% 05/27/19 1.51%Mexican Bonos, 8.00% 12/17/15 1.36%Colombia Government International Bond, 7.38% 01/27/17 1.31%Colombia Government International Bond, 4.38% 07/12/21 1.31%Mexico Government International Bond, 5.55% 01/21/45 1.16%Turkey Government Bond, 7.40% 02/05/20 1.15%Colombian TES, 10.00% 07/24/24 1.13%Republic of South Africa, 10.50% 12/21/26 1.07%Thailand Government Bond, 3.65% 12/17/21 1.02%Mexico Government International Bond, 6.05% 01/11/40 1.01%Croatia Government International Bond, 6.75% 11/05/19 0.92%Turkey Government International Bond, 6.25% 09/26/22 0.81%Total top 25 investments 46.53%
The Summary of Investment Portfolio may change due to ongoing portfolio transactions of the Fund, and is available quarterly.
6
For more information
You can find more information about HSBC Mutual Fundsin the Fund’s Simplified Prospectus, Annual InformationForm, Annual and Semi-Annual Report and Fund Facts. Youcan get a copy of these documents, as well as the Fund’sFinancial Statements, at no cost by calling 1-888-390-3333,by contacting your authorized dealer or by visiting ourwebsite at www.hsbc.ca/investment-resources.
These documents and other information about the HSBCMutual Funds, such as information circulars and materialcontracts, are also available at www.sedar.com.
Copies of the Annual Report and Semi-Annual Report,Simplified Prospectus, Annual Information Form, Annualand Interim Management Report of Fund Performanceand Fund Facts are available on our website atwww.hsbc.ca/investment-resources.
How to reach us
VancouverHSBC Global Asset Management (Canada) Limited3rd Floor, 885 West Georgia StreetVancouver, BC V6C 3E8
Tel: 1-888-390-3333Fax: 604-669-2756
TorontoSuite 300 – 70 York StreetToronto, ON M5J 1S9
MontrealSuite 300 – 2001 McGill College AvenueMontreal, QC H3A 1G1
A NOTE ON FORWARD-LOOKING STATEMENTS
This report may contain forward-looking statements about the Fund, including its strategy, expected performance and condition. Forward-lookingstatements include statements that are predictive in nature that depend upon or refer to future events or conditions, or that include words such as“expects,” “anticipates,” “intends,” “plans,” “believes,” “estimates” or negative versions thereof and similar expressions. In addition, any statement thatmay be made concerning future performance, strategies or prospects, and possible future Fund action, is also a forward-looking statement. Forward-lookingstatements are based on current expectations and projections about future events and are inherently subject to, among other things, risks, uncertaintiesand assumptions about the Fund and economic factors.
Forward-looking statements are not guarantees of future performance, and actual events and results could differ materially from those expressed or impliedin any forward-looking statements made by the Fund. Any number of important factors could contribute to these digressions, including, but not limited to,general economic, political and market factors in North America and internationally, interest and foreign exchange rates, global equity and capital markets,business competition, technological change, changes in government regulations, unexpected judicial or regulatory proceedings, and catastrophic events.
We stress that the above-mentioned list of important factors is not exhaustive. We encourage you to consider these and other factors carefully beforemaking any investment decisions and we urge you to avoid placing undue reliance on forward-looking statements. Further, you should be aware of the factthat the Fund has no specific intention of updating any forward-looking statements, whether as a result of new information, future events or otherwise.
Sources: HSBC Global Asset Management (Canada) Limited, Bloomberg, Bank of Canada.
Unauthorized reproduction, distribution, transmission or publication without our prior written consent is strictly prohibited.
Issued byHSBC Global Asset Management (Canada) Limited (2
015-
08)R
RD
HSBC Monthly Income Fund
Interim Management Report of Fund Performance
for the six months ended June 30, 2015
HSBC Monthly Income Fund
Management Discussion of Fund PerformanceIn this document, you and your refer to the unitholder of the Fund;we, us and our refer to HSBC Global Asset Management (Canada)Limited; and the Fund refers to the HSBC Monthly Income Fund.
We are the manager, trustee and primary investment advisor ofthe Fund.
IntroductionThis Interim Management Report of Fund Performance containsfinancial highlights but does not contain the complete annual or semi-annual financial statements of the investment fund. You may obtain acopy of the Fund’s annual or semi-annual financial statements at yourrequest, at no cost, by calling us toll-free at 1-888-390-3333, by visitingour website at www.hsbc.ca/investment-resources, by visiting theSEDAR website at www.sedar.com or by writing to us at:
Corporate SecretaryHSBC Global Asset Management (Canada) Limited3rd Floor, 885 West Georgia StreetVancouver, BC V6C 3E8
You may also contact us using one of these methods to request acopy of the Fund’s proxy voting policies and procedures, proxyvoting disclosure record or quarterly statement of investmentportfolio.
Results of OperationsAs of June 30, 2015, the Fund’s net assets decreased by 1% to$1,023.3 million from $1,033.4 million at the end of 2014. Of thisdecrease, a $1.7 million gain was attributable to investmentperformance and $11.8 million was attributable to net withdrawalsfrom Fund.
Investment PerformanceThe HSBC Monthly Income Fund (Investor Series) fell 0.03% forthe six months ending June 30, 2015, while its benchmark rose0.26% for the same period. The benchmark is a weightedcomposite consisting of the BMO Preferred 50 Index (10%), theS&P/TSX Composite Index (30%), the FTSE TMX CanadaMid-Term Bond Index (30%) and the FTSE TMX Canada Short-Term Bond Index (30%).
On a year-to-date basis, Canadian equity and fixed income marketshave enjoyed somewhat modest returns, while preferred shareshave come under some pressure. The S&P/TSX Composite Indexfell 1.63% on the quarter but was up 0.91% over six months.Canadian corporate bonds underperformed government bonds.These market returns resulted in a modest loss on the quarter forthe Fund. Despite a strong start to the year, global fixed incomemarkets came under pressure for most of the second quarter.Generational lows in yields, expectations for improving globalgrowth and the approaching start to the US Federal Reservetightening cycle all put upward pressure on yields.
The Fund’s overweight position in common equities was a drag onperformance in the second quarter and for the first half of the yearoverall. In addition, security selection within the equity portion ofthe portfolio has hurt relative performance. The Fund’sunderweight position in preferred shares has added valueconsistently over the first six months of the year, while itsoverweight position in residential mortgages has hurt relativeperformance.
Recent DevelopmentsAt this point, with longer-term yields expected to rise modestlyover the next year, the objective will be to maintain the Fund’sinterest rate exposure near its current level. Looking ahead, thewe continue to see better return prospects for corporate assets,both equity and debt, based on strong fundamentals andreasonable valuations. However, corporate earnings are expectedto contract modestly this year, led lower by the energy sector,before rebounding in 2016. Potential risks to our central outlookinclude disappointing global growth, further weakness incommodity prices and heightened geopolitical concerns in theeurozone. As expected, lower energy prices put short-termpressure on North American economies early in 2015. HSBCforecasts 2015 growth of 2.2% in the US, 1.4% in Canada and2.4% globally.
The Fund has a neutral position in equities relative to fixed income.Valuations in equity markets are reasonably attractive on ahistorical basis and are supported by continued strong earningsgrowth. Equity investments will focus on high-dividend-payingpreferred shares and common equities.
Related Party TransactionsWe, on behalf of the Fund, or the Fund Manager, may, from time totime, enter into transactions or arrangements with or involving othermembers of the HSBC Group or other people or companies relatedor connected to us or the Fund. To proceed with the transactions,the Fund relies on the positive recommendation of the Fund’sIndependent Review Committee. A condition of this positiverecommendation is that the transactions are performed inaccordance with our policy on Related Party Transactions. For moregeneral information on persons related to the Fund and the types ofpotential transactions, see the Fund’s Simplified Prospectus.
The following is a summary of current transactions andarrangements with entities that are related to us or the Fund.
Manager, Trustee and Investment AdvisorWe are the manager, trustee and primary investment advisor ofthe Fund. As manager, we manage the overall business andoperations of the Fund. As trustee, we hold legal title to theproperty of the Fund on your behalf. As primary investmentadvisor, we provide investment advice and portfolio management
1
HSBC Monthly Income Fund
services to the Fund. We receive a fee from the Fund for theseservices based on assets under management, calculated daily andpaid monthly.
Distribution ServicesThe Fund is distributed through us, HSBC Investment Funds(Canada) Inc. (our wholly owned subsidiary); HSBC Private WealthServices (Canada) Inc. and through HSBC Securities (Canada) Inc.(an affiliate) directly or through its division, HSBC InvestDirect. Wepay distribution and servicing fees to them based on the amountof assets held in the investor’s account, and additionally, in somecases, on the amount of the initial purchase. If you hold units ofthis Fund and/or other HSBC Mutual Funds in a registered planwith HSBC Investment Funds (Canada) Inc., they may charge youan annual fee to cover the annual administration costs of the plan.We permit HSBC Investment Funds (Canada) Inc. to collect thesefees by redeeming sufficient units of the Fund with the highestmarket value in your registered plan.
Fund on Fund InvestingDuring the period, the Fund invested in units of other HSBCMutual Funds, which are also managed by us. To proceed with thetransactions, the Fund relied on the positive recommendation ofthe Fund’s Independent Review Committee by way of StandingInstruction. A condition of this positive recommendation was thatthe transactions were performed in accordance with our policy onFund on Fund Investing.
Purchases of Securities Underwritten by a Related PartyDuring the period, the Fund invested in certain securities thatwere underwritten, in whole or in part, by entities that are arelated party to us. To proceed with the transactions, the Fundrelied on the approval of the Fund’s Independent ReviewCommittee by way of Standing Instruction. A condition of approvalwas that the transactions were performed in accordance with ourpolicy on Purchases of Securities Underwritten by a Related Party.
Financial HighlightsThe following tables show selected key financial information aboutthe Fund and are intended to help you understand the Fund’sfinancial performance for the six-month period ended June 30,2015 and for the last five years ended December 31, as applicable.In the year a fund is established, “period” represents the periodfrom inception to December 31 or June 30 of that fiscal year, asapplicable. This information is derived from the Fund’s unauditedsemi-annual financial statements and audited annual financialstatements. The information in the following tables is based onprescribed regulations, and as a result, is not expected to add dueto the increase/decrease in net assets from operations beingbased on average units outstanding during the period and all othernumbers being based on actual units outstanding at the relevantpoint in time.
HSBC Monthly Income Fund – Investor Series –Net Assets per Unit (1)
Period ended June 30, 2015 (unaudited)and years ended December 31 Inception: December 2004
June 30
2015
Dec. 31
2014
Dec. 31
2013
Dec. 31
2012
Dec. 31
2011
Dec. 31
2010
Net assets per unit, beginningof period (2) $10.20 $9.85 $9.53 $9.22 $9.70 $9.32
(1) This information is derived from the Fund’s unaudited semi-annualfinancial statements and audited annual financial statements. The netassets per unit presented in the financial statements differ from the netasset value calculated for fund pricing purposes.
(2) Net assets per unit and distributions per unit are based on the actualnumber of units outstanding for the relevant series at the relevanttime. The increase/decrease in net assets from operations per unit isbased on the weighted average number of units outstanding for therelevant series over the fiscal period.
(3) Distributions are automatically reinvested in additional units of theFund, unless the unitholder withdraws from the automaticreinvestment plan by providing written notice to us.
(4) This information is provided as at period-end.
(5) MER includes the total expenses of each Fund, including the Goodsand Services Tax and/or Harmonized Sales Tax thereon, other thanbrokerage commissions on securities transactions and any foreignwithholding taxes on income, as an annualized percentage of averagenet asset value (“NAV”) of the respective series of unit for the period.In the period a series is established, the MER is annualized from thedate of inception to the end of the period. The MER may vary fromone mutual fund to another and from one series of units to another.We may have waived or absorbed certain fees and expensesotherwise payable by the Fund. The amount of expenses absorbed orwaived is at the discretion of and can be terminated at any time by us.
The Fund may invest in units of other mutual funds and pooled funds.You should note that in addition to the fees and expenses paid by theFund, these other funds have their own operating expenses to pay.The Fund will effectively bear the operating expenses of the otherfunds in proportion to its holdings in the other funds. However, theFund will not invest in units of other funds if the Fund would berequired to pay any management fees in respect of such investments.In addition, the Fund will not make investments in other funds if theFund would be required to pay any sales or redemption fees in respectof such investments that duplicate a fee payable by unitholders of theFund. Further, the Fund will not invest in units of other funds if anysales or redemption fees are payable in respect of such investments.
(6) The Fund’s portfolio turnover rate indicates how actively the Fund’sportfolio advisor manages its portfolio investments. A portfolio turnoverrate of 100% is equivalent to the Fund buying and selling all of thesecurities in its portfolio once in the course of the period. The higher theFund’s portfolio turnover rate in a period, the greater the trading costspayable by the Fund in the period, and the greater the chance of aninvestor receiving taxable capital gains in the period. There is notnecessarily a relationship between a high turnover rate and theperformance of the Fund. The rate is calculated based on the lesser ofpurchases or sales of securities divided by the average weighted marketvalue of the portfolio securities, excluding short-term securities.
4
HSBC Monthly Income Fund
(7) The trading expense ratio represents commissions and other portfoliotransaction costs expressed as an annualized percentage of dailyaverage net asset value during the period.
Management FeesFor the six months ended June 30, 2015, the Fund paid usmanagement fees of $4,975,146. The management fee for eachseries is calculated as a percentage of the daily net asset value forthat series. The fees are reduced, where required, so that thesefees do not duplicate fees payable by mutual funds in which theFund invests for the same service.
The Fund’s management fees were used by us to pay costs formanaging the investment portfolio, providing investment analysisand recommendations, making investment decisions, makingbrokerage arrangements for the purchase and sale of theinvestment portfolio and providing other services. Themanagement fees also funded commission payments and othercompensation to sales representatives and registered dealers andbrokers (collectively “distribution costs”), including HSBC BankCanada, for units of the Fund bought and held by unitholders.Finally, we used management fees to pay for additional marketingand distribution services to the Fund.
For the six months ended June 30, 2015, approximately 45% ofthe total management fees collected from all HSBC Mutual Fundswere used to fund distribution costs. In comparison, for the Fund,such distribution costs represented 50% of the management feescollected. This may vary by series depending on the assetsinvested in each of the series.
Past PerformanceThe performance information shown assumes that all distributionsmade by the Fund in the periods shown were reinvested inadditional securities of the Fund. The performance informationdoes not take into account sales, redemption, distribution, optionalcharges or expenses you may be charged outside of the Fund orthe effect of any income tax you may have to pay as a result ofyour investment in the Fund that would have reduced returns orperformance. The Fund’s past performance does not necessarilyindicate how it will perform in the future.
Year-by-Year ReturnsThe following bar charts show the Fund’s performance for thesix-month period ended June 30, 2015, and for each of theprevious 12-month periods ended December 31. In percentageterms, the bar charts show how much an investment made on thefirst day of each financial period would have grown or decreasedby the last day of each financial period.
Returns – Investor SeriesFor the 12-month periods ended December 31 and the six-monthperiod ended June 30, 201525%
15%
10%
5%
0%
-5%
-10%
-15%
6.6% 4.3%
-1.4%
-9.8%
16.1%
7.9% 6.0% 6.0%
0.0%
5.9%
-1.6%
Dec. 312005
Dec. 312006
Dec. 312007
Dec. 312008
Dec. 312009
Dec. 312010
Dec. 312011
Dec. 312013
Dec. 312012
20%
June 302015
Dec. 312014
Returns – Advisor SeriesFor the 12-month periods ended December 31 and the six-monthperiod ended June 30, 201525%
15%
10%
5%
0%
-5%
-10%
-15%
4.3%
-1.4%
-9.6%
16.2%
8.1%
-1.5% -0.3%
Dec. 312006
Dec. 312007
Dec. 312008
Dec. 312009
Dec. 312010
Dec. 312011
Dec. 312013
Dec. 312012
20%
6.0% 6.0%5.9%
June 302015
Dec. 312014
Returns – Premium SeriesFor the 12-month periods ended December 31 and the six-monthperiod ended June 30, 201525%
15%
10%
5%
0%
-15%
16.7%
8.5%6.6% 6.6%
0.2%
6.5%
-1.0%
Dec. 312009
Dec. 312010
Dec. 312011
-10%
-5%
20%
Dec. 312013
Dec. 312012
Dec. 312014
June 302015
5
HSBC Monthly Income Fund
Returns – Manager SeriesFor the 12-month periods ended December 31 and the six-monthperiod ended June 30, 201525%
-15%
5%
0%
-10%
-5%
20%
15%
10%
Dec. 312013
Dec. 312014
6.5% 6.5%
0.0%
June 302015
Returns – Institutional SeriesFor the 12-month periods ended December 31 and the six-monthperiod ended June 30, 201525%
20%
15%
10%
5%
0%
-5%
-10%
-15%
7.3% 5.7%
-0.1%
-8.6%
17.4%
9.4%7.5% 7.4% 7.4%
0.5%
-0.2%
Dec. 312005
Dec. 312006
Dec. 312007
Dec. 312008
Dec. 312009
Dec. 312010
Dec. 312011
Dec. 312013
Dec. 312012
June 302015
Dec. 312014
Summary of Investment PortfolioAs at June 30, 2015
Asset MixPercentage
of NAV
Canadian Equities 39.38%Mutual Funds 32.94%Bonds 27.00%Cash & Equivalents 0.68%Total 100.00%
HSBC Mortgage Fund – Institutional Series 29.91%SPDR Barclays Capital High Yield Bond ETF 2.76%Toronto-Dominion Bank 2.32%Royal Bank of Canada 2.23%Bank of Nova Scotia 1.98%Government of Canada, 5.75% 06/01/33 1.81%Canadian National Railway Co. 1.44%Enbridge Inc. 1.36%Genworth MI Canada Inc., 5.68% 06/15/20 1.26%Manulife Financial Corp. 1.16%AT&T Inc., 3.83% 11/25/20 1.15%Canadian Imperial Bank of Commerce 1.11%Commonwealth Bank of Australia, 5.15% 04/09/20 1.10%Alimentation Couche-Tard Inc., Class B 1.09%Dollarama Inc. 1.08%Magna International Inc., Class A 1.05%Bank of Montreal 1.00%TELUS Corp. 0.92%Suncor Energy Inc. 0.91%Canadian Natural Resources Ltd., 2.60% 12/03/19 0.90%BCE Inc. 0.89%TransCanada Corp. 0.89%Sydney Airport Finance Co. Pty. Ltd., 4.60% 07/27/18 0.87%Cameco Corp., 5.67% 09/02/19 0.83%Canadian Tire Corp. Ltd., Class A, Non-Voting Shares 0.81%Total top 25 investments 60.83%
The Summary of Investment Portfolio may change due to ongoing portfolio transactions of the Fund, and is available quarterly.
6
For more information
You can find more information about HSBC Mutual Fundsin the Fund’s Simplified Prospectus, Annual InformationForm, Annual and Semi-Annual Report and Fund Facts. Youcan get a copy of these documents, as well as the Fund’sFinancial Statements, at no cost by calling 1-888-390-3333,by contacting your authorized dealer or by visiting ourwebsite at www.hsbc.ca/investment-resources.
These documents and other information about the HSBCMutual Funds, such as information circulars and materialcontracts, are also available at www.sedar.com.
Copies of the Annual Report and Semi-Annual Report,Simplified Prospectus, Annual Information Form, Annualand Interim Management Report of Fund Performanceand Fund Facts are available on our website atwww.hsbc.ca/investment-resources.
How to reach us
VancouverHSBC Global Asset Management (Canada) Limited3rd Floor, 885 West Georgia StreetVancouver, BC V6C 3E8
Tel: 1-888-390-3333Fax: 604-669-2756
TorontoSuite 300 – 70 York StreetToronto, ON M5J 1S9
MontrealSuite 300 – 2001 McGill College AvenueMontreal, QC H3A 1G1
A NOTE ON FORWARD-LOOKING STATEMENTS
This report may contain forward-looking statements about the Fund, including its strategy, expected performance and condition. Forward-lookingstatements include statements that are predictive in nature that depend upon or refer to future events or conditions, or that include words such as“expects,” “anticipates,” “intends,” “plans,” “believes,” “estimates” or negative versions thereof and similar expressions. In addition, any statement thatmay be made concerning future performance, strategies or prospects, and possible future Fund action, is also a forward-looking statement. Forward-lookingstatements are based on current expectations and projections about future events and are inherently subject to, among other things, risks, uncertaintiesand assumptions about the Fund and economic factors.
Forward-looking statements are not guarantees of future performance, and actual events and results could differ materially from those expressed or impliedin any forward-looking statements made by the Fund. Any number of important factors could contribute to these digressions, including, but not limited to,general economic, political and market factors in North America and internationally, interest and foreign exchange rates, global equity and capital markets,business competition, technological change, changes in government regulations, unexpected judicial or regulatory proceedings, and catastrophic events.
We stress that the above-mentioned list of important factors is not exhaustive. We encourage you to consider these and other factors carefully beforemaking any investment decisions and we urge you to avoid placing undue reliance on forward-looking statements. Further, you should be aware of the factthat the Fund has no specific intention of updating any forward-looking statements, whether as a result of new information, future events or otherwise.
Sources: HSBC Global Asset Management (Canada) Limited, Bloomberg, BMO Capital Markets, FTSE TMX Global Debt Capital Markets Inc.
FTSE TMX Global Debt Capital Markets Inc. (“FTDCM”), FTSE International Limited (“FTSE”), the London Stock Exchange Group companies (the“Exchange”) or TSX Inc. (“TSX” and together with FTDCM, FTSE and the Exchange, the “Licensor Parties”). The Licensor Parties make no warranty orrepresentation whatsoever, expressly or impliedly, either as to the results to be obtained from the use of the FTSE TMX Canada Index and/or the figure atwhich the said Index stands at any particular time on any particular day or otherwise. The Index is compiled and calculated by FTDCM and all copyright inthe Index values and constituent lists vests in FTDCM. The Licensor Parties shall not be liable (whether in negligence or otherwise) to any person for anyerror in the Index and the Licensor Parties shall not be under any obligation to advise any person of any error therein. “TMX” is a trade mark of TSX Inc. andis used under licence. “FTSE®” is a trade mark of FTSE International Limited and is used by FTDCM under licence.
Unauthorized reproduction, distribution, transmission or publication without our prior written consent is strictly prohibited.
Issued byHSBC Global Asset Management (Canada) Limited (2
015-
08)R
RD
HSBC U.S. DollarMonthly Income Fund
Interim Management Report of Fund Performance
for the six months ended June 30, 2015
HSBC U.S. Dollar Monthly Income Fund
Management Discussion of Fund PerformanceIn this document, you and your refer to the unitholder of the Fund;we, us and our refer to HSBC Global Asset Management (Canada)Limited; and the Fund refers to the HSBC U.S. Dollar MonthlyIncome Fund.
We are the manager, trustee and primary investment advisor ofthe Fund. We have hired HSBC Global Asset Management (USA)Inc. and Federated Investment Counseling Inc. as the sub-advisorsto provide portfolio management and investment advisory servicesto the Fund. For an explanation of the relationship between us andthe sub-advisors, see the section Selection of Sub-Advisors in theFund’s Simplified Prospectus.
IntroductionThis Interim Management Report of Fund Performance containsfinancial highlights but does not contain the complete annual or semi-annual financial statements of the investment fund. You may obtain acopy of the Fund’s annual or semi-annual financial statements at yourrequest, at no cost, by calling us toll-free at 1-888-390-3333, by visitingour website at www.hsbc.ca/investment-resources, by visiting theSEDAR website at www.sedar.com or by writing to us at:
Corporate SecretaryHSBC Global Asset Management (Canada) Limited3rd Floor, 885 West Georgia StreetVancouver, BC V6C 3E8
You may also contact us using one of these methods to request acopy of the Fund’s proxy voting policies and procedures, proxyvoting disclosure record or quarterly statement of investmentportfolio.
Results of OperationsAs of June 30, 2015, the Fund’s net assets increased by 2.5% to$1,074.2 million from $1,048.3 million at the end of 2014. Of thisincrease, a $4.4 million loss was attributable to investmentperformance and $30.3 million was attributable to netcontributions to the Fund.
Investment PerformanceThe HSBC U.S. Dollar Monthly Income Fund (Investor Series)dipped 0.51% for the six months ending June 30, 2015. Thebenchmark fell 0.42% for the same period. The benchmark is acomposite of the Merrill Lynch US Corporate, A Rated, 1-10 YearsIndex (in US dollars) (70%) and the Dow Jones Select DividendIndex (in US dollars) (30%).
Fund performance was driven by the overweight to BBB-ratedcredits, which underperformed A-rated issuers. In addition, yield-curve positioning negatively impacted performance, as the Fundwas underweight the three-to-seven-year segments of the curve,
which outperformed the short one-to-three-year segment and theeight-to-10-year portion of the yield curve.
Intermediate-investment-grade bonds returned 0.94% as indicatedby the Merrill Lynch 1-10 year Single A Rated US Corporate Index.More broadly, intermediate-term investment-grade corporate bondspreads widened 11 basis points in the first half of 2015. Thisspread widening occurred in longer-dated issues while shorter-dated corporate spreads were slightly tighter.
The energy sector was the only sector to provide positive returnsover the first half of 2015 as oil prices began to stabilize at lowerlevels. Lower-rated issues underperformed their higher-qualitycounterparts as risks related to Greece, China and an uncertain USFederal Reserve raised market volatility. The investment-graderated portion of the financial sector continued its strongperformance and outperformed most other sectors. The FundManager continues to see value in financials relative to non-financials and maintain an overweight to the sector. The worst-performing sector was communications. The Fund is underweightin the sector.
Recent DevelopmentsUS economic conditions gradually improved during the secondquarter after a weak first quarter. Lower energy prices and astrengthening dollar, the principal market movers the previous twoquarters, reversed course in the second quarter, alleviating fearsof a deeper global malaise. Employment conditions continued toimprove. While the industrial sector continues to struggle withlower energy prices and weak foreign demand, it appeared theworst was over until Grexit (or Greek exit) fears began toresurface.
Headwinds from a stronger dollar as well as concerns over weakergrowth in China will be some of the challenges to global growth.In addition, inflation remains low. This environment has led tomixed market views as to the timing of hikes in US interest rates.Given the recent rise in shorter-term US Treasury rates there islikely to be a cap on how much higher longer-term rates will move.In this environment, corporate debt should perform relatively welland corporate spreads should be reasonably well supported.Corporate fundamentals remain healthy.
Related Party TransactionsWe, on behalf of the Fund, or the Fund Manager, may, from time totime, enter into transactions or arrangements with or involving othermembers of the HSBC Group or other people or companies relatedor connected to us or the Fund. To proceed with the transactions,the Fund relies on the positive recommendation of the Fund’sIndependent Review Committee. A condition of this positiverecommendation is that the transactions are performed inaccordance with our policy on Related Party Transactions. For more
1
HSBC U.S. Dollar Monthly Income Fund
general information on persons related to the Fund and the types ofpotential transactions, see the Fund’s Simplified Prospectus.
The following is a summary of current transactions andarrangements with entities that are related to us or the Fund.
Manager, Trustee and Investment AdvisorWe are the manager, trustee and primary investment advisor ofthe Fund. As manager, we manage the overall business andoperations of the Fund. As trustee, we hold legal title to theproperty of the Fund on your behalf. As primary investmentadvisor, we provide investment advice and portfolio managementservices to the Fund. We receive a fee from the Fund for theseservices based on assets under management, calculated daily andpaid monthly. We have entered into a sub-advisory agreementwith HSBC Global Asset Management (USA) Inc. (an affiliate),under which HSBC Global Asset Management (USA) Inc. providesinvestment advice and portfolio management services to theFund. We pay HSBC Global Asset Management (USA) Inc. a feebased on assets under management, calculated daily and paidquarterly. For more information on our ability to hire sub-advisors,see the section Organization and Management of the HSBCMutual Funds in the Fund’s Simplified Prospectus.
Distribution ServicesThe Fund is distributed through us, HSBC Investment Funds(Canada) Inc. (our wholly owned subsidiary); HSBC Private WealthServices (Canada) Inc. and through HSBC Securities (Canada) Inc.(an affiliate) directly or through its division, HSBC InvestDirect. Wepay distribution and servicing fees to them based on the amountof assets held in the investor’s account, and additionally, in somecases, on the amount of the initial purchase. If you hold units ofthis Fund and/or other HSBC Mutual Funds in a registered planwith HSBC Investment Funds (Canada) Inc., they may charge youan annual fee to cover the annual administration costs of the plan.We permit HSBC Investment Funds (Canada) Inc. to collect thesefees by redeeming sufficient units of the Fund with the highestmarket value in your registered plan.
Purchases of Securities Underwritten by a Related PartyDuring the period, the Fund invested in certain securities thatwere underwritten, in whole or in part, by entities that are arelated party to us. To proceed with the transactions, the Fundrelied on the approval of the Fund’s Independent ReviewCommittee by way of Standing Instruction. A condition of thisapproval was that the transactions were performed in accordancewith our policy on Purchases of Securities Underwritten by aRelated Party.
Financial HighlightsThe following tables show selected key financial information aboutthe Fund and are intended to help you understand the Fund’sfinancial performance for the six-month period ended June 30,2015 and for the last five years ended December 31, as applicable.In the year a fund is established, “period” represents the periodfrom inception to December 31 or June 30 of that fiscal year, asapplicable. This information is derived from the Fund’s unauditedsemi-annual financial statements and audited annual financialstatements. The information in the following tables is based onprescribed regulations, and as a result, is not expected to add dueto the increase/decrease in net assets from operations beingbased on average units outstanding during the period and all othernumbers being based on actual units outstanding at the relevantpoint in time.
All figures are stated in US dollars.
HSBC U.S. Dollar Monthly Income Fund –Investor Series – Net Assets per Unit (1)
Period ended June 30, 2015 (unaudited)and years ended December 31 Inception: December 2010*
From income (excluding dividends) (0.18) (0.39) (0.28) – (0.28)From dividends – – – (0.33) –From capital gains – (0.26) – (0.03) (0.04)From return of capital – – (0.08) – (0.02)
Total annual distributions (2,3) $(0.18) $(0.65) $(0.36) $(0.36) $(0.34)
Net assets per unit, end of period (2) $11.38 $11.52 $11.39 $10.97 $10.43
* The Institutional Series commenced operations on February 7, 2011.
Ratios and Supplemental DataJune 30
2015
Dec. 31
2014
Dec. 31
2013
Dec. 31
2012
Dec. 31
2011
NAV (in 000s) (4) $4,210 $7,087 $5,882 $7,500 $3,875Units outstanding (in 000s) (4) 370 615 516 683 371Management expense ratio(“MER”) (5) 0.05% 0.05% 0.06% 0.07% 0.10%MER before absorbed or waivedfees (5) 0.05% 0.05% 0.06% 0.07% 0.10%Portfolio turnover rate (6) 16.21% 64.99% 58.37% 64.56% 103.95%Trading expense ratio (7) 0.02% 0.03% 0.02% 0.06% 0.11%NAV per unit (4) $11.38 $11.52 $11.40 $10.98 $10.44
(1) This information is derived from the Fund’s unaudited semi-annualfinancial statements and audited annual financial statements. The netassets per unit presented in the financial statements differ from the netasset value calculated for fund pricing purposes.
(2) Net assets per unit and distributions per unit are based on the actualnumber of units outstanding for the relevant series at the relevanttime. The increase/decrease in net assets from operations per unit isbased on the weighted average number of units outstanding for therelevant series over the fiscal period.
(3) Distributions are automatically reinvested in additional units of theFund; cash distributions are not available.
(4) This information is provided as at period-end.
(5) MER includes the total expenses of each Fund, including the Goodsand Services Tax and/or Harmonized Sales Tax thereon, other thanbrokerage commissions on securities transactions and any foreignwithholding taxes on income, as an annualized percentage of averagenet asset value (“NAV”) of the respective series of unit for the period.In the period a series is established, the MER is annualized from thedate of inception to the end of the period. The MER may vary fromone mutual fund to another and from one series of units to another.We may have waived or absorbed certain fees and expensesotherwise payable by the Fund. The amount of expenses absorbed orwaived is at the discretion of and can be terminated at any time by us.
The Fund may invest in units of other mutual funds and pooled funds.You should note that in addition to the fees and expenses paid by theFund, these other funds have their own operating expenses to pay.The Fund will effectively bear the operating expenses of the otherfunds in proportion to its holdings in the other funds. However, theFund will not invest in units of other funds if the Fund would berequired to pay any management fees in respect of such investments.In addition, the Fund will not make investments in other funds if theFund would be required to pay any sales or redemption fees in respectof such investments that duplicate a fee payable by unitholders of theFund. Further, the Fund will not invest in units of other funds if anysales or redemption fees are payable in respect of such investments.
(6) The Fund’s portfolio turnover rate indicates how actively the Fund’sportfolio advisor manages its portfolio investments. A portfolio turnoverrate of 100% is equivalent to the Fund buying and selling all of thesecurities in its portfolio once in the course of the period. The higher theFund’s portfolio turnover rate in a period, the greater the trading costspayable by the Fund in the period, and the greater the chance of aninvestor receiving taxable capital gains in the period. There is notnecessarily a relationship between a high turnover rate and theperformance of the Fund. The rate is calculated based on the lesser ofpurchases or sales of securities divided by the average weighted marketvalue of the portfolio securities, excluding short-term securities.
(7) The trading expense ratio represents commissions and other portfoliotransaction costs expressed as an annualized percentage of dailyaverage net asset value during the period.
Management FeesFor the six months ended June 30, 2015, the Fund paid usmanagement fees of $7,150,389. The management fee for eachseries is calculated as a percentage of the daily net asset value forthat series. The fees are reduced, where required, so that thesefees do not duplicate fees payable by mutual funds in which theFund invests for the same service.
The Fund’s management fees were used by us to pay costs formanaging the investment portfolio, providing investment analysisand recommendations, making investment decisions, makingbrokerage arrangements for the purchase and sale of theinvestment portfolio and providing other services. Themanagement fees also funded commission payments and othercompensation to sales representatives and registered dealers andbrokers (collectively “distribution costs”), including HSBC BankCanada, for units of the Fund bought and held by unitholders.Finally, we used management fees to pay for additional marketingand distribution services to the Fund.
For the six months ended June 30, 2015, approximately 45% ofthe total management fees collected from all HSBC Mutual Fundswere used to fund distribution costs. In comparison, for the Fund,such distribution costs represented 41% of the management feescollected. This may vary by series depending on the assetsinvested in each of the series.
4
HSBC U.S. Dollar Monthly Income Fund
Past PerformanceThe performance information shown assumes that all distributionsmade by the Fund in the periods shown were reinvested inadditional securities of the Fund. The performance informationdoes not take into account sales, redemption, distribution, optionalcharges or expenses you may be charged outside of the Fund orthe effect of any income tax you may have to pay as a result ofyour investment in the Fund that would have reduced returns orperformance. The Fund’s past performance does not necessarilyindicate how it will perform in the future.
Year-by-Year ReturnsThe following bar charts show the Fund’s performance for thesix-month period ended June 30, 2015, and for each of theprevious 12-month periods ended December 31. In percentageterms, the bar charts show how much an investment made on thefirst day of each financial period would have grown or decreasedby the last day of each financial period.
Returns – Investor SeriesFor the 12-month periods ended December 31 and the six-monthperiod ended June 30, 201515%
10%
-5%
0%
5%
2012Dec. 31
2013Dec. 31
6.8%5.4% 5.0%
-0.5%
Dec. 312014
June 302015
Returns – Advisor SeriesFor the 12-month periods ended December 31 and the six-monthperiod ended June 30, 201515%
-5%
0%
5%
10%
Dec. 312013
5.3% 5.0%
-0.7%
Dec. 312014
June 302015
Returns – Premium SeriesFor the 12-month periods ended December 31 and the six-monthperiod ended June 30, 201515%
10%
-5%
0%
5%
Dec. 312012
Dec. 312013
7.2%5.7% 5.4%
-0.4%
Dec. 312014
June 302015
Returns – Manager SeriesFor the 12-month periods ended December 31 and the six-monthperiod ended June 30, 201515%
-5%
0%
5%
10%
Dec. 312013
5.9% 5.5%
-0.8%
Dec. 312014
June 302015
Returns – Institutional SeriesFor the 12-month periods ended December 31 and the six-monthperiod ended June 30, 201515%
10%
-5%
0%
5%
Dec. 312012
Dec. 312013
8.7%7.2% 6.8%
0.3%
Dec. 312014
June 302015
5
HSBC U.S. Dollar Monthly Income Fund
Summary of Investment PortfolioAs at June 30, 2015
Kraft Foods Group Inc. 1.76%Reynolds American Inc. 1.59%AT&T Inc. 1.53%Altria Group Inc. 1.51%Verizon Communications Inc. 1.49%National Grid PLC 1.43%Philip Morris International Inc. 1.41%GlaxoSmithKline PLC 1.36%McDonald’s Corp. 1.28%The Procter & Gamble Co. 1.27%Vodafone Group PLC 1.16%Duke Energy Corp. 1.12%The Southern Co. 1.10%BP PLC 1.08%Chevron Corp. 1.08%Royal Dutch Shell PLC, Class B 1.06%Merck & Co., Ltd. 1.03%SPDR Barclays Capital High Yield Bond ETF 1.03%Unilever PLC 1.01%The Huntington National Bank, 1.70% 02/26/18 0.93%Toronto-Dominion Bank, 0.53% 01/06/17 0.93%McDonald’s Corp., 3.38% 05/26/25 0.91%Kimberly Clark Corp. 0.85%PPL Corp. 0.81%The Goldman Sachs Group Inc., 3.63% 02/07/16 0.76%Total top 25 investments 29.49%
The Summary of Investment Portfolio may change due to ongoing portfolio transactions of the Fund, and is available quarterly.
6
For more information
You can find more information about HSBC Mutual Fundsin the Fund’s Simplified Prospectus, Annual InformationForm, Annual and Semi-Annual Report and Fund Facts. Youcan get a copy of these documents, as well as the Fund’sFinancial Statements, at no cost by calling 1-888-390-3333,by contacting your authorized dealer or by visiting ourwebsite at www.hsbc.ca/investment-resources.
These documents and other information about the HSBCMutual Funds, such as information circulars and materialcontracts, are also available at www.sedar.com.
Copies of the Annual Report and Semi-Annual Report,Simplified Prospectus, Annual Information Form, Annualand Interim Management Report of Fund Performanceand Fund Facts are available on our website atwww.hsbc.ca/investment-resources.
How to reach us
VancouverHSBC Global Asset Management (Canada) Limited3rd Floor, 885 West Georgia StreetVancouver, BC V6C 3E8
Tel: 1-888-390-3333Fax: 604-669-2756
TorontoSuite 300 – 70 York StreetToronto, ON M5J 1S9
MontrealSuite 300 – 2001 McGill College AvenueMontreal, QC H3A 1G1
A NOTE ON FORWARD-LOOKING STATEMENTS
This report may contain forward-looking statements about the Fund, including its strategy, expected performance and condition. Forward-lookingstatements include statements that are predictive in nature that depend upon or refer to future events or conditions, or that include words such as“expects,” “anticipates,” “intends,” “plans,” “believes,” “estimates” or negative versions thereof and similar expressions. In addition, any statement thatmay be made concerning future performance, strategies or prospects, and possible future Fund action, is also a forward-looking statement. Forward-lookingstatements are based on current expectations and projections about future events and are inherently subject to, among other things, risks, uncertaintiesand assumptions about the Fund and economic factors.
Forward-looking statements are not guarantees of future performance, and actual events and results could differ materially from those expressed or impliedin any forward-looking statements made by the Fund. Any number of important factors could contribute to these digressions, including, but not limited to,general economic, political and market factors in North America and internationally, interest and foreign exchange rates, global equity and capital markets,business competition, technological change, changes in government regulations, unexpected judicial or regulatory proceedings, and catastrophic events.
We stress that the above-mentioned list of important factors is not exhaustive. We encourage you to consider these and other factors carefully beforemaking any investment decisions and we urge you to avoid placing undue reliance on forward-looking statements. Further, you should be aware of the factthat the Fund has no specific intention of updating any forward-looking statements, whether as a result of new information, future events or otherwise.
Sources: HSBC Global Asset Management (Canada) Limited, Bloomberg.
Unauthorized reproduction, distribution, transmission or publication without our prior written consent is strictly prohibited.
Issued byHSBC Global Asset Management (Canada) Limited (2
015-
08)R
RD
HSBC Canadian Balanced Fund
Interim Management Report of Fund Performance
for the six months ended June 30, 2015
HSBC Canadian Balanced Fund
Management Discussion of Fund PerformanceIn this document, you and your refer to the unitholder of the Fund;we, us and our refer to HSBC Global Asset Management (Canada)Limited; and the Fund refers to the HSBC Canadian BalancedFund.
We are the manager, trustee and primary investment advisor ofthe Fund.
IntroductionThis Interim Management Report of Fund Performance containsfinancial highlights but does not contain the complete annual or semi-annual financial statements of the investment fund. You may obtain acopy of the Fund’s annual or semi-annual financial statements at yourrequest, at no cost, by calling us toll-free at 1-888-390-3333, by visitingour website at www.hsbc.ca/investment-resources, by visiting theSEDAR website at www.sedar.com or by writing to us at:
Corporate SecretaryHSBC Global Asset Management (Canada) Limited3rd Floor, 885 West Georgia StreetVancouver, BC V6C 3E8
You may also contact us using one of these methods to request acopy of the Fund’s proxy voting policies and procedures, proxyvoting disclosure record or quarterly statement of investmentportfolio.
Results of OperationsAs of June 30, 2015, the Fund’s net assets increased by 3.7% to$586 million from $565.3 million at the end of 2014. Of thisincrease, a $16.1 million gain was attributable to investmentperformance and $4.6 million was attributable to net contributionsto the Fund.
Investment PerformanceThe HSBC Canadian Balanced Fund (Investor Series) rose 2.66%over the six months ending June 30, 2015, while the benchmarkrose 3.87% for the same period. The benchmark is a weightedcomposite consisting of the S&P/TSX Composite Index (35%), theFTSE TMX Canada Universe Bond Index (35%), the MSCI WorldIndex (in Canadian dollars) (25%) and the FTSE TMX Canada91-Day T-Bill Index (5%).
During the first half of 2015, the MSCI World Index (in Canadiandollars) rose 10.70%, with much of this gain attributable to theweakness of the Canadian dollar. The S&P/TSX Composite Indexwas up 0.91% during the same period. The strongest sector hasbeen healthcare (+58.33%), followed by consumer discretionary(+7.80%) and consumer staples (+3.23%). The weakest sectorswere industrials (�8.08%), energy (�5.36) and utilities (�4.50%).The Canadian bond market was strong in the first quarter as theBank of Canada surprised the market in January with a 25-basis-
point rate cut and deflation fears drove eurozone bond yields to all-time lows. However, global government bond yields moved higherin the second quarter as the risk of eurozone deflation diminished.The domestic bond market declined by 1.71% for the quarter, buton a year-to-date basis the market gained 2.37%.
The HSBC Canadian Balanced Fund achieved a positive return withcontributions from each of the major asset classes. The Fundmaintained a modest preference for equities and a morepronounced preference for corporate bonds relative to cash andgovernment bonds during the first six months of the year. Thispositioning was beneficial to performance. However, the securityselection in equities provided a return somewhat less than fromthe overall equity market.
Recent DevelopmentsIn the US, we expect a rebound of growth for the rest of 2015with 2.2% growth expected for the full year. In Canada,first-quarter growth contracted by 0.6% and again in the month ofApril by 0.1%. Business investment and trade numbers weredisappointing, while, as in the US, the consumer continues to addto growth. HSBC forecasts 2015 growth of 1.4% in Canada and2.4% globally. A softening of global economic expectationscombined with the anticipation of eventual rate hikes from the USFederal Reserve were a definite headwind for equity markets inthe first half. The major headwind for earnings growthdomestically continues to be the energy sector.
Looking ahead, we continue to see better return prospects forcorporate assets, both equity and debt, based on strongfundamentals and reasonable valuations. However, corporateearnings are expected to contract modestly this year, led lower bythe energy sector, before rebounding in 2016. The Fund istherefore somewhat less exposed to domestic equities than inrecent quarters.
Related Party TransactionsWe, on behalf of the Fund, or the Fund Manager, may, from timeto time, enter into transactions or arrangements with or involvingother members of the HSBC Group or other people or companiesrelated or connected to us or the Fund. To proceed with thetransactions, the Fund relies on the positive recommendation ofthe Fund’s Independent Review Committee. A condition of thispositive recommendation is that the transactions are performed inaccordance with our policy on Related Party Transactions. Formore general information on persons related to the Fund and thetypes of potential transactions, see the Fund’s SimplifiedProspectus.
The following is a summary of current transactions andarrangements with entities that are related to us or the Fund.
1
HSBC Canadian Balanced Fund
Manager, Trustee and Investment AdvisorWe are the manager, trustee and primary investment advisor ofthe Fund. As manager, we manage the overall business andoperations of the Fund. As trustee, we hold legal title to theproperty of the Fund on your behalf. As primary investmentadvisor, we provide investment advice and portfolio managementservices to the Fund. We receive a fee from the Fund for theseservices based on assets under management, calculated daily andpaid monthly.
Distribution ServicesThe Fund is distributed through us, HSBC Investment Funds(Canada) Inc. (our wholly owned subsidiary); HSBC Private WealthServices (Canada) Inc. and through HSBC Securities (Canada) Inc.(an affiliate) directly or through its division, HSBC InvestDirect. Wepay distribution and servicing fees to them based on the amountof assets held in the investor’s account, and additionally, in somecases, on the amount of the initial purchase. If you hold units ofthis Fund and/or other HSBC Mutual Funds in a registered planwith HSBC Investment Funds (Canada) Inc., they may charge youan annual fee to cover the annual administration costs of the plan.We permit HSBC Investment Funds (Canada) Inc. to collect thesefees by redeeming sufficient units of the Fund with the highestmarket value in your registered plan.
Fund on Fund InvestingDuring the period, the Fund invested in units of other HSBCMutual Funds, which are also managed by us. To proceed with thetransactions, the Fund relied on the positive recommendation ofthe Fund’s Independent Review Committee by way of StandingInstruction. A condition of this positive recommendation was thatthe transactions were performed in accordance with our policy onFund on Fund Investing.
Purchases of Securities Underwritten by a Related PartyDuring the period, the Fund invested in certain securities that wereunderwritten, in whole or in part, by entities that are a related partyto us. To proceed with the transactions, the Fund relied on theapproval of the Fund’s Independent Review Committee by way ofStanding Instruction. A condition of this approval was that thetransactions were performed in accordance with our policy onPurchases of Securities Underwritten by a Related Party.
Financial HighlightsThe following tables show selected key financial information aboutthe Fund and are intended to help you understand the Fund’sfinancial performance for the six-month period ended June 30, 2015and for the last five years ended December 31, as applicable. In theyear a fund is established, “period” represents the period frominception to December 31 or June 30 of that fiscal year, asapplicable. This information is derived from the Fund’s unauditedsemi-annual financial statements and audited annual financial
statements. The information in the following tables is based onprescribed regulations, and as a result, is not expected to add due tothe increase/decrease in net assets from operations being based onaverage units outstanding during the period and all other numbersbeing based on actual units outstanding at the relevant point in time.
HSBC Canadian Balanced Fund – Investor Series –Net Assets per Unit (1)
Period ended June 30, 2015 (unaudited)and years ended December 31 Inception: January 1989
June 30
2015
Dec. 31
2014
Dec. 31
2013
Dec. 31
2012
Dec. 31
2011
Dec. 31
2010
Net assets per unit,
beginning of period (2) $26.04 $23.87 $21.75 $20.62 $21.60 $20.48
From income (excludingdividends) – (0.09) – – (0.04) (0.23)From dividends (0.13) (0.34) (0.40) (0.38) (0.28) (0.17)From capital gains – – (0.35) – – –From return of capital – – – – – –
Total annual distributions (2,3) $(0.13) $(0.43) $(0.75) $(0.38) $(0.32) $(0.40)
Net assets per unit, end of
period (2) $14.81 $14.42 $13.20 $12.04 $11.41 $11.93
Ratios and Supplemental DataJune 30
2015
Dec. 31
2014
Dec. 31
2013
Dec. 31
2012
Dec. 31
2011
Dec. 31
2010
NAV (in 000s) (4) $96,424 $93,659 $82,877 $68,109 $59,105 $63,549Units outstanding (in 000s) (4) 6,511 6,497 6,273 5,650 5,175 5,321Management expense ratio(“MER”) (5) 0.06% 0.09% 0.11% 0.09% 0.09% 0.11%MER before absorbed or waivedfees (5) 0.06% 0.09% 0.11% 0.09% 0.09% 0.11%Portfolio turnover rate (6) 11.81% 19.66% 66.77% 55.41% 56.26% 74.65%Trading expense ratio (7) 0.08% 0.07% 0.10% 0.07% 0.06% 0.06%NAV per unit (4) $14.81 $14.42 $13.21 $12.05 $11.42 $11.94
(1) This information is derived from the Fund’s unaudited semi-annualfinancial statements and audited annual financial statements. The netassets per unit presented in the financial statements differ from the netasset value calculated for fund pricing purposes.
(2) Net assets per unit and distributions per unit are based on the actualnumber of units outstanding for the relevant series at the relevanttime. The increase/decrease in net assets from operations per unit isbased on the weighted average number of units outstanding for therelevant series over the fiscal period.
(3) Distributions are automatically reinvested in additional units of theFund, unless the unitholder withdraws from the automaticreinvestment plan by providing written notice to us.
(4) This information is provided as at period-end.
(5) MER includes the total expenses of each Fund, including the Goodsand Services Tax and/or Harmonized Sales Tax thereon, other thanbrokerage commissions on securities transactions and any foreignwithholding taxes on income, as an annualized percentage of averagenet asset value (“NAV”) of the respective series of unit for the period.In the period a series is established, the MER is annualized from thedate of inception to the end of the period. The MER may vary fromone mutual fund to another and from one series of units to another.
4
HSBC Canadian Balanced Fund
We may have waived or absorbed certain fees and expensesotherwise payable by the Fund. The amount of expenses absorbed orwaived is at the discretion of and can be terminated at any time by us.
(6) The Fund’s portfolio turnover rate indicates how actively the Fund’sportfolio advisor manages its portfolio investments. A portfolioturnover rate of 100% is equivalent to the Fund buying and selling allof the securities in its portfolio once in the course of the period. Thehigher the Fund’s portfolio turnover rate in a period, the greater thetrading costs payable by the Fund in the period, and the greater thechance of an investor receiving taxable capital gains in the period.There is not necessarily a relationship between a high turnover rateand the performance of the Fund. The rate is calculated based on thelesser of purchases or sales of securities divided by the averageweighted market value of the portfolio securities, excluding short-termsecurities.
(7) The trading expense ratio represents commissions and other portfoliotransaction costs expressed as an annualized percentage of dailyaverage net asset value during the period.
Management FeesFor the six months ended June 30, 2015, the Fund paid usmanagement fees of $4,106,174. The management fee for eachseries is calculated as a percentage of the daily net asset value forthat series. The fees are reduced, where required, so that thesefees do not duplicate fees payable by mutual funds in which theFund invests for the same service.
The Fund’s management fees were used by us to pay costs formanaging the investment portfolio, providing investment analysisand recommendations, making investment decisions, makingbrokerage arrangements for the purchase and sale of theinvestment portfolio and providing other services. Themanagement fees also funded commission payments and othercompensation to sales representatives and registered dealers andbrokers (collectively “distribution costs”), including HSBC BankCanada, for units of the Fund bought and held by unitholders.Finally, we used management fees to pay for additional marketingand distribution services to the Fund.
For the six months ended June 30, 2015, approximately 45% ofthe total management fees collected from all HSBC Mutual Fundswere used to fund distribution costs. In comparison, for the Fund,such distribution costs represented 48% of the management feescollected. This may vary by series depending on the assetsinvested in each of the series.
Past PerformanceThe performance information shown assumes that all distributionsmade by the Fund in the periods shown were reinvested inadditional securities of the Fund. The performance informationdoes not take into account sales, redemption, distribution, optionalcharges or expenses you may be charged outside of the Fund orthe effect of any income tax you may have to pay as a result ofyour investment in the Fund that would have reduced returns or
performance. The Fund’s past performance does not necessarilyindicate how it will perform in the future.
Year-by-Year ReturnsThe following bar charts show the Fund’s performance for thesix-month period ended June 30, 2015, and for each of theprevious 12-month periods ended December 31. In percentageterms, the bar charts show how much an investment made on thefirst day of each financial period would have grown or decreasedby the last day of each financial period.
Returns – Investor SeriesFor the 12-month periods ended December 31 and the six-monthperiod ended June 30, 2015
40%
30%
20%
10%
0%
-10%
-20%
-30%
11.9%
Dec. 312005
11.3%
Dec. 312006
1.0%
Dec. 312007
-15.5%
Dec. 312008
12.5%
Dec. 312009
7.2%
Dec. 312010
-3.6%
Dec. 312011
6.8%
Dec. 312012
13.9%
Dec. 312013
10.4%2.7%
Dec. 312014
June 302015
Returns – Advisor SeriesFor the 12-month periods ended December 31 and the six-monthperiod ended June 30, 2015
40%
30%
20%
10%
0%
-10%
-20%
-30%Dec. 31
2005
11.9%
Dec. 312006
11.2%
Dec. 312007
1.0%
Dec. 312008
-15.6%
Dec. 312010
7.2%
Dec. 312012
6.9%
Dec. 312013
14.0%
Dec. 312011
-3.6%
10.4%
2.2%
Dec. 312014
Dec. 312009*
0.0%
June 302015
* There were no unitholders from May to July 3, 2009.
Returns – Premium SeriesFor the 12-month periods ended December 31 and the six-monthperiod ended June 30, 2015
40%
30%
20%
10%
0%
-10%
-20%
-30%Dec. 31
2011
-3.1%
2012
7.4%14.5%
11.0%
2.9%
Dec. 312013
Dec. 31 Dec. 312014
June 302015
5
HSBC Canadian Balanced Fund
Returns – Manager SeriesFor the 12-month periods ended December 31 and the six-monthperiod ended June 30, 2015
40%
30%
20%
10%
0%
-10%
-30%
-40%
-20%
13.1%
2005Dec. 31
12.4%
2006Dec. 31
2.0%
2007Dec. 31
-14.6%
2008Dec. 31
13.7%
2009Dec. 31
8.4%
2010Dec. 31
-2.5%
2011Dec. 31
8.1%
2012Dec. 31
15.2%
2013Dec. 31 Dec. 31
2014
0.0% 0.0%
June 302015
Returns – Institutional SeriesFor the 12-month periods ended December 31 and the six-monthperiod ended June 30, 2015
Dec. 312014
40%
30%
20%
10%
0%
-10%
-30%
-40%
-20%
14.0% 13.3%
2.9%
-14.0%
14.6%9.3% 8.9%
16.1% 12.5%
-1.7%
2005Dec. 31
2006Dec. 31
2007Dec. 31
2008Dec. 31
2009Dec. 31
2010Dec. 31
2011Dec. 31
2012Dec. 31
2013Dec. 31
3.6%
June 302015
Summary of Investment PortfolioAs at June 30, 2015
HSBC Global Equity Fund – Institutional Series 28.31%HSBC Mortgage Fund – Institutional Series 5.69%HSBC Small Cap Growth Fund – Institutional Series 2.34%Royal Bank of Canada 2.07%Toronto-Dominion Bank 2.06%Bank of Nova Scotia 1.79%Province of Ontario Generic Coupon Strip, 0.00% 12/02/22 1.30%Canadian National Railway Co. 1.28%Suncor Energy Inc. 1.23%SPDR Barclays Capital High Yield Bond ETF 1.10%Enbridge Inc. 1.09%Province of Ontario Generic Coupon Strip, 0.00% 12/02/20 1.03%CGI Group Inc. 1.00%Canadian Natural Resources Ltd. 0.98%Dollarama Inc. 0.97%Alimentation Couche-Tard Inc., Class B 0.96%Magna International Inc., Class A 0.94%Province of Ontario, 5.60% 06/02/35 0.94%Canadian Imperial Bank of Commerce 0.90%HSBC Emerging Markets Fund – Institutional Series 0.90%Manulife Financial Corp. 0.90%Province of Ontario, 3.45% 06/02/45 0.87%Business Development Bank of Canada, 4.75% 07/26/21 0.85%Province of British Columbia, 5.70% 06/18/29 0.83%TELUS Corp. 0.83%Total top 25 investments 61.16%
6
The Summary of Investment Portfolio may change due to ongoing portfolio transactions of the Fund, and is available quarterly.
For more information
You can find more information about HSBC Mutual Fundsin the Fund’s Simplified Prospectus, Annual InformationForm, Annual and Semi-Annual Report and Fund Facts. Youcan get a copy of these documents, as well as the Fund’sFinancial Statements, at no cost by calling 1-888-390-3333,by contacting your authorized dealer or by visiting ourwebsite at www.hsbc.ca/investment-resources.
These documents and other information about the HSBCMutual Funds, such as information circulars and materialcontracts, are also available at www.sedar.com.
Copies of the Annual Report and Semi-Annual Report,Simplified Prospectus, Annual Information Form, Annualand Interim Management Report of Fund Performanceand Fund Facts are available on our website atwww.hsbc.ca/investment-resources.
How to reach us
VancouverHSBC Global Asset Management (Canada) Limited3rd Floor, 885 West Georgia StreetVancouver, BC V6C 3E8
Tel: 1-888-390-3333Fax: 604-669-2756
TorontoSuite 300 – 70 York StreetToronto, ON M5J 1S9
MontrealSuite 300 – 2001 McGill College AvenueMontreal, QC H3A 1G1
A NOTE ON FORWARD-LOOKING STATEMENTS
This report may contain forward-looking statements about the Fund, including its strategy, expected performance and condition. Forward-lookingstatements include statements that are predictive in nature that depend upon or refer to future events or conditions, or that include words such as“expects,” “anticipates,” “intends,” “plans,” “believes,” “estimates” or negative versions thereof and similar expressions. In addition, any statement thatmay be made concerning future performance, strategies or prospects, and possible future Fund action, is also a forward-looking statement. Forward-lookingstatements are based on current expectations and projections about future events and are inherently subject to, among other things, risks, uncertaintiesand assumptions about the Fund and economic factors.
Forward-looking statements are not guarantees of future performance, and actual events and results could differ materially from those expressed or impliedin any forward-looking statements made by the Fund. Any number of important factors could contribute to these digressions, including, but not limited to,general economic, political and market factors in North America and internationally, interest and foreign exchange rates, global equity and capital markets,business competition, technological change, changes in government regulations, unexpected judicial or regulatory proceedings, and catastrophic events.
We stress that the above-mentioned list of important factors is not exhaustive. We encourage you to consider these and other factors carefully beforemaking any investment decisions and we urge you to avoid placing undue reliance on forward-looking statements. Further, you should be aware of the factthat the Fund has no specific intention of updating any forward-looking statements, whether as a result of new information, future events or otherwise.
Sources: HSBC Global Asset Management (Canada) Limited, Bloomberg, MSCI, FTSE TMX Global Debt Capital Markets Inc., Bank of Canada.
Neither MSCI nor any other party involved in or related to compiling, computing or creating the MSCI data makes any express or implied warranties orrepresentations with respect to such data (or the results to be obtained by the use thereof), and all such parties hereby expressly disclaim all warranties oforiginality, accuracy, completeness, merchantability or fitness for a particular purpose with respect to any of such data. Without limiting any of theforegoing, in no event shall MSCI, any of its affiliates or any third party involved in or related to compiling, computing or creating the data have any liabilityfor any direct, indirect, special, punitive, consequential or any other damages (including lost profits) even if notified of the possibility of such damages. Nofurther distribution or dissemination of the MSCI data is permitted without MSCI’s express written consent.
FTSE TMX Global Debt Capital Markets Inc. (“FTDCM”), FTSE International Limited (“FTSE”), the London Stock Exchange Group companies (the“Exchange”) or TSX Inc. (“TSX” and together with FTDCM, FTSE and the Exchange, the “Licensor Parties”). The Licensor Parties make no warranty orrepresentation whatsoever, expressly or impliedly, either as to the results to be obtained from the use of the FTSE TMX Canada Index and/or the figure atwhich the said Index stands at any particular time on any particular day or otherwise. The Index is compiled and calculated by FTDCM and all copyright inthe Index values and constituent lists vests in FTDCM. The Licensor Parties shall not be liable (whether in negligence or otherwise) to any person for anyerror in the Index and the Licensor Parties shall not be under any obligation to advise any person of any error therein. “TMX” is a trade mark of TSX Inc. andis used under licence. “FTSE®” is a trade mark of FTSE International Limited and is used by FTDCM under licence.
Unauthorized reproduction, distribution, transmission or publication without our prior written consent is strictly prohibited.
Issued byHSBC Global Asset Management (Canada) Limited (2
015-
08)R
RD
HSBC Dividend Fund
Interim Management Report of Fund Performance
for the six months ended June 30, 2015
HSBC Dividend Fund
Management Discussion of Fund PerformanceIn this document, you and your refer to the unitholder of the Fund;we, us and our refer to HSBC Global Asset Management (Canada)Limited; and the Fund refers to the HSBC Dividend Fund.
We are the manager, trustee and primary investment advisor ofthe Fund.
IntroductionThis Interim Management Report of Fund Performance containsfinancial highlights but does not contain the complete annual or semi-annual financial statements of the investment fund. You may obtain acopy of the Fund’s annual or semi-annual financial statements at yourrequest, at no cost, by calling us toll-free at 1-888-390-3333, by visitingour website at www.hsbc.ca/investment-resources, by visiting theSEDAR website at www.sedar.com or by writing to us at:
Corporate SecretaryHSBC Global Asset Management (Canada) Limited3rd Floor, 885 West Georgia StreetVancouver, BC V6C 3E8
You may also contact us using one of these methods to request acopy of the Fund’s proxy voting policies and procedures, proxyvoting disclosure record or quarterly statement of investmentportfolio.
Results of OperationsAs of June 30, 2015, the Fund’s net assets decreased by 2.2% to$713.9 million from $730.2 million at the end of 2014. Of thisdecrease, a $8.1 million loss was attributable to investmentperformance and $8.2 million was attributable to net withdrawalsfrom Fund.
Investment PerformanceThe HSBC Dividend Fund (Investor Series) fell 1.29% for thesix months ending June 30, 2015. The benchmark S&P/TSXComposite Index rose 0.91% for the same period.
The Fund experienced negative absolute returns in the first half of2015 and lagged its benchmark, primarily due to beingunderweight the healthcare sector. The Fund had positive stockselection within the consumer discretionary, technology andutilities sectors and negative selection in the energy and materialssectors. The Fund remains well diversified across cyclical anddefensive sectors.
During the first half of the year, the MSCI World Index rose10.70% (in Canadian dollars), the MSCI Emerging Markets Indexclimbed 10.87% (in Canadian dollars) and the S&P 500 Indexgained 8.85% (in Canadian dollars). Foreign market returnsbenefited from a 7% depreciation in the Canadian dollar. Despite arebound in crude oil prices, the year-over-year decline in energy-
related earnings and weakness in many other commoditiescreated a headwind for the S&P/TSX Composite Index. Equitymarket performance by sector was mixed, with thebest-performing sectors being healthcare (+58.33%), consumerdiscretionary (+7.80%) and consumer staples (+3.23%), while theweakest were industrials (�8.08%), energy (�5.36%) and utilities(�4.50%).
S&P/TSX earnings growth is estimated to turn negative in 2015,driven by a collapse in energy sector forecasts. Excluding thisimpact, growth expectations are broadly solid across theremaining sectors. The medium-term outlook for positive earningsgrowth in the 5-10% range is supportive of equities.
Recent DevelopmentsDomestic economic growth in the first quarter was very weak,contracting in both the US and Canada. While growth remainstepid, a modest rebound is expected for the full year. Centralbanks continue deploying extraordinary measures to encourageeconomic activity, but growth differentials globally are emergingand it is anticipated that the US Federal Reserve will begin hikinginterest rates. Oil prices rebounded by 25% in the quarter and12% for the first half of the year; however, the major headwind forearnings growth domestically continues to be the weak energysector.
On balance, we expect modest positive global growth in 2015aided by continued accommodative monetary policy, less fiscalpolicy drag and slightly more positive cyclical forces. There is a riskthat growth could be slower due to government fiscal policy actionor muted willingness for consumer spending and businessinvestment, which could be potentially exacerbated by higherinterest rates. Equity markets continue to have better relativefundamentals and more attractive valuations than debt markets.
Related Party TransactionsWe, on behalf of the Fund, or the Fund Manager, may, from time totime, enter into transactions or arrangements with or involving othermembers of the HSBC Group or other people or companies relatedor connected to us or the Fund. To proceed with the transactions,the Fund relies on the positive recommendation of the Fund’sIndependent Review Committee. A condition of this positiverecommendation is that the transactions are performed inaccordance with our policy on Related Party Transactions. For moregeneral information on persons related to the Fund and the types ofpotential transactions, see the Fund’s Simplified Prospectus.
The following is a summary of current transactions andarrangements with entities that are related to us or the Fund.
1
HSBC Dividend Fund
Manager, Trustee and Investment AdvisorWe are the manager, trustee and primary investment advisor ofthe Fund. As manager, we manage the overall business andoperations of the Fund. As trustee, we hold legal title to theproperty of the Fund on your behalf. As primary investmentadvisor, we provide investment advice and portfolio managementservices to the Fund. We receive a fee from the Fund for theseservices based on assets under management, calculated daily andpaid monthly.
Distribution ServicesThe Fund is distributed through us, HSBC Investment Funds(Canada) Inc. (our wholly owned subsidiary); HSBC Private WealthServices (Canada) Inc. and through HSBC Securities (Canada) Inc.(an affiliate) directly or through its division, HSBC InvestDirect. Wepay distribution and servicing fees to them based on the amountof assets held in the investor’s account, and additionally, in somecases, on the amount of the initial purchase. If you hold units ofthis Fund and/or other HSBC Mutual Funds in a registered planwith HSBC Investment Funds (Canada) Inc., they may charge youan annual fee to cover the annual administration costs of the plan.We permit HSBC Investment Funds (Canada) Inc. to collect thesefees by redeeming sufficient units of the Fund with the highestmarket value in your registered plan.
Fund on Fund InvestingDuring the period, the Fund invested in units of other HSBCMutual Funds, which are also managed by us. To proceed with thetransactions, the Fund relied on the positive recommendation ofthe Fund’s Independent Review Committee by way of StandingInstruction. A condition of this positive recommendation was thatthe transactions were performed in accordance with our policy onFund on Fund Investing.
Purchases of Securities Underwritten by a Related PartyDuring the period, the Fund invested in certain securities thatwere underwritten, in whole or in part, by entities that are arelated party to us. To proceed with the transactions, the Fundrelied on the approval of the Fund’s Independent ReviewCommittee by way of Standing Instruction. A condition of approvalwas that the transactions were performed in accordance with ourpolicy on Purchases of Securities Underwritten by a Related Party.
Financial HighlightsThe following tables show selected key financial information aboutthe Fund and are intended to help you understand the Fund’sfinancial performance for the six-month period ended June 30,2015 and for the last five years ended December 31, as applicable.In the year a fund is established, “period” represents the periodfrom inception to December 31 or June 30 of that fiscal year, asapplicable. This information is derived from the Fund’s unauditedsemi-annual financial statements and audited annual financial
statements. The information in the following tables is based onprescribed regulations, and as a result, is not expected to add dueto the increase/decrease in net assets from operations beingbased on average units outstanding during the period and all othernumbers being based on actual units outstanding at the relevantpoint in time.
HSBC Dividend Fund – Investor Series –Net Assets per Unit (1)
Period ended June 30, 2015 (unaudited)and years ended December 31 Inception: January 1995
June 30
2015
Dec. 31
2014
Dec. 31
2013
Dec. 31
2012
Dec. 31
2011
Dec. 31
2010
Net assets per unit,
beginning of period (2) $35.86 $32.68 $28.06 $25.94 $28.09 $25.55
period (2) $14.18 $14.44 $13.15 $11.29 $10.44 $11.20
* The Institutional Series commenced operations on August 25, 2005.
Ratios and Supplemental DataJune 30
2015
Dec. 31
2014
Dec. 31
2013
Dec. 31
2012
Dec. 31
2011
Dec. 31
2010
NAV (in 000s) (4) $73,718 $61,881 $40,897 $28,395 $22,274 $18,148Units outstanding (in 000s) (4) 5,199 4,286 3,109 2,512 2,131 1,618Management expense ratio(“MER”) (5) 0.04% 0.05% 0.05% 0.07% 0.06% 0.06%MER before absorbed orwaived fees (5) 0.04% 0.05% 0.05% 0.07% 0.06% 0.06%Portfolio turnover rate (6) 2.85% 12.85% 13.77% 18.23% 12.99% 23.98%Trading expense ratio (7) 0.03% 0.03% 0.03% 0.04% 0.04% 0.06%NAV per unit (4) $14.18 $14.44 $13.16 $11.30 $10.45 $11.22
(1) This information is derived from the Fund’s unaudited semi-annualfinancial statements and audited annual financial statements. The netassets per unit presented in the financial statements differ from thenet asset value calculated for fund pricing purposes.
(2) Net assets per unit and distributions per unit are based on the actualnumber of units outstanding for the relevant series at the relevanttime. The increase/decrease in net assets from operations per unit isbased on the weighted average number of units outstanding for therelevant series over the fiscal period.
(3) Distributions are automatically reinvested in additional units of theFund, unless the unitholder withdraws from the automaticreinvestment plan by providing written notice to us.
(4) This information is provided as at period-end.
(5) MER includes the total expenses of each Fund, including the Goodsand Services Tax and/or Harmonized Sales Tax thereon, other thanbrokerage commissions on securities transactions and any foreignwithholding taxes on income, as an annualized percentage of averagenet asset value (“NAV”) of the respective series of unit for the period.
4
HSBC Dividend Fund
In the period a series is established, the MER is annualized from thedate of inception to the end of the period. The MER may vary fromone mutual fund to another and from one series of units to another.We may have waived or absorbed certain fees and expensesotherwise payable by the Fund. The amount of expenses absorbed orwaived is at the discretion of and can be terminated at any time by us.
(6) The Fund’s portfolio turnover rate indicates how actively the Fund’sportfolio advisor manages its portfolio investments. A portfolio turnoverrate of 100% is equivalent to the Fund buying and selling all of thesecurities in its portfolio once in the course of the period. The higher theFund’s portfolio turnover rate in a period, the greater the trading costspayable by the Fund in the period, and the greater the chance of aninvestor receiving taxable capital gains in the period. There is notnecessarily a relationship between a high turnover rate and theperformance of the Fund. The rate is calculated based on the lesser ofpurchases or sales of securities divided by the average weighted marketvalue of the portfolio securities, excluding short-term securities.
(7) The trading expense ratio represents commissions and other portfoliotransaction costs expressed as an annualized percentage of dailyaverage net asset value during the period.
Management FeesFor the six months ended June 30, 2015, the Fund paid usmanagement fees of $5,518,402. The management fee for eachseries is calculated as a percentage of the daily net asset valuefor that series. The fees are reduced, where required, so thatthese fees do not duplicate fees payable by mutual funds inwhich the Fund invests for the same service.
The Fund’s management fees were used by us to pay costs formanaging the investment portfolio, providing investment analysisand recommendations, making investment decisions, makingbrokerage arrangements for the purchase and sale of theinvestment portfolio and providing other services. Themanagement fees also funded commission payments and othercompensation to sales representatives and registered dealers andbrokers (collectively “distribution costs”), including HSBC BankCanada, for units of the Fund bought and held by unitholders.Finally, we used management fees to pay for additional marketingand distribution services to the Fund.
For the six months ended June 30, 2015, approximately 45% ofthe total management fees collected from all HSBC Mutual Fundswere used to fund distribution costs. In comparison, for the Fund,such distribution costs represented 51% of the management feescollected. This may vary by series depending on the assetsinvested in each of the series.
Past PerformanceThe performance information shown assumes that all distributionsmade by the Fund in the periods shown were reinvested inadditional securities of the Fund. The performance informationdoes not take into account sales, redemption, distribution, optionalcharges or expenses you may be charged outside of the Fund or
the effect of any income tax you may have to pay as a result ofyour investment in the Fund that would have reduced returns orperformance. The Fund’s past performance does not necessarilyindicate how it will perform in the future.
Year-by-Year ReturnsThe following bar charts show the Fund’s performance for thesix-month period ended June 30, 2015, and for each of theprevious 12-month periods ended December 31. In percentageterms, the bar charts show how much an investment made on thefirst day of each financial period would have grown or decreasedby the last day of each financial period.
Returns – Investor SeriesFor the 12-month periods ended December 31 and the six-monthperiod ended June 30, 2015
40%
30%
20%
10%
0%
-10%
-20%
-40%
-30%
Dec. 312005
17.2%
Dec. 312006
10.4%
Dec. 312007
1.4%
Dec. 312008
-29.9%
Dec. 312009
28.1%
Dec. 312010
10.1%
Dec. 312011
-7.5%-1.3%
8.5%
Dec. 312012
17.5%
Dec. 312013
June 302015
10.7%
Dec. 312014
Returns – Advisor SeriesFor the 12-month periods ended December 31 and the six-monthperiod ended June 30, 2015
40%
30%
20%
10%
0%
-10%
-20%
-40%
-30%
17.2%
2005Dec. 31
10.4%
2006Dec. 31
1.4%
2007Dec. 31
-29.9%
2008Dec. 31
28.1%
2009Dec. 31
10.1%
2010Dec. 31
-7.4%-1.4%
2011Dec. 31
2012Dec. 31
8.5%
2013Dec. 31
17.5%
June 302015
10.7%
Dec. 312014
5
HSBC Dividend Fund
Returns – Premium SeriesFor the 12-month periods ended December 31 and the six-monthperiod ended June 30, 2015
40%
30%
20%
10%
0%
-10%
-20%
-40%Dec. 31
2011
-30%
-6.9%-1.0%
9.1%18.2%
11.3%
Dec. 312012
Dec. 312013
Dec. 312014
June 302015
Returns – Manager SeriesFor the 12-month periods ended December 31 and the six-monthperiod ended June 30, 2015
40%
30%
20%
10%
0%
-10%
-20%
-40%
-30%
18.4%
2005Dec. 31
11.6%
2006Dec. 31
2.5%
2007Dec. 31
-29.1%
2008Dec. 31
29.4%
2009Dec. 31
11.3%
2010Dec. 31
-6.4%-0.9%
2011Dec. 31
9.7%
2012Dec. 31
18.8%
2013Dec. 31 June 30
2015
11.9%
Dec. 312014
Returns – Institutional SeriesFor the 12-month periods ended December 31 and the six-monthperiod ended June 30, 2015
40%
30%
20%
10%
0%
-10%
-20%
-40%
-30%
12.4%3.3%
-28.6%
30.4%
12.2% 10.6%19.8%
12.8%
-5.6%-0.4%
2006Dec. 31
2007Dec. 31
2008Dec. 31
2009Dec. 31
2010Dec. 31
2011Dec. 31
2012Dec. 31
2013Dec. 31 Dec. 31
2014June 30
2015
Summary of Investment PortfolioAs at June 30, 2015
Asset MixPercentage
of NAV
Canadian Equities 95.68%Mutual Funds 3.24%Cash & Equivalents 1.08%Total 100.00%
Royal Bank of Canada 6.25%Toronto-Dominion Bank 6.14%Bank of Nova Scotia 5.27%Canadian National Railway Co. 3.86%Enbridge Inc. 3.57%Suncor Energy Inc. 3.23%Manulife Financial Corp. 3.09%Alimentation Couche-Tard Inc., Class B 2.89%Dollarama Inc. 2.88%Canadian Imperial Bank of Commerce 2.84%Magna International Inc., Class A 2.82%Canadian Natural Resources Ltd. 2.78%Bank of Montreal 2.61%HSBC Mortgage Fund – Institutional Series 2.53%TELUS Corp. 2.41%BCE Inc. 2.33%TransCanada Corp. 2.31%Canadian Tire Corp. Ltd., Class A, Non-Voting Shares 2.17%Brookfield Infrastructure Partners LP 2.02%CGI Group Inc. 2.00%Intact Financial Corp. 1.88%Brookfield Asset Management Inc., Class A 1.70%Brookfield Property Partners LP 1.62%Loblaw Cos. Ltd. 1.51%Great-West Lifeco Inc. 1.47%Total top 25 investments 72.18%
The Summary of Investment Portfolio may change due to ongoing portfolio transactions of the Fund, and is available quarterly.
7
For more information
You can find more information about HSBC Mutual Fundsin the Fund’s Simplified Prospectus, Annual InformationForm, Annual and Semi-Annual Report and Fund Facts. Youcan get a copy of these documents, as well as the Fund’sFinancial Statements, at no cost by calling 1-888-390-3333,by contacting your authorized dealer or by visiting ourwebsite at www.hsbc.ca./investment-resources.
These documents and other information about the HSBCMutual Funds, such as information circulars and materialcontracts, are also available at www.sedar.com.
Copies of the Annual Report and Semi-Annual Report,Simplified Prospectus, Annual Information Form, Annualand Interim Management Report of Fund Performanceand Fund Facts are available on our website atwww.hsbc.ca/investment-resources.
How to reach us
VancouverHSBC Global Asset Management (Canada) Limited3rd Floor, 885 West Georgia StreetVancouver, BC V6C 3E8
Tel: 1-888-390-3333Fax: 604-669-2756
TorontoSuite 300 – 70 York StreetToronto, ON M5J 1S9
MontrealSuite 300 – 2001 McGill College AvenueMontreal, QC H3A 1G1
A NOTE ON FORWARD-LOOKING STATEMENTS
This report may contain forward-looking statements about the Fund, including its strategy, expected performance and condition. Forward-lookingstatements include statements that are predictive in nature that depend upon or refer to future events or conditions, or that include words such as“expects,” “anticipates,” “intends,” “plans,” “believes,” “estimates” or negative versions thereof and similar expressions. In addition, any statement thatmay be made concerning future performance, strategies or prospects, and possible future Fund action, is also a forward-looking statement. Forward-lookingstatements are based on current expectations and projections about future events and are inherently subject to, among other things, risks, uncertaintiesand assumptions about the Fund and economic factors.
Forward-looking statements are not guarantees of future performance, and actual events and results could differ materially from those expressed or impliedin any forward-looking statements made by the Fund. Any number of important factors could contribute to these digressions, including, but not limited to,general economic, political and market factors in North America and internationally, interest and foreign exchange rates, global equity and capital markets,business competition, technological change, changes in government regulations, unexpected judicial or regulatory proceedings, and catastrophic events.
We stress that the above-mentioned list of important factors is not exhaustive. We encourage you to consider these and other factors carefully beforemaking any investment decisions and we urge you to avoid placing undue reliance on forward-looking statements. Further, you should be aware of the factthat the Fund has no specific intention of updating any forward-looking statements, whether as a result of new information, future events or otherwise.
Sources: HSBC Global Asset Management (Canada) Limited, Bloomberg.
Unauthorized reproduction, distribution, transmission or publication without our prior written consent is strictly prohibited.
Issued byHSBC Global Asset Management (Canada) Limited (2
015-
08)R
RD
HSBC Equity Fund
Interim Management Report of Fund Performance
for the six months ended June 30, 2015
HSBC Equity Fund
Management Discussion of Fund PerformanceIn this document, you and your refer to the unitholder of the Fund;we, us and our refer to HSBC Global Asset Management (Canada)Limited; and the Fund refers to the HSBC Equity Fund.
We are the manager, trustee and primary investment advisor ofthe Fund.
IntroductionThis Interim Management Report of Fund Performance containsfinancial highlights but does not contain the complete annual or semi-annual financial statements of the investment fund. You may obtain acopy of the Fund’s annual or semi-annual financial statements at yourrequest, at no cost, by calling us toll-free at 1-888-390-3333, by visitingour website at www.hsbc.ca/investment-resources, by visiting theSEDAR website at www.sedar.com or by writing to us at:
Corporate SecretaryHSBC Global Asset Management (Canada) Limited3rd Floor, 885 West Georgia StreetVancouver, BC V6C 3E8
You may also contact us using one of these methods to request acopy of the Fund’s proxy voting policies and procedures, proxyvoting disclosure record or quarterly statement of investmentportfolio.
Results of OperationsAs of June 30, 2015, the Fund’s net assets increased by 2.6% to$323.6 million from $315.5 million at the end of 2014. Of thisincrease, a $5 million loss was attributable to investmentperformance and $13.1 million was attributable to netcontributions to the Fund.
Investment PerformanceThe HSBC Equity Fund (Investor Series) fell 1.64% for thesix months ending June 30, 2015. The benchmark S&P/TSXComposite Index rose 0.91% for the same period.
The Fund experienced negative absolute returns in the first half of2015 and lagged its benchmark, primarily due to beingunderweight in the healthcare sector. The Fund had positive stockselection within the consumer discretionary, technology andfinancial sectors and negative selection in the informationtechnology and materials sectors. The Fund remains welldiversified across cyclical and defensive sectors.
During the first half of the year, the MSCI World Index rose10.70% (in Canadian dollars), the MSCI Emerging Markets Indexclimbed 10.87% (in Canadian dollars) and the S&P 500 Indexgained 8.85% (in Canadian dollars). Foreign market returnsbenefited from a 7% depreciation in the Canadian dollar. Despite arebound in crude oil prices, the year-over-year decline in energy-
related earnings and weakness in many other commoditiescreated a headwind for the S&P/TSX Composite Index. Equitymarket performance by sector was mixed, with thebest-performing sectors being healthcare (+58.33%), consumerdiscretionary (+7.80%) and consumer staples (+3.23%), while theweakest were industrials (�8.08), energy (�5.36%) and utilities(�4.50%).
S&P/TSX earnings growth is estimated to turn negative in 2015,driven by a collapse in energy sector forecasts. Excluding thisimpact, growth expectations are broadly solid across theremaining sectors. The medium-term outlook for positive earningsgrowth in the 5-10% range is supportive of equities.
Recent DevelopmentsDomestic economic growth in the first quarter was very weak,contracting in both the US and Canada. While growth remainstepid, a modest rebound is expected for the full year. Centralbanks continue deploying extraordinary measures to encourageeconomic activity, but growth differentials globally are emergingand it is anticipated that the US Federal Reserve will begin hikinginterest rates. Oil prices rebounded by 25% in the quarter and12% for the first half of the year; however, the major headwind forearnings growth domestically continues to be the weak energysector.
On balance, we expect modest positive global growth in 2015aided by continued accommodative monetary policy, less fiscalpolicy drag and slightly more positive cyclical forces. There is a riskthat growth could be slower due to government fiscal policy actionor muted willingness for consumer spending and businessinvestment, which could be potentially exacerbated by higherinterest rates. Equity markets continue to have better relativefundamentals and more attractive valuations than debt markets.
Related Party TransactionsWe, on behalf of the Fund, or the Fund Manager, may, from time totime, enter into transactions or arrangements with or involving othermembers of the HSBC Group or other people or companies relatedor connected to us or the Fund. To proceed with the transactions,the Fund relies on the positive recommendation of the Fund’sIndependent Review Committee. A condition of this positiverecommendation is that the transactions are performed inaccordance with our policy on Related Party Transactions. For moregeneral information on persons related to the Fund and the types ofpotential transactions, see the Fund’s Simplified Prospectus.
The following is a summary of current transactions andarrangements with entities that are related to us or the Fund.
1
HSBC Equity Fund
Manager, Trustee and Investment AdvisorWe are the manager, trustee and primary investment advisor of theFund. As manager, we manage the overall business and operationsof the Fund. As trustee, we hold legal title to the property of theFund on your behalf. As primary investment advisor, we provideinvestment advice and portfolio management services to the Fund.We receive a fee from the Fund for these services based on assetsunder management, calculated daily and paid monthly.
Distribution ServicesThe Fund is distributed through us, HSBC Investment Funds(Canada) Inc. (our wholly owned subsidiary); HSBC Private WealthServices (Canada) Inc. and through HSBC Securities (Canada) Inc.(an affiliate) directly or through its division, HSBC InvestDirect. Wepay distribution and servicing fees to them based on the amountof assets held in the investor’s account, and additionally, in somecases, on the amount of the initial purchase. If you hold units ofthis Fund and/or other HSBC Mutual Funds in a registered planwith HSBC Investment Funds (Canada) Inc., they may charge youan annual fee to cover the annual administration costs of the plan.We permit HSBC Investment Funds (Canada) Inc. to collect thesefees by redeeming sufficient units of the Fund with the highestmarket value in your registered plan.
Financial HighlightsThe following tables show selected key financial information aboutthe Fund and are intended to help you understand the Fund’sfinancial performance for the six-month period ended June 30, 2015and for the last five years ended December 31, as applicable. In theyear a fund is established, “period” represents the period frominception to December 31 or June 30 of that fiscal year, asapplicable. This information is derived from the Fund’s unauditedsemi-annual financial statements and audited annual financialstatements. The information in the following tables is based onprescribed regulations, and as a result, is not expected to add due tothe increase/decrease in net assets from operations being based onaverage units outstanding during the period and all other numbersbeing based on actual units outstanding at the relevant point in time.
HSBC Equity Fund – Investor Series –Net Assets per Unit (1)
Period ended June 30, 2015 (unaudited)and years ended December 31 Inception: January 1989
June 30
2015
Dec. 31
2014
Dec. 31
2013
Dec. 31
2012
Dec. 31
2011
Dec. 31
2010
Net assets per unit,
beginning of period (2) $45.80 $40.79 $35.19 $32.80 $37.51 $33.68
period (2) $20.52 $20.86 $18.48 $15.92 $14.69 $16.55
* The Institutional Series commenced operations on January 5, 2004.
Ratios and Supplemental DataJune 30
2015
Dec. 31
2014
Dec. 31
2013
Dec. 31
2012
Dec. 31
2011
Dec. 31
2010
NAV (in 000s) (4) $113,819 $92,400 $67,734 $44,523 $38,977 $52,182Units outstanding (in 000s) (4) 5,546 4,429 3,665 2,793 2,650 3,148Management expense ratio(“MER”) (5) 0.05% 0.06% 0.07% 0.08% 0.08% 0.08%MER before absorbed or waivedfees (5) 0.05% 0.06% 0.07% 0.08% 0.08% 0.08%Portfolio turnover rate (6) 3.06% 13.66% 11.39% 16.29% 14.64% 21.64%Trading expense ratio (7) 0.03% 0.03% 0.02% 0.04% 0.04% 0.06%NAV per unit (4) $20.52 $20.86 $18.48 $15.94 $14.71 $16.58
(1) This information is derived from the Fund’s unaudited semi-annualfinancial statements and audited annual financial statements. The netassets per unit presented in the financial statements differ from thenet asset value calculated for fund pricing purposes.
(2) Net assets per unit and distributions per unit are based on the actualnumber of units outstanding for the relevant series at the relevanttime. The increase/decrease in net assets from operations per unit isbased on the weighted average number of units outstanding for therelevant series over the fiscal period.
(3) Distributions are automatically reinvested in additional units of theFund, unless the unitholder withdraws from the automaticreinvestment plan by providing written notice to us.
(4) This information is provided as at period-end.
(5) MER includes the total expenses of each Fund, including the Goodsand Services Tax and/or Harmonized Sales Tax thereon, other thanbrokerage commissions on securities transactions and any foreignwithholding taxes on income, as an annualized percentage of averagenet asset value (“NAV”) of the respective series of unit for the period.In the period a series is established, the MER is annualized from the
4
HSBC Equity Fund
date of inception to the end of the period. The MER may vary fromone mutual fund to another and from one series of units to another.We may have waived or absorbed certain fees and expensesotherwise payable by the Fund. The amount of expenses absorbed orwaived is at the discretion of and can be terminated at any time by us.
(6) The Fund’s portfolio turnover rate indicates how actively the Fund’sportfolio advisor manages its portfolio investments. A portfolio turnoverrate of 100% is equivalent to the Fund buying and selling all of thesecurities in its portfolio once in the course of the period. The higher theFund’s portfolio turnover rate in a period, the greater the trading costspayable by the Fund in the period, and the greater the chance of aninvestor receiving taxable capital gains in the period. There is notnecessarily a relationship between a high turnover rate and theperformance of the Fund. The rate is calculated based on the lesser ofpurchases or sales of securities divided by the average weighted marketvalue of the portfolio securities, excluding short-term securities.
(7) The trading expense ratio represents commissions and other portfoliotransaction costs expressed as an annualized percentage of dailyaverage net asset value during the period.
Management FeesFor the six months ended June 30, 2015, the Fund paid usmanagement fees of $1,866,777. The management fee for eachseries is calculated as a percentage of the daily net asset value forthat series. The fees are reduced, where required, so that thesefees do not duplicate fees payable by mutual funds in which theFund invests for the same service.
The Fund’s management fees were used by us to pay costs formanaging the investment portfolio, providing investment analysisand recommendations, making investment decisions, makingbrokerage arrangements for the purchase and sale of theinvestment portfolio and providing other services. Themanagement fees also funded commission payments and othercompensation to sales representatives and registered dealers andbrokers (collectively “distribution costs”), including HSBC BankCanada, for units of the Fund bought and held by unitholders.Finally, we used management fees to pay for additional marketingand distribution services to the Fund.
For the six months ended June 30, 2015, approximately 45% ofthe total management fees collected from all HSBC Mutual Fundswere used to fund distribution costs. In comparison, for the Fund,such distribution costs represented 51% of the management feescollected. This may vary by series depending on the assetsinvested in each of the series.
Past PerformanceThe performance information shown assumes that all distributionsmade by the Fund in the periods shown were reinvested inadditional securities of the Fund. The performance informationdoes not take into account sales, redemption, distribution, optionalcharges or expenses you may be charged outside of the Fund orthe effect of any income tax you may have to pay as a result of
your investment in the Fund that would have reduced returns orperformance. The Fund’s past performance does not necessarilyindicate how it will perform in the future.
Year-by-Year ReturnsThe following bar charts show the Fund’s performance for thesix-month period ended June 30, 2015, and for each of theprevious 12-month periods ended December 31. In percentageterms, the bar charts show how much an investment made on thefirst day of each financial period would have grown or decreasedby the last day of each financial period.
Returns – Investor SeriesFor the 12-month periods ended December 31 and the six-monthperiod ended June 30, 201550%40%
20%10%0%
-10%-20%
-50%
-30%-40%
30%
Dec. 312005
20.8%
Dec. 312006
15.1%
Dec. 312013
15.8%
Dec. 312007
5.7%
Dec. 312008
-29.8%
Dec. 312009
26.2%
Dec. 312010
11.3%
June 302015
12.4%
Dec. 312014
Dec. 312011
-11.4%-1.6%
Dec. 312012
7.3%
Returns – Advisor SeriesFor the 12-month periods ended December 31 and the six-monthperiod ended June 30, 201550%40%
20%10%0%
-10%-20%
-50%
-30%-40%
30%
Dec. 312005
20.7%
Dec. 312006
15.1%
Dec. 312007
5.7%
Dec. 312008
-29.8%
Dec. 312009
26.2%
Dec. 312010
11.3%
Dec. 312011
-11.4%-1.8%
7.3%
Dec. 312012
15.9%
Dec. 312013
June 302015
12.5%
Dec. 312014
Returns – Premium SeriesFor the 12-month periods ended December 31 and the six-monthperiod ended June 30, 201550%
20%10%0%
-10%-20%
-50%Dec. 31
2011
-30%-40%
30%40%
-10.9%-1.4%
7.9%16.5% 13.0%
Dec. 312012
Dec. 312013
Dec. 312014
June 302015
5
HSBC Equity Fund
Returns – Manager SeriesFor the 12-month periods ended December 31 and the six-monthperiod ended June 30, 201550%40%
20%10%0%
-10%-20%
-50%
-30%-40%
30%
Dec. 312005
21.8%
Dec. 312006
16.4%
Dec. 312007
6.8%
Dec. 312008
-29.1%
Dec. 312009
27.5%
Dec. 312010
12.5%
Dec. 312012
8.5%
Dec. 312013
17.2%
Dec. 312011
-10.4%-1.3%
June 302015
13.7%
Dec. 312014
Returns – Institutional SeriesFor the 12-month periods ended December 31 and the six-monthperiod ended June 30, 201550%40%
20%10%0%
-10%-20%
-50%Dec. 31
2005Dec. 31
2006Dec. 31
2007Dec. 31
2008Dec. 31
2009Dec. 31
2010Dec. 31
2011
-30%-40%
30% 23.0%17.3%
7.7%
-28.5%
28.5%
13.4% 9.4%18.1% 14.6%
-9.7%-0.7%
Dec. 312012
Dec. 312013
June 302015
Dec. 312014
Summary of Investment PortfolioAs at June 30, 2015
Royal Bank of Canada 6.51%Toronto-Dominion Bank 6.48%Bank of Nova Scotia 5.64%Canadian National Railway Co. 4.00%Suncor Energy Inc. 3.86%Enbridge Inc. 3.44%CGI Group Inc. 3.14%Canadian Natural Resources Ltd. 3.09%Dollarama Inc. 3.03%Alimentation Couche-Tard Inc., Class B 3.00%Magna International Inc., Class A 2.94%Canadian Imperial Bank of Commerce 2.83%Manulife Financial Corp. 2.82%TELUS Corp. 2.62%Canadian Tire Corp. Ltd., Class A, Non-Voting Shares 2.36%BCE Inc. 2.23%TransCanada Corp. 2.19%Bank of Montreal 2.17%Potash Corp. of Saskatchewan Inc. 2.11%Intact Financial Corp. 1.97%Open Text Corp. 1.92%Element Financial Corp. 1.84%Brookfield Asset Management Inc., Class A 1.83%West Fraser Timber Co., Ltd. 1.82%Great-West Lifeco Inc. 1.55%Total top 25 investments 75.39%
The Summary of Investment Portfolio may change due to ongoing portfolio transactions of the Fund, and is available quarterly.
6
For more information
You can find more information about HSBC Mutual Fundsin the Fund’s Simplified Prospectus, Annual InformationForm, Annual and Semi-Annual Report and Fund Facts. Youcan get a copy of these documents, as well as the Fund’sFinancial Statements, at no cost by calling 1-888-390-3333,by contacting your authorized dealer or by visiting ourwebsite at www.hsbc.ca/investment-resources.
These documents and other information about the HSBCMutual Funds, such as information circulars and materialcontracts, are also available at www.sedar.com.
Copies of the Annual Report and Semi-Annual Report,Simplified Prospectus, Annual Information Form, Annualand Interim Management Report of Fund Performanceand Fund Facts are available on our website atwww.hsbc.ca/investment-resources.
How to reach us
VancouverHSBC Global Asset Management (Canada) Limited3rd Floor, 885 West Georgia StreetVancouver, BC V6C 3E8
Tel: 1-888-390-3333Fax: 604-669-2756
TorontoSuite 300 – 70 York StreetToronto, ON M5J 1S9
MontrealSuite 300 – 2001 McGill College AvenueMontreal, QC H3A 1G1
A NOTE ON FORWARD-LOOKING STATEMENTS
This report may contain forward-looking statements about the Fund, including its strategy, expected performance and condition. Forward-lookingstatements include statements that are predictive in nature that depend upon or refer to future events or conditions, or that include words such as“expects,” “anticipates,” “intends,” “plans,” “believes,” “estimates” or negative versions thereof and similar expressions. In addition, any statement thatmay be made concerning future performance, strategies or prospects, and possible future Fund action, is also a forward-looking statement. Forward-lookingstatements are based on current expectations and projections about future events and are inherently subject to, among other things, risks, uncertaintiesand assumptions about the Fund and economic factors.
Forward-looking statements are not guarantees of future performance, and actual events and results could differ materially from those expressed or impliedin any forward-looking statements made by the Fund. Any number of important factors could contribute to these digressions, including, but not limited to,general economic, political and market factors in North America and internationally, interest and foreign exchange rates, global equity and capital markets,business competition, technological change, changes in government regulations, unexpected judicial or regulatory proceedings, and catastrophic events.
We stress that the above-mentioned list of important factors is not exhaustive. We encourage you to consider these and other factors carefully beforemaking any investment decisions and we urge you to avoid placing undue reliance on forward-looking statements. Further, you should be aware of the factthat the Fund has no specific intention of updating any forward-looking statements, whether as a result of new information, future events or otherwise.
Sources: HSBC Global Asset Management (Canada) Limited, Bloomberg.
Unauthorized reproduction, distribution, transmission or publication without our prior written consent is strictly prohibited.
Issued byHSBC Global Asset Management (Canada) Limited (2
015-
08)R
RD
HSBC Small Cap Growth Fund
Interim Management Report of Fund Performance
for the six months ended June 30, 2015
HSBC Small Cap Growth Fund
Management Discussion of Fund PerformanceIn this document, you and your refer to the unitholder of the Fund;we, us and our refer to HSBC Global Asset Management (Canada)Limited; and the Fund refers to the HSBC Small Cap Growth Fund.
We are the manager, trustee and primary investment advisor ofthe Fund. We have entered into a sub-advisory agreement withMawer Investment Management Limited and Triasima PortfolioManagement Inc. to provide portfolio management andinvestment advisory services to the Fund. For an explanation ofthe relationship between us and the sub-advisors, see the sectionSelection of Sub-Advisors in the Fund’s Simplified Prospectus.
IntroductionThis Interim Management Report of Fund Performance containsfinancial highlights but does not contain the complete annual or semi-annual financial statements of the investment fund. You may obtain acopy of the Fund’s annual or semi-annual financial statements at yourrequest, at no cost, by calling us toll-free at 1-888-390-3333, by visitingour website at www.hsbc.ca/investment-resources, by visiting theSEDAR website at www.sedar.com or by writing to us at:
Corporate SecretaryHSBC Global Asset Management (Canada) Limited3rd Floor, 885 West Georgia StreetVancouver, BC V6C 3E8
You may also contact us using one of these methods to request acopy of the Fund’s proxy voting policies and procedures, proxyvoting disclosure record or quarterly statement of investmentportfolio.
Results of OperationsAs of June 30, 2015, the Fund’s net assets decreased by 2.9% to$230.9 million from $237.9 million at the end of 2014. Of thisdecrease, a $12 million gain was attributable to investmentperformance and $19 million was attributable to net withdrawalsfrom Fund.
Investment PerformanceThe HSBC Small Cap Growth Fund (Investor Series) rose 5.29%for the six months ending June 30, 2015. The benchmark BMOBlended Small Cap Weighted Index returned 0.94%.
The relative performance of the Fund’s equity holdings versus thebenchmark can be attributed to sector allocation and securityselection. A residual (or unallocated performance contribution) mayoccur as a result of cash flow and timing issues.
Over the past six months, sector allocation detracted from theFund’s strong relative performance. This was primarily due to theFund’s underweight in the outperforming healthcare and materialssectors. The Fund Manager’s security selection was responsible
for all of the Fund’s outperformance against the benchmark.Significant value was added in the materials, consumerdiscretionary and information technology sectors. In particular, twoof the Fund’s largest positions, a pressure-treated woodmanufacturer and a packaging company, both provided double-digit returns that handily outperformed Canadian small capmaterials sector returns of 2.30%. In all, value was added viasecurity selection in six of the 10 sectors of the benchmark.
As of June 2015, relative to the benchmark, the Fund Manager’skey overweight positions are in financials, information technologyand industrials, and the key underweight positions are in materials,energy and utilities.
Recent DevelopmentsWhile the Fund Manager believes the Fund is fundamentallystrong, they are less sanguine about the return potential of thisFund over the remainder of the year. Small cap companies inCanada are operating in a slow growth economic environmentwhile trading at historically higher valuation levels. Many are beingimpacted by the decline in energy prices. As well, recent adversemacroeconomic situations, such as the Greek debt crisis and thecollapse in China’s equity market, have caused investor sentimentto tilt more towards fear than greed.
These factors will be headwinds for the small cap segment of themarket and leads the Fund Manager to believe that the returnpotential of the Fund will be more challenged. That said, the Fundcontinues to invest in companies that the Fund Manager believeswill provide superior returns over a full market cycle and the longterm.
Related Party TransactionsWe, on behalf of the Fund, or the Fund Manager, may, from timeto time, enter into transactions or arrangements with or involvingother members of the HSBC Group or other people or companiesrelated or connected to us or the Fund. To proceed with thetransactions, the Fund relies on the positive recommendation ofthe Fund’s Independent Review Committee. A condition of thispositive recommendation is that the transactions are performed inaccordance with our policy on Related Party Transactions. Formore general information on persons related to the Fund and thetypes of potential transactions, see the Fund’s SimplifiedProspectus.
The following is a summary of current transactions andarrangements with entities that are related to us or the Fund.
Manager, Trustee and Investment AdvisorWe are the manager, trustee and primary investment advisor of theFund. As manager, we manage the overall business and operationsof the Fund. As trustee, we hold legal title to the property of the
1
HSBC Small Cap Growth Fund
Fund on your behalf. As primary investment advisor, we provideinvestment advice and portfolio management services to the Fund.We receive a fee from the Fund for these services based on assetsunder management, calculated daily and paid monthly.
Distribution ServicesThe Fund is distributed through us, HSBC Investment Funds(Canada) Inc. (our wholly owned subsidiary); HSBC Private WealthServices (Canada) Inc. and through HSBC Securities (Canada) Inc.(an affiliate) directly or through its division, HSBC InvestDirect. Wepay distribution and servicing fees to them based on the amountof assets held in the investor’s account, and additionally, in somecases, on the amount of the initial purchase. If you hold units ofthis Fund and/or other HSBC Mutual Funds in a registered planwith HSBC Investment Funds (Canada) Inc., they may charge youan annual fee to cover the annual administration costs of the plan.We permit HSBC Investment Funds (Canada) Inc. to collect thesefees by redeeming sufficient units of the Fund with the highestmarket value in your registered plan.
Financial HighlightsThe following tables show selected key financial information aboutthe Fund and are intended to help you understand the Fund’sfinancial performance for the six-month period ended June 30,2015 and for the last five years ended December 31, as applicable.In the year a fund is established, “period” represents the periodfrom inception to December 31 or June 30 of that fiscal year, asapplicable. This information is derived from the Fund’s unauditedsemi-annual financial statements and audited annual financialstatements. The information in the following tables is based onprescribed regulations, and as a result, is not expected to add dueto the increase/decrease in net assets from operations beingbased on average units outstanding during the period and all othernumbers being based on actual units outstanding at the relevantpoint in time.
HSBC Small Cap Growth Fund – Investor Series –Net Assets per Unit (1)
Period ended June 30, 2015 (unaudited)and years ended December 31 Inception: January 1995
June 30
2015
Dec. 31
2014
Dec. 31
2013
Dec. 31
2012
Dec. 31
2011
Dec. 31
2010
Net assets per unit,beginning of period (2) $49.22 $46.91 $31.96 $27.69 $28.07 $22.45
(1) This information is derived from the Fund’s unaudited semi-annualfinancial statements and audited annual financial statements. The netassets per unit presented in the financial statements differ from thenet asset value calculated for fund pricing purposes.
(2) Net assets per unit and distributions per unit are based on the actualnumber of units outstanding for the relevant series at the relevanttime. The increase/decrease in net assets from operations per unit isbased on the weighted average number of units outstanding for therelevant series over the fiscal period.
(3) Distributions are automatically reinvested in additional units of theFund, unless the unitholder withdraws from the automaticreinvestment plan by providing written notice to us.
(4) This information is provided as at period-end.
(5) MER includes the total expenses of each Fund, including the Goodsand Services Tax and/or Harmonized Sales Tax thereon, other thanbrokerage commissions on securities transactions and any foreignwithholding taxes on income, as an annualized percentage of average
4
HSBC Small Cap Growth Fund
net asset value (“NAV”) of the respective series of unit for the period.In the period a series is established, the MER is annualized from thedate of inception to the end of the period. The MER may vary fromone mutual fund to another and from one series of units to another.We may have waived or absorbed certain fees and expensesotherwise payable by the Fund. The amount of expenses absorbed orwaived is at the discretion of and can be terminated at any time by us.
(6) The Fund’s portfolio turnover rate indicates how actively the Fund’sportfolio advisor manages its portfolio investments. A portfolio turnoverrate of 100% is equivalent to the Fund buying and selling all of thesecurities in its portfolio once in the course of the period. The higher theFund’s portfolio turnover rate in a period, the greater the trading costspayable by the Fund in the period, and the greater the chance of aninvestor receiving taxable capital gains in the period. There is notnecessarily a relationship between a high turnover rate and theperformance of the Fund. The rate is calculated based on the lesser ofpurchases or sales of securities divided by the average weighted marketvalue of the portfolio securities, excluding short-term securities.
(7) The trading expense ratio represents commissions and other portfoliotransaction costs expressed as an annualized percentage of dailyaverage net asset value during the period.
Management FeesFor the six months ended June 30, 2015, the Fund paid usmanagement fees of $1,831,599. The management fee for eachseries is calculated as a percentage of the daily net asset value forthat series. The fees are reduced, where required, so that thesefees do not duplicate fees payable by mutual funds in which theFund invests for the same service.
The Fund’s management fees were used by us to pay costs formanaging the investment portfolio, providing investment analysisand recommendations, making investment decisions, makingbrokerage arrangements for the purchase and sale of theinvestment portfolio and providing other services. Themanagement fees also funded commission payments and othercompensation to sales representatives and registered dealers andbrokers (collectively “distribution costs”), including HSBC BankCanada, for units of the Fund bought and held by unitholders.Finally, we used management fees to pay for additional marketingand distribution services to the Fund.
For the six months ended June 30, 2015, approximately 45% ofthe total management fees collected from all HSBC Mutual Fundswere used to fund distribution costs. In comparison, for the Fund,such distribution costs represented 39% of the management feescollected. This may vary by series depending on the assetsinvested in each of the series.
Past PerformanceThe performance information shown assumes that all distributionsmade by the Fund in the periods shown were reinvested inadditional securities of the Fund. The performance informationdoes not take into account sales, redemption, distribution, optionalcharges or expenses you may be charged outside of the Fund orthe effect of any income tax you may have to pay as a result ofyour investment in the Fund that would have reduced returns orperformance. The Fund’s past performance does not necessarilyindicate how it will perform in the future.
Year-by-Year ReturnsThe following bar charts show the Fund’s performance for thesix-month period ended June 30, 2015, and for each of theprevious 12-month periods ended December 31. In percentageterms, the bar charts show how much an investment made on thefirst day of each financial period would have grown or decreasedby the last day of each financial period.
Returns – Investor SeriesFor the 12-month periods ended December 31 and the six-monthperiod ended June 30, 201580%
60%
40%
20%
0%
-20%
-40%
-60%
27.5%
Dec. 312005
6.5%
Dec. 312006
-1.1%
Dec. 312007
-38.7%
Dec. 312008
50.7%
Dec. 312009
24.7%
Dec. 312010
15.4%
Dec. 312012
45.9%
Dec. 312013
-0.8%
Dec. 312011
June 302015
4.9% 5.3%
Dec. 312014
Returns – Advisor SeriesFor the 12-month periods ended December 31 and the six-monthperiod ended June 30, 201580%
60%
40%
20%
0%
-20%
-40%
-60%
6.5%
-1.0%
-38.0%
50.7%
24.6%15.3%
-0.8%
Dec. 312006
Dec. 312007
Dec. 312008
Dec. 312009
Dec. 312010
Dec. 312011
Dec. 312012
Dec. 312013
45.9%
4.9% 5.1%
June 302015
Dec. 312014
5
HSBC Small Cap Growth Fund
Returns – Premium SeriesFor the 12-month periods ended December 31 and the six-monthperiod ended June 30, 201580%
0%
-20%
-60%
-0.2%
16.0%
46.7%
5.5% 5.6%
Dec. 312011
Dec. 312012
Dec. 312013
60%
40%
20%
-40%
Dec. 312014
June 302015
Returns – Manager SeriesFor the 12-month periods ended December 31 and the six-monthperiod ended June 30, 201580%
20%
-60%
26.0%
0.3%
Dec. 312010
Dec. 312011
16.6%
47.6%
6.1% 5.8%
Dec. 312012
Dec. 312013
0%
60%
40%
-40%
-20%
June 302015
Dec. 312014
Returns – Institutional SeriesFor the 12-month periods ended December 31 and the six-monthperiod ended June 30, 201580%
60%
40%
20%
0%
-20%
-40%
-60%
8.8%1.0%
-37.4%
53.8% 49.1%
7.2% 6.4%
27.4%17.9%
1.4%
Dec. 312006
Dec. 312007
Dec. 312008
Dec. 312009
Dec. 312010
Dec. 312011 2013
Dec. 31Dec. 312012
Dec. 312014
June 302015
Summary of Investment PortfolioAs at June 30, 2015
Winpak Ltd. 4.18%Stella-Jones Inc. 4.11%Stantec Inc. 3.85%Home Capital Group Inc. 3.51%Canadian Energy Services & Technology Corp. 3.10%Equitable Group Inc. 2.83%The Descartes Systems Group Inc. 2.78%Constellation Software Inc. 2.77%New Flyer Industries Inc. 2.74%Morneau Shepell Inc. 2.65%Richelieu Hardware Ltd. 2.43%Altus Group Ltd. 2.02%Enghouse Systems Ltd. 1.93%Canadian Western Bank 1.87%Parkland Fuel Corp. 1.84%Raging River Exploration Inc. 1.76%AltaGas Ltd. 1.73%Colliers International Group Inc. 1.72%Newalta Corp. 1.69%ShawCor Ltd. 1.62%Intertape Polymer Group Inc. 1.60%Boyd Group Income Fund 1.53%Element Financial Corp. 1.52%AirBoss of America Corp. 1.50%Alaris Royalty Corp. 1.47%Total top 25 investments 58.75%
The Summary of Investment Portfolio may change due to ongoing portfolio transactions of the Fund, and is available quarterly.
6
For more information
You can find more information about HSBC Mutual Fundsin the Fund’s Simplified Prospectus, Annual InformationForm, Annual and Semi-Annual Report and Fund Facts. Youcan get a copy of these documents, as well as the Fund’sFinancial Statements, at no cost by calling 1-888-390-3333,by contacting your authorized dealer or by visiting ourwebsite at www.hsbc.ca/investment-resources.
These documents and other information about the HSBCMutual Funds, such as information circulars and materialcontracts, are also available at www.sedar.com.
Copies of the Annual Report and Semi-Annual Report,Simplified Prospectus, Annual Information Form, Annualand Interim Management Report of Fund Performanceand Fund Facts are available on our website atwww.hsbc.ca/investment-resources.
How to reach us
VancouverHSBC Global Asset Management (Canada) Limited3rd Floor, 885 West Georgia StreetVancouver, BC V6C 3E8
Tel: 1-888-390-3333Fax: 604-669-2756
TorontoSuite 300 – 70 York StreetToronto, ON M5J 1S9
MontrealSuite 300 – 2001 McGill College AvenueMontreal, QC H3A 1G1
A NOTE ON FORWARD-LOOKING STATEMENTS
This report may contain forward-looking statements about the Fund, including its strategy, expected performance and condition. Forward-lookingstatements include statements that are predictive in nature that depend upon or refer to future events or conditions, or that include words such as“expects,” “anticipates,” “intends,” “plans,” “believes,” “estimates” or negative versions thereof and similar expressions. In addition, any statement thatmay be made concerning future performance, strategies or prospects, and possible future Fund action, is also a forward-looking statement. Forward-lookingstatements are based on current expectations and projections about future events and are inherently subject to, among other things, risks, uncertaintiesand assumptions about the Fund and economic factors.
Forward-looking statements are not guarantees of future performance, and actual events and results could differ materially from those expressed or impliedin any forward-looking statements made by the Fund. Any number of important factors could contribute to these digressions, including, but not limited to,general economic, political and market factors in North America and internationally, interest and foreign exchange rates, global equity and capital markets,business competition, technological change, changes in government regulations, unexpected judicial or regulatory proceedings, and catastrophic events.
We stress that the above-mentioned list of important factors is not exhaustive. We encourage you to consider these and other factors carefully beforemaking any investment decisions and we urge you to avoid placing undue reliance on forward-looking statements. Further, you should be aware of the factthat the Fund has no specific intention of updating any forward-looking statements, whether as a result of new information, future events or otherwise.
Sources: HSBC Global Asset Management (Canada) Limited, BMO Capital Markets.
Unauthorized reproduction, distribution, transmission or publication without our prior written consent is strictly prohibited.
Issued byHSBC Global Asset Management (Canada) Limited (2
015-
08)R
RD
HSBC Global Equity Fund
Interim Management Report of Fund Performance
for the six months ended June 30, 2015
HSBC Global Equity Fund
Management Discussion of Fund PerformanceIn this document, you and your refer to the unitholder of the Fund;we, us and our refer to HSBC Global Asset Management (Canada)Limited; and the Fund refers to the HSBC Global Equity Fund.
We are the manager, trustee and primary investment advisor of theFund. We have entered into a sub-advisory agreement with HSBCGlobal Asset Management (UK) Limited, under which HSBC GlobalAsset Management (UK) Limited provides investment advice andportfolio management services to the Fund. For an explanation of therelationship between us and the sub-advisor, see thesection Selection of Sub-Advisors in the Fund’s Simplified Prospectus.
IntroductionThis Interim Management Report of Fund Performance containsfinancial highlights but does not contain the complete annual or semi-annual financial statements of the investment fund. You may obtain acopy of the Fund’s annual or semi-annual financial statements at yourrequest, at no cost, by calling us toll-free at 1-888-390-3333, by visitingour website at www.hsbc.ca/investment-resources, by visiting theSEDAR website at www.sedar.com or by writing to us at:
Corporate SecretaryHSBC Global Asset Management (Canada) Limited3rd Floor, 885 West Georgia StreetVancouver, BC V6C 3E8
You may also contact us using one of these methods to request acopy of the Fund’s proxy voting policies and procedures, proxy votingdisclosure record or quarterly statement of investment portfolio.
Results of OperationsAs of June 30, 2015, the Fund’s net assets increased by 23.3% to$352.9 million from $286.2 million at the end of 2014. Of thisincrease, a $28.3 million gain was attributable to investmentperformance and $38.4 million was attributable to netcontributions to the Fund.
Investment PerformanceThe HSBC Global Equity Fund (Investor Series) rose 9.05% for thesix months ending June 30, 2015, while its benchmark, the MSCIWorld Index (in Canadian dollars), rose 10.70% for the sameperiod.
At a country level, top absolute contributing countries were Japan,France and Switzerland. The Fund’s underweight exposure toGermany contributed negatively. At a sector level, top contributorsto overall Fund performance were consumer discretionary,industrials and financials.
Top absolute contributing stocks to the Fund’s overallperformance were a Japanese phone company and electronicsmanufacturer and an American multinational conglomerate.
Purchases during the year included a Hong Kong property-holdingcompany, a Canadian mobile network provider and an internationalcontractor active in telecommunications, engineering andinfrastructure. During the period, sales included a Hong Konginvestment-holding company, an American supplier of automotiveequipment and a Canadian energy company.
Recent DevelopmentsGlobal equities have continued to advance in 2015, supported byultra-loose monetary policy, and despite notable periods ofvolatility, particularly earlier in the year when geopolitical tensionsin Eastern Europe resurfaced.
Stronger-than-expected economic data from European countries,such as France and Spain, helped lift equities in the region. Inemerging markets, drivers of equity performance includedencouraging economic figures generated by reform initiatives andlower input costs for businesses. In the US, while datadisappointed, further accommodative monetary policy supportedequities.
The Fund Manager continues to believe that the global economicrecovery is on track and global equity markets will post positivereturns over the long term. Continued support from quantitativemonetary policy will also likely outweigh headwinds created byconcerns over developments in Greece, slower growth in Chinaand tighter US monetary policy. The Fund Manager is particularlypositive for Asia ex-Japan equities. Developed market equityvaluations remain attractive relative to government bonds.
Effective February 25, 2015, HSBC Global Asset Management(UK) Limited replaced HSBC Global Asset Management (France)as sub-advisor to the Fund. Also effective February 25, 2015, theFund shifted its investment strategy to a rules-based strategy thatinvests primarily in securities included in the HSBC EconomicScale Index – World, a fundamentally weighted index that coversdeveloped market companies where securities are weightedaccording to their economic scale or “footprint” using the notionof “Value Added” rather than their market capitalization.
Related Party TransactionsWe, on behalf of the Fund, or the Fund Manager, may, from time totime, enter into transactions or arrangements with or involving othermembers of the HSBC Group or other people or companies relatedor connected to us or the Fund. To proceed with the transactions,the Fund relies on the positive recommendation of the Fund’sIndependent Review Committee. A condition of this positiverecommendation is that the transactions are performed inaccordance with our policy on Related Party Transactions. For moregeneral information on persons related to the Fund and the types ofpotential transactions, see the Fund’s Simplified Prospectus.
1
HSBC Global Equity Fund
The following is a summary of current transactions andarrangements with entities that are related to us or the Fund.
Manager, Trustee and Investment AdvisorWe are the manager, trustee and primary investment advisor of theFund. As manager, we manage the overall business and operationsof the Fund. As trustee, we hold legal title to the property of theFund on your behalf. As primary investment advisor, we provideinvestment advice and portfolio management services to the Fund.We receive a fee from the Fund for these services based on assetsunder management, calculated daily and paid monthly. We haveentered into a sub-advisory agreement with HSBC Global AssetManagement (UK) Limited (an affiliate), under which HSBC GlobalAsset Management (UK) Limited provides investment advice andportfolio management services to the Fund. We pay HSBC GlobalAsset Management (UK) Limited a fee from the Fund based onassets under management, calculated daily and paid quarterly. Formore information on our ability to hire sub-advisors, see the sectionOrganization and Management of the HSBC Mutual Funds in theFund’s Simplified Prospectus.
Distribution ServicesThe Fund is distributed through us, HSBC Investment Funds(Canada) Inc. (our wholly owned subsidiary); HSBC Private WealthServices (Canada) Inc. and through HSBC Securities (Canada) Inc.(an affiliate) directly or through its division, HSBC InvestDirect. Wepay distribution and servicing fees to them based on the amountof assets held in the investor’s account, and additionally, in somecases, on the amount of the initial purchase. If you hold units ofthis Fund and/or other HSBC Mutual Funds in a registered planwith HSBC Investment Funds (Canada) Inc., they may charge youan annual fee to cover the annual administration costs of the plan.We permit HSBC Investment Funds (Canada) Inc. to collect thesefees by redeeming sufficient units of the Fund with the highestmarket value in your registered plan.
Investments in Securities of Related PartiesIn accordance with Canadian securities legislation and policies setout by our Independent Review Committee, the Fund may investits assets in the securities of companies related to the Fund’sinvestment advisor or sub-advisor. During the period, the Fundheld, purchased or sold shares in HSBC Holdings PLC (ourultimate parent company), Hang Seng Bank and Deutsche BoerseAG, which represented 0.37%, 0.04% and 0.02% of the Fund’sassets, respectively, as at June 30, 2015.
Financial HighlightsThe following tables show selected key financial information aboutthe Fund and are intended to help you understand the Fund’sfinancial performance for the six-month period ended June 30, 2015and for the last five years ended December 31, as applicable. In the
year a fund is established, “period” represents the period frominception to December 31 or June 30 of that fiscal year, asapplicable. This information is derived from the Fund’s unauditedsemi-annual financial statements and audited annual financialstatements. The information in the following tables is based onprescribed regulations, and as a result, is not expected to add due tothe increase/decrease in net assets from operations being based onaverage units outstanding during the period and all other numbersbeing based on actual units outstanding at the relevant point in time.
HSBC Global Equity Fund – Investor Series –Net Assets per Unit (1)
Period ended June 30, 2015 (unaudited)and years ended December 31 Inception: January 1998
June 30
2015
Dec. 31
2014
Dec. 31
2013
Dec. 31
2012
Dec. 31
2011
Dec. 31
2010
Net assets per unit,
beginning of period (2) $12.58 $11.13 $8.52 $7.79 $8.34 $8.29
(1) This information is derived from the Fund’s unaudited semi-annualfinancial statements and audited annual financial statements. The netassets per unit presented in the financial statements differ from thenet asset value calculated for fund pricing purposes.
(2) Net assets per unit and distributions per unit are based on the actualnumber of units outstanding for the relevant series at the relevanttime. The increase/decrease in net assets from operations per unit isbased on the weighted average number of units outstanding for therelevant series over the fiscal period.
(3) Distributions are automatically reinvested in additional units of theFund, unless the unitholder withdraws from the automaticreinvestment plan by providing written notice to us.
(4) This information is provided as at period-end.
(5) MER includes the total expenses of each Fund, including the Goodsand Services Tax and/or Harmonized Sales Tax thereon, other thanbrokerage commissions on securities transactions and any foreignwithholding taxes on income, as an annualized percentage of averagenet asset value (“NAV”) of the respective series of unit for the period.In the period a series is established, the MER is annualized from thedate of inception to the end of the period. The MER may vary from
4
HSBC Global Equity Fund
one mutual fund to another and from one series of units to another.We may have waived or absorbed certain fees and expensesotherwise payable by the Fund. The amount of expenses absorbed orwaived is at the discretion of and can be terminated at any time by us.
(6) The Fund’s portfolio turnover rate indicates how actively the Fund’sportfolio advisor manages its portfolio investments. A portfolio turnoverrate of 100% is equivalent to the Fund buying and selling all of thesecurities in its portfolio once in the course of the period. The higher theFund’s portfolio turnover rate in a period, the greater the trading costspayable by the Fund in the period, and the greater the chance of aninvestor receiving taxable capital gains in the period. There is notnecessarily a relationship between a high turnover rate and theperformance of the Fund. The rate is calculated based on the lesser ofpurchases or sales of securities divided by the average weighted marketvalue of the portfolio securities, excluding short-term securities.
(7) The trading expense ratio represents commissions and other portfoliotransaction costs expressed as an annualized percentage of dailyaverage net asset value during the period.
Management FeesFor the six months ended June 30, 2015, the Fund paid usmanagement fees of $297,059. The management fee for eachseries is calculated as a percentage of the daily net asset value forthat series. The fees are reduced, where required, so that thesefees do not duplicate fees payable by mutual funds in which theFund invests for the same service.
The Fund’s management fees were used by us to pay costs formanaging the investment portfolio, providing investment analysisand recommendations, making investment decisions, makingbrokerage arrangements for the purchase and sale of theinvestment portfolio and providing other services. Themanagement fees also funded commission payments and othercompensation to sales representatives and registered dealers andbrokers (collectively “distribution costs”), including HSBC BankCanada, for units of the Fund bought and held by unitholders.Finally, we used management fees to pay for additional marketingand distribution services to the Fund.
For the six months ended June 30, 2015, approximately 45% ofthe total management fees collected from all HSBC Mutual Fundswere used to fund distribution costs. In comparison, for the Fund,such distribution costs represented 35% of the management feescollected. This may vary by series depending on the assetsinvested in each of the series.
Past PerformanceThe performance information shown assumes that all distributionsmade by the Fund in the periods shown were reinvested inadditional securities of the Fund. The performance informationdoes not take into account sales, redemption, distribution, optionalcharges or expenses you may be charged outside of the Fund orthe effect of any income tax you may have to pay as a result ofyour investment in the Fund that would have reduced returns or
performance. The Fund’s past performance does not necessarilyindicate how it will perform in the future.
Year-by-Year ReturnsThe following bar charts show the Fund’s performance for thesix-month period ended June 30, 2015, and for each of theprevious 12-month periods ended December 31. In percentageterms, the bar charts show how much an investment made on thefirst day of each financial period would have grown or decreasedby the last day of each financial period.
Returns – Investor SeriesFor the 12-month periods ended December 31 and the six-monthperiod ended June 30, 201560%
40%
20%
0%
-20%
-40%
8.9%
Dec. 312005
17.5%
Dec. 312006
-6.2%
Dec. 312007
-28.7%Dec. 31
2008
6.7%
Dec. 312009
0.5%
Dec. 312010
-6.6%
Dec. 312011
31.6%
Dec. 312013
9.8%
Dec. 312012
June 302015
14.1%9.1%
Dec. 312014
Returns – Advisor SeriesFor the 12-month periods ended December 31 and the six-monthperiod ended June 30, 201560%
40%
20%
0%
-20%
-40%
-6.2%
-28.6%
6.7% 9.9%
31.6%
14.1%8.2%
0.6%
-6.5%
Dec. 312007
Dec. 312008
Dec. 312009
Dec. 312010
Dec. 312011
Dec. 312012
Dec. 312013
Dec. 312014
June 302015
Returns – Premium SeriesFor the 12-month periods ended December 31 and the six-monthperiod ended June 30, 201560%
20%
0%
-20%
-40%
-6.1%
10.4%
32.3%
14.7%9.2%
Dec. 312011
Dec. 312012
Dec. 312013
40%
Dec. 312014
June 302015
5
HSBC Global Equity Fund
Returns – Manager SeriesFor the 12-month periods ended December 31 and the six-monthperiod ended June 30, 201560%
40%
20%
0%
-20%
-40%
18.7%
-5.2%
-27.9%
7.8% 11.1%
33.1%
15.4%9.0%
1.7%
-5.5%
Dec. 312006
Dec. 312007
Dec. 312008
Dec. 312009
Dec. 312010
Dec. 312011
Dec. 312012
Dec. 312013
Dec. 312014
June 302015
Returns – Institutional SeriesFor the 12-month periods ended December 31 and the six-monthperiod ended June 30, 201560%
40%
20%
0%
-20%
-40%
11.5% 12.6%
34.9%
16.9%10.0%
20.3%
-3.9%
-27.0%
9.2%3.0%
-4.2%
Dec. 312005
Dec. 312006
Dec. 312007
Dec. 312008
Dec. 312009
Dec. 312010
Dec. 312011
Dec. 312012
Dec. 312013
June 302015
Dec. 312014
Summary of Investment PortfolioAs at June 30, 2015
United States of America 43.00%Japan 12.84%United Kingdom 7.72%France 6.65%Germany 6.15%Canada 2.42%Switzerland 2.24%Spain 2.12%Italy 1.99%Australia 1.92%Netherlands 1.84%Ireland 1.21%Sweden 0.95%Hong Kong 0.82%Singapore 0.71%Denmark 0.53%Norway 0.51%Belgium 0.48%Finland 0.35%Luxembourg 0.21%Austria 0.13%China 0.11%Israel 0.10%New Zealand 0.05%Portugal 0.05%Taiwan 0.05%Mutual Funds 4.00%Cash & Equivalents 0.85%Total 100.00%
6
HSBC Global Equity Fund
Top 25 HoldingsPercentage
of NAV
iShares Core S&P 500 ETF 2.39%Wal-Mart Stores Inc. 1.80%iShares MSCI EAFE ETF 1.60%Exxon Mobil Corp. 1.08%General Electric Co. 1.05%AT&T Inc. 0.86%Royal Dutch Shell PLC 0.75%Volkswagen AG 0.68%JPMorgan Chase & Co. 0.66%Nippon Telegraph & Telephone Corp. 0.64%Chevron Corp. 0.61%Siemens AG 0.58%Wells Fargo & Co. 0.57%Bank of America Corp. 0.54%United Parcel Service Inc., Class B 0.53%ENI SpA 0.50%International Business Machines Corp. 0.49%Toyota Motor Corp. 0.49%Deutsche Telekom AG 0.48%Hewlett-Packard Co. 0.48%Verizon Communications Inc. 0.48%Apple Inc. 0.46%Pfizer Inc. 0.46%Telefonica SA 0.46%Total SA 0.45%Total top 25 investments 19.09%
The Summary of Investment Portfolio may change due to ongoing portfolio transactions of the Fund, and is available quarterly.
7
For more information
You can find more information about HSBC Mutual Fundsin the Fund’s Simplified Prospectus, Annual InformationForm, Annual and Semi-Annual Report and Fund Facts. Youcan get a copy of these documents, as well as the Fund’sFinancial Statements, at no cost by calling 1-888-390-3333,by contacting your authorized dealer or by visiting ourwebsite at www.hsbc.ca/investment-resources.
These documents and other information about the HSBCMutual Funds, such as information circulars and materialcontracts, are also available at www.sedar.com.
Copies of the Annual Report and Semi-Annual Report,Simplified Prospectus, Annual Information Form, Annualand Interim Management Report of Fund Performanceand Fund Facts are available on our website atwww.hsbc.ca/investment-resources.
How to reach us
VancouverHSBC Global Asset Management (Canada) Limited3rd Floor, 885 West Georgia StreetVancouver, BC V6C 3E8
Tel: 1-888-390-3333Fax: 604-669-2756
TorontoSuite 300 – 70 York StreetToronto, ON M5J 1S9
MontrealSuite 300 – 2001 McGill College AvenueMontreal, QC H3A 1G1
A NOTE ON FORWARD-LOOKING STATEMENTS
This report may contain forward-looking statements about the Fund, including its strategy, expected performance and condition. Forward-lookingstatements include statements that are predictive in nature that depend upon or refer to future events or conditions, or that include words such as“expects,” “anticipates,” “intends,” “plans,” “believes,” “estimates” or negative versions thereof and similar expressions. In addition, any statement thatmay be made concerning future performance, strategies or prospects, and possible future Fund action, is also a forward-looking statement. Forward-lookingstatements are based on current expectations and projections about future events and are inherently subject to, among other things, risks, uncertaintiesand assumptions about the Fund and economic factors.
Forward-looking statements are not guarantees of future performance, and actual events and results could differ materially from those expressed or impliedin any forward-looking statements made by the Fund. Any number of important factors could contribute to these digressions, including, but not limited to,general economic, political and market factors in North America and internationally, interest and foreign exchange rates, global equity and capital markets,business competition, technological change, changes in government regulations, unexpected judicial or regulatory proceedings, and catastrophic events.
We stress that the above-mentioned list of important factors is not exhaustive. We encourage you to consider these and other factors carefully beforemaking any investment decisions and we urge you to avoid placing undue reliance on forward-looking statements. Further, you should be aware of the factthat the Fund has no specific intention of updating any forward-looking statements, whether as a result of new information, future events or otherwise.
Sources: HSBC Global Asset Management (Canada) Limited, Bloomberg, MSCI, Bank of Canada.
Neither MSCI nor any other party involved in or related to compiling, computing or creating the MSCI data makes any express or implied warranties orrepresentations with respect to such data (or the results to be obtained by the use thereof), and all such parties hereby expressly disclaim all warranties oforiginality, accuracy, completeness, merchantability or fitness for a particular purpose with respect to any of such data. Without limiting any of theforegoing, in no event shall MSCI, any of its affiliates or any third party involved in or related to compiling, computing or creating the data have any liabilityfor any direct, indirect, special, punitive, consequential or any other damages (including lost profits) even if notified of the possibility of such damages. Nofurther distribution or dissemination of the MSCI data is permitted without MSCI’s express written consent.
Unauthorized reproduction, distribution, transmission or publication without our prior written consent is strictly prohibited.
Issued byHSBC Global Asset Management (Canada) Limited (2
015-
08)R
RD
HSBC U.S. Equity Fund
Interim Management Report of Fund Performance
for the six months ended June 30, 2015
HSBC U.S. Equity Fund
Management Discussion of Fund PerformanceIn this document, you and your refer to the unitholder of the Fund;we, us and our refer to HSBC Global Asset Management (Canada)Limited; and the Fund refers to the HSBC U.S. Equity Fund.
We are the manager, trustee and primary investment advisor ofthe Fund. We have entered into a sub-advisory agreement withLos Angeles Capital Management and Equity Research, Inc., underwhich Los Angeles Capital Management and Equity Research, Inc.provides investment advice and portfolio management services tothe Fund. For an explanation of the relationship between us andthe sub-advisor, see the section Selection of Sub-Advisors in theFund’s Simplified Prospectus.
IntroductionThis Interim Management Report of Fund Performance containsfinancial highlights but does not contain the complete annual or semi-annual financial statements of the investment fund. You may obtain acopy of the Fund’s annual or semi-annual financial statements at yourrequest, at no cost, by calling us toll-free at 1-888-390-3333, by visitingour website at www.hsbc.ca/investment-resources, by visiting theSEDAR website at www.sedar.com or by writing to us at:
Corporate SecretaryHSBC Global Asset Management (Canada) Limited3rd Floor, 885 West Georgia StreetVancouver, BC V6C 3E8
You may also contact us using one of these methods to request acopy of the Fund’s proxy voting policies and procedures, proxyvoting disclosure record or quarterly statement of investmentportfolio.
Results of OperationsAs of June 30, 2015, the Fund’s net assets increased by 38.7% to$182.9 million from $131.9 million at the end of 2014. Of thisincrease, a $12.8 million gain was attributable to investmentperformance and $38.2 million was attributable to netcontributions to the Fund.
Investment PerformanceThe HSBC U.S. Equity Fund (Investor Series) rose 9.27% for thesix months ending June 30, 2015, while its benchmark, theRussell 1000 Index (in Canadian dollars), rose 9.36% for the sameperiod.
At a sector level, top contributors to overall Fund performancewere healthcare, information technology and financials. Topabsolute contributing stocks to overall performance were aninvestment bank, a cable company and a healthcare provider.
Purchases during the year included a shoe company and twofinancial services firms. Sales included a shoe company, anautomotive company and a pharmaceutical company.
Within industries, overweight positions in healthcare equipmentand services, and pharmaceuticals and biotech, along with anunderweight to utilities, were the leading contributors to return.The Fund was hurt by an overweight to real estate, andunderweights to the commodity-based materials and energysectors. The leading detractors from return came from the Fund’sexposure to dividend-paying stocks and securities with shorter-term one-year and three-year price momentum.
Recent DevelopmentsUS equities have continued to advance in 2015, supported byultra-loose monetary policy. This has been despite notable periodsof volatility, particularly earlier in the year when geopoliticaltensions in Eastern Europe resurfaced and when the SwissNational Bank abandoned its currency floor for the franc againstthe euro.
The US economy has been the engine of global growth recently;however, data released in February suggested the world’s biggesteconomy may be losing some momentum. Retail sales growthand industrial production all surprised on the downside.Comments from the US Federal Reserve suggest rate rises thisyear are likely.
A US economic recovery that looks durable and a central bank thatremains focused on sustaining that recovery are supportive for USequities, in the Fund Manager’s view. With bond yields so low,equity valuations remain relatively attractive, although the size ofthe valuation gap between the two has narrowed over the pasttwo years.
Related Party TransactionsWe, on behalf of the Fund, or the Fund Manager, may, from timeto time, enter into transactions or arrangements with or involvingother members of the HSBC Group or other people or companiesrelated or connected to us or the Fund. To proceed with thetransactions, the Fund relies on the positive recommendation ofthe Fund’s Independent Review Committee. A condition of thispositive recommendation is that the transactions are performed inaccordance with our policy on Related Party Transactions. Formore general information on persons related to the Fund and thetypes of potential transactions, see the Fund’s SimplifiedProspectus.
The following is a summary of current transactions andarrangements with entities that are related to us or the Fund.
Manager, Trustee and Investment AdvisorWe are the manager, trustee and primary investment advisor of theFund. As manager, we manage the overall business and operationsof the Fund. As trustee, we hold legal title to the property of theFund on your behalf. As primary investment advisor, we provide
1
HSBC U.S. Equity Fund
investment advice and portfolio management services to the Fund.We receive a fee from the Fund for these services based on assetsunder management, calculated daily and paid monthly.
Distribution ServicesThe Fund is distributed through us, HSBC Investment Funds(Canada) Inc. (our wholly owned subsidiary); HSBC Private WealthServices (Canada) Inc. and through HSBC Securities (Canada) Inc.(an affiliate) directly or through its division, HSBC InvestDirect. Wepay distribution and servicing fees to them based on the amountof assets held in the investor’s account, and additionally, in somecases, on the amount of the initial purchase. If you hold units ofthis Fund and/or other HSBC Mutual Funds in a registered planwith HSBC Investment Funds (Canada) Inc., they may charge youan annual fee to cover the annual administration costs of the plan.We permit HSBC Investment Funds (Canada) Inc. to collect thesefees by redeeming sufficient units of the Fund with the highestmarket value in your registered plan.
Financial HighlightsThe following tables show selected key financial information aboutthe Fund and are intended to help you understand the Fund’sfinancial performance for the six-month period ended June 30,2015 and for the last five years ended December 31, as applicable.In the year a fund is established, “period” represents the periodfrom inception to December 31 or June 30 of that fiscal year, asapplicable. This information is derived from the Fund’s unauditedsemi-annual financial statements and audited annual financialstatements. The information in the following tables is based onprescribed regulations, and as a result, is not expected to add dueto the increase/decrease in net assets from operations beingbased on average units outstanding during the period and all othernumbers being based on actual units outstanding at the relevantpoint in time.
HSBC U.S. Equity Fund – Investor Series –Net Assets per Unit (1)
Period ended June 30, 2015 (unaudited)and years ended December 31 Inception: November 1994
June 30
2015
Dec. 31
2014
Dec. 31
2013
Dec. 31
2012
Dec. 31
2011
Dec. 31
2010
Net assets per unit,
beginning of period (2) $24.96 $20.84 $14.48 $13.53 $13.77 $12.67
(1) This information is derived from the Fund’s unaudited semi-annualfinancial statements and audited annual financial statements. The netassets per unit presented in the financial statements differ from thenet asset value calculated for fund pricing purposes.
(2) Net assets per unit and distributions per unit are based on the actualnumber of units outstanding for the relevant series at the relevanttime. The increase/decrease in net assets from operations per unit isbased on the weighted average number of units outstanding for therelevant series over the fiscal period.
(3) Distributions are automatically reinvested in additional units of theFund, unless the unitholder withdraws from the automaticreinvestment plan by providing written notice to us.
(4) This information is provided as at period-end.
(5) MER includes the total expenses of each Fund, including the Goodsand Services Tax and/or Harmonized Sales Tax thereon, other thanbrokerage commissions on securities transactions and any foreignwithholding taxes on income, as an annualized percentage of average
4
HSBC U.S. Equity Fund
net asset value (“NAV”) of the respective series of unit for the period.In the period a series is established, the MER is annualized from thedate of inception to the end of the period. The MER may vary fromone mutual fund to another and from one series of units to another.We may have waived or absorbed certain fees and expensesotherwise payable by the Fund. The amount of expenses absorbed orwaived is at the discretion of and can be terminated at any time by us.
(6) The Fund’s portfolio turnover rate indicates how actively the Fund’sportfolio advisor manages its portfolio investments. A portfolio turnoverrate of 100% is equivalent to the Fund buying and selling all of thesecurities in its portfolio once in the course of the period. The higher theFund’s portfolio turnover rate in a period, the greater the trading costspayable by the Fund in the period, and the greater the chance of aninvestor receiving taxable capital gains in the period. There is notnecessarily a relationship between a high turnover rate and theperformance of the Fund. The rate is calculated based on the lesser ofpurchases or sales of securities divided by the average weighted marketvalue of the portfolio securities, excluding short-term securities.
(7) The trading expense ratio represents commissions and other portfoliotransaction costs expressed as an annualized percentage of dailyaverage net asset value during the period.
Management FeesFor the six months ended June 30, 2015, the Fund paid usmanagement fees of $1,600,191. The management fee for eachseries is calculated as a percentage of the daily net asset value forthat series. The fees are reduced, where required, so that thesefees do not duplicate fees payable by mutual funds in which theFund invests for the same service.
The Fund’s management fees were used by us to pay costs formanaging the investment portfolio, providing investment analysisand recommendations, making investment decisions, makingbrokerage arrangements for the purchase and sale of theinvestment portfolio and providing other services. Themanagement fees also funded commission payments and othercompensation to sales representatives and registered dealers andbrokers (collectively “distribution costs”), including HSBC BankCanada, for units of the Fund bought and held by unitholders.Finally, we used management fees to pay for additional marketingand distribution services to the Fund.
For the six months ended June 30, 2015, approximately 45% ofthe total management fees collected from all HSBC Mutual Fundswere used to fund distribution costs. In comparison, for the Fund,such distribution costs represented 42% of the management feescollected. This may vary by series depending on the assetsinvested in each of the series.
Past PerformanceThe performance information shown assumes that all distributionsmade by the Fund in the periods shown were reinvested inadditional securities of the Fund. The performance informationdoes not take into account sales, redemption, distribution, optional
charges or expenses you may be charged outside of the Fund orthe effect of any income tax you may have to pay as a result ofyour investment in the Fund that would have reduced returns orperformance. The Fund’s past performance does not necessarilyindicate how it will perform in the future.
Year-by-Year ReturnsThe following bar charts show the Fund’s performance for thesix-month period ended June 30, 2015, and for each of theprevious 12-month periods ended December 31. In percentageterms, the bar charts show how much an investment made on thefirst day of each financial period would have grown or decreasedby the last day of each financial period.
Returns – Investor SeriesFor the 12-month periods ended December 31 and the six-monthperiod ended June 30, 201560%
40%
20%
0%
-20%
-40%
-60%
0.9%
Dec. 312005
11.0%
Dec. 312006
-11.5%
Dec. 312007
-30.0%
Dec. 312008
9.1%
Dec. 312009
8.7%
Dec. 312010
Dec. 312012
7.1%
Dec. 312013
43.9%
-1.7%
Dec. 312011
June 302015
19.8%9.3%
Dec. 312014
Returns – Advisor SeriesFor the 12-month periods ended December 31 and the six-monthperiod ended June 30, 201560%
40%
20%
0%
-20%
-40%
-60%
1.0%
Dec. 312005
11.0%
Dec. 312006
-11.5%
Dec. 312007
-30.0%
Dec. 312008
9.1%
Dec. 312009
8.7%
Dec. 312010
-1.7%
Dec. 312011
Dec. 312012
7.1%
43.9%
Dec. 312013
June 302015
19.7%9.0%
Dec. 312014
5
HSBC U.S. Equity Fund
Returns – Premium SeriesFor the 12-month periods ended December 31 and the six-monthperiod ended June 30, 201560%
20%
0%
-20%
-60%
-1.2%
Dec. 312011
Dec. 312012
40%
-40%
7.7%
44.7%
20.4%9.6%
Dec. 312013
Dec. 312014
June 302015
Returns – Manager SeriesFor the 12-month periods ended December 31 and the six-monthperiod ended June 30, 201560%
40%
20%
0%
-20%
-40%
-60%
12.2% 8.4%
45.5%
21.1%9.7%
-10.6%
-29.3%
10.3% 9.9%
-0.6%
Dec. 312006
Dec. 312007
Dec. 312008
Dec. 312009
Dec. 312010
Dec. 312011
Dec. 312012
Dec. 312013
Dec. 312014
June 302015
Returns – Institutional SeriesFor the 12-month periods ended December 31 and the six-monthperiod ended June 30, 201560%
40%
20%
0%
-20%
-40%
-60%
13.4%
-9.6%
-28.5%
11.4% 10.4%0.0% 0.0% 0.0% 0.0% 0.0%
Dec. 312006
Dec. 312007
Dec. 312008
Dec. 312009
Dec. 312010
Dec. 312011
Dec. 312012
Dec. 312013
Dec. 312014
June 302015
Summary of Investment PortfolioAs at June 30, 2015
Apple Inc. 3.03%Express Scripts Holding Co. 1.65%The Sherwin-Williams Co. 1.54%Northrop Grumman Corp. 1.41%The Kroger Co. 1.33%CVS Health Corp. 1.27%The Home Depot Inc. 1.24%Omnicare Inc. 1.21%Eastman Chemical Co. 1.14%Ashland Inc. 1.09%AT&T Inc. 1.05%Reynolds American Inc. 0.95%Anthem Inc. 0.94%Berkshire Hathaway Inc., Class B 0.93%Crown Holdings Inc. 0.93%Comcast Corp., Class A 0.91%Marathon Petroleum Corp. 0.90%RenaissanceRe Holdings Ltd. 0.90%Tenet Healthcare Corp. 0.90%McGraw Hill Financial Inc. 0.89%Cigna Corp. 0.88%Citigroup Inc. 0.88%Cheniere Energy Inc. 0.87%Hewlett-Packard Co. 0.87%Assurant Inc. 0.85%Total top 25 investments 28.56%
6
The Summary of Investment Portfolio may change due to ongoing portfolio transactions of the Fund, and is available quarterly.
For more information
You can find more information about HSBC Mutual Fundsin the Fund’s Simplified Prospectus, Annual InformationForm, Annual and Semi-Annual Report and Fund Facts. Youcan get a copy of these documents, as well as the Fund’sFinancial Statements, at no cost by calling 1-888-390-3333,by contacting your authorized dealer or by visiting ourwebsite at www.hsbc.ca/investment-resources.
These documents and other information about the HSBCMutual Funds, such as information circulars and materialcontracts, are also available at www.sedar.com.
Copies of the Annual Report and Semi-Annual Report,Simplified Prospectus, Annual Information Form, Annualand Interim Management Report of Fund Performanceand Fund Facts are available on our website atwww.hsbc.ca/investment-resources.
How to reach us
VancouverHSBC Global Asset Management (Canada) Limited3rd Floor, 885 West Georgia StreetVancouver, BC V6C 3E8
Tel: 1-888-390-3333Fax: 604-669-2756
TorontoSuite 300 – 70 York StreetToronto, ON M5J 1S9
MontrealSuite 300 – 2001 McGill College AvenueMontreal, QC H3A 1G1
A NOTE ON FORWARD-LOOKING STATEMENTS
This report may contain forward-looking statements about the Fund, including its strategy, expected performance and condition. Forward-lookingstatements include statements that are predictive in nature that depend upon or refer to future events or conditions, or that include words such as“expects,” “anticipates,” “intends,” “plans,” “believes,” “estimates” or negative versions thereof and similar expressions. In addition, any statement thatmay be made concerning future performance, strategies or prospects, and possible future Fund action, is also a forward-looking statement. Forward-lookingstatements are based on current expectations and projections about future events and are inherently subject to, among other things, risks, uncertaintiesand assumptions about the Fund and economic factors.
Forward-looking statements are not guarantees of future performance, and actual events and results could differ materially from those expressed or impliedin any forward-looking statements made by the Fund. Any number of important factors could contribute to these digressions, including, but not limited to,general economic, political and market factors in North America and internationally, interest and foreign exchange rates, global equity and capital markets,business competition, technological change, changes in government regulations, unexpected judicial or regulatory proceedings, and catastrophic events.
We stress that the above-mentioned list of important factors is not exhaustive. We encourage you to consider these and other factors carefully beforemaking any investment decisions and we urge you to avoid placing undue reliance on forward-looking statements. Further, you should be aware of the factthat the Fund has no specific intention of updating any forward-looking statements, whether as a result of new information, future events or otherwise.
Sources: HSBC Global Asset Management (Canada) Limited, Bloomberg, Bank of Canada.
Unauthorized reproduction, distribution, transmission or publication without our prior written consent is strictly prohibited.
Issued byHSBC Global Asset Management (Canada) Limited (2
015-
08)R
RD
HSBC European Fund
Interim Management Report of Fund Performance
for the six months ended June 30, 2015
HSBC European Fund
Management Discussion of Fund PerformanceIn this document, you and your refer to the unitholder of the Fund;we, us and our refer to HSBC Global Asset Management (Canada)Limited; and the Fund refers to the HSBC European Fund.
We are the manager, trustee and primary investment advisor of theFund. We have entered into a sub-advisory agreement with HSBCGlobal Asset Management (UK) Limited, under which HSBC GlobalAsset Management (UK) Limited provides investment advice andportfolio management services to the Fund. For an explanation ofthe relationship between us and the sub-advisor, see the sectionSelection of Sub-Advisors in the Fund’s Simplified Prospectus.
IntroductionThis Interim Management Report of Fund Performance containsfinancial highlights but does not contain the complete annual or semi-annual financial statements of the investment fund. You may obtain acopy of the Fund’s annual or semi-annual financial statements at yourrequest, at no cost, by calling us toll-free at 1-888-390-3333, by visitingour website at www.hsbc.ca/investment-resources, by visiting theSEDAR website at www.sedar.com or by writing to us at:
Corporate SecretaryHSBC Global Asset Management (Canada) Limited3rd Floor, 885 West Georgia StreetVancouver, BC V6C 3E8
You may also contact us using one of these methods to request acopy of the Fund’s proxy voting policies and procedures, proxyvoting disclosure record or quarterly statement of investmentportfolio.
Results of OperationsAs of June 30, 2015, the Fund’s net assets increased by 11.1% to$50.2 million from $45.2 million at the end of 2014. Of thisincrease, a $5.7 million gain was attributable to investmentperformance and $0.7 million was attributable to net withdrawalsfrom Fund.
Investment PerformanceThe HSBC European Fund (Investor Series) rose 12.81% for thesix months ending June 30, 2015. The benchmark MSCI EuropeIndex (in Canadian dollars) was up 12.13% over the same period.
During the period, consumer discretionary, telecommunicationservices and healthcare outperformed while utilities, energy andinformation technology lagged the Index. Overall, stock selectionwas positive. The Fund Manager’s sector allocation, a feature oftheir bottom-up investment process, added to performance aswell.
Volatility continued to rise year-to-date. In June, European equitieswere under pressure as markets awaited more evidence of
economic recovery in earnings growth and developments inGreece induced volatility. Recent economic data in the eurozonehave been positive, especially in the periphery. This has benefitedthe more domestic-focused names in the Fund, including an Italianbank and a Danish bank.
However, the Fund faced some headwinds. The Fund Manager’sstock selection in consumer discretionary detracted. After a strongperformance last year, the Fund’s holdings in a UK jeweler haveconsolidated since the beginning of the year. However, thecompany continues to trade attractively and the Fund Managerremains confident in its fundamentals. Some of the Fund’sfinancial holdings also detracted. A Dutch insurer performed poorlyas low interest rates hit capital ratios and investment returns.Capital ratios are now more adequate, after a 10% capital increasein the period, while cash flow remains strong. A Spanish bank wasalso weaker and the Fund exited its position in April.
Recent DevelopmentsReforms are taking place in various European countries and recenteconomic data are showing encouraging signs of a slow recovery.The Fund Manager continues to believe that the global economicrecovery is on track. Global economic growth lost somemomentum in early 2015, but developed market economies arebeginning to regain pace. The eurozone recovery continues to besupported by fading austerity measures, improving credit andultra-loose monetary policy that has contributed to a weaker eurosupporting exports. The region appears set for above-trend growthin 2015.
Inflation in Europe is rebounding, helped by the weaker euro, withthe eurozone recovering from deflation in May. Continued supportfrom the European Central Bank’s quantitative easing program willalso likely outweigh headwinds created by concerns overdevelopments in Greece, slower growth in China and tighter USmonetary policy. However, these risks could flare up from time totime, leading to sudden spikes in volatility in 2015.
Related Party TransactionsWe, on behalf of the Fund, or the Fund Manager, may, from time totime, enter into transactions or arrangements with or involving othermembers of the HSBC Group or other people or companies relatedor connected to us or the Fund. To proceed with the transactions,the Fund relies on the positive recommendation of the Fund’sIndependent Review Committee. A condition of this positiverecommendation is that the transactions are performed inaccordance with our policy on Related Party Transactions. For moregeneral information on persons related to the Fund and the types ofpotential transactions, see the Fund’s Simplified Prospectus.
The following is a summary of current transactions andarrangements with entities that are related to us or the Fund.
1
HSBC European Fund
Manager, Trustee and Investment AdvisorWe are the manager, trustee and primary investment advisor ofthe Fund. As manager, we manage the overall business andoperations of the Fund. As trustee, we hold legal title to theproperty of the Fund on your behalf. As primary investmentadvisor, we provide investment advice and portfolio managementservices to the Fund. We receive a fee from the Fund for theseservices based on assets under management, calculated daily andpaid monthly. We have entered into a sub-advisory agreementwith HSBC Global Asset Management (UK) Limited (an affiliate),under which HSBC Global Asset Management (UK) Limitedprovides investment advice and portfolio management services tothe Fund. We pay HSBC Global Asset Management (UK) Limitedan investment advisory fee from the Fund based on assets undermanagement, calculated daily and paid quarterly. For moreinformation on our ability to hire sub-advisors, see the sectionOrganization and Management of the HSBC Mutual Funds in theFund’s Simplified Prospectus.
Distribution ServicesThe Fund is distributed through us, HSBC Investment Funds(Canada) Inc. (our wholly owned subsidiary); HSBC Private WealthServices (Canada) Inc. and through HSBC Securities (Canada) Inc.(an affiliate) directly or through its division, HSBC InvestDirect. Wepay distribution and servicing fees to them based on the amountof assets held in the investor’s account, and additionally, in somecases, on the amount of the initial purchase. If you hold units ofthis Fund and/or other HSBC Mutual Funds in a registered planwith HSBC Investment Funds (Canada) Inc., they may charge youan annual fee to cover the annual administration costs of the plan.We permit HSBC Investment Funds (Canada) Inc. to collect thesefees by redeeming sufficient units of the Fund with the highestmarket value in your registered plan.
Related Brokerage CommissionsFrom time to time, the Fund may enter into purchases and salesof securities, derivative instruments, foreign exchange contracts orother instruments with dealers that are members of the HSBCGroup (“Related Brokers”). These Related Brokers may earncommissions or spreads provided that such trades are made onterms and conditions comparable to those offered by or tounrelated parties. During the period, the Fund did not pay any feesto the Related Brokers (December 31, 2014, $3,798).
Investments in Securities of Related PartiesIn accordance with Canadian securities legislation and policies setout by our Independent Review Committee, the Fund may investits assets in the securities of companies related to the Fund’sinvestment advisor or sub-advisor. During the period, the Fundheld, purchased or sold shares in HSBC Holdings PLC (ourultimate parent company), which represented 0.00% of the Fund’sassets as at June 30, 2015.
Financial HighlightsThe following tables show selected key financial information aboutthe Fund and are intended to help you understand the Fund’sfinancial performance for the six-month period ended June 30, 2015and for the last five years ended December 31, as applicable. In theyear a fund is established, “period” represents the period frominception to December 31 or June 30 of that fiscal year, asapplicable. This information is derived from the Fund’s unauditedsemi-annual financial statements and audited annual financialstatements. The information in the following tables is based onprescribed regulations, and as a result, is not expected to add due tothe increase/decrease in net assets from operations being based onaverage units outstanding during the period and all other numbersbeing based on actual units outstanding at the relevant point in time.
HSBC European Fund – Investor Series –Net Assets per Unit (1)
Period ended June 30, 2015 (unaudited)and years ended December 31 Inception: November 1994
June 30
2015
Dec. 31
2014
Dec. 31
2013
Dec. 31
2012
Dec. 31
2011
Dec. 31
2010
Net assets per unit,
beginning of period (2) $24.50 $24.79 $18.72 $16.09 $18.94 $19.86
(1) This information is derived from the Fund’s unaudited semi-annualfinancial statements and audited annual financial statements. The netassets per unit presented in the financial statements differ from the netasset value calculated for fund pricing purposes.
(2) Net assets per unit and distributions per unit are based on the actualnumber of units outstanding for the relevant series at the relevant time.The increase/decrease in net assets from operations per unit is based onthe weighted average number of units outstanding for the relevant seriesover the fiscal period.
(3) Distributions are automatically reinvested in additional units of theFund, unless the unitholder withdraws from the automaticreinvestment plan by providing written notice to us.
(4) This information is provided as at period-end.
(5) MER includes the total expenses of each Fund, including the Goodsand Services Tax and/or Harmonized Sales Tax thereon, other thanbrokerage commissions on securities transactions and any foreignwithholding taxes on income, as an annualized percentage of average
4
HSBC European Fund
net asset value (“NAV”) of the respective series of unit for the period.In the period a series is established, the MER is annualized from thedate of inception to the end of the period. The MER may vary fromone mutual fund to another and from one series of units to another.We may have waived or absorbed certain fees and expensesotherwise payable by the Fund. The amount of expenses absorbed orwaived is at the discretion of and can be terminated at any time by us.
(6) The Fund’s portfolio turnover rate indicates how actively the Fund’sportfolio advisor manages its portfolio investments. A portfolio turnoverrate of 100% is equivalent to the Fund buying and selling all of thesecurities in its portfolio once in the course of the period. The higher theFund’s portfolio turnover rate in a period, the greater the trading costspayable by the Fund in the period, and the greater the chance of aninvestor receiving taxable capital gains in the period. There is notnecessarily a relationship between a high turnover rate and theperformance of the Fund. The rate is calculated based on the lesser ofpurchases or sales of securities divided by the average weighted marketvalue of the portfolio securities, excluding short-term securities.
(7) The trading expense ratio represents commissions and other portfoliotransaction costs expressed as an annualized percentage of dailyaverage net asset value during the period.
Management FeesFor the six months ended June 30, 2015, the Fund paid usmanagement fees of $473,268. The management fee for eachseries is calculated as a percentage of the daily net asset value forthat series. The fees are reduced, where required, so that thesefees do not duplicate fees payable by mutual funds in which theFund invests for the same service.
The Fund’s management fees were used by us to pay costs formanaging the investment portfolio, providing investment analysisand recommendations, making investment decisions, makingbrokerage arrangements for the purchase and sale of theinvestment portfolio and providing other services. Themanagement fees also funded commission payments and othercompensation to sales representatives and registered dealers andbrokers (collectively “distribution costs”), including HSBC BankCanada, for units of the Fund bought and held by unitholders.Finally, we used management fees to pay for additional marketingand distribution services to the Fund.
For the six months ended June 30, 2015, approximately 45% ofthe total management fees collected from all HSBC Mutual Fundswere used to fund distribution costs. In comparison, for the Fund,such distribution costs represented 44% of the management feescollected. This may vary by series depending on the assetsinvested in each of the series.
Past PerformanceThe performance information shown assumes that all distributionsmade by the Fund in the periods shown were reinvested inadditional securities of the Fund. The performance informationdoes not take into account sales, redemption, distribution, optionalcharges or expenses you may be charged outside of the Fund or
the effect of any income tax you may have to pay as a result ofyour investment in the Fund that would have reduced returns orperformance. The Fund’s past performance does not necessarilyindicate how it will perform in the future.
Year-by-Year ReturnsThe following bar charts show the Fund’s performance for thesix-month period ended June 30, 2015, and for each of the previous12-month periods ended December 31. In percentage terms, thebar charts show how much an investment made on the first day ofeach financial period would have grown or decreased by the last dayof each financial period.
Returns – Investor SeriesFor the 12-month periods ended December 31 and the six-monthperiod ended June 30, 201560%
0%
-60%
-20%
-40%
40%
20%
Dec. 312005
5.8%
Dec. 312006
32.9%
Dec. 312007
-7.0%
Dec. 312008
-37.0%
Dec. 312009
15.3%
Dec. 312012
16.9%
Dec. 312010
-3.8%
Dec. 312011
-13.0%
32.6%
12.8%
Dec. 312013
June 302015
-0.5%
Dec. 312014
Returns – Advisor SeriesFor the 12-month periods ended December 31 and the six-monthperiod ended June 30, 201560%
0%
-60%
-20%
-40%
40%
20%
Dec. 312005
5.8%
Dec. 312006
32.9%
Dec. 312007
-7.2%
Dec. 312008
-37.1%
Dec. 312009
15.3%
Dec. 312012
16.9%
Dec. 312010
-3.8%
Dec. 312011
-13.0%
32.6%
12.6%
Dec. 312013
June 302015
-0.5%
Dec. 312014
5
HSBC European Fund
Returns – Premium SeriesFor the 12-month periods ended December 31 and the six-monthperiod ended June 30, 201560%
40%
-20%
-60%
0%
Dec. 312011
Dec. 312012
20%
-40%
-12.4%
18.0% 13.1%
33.4%
0.1%
Dec. 312013
Dec. 312014
June 302015
Returns – Manager SeriesFor the 12-month periods ended December 31 and the six-monthperiod ended June 30, 201560%
0%
-60%
-20%
-40%
40%
20%
Dec. 312005
7.0%
Dec. 312006
34.3%
Dec. 312007
-6.0%
Dec. 312008
-36.3%
Dec. 312009
16.5% 13.2%
Dec. 312012
0.0%
Dec. 312010
-2.8%
Dec. 312011
-12.0%
0.0%
Dec. 312013
June 302015
0.0%
Dec. 312014
Returns – Institutional SeriesFor the 12-month periods ended December 31 and the six-monthperiod ended June 30, 201560%
20%
-60%
0%
Dec. 312008
Dec. 312009
Dec. 312010
Dec. 312011
Dec. 312012
Dec. 312006
Dec. 312007
-20%
-40%
40% 35.7%
-5.0%
-35.6%
17.8% 13.9%0.0% 0.0% 0.0% 0.0% 0.0%
Dec. 312013
Dec. 312014
June 302015
Summary of Investment PortfolioAs at June 30, 2015
Danske Bank A/S 3.45%Lloyds Banking Group PLC 3.37%Wolseley PLC 3.24%BNP Paribas SA 3.17%Cap Gemini SA 3.17%Intesa Sanpaolo SpA 3.17%Legrand SA 3.17%Continental AG 3.14%Unilever PLC 3.14%GEA Group AG 3.10%Roche Holding AG 3.09%Ryanair Holdings PLC, ADR 3.08%Novo Nordisk A/S 3.07%Vodafone Group PLC 3.07%KBC Groep NV 3.06%BT Group PLC 3.03%Signet Jewelers Ltd. 2.98%Novartis AG 2.97%AXA SA 2.95%Accor SA 2.93%Compass Group PLC 2.86%Brenntag AG 2.84%BP PLC 2.81%Publicis Groupe SA 2.80%Amadeus IT Holding SA, Class A 2.78%Total top 25 investments 76.44%
The Summary of Investment Portfolio may change due to ongoing portfolio transactions of the Fund, and is available quarterly.
7
For more information
You can find more information about HSBC Mutual Fundsin the Fund’s Simplified Prospectus, Annual InformationForm, Annual and Semi-Annual Report and Fund Facts. Youcan get a copy of these documents, as well as the Fund’sFinancial Statements, at no cost by calling 1-888-390-3333,by contacting your authorized dealer or by visiting ourwebsite at www.hsbc.ca/investment-resources.
These documents and other information about the HSBCMutual Funds, such as information circulars and materialcontracts, are also available at www.sedar.com.
Copies of the Annual Report and Semi-Annual Report,Simplified Prospectus, Annual Information Form, Annualand Interim Management Report of Fund Performanceand Fund Facts are available on our website atwww.hsbc.ca/investment-resources.
How to reach us
VancouverHSBC Global Asset Management (Canada) Limited3rd Floor, 885 West Georgia StreetVancouver, BC V6C 3E8
Tel: 1-888-390-3333Fax: 604-669-2756
TorontoSuite 300 – 70 York StreetToronto, ON M5J 1S9
MontrealSuite 300 – 2001 McGill College AvenueMontreal, QC H3A 1G1
A NOTE ON FORWARD-LOOKING STATEMENTS
This report may contain forward-looking statements about the Fund, including its strategy, expected performance and condition. Forward-lookingstatements include statements that are predictive in nature that depend upon or refer to future events or conditions, or that include words such as“expects,” “anticipates,” “intends,” “plans,” “believes,” “estimates” or negative versions thereof and similar expressions. In addition, any statement thatmay be made concerning future performance, strategies or prospects, and possible future Fund action, is also a forward-looking statement. Forward-lookingstatements are based on current expectations and projections about future events and are inherently subject to, among other things, risks, uncertaintiesand assumptions about the Fund and economic factors.
Forward-looking statements are not guarantees of future performance, and actual events and results could differ materially from those expressed or impliedin any forward-looking statements made by the Fund. Any number of important factors could contribute to these digressions, including, but not limited to,general economic, political and market factors in North America and internationally, interest and foreign exchange rates, global equity and capital markets,business competition, technological change, changes in government regulations, unexpected judicial or regulatory proceedings, and catastrophic events.
We stress that the above-mentioned list of important factors is not exhaustive. We encourage you to consider these and other factors carefully beforemaking any investment decisions and we urge you to avoid placing undue reliance on forward-looking statements. Further, you should be aware of the factthat the Fund has no specific intention of updating any forward-looking statements, whether as a result of new information, future events or otherwise.
Sources: HSBC Global Asset Management (Canada) Limited, Bloomberg, MSCI, Bank of Canada.
Neither MSCI nor any other party involved in or related to compiling, computing or creating the MSCI data makes any express or implied warranties orrepresentations with respect to such data (or the results to be obtained by the use thereof), and all such parties hereby expressly disclaim all warranties oforiginality, accuracy, completeness, merchantability or fitness for a particular purpose with respect to any of such data. Without limiting any of theforegoing, in no event shall MSCI, any of its affiliates or any third party involved in or related to compiling, computing or creating the data have any liabilityfor any direct, indirect, special, punitive, consequential or any other damages (including lost profits) even if notified of the possibility of such damages. Nofurther distribution or dissemination of the MSCI data is permitted without MSCI’s express written consent.
Unauthorized reproduction, distribution, transmission or publication without our prior written consent is strictly prohibited.
Issued byHSBC Global Asset Management (Canada) Limited (2
015-
08)R
RD
HSBC AsiaPacific Fund
Interim Management Report of Fund Performance
for the six months ended June 30, 2015
HSBC AsiaPacific Fund
Management Discussion of Fund PerformanceIn this document, you and your refer to the unitholder of the Fund;we, us and our refer to HSBC Global Asset Management (Canada)Limited; and the Fund refers to the HSBC AsiaPacific Fund.
We are the manager, trustee and primary investment advisor ofthe Fund. We have entered into a sub-advisory agreement withHSBC Global Asset Management (Hong Kong) Limited, underwhich HSBC Global Asset Management (Hong Kong) Limitedprovides investment advice and portfolio management services tothe Fund. For an explanation of the relationship between us andthe sub-advisor, see the section Selection of Sub-Advisors in theFund’s Simplified Prospectus.
IntroductionThis Interim Management Report of Fund Performance containsfinancial highlights but does not contain the complete annual or semi-annual financial statements of the investment fund. You may obtain acopy of the Fund’s annual or semi-annual financial statements at yourrequest, at no cost, by calling us toll-free at 1-888-390-3333, by visitingour website at www.hsbc.ca/investment-resources, by visiting theSEDAR website at www.sedar.com or by writing to us at:
Corporate SecretaryHSBC Global Asset Management (Canada) Limited3rd Floor, 885 West Georgia StreetVancouver, BC V6C 3E8
You may also contact us using one of these methods to request acopy of the Fund’s proxy voting policies and procedures, proxyvoting disclosure record or quarterly statement of investmentportfolio.
Results of OperationsAs of June 30, 2015, the Fund’s net assets increased by 3.6% to$40.1 million from $38.7 million at the end of 2014. Of thisincrease, a $3.7 million gain was attributable to investmentperformance and $2.3 million was attributable to net withdrawalsfrom Fund.
Investment PerformanceThe HSBC AsiaPacific Fund (Investor Series) rose 9.36% over thesix months ending June 30, 2015, while its benchmark, the MSCIAll Country Asia Pacific ex-Japan Index (in Canadian dollars), rose11.29% for the same period.
Asia-Pacific equity markets made strong gains in Canadian-dollarterms in the first half of the year, but in local currency or US-dollarterms the gains were more muted. Markets were supported in thefirst quarter by accommodative central bank action, with rate cutsin several countries. Hong Kong and Chinese markets ralliedstrongly in April on government policy announcements supportiveof the opening up of the market. But they fell sharply in May and
June on concerns over valuations and also on worries that theChinese government would clamp down on margin trading.
The best-performing markets in the first half were Hong Kong,China, Taiwan and the Philippines, while Indonesia and Malaysialagged. Industrials and financials were the standout sectorperformers, while consumer discretionary and utilities were out offavour.
The Fund underperformed the Index during the first half of 2015,mainly driven by stock selection in Korea, Malaysia and Australia.In South Korea, an automaker was impacted by poor sales resultsin China and a semiconductor manufacturer was hit by lower-than-expected earnings results. But the Fund Manager remains positiveon the long-term outlook for computer memory prices. Stockselection was a highlight in China, India and Thailand. An Indianreal estate and financial conglomerate benefited from rate cutsthat will bring down its wholesale funding costs.
Recent DevelopmentsThe overall inflation outlook in the region is subdued, which willgive policymakers room to move on rates as needed. Oil prices,despite stabilizing recently, remain at relatively low levels, which isa net benefit for Asia-Pacific equities. The Fund Manager also seespositive trends in terms of fiscal consolidation in markets such asIndia, Malaysia and Indonesia, which are winding down energysubsidies and increasing infrastructure spending. Recent volatilityin Chinese equity markets has led to a raft of positive policyresponses to support the market.
Valuations in Asia ex-Japan remain attractive on a price-to-earningsand price-to-book basis, particularly given the potential tailwinds ofmonetary easing and fiscal consolidation. Looking ahead, the FundManager continues to see better return prospects for corporateassets, both equity and debt, based on strong fundamentals andreasonable valuations. However, corporate earnings are expectedto contract modestly this year, led lower by the energy sector,before rebounding in 2016. The Fund is therefore somewhat lessexposed to domestic equities than in recent quarters.
Related Party TransactionsWe, on behalf of the Fund, or the Fund Manager, may, from timeto time, enter into transactions or arrangements with or involvingother members of the HSBC Group or other people or companiesrelated or connected to us or the Fund. To proceed with thetransactions, the Fund relies on the positive recommendation ofthe Fund’s Independent Review Committee. A condition of thispositive recommendation is that the transactions are performed inaccordance with our policy on Related Party Transactions. For moregeneral information on persons related to the Fund and the typesof potential transactions, see the Fund’s Simplified Prospectus.
1
HSBC AsiaPacific Fund
The following is a summary of current transactions andarrangements with entities that are related to us or the Fund.
Manager, Trustee and Investment AdvisorWe are the manager, trustee and primary investment advisor ofthe Fund. As manager, we manage the overall business andoperations of the Fund. As trustee, we hold legal title to theproperty of the Fund on your behalf. As primary investmentadvisor, we provide investment advice and portfolio managementservices to the Fund. We receive a fee from the Fund for theseservices based on assets under management, calculated daily andpaid monthly. We have entered into a sub-advisory agreementwith HSBC Global Asset Management (Hong Kong) Limited (anaffiliate), under which HSBC Global Asset Management (HongKong) Limited provides investment advice and portfoliomanagement services to the Fund. We pay HSBC Global AssetManagement (Hong Kong) Limited a fee from the Fund based onassets under management, calculated daily and paid quarterly. Formore information on our ability to hire sub-advisors, see thesection Organization and Management of the HSBC Mutual Fundsin the Fund’s Simplified Prospectus.
Distribution ServicesThe Fund is distributed through us, HSBC Investment Funds(Canada) Inc. (our wholly owned subsidiary); HSBC Private WealthServices (Canada) Inc. and through HSBC Securities (Canada) Inc.(an affiliate) directly or through its division, HSBC InvestDirect. Wepay distribution and servicing fees to them based on the amountof assets held in the investor’s account, and additionally, in somecases, on the amount of the initial purchase. If you hold units ofthis Fund and/or other HSBC Mutual Funds in a registered planwith HSBC Investment Funds (Canada) Inc., they may charge youan annual fee to cover the annual administration costs of the plan.We permit HSBC Investment Funds (Canada) Inc. to collect thesefees by redeeming sufficient units of the Fund with the highestmarket value in your registered plan.
Related Brokerage CommissionsFrom time to time, the Fund may enter into purchases and salesof securities, derivative instruments, foreign exchange contracts orother instruments with The Hong Kong & Shanghai BankingCorporation Limited, HSBC Securities (Asia) Ltd. or other dealersthat are members of the HSBC Group (“Related Brokers”). TheseRelated Brokers may earn commissions or spreads provided thatsuch trades are made on terms and conditions comparable tothose offered by or to unrelated parties. During the period, theFund paid commissions to HSBC Broking Services (Asia) Limitedand other Related Brokers amounting to $728 (December 31,2014 – $7,248).
Financial HighlightsThe following tables show selected key financial information aboutthe Fund and are intended to help you understand the Fund’sfinancial performance for the six-month period ended June 30,2015 and for the last five years ended December 31, as applicable.In the year a fund is established, “period” represents the periodfrom inception to December 31 or June 30 of that fiscal year, asapplicable. This information is derived from the Fund’s unauditedsemi-annual financial statements and audited annual financialstatements. The information in the following tables is based onprescribed regulations, and as a result, is not expected to add dueto the increase/decrease in net assets from operations beingbased on average units outstanding during the period and all othernumbers being based on actual units outstanding at the relevantpoint in time.
HSBC AsiaPacific Fund – Investor Series –Net Assets per Unit (1)
Period ended June 30, 2015 (unaudited)and years ended December 31 Inception: November 1993
June 30
2015
Dec. 31
2014
Dec. 31
2013
Dec. 31
2012
Dec. 31
2011
Dec. 31
2010
Net assets per unit,
beginning of period (2) $13.60 $12.36 $11.72 $10.65 $13.44 $12.16
(1) This information is derived from the Fund’s unaudited semi-annualfinancial statements and audited annual financial statements. The netassets per unit presented in the financial statements differ from thenet asset value calculated for fund pricing purposes.
(2) Net assets per unit and distributions per unit are based on the actualnumber of units outstanding for the relevant series at the relevanttime. The increase/decrease in net assets from operations per unit isbased on the weighted average number of units outstanding for therelevant series over the fiscal period.
(3) Distributions are automatically reinvested in additional units of theFund, unless the unitholder withdraws from the automaticreinvestment plan by providing written notice to us.
(4) This information is provided as at period-end.
(5) MER includes the total expenses of each Fund, including the Goodsand Services Tax and/or Harmonized Sales Tax thereon, other thanbrokerage commissions on securities transactions and any foreignwithholding taxes on income, as an annualized percentage of average
4
HSBC AsiaPacific Fund
net asset value (“NAV”) of the respective series of unit for the period.In the period a series is established, the MER is annualized from thedate of inception to the end of the period. The MER may vary fromone mutual fund to another and from one series of units to another.We may have waived or absorbed certain fees and expensesotherwise payable by the Fund. The amount of expenses absorbed orwaived is at the discretion of and can be terminated at any time by us.
(6) The Fund’s portfolio turnover rate indicates how actively the Fund’sportfolio advisor manages its portfolio investments. A portfolio turnoverrate of 100% is equivalent to the Fund buying and selling all of thesecurities in its portfolio once in the course of the period. The higher theFund’s portfolio turnover rate in a period, the greater the trading costspayable by the Fund in the period, and the greater the chance of aninvestor receiving taxable capital gains in the period. There is notnecessarily a relationship between a high turnover rate and theperformance of the Fund. The rate is calculated based on the lesser ofpurchases or sales of securities divided by the average weighted marketvalue of the portfolio securities, excluding short-term securities.
(7) The trading expense ratio represents commissions and other portfoliotransaction costs expressed as an annualized percentage of dailyaverage net asset value during the period.
Management FeesFor the six months ended June 30, 2015, the Fund paid usmanagement fees of $398,638. The management fee for eachseries is calculated as a percentage of the daily net asset value forthat series. The fees are reduced, where required, so that thesefees do not duplicate fees payable by mutual funds in which theFund invests for the same service.
The Fund’s management fees were used by us to pay costs formanaging the investment portfolio, providing investment analysisand recommendations, making investment decisions, makingbrokerage arrangements for the purchase and sale of theinvestment portfolio and providing other services. Themanagement fees also funded commission payments and othercompensation to sales representatives and registered dealers andbrokers (collectively “distribution costs”), including HSBC BankCanada, for units of the Fund bought and held by unitholders.Finally, we used management fees to pay for additional marketingand distribution services to the Fund.
For the six months ended June 30, 2015, approximately 45% ofthe total management fees collected from all HSBC Mutual Fundswere used to fund distribution costs. In comparison, for the Fund,such distribution costs represented 43% of the management feescollected. This may vary by series depending on the assetsinvested in each of the series.
Past PerformanceThe performance information shown assumes that all distributionsmade by the Fund in the periods shown were reinvested inadditional securities of the Fund. The performance informationdoes not take into account sales, redemption, distribution, optional
charges or expenses you may be charged outside of the Fund orthe effect of any income tax you may have to pay as a result ofyour investment in the Fund that would have reduced returns orperformance. The Fund’s past performance does not necessarilyindicate how it will perform in the future.
Year-by-Year ReturnsThe following bar charts show the Fund’s performance for thesix-month period ended June 30, 2015, and for each of theprevious 12-month periods ended December 31. In percentageterms, the bar charts show how much an investment made on thefirst day of each financial period would have grown or decreasedby the last day of each financial period.
Returns – Investor SeriesFor the 12-month periods ended December 31 and the six-monthperiod ended June 30, 201560%
0%
-60%
-20%
-40%
40%
20% 17.1%
2005Dec. 31
29.9%
2006Dec. 31
13.5%
2007Dec. 31
-39.7%
2008Dec. 31
42.3%
2009Dec. 31
10.5%
2010Dec. 31
-20.2%
2011Dec. 31 June 30
20152012Dec. 31
11.9%
2013Dec. 31
5.6%
2014Dec. 31
10.9% 9.4%
Returns – Advisor SeriesFor the 12-month periods ended December 31 and the six-monthperiod ended June 30, 201560%
0%
-60%
20%
40%
-40%
-20%
17.1%29.9%
13.5%
-39.7%
42.2%
10.5% 10.5%11.9%5.5%
11.1%
-19.4%
2005Dec. 31
2006Dec. 31
2007Dec. 31
2008Dec. 31
2009Dec. 31
2010Dec. 31
2011Dec. 31
2013Dec. 31 June 30
20152014Dec. 31
2012Dec. 31
5
HSBC AsiaPacific Fund
Returns – Premium SeriesFor the 12-month periods ended December 31 and the six-monthperiod ended June 30, 201560%
20%
-20%
-60%
0%
Dec. 312011
40%
-40%-19.3%
12.5%6.2% 11.5% 9.6%
2012Dec. 31 Dec. 31
2013Dec. 31
2014June 30
2015
Returns – Manager SeriesFor the 12-month periods ended December 31 and the six-monthperiod ended June 30, 201560%
0%
-60%
-20%
-40%
40%
20%
June 302015
18.3%
2005Dec. 31
31.2%
2006Dec. 31
14.5%
2007Dec. 31
-39.0%
2008Dec. 31
43.7%
2009Dec. 31
11.9%
2010Dec. 31
2012Dec. 31
13.2%
2013Dec. 31
6.8%
2014Dec. 31
12.1% 9.8%
-19.4%
2011Dec. 31
Returns – Institutional SeriesFor the 12-month periods ended December 31 and the six-monthperiod ended June 30, 201560%
0%
-60%
-20%
-40%
40%
20%
June 3020152012
Dec. 31
14.4%
2013Dec. 31
7.9%
2014Dec. 31
13.3% 10.5%19.6%
2005Dec. 31
32.6%
2006Dec. 31
16.0%
2007Dec. 31
-38.4%
2008Dec. 31
45.2%
2009Dec. 31
12.9%
2010Dec. 31
-18.5%
2011Dec. 31
Summary of Investment PortfolioAs at June 30, 2015
China 20.84%Hong Kong 17.66%South Korea 17.56%Australia 15.13%India 11.21%Taiwan 8.69%Singapore 2.34%Indonesia 2.19%Thailand 1.65%Malaysia 1.43%Cash & Equivalents 1.30%Total 100.00%
6
HSBC AsiaPacific Fund
Top 25 HoldingsPercentage
of NAV
Samsung Electronics Co., Ltd. 4.83%Taiwan Semiconductor Manufacturing Co., Ltd., ADR 4.60%China Construction Bank Corp., Class H 3.71%Commonwealth Bank of Australia 3.54%National Australia Bank Ltd. 3.26%Industrial & Commercial Bank of China Ltd., Class H 3.17%BOC Hong Kong (Holdings) Ltd. 2.94%SK Hynix Inc. 2.93%Tencent Holdings Ltd. 2.91%China Mobile (Hong Kong) Ltd. 2.89%BHP Billiton Ltd. 2.56%DBS Group Holdings Ltd. 2.34%Hon Hai Precision Industry Co., Ltd., GDR 2.23%Hyundai Motor Co. 2.22%Xinyi Glass Holdings Ltd. 2.16%CK Hutchinson Holdings Ltd. 2.10%Axis Bank Ltd., Warrants (17 Aug 17) 2.07%Shimao Property Holdings Ltd. 2.05%AIA Group Ltd. 2.03%Challenger Ltd. 2.00%BNK Financial Group Inc. 1.96%Tata Motors Ltd., ADR 1.95%China Life Insurance Co., Ltd., Class H 1.94%CNOOC Ltd. 1.64%Quanta Computer Inc., Registered GDR 1.38%Total top 25 investments 65.41%
The Summary of Investment Portfolio may change due to ongoing portfolio transactions of the Fund, and is available quarterly.
7
For more information
You can find more information about HSBC Mutual Fundsin the Fund’s Simplified Prospectus, Annual InformationForm, Annual and Semi-Annual Report and Fund Facts. Youcan get a copy of these documents, as well as the Fund’sFinancial Statements, at no cost by calling 1-888-390-3333,by contacting your authorized dealer or by visiting ourwebsite at www.hsbc.ca/investment-resources.
These documents and other information about the HSBCMutual Funds, such as information circulars and materialcontracts, are also available at www.sedar.com.
Copies of the Annual Report and Semi-Annual Report,Simplified Prospectus, Annual Information Form, Annualand Interim Management Report of Fund Performanceand Fund Facts are available on our website atwww.hsbc.ca/investment-resources.
How to reach us
VancouverHSBC Global Asset Management (Canada) Limited3rd Floor, 885 West Georgia StreetVancouver, BC V6C 3E8
Tel: 1-888-390-3333Fax: 604-669-2756
TorontoSuite 300 – 70 York StreetToronto, ON M5J 1S9
MontrealSuite 300 – 2001 McGill College AvenueMontreal, QC H3A 1G1
A NOTE ON FORWARD-LOOKING STATEMENTS
This report may contain forward-looking statements about the Fund, including its strategy, expected performance and condition. Forward-lookingstatements include statements that are predictive in nature that depend upon or refer to future events or conditions, or that include words such as“expects,” “anticipates,” “intends,” “plans,” “believes,” “estimates” or negative versions thereof and similar expressions. In addition, any statement thatmay be made concerning future performance, strategies or prospects, and possible future Fund action, is also a forward-looking statement. Forward-lookingstatements are based on current expectations and projections about future events and are inherently subject to, among other things, risks, uncertaintiesand assumptions about the Fund and economic factors.
Forward-looking statements are not guarantees of future performance, and actual events and results could differ materially from those expressed or impliedin any forward-looking statements made by the Fund. Any number of important factors could contribute to these digressions, including, but not limited to,general economic, political and market factors in North America and internationally, interest and foreign exchange rates, global equity and capital markets,business competition, technological change, changes in government regulations, unexpected judicial or regulatory proceedings, and catastrophic events.
We stress that the above-mentioned list of important factors is not exhaustive. We encourage you to consider these and other factors carefully beforemaking any investment decisions and we urge you to avoid placing undue reliance on forward-looking statements. Further, you should be aware of the factthat the Fund has no specific intention of updating any forward-looking statements, whether as a result of new information, future events or otherwise.
Sources: HSBC Global Asset Management (Canada) Limited, Bloomberg, MSCI, Bank of Canada.
Neither MSCI nor any other party involved in or related to compiling, computing or creating the MSCI data makes any express or implied warranties orrepresentations with respect to such data (or the results to be obtained by the use thereof), and all such parties hereby expressly disclaim all warranties oforiginality, accuracy, completeness, merchantability or fitness for a particular purpose with respect to any of such data. Without limiting any of theforegoing, in no event shall MSCI, any of its affiliates or any third party involved in or related to compiling, computing or creating the data have any liabilityfor any direct, indirect, special, punitive, consequential or any other damages (including lost profits) even if notified of the possibility of such damages. Nofurther distribution or dissemination of the MSCI data is permitted without MSCI’s express written consent.
Unauthorized reproduction, distribution, transmission or publication without our prior written consent is strictly prohibited.
Issued byHSBC Global Asset Management (Canada) Limited (2
015-
08)R
RD
HSBC Global Real Estate Equity Fund
Interim Management Report of Fund Performance
for the six months ended June 30, 2015
HSBC Global Real Estate Equity Fund
Management Discussion of Fund PerformanceIn this document, you and your refer to the unitholder of the Fund;we, us and our refer to HSBC Global Asset Management (Canada)Limited; and the Fund refers to the HSBC Global Real EstateEquity Fund.
We are the manager, trustee and primary investment advisor ofthe Fund.
IntroductionThis Interim Management Report of Fund Performance containsfinancial highlights but does not contain the complete annual or semi-annual financial statements of the investment fund. You may obtain acopy of the Fund’s annual or semi-annual financial statements at yourrequest, at no cost, by calling us toll-free at 1-888-390-3333, by visitingour website at www.hsbc.ca/investment-resources, by visiting theSEDAR website at www.sedar.com or by writing to us at:
Corporate SecretaryHSBC Global Asset Management (Canada) Limited3rd Floor, 885 West Georgia StreetVancouver, BC V6C 3E8
You may also contact us using one of these methods to request acopy of the Fund’s proxy voting policies and procedures, proxyvoting disclosure record or quarterly statement of investmentportfolio.
Results of OperationsThis Fund was created on June 25, 2014, but as of June 30, 2015,it had not begun investing according to its strategy.
Recent DevelopmentsThis Fund was created on June 25, 2014, but as of June 30, 2015,it had not begun investing according to its strategy.
On May 28, 2015 we announced the closure of this Fund, and theFund was closed on July 31, 2015.
Related Party TransactionsWe, on behalf of the Fund, or the Fund Manager, may, from timeto time, enter into transactions or arrangements with or involvingother members of the HSBC Group or other people or companiesrelated or connected to us or the Fund. To proceed with thetransactions, the Fund relies on the positive recommendation ofthe Fund’s Independent Review Committee. A condition of thispositive recommendation is that the transactions are performed inaccordance with our policy on Related Party Transactions. Formore general information on persons related to the Fund and thetypes of potential transactions, see the Fund’s SimplifiedProspectus.
The following is a summary of current transactions andarrangements with entities that are related to us or the Fund.
Manager, Trustee and Investment AdvisorWe are the manager, trustee and primary investment advisor ofthe Fund. As manager, we manage the overall business andoperations of the Fund. As trustee, we hold legal title to theproperty of the Fund on your behalf. As primary investmentadvisor, we provide investment advice and portfolio managementservices to the Fund. We receive a fee from the Fund for theseservices based on assets under management, calculated daily andpaid monthly.
Distribution ServicesThe Fund is distributed through us, HSBC Investment Funds(Canada) Inc. (our wholly owned subsidiary); HSBC Private WealthServices (Canada) Inc. and through HSBC Securities (Canada) Inc.(an affiliate) directly or through its division, HSBC InvestDirect. Wepay distribution and servicing fees to them based on the amountof assets held in the investor’s account, and additionally, in somecases, on the amount of the initial purchase. If you hold units ofthis Fund and/or other HSBC Mutual Funds in a registered planwith HSBC Investment Funds (Canada) Inc., they may charge youan annual fee to cover the annual administration costs of the plan.We permit HSBC Investment Funds (Canada) Inc. to collect thesefees by redeeming sufficient units of the Fund with the highestmarket value in your registered plan.
Financial HighlightsThe following tables show selected key financial information aboutthe Fund and are intended to help you understand the Fund’sfinancial performance for the six-month period ended June 30,2015 and for the last five years ended December 31, as applicable.In the year a fund is established, “period” represents the periodfrom inception to December 31 or June 30 of that fiscal year, asapplicable. This information is derived from the Fund’s unauditedsemi-annual financial statements and audited annual financialstatements. The information in the following tables is based onprescribed regulations, and as a result, is not expected to add dueto the increase/decrease in net assets from operations beingbased on average units outstanding during the period and all othernumbers being based on actual units outstanding at the relevantpoint in time.
1
HSBC Global Real Estate Equity Fund
HSBC Global Real Estate Equity Fund –Investor Series – Net Assets per Unit (1)
Period ended June 30, 2015 (unaudited)and year ended December 31 Inception: June 2014
June 30
2015
Dec. 31
2014
Net assets per unit, beginning of period (2) $10.00 $10.00
Total increase (decrease) from operations (2) $– $–
Distributions to unitholders:
From income (excluding dividends) – –From dividends – –From capital gains – –From return of capital – –
Total annual distributions (2,3) $– $–
Net assets per unit, end of period (2) $10.00 $10.00
Ratios and Supplemental DataJune 30
2015
Dec. 31
2014
NAV (in 000s) (4) $–* $–*Units outstanding (in 000s) (4) –* –*Management expense ratio (“MER”) (5) – –MER before absorbed or waived fees (5) – –Portfolio turnover rate (6) – –Trading expense ratio (7) – –NAV per unit (4) $10.00 $10.00
* Amount less than one thousand.
(1) This information is derived from the Fund’s unaudited semi-annualfinancial statements and audited annual financial statements. The netassets per unit presented in the financial statements differ from thenet asset value calculated for fund pricing purposes.
(2) Net assets per unit and distributions per unit are based on the actualnumber of units outstanding for the relevant series at the relevanttime. The increase/decrease in net assets from operations per unit isbased on the weighted average number of units outstanding for therelevant series over the fiscal period.
(3) Distributions are automatically reinvested in additional units of theFund, unless the unitholder withdraws from the automaticreinvestment plan by providing written notice to us.
(4) This information is provided as at period-end.
(5) MER includes the total expenses of each Fund, including the Goodsand Services Tax and/or Harmonized Sales Tax thereon, other thanbrokerage commissions on securities transactions and any foreignwithholding taxes on income, as an annualized percentage of averagenet asset value (“NAV”) of the respective series of unit for the period.In the period a series is established, the MER is annualized from thedate of inception to the end of the period. The MER may vary fromone mutual fund to another and from one series of units to another.We may have waived or absorbed certain fees and expensesotherwise payable by the Fund. The amount of expenses absorbed orwaived is at the discretion of and can be terminated at any time by us.
(6) The Fund’s portfolio turnover rate indicates how actively the Fund’sportfolio advisor manages its portfolio investments. A portfolioturnover rate of 100% is equivalent to the Fund buying and selling allof the securities in its portfolio once in the course of the period. Thehigher the Fund’s portfolio turnover rate in a period, the greater thetrading costs payable by the Fund in the period, and the greater thechance of an investor receiving taxable capital gains in the period.There is not necessarily a relationship between a high turnover rateand the performance of the Fund. The rate is calculated based on thelesser of purchases or sales of securities divided by the averageweighted market value of the portfolio securities, excluding short-termsecurities.
(7) The trading expense ratio represents commissions and other portfoliotransaction costs expressed as an annualized percentage of dailyaverage net asset value during the period.
Past PerformanceAs at June 30, 2015, the Fund has not begun investing accordingto its strategy.
2
For more information
You can find more information about HSBC Mutual Fundsin the Fund’s Simplified Prospectus, Annual InformationForm, Annual and Semi-Annual Report and Fund Facts. Youcan get a copy of these documents, as well as the Fund’sFinancial Statements, at no cost by calling 1-888-390-3333,by contacting your authorized dealer or by visiting ourwebsite at www.hsbc.ca/investment-resources.
These documents and other information about the HSBCMutual Funds, such as information circulars and materialcontracts, are also available at www.sedar.com.
Copies of the Annual Report and Semi-Annual Report,Simplified Prospectus, Annual Information Form, Annualand Interim Management Report of Fund Performanceand Fund Facts are available on our website atwww.hsbc.ca/investment-resources.
How to reach us
VancouverHSBC Global Asset Management (Canada) Limited3rd Floor, 885 West Georgia StreetVancouver, BC V6C 3E8
Tel: 1-888-390-3333Fax: 604-669-2756
TorontoSuite 300 – 70 York StreetToronto, ON M5J 1S9
MontrealSuite 300 – 2001 McGill College AvenueMontreal, QC H3A 1G1
A NOTE ON FORWARD-LOOKING STATEMENTS
This report may contain forward-looking statements about the Fund, including its strategy, expected performance and condition. Forward-lookingstatements include statements that are predictive in nature that depend upon or refer to future events or conditions, or that include words such as“expects,” “anticipates,” “intends,” “plans,” “believes,” “estimates” or negative versions thereof and similar expressions. In addition, any statement thatmay be made concerning future performance, strategies or prospects, and possible future Fund action, is also a forward-looking statement. Forward-lookingstatements are based on current expectations and projections about future events and are inherently subject to, among other things, risks, uncertaintiesand assumptions about the Fund and economic factors.
Forward-looking statements are not guarantees of future performance, and actual events and results could differ materially from those expressed or impliedin any forward-looking statements made by the Fund. Any number of important factors could contribute to these digressions, including, but not limited to,general economic, political and market factors in North America and internationally, interest and foreign exchange rates, global equity and capital markets,business competition, technological change, changes in government regulations, unexpected judicial or regulatory proceedings, and catastrophic events.
We stress that the above-mentioned list of important factors is not exhaustive. We encourage you to consider these and other factors carefully beforemaking any investment decisions and we urge you to avoid placing undue reliance on forward-looking statements. Further, you should be aware of the factthat the Fund has no specific intention of updating any forward-looking statements, whether as a result of new information, future events or otherwise.
Sources: HSBC Global Asset Management (Canada) Limited, Bloomberg, MSCI, Bank of Canada.
Neither MSCI nor any other party involved in or related to compiling, computing or creating the MSCI data makes any express or implied warranties orrepresentations with respect to such data (or the results to be obtained by the use thereof), and all such parties hereby expressly disclaim all warranties oforiginality, accuracy, completeness, merchantability or fitness for a particular purpose with respect to any of such data. Without limiting any of theforegoing, in no event shall MSCI, any of its affiliates or any third party involved in or related to compiling, computing or creating the data have any liabilityfor any direct, indirect, special, punitive, consequential or any other damages (including lost profits) even if notified of the possibility of such damages. Nofurther distribution or dissemination of the MSCI data is permitted without MSCI’s express written consent.
Unauthorized reproduction, distribution, transmission or publication without our prior written consent is strictly prohibited.
Issued byHSBC Global Asset Management (Canada) Limited (2
015-
08)R
RD
HSBC Chinese Equity Fund
Interim Management Report of Fund Performance
for the six months ended June 30, 2015
HSBC Chinese Equity Fund
Management Discussion of Fund PerformanceIn this document, you and your refer to the unitholder of the Fund;we, us and our refer to HSBC Global Asset Management (Canada)Limited; and the Fund refers to the HSBC Chinese Equity Fund.
We are the manager, trustee and primary investment advisor ofthe Fund. We have entered into a sub-advisory agreement withHSBC Global Asset Management (Hong Kong) Limited, underwhich HSBC Global Asset Management (Hong Kong) Limitedprovides investment advice and portfolio management services tothe Fund. For an explanation of the relationship between us andthe sub-advisor, see the section Selection of Sub-Advisors in theFund’s Simplified Prospectus.
IntroductionThis Interim Management Report of Fund Performance containsfinancial highlights but does not contain the complete annual or semi-annual financial statements of the investment fund. You may obtain acopy of the Fund’s annual or semi-annual financial statements at yourrequest, at no cost, by calling us toll-free at 1-888-390-3333, by visitingour website at www.hsbc.ca/investment-resources, by visiting theSEDAR website at www.sedar.com or by writing to us at:
Corporate SecretaryHSBC Global Asset Management (Canada) Limited3rd Floor, 885 West Georgia StreetVancouver, BC V6C 3E8
You may also contact us using one of these methods to request acopy of the Fund’s proxy voting policies and procedures, proxyvoting disclosure record or quarterly statement of investmentportfolio.
Results of OperationsAs of June 30, 2015, the Fund’s net assets increased by 18.6% to$227.9 million from $192.2 million at the end of 2014. Of thisincrease, a $43 million gain was attributable to investmentperformance and $7.3 million was attributable to net withdrawalsfrom Fund.
Investment PerformanceThe HSBC Chinese Equity Fund (Investor Series) rose 22.54% forthe six months ending June 30, 2015, while its benchmark, theMSCI China 10/40 Net Index (in Canadian dollars), rose 23.33%during the same period.
Chinese equities made stellar gains over the first half of the year inCanadian dollar terms. The market embraced a strong start to theyear driven by the announcement of a number of favourable policymeasures, namely the cuts to the reserve requirement ratio andbenchmark interest rates. This was followed by the broadening ofaccess to the southbound Shanghai-Hong Kong Stock Connect forChina’s mutual funds, as well as the Mutual Recognition of Funds
(MRF) initiative. However, Chinese equities consolidated goinginto the end of the second quarter, alongside a correction in theonshore market, which was triggered by concerns over domesticIPO liquidity and margin finance tightening.
The Fund made strong absolute gains over the period, but slightlyunderperformed the Index due to stock selection. Theinvestments in financials were positive, mainly driven by theselections within diversified financial and property names.Selection in industrials also boosted relative performance, with anairline being a notable contributor on the back of falling oil pricesand an uptrend in customer traffic. Sector allocation was alsopositive because of the underweight position in energy. However,these positives were outweighed somewhat by the selections ininformation technology, consumer discretionaries and healthcare.
Recent DevelopmentsRecent volatility in Chinese equity markets has led to a raft ofpositive policy responses to support the market. The FundManager believes the Chinese government could potentiallyintensify policy support to the financial sector if there are moresigns of risks spreading to the real economy and other assetmarkets, such as real estate.
The Fund Manager continues to like sectors and stocks with lowmacroeconomic correlation and strong earnings growth prospects,and those that stand to gain from reforms. They are currentlyfinding opportunities within the property sector, given monetarypolicies and property easing measures. They also like banks fortheir defensive qualities – attractive valuations with good dividendyield. The Fund Manager likes the renewable-environmentalnames, given rising public environmental consciousness andstrong policy support. Independent power producers shouldbenefit as falling coal prices will potentially lead to higher earnings.The Fund Manager also likes logistics companies that can benefitfrom the acceleration in e-commerce business.
Related Party TransactionsWe, on behalf of the Fund, or the Fund Manager, may, from timeto time, enter into transactions or arrangements with or involvingother members of the HSBC Group or other people or companiesrelated or connected to us or the Fund. To proceed with thetransactions, the Fund relies on the positive recommendation ofthe Fund’s Independent Review Committee. A condition of thispositive recommendation is that the transactions are performed inaccordance with our policy on Related Party Transactions. Formore general information on persons related to the Fund and thetypes of potential transactions, see the Fund’s SimplifiedProspectus.
The following is a summary of current transactions andarrangements with entities that are related to us or the Fund.
1
HSBC Chinese Equity Fund
Manager, Trustee and Investment AdvisorWe are the manager, trustee and primary investment advisor ofthe Fund. As manager, we manage the overall business andoperations of the Fund. As trustee, we hold legal title to theproperty of the Fund on your behalf. As primary investmentadvisor, we provide investment advice and portfolio managementservices to the Fund. We receive a fee from the Fund for theseservices based on assets under management, calculated daily andpaid monthly. We have entered into a sub-advisory agreementwith HSBC Global Asset Management (Hong Kong) Limited(an affiliate), under which HSBC Global Asset Management (HongKong) Limited provides investment advice and portfoliomanagement services to the Fund. We pay HSBC Global AssetManagement (Hong Kong) Limited a fee from the Fund based onassets under management, calculated daily and paid quarterly. Formore information on our ability to hire sub-advisors, see thesection Organization and Management of the HSBC Mutual Fundsin the Fund’s Simplified Prospectus.
Distribution ServicesThe Fund is distributed through us, HSBC Investment Funds(Canada) Inc. (our wholly owned subsidiary); HSBC Private WealthServices (Canada) Inc. and through HSBC Securities (Canada) Inc.(an affiliate) directly or through its division, HSBC InvestDirect. Wepay distribution and servicing fees to them based on the amountof assets held in the investor’s account, and additionally, in somecases, on the amount of the initial purchase. If you hold units ofthis Fund and/or other HSBC Mutual Funds in a registered planwith HSBC Investment Funds (Canada) Inc., they may charge youan annual fee to cover the annual administration costs of the plan.We permit HSBC Investment Funds (Canada) Inc. to collect thesefees by redeeming sufficient units of the Fund with the highestmarket value in your registered plan.
Related Brokerage CommissionsFrom time to time, the Fund may enter into purchases and salesof securities, derivative instruments, foreign exchange contracts orother instruments with The Hong Kong & Shanghai BankingCorporation Limited, HSBC Securities (Asia) Ltd. other dealers thatare members of the HSBC Group (“Related Brokers”). TheseRelated Brokers may earn commissions or spreads provided thatsuch trades are made on terms and conditions comparable tothose offered by or to unrelated parties. During the period, theFund paid commissions to HSBC Broking Services (Asia) Limitedamounting to $17,734 (December 31, 2014 – $57,347).
Financial HighlightsThe following tables show selected key financial information aboutthe Fund and are intended to help you understand the Fund’sfinancial performance for the six-month period ended June 30,2015 and for the last five years ended December 31, as applicable.
In the year a fund is established, “period” represents the periodfrom inception to December 31 or June 30 of that fiscal year, asapplicable. This information is derived from the Fund’s unauditedsemi-annual financial statements and audited annual financialstatements. The information in the following tables is based onprescribed regulations, and as a result, is not expected to add dueto the increase/decrease in net assets from operations beingbased on average units outstanding during the period and all othernumbers being based on actual units outstanding at the relevantpoint in time.
HSBC Chinese Equity Fund – Investor Series –Net Assets per Unit (1)
Period ended June 30, 2015 (unaudited)and years ended December 31 Inception: December 2003
June 30
2015
Dec. 31
2014
Dec. 31
2013
Dec. 31
2012
Dec. 31
2011
Dec. 31
2010
Net assets per unit,beginning of period (2) $24.10 $20.39 $18.27 $15.68 $19.42 $20.73
(1) This information is derived from the Fund’s unaudited semi-annualfinancial statements and audited annual financial statements. The netassets per unit presented in the financial statements differ from thenet asset value calculated for fund pricing purposes.
(2) Net assets per unit and distributions per unit are based on the actualnumber of units outstanding for the relevant series at the relevanttime. The increase/decrease in net assets from operations per unit isbased on the weighted average number of units outstanding for therelevant series over the fiscal period.
(3) Distributions are automatically reinvested in additional units of theFund, unless the unitholder withdraws from the automaticreinvestment plan by providing written notice to us.
(4) This information is provided as at period-end.
(5) MER includes the total expenses of each Fund, including the Goodsand Services Tax and/or Harmonized Sales Tax thereon, other thanbrokerage commissions on securities transactions and any foreignwithholding taxes on income, as an annualized percentage of averagenet asset value (“NAV”) of the respective series of unit for the period.
4
HSBC Chinese Equity Fund
In the period a series is established, the MER is annualized from thedate of inception to the end of the period. The MER may vary fromone mutual fund to another and from one series of units to another.We may have waived or absorbed certain fees and expensesotherwise payable by the Fund. The amount of expenses absorbed orwaived is at the discretion of and can be terminated at any time by us.
(6) The Fund’s portfolio turnover rate indicates how actively the Fund’sportfolio advisor manages its portfolio investments. A portfolio turnoverrate of 100% is equivalent to the Fund buying and selling all of thesecurities in its portfolio once in the course of the period. The higher theFund’s portfolio turnover rate in a period, the greater the trading costspayable by the Fund in the period, and the greater the chance of aninvestor receiving taxable capital gains in the period. There is notnecessarily a relationship between a high turnover rate and theperformance of the Fund. The rate is calculated based on the lesser ofpurchases or sales of securities divided by the average weighted marketvalue of the portfolio securities, excluding short-term securities.
(7) The trading expense ratio represents commissions and other portfoliotransaction costs expressed as an annualized percentage of dailyaverage net asset value during the period.
Management FeesFor the six months ended June 30, 2015, the Fund paid usmanagement fees of $2,365,398. The management fee for eachseries is calculated as a percentage of the daily net asset value forthat series. The fees are reduced, where required, so that thesefees do not duplicate fees payable by mutual funds in which theFund invests for the same service.
The Fund’s management fees were used by us to pay costs formanaging the investment portfolio, providing investment analysisand recommendations, making investment decisions, makingbrokerage arrangements for the purchase and sale of theinvestment portfolio and providing other services. Themanagement fees also funded commission payments and othercompensation to sales representatives and registered dealers andbrokers (collectively “distribution costs”), including HSBC BankCanada, for units of the Fund bought and held by unitholders.Finally, we used management fees to pay for additional marketingand distribution services to the Fund.
For the six months ended June 30, 2015, approximately 45% ofthe total management fees collected from all HSBC Mutual Fundswere used to fund distribution costs. In comparison, for the Fund,such distribution costs represented 43% of the management feescollected. This may vary by series depending on the assetsinvested in each of the series.
Past PerformanceThe performance information shown assumes that all distributionsmade by the Fund in the periods shown were reinvested inadditional securities of the Fund. The performance informationdoes not take into account sales, redemption, distribution, optionalcharges or expenses you may be charged outside of the Fund orthe effect of any income tax you may have to pay as a result of
your investment in the Fund that would have reduced returns orperformance. The Fund’s past performance does not necessarilyindicate how it will perform in the future.
Year-by-Year ReturnsThe following bar charts show the Fund’s performance for thesix-month period ended June 30, 2015, and for each of theprevious 12-month periods ended December 31. In percentageterms, the bar charts show how much an investment made on thefirst day of each financial period would have grown or decreasedby the last day of each financial period.
Returns – Investor SeriesFor the 12-month periods ended December 31 and the six-monthperiod ended June 30, 2015100%
0%
-60%
20%
40%
-40%
-20%
60%
80%
Dec. 312005
7.2%
Dec. 312006
80.3%
Dec. 312007
35.0%
Dec. 312008
-43.4%Dec. 31
2009
36.9%
Dec. 312010
-6.2%
Dec. 312011
-19.3%
Dec. 312012
16.5%
Dec. 312013
11.8% 18.3% 22.5%
June 302015
Dec. 312014
Returns – Advisor SeriesFor the 12-month periods ended December 31 and the six-monthperiod ended June 30, 2015100%
0%
-60%
20%
40%
-40%
-20%
60%
80%
Dec. 312005
7.3%
Dec. 312006
80.6%
Dec. 312007
35.0%
Dec. 312008
-43.5%Dec. 31
2009
36.8%
Dec. 312012
16.5% 18.3%
Dec. 312013
11.7%22.5%
June 302015
Dec. 312014
Dec. 312010
-6.2%
Dec. 312011
-19.3%
Returns – Premium SeriesFor the 12-month periods ended December 31 and the six-monthperiod ended June 30, 2015100%
-40%
-60%
20%
0%
80%
60%
40%
-20%
Dec. 312011
-18.9%
Dec. 312012
17.1%
Dec. 312013
12.3%
Dec. 312014
19.0% 22.9%
June 302015
5
HSBC Chinese Equity Fund
Returns – Manager SeriesFor the 12-month periods ended December 31 and the six-monthperiod ended June 30, 2015100%
0%
-60%Dec. 31
2005Dec. 31
2006Dec. 31
2007Dec. 31
2008Dec. 31
2009Dec. 31
2010Dec. 31
2011June 30
2015Dec. 31
2014Dec. 31
2012
20%
40%
-40%
-20%
60%
80%
8.4%
82.1%
36.4%
-42.8%
38.2%
17.8%
Dec. 312013
13.0% 19.6% 23.0%
-5.2%-18.4%
Returns – Institutional SeriesFor the 12-month periods ended December 31 and the six-monthperiod ended June 30, 2015100%
0%
-60%Dec. 31
2005Dec. 31
2006Dec. 31
2007Dec. 31
2008Dec. 31
2009Dec. 31
2010Dec. 31
2011Dec. 31
2012June 30
2015Dec. 31
2014
20%
40%
-40%
-20%
60%
80%
9.8%19.4%
Dec. 312013
14.6% 21.2% 24.0%
84.6%
38.2%
-42.0%
40.0%
-3.9%-17.3%
Summary of Investment PortfolioAs at June 30, 2015
Tencent Holdings Ltd. 9.79%China Construction Bank Corp., Class H 9.48%Industrial & Commercial Bank of China Ltd., Class H 8.44%Ping An Insurance (Group) Co. of China Ltd., Class H 6.49%China Life Insurance Co., Ltd., Class H 4.34%China Resources Land Ltd. 4.25%China Mobile Ltd. 3.68%Agricultural Bank of China Ltd. 3.29%China Petroleum & Chemical Corp., Class H 3.27%Chongqing Changan Automobile Co., Ltd., Class B 2.89%Zhuzhou CSR Times Electric Co., Ltd. 1.63%China Overseas Land & Investment Ltd. 1.53%Fosun International Ltd. 1.44%Sinopharm Group Co., Ltd., Class H 1.40%China Merchants Bank Co., Ltd., Class H 1.36%PetroChina Co., Ltd., Class H 1.32%China Railway Construction Corp., Ltd., Class H 1.18%China Taiping Insurance Holdings Co., Ltd. 1.14%CNOOC Ltd. 1.14%China State Construction International Holdings Ltd. 1.12%Bank of China Ltd. 1.08%CSI Properties Ltd. 1.05%Alibaba Group Holding Ltd., ADR 1.04%Huaneng Renewables Corp., Ltd., Class H 1.04%Lenovo Group Ltd. 0.96%Total top 25 investments 74.35%
The Summary of Investment Portfolio may change due to ongoing portfolio transactions of the Fund, and is available quarterly.
6
For more information
You can find more information about HSBC Mutual Fundsin the Fund’s Simplified Prospectus, Annual InformationForm, Annual and Semi-Annual Report and Fund Facts. Youcan get a copy of these documents, as well as the Fund’sFinancial Statements, at no cost by calling 1-888-390-3333,by contacting your authorized dealer or by visiting ourwebsite at www.hsbc.ca/investment-resources.
These documents and other information about the HSBCMutual Funds, such as information circulars and materialcontracts, are also available at www.sedar.com.
Copies of the Annual Report and Semi-Annual Report,Simplified Prospectus, Annual Information Form, Annualand Interim Management Report of Fund Performanceand Fund Facts are available on our website atwww.hsbc.ca/investment-resources.
How to reach us
VancouverHSBC Global Asset Management (Canada) Limited3rd Floor, 885 West Georgia StreetVancouver, BC V6C 3E8
Tel: 1-888-390-3333Fax: 604-669-2756
TorontoSuite 300 – 70 York StreetToronto, ON M5J 1S9
MontrealSuite 300 – 2001 McGill College AvenueMontreal, QC H3A 1G1
A NOTE ON FORWARD-LOOKING STATEMENTS
This report may contain forward-looking statements about the Fund, including its strategy, expected performance and condition. Forward-lookingstatements include statements that are predictive in nature that depend upon or refer to future events or conditions, or that include words such as“expects,” “anticipates,” “intends,” “plans,” “believes,” “estimates” or negative versions thereof and similar expressions. In addition, any statement thatmay be made concerning future performance, strategies or prospects, and possible future Fund action, is also a forward-looking statement. Forward-lookingstatements are based on current expectations and projections about future events and are inherently subject to, among other things, risks, uncertaintiesand assumptions about the Fund and economic factors.
Forward-looking statements are not guarantees of future performance, and actual events and results could differ materially from those expressed or impliedin any forward-looking statements made by the Fund. Any number of important factors could contribute to these digressions, including, but not limited to,general economic, political and market factors in North America and internationally, interest and foreign exchange rates, global equity and capital markets,business competition, technological change, changes in government regulations, unexpected judicial or regulatory proceedings, and catastrophic events.
We stress that the above-mentioned list of important factors is not exhaustive. We encourage you to consider these and other factors carefully beforemaking any investment decisions and we urge you to avoid placing undue reliance on forward-looking statements. Further, you should be aware of the factthat the Fund has no specific intention of updating any forward-looking statements, whether as a result of new information, future events or otherwise.
Sources: HSBC Global Asset Management (Canada) Limited, Bloomberg, MSCI, Bank of Canada.
Neither MSCI nor any other party involved in or related to compiling, computing or creating the MSCI data makes any express or implied warranties orrepresentations with respect to such data (or the results to be obtained by the use thereof), and all such parties hereby expressly disclaim all warranties oforiginality, accuracy, completeness, merchantability or fitness for a particular purpose with respect to any of such data. Without limiting any of theforegoing, in no event shall MSCI, any of its affiliates or any third party involved in or related to compiling, computing or creating the data have any liabilityfor any direct, indirect, special, punitive, consequential or any other damages (including lost profits) even if notified of the possibility of such damages. Nofurther distribution or dissemination of the MSCI data is permitted without MSCI’s express written consent.
Unauthorized reproduction, distribution, transmission or publication without our prior written consent is strictly prohibited.
Issued byHSBC Global Asset Management (Canada) Limited (2
015-
08)R
RD
HSBC Indian Equity Fund
Interim Management Report of Fund Performance
for the six months ended June 30, 2015
HSBC Indian Equity Fund
Management Discussion of Fund PerformanceIn this document, you and your refer to the unitholder of the Fund;we, us and our refer to HSBC Global Asset Management (Canada)Limited; and the Fund refers to the HSBC Indian Equity Fund.
We are the manager, trustee and primary investment advisor ofthe Fund. We have entered into a sub-advisory agreement withHSBC Global Asset Management (Hong Kong) Limited, underwhich HSBC Global Asset Management (Hong Kong) Limitedprovides investment advice and portfolio management services tothe Fund. For an explanation of the relationship between us andthe sub-advisor, see the section Selection of Sub-Advisors in theFund’s Simplified Prospectus.
IntroductionThis Interim Management Report of Fund Performance containsfinancial highlights but does not contain the complete annual or semi-annual financial statements of the investment fund. You may obtain acopy of the Fund’s annual or semi-annual financial statements at yourrequest, at no cost, by calling us toll-free at 1-888-390-3333, byvisiting our website at www.hsbc.ca/investment-resources, byvisiting the SEDAR website at www.sedar.com or by writing to us at:
Corporate SecretaryHSBC Global Asset Management (Canada) Limited3rd Floor, 885 West Georgia StreetVancouver, BC V6C 3E8
You may also contact us using one of these methods to request acopy of the Fund’s proxy voting policies and procedures, proxyvoting disclosure record or quarterly statement of investmentportfolio.
Results of OperationsAs of June 30, 2015, the Fund’s net assets increased by 2.1% to$29.8 million from $29.2 million at the end of 2014. Of thisincrease, a $0.8 million gain was attributable to investmentperformance and $0.2 million was attributable to net withdrawalsfrom Fund.
Investment PerformanceThe HSBC Indian Equity Fund (Investor Series) rose 2.45% for thesix months ending June 30, 2015, while its benchmark, the S&P/IFC Emerging Markets India Index (in Canadian dollars), rose10.81% for the same period.
The market made strong gains in Canadian-dollar terms in the firsthalf of 2015. The market was supported by several rate cutsduring the period. Markets were also encouraged by thegovernment’s 2016 budget, which appeared to be a fine balancingact between fiscal prudence and investment-led growth. Thebudget also focused on sustainable medium-term growth ratherthan any immediate shake-ups. Inflation trended down in the first
half of the year, giving the central bank move to room on rates.Telecommunications and healthcare were the best-performingsectors, while utilities, materials and consumer discretionarylagged the broader market.
The Fund underperformed the benchmark in the first half of 2015.Key detractors included an automaker that delivered poor resultsand a steel and power company, which was negatively impactedby news that its winning bid in a re-auction of its coal mining blockwas rejected by the government. Another automaker was a goodperformer for the Fund on strong sales results. A real estate andhousing finance conglomerate benefited from rate cuts that willbring down its wholesale funding costs. The Fund’s underweightposition to healthcare and telecommunications also weighed onperformance as defensives fared better than cyclicals during theperiod.
Recent DevelopmentsThe Fund Manager expects India’s GDP to recover from threeyears of below-trend growth and accelerate further on the back ofsome structural reforms. The Fund Manager also expects to seeboth reduced operating and financial leverage benefiting earningsof the companies in which they are invested much more than thedefensive part of the market. With a rebound in GDP, corporateearnings are bound to recover and revert to mean profitability. Thiswould be a tailwind for valuations, which are currently marginallyabove long-term averages.
While equity returns may be more volatile in the short term, theyshould compare favourably with other asset classes. At the end ofJune 2015, the strategy was overweight to Taiwan, India, Turkeyand Saudi Arabia and underweight to South Africa, Mexico, Chinaand Malaysia. While sector weightings are largely an outcome ofthe Fund Manager’s stock views, the current sector tilts relative totheir reference index see the largest overweight positions infinancials, energy and IT, with underweight positions in consumerstaples, industrials and telecommunications.
Related Party TransactionsWe, on behalf of the Fund, or the Fund Manager, may, from time totime, enter into transactions or arrangements with or involving othermembers of the HSBC Group or other people or companies relatedor connected to us or the Fund. To proceed with the transactions,the Fund relies on the positive recommendation of the Fund’sIndependent Review Committee. A condition of this positiverecommendation is that the transactions are performed inaccordance with our policy on Related Party Transactions. For moregeneral information on persons related to the Fund and the types ofpotential transactions, see the Fund’s Simplified Prospectus.
The following is a summary of current transactions andarrangements with entities that are related to us or the Fund.
1
HSBC Indian Equity Fund
Manager, Trustee and Investment AdvisorWe are the manager, trustee and primary investment advisor ofthe Fund. As manager, we manage the overall business andoperations of the Fund. As trustee, we hold legal title to theproperty of the Fund on your behalf. As primary investmentadvisor, we provide investment advice and portfolio managementservices to the Fund. We receive a fee from the Fund for theseservices based on assets under management, calculated daily andpaid monthly. We have entered into a sub-advisory agreementwith HSBC Global Asset Management (Hong Kong) Limited (anaffiliate), under which HSBC Global Asset Management(Hong Kong) Limited provides investment advice and portfoliomanagement services to the Fund. We pay HSBC Global AssetManagement (Hong Kong) Limited a fee from the Fund based onassets under management, calculated daily and paid quarterly. Formore information on our ability to hire sub-advisors, see thesection Organization and Management of the HSBC Mutual Fundsin the Fund’s Simplified Prospectus.
Distribution ServicesThe Fund is distributed through us, HSBC Investment Funds(Canada) Inc. (our wholly owned subsidiary); HSBC Private WealthServices (Canada) Inc. and through HSBC Securities (Canada) Inc.(an affiliate) directly or through its division, HSBC InvestDirect. Wepay distribution and servicing fees to them based on the amountof assets held in the investor’s account, and additionally, in somecases, on the amount of the initial purchase. If you hold units ofthis Fund and/or other HSBC Mutual Funds in a registered planwith HSBC Investment Funds (Canada) Inc., they may charge youan annual fee to cover the annual administration costs of the plan.We permit HSBC Investment Funds (Canada) Inc. to collect thesefees by redeeming sufficient units of the Fund with the highestmarket value in your registered plan.
Related Brokerage CommissionsFrom time to time, the Fund may enter into purchases and salesof securities, derivative instruments, foreign exchange contracts orother instruments with The Hong Kong & Shanghai BankingCorporation Limited, HSBC Securities (Asia) Ltd. or other dealersthat are members of the HSBC Group (“Related Brokers”). TheseRelated Brokers may earn commissions or spreads provided thatsuch trades are made on terms and conditions comparable tothose offered by or to unrelated parties. During the period, theFund paid commissions to HSBC Broking Services (Asia) Limitedamounting to $866 (December 31, 2014 – $220).
Financial HighlightsThe following tables show selected key financial information aboutthe Fund and are intended to help you understand the Fund’sfinancial performance for the six-month period ended June 30, 2015and for the last five years ended December 31, as applicable. In theyear a fund is established, “period” represents the period from
inception to December 31 or June 30 of that fiscal year, asapplicable. This information is derived from the Fund’s unauditedsemi-annual financial statements and audited annual financialstatements. The information in the following tables is based onprescribed regulations, and as a result, is not expected to add due tothe increase/decrease in net assets from operations being based onaverage units outstanding during the period and all other numbersbeing based on actual units outstanding at the relevant point in time.
HSBC Indian Equity Fund – Investor Series –Net Assets per Unit (1)
Period ended June 30, 2015 (unaudited)and years ended December 31 Inception: December 2008
June 30
2015
Dec. 31
2014
Dec. 31
2013
Dec. 31
2012
Dec. 31
2011
Dec. 31
2010
Net assets per unit,beginning of period (2) $10.10 $7.05 $7.78 $5.86 $11.17 $10.27
(1) This information is derived from the Fund’s unaudited semi-annualfinancial statements and audited annual financial statements. The netassets per unit presented in the financial statements differ from thenet asset value calculated for fund pricing purposes.
(2) Net assets per unit and distributions per unit are based on the actualnumber of units outstanding for the relevant series at the relevanttime. The increase/decrease in net assets from operations per unit isbased on the weighted average number of units outstanding for therelevant series over the fiscal period.
(3) Distributions are automatically reinvested in additional units of theFund, unless the unitholder withdraws from the automaticreinvestment plan by providing written notice to us.
(4) This information is provided as at period-end.
(5) MER includes the total expenses of each Fund, including the Goodsand Services Tax and/or Harmonized Sales Tax thereon, other thanbrokerage commissions on securities transactions and any foreignwithholding taxes on income, as an annualized percentage of averagenet asset value (“NAV”) of the respective series of unit for the period.In the period a series is established, the MER is annualized from thedate of inception to the end of the period. The MER may vary from
4
HSBC Indian Equity Fund
one mutual fund to another and from one series of units to another.We may have waived or absorbed certain fees and expensesotherwise payable by the Fund. The amount of expenses absorbed orwaived is at the discretion of and can be terminated at any time by us.
(6) The Fund’s portfolio turnover rate indicates how actively the Fund’sportfolio advisor manages its portfolio investments. A portfolio turnoverrate of 100% is equivalent to the Fund buying and selling all of thesecurities in its portfolio once in the course of the period. The higher theFund’s portfolio turnover rate in a period, the greater the trading costspayable by the Fund in the period, and the greater the chance of aninvestor receiving taxable capital gains in the period. There is notnecessarily a relationship between a high turnover rate and theperformance of the Fund. The rate is calculated based on the lesser ofpurchases or sales of securities divided by the average weighted marketvalue of the portfolio securities, excluding short-term securities.
(7) The trading expense ratio represents commissions and other portfoliotransaction costs expressed as an annualized percentage of dailyaverage net asset value during the period.
Management FeesFor the six months ended June 30, 2015, the Fund paid usmanagement fees of $344,244. The management fee for eachseries is calculated as a percentage of the daily net asset value forthat series. The fees are reduced, where required, so that thesefees do not duplicate fees payable by mutual funds in which theFund invests for the same service.
The Fund’s management fees were used by us to pay costs formanaging the investment portfolio, providing investment analysisand recommendations, making investment decisions, makingbrokerage arrangements for the purchase and sale of theinvestment portfolio and providing other services. Themanagement fees also funded commission payments and othercompensation to sales representatives and registered dealers andbrokers (collectively “distribution costs”), including HSBC BankCanada, for units of the Fund bought and held by unitholders.Finally, we used management fees to pay for additional marketingand distribution services to the Fund.
For the six months ended June 30, 2015, approximately 45% ofthe total management fees collected from all HSBC Mutual Fundswere used to fund distribution costs. In comparison, for the Fund,such distribution costs represented 38% of the management feescollected. This may vary by series depending on the assetsinvested in each of the series.
Past PerformanceThe performance information shown assumes that all distributionsmade by the Fund in the periods shown were reinvested inadditional securities of the Fund. The performance informationdoes not take into account sales, redemption, distribution, optionalcharges or expenses you may be charged outside of the Fund orthe effect of any income tax you may have to pay as a result ofyour investment in the Fund that would have reduced returns orperformance. The Fund’s past performance does not necessarilyindicate how it will perform in the future.
Year-by-Year ReturnsThe following bar charts show the Fund’s performance for thesix-month period ended June 30, 2015, and for each of theprevious 12-month periods ended December 31. In percentageterms, the bar charts show how much an investment made on thefirst day of each financial period would have grown or decreasedby the last day of each financial period.
Returns – Investor SeriesFor the 12-month periods ended December 31 and the six-monthperiod ended June 30, 201560%
20%
-20%
-60%
0%
Dec. 312010
Dec. 312011
-40%
40%
Dec. 312012
Dec. 312014
11.4%
34.3%
Dec. 312013
-9.6%
43.3%
2.4%
June 302015
-47.5%
Returns – Advisor SeriesFor the 12-month periods ended December 31 and the six-monthperiod ended June 30, 201560%
20%
-20%
-60%
0%
Dec. 312010
Dec. 312011
-40%
40%
11.4%
-47.5%Dec. 31
2012
34.4%
-9.6%
Dec. 312013
43.2%
2.3%
Dec. 312014
June 302015
Returns – Premium SeriesFor the 12-month periods ended December 31 and the six-monthperiod ended June 30, 201560%
40%
20%
-20%
-60%
0%
Dec. 312011
-40%
Dec. 312012
Dec. 312014
-47.3%
35.0%
Dec. 312013
-8.8%
44.0%
2.7%
June 302015
5
HSBC Indian Equity Fund
Returns – Manager SeriesFor the 12-month periods ended December 31 and the six-monthperiod ended June 30, 201560%
20%
-20%
-60%
0%
Dec. 312010
Dec. 312011
-40%
40%
Dec. 312012
12.6%
-47.0%
35.8%44.7%
2.9%
-8.6%
Dec. 312013
Dec. 312014
June 302015
Returns – Institutional SeriesFor the 12-month periods ended December 31 and the six-monthperiod ended June 30, 201560%
20%
-20%
-60%
0%
Dec. 312010
Dec. 312011
-40%
40%
Dec. 312012
14.1%
-46.2%
37.7%
Dec. 312014
46.8%
3.6%
-7.3%
June 302015
Dec. 312013
Summary of Investment PortfolioAs at June 30, 2015
ICICI Bank Ltd. 6.14%HCL Technologies Ltd. 5.40%Tata Motors Ltd.-A-DVR 4.81%Maruti Suzuki India Ltd. 4.66%Oil and Natural Gas Corp., Ltd. 4.59%Wipro Ltd. 4.42%ITC Ltd. 4.37%Infosys Ltd., ADR 4.10%Indiabulls Housing Finance Ltd. 3.51%Axis Bank Ltd. 3.13%Glenmark Pharmaceuticals Ltd. 3.10%Housing Development Finance Corp., Ltd. 3.08%LIC Housing Finance Ltd. 2.87%Coal India Ltd. 2.61%Aditya Birla Nuvo Ltd. 2.57%Larsen & Toubro Ltd. 2.15%Axis Bank Ltd. (JPMorgan Chase & Co.) 2.06%Oil India Ltd. 2.03%Sesa Sterlite Ltd. 2.00%State Bank of India 2.00%Jindal Steel & Power Ltd. 1.69%Rural Electrification Corp., Ltd. 1.69%Reliance Industries Ltd. 1.68%Adani Ports & Special Economic Zone Ltd. 1.52%NTPC Ltd. 1.49%Total top 25 investments 77.67%
The Summary of Investment Portfolio may change due to ongoing portfolio transactions of the Fund, and is available quarterly.
6
For more information
You can find more information about HSBC Mutual Fundsin the Fund’s Simplified Prospectus, Annual InformationForm, Annual and Semi-Annual Report and Fund Facts. Youcan get a copy of these documents, as well as the Fund’sFinancial Statements, at no cost by calling 1-888-390-3333,by contacting your authorized dealer or by visiting ourwebsite at www.hsbc.ca/investment-resources.
These documents and other information about the HSBCMutual Funds, such as information circulars and materialcontracts, are also available at www.sedar.com.
Copies of the Annual Report and Semi-Annual Report,Simplified Prospectus, Annual Information Form, Annualand Interim Management Report of Fund Performanceand Fund Facts are available on our website atwww.hsbc.ca/investment-resources.
How to reach us
VancouverHSBC Global Asset Management (Canada) Limited3rd Floor, 885 West Georgia StreetVancouver, BC V6C 3E8
Tel: 1-888-390-3333Fax: 604-669-2756
TorontoSuite 300 – 70 York StreetToronto, ON M5J 1S9
MontrealSuite 300 – 2001 McGill College AvenueMontreal, QC H3A 1G1
A NOTE ON FORWARD-LOOKING STATEMENTS
This report may contain forward-looking statements about the Fund, including its strategy, expected performance and condition. Forward-lookingstatements include statements that are predictive in nature that depend upon or refer to future events or conditions, or that include words such as“expects,” “anticipates,” “intends,” “plans,” “believes,” “estimates” or negative versions thereof and similar expressions. In addition, any statement thatmay be made concerning future performance, strategies or prospects, and possible future Fund action, is also a forward-looking statement. Forward-lookingstatements are based on current expectations and projections about future events and are inherently subject to, among other things, risks, uncertaintiesand assumptions about the Fund and economic factors.
Forward-looking statements are not guarantees of future performance, and actual events and results could differ materially from those expressed or impliedin any forward-looking statements made by the Fund. Any number of important factors could contribute to these digressions, including, but not limited to,general economic, political and market factors in North America and internationally, interest and foreign exchange rates, global equity and capital markets,business competition, technological change, changes in government regulations, unexpected judicial or regulatory proceedings, and catastrophic events.
We stress that the above-mentioned list of important factors is not exhaustive. We encourage you to consider these and other factors carefully beforemaking any investment decisions and we urge you to avoid placing undue reliance on forward-looking statements. Further, you should be aware of the factthat the Fund has no specific intention of updating any forward-looking statements, whether as a result of new information, future events or otherwise.
Sources: HSBC Global Asset Management (Canada) Limited, Bloomberg, Bank of Canada.
Unauthorized reproduction, distribution, transmission or publication without our prior written consent is strictly prohibited.
Issued byHSBC Global Asset Management (Canada) Limited (2
015-
08)R
RD
HSBC Emerging Markets Fund
Interim Management Report of Fund Performance
for the six months ended June 30, 2015
HSBC Emerging Markets Fund
Management Discussion of Fund PerformanceIn this document, you and your refer to the unitholder of the Fund;we, us and our refer to HSBC Global Asset Management (Canada)Limited; and the Fund refers to the HSBC Emerging MarketsFund.
We are the manager, trustee and primary investment advisor ofthe Fund. We have entered into a sub-advisory agreement withHSBC Global Asset Management (UK) Limited, under which HSBCGlobal Asset Management (UK) Limited provides investmentadvice and portfolio management services to the Fund. For anexplanation of the relationship between us and the sub-advisor,see the section Selection of Sub-Advisors in the Fund’s SimplifiedProspectus.
IntroductionThis Interim Management Report of Fund Performance containsfinancial highlights but does not contain the complete annual or semi-annual financial statements of the investment fund. You may obtain acopy of the Fund’s annual or semi-annual financial statements at yourrequest, at no cost, by calling us toll-free at 1-888-390-3333, by visitingour website at www.hsbc.ca/investment-resources, by visiting theSEDAR website at www.sedar.com or by writing to us at:
Corporate SecretaryHSBC Global Asset Management (Canada) Limited3rd Floor, 885 West Georgia StreetVancouver, BC V6C 3E8
You may also contact us using one of these methods to request acopy of the Fund’s proxy voting policies and procedures, proxyvoting disclosure record or quarterly statement of investmentportfolio.
Results of OperationsAs of June 30, 2015, the Fund’s net assets increased by 16.9% to$65.1 million from $55.7 million at the end of 2014. Of thisincrease, a $4.4 million gain was attributable to investmentperformance and $5 million was attributable to net contributions tothe Fund.
Investment PerformanceThe HSBC Emerging Markets Fund (Investor Series) rose 6.69%for the six months ending June 30, 2015, while its benchmark, theMSCI Emerging Markets Index (in Canadian dollars), rose 10.88%for the same period.
Over the period, stock selection, notably in Brazil and China, wasthe key detractor of relative performance. Brazil (�8.70%) laggedits emerging market peers on weaker growth and continuedcurrency weakness. The Fund’s exposure to consumer electronicsand a furniture retailer was the largest detractor of relative returns.The weak consumer environment meant the holdings suffered. In
China, underperfomance was mainly from the Fund’s underweightposition in an internet company, which outperformed over theperiod.
On the positive side, selection in Taiwan and South Africamitigated some of the underperformance. In Taiwan, exposure tothe IT sector and particularly the overweight to a circuit boardmanufacturer added value to relative returns. It rallied over theperiod on strong fourth- and first-quarter results, supported bygrowth in sales and strong iPhone demand. Positive selectionwithin the consumer sector in South Africa aided relativeperformance. Country allocation, notably the underweightpositions in Malaysia and Indonesia, also made a positivecontribution to relative performance.
Recent DevelopmentsIn the first half of the year, many economies were supported bylower oil prices and by the broad wave of global monetary easingthese enabled. The Fund Manager continues to expect the globaleconomy to remain supportive for emerging market growth, led bythe US and a recovery in the eurozone. However, in the near term,there remain significant headwinds from impending US interestrate hikes, potential Grexit (or Greek exit), a slowing Chineseeconomy, oil price volatility and geopolitical tensions.
While equity returns may be more volatile in the short term, theyshould compare favourably with other asset classes. At the end ofJune 2015, the Fund was overweight to Taiwan, India, Turkey andSaudi Arabia and underweight to South Africa, Mexico, China andMalaysia. While sector weightings are largely an outcome of theFund Manager’s stock views, the current sector tilts relative totheir reference index see the largest overweight positions infinancials, energy and IT, with underweight positions in consumerstaples, industrials and telecommunications.
Related Party TransactionsWe, on behalf of the Fund, or the Fund Manager, may, from time totime, enter into transactions or arrangements with or involving othermembers of the HSBC Group or other people or companies relatedor connected to us or the Fund. To proceed with the transactions,the Fund relies on the positive recommendation of the Fund’sIndependent Review Committee. A condition of this positiverecommendation is that the transactions are performed inaccordance with our policy on Related Party Transactions. For moregeneral information on persons related to the Fund and the types ofpotential transactions, see the Fund’s Simplified Prospectus.
The following is a summary of current transactions andarrangements with entities that are related to us or the Fund.
1
HSBC Emerging Markets Fund
Manager, Trustee and Investment AdvisorWe are the manager, trustee and primary investment advisor of theFund. As manager, we manage the overall business and operationsof the Fund. As trustee, we hold legal title to the property of theFund on your behalf. As primary investment advisor, we provideinvestment advice and portfolio management services to the Fund.We receive a fee from the Fund for these services based on assetsunder management, calculated daily and paid monthly. We haveentered into a sub-advisory agreement with HSBC Global AssetManagement (UK) Limited (an affiliate), under which HSBC GlobalAsset Management (UK) Limited provides investment advice andportfolio management services to the Fund. We pay HSBC GlobalAsset Management (UK) Limited an investment advisory fee fromthe Fund based on assets under management, calculated daily andpaid quarterly. For more information on our ability to hire sub-advisors, see the section Organization and Management of theHSBC Mutual Funds in the Fund’s Simplified Prospectus.
Distribution ServicesThe Fund is distributed through us, HSBC Investment Funds(Canada) Inc. (our wholly owned subsidiary); HSBC Private WealthServices (Canada) Inc. and through HSBC Securities (Canada) Inc.(an affiliate) directly or through its division, HSBC InvestDirect. Wepay distribution and servicing fees to them based on the amountof assets held in the investor’s account, and additionally, in somecases, on the amount of the initial purchase. If you hold units ofthis Fund and/or other HSBC Mutual Funds in a registered planwith HSBC Investment Funds (Canada) Inc., they may charge youan annual fee to cover the annual administration costs of the plan.We permit HSBC Investment Funds (Canada) Inc. to collect thesefees by redeeming sufficient units of the Fund with the highestmarket value in your registered plan.
Related Brokerage CommissionsFrom time to time, the Fund may enter into purchases and salesof securities, derivative instruments, foreign exchange contracts orother instruments with dealers that are members of the HSBCGroup (“Related Brokers”). These Related Brokers may earncommissions or spreads provided that such trades are made onterms and conditions comparable to those offered by or tounrelated parties. During the period, the Fund did not pay any feesto the Related Brokers (December 31, 2014, $8,007).
Investments in Securities of Related PartiesIn accordance with Canadian securities legislation and policies setout by our Independent Review Committee, the Fund may invest itsassets in the securities of companies related to the Fund’sinvestment advisor or sub-advisor. During the period, the Fund held,purchased or sold shares in Bank of Communications, whichrepresented 1.31% of the Fund’s assets as at June 30, 2015.
Financial HighlightsThe following tables show selected key financial information aboutthe Fund and are intended to help you understand the Fund’sfinancial performance for the six-month period ended June 30, 2015and for the last five years ended December 31, as applicable. In theyear a fund is established, “period” represents the period frominception to December 31 or June 30 of that fiscal year, asapplicable. This information is derived from the Fund’s unauditedsemi-annual financial statements and audited annual financialstatements. The information in the following tables is based onprescribed regulations, and as a result, is not expected to add due tothe increase/decrease in net assets from operations being based onaverage units outstanding during the period and all other numbersbeing based on actual units outstanding at the relevant point in time.
HSBC Emerging Markets Fund – Investor Series –Net Assets per Unit (1)
Period ended June 30, 2015 (unaudited)and years ended December 31 Inception: November 1994
June 30
2015
Dec. 31
2014
Dec. 31
2013
Dec. 31
2012
Dec. 31
2011
Dec. 31
2010
Net assets per unit,beginning of period (2) $8.40 $7.86 $8.22 $7.11 $9.68 $9.12
(1) This information is derived from the Fund’s unaudited semi-annualfinancial statements and audited annual financial statements. The netassets per unit presented in the financial statements differ from thenet asset value calculated for fund pricing purposes.
(2) Net assets per unit and distributions per unit are based on the actualnumber of units outstanding for the relevant series at the relevanttime. The increase/decrease in net assets from operations per unit isbased on the weighted average number of units outstanding for therelevant series over the fiscal period.
(3) Distributions are automatically reinvested in additional units of theFund, unless the unitholder withdraws from the automaticreinvestment plan by providing written notice to us.
(4) This information is provided as at period-end.
(5) MER includes the total expenses of each Fund, including the Goodsand Services Tax and/or Harmonized Sales Tax thereon, other thanbrokerage commissions on securities transactions and any foreignwithholding taxes on income, as an annualized percentage of averagenet asset value (“NAV”) of the respective series of unit for the period.In the period a series is established, the MER is annualized from thedate of inception to the end of the period. The MER may vary fromone mutual fund to another and from one series of units to another.
4
HSBC Emerging Markets Fund
We may have waived or absorbed certain fees and expensesotherwise payable by the Fund. The amount of expenses absorbed orwaived is at the discretion of and can be terminated at any time by us.
(6) The Fund’s portfolio turnover rate indicates how actively the Fund’sportfolio advisor manages its portfolio investments. A portfolio turnoverrate of 100% is equivalent to the Fund buying and selling all of thesecurities in its portfolio once in the course of the period. The higher theFund’s portfolio turnover rate in a period, the greater the trading costspayable by the Fund in the period, and the greater the chance of aninvestor receiving taxable capital gains in the period. There is notnecessarily a relationship between a high turnover rate and theperformance of the Fund. The rate is calculated based on the lesser ofpurchases or sales of securities divided by the average weighted marketvalue of the portfolio securities, excluding short-term securities.
(7) The trading expense ratio represents commissions and other portfoliotransaction costs expressed as an annualized percentage of dailyaverage net asset value during the period.
Management FeesFor the six months ended June 30, 2015, the Fund paid usmanagement fees of $112,127. The management fee for eachseries is calculated as a percentage of the daily net asset value forthat series. The fees are reduced, where required, so that thesefees do not duplicate fees payable by mutual funds in which theFund invests for the same service.
The Fund’s management fees were used by us to pay costs formanaging the investment portfolio, providing investment analysisand recommendations, making investment decisions, makingbrokerage arrangements for the purchase and sale of theinvestment portfolio and providing other services. Themanagement fees also funded commission payments and othercompensation to sales representatives and registered dealers andbrokers (collectively “distribution costs”), including HSBC BankCanada, for units of the Fund bought and held by unitholders.Finally, we used management fees to pay for additional marketingand distribution services to the Fund.
For the six months ended June 30, 2015, approximately 45% ofthe total management fees collected from all HSBC Mutual Fundswere used to fund distribution costs. In comparison, for the Fund,such distribution costs represented 38% of the management feescollected. This may vary by series depending on the assetsinvested in each of the series.
Past PerformanceThe performance information shown assumes that all distributionsmade by the Fund in the periods shown were reinvested inadditional securities of the Fund. The performance informationdoes not take into account sales, redemption, distribution, optionalcharges or expenses you may be charged outside of the Fund orthe effect of any income tax you may have to pay as a result ofyour investment in the Fund that would have reduced returns orperformance. The Fund’s past performance does not necessarilyindicate how it will perform in the future.
Year-by-Year ReturnsThe following bar charts show the Fund’s performance for thesix-month period ended June 30, 2015, and for each of theprevious 12-month periods ended December 31. In percentageterms, the bar charts show how much an investment made on thefirst day of each financial period would have grown or decreasedby the last day of each financial period.
Returns – Investor SeriesFor the 12-month periods ended December 31 and the six-monthperiod ended June 30, 201580%
0%
-60%
-80%June 30
2015
-20%
-40%
60%
40%
20%
Dec. 312005
26.2%
Dec. 312006
27.3%
Dec. 312007
18.5%
Dec. 312008
-48.8%
Dec. 312009
43.8%
Dec. 312012
16.1%
Dec. 312014
6.8% 6.7%
Dec. 312013
-4.8%
Dec. 312010
6.2%
Dec. 312011
-26.7%
Returns – Advisor SeriesFor the 12-month periods ended December 31 and the six-monthperiod ended June 30, 201580%
60%
0%
-80%Dec. 31
2005Dec. 31
2006Dec. 31
2007Dec. 31
2008Dec. 31
2009Dec. 31
2010Dec. 31
2011
20%
40%
-60%
-40%
-20%
26.3% 27.4%18.1%
-48.8%
43.8%
16.1%
-4.9%
6.2%
-26.7%
Dec. 312013
June 302015
Dec. 312014
Dec. 312012
0.0% 0.0%
Returns – Premium SeriesFor the 12-month periods ended December 31 and the six-monthperiod ended June 30, 201580%
40%
-40%
-80%
0%
Dec. 312011
-60%
-20%
60%
20%
Dec. 312012
-26.3%
7.4% 6.7%16.8%
Dec. 312014
-4.0%
Dec. 312013
June 302015
5
HSBC Emerging Markets Fund
Returns – Manager SeriesFor the 12-month periods ended December 31 and the six-monthperiod ended June 30, 2015
Dec. 312010
Dec. 312011
Dec. 312008
Dec. 312009
-48.3%
45.4%
17.5%0.0% 0.0% 0.0%7.4%
-25.7%
Dec. 312014
June 302015
Dec. 312013
Dec. 312012
80%
40%
-40%
-80%
0%
-60%
-20%
60%
20%
Returns – Institutional SeriesFor the 12-month periods ended December 31 and the six-monthperiod ended June 30, 201580%
60%
0%
-80%Dec. 31
2005Dec. 31
2006Dec. 31
2007Dec. 31
2008Dec. 31
2009Dec. 31
2010Dec. 31
2011
20%
40%
-60%
-40%
-20%
27.3% 30.4%21.4%
-47.6%
47.3%
19.1%9.4%8.8% 8.0%
-24.8%
Dec. 312012
June 302015
Dec. 312014
-2.5%
Dec. 312013
Summary of Investment PortfolioAs at June 30, 2015
China 18.02%Taiwan 15.01%South Korea 13.89%India 8.86%Brazil 6.22%Hong Kong 5.59%South Africa 4.99%Russia 4.59%Thailand 3.03%Turkey 2.37%Mexico 2.35%Malaysia 1.80%Qatar 1.28%Indonesia 1.10%Chile 1.09%Colombia 1.04%Saudi Arabia 1.03%Poland 0.94%United Arab Emirates 0.90%Greece 0.25%Mutual Funds 1.82%Cash & Equivalents 3.83%Total 100.00%
6
HSBC Emerging Markets Fund
Top 25 HoldingsPercentage
of NAV
Samsung Electronics Co., Ltd. 4.60%Taiwan Semiconductor Manufacturing Co., Ltd. 3.80%China Construction Bank Corp., Class H 3.18%Industrial & Commercial Bank of China Ltd., Class H 2.45%Hon Hai Precision Industry Co., Ltd. 2.14%China Mobile (Hong Kong) Ltd. 2.05%Sasol Ltd. 2.00%iShares MSCI Emerging Markets Index Fund 1.82%China Life Insurance Co., Ltd., Class H 1.80%Gazprom OAO 1.66%Naspers Ltd. 1.62%Lukoil OAO, ADR 1.54%Shinhan Financial Group Co., Ltd. 1.50%Hynix Semiconductor Inc. 1.49%PTT Public Co., Ltd., NVDR 1.45%Bank of Communications Co., Ltd. 1.40%Sberbank of Russia 1.38%China Overseas Land & Investment Ltd. 1.37%Grupo Mexico SAB de CV 1.37%FirstRand Ltd. 1.36%Infosys Ltd. 1.35%Malayan Banking BHD 1.35%PICC Property & Casualty Co., Ltd., Class H 1.32%Agricultural Bank of China Ltd. 1.29%Mega Financial Holding Co., Ltd. 1.28%Total top 25 investments 46.57%
The Summary of Investment Portfolio may change due to ongoing portfolio transactions of the Fund, and is available quarterly.
7
For more information
You can find more information about HSBC Mutual Fundsin the Fund’s Simplified Prospectus, Annual InformationForm, Annual and Semi-Annual Report and Fund Facts. Youcan get a copy of these documents, as well as the Fund’sFinancial Statements, at no cost by calling 1-888-390-3333,by contacting your authorized dealer or by visiting ourwebsite at www.hsbc.ca/investment-resources.
These documents and other information about the HSBCMutual Funds, such as information circulars and materialcontracts, are also available at www.sedar.com.
Copies of the Annual Report and Semi-Annual Report,Simplified Prospectus, Annual Information Form, Annualand Interim Management Report of Fund Performanceand Fund Facts are available on our website atwww.hsbc.ca/investment-resources.
How to reach us
VancouverHSBC Global Asset Management (Canada) Limited3rd Floor, 885 West Georgia StreetVancouver, BC V6C 3E8
Tel: 1-888-390-3333Fax: 604-669-2756
TorontoSuite 300 – 70 York StreetToronto, ON M5J 1S9
MontrealSuite 300 – 2001 McGill College AvenueMontreal, QC H3A 1G1
A NOTE ON FORWARD-LOOKING STATEMENTS
This report may contain forward-looking statements about the Fund, including its strategy, expected performance and condition. Forward-lookingstatements include statements that are predictive in nature that depend upon or refer to future events or conditions, or that include words such as“expects,” “anticipates,” “intends,” “plans,” “believes,” “estimates” or negative versions thereof and similar expressions. In addition, any statement thatmay be made concerning future performance, strategies or prospects, and possible future Fund action, is also a forward-looking statement. Forward-lookingstatements are based on current expectations and projections about future events and are inherently subject to, among other things, risks, uncertaintiesand assumptions about the Fund and economic factors.
Forward-looking statements are not guarantees of future performance, and actual events and results could differ materially from those expressed or impliedin any forward-looking statements made by the Fund. Any number of important factors could contribute to these digressions, including, but not limited to,general economic, political and market factors in North America and internationally, interest and foreign exchange rates, global equity and capital markets,business competition, technological change, changes in government regulations, unexpected judicial or regulatory proceedings, and catastrophic events.
We stress that the above-mentioned list of important factors is not exhaustive. We encourage you to consider these and other factors carefully beforemaking any investment decisions and we urge you to avoid placing undue reliance on forward-looking statements. Further, you should be aware of the factthat the Fund has no specific intention of updating any forward-looking statements, whether as a result of new information, future events or otherwise.
Sources: HSBC Global Asset Management (Canada) Limited, Bloomberg, MSCI, Bank of Canada.
Neither MSCI nor any other party involved in or related to compiling, computing or creating the MSCI data makes any express or implied warranties orrepresentations with respect to such data (or the results to be obtained by the use thereof), and all such parties hereby expressly disclaim all warranties oforiginality, accuracy, completeness, merchantability or fitness for a particular purpose with respect to any of such data. Without limiting any of theforegoing, in no event shall MSCI, any of its affiliates or any third party involved in or related to compiling, computing or creating the data have any liabilityfor any direct, indirect, special, punitive, consequential or any other damages (including lost profits) even if notified of the possibility of such damages. Nofurther distribution or dissemination of the MSCI data is permitted without MSCI’s express written consent.
Unauthorized reproduction, distribution, transmission or publication without our prior written consent is strictly prohibited.
Issued byHSBC Global Asset Management (Canada) Limited (2
015-
08)R
RD
HSBC BRIC Equity Fund
Interim Management Report of Fund Performance
for the six months ended June 30, 2015
HSBC BRIC Equity Fund
Management Discussion of Fund PerformanceIn this document, you and your refer to the unitholder of the Fund;we, us and our refer to HSBC Global Asset Management (Canada)Limited; and the Fund refers to the HSBC BRIC Equity Fund.
We are the manager, trustee and primary investment advisor ofthe Fund. We have entered into a sub-advisory agreement withHSBC Global Asset Management (UK) Limited, under which HSBCGlobal Asset Management (UK) Limited provides investmentadvice and portfolio management services to the Fund. For anexplanation of the relationship between us and the sub-advisor,see the section Selection of Sub-Advisors in the Fund’s SimplifiedProspectus.
IntroductionThis Interim Management Report of Fund Performance containsfinancial highlights but does not contain the complete annual or semi-annual financial statements of the investment fund. You may obtain acopy of the Fund’s annual or semi-annual financial statements at yourrequest, at no cost, by calling us toll-free at 1-888-390-3333, by visitingour website at www.hsbc.ca/investment-resources, by visiting theSEDAR website at www.sedar.com or by writing to us at:
Corporate SecretaryHSBC Global Asset Management (Canada) Limited3rd Floor, 885 West Georgia StreetVancouver, BC V6C 3E8
You may also contact us using one of these methods to request acopy of the Fund’s proxy voting policies and procedures, proxyvoting disclosure record or quarterly statement of investmentportfolio.
Results of OperationsAs of June 30, 2015, the Fund’s net assets decreased by 8.6% to$46.8 million from $51.2 million at the end of 2014. Of thisdecrease, a $4.3 million gain was attributable to investmentperformance and $8.7 million was attributable to net withdrawalsfrom Fund.
Investment PerformanceThe HSBC BRIC Equity Fund (Investor Series) rose 7.82% for thesix months ending June 30, 2015, while its benchmark, the MSCIBrazil Index (25%), MSCI Russia Index (25%), MSCI India Index(25%) and MSCI China Index (25%) all (in Canadian dollars), rose17.89% for the same period.
Exposure management had no significant impact on Fundperformance, as the average exposure of the Fund remained closeto 100%. The county allocation contribution also had no significantimpact on Fund performance.
The stock selection strategy contributed negatively to the Fund’sperformance, in particular in the Fund’s Chinese holdings.
Recent DevelopmentsThe Fund Manager’s strategy remains unchanged and relies onthree layers aimed at capturing opportunities while diversifyingrisk. First, a dynamic country allocation. Second, a stock selectionstrategy based upon the anticipated risk-return profile of singleequity names. And last, a continuous monitoring of the overallequity exposure of the Fund.
Equity markets remain attractive overall in the context of very lowinterest rates.
Effective March 12, 2015, HSBC Global Asset Management (UK)Limited replaced HSBC Global Asset Management (France) assub-advisor to the Fund. At the same time, the Fund’s benchmarkchanged to a composite benchmark consisting of the MSCI BrazilIndex (25%), MSCI Russia Index (25%), MSCI India Index (25%)and MSCI China Index (25%).
Related Party TransactionsWe, on behalf of the Fund, or the Fund Manager, may, from timeto time, enter into transactions or arrangements with or involvingother members of the HSBC Group or other people or companiesrelated or connected to us or the Fund. To proceed with thetransactions, the Fund relies on the positive recommendation ofthe Fund’s Independent Review Committee. A condition of thispositive recommendation is that the transactions are performed inaccordance with our policy on Related Party Transactions. Formore general information on persons related to the Fund and thetypes of potential transactions, see the Fund’s SimplifiedProspectus.
The following is a summary of current transactions andarrangements with entities that are related to us or the Fund.
Manager, Trustee and Investment AdvisorWe are the manager, trustee and primary investment advisor ofthe Fund. As manager, we manage the overall business andoperations of the Fund. As trustee, we hold legal title to theproperty of the Fund on your behalf. As primary investmentadvisor, we provide investment advice and portfolio managementservices to the Fund. We receive a fee from the Fund for theseservices based on assets under management, calculated daily andpaid monthly. We have entered into a sub-advisory agreementwith HSBC Global Asset Management (France) (an affiliate), underwhich HSBC Global Asset Management (France) providesinvestment advice and portfolio management services to theFund. We pay HSBC Global Asset Management (France) a feefrom the Fund based on assets under management, calculated
1
HSBC BRIC Equity Fund
daily and paid quarterly. For more information on our ability to hiresub-advisors, see the section Organization and Management ofthe HSBC Mutual Funds in the Fund’s Simplified Prospectus.
Distribution ServicesThe Fund is distributed through us, HSBC Investment Funds(Canada) Inc. (our wholly owned subsidiary); HSBC Private WealthServices (Canada) Inc. and through HSBC Securities (Canada) Inc.(an affiliate) directly or through its division, HSBC InvestDirect. Wepay distribution and servicing fees to them based on the amountof assets held in the investor’s account, and additionally, in somecases, on the amount of the initial purchase. If you hold units ofthis Fund and/or other HSBC Mutual Funds in a registered planwith HSBC Investment Funds (Canada) Inc., they may charge youan annual fee to cover the annual administration costs of the plan.We permit HSBC Investment Funds (Canada) Inc. to collect thesefees by redeeming sufficient units of the Fund with the highestmarket value in your registered plan.
Financial HighlightsThe following tables show selected key financial information aboutthe Fund and are intended to help you understand the Fund’sfinancial performance for the six-month period ended June 30, 2015and for the last five years ended December 31, as applicable. In theyear a fund is established, “period” represents the period frominception to December 31 or June 30 of that fiscal year, asapplicable. This information is derived from the Fund’s unauditedsemi-annual financial statements and audited annual financialstatements. The information in the following tables is based onprescribed regulations, and as a result, is not expected to add due tothe increase/decrease in net assets from operations being based onaverage units outstanding during the period and all other numbersbeing based on actual units outstanding at the relevant point in time.
HSBC BRIC Equity Fund – Investor Series –Net Assets per Unit (1)
Period ended June 30, 2015 (unaudited)and years ended December 31 Inception: December 2006
June 30
2015
Dec. 31
2014
Dec. 31
2013
Dec. 31
2012
Dec. 31
2011
Dec. 31
2010
Net assets per unit,
beginning of period (2) $9.13 $8.84 $8.77 $8.01 $10.31 $10.31
(1) This information is derived from the Fund’s unaudited semi-annualfinancial statements and audited annual financial statements. The netassets per unit presented in the financial statements differ from thenet asset value calculated for fund pricing purposes.
(2) Net assets per unit and distributions per unit are based on the actualnumber of units outstanding for the relevant series at the relevanttime. The increase /decrease in net assets from operations per unit isbased on the weighted average number of units outstanding for therelevant series over the fiscal period.
(3) Distributions are automatically reinvested in additional units of theFund, unless the unitholder withdraws from the automaticreinvestment plan by providing written notice to us.
(4) This information is provided as at period-end.
(5) MER includes the total expenses of each Fund, including the Goodsand Services Tax and/or Harmonized Sales Tax thereon, other thanbrokerage commissions on securities transactions and any foreignwithholding taxes on income, as an annualized percentage of average
4
HSBC BRIC Equity Fund
net asset value (“NAV”) of the respective series of unit for the period.In the period a series is established, the MER is annualized from thedate of inception to the end of the period. The MER may vary fromone mutual fund to another and from one series of units to another.We may have waived or absorbed certain fees and expensesotherwise payable by the Fund. The amount of expenses absorbed orwaived is at the discretion of and can be terminated at any time by us.
(6) The Fund’s portfolio turnover rate indicates how actively the Fund’sportfolio advisor manages its portfolio investments. A portfolio turnoverrate of 100% is equivalent to the Fund buying and selling all of thesecurities in its portfolio once in the course of the period. The higher theFund’s portfolio turnover rate in a period, the greater the trading costspayable by the Fund in the period, and the greater the chance of aninvestor receiving taxable capital gains in the period. There is notnecessarily a relationship between a high turnover rate and theperformance of the Fund. The rate is calculated based on the lesser ofpurchases or sales of securities divided by the average weighted marketvalue of the portfolio securities, excluding short-term securities.
(7) The trading expense ratio represents commissions and other portfoliotransaction costs expressed as an annualized percentage of dailyaverage net asset value during the period.
Management FeesFor the six months ended June 30, 2015, the Fund paid usmanagement fees of $485,420. The management fee for eachseries is calculated as a percentage of the daily net asset value forthat series. The fees are reduced, where required, so that thesefees do not duplicate fees payable by mutual funds in which theFund invests for the same service.
The Fund’s management fees were used by us to pay costs formanaging the investment portfolio, providing investment analysisand recommendations, making investment decisions, makingbrokerage arrangements for the purchase and sale of theinvestment portfolio and providing other services. Themanagement fees also funded commission payments and othercompensation to sales representatives and registered dealers andbrokers (collectively “distribution costs”), including HSBC BankCanada, for units of the Fund bought and held by unitholders.Finally, we used management fees to pay for additional marketingand distribution services to the Fund.
For the six months ended June 30, 2015, approximately 45% ofthe total management fees collected from all HSBC Mutual Fundswere used to fund distribution costs. In comparison, for the Fund,such distribution costs represented 40% of the management feescollected. This may vary by series depending on the assetsinvested in each of the series.
Past PerformanceThe performance information shown assumes that all distributionsmade by the Fund in the periods shown were reinvested inadditional securities of the Fund. The performance informationdoes not take into account sales, redemption, distribution, optionalcharges or expenses you may be charged outside of the Fund or
the effect of any income tax you may have to pay as a result ofyour investment in the Fund that would have reduced returns orperformance. The Fund’s past performance does not necessarilyindicate how it will perform in the future.
Year-by-Year ReturnsThe following bar charts show the Fund’s performance for thesix-month period ended June 30, 2015, and for each of theprevious 12-month periods ended December 31. In percentageterms, the bar charts show how much an investment made on thefirst day of each financial period would have grown or decreasedby the last day of each financial period.
Returns – Investor SeriesFor the 12-month periods ended December 31 and the six-monthperiod ended June 30, 201580%
40%
20%
-20%
-80%
0%
Dec. 312010
Dec. 312011
Dec. 312013
Dec. 312012
Dec. 312008
Dec. 312009
-40%
-60%
60%
-48.6%
59.0%
3.9% 7.8%0.8%9.4%
Dec. 312014
June 302015
0.0%
-22.3%
Returns – Advisor SeriesFor the 12-month periods ended December 31 and the six-monthperiod ended June 30, 201580%
40%
20%
-20%
-80%
0%
Dec. 312010
Dec. 312011
Dec. 312013
Dec. 312012
Dec. 312009
-40%
-60%
60%
Dec. 312008
-48.6%
58.9%
9.5% 3.8% 7.7%0.8%
June 302015
Dec. 312014
-22.2%
0.0%
5
HSBC BRIC Equity Fund
Returns – Premium SeriesFor the 12-month periods ended December 31 and the six-monthperiod ended June 30, 201580%
40%
20%
-20%
-80%
0%
Dec. 312011
Dec. 312012
Dec. 312013
-40%
-60%
60%
-21.8%
10.0% 8.0%1.3% 4.4%
Dec. 312014
June 302015
Returns – Manager SeriesFor the 12-month periods ended December 31 and the six-monthperiod ended June 30, 201580%
40%
20%
-20%
-80%
0%
Dec. 312010
Dec. 312011
Dec. 312012
Dec. 312013
Dec. 312008
Dec. 312009
-40%
-60%
60%
-48.0%
60.6%
10.7% 8.1%1.8% 4.9%
Dec. 312014
June 302015
1.1%
-21.4%
Returns – Institutional SeriesFor the 12-month periods ended December 31 and the six-monthperiod ended June 30, 201580%
40%
20%
-20%
-80%
0%
Dec. 312010
Dec. 312011
Dec. 312008
Dec. 312009
-40%
-60%
60%
-47.4%
62.7%
12.2% 9.1%6.5%3.3%2.4%
-20.3%
Dec. 312012
Dec. 312013
June 302015
Dec. 312014
Summary of Investment PortfolioAs at June 30, 2015
India 26.52%China 25.47%Russia 24.30%Brazil 18.40%Hong Kong 0.80%Cyprus 0.56%Mutual Funds 0.67%Cash & Equivalents 3.28%Total 100.00%
6
HSBC BRIC Equity Fund
Top 25 HoldingsPercentage
of NAV
Gazprom OAO, ADS 5.83%Lukoil OAO, ADR 5.13%Itau Unibanco Holding SA, Preferred 4.30%Tencent Holdings Ltd. 3.84%China Construction Bank Corp., Class H 3.65%Banco Bradesco SA, Preferred 3.11%Indiabulls Housing Finance Ltd. 2.62%Sberbank of Russia, GDR 2.59%Industrial & Commercial Bank of China Ltd., Class H 2.40%Maruti Suzuki India Ltd. 2.29%Oil and Natural Gas Corp., Ltd. 2.18%China Resources Land Ltd. 2.06%Rosneft Oil Co., GDR 2.03%Mobile TeleSystems OJSC 1.98%Sesa Sterlite Ltd. 1.91%Ping An Insurance (Group) Co. of China Ltd., Class H 1.80%MMC Norilsk Nickel, ADR (LSE) 1.75%Tata Motors Ltd. 1.73%Telefonica Brasil SA, Preferred 1.72%Shenzhen International Holdings Ltd. 1.66%HCL Technologies Ltd. 1.65%Vale SA, Preferred 1.64%Severstal OAO, GDR 1.63%Coal India Ltd. 1.57%OAO Tatneft, ADR 1.51%Total top 25 investments 62.58%
The Summary of Investment Portfolio may change due to ongoing portfolio transactions of the Fund, and is available quarterly.
7
For more information
You can find more information about HSBC Mutual Fundsin the Fund’s Simplified Prospectus, Annual InformationForm, Annual and Semi-Annual Report and Fund Facts. Youcan get a copy of these documents, as well as the Fund’sFinancial Statements, at no cost by calling 1-888-390-3333,by contacting your authorized dealer or by visiting ourwebsite at www.hsbc.ca/investment-resources.
These documents and other information about the HSBCMutual Funds, such as information circulars and materialcontracts, are also available at www.sedar.com.
Copies of the Annual Report and Semi-Annual Report,Simplified Prospectus, Annual Information Form, Annualand Interim Management Report of Fund Performanceand Fund Facts are available on our website atwww.hsbc.ca/investment-resources.
How to reach us
Vancouver
HSBC Global Asset Management (Canada) Limited3rd Floor, 885 West Georgia StreetVancouver, BC V6C 3E8
Tel: 1-888-390-3333Fax: 604-669-2756
Toronto
Suite 300 – 70 York StreetToronto, ON M5J 1S9
Montreal
Suite 300 – 2001 McGill College AvenueMontreal, QC H3A 1G1
A NOTE ON FORWARD-LOOKING STATEMENTS
This report may contain forward-looking statements about the Fund, including its strategy, expected performance and condition. Forward-lookingstatements include statements that are predictive in nature that depend upon or refer to future events or conditions, or that include words such as“expects,” “anticipates,” “intends,” “plans,” “believes,” “estimates” or negative versions thereof and similar expressions. In addition, any statementthat may be made concerning future performance, strategies or prospects, and possible future Fund action, is also a forward-looking statement.Forward-looking statements are based on current expectations and projections about future events and are inherently subject to, among other things,risks, uncertainties and assumptions about the Fund and economic factors.
Forward-looking statements are not guarantees of future performance, and actual events and results could differ materially from those expressed orimplied in any forward-looking statements made by the Fund. Any number of important factors could contribute to these digressions, including, but notlimited to, general economic, political and market factors in North America and internationally, interest and foreign exchange rates, global equity andcapital markets, business competition, technological change, changes in government regulations, unexpected judicial or regulatory proceedings, andcatastrophic events.
We stress that the above-mentioned list of important factors is not exhaustive. We encourage you to consider these and other factors carefully before makingany investment decisions and we urge you to avoid placing undue reliance on forward-looking statements. Further, you should be aware of the fact that theFund has no specific intention of updating any forward-looking statements, whether as a result of new information, future events or otherwise.
Sources: HSBC Global Asset Management (Canada) Limited, Bloomberg, MSCI, Bank of Canada.
Neither MSCI nor any other party involved in or related to compiling, computing or creating the MSCI data makes any express or implied warranties orrepresentations with respect to such data (or the results to be obtained by the use thereof), and all such parties hereby expressly disclaim all warranties oforiginality, accuracy, completeness, merchantability or fitness for a particular purpose with respect to any of such data. Without limiting any of theforegoing, in no event shall MSCI, any of its affiliates or any third party involved in or related to compiling, computing or creating the data have any liabilityfor any direct, indirect, special, punitive, consequential or any other damages (including lost profits) even if notified of the possibility of such damages. Nofurther distribution or dissemination of the MSCI data is permitted without MSCI’s express written consent.
Unauthorized reproduction, distribution, transmission or publication without our prior written consent is strictly prohibited.
Issued byHSBC Global Asset Management (Canada) Limited
(201
5-08
)RR
D
HSBC World SelectionDiversified Conservative Fund
Interim Management Report of Fund Performance
for the six months ended June 30, 2015
HSBC World Selection Diversified Conservative Fund
Management Discussion of Fund PerformanceIn this document, you and your refer to the unitholder of the Fund;we, us and our refer to HSBC Global Asset Management (Canada)Limited; and the Fund refers to the HSBC World SelectionDiversified Conservative Fund.
We are the manager, trustee and primary investment advisor ofthe Fund.
IntroductionThis Interim Management Report of Fund Performance containsfinancial highlights but does not contain the complete annual or semi-annual financial statements of the investment fund. You may obtain acopy of the Fund’s annual or semi-annual financial statements at yourrequest, at no cost, by calling us toll-free at 1-888-390-3333, by visitingour website at www.hsbc.ca/investment-resources, by visiting theSEDAR website at www.sedar.com or by writing to us at:
Corporate SecretaryHSBC Global Asset Management (Canada) Limited3rd Floor, 885 West Georgia StreetVancouver, BC V6C 3E8
You may also contact us using one of these methods to request acopy of the Fund’s proxy voting policies and procedures, proxy votingdisclosure record or quarterly statement of investment portfolio.
Results of OperationsAs of June 30, 2015, the Fund’s net assets increased by 16.1% to$170.1 million from $146.5 million at the end of 2014. Of thisincrease, a $2.8 million gain was attributable to investmentperformance and $20.8 million was attributable to netcontributions to the Fund.
Investment PerformanceThe HSBC World Selection Diversified Conservative Fund (InvestorSeries) rose 1.96% for the six months ending June 30, 2015,while its benchmark rose 2.93% for the same period. Itsbenchmark is a composite of the FTSE TMX Canada 91-DayTreasury Bill Index (7%), the FTSE TMX Canada Universe BondIndex (65%), the S&P/TSX Composite Index (17%) and the MSCIWorld Index (in Canadian dollars) (11%).
During the first half of 2015, the MSCI World Index (in Canadiandollars) rose 10.70%, with much of this gain attributable to a weakCanadian dollar. Over the same period, the S&P/TSX CompositeIndex was up 0.91%. The strongest sectors were healthcare(+58.33), consumer discretionary (+7.80) and consumer staples(+3.23%). The weakest sectors were industrials (�8.08%),energy (�5.36) and utilities (�4.50%). The Canadian bond marketwas strong in the first quarter as the Bank of Canada surprised themarket with a 25-basis-point rate cut. Deflation fears droveeurozone bond yields to all-time lows. Global government
bond yields moved higher, however, in the second quarter as therisk of eurozone deflation diminished. The FTSE TMX CanadaUniverse Bond Index gained 2.37%, year-to-date.
The Fund achieved a positive return, with contributions from eachof the major asset classes noted above. The Fund maintained amodest preference for equities and a more pronouncedpreference for corporate bonds relative to cash and governmentbonds during the first six months of the year. This positioning wasbeneficial to performance. However, security selection in equitiesprovided a return somewhat lower than the overall equity market.
Recent DevelopmentsThe US economy contracted 0.2% in the first quarter. But weexpect a rebound of growth for the rest of 2015, with 2.2%growth expected for the full year. In Canada, growth alsocontracted in the first quarter, by 0.6%, and April was 0.1% lower.Business investment and trade numbers were disappointing, butUS and Canadian consumers continue to add to growth. HSBCforecasts 2015 growth of 1.4% in Canada and 2.4% globally.
A softening of global economic expectations combined with theanticipation of eventual rate hikes from the US Federal Reservewere a definite headwind for equity markets in the first half of2015. Another major headwind for earnings growth domesticallycontinues to be the energy sector. Looking ahead, we continue tosee better return prospects for corporate assets, both equity anddebt, based on strong fundamentals and reasonable valuations.However, corporate earnings are expected to contract modestlythis year, led lower by the energy sector, before rebounding in2016. The Fund is somewhat less exposed to domestic equitiesthan in recent quarters.
Related Party TransactionsWe, on behalf of the Fund, or the Fund Manager, may, from time totime, enter into transactions or arrangements with or involving othermembers of the HSBC Group or other people or companies relatedor connected to us or the Fund. To proceed with the transactions,the Fund relies on the positive recommendation of the Fund’sIndependent Review Committee. A condition of this positiverecommendation is that the transactions are performed inaccordance with our policy on Related Party Transactions. For moregeneral information on persons related to the Fund and the types ofpotential transactions, see the Fund’s Simplified Prospectus.
The following is a summary of current transactions andarrangements with entities that are related to us or the Fund.
Manager, Trustee and Investment AdvisorWe are the manager, trustee and primary investment advisor of theFund. As manager, we manage the overall business and operations
1
HSBC World Selection Diversified Conservative Fund
of the Fund. As trustee, we hold legal title to the property of theFund on your behalf. As primary investment advisor, we provideinvestment advice and portfolio management services to the Fund.We receive a fee from the Fund for these services based on assetsunder management, calculated daily and paid monthly.
Custodial ServicesHSBC Bank Canada (“the Bank”) (of which we are a wholly ownedsubsidiary) is the custodian of the Fund. All fees for these serviceswere waived by the Bank.
Distribution ServicesThe Fund is distributed through us, HSBC Investment Funds(Canada) Inc. (our wholly owned subsidiary); HSBC Private WealthServices (Canada) Inc. and through HSBC Securities (Canada) Inc.(an affiliate) directly or through its division, HSBC InvestDirect. Wepay distribution and servicing fees to them based on the amountof assets held in the investor’s account, and additionally, in somecases, on the amount of the initial purchase. If you hold units ofthis Fund and/or other HSBC Mutual Funds in a registered planwith HSBC Investment Funds (Canada) Inc., they may charge youan annual fee to cover the annual administration costs of the plan.We permit HSBC Investment Funds (Canada) Inc. to collect thesefees by redeeming sufficient units of the Fund with the highestmarket value in your registered plan.
Fund on Fund InvestingDuring the period, the Fund invested in units of other HSBC MutualFunds, which are also managed by us. To proceed with thetransactions, the Fund relied on the positive recommendation of theFund’s Independent Review Committee by way of StandingInstruction. A condition of this positive recommendation was thatthe transactions were performed in accordance with our policy onFund on Fund Investing.
Financial HighlightsThe following tables show selected key financial information aboutthe Fund and are intended to help you understand the Fund’s financialperformance for the six-month period ended June 30, 2015 and forthe last five years ended December 31, as applicable. In the year afund is established, “period” represents the period from inception toDecember 31 or June 30 of that fiscal year, as applicable. Thisinformation is derived from the Fund’s unaudited semi-annual financialstatements and audited annual financial statements. The informationin the following tables is based on prescribed regulations, and as aresult, is not expected to add due to the increase/decrease in netassets from operations being based on average units outstandingduring the period and all other numbers being based on actual unitsoutstanding at the relevant point in time.
HSBC World Selection Diversified ConservativeFund – Investor Series – Net Assets per Unit (1)
Period ended June 30, 2015 (unaudited)and years ended December 31 Inception: December 2004
June 30
2015
Dec. 31
2014
Dec. 31
2013
Dec. 31
2012
Dec. 31
2011
Dec. 31
2010
Net assets per unit,
beginning of period (2) $12.24 $11.63 $11.24 $10.77 $10.79 $10.39
From income (excludingdividends) – – (0.17) – – –From dividends – – (0.11) – – –From capital gains – – (0.07) – – –From return of capital – – – – – –
Total annual
distributions (2,3) $– $– $(0.35) $– $– $–
Net assets per unit, end of
period (2) $– $– $9.70 $– $– $–
* The Institutional Series commenced operations on December 2, 2013.
Ratios and Supplemental DataJune 30
2015
Dec. 31
2014
Dec. 31
2013
NAV (in 000s) (4) $– $– $16Units outstanding (in 000s) (4) – – 2Management expense ratio (“MER”) (5) – 0.09% 0.35%MER before absorbed or waived fees (5) – 0.09% 0.35%Portfolio turnover rate (6) – 7.85% 21.04%Trading expense ratio (7) – 0.01% 0.01%NAV per unit (4) $– $– $9.70
(1) This information is derived from the Fund’s unaudited semi-annualfinancial statements and audited annual financial statements. The netassets per unit presented in the financial statements differ from the netasset value calculated for fund pricing purposes.
(2) Net assets per unit and distributions per unit are based on the actualnumber of units outstanding for the relevant series at the relevant time.The increase/decrease in net assets from operations per unit is based onthe weighted average number of units outstanding for the relevant seriesover the fiscal period.
(3) Distributions are automatically reinvested in additional units of theFund, unless the unitholder withdraws from the automaticreinvestment plan by providing written notice to us.
(4) This information is provided as at period-end.
(5) MER includes the total expenses of each Fund, including the Goods andServices Tax and/or Harmonized Sales Tax thereon, other thanbrokerage commissions on securities transactions and any foreignwithholding taxes on income, as an annualized percentage of averagenet asset value (“NAV”) of the respective series of unit for the period. Inthe period a series is established, the MER is annualized from the date
3
HSBC World Selection Diversified Conservative Fund
of inception to the end of the period. The MER may vary from onemutual fund to another and from one series of units to another. We mayhave waived or absorbed certain fees and expenses otherwise payableby the Fund. The amount of expenses absorbed or waived is at thediscretion of and can be terminated at any time by us.
The Fund may invest in units of other mutual funds and pooled funds.You should note that in addition to the fees and expenses paid by theFund, these other funds have their own operating expenses to pay. TheFund will effectively bear the operating expenses of the other funds inproportion to its holdings in the other funds. However, the Fund will notinvest in units of other funds if the Fund would be required to pay anymanagement fees in respect of such investments. In addition, the Fundwill not make investments in other funds if the Fund would be requiredto pay any sales or redemption fees in respect of such investments thatduplicate a fee payable by unitholders of the Fund.
(6) The Fund’s portfolio turnover rate indicates how actively the Fund’sportfolio advisor manages its portfolio investments. A portfolio turnoverrate of 100% is equivalent to the Fund buying and selling all of thesecurities in its portfolio once in the course of the period. The higher theFund’s portfolio turnover rate in a period, the greater the trading costspayable by the Fund in the period, and the greater the chance of aninvestor receiving taxable capital gains in the period. There is notnecessarily a relationship between a high turnover rate and theperformance of the Fund. The rate is calculated based on the lesser ofpurchases or sales of securities divided by the average weighted marketvalue of the portfolio securities, excluding short-term securities.
(7) The trading expense ratio represents commissions and other portfoliotransaction costs expressed as an annualized percentage of dailyaverage net asset value during the period.
Management FeesFor the six months ended June 30, 2015, the Fund paid usmanagement fees of $1,223,294. The management fee for eachseries is calculated as a percentage of the daily net asset value forthat series. The fees are reduced, where required, so that thesefees do not duplicate fees payable by mutual funds in which theFund invests for the same service.
The Fund’s management fees were used by us to pay costs formanaging the investment portfolio, providing investment analysisand recommendations, making investment decisions, makingbrokerage arrangements for the purchase and sale of theinvestment portfolio and providing other services. Themanagement fees also funded commission payments and othercompensation to sales representatives and registered dealers andbrokers (collectively “distribution costs”), including HSBC BankCanada, for units of the Fund bought and held by unitholders.Finally, we used management fees to pay for additional marketingand distribution services to the Fund.
For the six months ended June 30, 2015, approximately 45% ofthe total management fees collected from all HSBC Mutual Fundswere used to fund distribution costs. In comparison, for the Fund,such distribution costs represented 47% of the management feescollected. This may vary by series depending on the assetsinvested in each of the series.
Past PerformanceThe performance information shown assumes that all distributionsmade by the Fund in the periods shown were reinvested inadditional securities of the Fund. The performance informationdoes not take into account sales, redemption, distribution, optionalcharges or expenses you may be charged outside of the Fund orthe effect of any income tax you may have to pay as a result ofyour investment in the Fund that would have reduced returns orperformance. The Fund’s past performance does not necessarilyindicate how it will perform in the future.
Year-by-Year ReturnsThe following bar charts show the Fund’s performance for thesix-month period ended June 30, 2015, and for each of theprevious 12-month periods ended December 31. In percentageterms, the bar charts show how much an investment made on thefirst day of each financial period would have grown or decreasedby the last day of each financial period.
Returns – Investor SeriesFor the 12-month periods ended December 31 and the six-monthperiod ended June 30, 2015
15%
10%
0%
-15%
5%
Dec. 312006
Dec. 312007
Dec. 312008
Dec. 312009
Dec. 312010
Dec. 312011
-5%
-10%
5.3%
0.9%
-5.5%
8.3%5.3% 4.8%
6.6%
2.0%4.8%
1.4%
Dec. 312012
Dec. 312013
Dec. 312014
June 302015
Returns – Advisor SeriesFor the 12-month periods ended December 31 and the six-monthperiod ended June 30, 2015
15%
10%
5%
-5%
-15%
0%
Dec. 312010
Dec. 312011
Dec. 312008
Dec. 312009
-10%-6.0%
8.8%5.4% 4.8%
6.5%
1.6%4.8%
1.5%
Dec. 312012
Dec. 312013
Dec. 312014
June 302015
4
HSBC World Selection Diversified Conservative Fund
Summary of Investment PortfolioAs at June 30, 2015
HSBC Canadian Bond Fund – Institutional Series 43.16%HSBC Mortgage Fund – Institutional Series 14.46%HSBC Dividend Fund – Institutional Series 10.91%HSBC Canadian Money Market Fund – Institutional Series 7.03%Capital Group Global Equity Fund (Canada) – Class I 6.54%HSBC Equity Fund – Institutional Series 5.88%HSBC Emerging Markets Debt Fund – Institutional Series 5.02%HSBC Global Equity Fund – Institutional Series 5.01%HSBC Emerging Markets Fund – Institutional Series 1.68%Cash & Equivalents 0.31%Total top 25 investments 100.00%
* The Fund had less than 25 holdings as at June 30, 2015.
The Summary of Investment Portfolio may change due to ongoing portfolio transactions of the Fund, and is available quarterly.
The Fund invests in other mutual funds, and the prospectus and other information about the underlying funds is available on SEDAR atwww.sedar.com.
5
For more information
You can find more information about HSBC Mutual Fundsin the Fund’s Simplified Prospectus, Annual InformationForm, Annual and Semi-Annual Report and Fund Facts. Youcan get a copy of these documents, as well as the Fund’sFinancial Statements, at no cost by calling 1-888-390-3333,by contacting your authorized dealer or by visiting ourwebsite at www.hsbc.ca/investment-resources.
These documents and other information about the HSBCMutual Funds, such as information circulars and materialcontracts, are also available at www.sedar.com.
Copies of the Annual Report and Semi-Annual Report,Simplified Prospectus, Annual Information Form, Annualand Interim Management Report of Fund Performanceand Fund Facts are available on our website atwww.hsbc.ca/investment-resources.
How to reach us
Vancouver
HSBC Global Asset Management (Canada) Limited3rd Floor, 885 West Georgia StreetVancouver, BC V6C 3E8
Tel: 1-888-390-3333Fax: 604-669-2756
TorontoSuite 300 – 70 York StreetToronto, ON M5J 1S9
Montreal
Suite 300 – 2001 McGill College AvenueMontreal, QC H3A 1G1
A NOTE ON FORWARD-LOOKING STATEMENTS
This report may contain forward-looking statements about the Fund, including its strategy, expected performance and condition. Forward-lookingstatements include statements that are predictive in nature that depend upon or refer to future events or conditions, or that include words such as“expects,” “anticipates,” “intends,” “plans,” “believes,” “estimates” or negative versions thereof and similar expressions. In addition, any statement thatmay be made concerning future performance, strategies or prospects, and possible future Fund action, is also a forward-looking statement. Forward-lookingstatements are based on current expectations and projections about future events and are inherently subject to, among other things, risks, uncertaintiesand assumptions about the Fund and economic factors.
Forward-looking statements are not guarantees of future performance, and actual events and results could differ materially from those expressed or impliedin any forward-looking statements made by the Fund. Any number of important factors could contribute to these digressions, including, but not limited to,general economic, political and market factors in North America and internationally, interest and foreign exchange rates, global equity and capital markets,business competition, technological change, changes in government regulations, unexpected judicial or regulatory proceedings, and catastrophic events.
We stress that the above-mentioned list of important factors is not exhaustive. We encourage you to consider these and other factors carefully beforemaking any investment decisions and we urge you to avoid placing undue reliance on forward-looking statements. Further, you should be aware of the factthat the Fund has no specific intention of updating any forward-looking statements, whether as a result of new information, future events or otherwise.
Sources: HSBC Global Asset Management (Canada) Limited, Bloomberg, MSCI, FTSE TMX Global Debt Capital Markets Inc., Bank of Canada.
Neither MSCI nor any other party involved in or related to compiling, computing or creating the MSCI data makes any express or implied warranties orrepresentations with respect to such data (or the results to be obtained by the use thereof), and all such parties hereby expressly disclaim all warranties oforiginality, accuracy, completeness, merchantability or fitness for a particular purpose with respect to any of such data. Without limiting any of theforegoing, in no event shall MSCI, any of its affiliates or any third party involved in or related to compiling, computing or creating the data have any liabilityfor any direct, indirect, special, punitive, consequential or any other damages (including lost profits) even if notified of the possibility of such damages. Nofurther distribution or dissemination of the MSCI data is permitted without MSCI’s express written consent.
FTSE TMX Global Debt Capital Markets Inc. (“FTDCM”), FTSE International Limited (“FTSE”), the London Stock Exchange Group companies (the“Exchange”) or TSX Inc. (“TSX” and together with FTDCM, FTSE and the Exchange, the “Licensor Parties”). The Licensor Parties make no warranty orrepresentation whatsoever, expressly or impliedly, either as to the results to be obtained from the use of the FTSE TMX Canada Index and/or the figure atwhich the said Index stands at any particular time on any particular day or otherwise. The Index is compiled and calculated by FTDCM and all copyright inthe Index values and constituent lists vests in FTDCM. The Licensor Parties shall not be liable (whether in negligence or otherwise) to any person for anyerror in the Index and the Licensor Parties shall not be under any obligation to advise any person of any error therein. “TMX” is a trade mark of TSX Inc. andis used under licence. “FTSE®” is a trade mark of FTSE International Limited and is used by FTDCM under licence.
Unauthorized reproduction, distribution, transmission or publication without our prior written consent is strictly prohibited.
Issued byHSBC Global Asset Management (Canada) Limited (2
015-
08)R
RD
HSBC World Selection DiversifiedModerate Conservative Fund
Interim Management Report of Fund Performance
for the six months ended June 30, 2015
HSBC World Selection Diversified Moderate Conservative Fund
Management Discussion of Fund PerformanceIn this document, you and your refer to the unitholder of the Fund;we, us and our refer to HSBC Global Asset Management (Canada)Limited; and the Fund refers to the HSBC World SelectionDiversified Moderate Conservative Fund.
We are the manager, trustee and primary investment advisor ofthe Fund.
IntroductionThis Interim Management Report of Fund Performance containsfinancial highlights but does not contain the complete annual or semi-annual financial statements of the investment fund. You may obtain acopy of the Fund’s annual or semi-annual financial statements at yourrequest, at no cost, by calling us toll-free at 1-888-390-3333, by visitingour website at www.hsbc.ca/investment-resources, by visiting theSEDAR website at www.sedar.com or by writing to us at:
Corporate SecretaryHSBC Global Asset Management (Canada) Limited3rd Floor, 885 West Georgia StreetVancouver, BC V6C 3E8
You may also contact us using one of these methods to request acopy of the Fund’s proxy voting policies and procedures, proxy votingdisclosure record or quarterly statement of investment portfolio.
Results of OperationsAs of June 30, 2015, the Fund’s net assets increased by 21.1% to$255.8 million from $211.2 million at the end of 2014. Of thisincrease, a $6.4 million gain was attributable to investmentperformance and $38.2 million was attributable to netcontributions to the Fund.
Investment PerformanceThe HSBC World Selection Diversified Moderate Conservative Fund(Investor Series) rose 3.10% for the six months ending June 30, 2015,while its benchmark rose 3.61% for the same period. Its benchmarkis a composite of the FTSE TMX Canada 91-Day Treasury Bill Index(5%), the FTSE TMX Canada Universe Bond Index (51%), theS&P/TSX Composite Index (24%) and the MSCI World Index (inCanadian dollars) (20%).
During the first half of 2015, the MSCI World Index (in Canadiandollars) rose 10.70%, with much of this gain attributable to a weakCanadian dollar. Over the same period, the S&P/TSX Composite Indexwas up 0.91%. The strongest sectors were healthcare (+58.33),consumer discretionary (+7.80) and consumer staples (+3.23%). Theweakest sectors were industrials (�8.08%), energy (�5.36) andutilities (�4.50%). The Canadian bond market was strong in the firstquarter as the Bank of Canada surprised the market with a 25-basis-point rate cut. Deflation fears drove eurozone bond yields to all-timelows. Global government bond yields moved higher, however, in
the second quarter as the risk of eurozone deflation diminished. TheFTSE TMX Canada Universe Bond Index gained 2.37%, year-to-date.
The Fund achieved a positive return, with contributions from each ofthe major asset classes noted above. The Fund maintained a modestpreference for equities and a more pronounced preference forcorporate bonds relative to cash and government bonds during thefirst six months of the year. This positioning was beneficial toperformance. Security selection in equities provided a return close tothe benchmark.
Recent DevelopmentsThe US Economy contracted 0.2% in the first quarter. But we expecta rebound of growth for the rest of 2015, with 2.2% growth expectedfor the full year. In Canada, growth contracted by 0.6% in the firstquarter and April was 0.1% lower. Business investment and tradenumbers were disappointing, but US and Canadian consumerscontinue to add to growth. HSBC forecasts 2015 growth of 1.4% inCanada and 2.4% globally.
A softening of global economic expectations combined with theanticipation of eventual rate hikes from the US Federal Reserve werea definite headwind for equity markets in the first half of 2015.Another major headwind for earnings growth domestically continuesto be the energy sector. Looking ahead, we continue to see betterreturn prospects for corporate assets, both equity and debt, based onstrong fundamentals and reasonable valuations. However, corporateearnings are expected to contract modestly this year, led lower by theenergy sector, before rebounding in 2016. The Fund is somewhat lessexposed to domestic equities than in recent quarters.
Related Party TransactionsWe, on behalf of the Fund, or the Fund Manager, may, from time totime, enter into transactions or arrangements with or involving othermembers of the HSBC Group or other people or companies relatedor connected to us or the Fund. To proceed with the transactions,the Fund relies on the positive recommendation of the Fund’sIndependent Review Committee. A condition of this positiverecommendation is that the transactions are performed inaccordance with our policy on Related Party Transactions. For moregeneral information on persons related to the Fund and the types ofpotential transactions, see the Fund’s Simplified Prospectus.
The following is a summary of current transactions andarrangements with entities that are related to us or the Fund.
Manager, Trustee and Investment AdvisorWe are the manager, trustee and primary investment advisor ofthe Fund. As manager, we manage the overall business andoperations of the Fund. As trustee, we hold legal title to theproperty of the Fund on your behalf. As primary investment
1
HSBC World Selection Diversified Moderate Conservative Fund
advisor, we provide investment advice and portfolio managementservices to the Fund. We receive a fee from the Fund for theseservices based on assets under management, calculated daily andpaid monthly.
Custodial ServicesHSBC Bank Canada (“the Bank”) (of which we are a wholly ownedsubsidiary) is the custodian of the Fund. All fees for these serviceswere waived by the Bank.
Distribution ServicesThe Fund is distributed through us, HSBC Investment Funds(Canada) Inc. (our wholly owned subsidiary); HSBC Private WealthServices (Canada) Inc. and through HSBC Securities (Canada) Inc.(an affiliate) directly or through its division, HSBC InvestDirect. Wepay distribution and servicing fees to them based on the amountof assets held in the investor’s account, and additionally, in somecases, on the amount of the initial purchase. If you hold units ofthis Fund and/or other HSBC Mutual Funds in a registered planwith HSBC Investment Funds (Canada) Inc., they may charge youan annual fee to cover the annual administration costs of the plan.We permit HSBC Investment Funds (Canada) Inc. to collect thesefees by redeeming sufficient units of the Fund with the highestmarket value in your registered plan.
Fund on Fund InvestingDuring the period, the Fund invested in units of other HSBC MutualFunds, which are also managed by us. To proceed with thetransactions, the Fund relied on the positive recommendation of theFund’s Independent Review Committee by way of StandingInstruction. A condition of this positive recommendation was thatthe transactions were performed in accordance with our policy onFund on Fund Investing.
Financial HighlightsThe following tables show selected key financial information aboutthe Fund and are intended to help you understand the Fund’sfinancial performance for the six-month period ended June 30, 2015and for the last five years ended December 31, as applicable. In theyear a fund is established, “period” represents the period frominception to December 31 or June 30 of that fiscal year, asapplicable. This information is derived from the Fund’s unauditedsemi-annual financial statements and audited annual financialstatements. The information in the following tables is based onprescribed regulations, and as a result, is not expected to add due tothe increase/decrease in net assets from operations being based onaverage units outstanding during the period and all other numbersbeing based on actual units outstanding at the relevant point in time.
HSBC World Selection Diversified ModerateConservative Fund – Investor Series – Net Assetsper Unit (1)
Period ended June 30, 2015 (unaudited)and years ended December 31 Inception: December 2004
June 30
2015
Dec. 31
2014
Dec. 31
2013
Dec. 31
2012
Dec. 31
2011
Dec. 31
2010
Net assets per unit,beginning of period (2) $12.76 $12.01 $11.26 $10.69 $10.86 $10.42
Total increase (decrease) from operations (2) $(0.03)
Distributions to unitholders:
From income (excluding dividends) –From dividends –From capital gains –From return of capital –
Total annual distributions (2,3) $–
Net assets per unit, end of period (2) $9.98
Ratios and Supplemental DataJune 30
2015
NAV (in 000s) (4) $38Units outstanding (in 000s) (4) 4Management expense ratio (“MER”) (5) 0.21%MER before absorbed or waived fees (5) 0.21%Portfolio turnover rate (6) 6.67%Trading expense ratio (7) 0.04%NAV per unit (4) $9.98
(1) This information is derived from the Fund’s unaudited semi-annualfinancial statements and audited annual financial statements. The netassets per unit presented in the financial statements differ from thenet asset value calculated for fund pricing purposes.
(2) Net assets per unit and distributions per unit are based on the actualnumber of units outstanding for the relevant series at the relevanttime. The increase/decrease in net assets from operations per unit isbased on the weighted average number of units outstanding for therelevant series over the fiscal period.
(3) Distributions are automatically reinvested in additional units of theFund, unless the unitholder withdraws from the automaticreinvestment plan by providing written notice to us.
(4) This information is provided as at period-end.
(5) MER includes the total expenses of each Fund, including the Goodsand Services Tax and/or Harmonized Sales Tax thereon, other thanbrokerage commissions on securities transactions and any foreignwithholding taxes on income, as an annualized percentage of averagenet asset value (“NAV”) of the respective series of unit for the period.In the period a series is established, the MER is annualized from thedate of inception to the end of the period. The MER may vary fromone mutual fund to another and from one series of units to another.We may have waived or absorbed certain fees and expensesotherwise payable by the Fund. The amount of expenses absorbed orwaived is at the discretion of and can be terminated at any time by us.
3
HSBC World Selection Diversified Moderate Conservative Fund
The Fund may invest in units of other mutual funds and pooled funds.You should note that in addition to the fees and expenses paid by theFund, these other funds have their own operating expenses to pay.The Fund will effectively bear the operating expenses of the otherfunds in proportion to its holdings in the other funds. However, theFund will not invest in units of other funds if the Fund would berequired to pay any management fees in respect of suchinvestments. In addition, the Fund will not make investments in otherfunds if the Fund would be required to pay any sales or redemptionfees in respect of such investments that duplicate a fee payable byunitholders of the Fund.
(6) The Fund’s portfolio turnover rate indicates how actively the Fund’sportfolio advisor manages its portfolio investments. A portfolioturnover rate of 100% is equivalent to the Fund buying and selling allof the securities in its portfolio once in the course of the period. Thehigher the Fund’s portfolio turnover rate in a period, the greater thetrading costs payable by the Fund in the period, and the greater thechance of an investor receiving taxable capital gains in the period.There is not necessarily a relationship between a high turnover rateand the performance of the Fund. The rate is calculated based on thelesser of purchases or sales of securities divided by the averageweighted market value of the portfolio securities, excluding short-termsecurities.
(7) The trading expense ratio represents commissions and other portfoliotransaction costs expressed as an annualized percentage of dailyaverage net asset value during the period.
Management FeesFor the six months ended June 30, 2015, the Fund paid usmanagement fees of $1,808,611. The management fee for eachseries is calculated as a percentage of the daily net asset value forthat series. The fees are reduced, where required, so that thesefees do not duplicate fees payable by mutual funds in which theFund invests for the same service.
The Fund’s management fees were used by us to pay costs formanaging the investment portfolio, providing investment analysisand recommendations, making investment decisions, makingbrokerage arrangements for the purchase and sale of theinvestment portfolio and providing other services. Themanagement fees also funded commission payments and othercompensation to sales representatives and registered dealers andbrokers (collectively “distribution costs”), including HSBC BankCanada, for units of the Fund bought and held by unitholders.Finally, we used management fees to pay for additional marketingand distribution services to the Fund.
For the six months ended June 30, 2015, approximately 45% ofthe total management fees collected from all HSBC Mutual Fundswere used to fund distribution costs. In comparison, for the Fund,such distribution costs represented 43% of the management feescollected. This may vary by series depending on the assetsinvested in each of the series.
Past PerformanceThe performance information shown assumes that all distributionsmade by the Fund in the periods shown were reinvested inadditional securities of the Fund. The performance informationdoes not take into account sales, redemption, distribution, optionalcharges or expenses you may be charged outside of the Fund orthe effect of any income tax you may have to pay as a result ofyour investment in the Fund that would have reduced returns orperformance. The Fund’s past performance does not necessarilyindicate how it will perform in the future.
Year-by-Year ReturnsThe following bar charts show the Fund’s performance for thesix-month period ended June 30, 2015, and for each of theprevious 12-month periods ended December 31. In percentageterms, the bar charts show how much an investment made on thefirst day of each financial period would have grown or decreasedby the last day of each financial period.
Returns – Investor SeriesFor the 12-month periods ended December 31 and the six-monthperiod ended June 30, 201515%
10%
0%
-15%
5%
Dec. 312006
Dec. 312007
Dec. 312008
Dec. 312009
Dec. 312010
Dec. 312011
-5%
-10%
6.9%
0.9%
-8.7%
9.5%
5.1% 6.1%7.7% 7.2%
3.1%
Dec. 312012
Dec. 312014
June 302015
Dec. 312013
0.2%
Returns – Advisor SeriesFor the 12-month periods ended December 31 and the six-monthperiod ended June 30, 201515%
5%
-15%
0%
Dec. 312011
-10%
-5%
10%
0.2%
6.2%
0.0% 0.0% 0.0%
Dec. 312012
Dec. 312014
June 302015
Dec. 312013*
* The Advisor Series was fully redeemed during 2013; however, it remainsin operation at period-end.
4
HSBC World Selection Diversified Moderate Conservative Fund
Summary of Investment PortfolioAs at June 30, 2015
HSBC Canadian Bond Fund – Institutional Series 31.75%Capital Group Global Equity Fund (Canada) – Class I 13.50%HSBC Mortgage Fund – Institutional Series 11.69%HSBC Dividend Fund – Institutional Series 9.78%HSBC Global Equity Fund – Institutional Series 6.85%HSBC Canadian Money Market Fund – Institutional Series 5.79%Synergy Canadian Corporate Class – Series I 5.23%HSBC Emerging Markets Debt Fund – Institutional Series 4.89%Sionna Canadian Equity Fund – Class I 3.96%HSBC Equity Fund – Institutional Series 3.88%HSBC Emerging Markets Fund – Institutional Series 2.40%Cash & Equivalents 0.28%Total top 25 investments 100.00%
* The Fund had less than 25 holdings as at June 30, 2015.
The Summary of Investment Portfolio may change due to ongoing portfolio transactions of the Fund, and is available quarterly.
The Fund invests in other mutual funds, and the prospectus and other information about the underlying funds is available on SEDAR atwww.sedar.com.
5
For more information
You can find more information about HSBC Mutual Fundsin the Fund’s Simplified Prospectus, Annual InformationForm, Annual and Semi-Annual Report and Fund Facts. Youcan get a copy of these documents, as well as the Fund’sFinancial Statements, at no cost by calling 1-888-390-3333,by contacting your authorized dealer or by visiting ourwebsite at www.hsbc.ca/investment-resources.
These documents and other information about the HSBCMutual Funds, such as information circulars and materialcontracts, are also available at www.sedar.com.
Copies of the Annual Report and Semi-Annual Report,Simplified Prospectus, Annual Information Form, Annualand Interim Management Report of Fund Performanceand Fund Facts are available on our website atwww.hsbc.ca/investment-resources.
How to reach us
Vancouver
HSBC Global Asset Management (Canada) Limited3rd Floor, 885 West Georgia StreetVancouver, BC V6C 3E8
Tel: 1-888-390-3333Fax: 604-669-2756
TorontoSuite 300 – 70 York StreetToronto, ON M5J 1S9
MontrealSuite 300 – 2001 McGill College AvenueMontreal, QC H3A 1G1
A NOTE ON FORWARD-LOOKING STATEMENTS
This report may contain forward-looking statements about the Fund, including its strategy, expected performance and condition. Forward-lookingstatements include statements that are predictive in nature that depend upon or refer to future events or conditions, or that include words such as“expects,” “anticipates,” “intends,” “plans,” “believes,” “estimates” or negative versions thereof and similar expressions. In addition, any statement thatmay be made concerning future performance, strategies or prospects, and possible future Fund action, is also a forward-looking statement. Forward-lookingstatements are based on current expectations and projections about future events and are inherently subject to, among other things, risks, uncertaintiesand assumptions about the Fund and economic factors.
Forward-looking statements are not guarantees of future performance, and actual events and results could differ materially from those expressed or impliedin any forward-looking statements made by the Fund. Any number of important factors could contribute to these digressions, including, but not limited to,general economic, political and market factors in North America and internationally, interest and foreign exchange rates, global equity and capital markets,business competition, technological change, changes in government regulations, unexpected judicial or regulatory proceedings, and catastrophic events.
We stress that the above-mentioned list of important factors is not exhaustive. We encourage you to consider these and other factors carefully beforemaking any investment decisions and we urge you to avoid placing undue reliance on forward-looking statements. Further, you should be aware of the factthat the Fund has no specific intention of updating any forward-looking statements, whether as a result of new information, future events or otherwise.
Sources: HSBC Global Asset Management (Canada) Limited, Bloomberg, MSCI, FTSE TMX Global Debt Capital Markets Inc., Bank of Canada.
Neither MSCI nor any other party involved in or related to compiling, computing or creating the MSCI data makes any express or implied warranties orrepresentations with respect to such data (or the results to be obtained by the use thereof), and all such parties hereby expressly disclaim all warranties oforiginality, accuracy, completeness, merchantability or fitness for a particular purpose with respect to any of such data. Without limiting any of theforegoing, in no event shall MSCI, any of its affiliates or any third party involved in or related to compiling, computing or creating the data have any liabilityfor any direct, indirect, special, punitive, consequential or any other damages (including lost profits) even if notified of the possibility of such damages. Nofurther distribution or dissemination of the MSCI data is permitted without MSCI’s express written consent.
FTSE TMX Global Debt Capital Markets Inc. (“FTDCM”), FTSE International Limited (“FTSE”), the London Stock Exchange Group companies (the“Exchange”) or TSX Inc. (“TSX” and together with FTDCM, FTSE and the Exchange, the “Licensor Parties”). The Licensor Parties make no warranty orrepresentation whatsoever, expressly or impliedly, either as to the results to be obtained from the use of the FTSE TMX Canada Index and/or the figure atwhich the said Index stands at any particular time on any particular day or otherwise. The Index is compiled and calculated by FTDCM and all copyright inthe Index values and constituent lists vests in FTDCM. The Licensor Parties shall not be liable (whether in negligence or otherwise) to any person for anyerror in the Index and the Licensor Parties shall not be under any obligation to advise any person of any error therein. “TMX” is a trade mark of TSX Inc. andis used under licence. “FTSE®” is a trade mark of FTSE International Limited and is used by FTDCM under licence.
Unauthorized reproduction, distribution, transmission or publication without our prior written consent is strictly prohibited.
Issued byHSBC Global Asset Management (Canada) Limited (2
015-
08)R
RD
HSBC World SelectionDiversified Balanced Fund
Interim Management Report of Fund Performance
for the six months ended June 30, 2015
HSBC World Selection Diversified Balanced Fund
Management Discussion of Fund PerformanceIn this document, you and your refer to the unitholder of the Fund;we, us and our refer to HSBC Global Asset Management (Canada)Limited; and the Fund refers to the HSBC World SelectionDiversified Balanced Fund.
We are the manager, trustee and primary investment advisor ofthe Fund.
IntroductionThis Interim Management Report of Fund Performance containsfinancial highlights but does not contain the complete annual or semi-annual financial statements of the investment fund. You may obtain acopy of the Fund’s annual or semi-annual financial statements at yourrequest, at no cost, by calling us toll-free at 1-888-390-3333, by visitingour website at www.hsbc.ca/investment-resources, by visiting theSEDAR website at www.sedar.com or by writing to us at:
Corporate SecretaryHSBC Global Asset Management (Canada) Limited3rd Floor, 885 West Georgia StreetVancouver, BC V6C 3E8
You may also contact us using one of these methods to request acopy of the Fund’s proxy voting policies and procedures, proxyvoting disclosure record or quarterly statement of investmentportfolio.
Results of OperationsAs of June 30, 2015, the Fund’s net assets increased by 19.5% to$484.4 million from $405.5 million at the end of 2014. Of thisincrease, a $17.7 million gain was attributable to investmentperformance and $61.2 million was attributable to netcontributions to the Fund.
Investment PerformanceThe HSBC World Selection Diversified Balanced Fund (InvestorSeries) rose 4.40% for the six months ending June 30, 2015, while itsbenchmark rose 4.46% for the same period. Its benchmark is acomposite of the FTSE TMX Canada 91-Day Treasury Bill Index (5%),the FTSE TMX Canada Universe Bond Index (32%), the S&P/TSXComposite Index (31.5%) and the MSCI World Index (in Canadiandollars) (31.5%).
During the first half of 2015, the MSCI World Index (in Canadiandollars) rose 10.70%, with much of this gain attributable to a weakCanadian dollar. Over the same period, the S&P/TSX Composite Indexwas up 0.91%. The strongest sectors were healthcare (+58.33),consumer discretionary (+7.80) and consumer staples (+3.23%). Theweakest sectors were industrials (�8.08%), energy (�5.36) andutilities (�4.50%). The Canadian bond market was strong in the firstquarter as the Bank of Canada surprised the market with a 25-basis-point rate cut. Deflation fears drove eurozone bond yields to
all-time lows. Global government bond yields moved higher, however,in the second quarter as the risk of eurozone deflation diminished. TheFTSE TMX Canada Universe Bond Index gained 2.37%, year-to-date.
The Fund achieved a positive return, with contributions from each ofthe major asset classes noted above. The Fund maintained a modestpreference for equities and a more pronounced preference forcorporate bonds relative to cash and government bonds during thefirst six months of the year. This positioning was beneficial toperformance. Security selection in equities provided a return close tothe benchmark.
Recent DevelopmentsThe US economy contracted 0.2% in the first quarter. But we expecta rebound of growth for the rest of 2015, with 2.2% growth expectedfor the full year. In Canada, growth contracted by 0.6% in the firstquarter and April was 0.1% lower. Business investment and tradenumbers were disappointing, but US and Canadian consumerscontinue to add to growth. HSBC forecasts 2015 growth of 1.4% inCanada and 2.4% globally.
A softening of global economic expectations combined with theanticipation of eventual rate hikes from the US Federal Reserve werea definite headwind for equity markets in the first half of 2015.Another major headwind for earnings growth domestically continuesto be the energy sector. Looking ahead, we continue to see betterreturn prospects for corporate assets, both equity and debt, based onstrong fundamentals and reasonable valuations. However, corporateearnings are expected to contract modestly this year, led lower by theenergy sector, before rebounding in 2016. The Fund is somewhat lessexposed to domestic equities than in recent quarters.
Related Party TransactionsWe, on behalf of the Fund, or the Fund Manager, may, from timeto time, enter into transactions or arrangements with or involvingother members of the HSBC Group or other people or companiesrelated or connected to us or the Fund. To proceed with thetransactions, the Fund relies on the positive recommendation ofthe Fund’s Independent Review Committee. A condition of thispositive recommendation is that the transactions are performed inaccordance with our policy on Related Party Transactions. Formore general information on persons related to the Fund and thetypes of potential transactions, see the Fund’s SimplifiedProspectus.
The following is a summary of current transactions andarrangements with entities that are related to us or the Fund.
Manager, Trustee and Investment AdvisorWe are the manager, trustee and primary investment advisor ofthe Fund. As manager, we manage the overall business and
1
HSBC World Selection Diversified Balanced Fund
operations of the Fund. As trustee, we hold legal title to theproperty of the Fund on your behalf. As primary investmentadvisor, we provide investment advice and portfolio managementservices to the Fund. We receive a fee from the Fund for theseservices based on assets under management, calculated daily andpaid monthly.
Custodial ServicesHSBC Bank Canada (“the Bank”) (of which we are a wholly ownedsubsidiary) is the custodian of the Fund. All fees for these serviceswere waived by the Bank.
Distribution ServicesThe Fund is distributed through us, HSBC Investment Funds(Canada) Inc. (our wholly owned subsidiary); HSBC Private WealthServices (Canada) Inc. and through HSBC Securities (Canada) Inc.(an affiliate) directly or through its division, HSBC InvestDirect. Wepay distribution and servicing fees to them based on the amountof assets held in the investor’s account, and additionally, in somecases, on the amount of the initial purchase. If you hold units ofthis Fund and/or other HSBC Mutual Funds in a registered planwith HSBC Investment Funds (Canada) Inc., they may charge youan annual fee to cover the annual administration costs of the plan.We permit HSBC Investment Funds (Canada) Inc. to collect thesefees by redeeming sufficient units of the Fund with the highestmarket value in your registered plan.
Fund on Fund InvestingDuring the period, the Fund invested in units of other HSBCMutual Funds, which are also managed by us. To proceed with thetransactions, the Fund relied on the positive recommendation ofthe Fund’s Independent Review Committee by way of StandingInstruction. A condition of this positive recommendation was thatthe transactions were performed in accordance with our policy onFund on Fund Investing.
Financial HighlightsThe following tables show selected key financial information aboutthe Fund and are intended to help you understand the Fund’sfinancial performance for the six-month period ended June 30,2015 and for the last five years ended December 31, as applicable.In the year a fund is established, “period” represents the periodfrom inception to December 31 or June 30 of that fiscal year, asapplicable. This information is derived from the Fund’s unauditedsemi-annual financial statements and audited annual financialstatements. The information in the following tables is based onprescribed regulations, and as a result, is not expected to add dueto the increase/decrease in net assets from operations beingbased on average units outstanding during the period and all othernumbers being based on actual units outstanding at the relevantpoint in time.
HSBC World Selection Diversified BalancedFund – Investor Series – Net Assets per Unit (1)
Period ended June 30, 2015 (unaudited)and years ended December 31 Inception: December 2004
June 30
2015
Dec. 31
2014
Dec. 31
2013
Dec. 31
2012
Dec. 31
2011
Dec. 31
2010
Net assets per unit,
beginning of period (2) $13.95 $13.01 $11.56 $10.76 $11.12 $10.56
Total increase (decrease) from operations (2) $0.12 $0.10 $0.06
Distributions to unitholders:
From income (excluding dividends) – – –From dividends – – –From capital gains – – –From return of capital – – –
Total annual distributions (2,3) $– $– $–
Net assets per unit, end of period (2) $– $– $10.06
* The Institutional Series was fully redeemed during 2014; however, itremains in operation at period-end.
Ratios and Supplemental DataJune 30
2015
Dec. 31
2014
Dec. 31
2013
NAV (in 000s) (4) $– $– $47Units outstanding (in 000s) (4) – – 5Management expense ratio (“MER”) (5) 0.02% 0.10% 0.11%MER before absorbed or waived fees (5) 0.02% 0.10% 0.11%Portfolio turnover rate (6) 9.46% 6.08% 26.82%Trading expense ratio (7) 0.07% 0.06% 0.02%NAV per unit (4) $– $– $10.06
(1) This information is derived from the Fund’s unaudited semi-annualfinancial statements and audited annual financial statements. The netassets per unit presented in the financial statements differ from thenet asset value calculated for fund pricing purposes.
(2) Net assets per unit and distributions per unit are based on the actualnumber of units outstanding for the relevant series at the relevanttime. The increase/decrease in net assets from operations per unit isbased on the weighted average number of units outstanding for therelevant series over the fiscal period.
(3) Distributions are automatically reinvested in additional units of theFund, unless the unitholder withdraws from the automaticreinvestment plan by providing written notice to us.
(4) This information is provided as at period-end.
(5) MER includes the total expenses of each Fund, including the Goodsand Services Tax and/or Harmonized Sales Tax thereon, other thanbrokerage commissions on securities transactions and any foreignwithholding taxes on income, as an annualized percentage of averagenet asset value (“NAV”) of the respective series of unit for the period.In the period a series is established, the MER is annualized from thedate of inception to the end of the period. The MER may vary fromone mutual fund to another and from one series of units to another.We may have waived or absorbed certain fees and expensesotherwise payable by the Fund. The amount of expenses absorbed orwaived is at the discretion of and can be terminated at any time by us.
3
HSBC World Selection Diversified Balanced Fund
The Fund may invest in units of other mutual funds and pooled funds.You should note that in addition to the fees and expenses paid by theFund, these other funds have their own operating expenses to pay.The Fund will effectively bear the operating expenses of the otherfunds in proportion to its holdings in the other funds. However, theFund will not invest in units of other funds if the Fund would berequired to pay any management fees in respect of such investments.In addition, the Fund will not make investments in other funds if theFund would be required to pay any sales or redemption fees in respectof such investments that duplicate a fee payable by unitholders of theFund.
(6) The Fund’s portfolio turnover rate indicates how actively the Fund’sportfolio advisor manages its portfolio investments. A portfolio turnoverrate of 100% is equivalent to the Fund buying and selling all of thesecurities in its portfolio once in the course of the period. The higher theFund’s portfolio turnover rate in a period, the greater the trading costspayable by the Fund in the period, and the greater the chance of aninvestor receiving taxable capital gains in the period. There is notnecessarily a relationship between a high turnover rate and theperformance of the Fund. The rate is calculated based on the lesser ofpurchases or sales of securities divided by the average weighted marketvalue of the portfolio securities, excluding short-term securities.
(7) The trading expense ratio represents commissions and other portfoliotransaction costs expressed as an annualized percentage of dailyaverage net asset value during the period.
Management FeesFor the six months ended June 30, 2015, the Fund paid usmanagement fees of $4,009,714. The management fee for eachseries is calculated as a percentage of the daily net asset value forthat series. The fees are reduced, where required, so that thesefees do not duplicate fees payable by mutual funds in which theFund invests for the same service.
The Fund’s management fees were used by us to pay costs formanaging the investment portfolio, providing investment analysisand recommendations, making investment decisions, makingbrokerage arrangements for the purchase and sale of theinvestment portfolio and providing other services. Themanagement fees also funded commission payments and othercompensation to sales representatives and registered dealers andbrokers (collectively “distribution costs”), including HSBC BankCanada, for units of the Fund bought and held by unitholders.Finally, we used management fees to pay for additional marketingand distribution services to the Fund.
For the six months ended June 30, 2015, approximately 45% ofthe total management fees collected from all HSBC Mutual Fundswere used to fund distribution costs. In comparison, for the Fund,such distribution costs represented 40% of the management feescollected. This may vary by series depending on the assetsinvested in each of the series.
Past PerformanceThe performance information shown assumes that all distributionsmade by the Fund in the periods shown were reinvested inadditional securities of the Fund. The performance informationdoes not take into account sales, redemption, distribution, optionalcharges or expenses you may be charged outside of the Fund orthe effect of any income tax you may have to pay as a result ofyour investment in the Fund that would have reduced returns orperformance. The Fund’s past performance does not necessarilyindicate how it will perform in the future.
Year-by-Year ReturnsThe following bar charts show the Fund’s performance for thesix-month period ended June 30, 2015, and for each of theprevious 12-month periods ended December 31. In percentageterms, the bar charts show how much an investment made on thefirst day of each financial period would have grown or decreasedby the last day of each financial period.
Returns – Investor SeriesFor the 12-month periods ended December 31 and the six-monthperiod ended June 30, 201520%
10%
0%
-20%Dec. 31
2006Dec. 31
2007Dec. 31
2008Dec. 31
2009Dec. 31
2010Dec. 31
2011
-10%
9.8%
0.2%
-15.4%
12.3%
5.9%7.8%
13.0%
7.7%4.4%
-2.5%
Dec. 312012
Dec. 312014
June 302015
Dec. 312013
Returns – Advisor SeriesFor the 12-month periods ended December 31 and the six-monthperiod ended June 30, 201520%
10%
-10%
-20%
0%
Dec. 312011
-2.4%
7.8%
13.0%
7.6%4.3%
Dec. 312012
Dec. 312013
Dec. 312014
June 302015
4
HSBC World Selection Diversified Balanced Fund
Summary of Investment PortfolioAs at June 30, 2015
Asset MixPercentage
of NAV
International Equities 35.42%Bonds 30.91%Canadian Equities 29.02%Cash & Equivalents 4.65%Total 100.00%
Top 25 Holdings*Percentage
of NAV
HSBC Canadian Bond Fund – Institutional Series 20.60%Capital Group Global Equity Fund (Canada) – Class I 10.29%HSBC Equity Fund – Institutional Series 8.77%Mackenzie Global Growth Class, Series O 7.14%Brandes Global Equity Fund – Class I 7.00%HSBC Global Equity Fund – Institutional Series 7.00%Synergy Canadian Corporate Class – Series I 5.92%HSBC Dividend Fund – Institutional Series 5.91%Sionna Canadian Equity Fund – Class I 5.62%HSBC Mortgage Fund – Institutional Series 5.12%HSBC Emerging Markets Debt Fund – Institutional Series 5.06%HSBC Canadian Money Market Fund – Institutional Series 4.72%HSBC Emerging Markets Fund – Institutional Series 3.95%HSBC Small Cap Growth Fund – Institutional Series 2.67%Cash & Equivalents 0.23%Total top 25 investments 100.00%
* The Fund had less than 25 holdings as at June 30, 2015.
The Summary of Investment Portfolio may change due to ongoing portfolio transactions of the Fund, and is available quarterly.
The Fund invests in other mutual funds, and the prospectus and other information about the underlying funds is available on SEDAR atwww.sedar.com.
5
For more information
You can find more information about HSBC Mutual Fundsin the Fund’s Simplified Prospectus, Annual InformationForm, Annual and Semi-Annual Report and Fund Facts. Youcan get a copy of these documents, as well as the Fund’sFinancial Statements, at no cost by calling 1-888-390-3333,by contacting your authorized dealer or by visiting ourwebsite at www.hsbc.ca/investment-resources.
These documents and other information about the HSBCMutual Funds, such as information circulars and materialcontracts, are also available at www.sedar.com.
Copies of the Annual Report and Semi-Annual Report,Simplified Prospectus, Annual Information Form, Annualand Interim Management Report of Fund Performanceand Fund Facts are available on our website atwww.hsbc.ca/investment-resources.
How to reach us
VancouverHSBC Global Asset Management (Canada) Limited3rd Floor, 885 West Georgia StreetVancouver, BC V6C 3E8
Tel: 1-888-390-3333Fax: 604-669-2756
TorontoSuite 300 – 70 York StreetToronto, ON M5J 1S9
MontrealSuite 300 – 2001 McGill College AvenueMontreal, QC H3A 1G1
A NOTE ON FORWARD-LOOKING STATEMENTS
This report may contain forward-looking statements about the Fund, including its strategy, expected performance and condition. Forward-lookingstatements include statements that are predictive in nature that depend upon or refer to future events or conditions, or that include words such as“expects,” “anticipates,” “intends,” “plans,” “believes,” “estimates” or negative versions thereof and similar expressions. In addition, any statement thatmay be made concerning future performance, strategies or prospects, and possible future Fund action, is also a forward-looking statement. Forward-lookingstatements are based on current expectations and projections about future events and are inherently subject to, among other things, risks, uncertaintiesand assumptions about the Fund and economic factors.
Forward-looking statements are not guarantees of future performance, and actual events and results could differ materially from those expressed or impliedin any forward-looking statements made by the Fund. Any number of important factors could contribute to these digressions, including, but not limited to,general economic, political and market factors in North America and internationally, interest and foreign exchange rates, global equity and capital markets,business competition, technological change, changes in government regulations, unexpected judicial or regulatory proceedings, and catastrophic events.
We stress that the above-mentioned list of important factors is not exhaustive. We encourage you to consider these and other factors carefully beforemaking any investment decisions and we urge you to avoid placing undue reliance on forward-looking statements. Further, you should be aware of the factthat the Fund has no specific intention of updating any forward-looking statements, whether as a result of new information, future events or otherwise.
Sources: HSBC Global Asset Management (Canada) Limited, Bloomberg, MSCI, FTSE TMX Global Debt Capital Markets Inc., Bank of Canada.
Neither MSCI nor any other party involved in or related to compiling, computing or creating the MSCI data makes any express or implied warranties orrepresentations with respect to such data (or the results to be obtained by the use thereof), and all such parties hereby expressly disclaim all warranties oforiginality, accuracy, completeness, merchantability or fitness for a particular purpose with respect to any of such data. Without limiting any of theforegoing, in no event shall MSCI, any of its affiliates or any third party involved in or related to compiling, computing or creating the data have any liabilityfor any direct, indirect, special, punitive, consequential or any other damages (including lost profits) even if notified of the possibility of such damages. Nofurther distribution or dissemination of the MSCI data is permitted without MSCI’s express written consent.
FTSE TMX Global Debt Capital Markets Inc. (“FTDCM”), FTSE International Limited (“FTSE”), the London Stock Exchange Group companies (the“Exchange”) or TSX Inc. (“TSX” and together with FTDCM, FTSE and the Exchange, the “Licensor Parties”). The Licensor Parties make no warranty orrepresentation whatsoever, expressly or impliedly, either as to the results to be obtained from the use of the FTSE TMX Canada Index and/or the figure atwhich the said Index stands at any particular time on any particular day or otherwise. The Index is compiled and calculated by FTDCM and all copyright inthe Index values and constituent lists vests in FTDCM. The Licensor Parties shall not be liable (whether in negligence or otherwise) to any person for anyerror in the Index and the Licensor Parties shall not be under any obligation to advise any person of any error therein. “TMX” is a trade mark of TSX Inc. andis used under licence. “FTSE®” is a trade mark of FTSE International Limited and is used by FTDCM under licence.
Unauthorized reproduction, distribution, transmission or publication without our prior written consent is strictly prohibited.
(201
5-08
)RR
D
Issued byHSBC Global Asset Management (Canada) Limited
HSBC World SelectionDiversified Growth Fund
Interim Management Report of Fund Performance
for the six months ended June 30, 2015
HSBC World Selection Diversified Growth Fund
Management Discussion of Fund PerformanceIn this document, you and your refer to the unitholder of the Fund;we, us and our refer to HSBC Global Asset Management (Canada)Limited; and the Fund refers to the HSBC World SelectionDiversified Growth Fund.
We are the manager, trustee and primary investment advisor ofthe Fund.
IntroductionThis Interim Management Report of Fund Performance containsfinancial highlights but does not contain the complete annual or semi-annual financial statements of the investment fund. You may obtain acopy of the Fund’s annual or semi-annual financial statements at yourrequest, at no cost, by calling us toll-free at 1-888-390-3333, by visitingour website at www.hsbc.ca/investment-resources, by visiting theSEDAR website at www.sedar.com or by writing to us at:
Corporate SecretaryHSBC Global Asset Management (Canada) Limited3rd Floor, 885 West Georgia StreetVancouver, BC V6C 3E8
You may also contact us using one of these methods to request acopy of the Fund’s proxy voting policies and procedures, proxyvoting disclosure record or quarterly statement of investmentportfolio.
Results of OperationsAs of June 30, 2015, the Fund’s net assets increased by 11.7% to$297.1 million from $266 million at the end of 2014. Of thisincrease, a $14.4 million gain was attributable to investmentperformance and $16.7 million was attributable to netcontributions to the Fund.
Investment PerformanceThe HSBC World Selection Diversified Growth Fund (InvestorSeries) rose 5.46% over the six months ending June 30, 2015,while its benchmark rose 5.13% for the same period. Itsbenchmark is a composite of the MSCI World Index (in Canadiandollars) (40%), the S&P/TSX Composite Index (40%) and theFTSE TMX Canada Universe Bond Index (20%).
During the first half of 2015, the MSCI World Index (in Canadiandollars) rose 10.70%, with much of this gain attributable to a weakCanadian dollar. Over the same period, the S&P/TSX CompositeIndex was up 0.91%. The strongest sectors were healthcare(+58.33), consumer discretionary (+7.80) and consumer staples(+3.23%). The weakest sectors were industrials (�8.08%),energy (�5.36) and utilities (�4.50%). The Canadian bond marketwas strong in the first quarter as the Bank of Canada surprised themarket with a 25-basis-point rate cut. Deflation fears droveeurozone bond yields to all-time lows. Global government
bond yields moved higher, however, in the second quarter as therisk of eurozone deflation diminished. The FTSE TMX CanadaUniverse Bond Index gained 2.37%, year-to-date.
The Fund achieved a positive return, with contributions from eachof the major asset classes noted above. The Fund maintained amodest preference for equities and a more pronouncedpreference for corporate bonds relative to cash and governmentbonds during the first six months of the year. This positioning wasbeneficial to performance. Security selection in equitiescontributed positively to relative performance, resulting in theFund outperforming its benchmark.
Recent DevelopmentsThe US economy contracted 0.2% in the first quarter. But weexpect a rebound of growth for the rest of 2015, with 2.2%growth expected for the full year. In Canada, growth contracted by0.6% in the first quarter and April was 0.1% lower. Businessinvestment and trade numbers were disappointing, but US andCanadian consumers continue to add to growth. HSBC forecasts2015 growth of 1.4% in Canada and 2.4% globally.
A softening of global economic expectations combined with theanticipation of eventual rate hikes from the US Federal Reservewere a definite headwind for equity markets in the first half of2015. Another major headwind for earnings growth domesticallycontinues to be the energy sector. Looking ahead, we continue tosee better return prospects for corporate assets, both equity anddebt, based on strong fundamentals and reasonable valuations.However, corporate earnings are expected to contract modestlythis year, led lower by the energy sector, before rebounding in2016. The Fund is somewhat less exposed to domestic equitiesthan in recent quarters.
Related Party TransactionsWe, on behalf of the Fund, or the Fund Manager, may, from timeto time, enter into transactions or arrangements with or involvingother members of the HSBC Group or other people or companiesrelated or connected to us or the Fund. To proceed with thetransactions, the Fund relies on the positive recommendation ofthe Fund’s Independent Review Committee. A condition of thispositive recommendation is that the transactions are performed inaccordance with our policy on Related Party Transactions. Formore general information on persons related to the Fund and thetypes of potential transactions, see the Fund’s SimplifiedProspectus.
The following is summary of current transactions andarrangements with entities that are related to us or the Fund.
1
HSBC World Selection Diversified Growth Fund
Manager, Trustee and Investment AdvisorWe are the manager, trustee and primary investment advisor of theFund. As manager, we manage the overall business and operationsof the Fund. As trustee, we hold legal title to the property of theFund on your behalf. As primary investment advisor, we provideinvestment advice and portfolio management services to the Fund.We receive a fee from the Fund for these services based on assetsunder management, calculated daily and paid monthly.
Custodial ServicesHSBC Bank Canada (“the Bank”) (of which we are a wholly ownedsubsidiary) is the custodian of the Fund. All fees for these serviceswere waived by the Bank.
Distribution ServicesThe Fund is distributed through us, HSBC Investment Funds(Canada) Inc. (our wholly owned subsidiary); HSBC Private WealthServices (Canada) Inc. and through HSBC Securities (Canada) Inc.(an affiliate) directly or through its division, HSBC InvestDirect. Wepay distribution and servicing fees to them based on the amountof assets held in the investor’s account, and additionally, in somecases, on the amount of the initial purchase. If you hold units ofthis Fund and/or other HSBC Mutual Funds in a registered planwith HSBC Investment Funds (Canada) Inc., they may charge youan annual fee to cover the annual administration costs of the plan.We permit HSBC Investment Funds (Canada) Inc. to collect thesefees by redeeming sufficient units of the Fund with the highestmarket value in your registered plan.
Fund on Fund InvestingDuring the period, the Fund invested in units of other HSBC MutualFunds, which are also managed by us. To proceed with thetransactions, the Fund relied on the positive recommendation of theFund’s Independent Review Committee by way of StandingInstruction. A condition of this positive recommendation was thatthe transactions were performed in accordance with our policy onFund on Fund Investing.
Financial HighlightsThe following tables show selected key financial information aboutthe Fund and are intended to help you understand the Fund’sfinancial performance for the six-month period ended June 30, 2015and for the last five years ended December 31, as applicable. In theyear a fund is established, “period” represents the period frominception to December 31 or June 30 of that fiscal year, asapplicable. This information is derived from the Fund’s unauditedsemi-annual financial statements and audited annual financialstatements. The information in the following tables is based onprescribed regulations, and as a result, is not expected to add due tothe increase/decrease in net assets from operations being based onaverage units outstanding during the period and all other numbersbeing based on actual units outstanding at the relevant point in time.
HSBC World Selection Diversified GrowthFund – Investor Series – Net Assets per Unit (1)
Period ended June 30, 2015 (unaudited)and years ended December 31 Inception: December 2004
June 30
2015
Dec. 31
2014
Dec. 31
2013
Dec. 31
2012
Dec. 31
2011
Dec. 31
2010
Net assets per unit,
beginning of period (2) $15.01 $13.86 $11.74 $10.77 $11.39 $10.64
(1) This information is derived from the Fund’s unaudited semi-annualfinancial statements and audited annual financial statements. The netassets per unit presented in the financial statements differ from thenet asset value calculated for fund pricing purposes.
(2) Net assets per unit and distributions per unit are based on the actualnumber of units outstanding for the relevant series at the relevanttime. The increase/decrease in net assets from operations per unit isbased on the weighted average number of units outstanding for therelevant series over the fiscal period.
(3) Distributions are automatically reinvested in additional units of theFund, unless the unitholder withdraws from the automaticreinvestment plan by providing written notice to us.
(4) This information is provided as at period-end.
3
HSBC World Selection Diversified Growth Fund
(5) MER includes the total expenses of each Fund, including the Goodsand Services Tax and/or Harmonized Sales Tax thereon, other thanbrokerage commissions on securities transactions and any foreignwithholding taxes on income, as an annualized percentage of averagenet asset value (“NAV”) of the respective series of unit for the period.In the period a series is established, the MER is annualized from thedate of inception to the end of the period. The MER may vary fromone mutual fund to another and from one series of units to another.We may have waived or absorbed certain fees and expensesotherwise payable by the Fund. The amount of expenses absorbed orwaived is at the discretion of and can be terminated at any time by us.
The Fund may invest in units of other mutual funds and pooled funds.You should note that in addition to the fees and expenses paid by theFund, these other funds have their own operating expenses to pay.The Fund will effectively bear the operating expenses of the otherfunds in proportion to its holdings in the other funds. However, theFund will not invest in units of other funds if the Fund would berequired to pay any management fees in respect of suchinvestments. In addition, the Fund will not make investments in otherfunds if the Fund would be required to pay any sales or redemptionfees in respect of such investments that duplicate a fee payable byunitholders of the Fund.
(6) The Fund’s portfolio turnover rate indicates how actively the Fund’sportfolio advisor manages its portfolio investments. A portfolio turnoverrate of 100% is equivalent to the Fund buying and selling all of thesecurities in its portfolio once in the course of the period. The higher theFund’s portfolio turnover rate in a period, the greater the trading costspayable by the Fund in the period, and the greater the chance of aninvestor receiving taxable capital gains in the period. There is notnecessarily a relationship between a high turnover rate and theperformance of the Fund. The rate is calculated based on the lesser ofpurchases or sales of securities divided by the average weighted marketvalue of the portfolio securities, excluding short-term securities.
(7) The trading expense ratio represents commissions and other portfoliotransaction costs expressed as an annualized percentage of dailyaverage net asset value during the period.
Management FeesFor the six months ended June 30, 2015, the Fund paid usmanagement fees of $2,885,516. The management fee for eachseries is calculated as a percentage of the daily net asset value forthat series. The fees are reduced, where required, so that thesefees do not duplicate fees payable by mutual funds in which theFund invests for the same service.
The Fund’s management fees were used by us to pay costs formanaging the investment portfolio, providing investment analysisand recommendations, making investment decisions, makingbrokerage arrangements for the purchase and sale of theinvestment portfolio and providing other services. Themanagement fees also funded commission payments and othercompensation to sales representatives and registered dealers andbrokers (collectively “distribution costs”), including HSBC BankCanada, for units of the Fund bought and held by unitholders.Finally, we used management fees to pay for additional marketingand distribution services to the Fund.
For the six months ended June 30, 2015, approximately 45% ofthe total management fees collected from all HSBC Mutual Fundswere used to fund distribution costs. In comparison, for the Fund,such distribution costs represented 40% of the management feescollected. This may vary by series depending on the assetsinvested in each of the series.
Past PerformanceThe performance information shown assumes that all distributionsmade by the Fund in the periods shown were reinvested inadditional securities of the Fund. The performance informationdoes not take into account sales, redemption, distribution, optionalcharges or expenses you may be charged outside of the Fund orthe effect of any income tax you may have to pay as a result ofyour investment in the Fund that would have reduced returns orperformance. The Fund’s past performance does not necessarilyindicate how it will perform in the future.
Year-by-Year ReturnsThe following bar charts show the Fund’s performance for thesix-month period ended June 30, 2015, and for each of theprevious 12-month periods ended December 31. In percentageterms, the bar charts show how much an investment made on thefirst day of each financial period would have grown or decreasedby the last day of each financial period.
Returns – Investor SeriesFor the 12-month periods ended December 31 and the six-monthperiod ended June 30, 201530%
20%
10%
-10%
-30%
0%
-20%
12.9%
0.0%
-23.4%
16.7%
7.1% 9.0% 8.4%5.5%
-5.5%
2006Dec. 31
2007Dec. 31
2008Dec. 31
2009Dec. 31
2010Dec. 31
2011Dec. 31
2012Dec. 31
2014Dec. 31 June 30
2015
18.0%
2013Dec. 31
Returns – Advisor SeriesFor the 12-month periods ended December 31 and the six-monthperiod ended June 30, 201530%
20%
10%
-10%
-30%
0%
-20%
-23.4%
16.7%
7.0% 8.9% 8.3%5.3%
17.9%
-5.5%
2008Dec. 31
2009Dec. 31
2010Dec. 31
2011Dec. 31
2012Dec. 31
2013Dec. 31
2014Dec. 31 June 30
2015
4
HSBC World Selection Diversified Growth Fund
Returns – Manager SeriesFor the 12-month periods ended December 31 and the six-monthperiod ended June 30, 201530%
20%
10%
-10%
-30%
0%
Dec. 312010
Dec. 312011
Dec. 312012
Dec. 312013
June 302015
Dec. 312014
-20%
8.2% 10.2%
19.2%
0.0% 0.0%
-4.4%
Summary of Investment PortfolioAs at June 30, 2015
Asset MixPercentage
of NAV
International Equities 49.38%Canadian Equities 31.08%Bonds 19.74%Cash & Equivalents �0.20%Total 100.00%
Top 25 Holdings*Percentage
of NAV
HSBC Global Equity Fund – Institutional Series 18.38%HSBC Equity Fund – Institutional Series 14.15%HSBC Canadian Bond Fund – Institutional Series 11.77%Capital Group Global Equity Fund (Canada) – Class I 10.75%Mackenzie Global Growth Class, Series O 7.52%Brandes Global Equity Fund – Class I 7.46%Sionna Canadian Equity Fund – Class I 6.18%Synergy Canadian Corporate Class – Series I 6.15%HSBC Emerging Markets Fund – Institutional Series 5.20%HSBC Emerging Markets Debt Fund – Institutional Series 4.90%HSBC Small Cap Growth Fund – Institutional Series 4.50%HSBC Mortgage Fund – Institutional Series 3.00%Cash & Equivalents 0.04%Total top 25 investments 100.00%
* The Fund had less than 25 holdings as at June 30, 2015.
The Summary of Investment Portfolio may change due to ongoing portfolio transactions of the Fund, and is available quarterly.
The Fund invests in other mutual funds, and the prospectus and other information about the underlying funds is available on SEDAR atwww.sedar.com.
5
For more information
You can find more information about HSBC Mutual Fundsin the Fund’s Simplified Prospectus, Annual InformationForm, Annual and Semi-Annual Report and Fund Facts. Youcan get a copy of these documents, as well as the Fund’sFinancial Statements, at no cost by calling 1-888-390-3333,by contacting your authorized dealer or by visiting ourwebsite at www.hsbc.ca/investment-resources.
These documents and other information about the HSBCMutual Funds, such as information circulars and materialcontracts, are also available at www.sedar.com.
Copies of the Annual Report and Semi-Annual Report,Simplified Prospectus, Annual Information Form, Annualand Interim Management Report of Fund Performanceand Fund Facts are available on our website atwww.hsbc.ca/investment-resources.
How to reach us
VancouverHSBC Global Asset Management (Canada) Limited3rd Floor, 885 West Georgia StreetVancouver, BC V6C 3E8
Tel: 1-888-390-3333Fax: 604-669-2756
TorontoSuite 300 – 70 York StreetToronto, ON M5J 1S9
MontrealSuite 300 – 2001 McGill College AvenueMontreal, QC H3A 1G1
A NOTE ON FORWARD-LOOKING STATEMENTS
This report may contain forward-looking statements about the Fund, including its strategy, expected performance and condition. Forward-lookingstatements include statements that are predictive in nature that depend upon or refer to future events or conditions, or that include words such as“expects,” “anticipates,” “intends,” “plans,” “believes,” “estimates” or negative versions thereof and similar expressions. In addition, any statement thatmay be made concerning future performance, strategies or prospects, and possible future Fund action, is also a forward-looking statement. Forward-lookingstatements are based on current expectations and projections about future events and are inherently subject to, among other things, risks, uncertaintiesand assumptions about the Fund and economic factors.
Forward-looking statements are not guarantees of future performance, and actual events and results could differ materially from those expressed or impliedin any forward-looking statements made by the Fund. Any number of important factors could contribute to these digressions, including, but not limited to,general economic, political and market factors in North America and internationally, interest and foreign exchange rates, global equity and capital markets,business competition, technological change, changes in government regulations, unexpected judicial or regulatory proceedings, and catastrophic events.
We stress that the above-mentioned list of important factors is not exhaustive. We encourage you to consider these and other factors carefully beforemaking any investment decisions and we urge you to avoid placing undue reliance on forward-looking statements. Further, you should be aware of the factthat the Fund has no specific intention of updating any forward-looking statements, whether as a result of new information, future events or otherwise.
Sources: HSBC Global Asset Management (Canada) Limited, Bloomberg, MSCI, FTSE TMX Global Debt Capital Markets Inc., Bank of Canada.
Neither MSCI nor any other party involved in or related to compiling, computing or creating the MSCI data makes any express or implied warranties orrepresentations with respect to such data (or the results to be obtained by the use thereof), and all such parties hereby expressly disclaim all warranties oforiginality, accuracy, completeness, merchantability or fitness for a particular purpose with respect to any of such data. Without limiting any of theforegoing, in no event shall MSCI, any of its affiliates or any third party involved in or related to compiling, computing or creating the data have any liabilityfor any direct, indirect, special, punitive, consequential or any other damages (including lost profits) even if notified of the possibility of such damages. Nofurther distribution or dissemination of the MSCI data is permitted without MSCI’s express written consent.
FTSE TMX Global Debt Capital Markets Inc. (“FTDCM”), FTSE International Limited (“FTSE”), the London Stock Exchange Group companies (the“Exchange”) or TSX Inc. (“TSX” and together with FTDCM, FTSE and the Exchange, the “Licensor Parties”). The Licensor Parties make no warranty orrepresentation whatsoever, expressly or impliedly, either as to the results to be obtained from the use of the FTSE TMX Canada Index and/or the figure atwhich the said Index stands at any particular time on any particular day or otherwise. The Index is compiled and calculated by FTDCM and all copyright inthe Index values and constituent lists vests in FTDCM. The Licensor Parties shall not be liable (whether in negligence or otherwise) to any person for anyerror in the Index and the Licensor Parties shall not be under any obligation to advise any person of any error therein. “TMX” is a trade mark of TSX Inc. andis used under licence. “FTSE®” is a trade mark of FTSE International Limited and is used by FTDCM under licence.
Unauthorized reproduction, distribution, transmission or publication without our prior written consent is strictly prohibited.
Issued byHSBC Global Asset Management (Canada) Limited (2
015-
08)R
RD
HSBC World Selection DiversifiedAggressive Growth Fund
Interim Management Report of Fund Performance
for the six months ended June 30, 2015
HSBC World Selection Diversified Aggressive Growth Fund
Management Discussion of Fund PerformanceIn this document, you and your refer to the unitholder of the Fund;we, us and our refer to HSBC Global Asset Management (Canada)Limited; and the Fund refers to the HSBC World SelectionDiversified Aggressive Growth Fund.
We are the manager, trustee and primary investment advisor ofthe Fund.
IntroductionThis Interim Management Report of Fund Performance containsfinancial highlights but does not contain the complete annual or semi-annual financial statements of the investment fund. You may obtain acopy of the Fund’s annual or semi-annual financial statements at yourrequest, at no cost, by calling us toll-free at 1-888-390-3333, by visitingour website at www.hsbc.ca/investment-resources, by visiting theSEDAR website at www.sedar.com or by writing to us at:
Corporate SecretaryHSBC Global Asset Management (Canada) Limited3rd Floor, 885 West Georgia StreetVancouver, BC V6C 3E8
You may also contact us using one of these methods to request acopy of the Fund’s proxy voting policies and procedures, proxyvoting disclosure record or quarterly statement of investmentportfolio.
Results of OperationsAs of June 30, 2015, the Fund’s net assets increased by 22.7% to$73 million from $59.5 million at the end of 2014. Of this increase,a $3.9 million gain was attributable to investment performance and$9.6 million was attributable to net contributions to the Fund.
Investment PerformanceThe HSBC World Selection Diversified Aggressive Growth Fund(Investor Series) rose 6.60% over the six months ending June 30,2015, tracking its benchmark, which rose 6.60% for the sameperiod. Its benchmark is a composite of the MSCI World Index (inCanadian dollars) (57%), the S&P/TSX Composite Index (38%) andthe FTSE TMX Canada Universe Bond Index (5%).
During the first half of 2015, the MSCI World Index (in Canadiandollars) rose 10.70%, with much of this gain attributable to a weakCanadian dollar. Over the same period, the S&P/TSX CompositeIndex was up 0.91%. The strongest sectors were healthcare(+58.33), consumer discretionary (+7.80) and consumer staples(+3.23%). The weakest sectors were industrials (�8.08%),energy (�5.36) and utilities (�4.50%). The Canadian bond marketwas strong in the first quarter as the Bank of Canada surprised themarket with a 25-basis-point rate cut. Deflation fears droveeurozone bond yields to all-time lows. Global government bondyields moved higher, however, in the second quarter as the
risk of eurozone deflation diminished. The FTSE TMX CanadaUniverse Bond Index gained 2.37%, year-to-date.
The Fund achieved a positive return, with contributions from eachof the major asset classes noted above. The Fund maintained amodest preference for equities and a more pronouncedpreference for corporate bonds relative to cash and governmentbonds during the first six months of the year. This positioning wasbeneficial to performance. Security selection in equitiescontributed positively to relative performance, resulting in theFund matching its benchmark.
Recent DevelopmentsThe US economy contracted 0.2% in the first quarter. But weexpect a rebound of growth for the rest of 2015, with 2.2%growth expected for the full year. In Canada, growth contracted by0.6% in the first quarter and April was 0.1% lower. Businessinvestment and trade numbers were disappointing, but US andCanadian consumers continue to add to growth. HSBC forecasts2015 growth of 1.4% in Canada and 2.4% globally.
A softening of global economic expectations combined with theanticipation of eventual rate hikes from the US Federal Reservewere a definite headwind for equity markets in the first half of2015. Another major headwind for earnings growth domesticallycontinues to be the energy sector. Looking ahead, we continue tosee better return prospects for corporate assets, both equity anddebt, based on strong fundamentals and reasonable valuations.However, corporate earnings are expected to contract modestlythis year, led lower by the energy sector, before rebounding in2016. The Fund is somewhat less exposed to domestic equitiesthan in recent quarters.
Related Party TransactionsWe, on behalf of the Fund, or the Fund Manager, may, from timeto time, enter into transactions or arrangements with or involvingother members of the HSBC Group or other people or companiesrelated or connected to us or the Fund. To proceed with thetransactions, the Fund relies on the positive recommendation ofthe Fund’s Independent Review Committee. A condition of thispositive recommendation is that the transactions are performed inaccordance with our policy on Related Party Transactions. Formore general information on persons related to the Fund and thetypes of potential transactions, see the Fund’s SimplifiedProspectus.
The following is a summary of current transactions andarrangements with entities that are related to us or the Fund.
Manager, Trustee and Investment AdvisorWe are the manager, trustee and primary investment advisor of theFund. As manager, we manage the overall business and operations
1
HSBC World Selection Diversified Aggressive Growth Fund
of the Fund. As trustee, we hold legal title to the property of theFund on your behalf. As primary investment advisor, we provideinvestment advice and portfolio management services to the Fund.We receive a fee from the Fund for these services based on assetsunder management, calculated daily and paid monthly.
Custodial ServicesHSBC Bank Canada (“the Bank”) (of which we are a wholly ownedsubsidiary) is the custodian of the Fund. All fees for these serviceswere waived by the Bank.
Distribution ServicesThe Fund is distributed through us, HSBC Investment Funds(Canada) Inc. (our wholly owned subsidiary); HSBC Private WealthServices (Canada) Inc. and through HSBC Securities (Canada) Inc.(an affiliate) directly or through its division, HSBC InvestDirect. Wepay distribution and servicing fees to them based on the amountof assets held in the investor’s account, and additionally, in somecases, on the amount of the initial purchase. If you hold units ofthis Fund and/or other HSBC Mutual Funds in a registered planwith HSBC Investment Funds (Canada) Inc., they may charge youan annual fee to cover the annual administration costs of the plan.We permit HSBC Investment Funds (Canada) Inc. to collect thesefees by redeeming sufficient units of the Fund with the highestmarket value in your registered plan.
Fund on Fund InvestingDuring the period, the Fund invested in units of other HSBCMutual Funds, which are also managed by us. To proceed with thetransactions, the Fund relied on the positive recommendation ofthe Fund’s Independent Review Committee by way of StandingInstruction. A condition of this positive recommendation was thatthe transactions were performed in accordance with our policy onFund on Fund Investing.
Financial HighlightsThe following tables show selected key financial information aboutthe Fund and are intended to help you understand the Fund’sfinancial performance for the six-month period ended June 30, 2015and for the last five years ended December 31, as applicable. In theyear a fund is established, “period” represents the period frominception to December 31 or June 30 of that fiscal year, asapplicable. This information is derived from the Fund’s unauditedsemi-annual financial statements and audited annual financialstatements. The information in the following tables is based onprescribed regulations, and as a result, is not expected to add due tothe increase/decrease in net assets from operations being based onaverage units outstanding during the period and all other numbersbeing based on actual units outstanding at the relevant point in time.
HSBC World Selection Diversified AggressiveGrowth Fund – Investor Series – Net Assets perUnit (1)
Period ended June 30, 2015 (unaudited)and years ended December 31 Inception: December 2004
June 30
2015
Dec. 31
2014
Dec. 31
2013
Dec. 31
2012
Dec. 31
2011
Dec. 31
2010
Net assets per unit,beginning of period (2) $14.68 $13.39 $10.79 $9.80 $10.69 $10.01
Total increase (decrease) fromoperations (2) $(0.15) $– $0.75 $1.27 $0.19
Distributions to unitholders:From income (excluding dividends) – – – – –From dividends – – – – –From capital gains – – – – –From return of capital – – – – –
Total annual distributions (2,3) $– $– $– $– $–
Net assets per unit, end of period (2) $– $– $– $11.47 $10.19
* The Institutional Series was fully redeemed during 2013; however, itremains in operation at period-end.
** The Institutional Series commenced operations on September 16, 2011.
Ratios and Supplemental DataJune 30
2015
Dec. 31
2014
Dec. 31
2013
Dec. 31
2012
Dec. 31
2011
NAV (in 000s) (4) $– $– $– $13 $12Units outstanding (in 000s) (4) – – – 1 1Management expense ratio (“MER”) (5) 0.00% – 0.20% 0.42% 0.52%MER before absorbed or waivedfees (5) 0.00% – 0.20% 0.42% 0.52%Portfolio turnover rate (6) 18.01% – 28.05% 12.73% 11.83%Trading expense ratio (7) 0.13% – 0.10% 0.13% 0.09%NAV per unit (4) $– $– $– $11.47 $10.19
(1) This information is derived from the Fund’s unaudited semi-annualfinancial statements and audited annual financial statements. The netassets per unit presented in the financial statements differ from the netasset value calculated for fund pricing purposes.
(2) Net assets per unit and distributions per unit are based on the actualnumber of units outstanding for the relevant series at the relevanttime. The increase/decrease in net assets from operations per unit isbased on the weighted average number of units outstanding for therelevant series over the fiscal period.
(3) Distributions are automatically reinvested in additional units of theFund, unless the unitholder withdraws from the automaticreinvestment plan by providing written notice to us.
(4) This information is provided as at period-end.
(5) MER includes the total expenses of each Fund, including the Goodsand Services Tax and/or Harmonized Sales Tax thereon, other thanbrokerage commissions on securities transactions and any foreignwithholding taxes on income, as an annualized percentage of averagenet asset value (“NAV”) of the respective series of unit for the period.In the period a series is established, the MER is annualized from thedate of inception to the end of the period. The MER may vary fromone mutual fund to another and from one series of units to another.
3
HSBC World Selection Diversified Aggressive Growth Fund
We may have waived or absorbed certain fees and expensesotherwise payable by the Fund. The amount of expenses absorbed orwaived is at the discretion of and can be terminated at any time by us.
The Fund may invest in units of other mutual funds and pooled funds.You should note that in addition to the fees and expenses paid by theFund, these other funds have their own operating expenses to pay. TheFund will effectively bear the operating expenses of the other funds inproportion to its holdings in the other funds. However, the Fund will notinvest in units of other funds if the Fund would be required to pay anymanagement fees in respect of such investments. In addition, the Fundwill not make investments in other funds if the Fund would be requiredto pay any sales or redemption fees in respect of such investments thatduplicate a fee payable by unitholders of the Fund.
(6) The Fund’s portfolio turnover rate indicates how actively the Fund’sportfolio advisor manages its portfolio investments. A portfolio turnoverrate of 100% is equivalent to the Fund buying and selling all of thesecurities in its portfolio once in the course of the period. The higher theFund’s portfolio turnover rate in a period, the greater the trading costspayable by the Fund in the period, and the greater the chance of aninvestor receiving taxable capital gains in the period. There is notnecessarily a relationship between a high turnover rate and theperformance of the Fund. The rate is calculated based on the lesser ofpurchases or sales of securities divided by the average weighted marketvalue of the portfolio securities, excluding short-term securities.
(7) The trading expense ratio represents commissions and other portfoliotransaction costs expressed as an annualized percentage of dailyaverage net asset value during the period.
Management FeesFor the six months ended June 30, 2015, the Fund paid usmanagement fees of $690,667. The management fee for eachseries is calculated as a percentage of the daily net asset value forthat series. The fees are reduced, where required, so that thesefees do not duplicate fees payable by mutual funds in which theFund invests for the same service.
The Fund’s management fees were used by us to pay costs formanaging the investment portfolio, providing investment analysisand recommendations, making investment decisions, makingbrokerage arrangements for the purchase and sale of theinvestment portfolio and providing other services. Themanagement fees also funded commission payments and othercompensation to sales representatives and registered dealers andbrokers (collectively “distribution costs”), including HSBC BankCanada, for units of the Fund bought and held by unitholders.Finally, we used management fees to pay for additional marketingand distribution services to the Fund.
For the six months ended June 30, 2015, approximately 45% ofthe total management fees collected from all HSBC Mutual Fundswere used to fund distribution costs. In comparison, for the Fund,such distribution costs represented 40% of the management feescollected. This may vary by series depending on the assetsinvested in each of the series.
Past PerformanceThe performance information shown assumes that all distributionsmade by the Fund in the periods shown were reinvested inadditional securities of the Fund. The performance informationdoes not take into account sales, redemption, distribution, optionalcharges or expenses you may be charged outside of the Fund orthe effect of any income tax you may have to pay as a result ofyour investment in the Fund that would have reduced returns orperformance. The Fund’s past performance does not necessarilyindicate how it will perform in the future.
Year-by-Year ReturnsThe following bar charts show the Fund’s performance for thesix-month period ended June 30, 2015, and for each of theprevious 12-month periods ended December 31. In percentageterms, the bar charts show how much an investment made on thefirst day of each financial period would have grown or decreasedby the last day of each financial period.
Returns – Investor SeriesFor the 12-month periods ended December 31 and the six-monthperiod ended June 30, 201540%
30%
20%
10%
-10%
-40%
0%
-20%
-30%
15.6%
-2.1%
-30.3%
18.7%
6.8% 10.1%
24.1%
9.7% 6.6%
-8.3%
2006Dec. 31
2007Dec. 31
2008Dec. 31
2009Dec. 31
2010Dec. 31
2011Dec. 31
2012Dec. 31
2013Dec. 31
2014Dec. 31 June 30
2015
Returns – Advisor SeriesFor the 12-month periods ended December 31 and the six-monthperiod ended June 30, 201540%
30%
20%
10%
-10%
-40%
0%
-20%
-30%
10.2%
24.0%
9.6% 6.2%
-8.4%
2011Dec. 31
2012Dec. 31
2013Dec. 31
2014Dec. 31 June 30
2015
4
HSBC World Selection Diversified Aggressive Growth Fund
Returns – Institutional SeriesFor the 12-month periods ended December 31 and the six-monthperiod ended June 30, 201540%
10%
-20%
-40%
0%
-30%
-10%
20%
30%
2014Dec. 31
12.5%
0.0% 0.0% 0.0%
2012Dec. 31 Dec. 31
2013June 30
2015
Summary of Investment PortfolioAs at June 30, 2015
Asset MixPercentage
of NAV
International Equities 65.52%Canadian Equities 25.88%Bonds 9.00%Cash & Equivalents �0.40%Total 100.00%
Top 25 Holdings*Percentage
of NAV
HSBC Global Equity Fund – Institutional Series 32.25%HSBC Equity Fund – Institutional Series 11.84%Capital Group Global Equity Fund (Canada) – Class I 10.95%Mackenzie Global Growth Class, Series O 7.85%Brandes Global Equity Fund – Class I 7.61%HSBC Emerging Markets Fund – Institutional Series 6.78%Synergy Canadian Corporate Class – Series I 5.04%Sionna Canadian Equity Fund – Class I 4.99%HSBC Emerging Markets Debt Fund – Institutional Series 4.03%HSBC Small Cap Growth Fund – Institutional Series 3.93%HSBC Mortgage Fund – Institutional Series 2.49%HSBC Canadian Bond Fund – Institutional Series 2.44%Cash & Equivalents �0.20%Total top 25 investments 100.00%
* The Fund had less than 25 holdings as at June 30, 2015.
The Summary of Investment Portfolio may change due to ongoing portfolio transactions of the Fund, and is available quarterly.
The Fund invests in other mutual funds, and the prospectus and other information about the underlying funds is available on SEDAR atwww.sedar.com.
5
For more information
You can find more information about HSBC Mutual Fundsin the Fund’s Simplified Prospectus, Annual InformationForm, Annual and Semi-Annual Report and Fund Facts. Youcan get a copy of these documents, as well as the Fund’sFinancial Statements, at no cost by calling 1-888-390-3333,by contacting your authorized dealer or by visiting ourwebsite at www.hsbc.ca/investment-resources.
These documents and other information about the HSBCMutual Funds, such as information circulars and materialcontracts, are also available at www.sedar.com.
Copies of the Annual Report and Semi-Annual Report,Simplified Prospectus, Annual Information Form, Annualand Interim Management Report of Fund Performanceand Fund Facts are available on our website atwww.hsbc.ca/investment-resources.
How to reach us
VancouverHSBC Global Asset Management (Canada) Limited3rd Floor, 885 West Georgia StreetVancouver, BC V6C 3E8
Tel: 1-888-390-3333Fax: 604-669-2756
TorontoSuite 300 – 70 York StreetToronto, ON M5J 1S9
MontrealSuite 300 – 2001 McGill College AvenueMontreal, QC H3A 1G1
A NOTE ON FORWARD-LOOKING STATEMENTS
This report may contain forward-looking statements about the Fund, including its strategy, expected performance and condition. Forward-lookingstatements include statements that are predictive in nature that depend upon or refer to future events or conditions, or that include words such as“expects,” “anticipates,” “intends,” “plans,” “believes,” “estimates” or negative versions thereof and similar expressions. In addition, any statement thatmay be made concerning future performance, strategies or prospects, and possible future Fund action, is also a forward-looking statement. Forward-lookingstatements are based on current expectations and projections about future events and are inherently subject to, among other things, risks, uncertaintiesand assumptions about the Fund and economic factors.
Forward-looking statements are not guarantees of future performance, and actual events and results could differ materially from those expressed or impliedin any forward-looking statements made by the Fund. Any number of important factors could contribute to these digressions, including, but not limited to,general economic, political and market factors in North America and internationally, interest and foreign exchange rates, global equity and capital markets,business competition, technological change, changes in government regulations, unexpected judicial or regulatory proceedings, and catastrophic events.
We stress that the above-mentioned list of important factors is not exhaustive. We encourage you to consider these and other factors carefully beforemaking any investment decisions and we urge you to avoid placing undue reliance on forward-looking statements. Further, you should be aware of the factthat the Fund has no specific intention of updating any forward-looking statements, whether as a result of new information, future events or otherwise.
Sources: HSBC Global Asset Management (Canada) Limited, Bloomberg, MSCI, FTSE TMX Global Debt Capital Markets Inc., Bank of Canada.
Neither MSCI nor any other party involved in or related to compiling, computing or creating the MSCI data makes any express or implied warranties orrepresentations with respect to such data (or the results to be obtained by the use thereof), and all such parties hereby expressly disclaim all warranties oforiginality, accuracy, completeness, merchantability or fitness for a particular purpose with respect to any of such data. Without limiting any of theforegoing, in no event shall MSCI, any of its affiliates or any third party involved in or related to compiling, computing or creating the data have any liabilityfor any direct, indirect, special, punitive, consequential or any other damages (including lost profits) even if notified of the possibility of such damages. Nofurther distribution or dissemination of the MSCI data is permitted without MSCI’s express written consent.
FTSE TMX Global Debt Capital Markets Inc. (“FTDCM”), FTSE International Limited (“FTSE”), the London Stock Exchange Group companies (the“Exchange”) or TSX Inc. (“TSX” and together with FTDCM, FTSE and the Exchange, the “Licensor Parties”). The Licensor Parties make no warranty orrepresentation whatsoever, expressly or impliedly, either as to the results to be obtained from the use of the FTSE TMX Canada Index and/or the figure atwhich the said Index stands at any particular time on any particular day or otherwise. The Index is compiled and calculated by FTDCM and all copyright inthe Index values and constituent lists vests in FTDCM. The Licensor Parties shall not be liable (whether in negligence or otherwise) to any person for anyerror in the Index and the Licensor Parties shall not be under any obligation to advise any person of any error therein. “TMX” is a trade mark of TSX Inc. andis used under licence. “FTSE®” is a trade mark of FTSE International Limited and is used by FTDCM under licence.
Unauthorized reproduction, distribution, transmission or publication without our prior written consent is strictly prohibited.
Issued byHSBC Global Asset Management (Canada) Limited (2