The Study on Flood Control Project Implementation System For Principal Rivers in the Philippines Hydrological Observation Report i TABLE OF CONTENTS PAGE NO. 1. INTRODUCTION ............................................................................. HYO-1 1.1 Background ................................................................................. HyO-1 1.2 Scope of Works .......................................................................... HyO-1 1.3 Duration of Works ...................................................................... HyO-1 2. EXPECTED OUTPUT ...................................................................... HYO-2 2.1 General ....................................................................................... HyO-2 2.2 Expected Output ......................................................................... HyO-2 3. EQUIPMENT AND METHODOLOGY ......................................... HYO-4 3.1 General ....................................................................................... HyO-4 3.2 Equipment Used ......................................................................... HyO-4 3.3 Methodology ............................................................................... HyO-6 3.3.1 Survey Team ................................................................ HyO-6 3.3.2 Setting Up the First and Second Observation Line ..... HyO-6 3.3.3 Releasing the Float ....................................................... HyO-6 4. LOCATION AND GENERAL CONDITIONS OF TARGET AREAS ............................................................................ HYO-7 4.1 General ....................................................................................... HyO-7 4.2 The Target Areas ........................................................................ HyO-7 4.3 Flooding Conditions ................................................................... HyO-7 4.4 Environmental Conditions .......................................................... HyO-8 4.5 Socio Economic Conditions ....................................................... HyO-8 5. RESULTS OF CURRENT OBSERVATION ................................. HYO-9 5.1 Marikina River ............................................................................ HyO-9 5.2 Upper Marikina River ................................................................. HyO-9 5.3 Pansipit River ............................................................................. HyO-10 5.4 Panaysayan River ....................................................................... HyO-11 5.5 San Cristobal River ..................................................................... HyO-11 ANNEXES Annex A Figures Annex B Stream Flow Measurements Procedures .................................... Annex C Site Photos .................................................................................. Annex D Observation Results ....................................................................
Transcript
The Study on Flood Control Project Implementation System For Principal Rivers in the Philippines Hydrological Observation Report
i
TABLE OF CONTENTS
PAGE NO.
1. INTRODUCTION ............................................................................. HYO-1 1.1 Background ................................................................................. HyO-1 1.2 Scope of Works .......................................................................... HyO-1 1.3 Duration of Works ...................................................................... HyO-1
3. EQUIPMENT AND METHODOLOGY ......................................... HYO-4 3.1 General ....................................................................................... HyO-4 3.2 Equipment Used ......................................................................... HyO-4 3.3 Methodology ............................................................................... HyO-6
3.3.1 Survey Team ................................................................ HyO-6 3.3.2 Setting Up the First and Second Observation Line ..... HyO-6 3.3.3 Releasing the Float ....................................................... HyO-6
4. LOCATION AND GENERAL CONDITIONS OF TARGET AREAS ............................................................................ HYO-7 4.1 General ....................................................................................... HyO-7 4.2 The Target Areas ........................................................................ HyO-7 4.3 Flooding Conditions ................................................................... HyO-7 4.4 Environmental Conditions .......................................................... HyO-8 4.5 Socio Economic Conditions ....................................................... HyO-8
5. RESULTS OF CURRENT OBSERVATION ................................. HYO-9 5.1 Marikina River ............................................................................ HyO-9 5.2 Upper Marikina River ................................................................. HyO-9 5.3 Pansipit River ............................................................................. HyO-10 5.4 Panaysayan River ....................................................................... HyO-11 5.5 San Cristobal River ..................................................................... HyO-11
ANNEXES Annex A Figures Annex B Stream Flow Measurements Procedures .................................... Annex C Site Photos .................................................................................. Annex D Observation Results ....................................................................
The Study on Flood Control Project Implementation System For Principal Rivers in the Philippines Hydrological Observation Report
HyO-1
1. INTRODUCTION
1.1 Background The Philippines has frequently suffered from annual flooding and landslides mainly caused by typhoons while the government has continuously endeavored to mitigate the damages. Such disasters have brought heavy losses to the country’s economy and claimed hundreds of lives every year. Approximately 700 lives have been lost and damages have amounted 8.1billion pesos annually. It has affected primarily agricultural productions, transportation and communication resulting in aggravated and long time economic depression, and enlargement of regional differential and influx of the poor to the urban areas. The Government of the Republic of the Philippines has hardly mitigated or prevented the disasters due to its limited technical background, organization structures, regulations as well as budgetary constraint.
Hence, the Government has requested a technical cooperation project to develop the capacities of engineers by means of establishing “Flood Control and Sabo Engineering Center” to the Government of Japan. In response to the request, Japan International Cooperation Agency (JICA) has started “The Project for Enhancement of Capabilities in Flood Control and Sabo Engineering of the Department of Public Works and Highways” on January 10, 2000. The Project has been implemented with the objective of enhancing the capabilities of the engineers of the DPWH at the regional offices.
While the Project is now under the Stage 2 (10 January 2003 to 30 June 2005), DPWH engineers are trained for structural designing/planning through the On-the-Job Training (OJT) and construction supervision and maintenance until June 2005. It is envisaged that the counterpart personnel who are participating in the current training will echo the program to the field engineers of other DPWH regional offices.
Likewise, Study titled “Study on Flood Control Project Implementation System for Principal Rivers in the Philippines “on possible reforms and improvement for effective flood control project implementation system is started in parallel with the on-going training program.
1.2 Scope of Works The above Works will be undertaken on the following pre-selected river basins namely;
● Marikina River ● Upper Marikina River ● Pansipit River ● Panaysayan River ● San Cristobal River
Location of the said river basins is shown in Annex A (Figures).
1.3 Duration of Works The Works was started in 2nd week of July 2004 and about to be completed on August 2004.
The Study on Flood Control Project Implementation System For Principal Rivers in the Philippines Hydrological Observation Report
HyO-2
2. EXPECTED OUTPUT
2.1 General The discharge observation will be carried out at the five (5) pre-selected principal rivers in Region IV-A and NCR in the Luzon Island where there are existing installed staff gauges for water level observation and currently operational as listed below.
Rivers Location Drainage Area
Lower Marikina Sto. Nino, Marikina – (1959-1970), (1986-2000) 518 sq. km Upper Marikina San Jose, Montalban Rizal – (1988-1998) 277 sq. km Pansipit Ignacio Ilagan, Taal Batangas 732 sq. km
Panaysayan Palubluban, General Trias, Cavite (1959-1976), (1982-1999) 29 sq. km
San Cristobal San Cristobal, Calamba, Laguna – (1984-1999) 129 sq. km
The locations of the observation points for each river are set to be within the vicinity of the existing water level staff gauge as shown in Annex A (Figures).
2.2 Expected Output As shown from the table below is a sample result from velocity measurement. The observation form includes the river name and location, water level, current weather condition, physical observation of the vicinity such as topography, geology, proximity to the sea for tidal effect and social conditions, date of measurement, time start and the computation table. The recorded water level at the time of observation together with the cross section of the river can calculate the cross sectional area of the channel during the observation. With the calculated cross sectional area and the observed water velocity, discharge at the observation point will be approximated. It is important to include the time in measuring due to the rise and low of water level. The accuracy of measurement can affect due to the conditions of weather and the surroundings of the river.
The computation table indicates the weight of the float, time, time traveled and the float current. The weight of float used is discussed in 2. Float current can be measured by measuring the time such float takes to travel first observation point and to the last observation point over a known distance, estimate of the velocity can obtain. Repeating the float measurement over the same stretch will give an average estimate of current. Velocity can be computed to the distance traveled by float divided by the total time traveled. Average velocity is equal to the distance traveled by float divided by the average time traveled.
V = Dtravelled / Ttotal
Vaverage = Dtravelled / Taverage
The calculation above used in determining of estimating stream flow where discharge is equal to cross-sectional area multiply by mean velocity.
The Study on Flood Control Project Implementation System For Principal Rivers in the Philippines Hydrological Observation Report
HyO-3
Qstreamflow = Across-section x Vmean
Table below represents as a Sample Observation Form.
RIVER NAM E: Marikina River W eather: Sunny
Location: Sto. N ino, Marikina City Surrounding Observation: Presence of Barge
W ater Level: 12.80 m eter Date of M easurem ent: August 3, 2004
Tim e Start: 11:05 AM
Float W eight (kg) Tim e of Low ering Total Tim e Travelled
(sec) Tim e EndTotal Distance
Travelled (m )
Float Current (m /s)
1 0.90 11:05 AM 33.00 11:06 AM 30.00 0.9091
2 0.90 11:06 AM 28.00 11:07 AM 30.00 1.0714
3 0.90 11:08 AM 36.00 11:09 AM 30.00 0.8333
4
5
6
7
0.9278Average Current (m /s) =
CURRENT MEASUREMENT USING FLOAT
OBSERVATION FORM
The Study on Flood Control Project Implementation System For Principal Rivers in the Philippines Hydrological Observation Report
HyO-4
3. EQUIPMENT AND METHODOLOGY
3.1 General There are various methods used in measuring the current velocity. Devices and other types of equipments like current meters, cone and rubber bag method and float method are mostly used for determining stream flow.
A current meter is the best-known and more accurate determination of velocity. It measures the velocity at a single point, and several measurements are required to calculate the total flow. The average velocity at a single point of measurements is estimated from the mean of the velocity measured at 0.2 and 0.8 of the depth. For shallow water a single reading is taken at 0.6 of the depth instead of averaging the readings at 0.2 and 0.8 of the depth. This device is expensive but it is most accurate in all of methods.
Cone and rubber bag method is a simple inexpensive device for measuring current velocity. This device is made with a truncated cone with small opening which has a rubber bag attached to its base. It is helpful if a clear, open-ended plastic cylinder surrounds the bag. A suitable cone is a small, plastic garden hose attachment. Balloons are suitable rubber bags. It is easily attached to the garden hose cone using the rubber washer that is supplied with the cone.
Another method is to pour into the stream a quantity of strongly colored dye. It is measured for the first and last of the dye to reach the measuring point and an average of the two times is used to calculate the average velocity. In turbulent flow, the dye is dispersed quickly and difficult to observed and measure resulting to in accurate reading.
The float method which is used in this Study is the safest, simplest and cheapest method. The system will require only a floating material and a timer to approximate the velocity of the water in the channel. By repeating the method, rough estimate of the average flow velocity in the channel is immediately attained. Below are the typical examples of floats used, which includes their respective characteristics and specifications.
3.2 Equipment Used Float is the simplest equipment for measuring river velocity. Even observers are not highly skilled or do not have a current meter available, reading of gage height and float velocity can provide a valuable record of river flow. By using a stopwatch, measuring tape, leveling rod, transit and 2 or more floats are all required to find the velocity of the river. Figures below are the three kinds of float used for velocity measurement.
The Study on Flood Control Project Implementation System For Principal Rivers in the Philippines Hydrological Observation Report
HyO-5
Float 1 It is made of a plastic bottle containing sand to stabilize the vertical movement of the float. The weight of the sand is determined prior to fieldwork by calibrating the submergence of the float such that an inch of the float shall be above the water line. About 0.90 kg of sand is found to meet the said requirement. Normally, the system is used in a shallow river with a depth less or equal to one (1) meter.
Sand0.9 kg
PlasticBottle
Float 2 It is made of a 1” x 1” wooden stick, cylindrical styro foam which served as the float and sealed plastic cups containing sands for vertical stability. The weight of the sand is determined prior to field work by calibrating the submergence of the float such that the top side of the float shall level with the water line. About 0.85 kg of sand is found to meet the said requirement 0.47 cm
10.16 cm
Stick
Styro Foam
Plastic
Sand(0.85 kg)
Float 3 It is made of a plastic bottle as float and hard paper tube containing sand for stability. The weight of the sand is determined prior to fieldwork by calibrating the submergence of the float such that an inch of the float shall be above the water line. About 0.90 kg of sand is found to meet the said requirement. Normally, the system is used in a shallow river with a depth less or equal to one (1) meter. Sand
(0.85 kg)
Hard Paper
PlasticBottle
String
(B)
Theoretically, the velocity distribution along the depth of the channel varies with fastest velocity near the surface and slowest at the sides and bottom of the channel. Float 2 and 3 are used to measure below the surface where the float and weight move down the stream together at the velocity of the stream at the depth. This method used to measure the approximate average velocity for the whole river.
Pictures of the equipment used shown in the Annex C (Photographs).
The Study on Flood Control Project Implementation System For Principal Rivers in the Philippines Hydrological Observation Report
HyO-6
3.3 Methodology
3.3.1 Survey Team In performing a float method survey for current velocity a team was made which comprise of Team Leader, Assistant Leader, Floatman, and 4 Rodman.
The team leader directs general affairs concerning the measurement, measures the time it takes the floats to pass from the first observation line to the second observation line, makes contact with the offices and determines the observation date and time.
Assistant leader measures the water level at the standard staff gauge and the first and second observation line staff gauge during measurement periods and on a regular basis he’s the one responsible for setting up all the necessary markers especially the current measurement line.
Floatman lowers the floats into water at prescribed places; observers flowing condition.
Rodman will serve as first and second observation line.
3.2.2 Setting-Up the First and Second Observation Line
● The assistant team leader measures 30 meters from the first observation point line up to the second point along the bank of a straight section of the selected river
● Using a transit, from the first observation point line up to the second point a 90o turn was set in place facing the opposite bank of the river to form a right angle which will serve as third point then the transit was placed on the second point facing the first point then a 90o turn was made which will be the fourth point.
3.2.3 Releasing the Float ● After marking up all the observation point, the four rodman stands at each point.
Then release the float at the upstream site in 5 - 10 m distance before the starting point. Float should travel a long patch with no turbulence or flow stagnation, no obstruction or affected by wind.
● Using stopwatch, record the time it takes from the starting point and to reach the ending point.
● Repeat the measurement two or more times for an accurate measurement
● Calculate the velocity as distance traveled divided by the average time it took the float to travel the distance.
● Record the reading depth of gauging station at the location of measurement to be used in estimate stream flow.
Pictures are illustrated in Annex B.
The Study on Flood Control Project Implementation System For Principal Rivers in the Philippines Hydrological Observation Report
HyO-7
4. LOCATION AND GENERAL CONDITIONS OF TARGET AREAS
4.1 General This section of the Draft Report describes the location and general conditions of five discharge observation sites on the principal rivers in Luzon Region under The Study on Flood Control Project Implementation System for Principal Rivers in the Philippines (FCPISPR). The prevailing conditions of the five discharge observation sites are among the considerations taken into account in preparing the FCPISPR methodology and approach to the services. Appreciation of the existing conditions set the grounds for the study areas.
4.2 The Target Areas The Target Area falls within five principal rivers three sites will be outside from National Capital Region (NCR) and two sites inside National Capital Region where the water level gauging station is present. Panasayan River, Pansipit River, and San Cristobal River are among the selected principal rivers outside from NCR and one site from Marikina and Upper Marikina River are consider inside NCR.
A location of target areas is shown in Annex A (Figure 4.0).
Marikina River Location of target and gauging station area are located at Sto. Niño bridge in Barangay Sto. Niño, Marikina City. See Annex A (Figure 4.1)
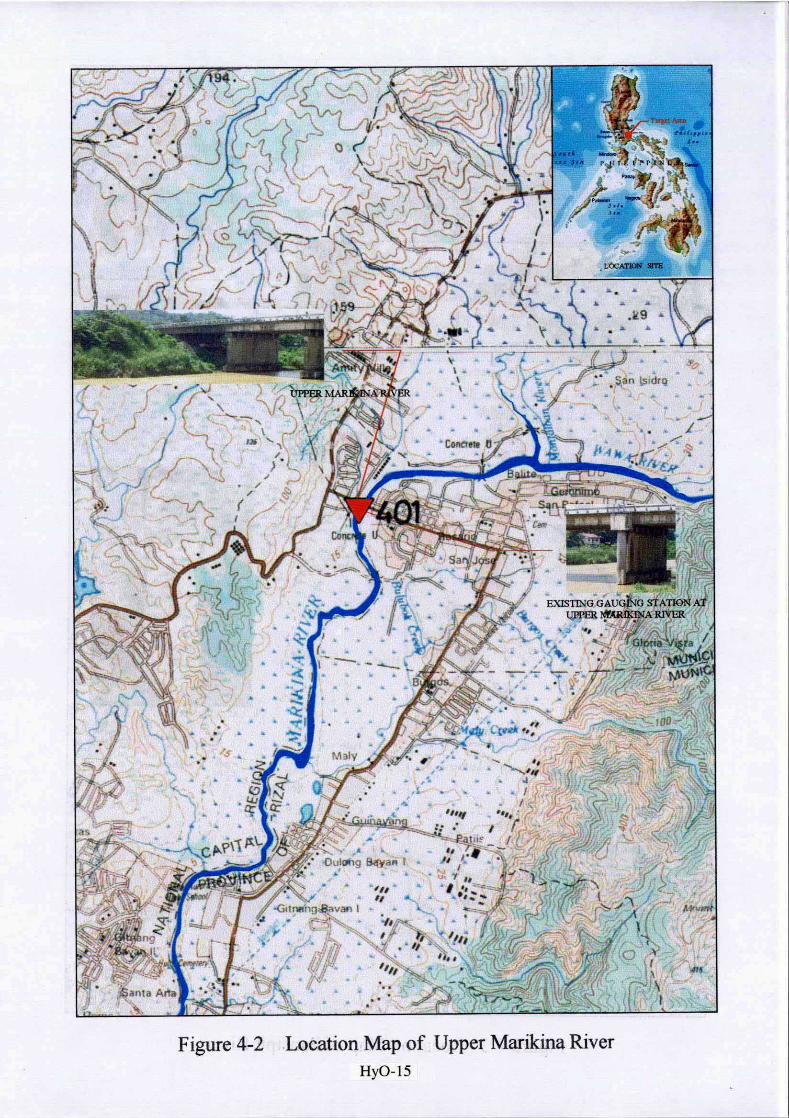
Upper Marikina River Location of target area and gauging station are located at the bridge of San Jose, Montalban, Rizal. See Annex A (Figure 4.2)
Pansipit River Location of target area and gauging station are located at Brgy. Poblacion, San Nicolas Batangas. Just above bodega of Ignacio Ilagan and at the lower corner of the rice field abutting on the river. Standard metric gage vertically nailed to column of adobe wall at left bank of the river. See Annex A (Figure 4.3).
Panasayan River
Location of target area in Panaysayan River and gauging station is located about 6 kms. South of the Municipality of Gen. Trias, Barangay Palubuhan, Province of Cavite (Latitude 14o22’22”, Longtitude 120o52’55”). On the downstream side of the Palubuhan bridge and about 1 km. of the confluence of the Panaysayan and Palubuhan Rivers. It has a drainage area of 29 sq. kilometers. See Annex A (Figure 4.4)
San Cristobal River Location of target area and gauging station are located at Brgy. San Cristobal, Calamba Laguna. See Annex A (Figure 4.5)
4.3 Flooding Conditions The target areas constantly experience high tides, which sometimes causes flooding due to heavy storm particularly in some low portion of Montalban, Marikina and Cavite.
The Study on Flood Control Project Implementation System For Principal Rivers in the Philippines Hydrological Observation Report
HyO-8
4.4 Environmental Conditions The environmental conditions in the target area, particularly the San Cristobal River and peripheral areas are far from ideal. Floating debris, murky and stinky waters and garbage dumps are a common sight along the banks. Informal settlers occupy a portion of the waterways and their banks. No valuable flora and fauna could be found within the areas except for a few ornamentals that have been planted in some areas.
4.5 Socio-Economic Conditions The target area focused on the principal river in Luzon Region. As such, the communities within the Study area have relatively easy access to most social services such as elementary, secondary and tertiary schools; hospitals and clinics; water and power connections, markets and department stores and leisure areas. However, the target area also has a high percentage of urban poor living in informal settlements that abound near the banks of rivers.
The Study on Flood Control Project Implementation System For Principal Rivers in the Philippines Hydrological Observation Report
HyO-9
5. RESULTS OF CURRENT OBSERVATION
5.1 Marikina River The location of observation site as shown in Figure 4.1 is located at barangay Sto. Nino gaging Station, Marikina City. The calculations for the velocity measurements using float A and B is tabulated below where:
Average V elocity = Distance x Average time Other observation data shown in Annex D (Observation Results).
Used float: Float 2 July 31, 2004
Trial Time Recorded (s) Distance (m) 1 78.75 30 2 63.19 30 3 64.36 30
Average Time = 68.77 s Average Velocity = 30/68.77 = 0.4362 m/s
August 3, 2004
Trial Time Recorded (s) Distance (m) 1 32.00 30 2 32.00 30 3 34.00 30
Average Time = 32.67 s Average Velocity = 30/32.77 = 0.9155 m/s
Used float Float 3 July 31, 2004
Trial Time Recorded (s) Distance (m) 1 90.00 30 2 68.94 30 3 59.00 30
Average Time = 72.64 s Average Velocity = 30/72.64 = 0.4130 m/s
August 3, 2004
Trial Time Recorded (s) Distance (m) 1 33.00 30 2 28.00 30 3 36.00 30
Average Time = 32.33 s Average Velocity = 30/32.33 = 0.9279 m/s
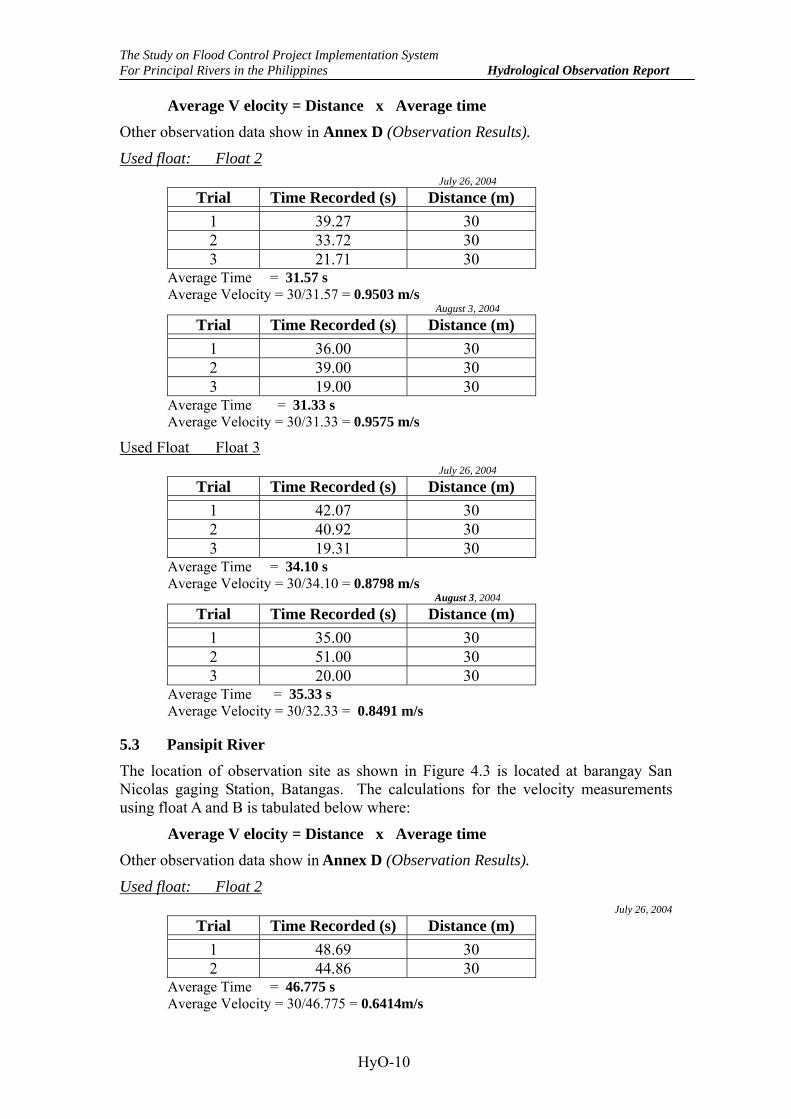
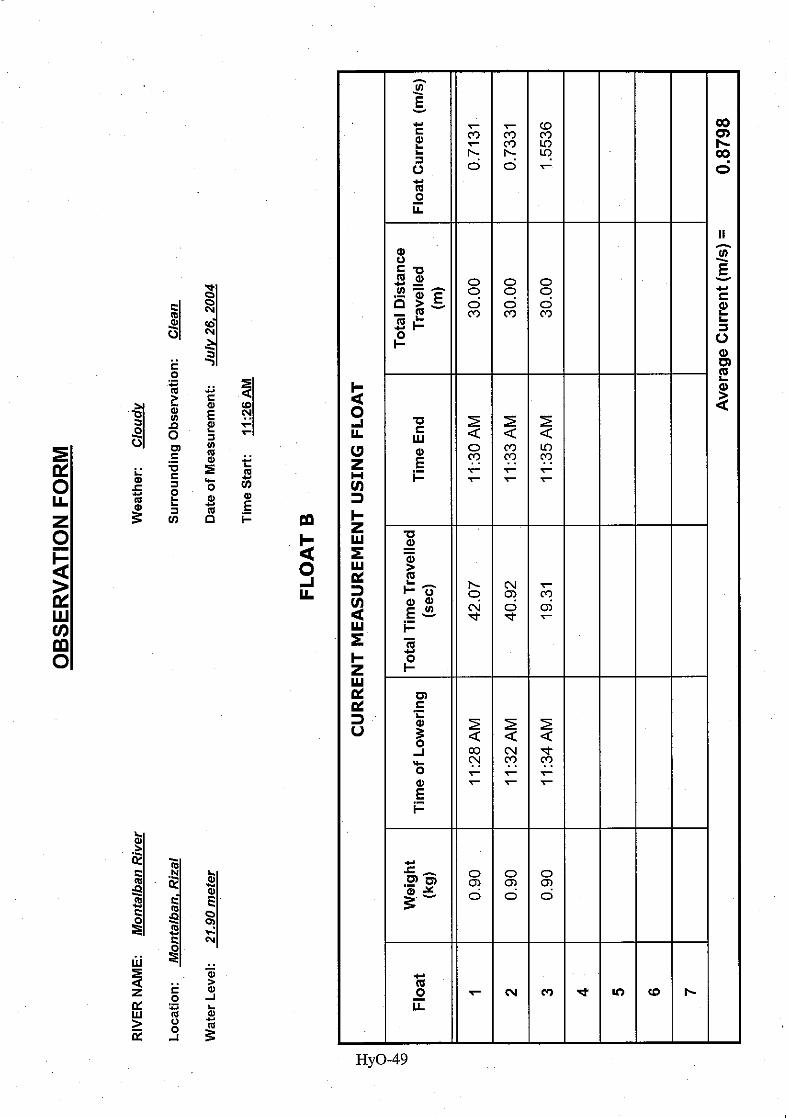
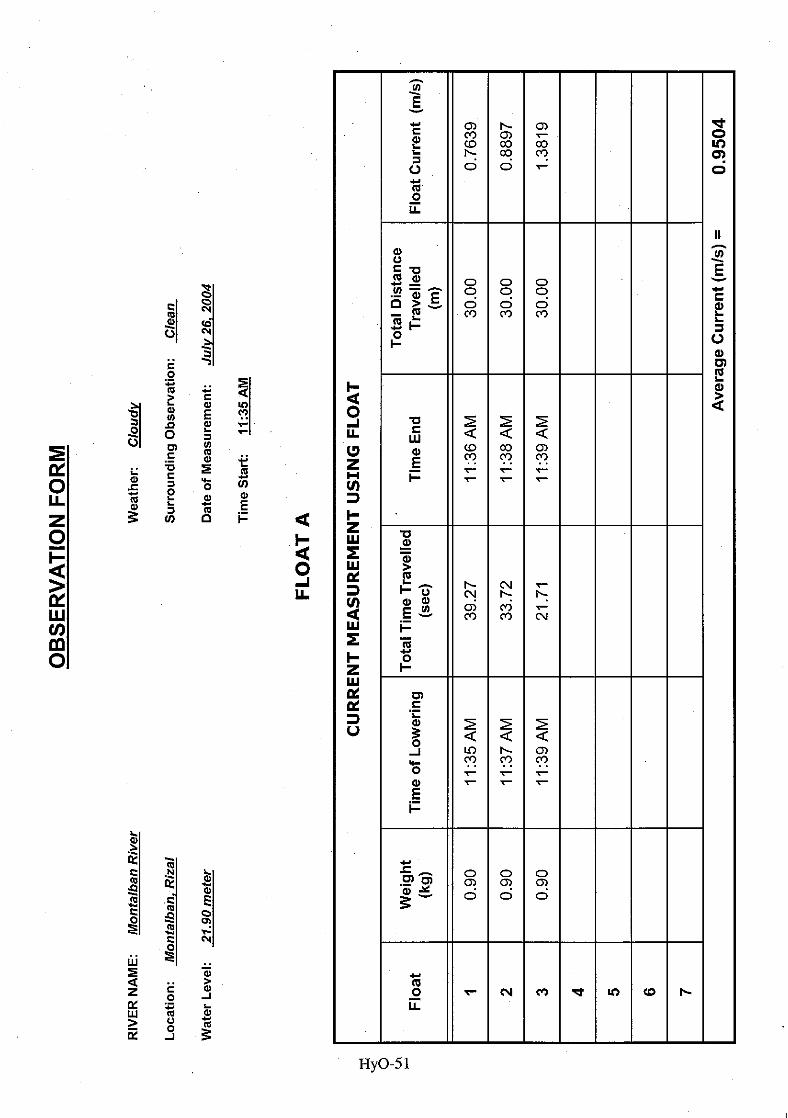
5.2 Upper Marikina River The location of observation site as shown in Figure 4.2 is located at barangay San Jose gaging Station, Montalban, Rizal. The calculations for the velocity measurements using float A and B is tabulated below where:
The Study on Flood Control Project Implementation System For Principal Rivers in the Philippines Hydrological Observation Report
HyO-10
Average V elocity = Distance x Average time
Other observation data show in Annex D (Observation Results).
Used float: Float 2 July 26, 2004
Trial Time Recorded (s) Distance (m) 1 39.27 30 2 33.72 30 3 21.71 30
Average Time = 31.57 s Average Velocity = 30/31.57 = 0.9503 m/s
August 3, 2004
Trial Time Recorded (s) Distance (m) 1 36.00 30 2 39.00 30 3 19.00 30
Average Time = 31.33 s Average Velocity = 30/31.33 = 0.9575 m/s
Used Float Float 3 July 26, 2004
Trial Time Recorded (s) Distance (m) 1 42.07 30 2 40.92 30 3 19.31 30
Average Time = 34.10 s Average Velocity = 30/34.10 = 0.8798 m/s
August 3, 2004
Trial Time Recorded (s) Distance (m) 1 35.00 30 2 51.00 30 3 20.00 30
Average Time = 35.33 s Average Velocity = 30/32.33 = 0.8491 m/s
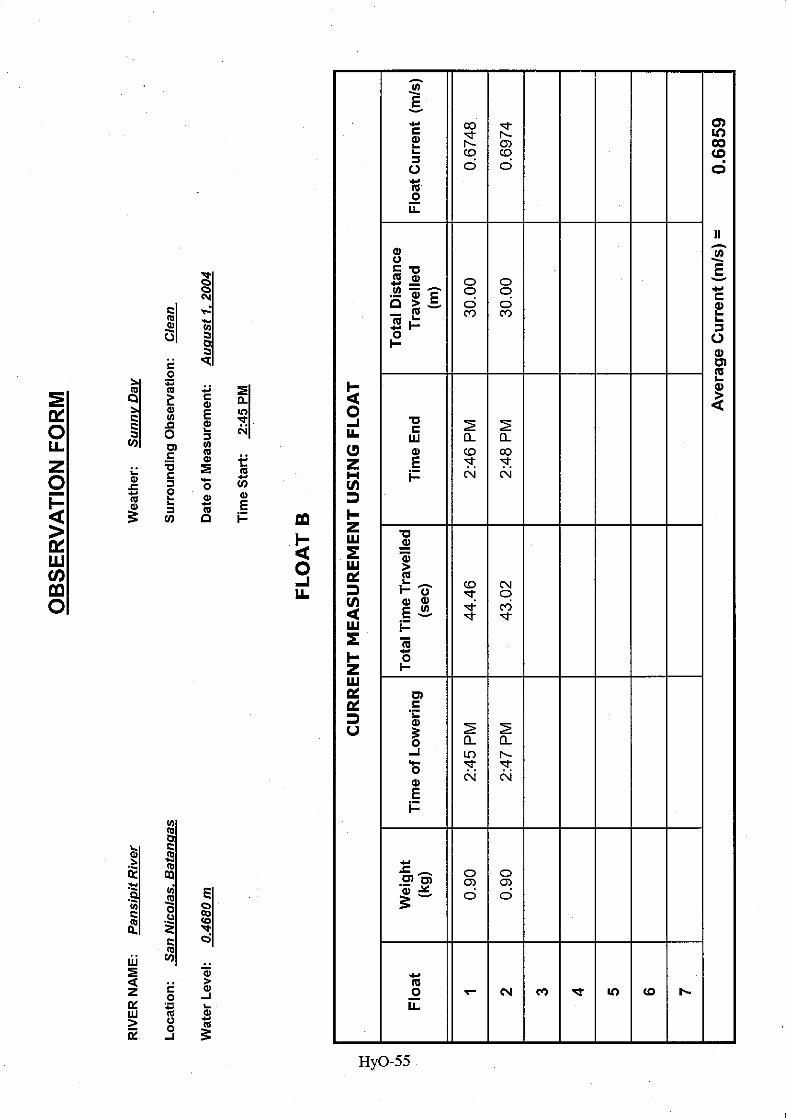
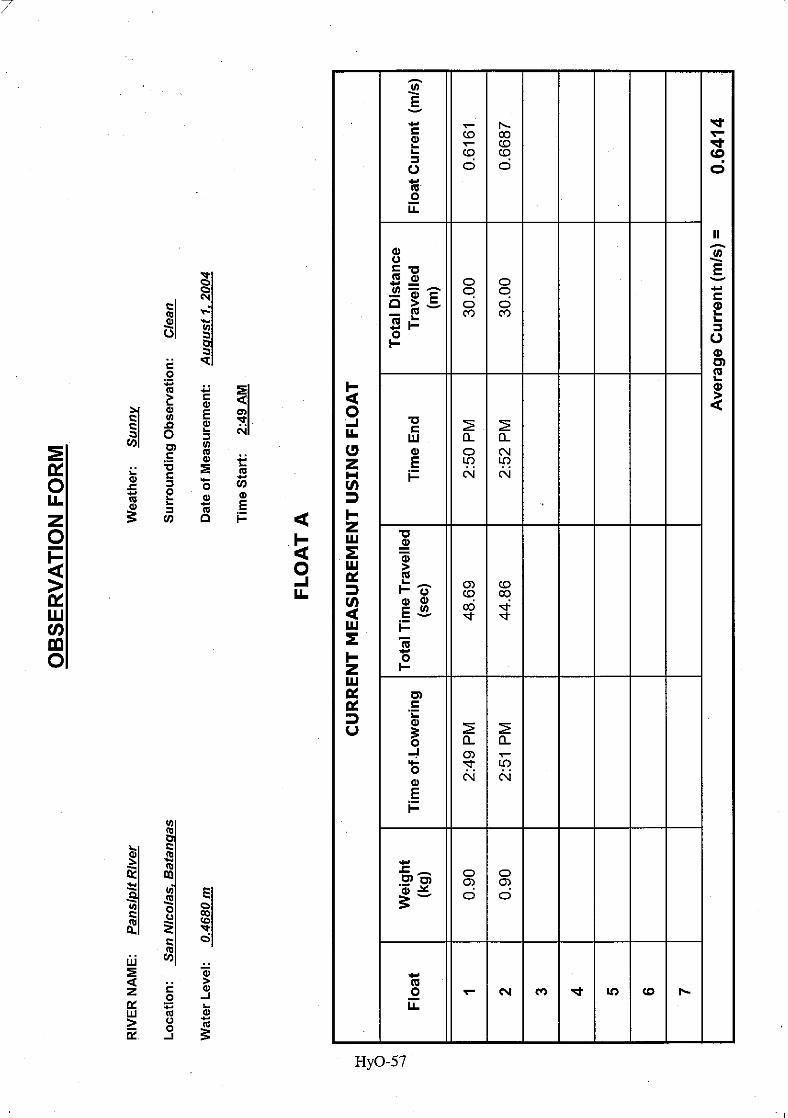
5.3 Pansipit River
The location of observation site as shown in Figure 4.3 is located at barangay San Nicolas gaging Station, Batangas. The calculations for the velocity measurements using float A and B is tabulated below where:
Average V elocity = Distance x Average time Other observation data show in Annex D (Observation Results).
Used float: Float 2 July 26, 2004
Trial Time Recorded (s) Distance (m) 1 48.69 30 2 44.86 30
Average Time = 46.775 s Average Velocity = 30/46.775 = 0.6414m/s
The Study on Flood Control Project Implementation System For Principal Rivers in the Philippines Hydrological Observation Report
HyO-11
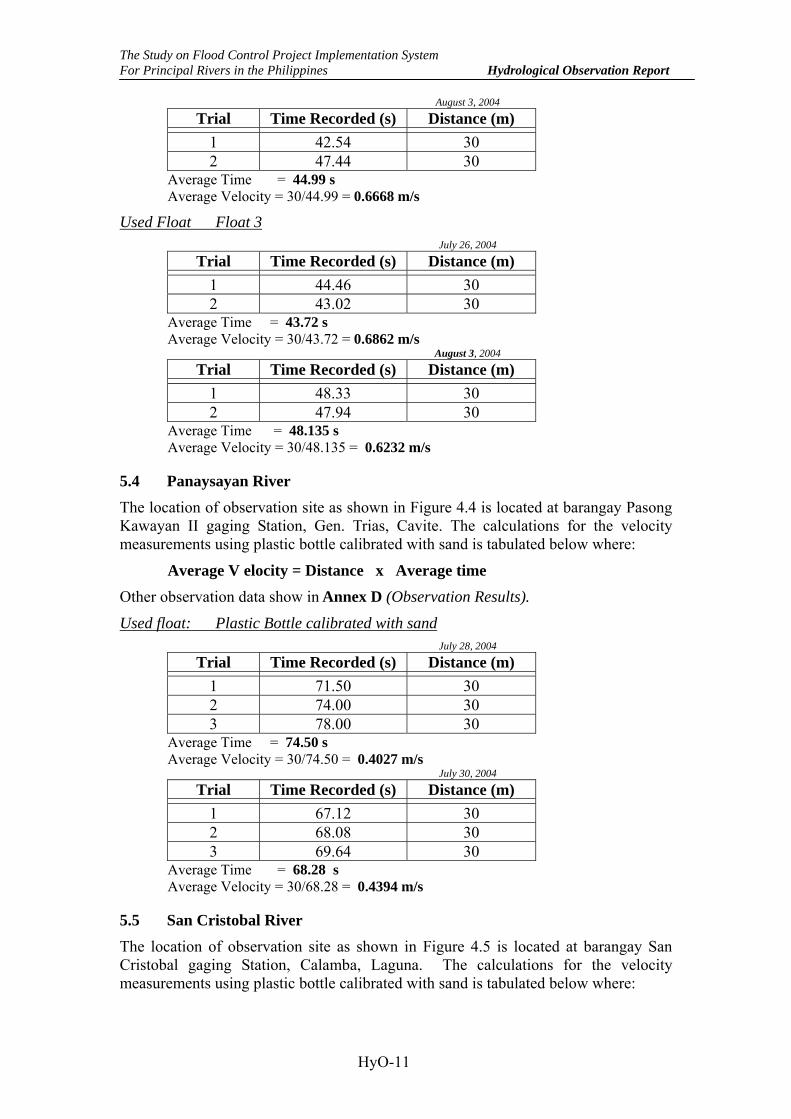
August 3, 2004
Trial Time Recorded (s) Distance (m) 1 42.54 30 2 47.44 30
Average Time = 44.99 s Average Velocity = 30/44.99 = 0.6668 m/s
Used Float Float 3 July 26, 2004
Trial Time Recorded (s) Distance (m) 1 44.46 30 2 43.02 30
Average Time = 43.72 s Average Velocity = 30/43.72 = 0.6862 m/s
August 3, 2004
Trial Time Recorded (s) Distance (m) 1 48.33 30 2 47.94 30
Average Time = 48.135 s Average Velocity = 30/48.135 = 0.6232 m/s
5.4 Panaysayan River The location of observation site as shown in Figure 4.4 is located at barangay Pasong Kawayan II gaging Station, Gen. Trias, Cavite. The calculations for the velocity measurements using plastic bottle calibrated with sand is tabulated below where:
Average V elocity = Distance x Average time Other observation data show in Annex D (Observation Results).
Used float: Plastic Bottle calibrated with sand July 28, 2004
Trial Time Recorded (s) Distance (m) 1 71.50 30 2 74.00 30 3 78.00 30
Average Time = 74.50 s Average Velocity = 30/74.50 = 0.4027 m/s
July 30, 2004
Trial Time Recorded (s) Distance (m) 1 67.12 30 2 68.08 30 3 69.64 30
Average Time = 68.28 s Average Velocity = 30/68.28 = 0.4394 m/s
5.5 San Cristobal River The location of observation site as shown in Figure 4.5 is located at barangay San Cristobal gaging Station, Calamba, Laguna. The calculations for the velocity measurements using plastic bottle calibrated with sand is tabulated below where:
The Study on Flood Control Project Implementation System For Principal Rivers in the Philippines Hydrological Observation Report
HyO-12
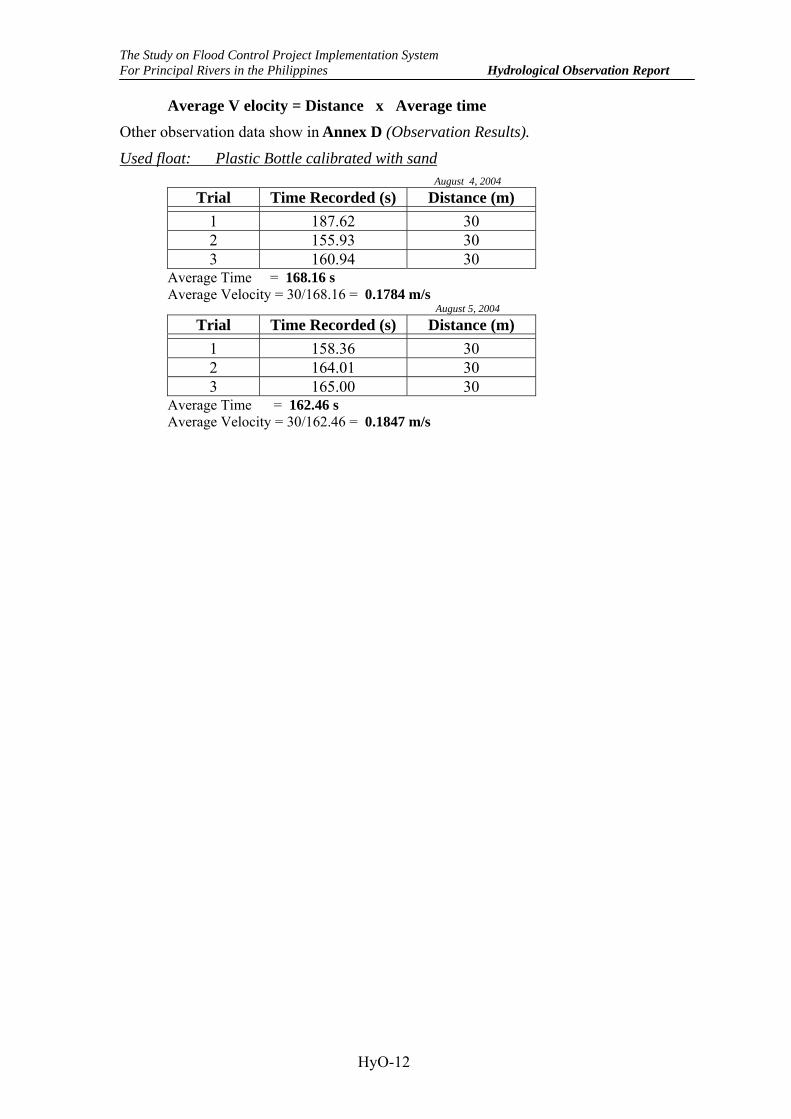
Average V elocity = Distance x Average time
Other observation data show in Annex D (Observation Results).
Used float: Plastic Bottle calibrated with sand August 4, 2004
Trial Time Recorded (s) Distance (m) 1 187.62 30 2 155.93 30 3 160.94 30
Average Time = 168.16 s Average Velocity = 30/168.16 = 0.1784 m/s
August 5, 2004
Trial Time Recorded (s) Distance (m) 1 158.36 30 2 164.01 30 3 165.00 30
Average Time = 162.46 s Average Velocity = 30/162.46 = 0.1847 m/s
Annexes
Annex A Figures
Annex B Streamflow Measurements
Procedures
HyO-19
STREAM FLOW MEASURING PROCEDURE
Measuring 30 meter from first observation line up to the second line along the bank of a straight section of the selected river
Setting up the transit that will be used for determining a right angle from the opposite bank and second observation line
HyO-20
Leveling the bubbles of the transit
Determining a 90o from the first observation line up to the second observation line and opposite bank
HyO-21
Position of four rods that will serve as a reference for starting and end line
Floatman tosses the float into the river above the bridge
1st Point 4th Point
2nd Point
3rd Point
Floatman
Second Observation Line
First Observation Line
HyO-22
Observers waiting the float to cross the first observation line
HyO-23
Observers waiting the float to cross the second observation line
Annex C Site Photos
The Study on Flood Control Project Implementation System For Principal Rivers in the Philippines Report
HyO-25
MARIKINA RIVER (Located at Barangay Sto. Niño, Marikina City)
(July 31 & August 3, 2004)
Location of leveling rod, which will serve as starting and end point of the float
Existing Gauging Station at Sto. Bridge along Marikina River
Leveling RodLeveling Rod
Leveling Rod
Leveling Rod
The Study on Flood Control Project Implementation System For Principal Rivers in the Philippines Report
HyO-26
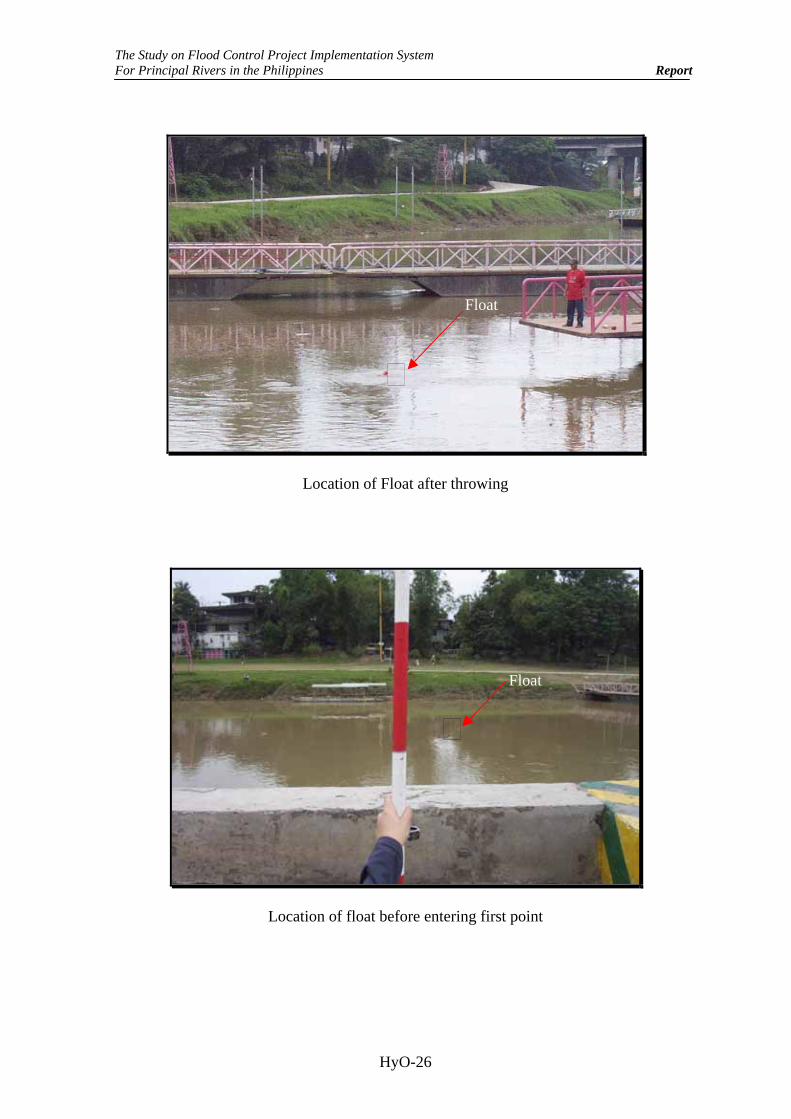
Location of Float after throwing
Location of float before entering first point
Float
Float
The Study on Flood Control Project Implementation System For Principal Rivers in the Philippines Report
HyO-27
Location of float after entering the starting point
Location of float before entering end point
Float
Float
The Study on Flood Control Project Implementation System For Principal Rivers in the Philippines Report
HyO-28
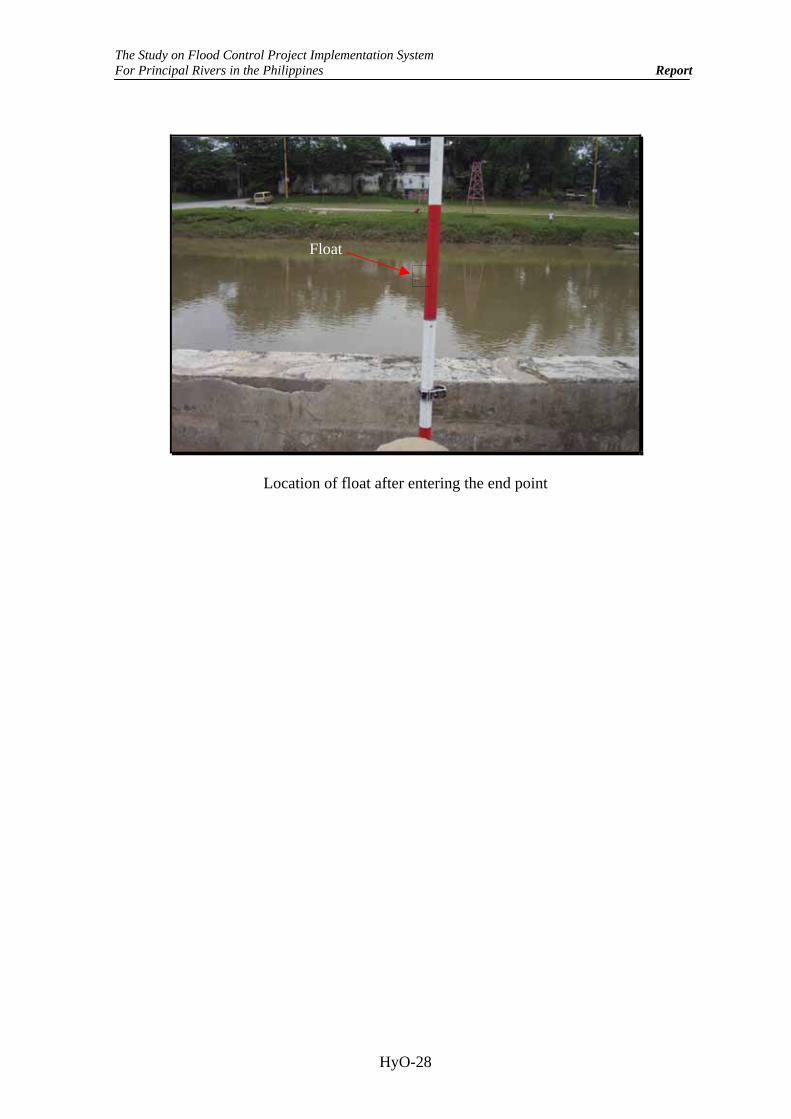
Location of float after entering the end point
Float
The Study on Flood Control Project Implementation System For Principal Rivers in the Philippines Report
HyO-30
Location of float after throwing
Observing the float to pass within the starting point
The Study on Flood Control Project Implementation System For Principal Rivers in the Philippines Report
HyO-31
Recording the time travel by the float.
The Study on Flood Control Project Implementation System For Principal Rivers in the Philippines Report
HyO-33
PANASAYAN RIVER (Located at Barangay Pasong Kawayan II, Gen Trias, Cavite City)
(July 28 & 30, 2004)
Location Site at Panaysayan River
Location of leveling rod, which will serve as starting and end point of the float
Leveling Rod
Leveling Rod
Leveling Rod
Leveling Rod
The Study on Flood Control Project Implementation System For Principal Rivers in the Philippines Report
HyO-34
Existing Gauging Station at Panasayan River
Throwing of float
Gauging Level
The Study on Flood Control Project Implementation System For Principal Rivers in the Philippines Report
HyO-35
Location of float after throwing
Location of float before entering first point
Float
Float
The Study on Flood Control Project Implementation System For Principal Rivers in the Philippines Report
HyO-36
Location of float after entering the end point
Float
Float
The Study on Flood Control Project Implementation System For Principal Rivers in the Philippines Report
HyO-37
PANSIPIT RIVER (Located at Barangay Poblacion, San Nicolas, Batangas)
(August 1 & 2, 2004)
Location of leveling rod, which will serve as starting and end point of the float
Location of float after throwing
Leveling Rod
Leveling Rod Leveling Rod
Leveling Rod
Float
The Study on Flood Control Project Implementation System For Principal Rivers in the Philippines Report
HyO-38
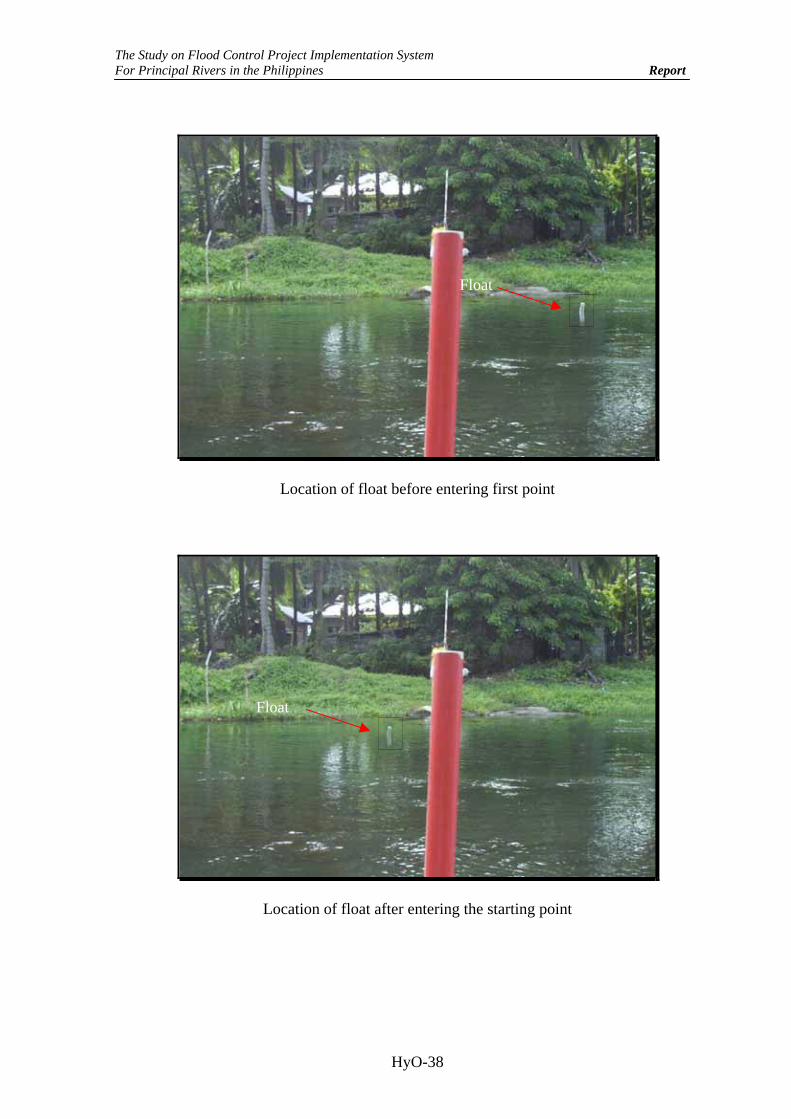
Location of float before entering first point
Location of float after entering the starting point
Float
Float
The Study on Flood Control Project Implementation System For Principal Rivers in the Philippines Report
HyO-39
Location of float before entering end point
Location of float after entering the end point
Float
Float
The Study on Flood Control Project Implementation System For Principal Rivers in the Philippines Report
HyO-40
Existing Gauging Station at Brgy. Poblacion along Pansipit River
The Study on Flood Control Project Implementation System For Principal Rivers in the Philippines Report
HyO-41
SAN CRISTOBAL RIVER (Located at Barangay San Cristobal, Calamba Laguna)
(August 4 & 5, 2004)
Location of leveling rod, which will serve as starting and end point of the float
Existing Gauging Station at San Cristobal River
Leveling Rod
Leveling Rod
Leveling Rod
Leveling Rod
The Study on Flood Control Project Implementation System For Principal Rivers in the Philippines Report
HyO-42
Location of float after throwing
Location of float before entering first point
Float
Float
Float
The Study on Flood Control Project Implementation System For Principal Rivers in the Philippines Report
HyO-43
Location of float after entering the starting point
Location of float before entering end point
Float
Float
Float
The Study on Flood Control Project Implementation System For Principal Rivers in the Philippines Report