24
0

0

1
Table of Contents Section A: System Information ...................................................................................................................................... 2
System Names ........................................................................................................................................................... 2
Exemplary Systems in Government Category ........................................................................................................... 2
System Summary ....................................................................................................................................................... 2
Testimonial Letters .................................................................................................................................................... 3
Section B: Jurisdiction .................................................................................................................................................... 3
City of Naperville, Illinois ........................................................................................................................................... 3
Section C: System Design ............................................................................................................................................... 4
Motivation for Change ............................................................................................................................................... 4
Services Targeted for improvement .......................................................................................................................... 5
Unexpected Benefits ................................................................................................................................................. 5
System Design Problems Encountered ...................................................................................................................... 6
What differentiates this system from others? .......................................................................................................... 7
Section D: Implementation ............................................................................................................................................ 7
Phases of Development ............................................................................................................................................. 7
Phase 1: Design Phase ........................................................................................................................................... 7
Phase 2: Development and Automation Phase ..................................................................................................... 8
Phase 3: GIS Web App Development Phase .......................................................................................................... 9
Modifications to the Original System Design .......................................................................................................... 11
Section E: Organizational Impact ................................................................................................................................. 11
User community the system serves ......................................................................................................................... 11
Decisions Operation and Services Affected ............................................................................................................. 12
Qualitative Impacts .................................................................................................................................................. 13
Quantitative Impacts ............................................................................................................................................... 14
Effects on Productivity ............................................................................................................................................. 15
Section F: System Resources ....................................................................................................................................... 18
Primary Hardware Components .............................................................................................................................. 18
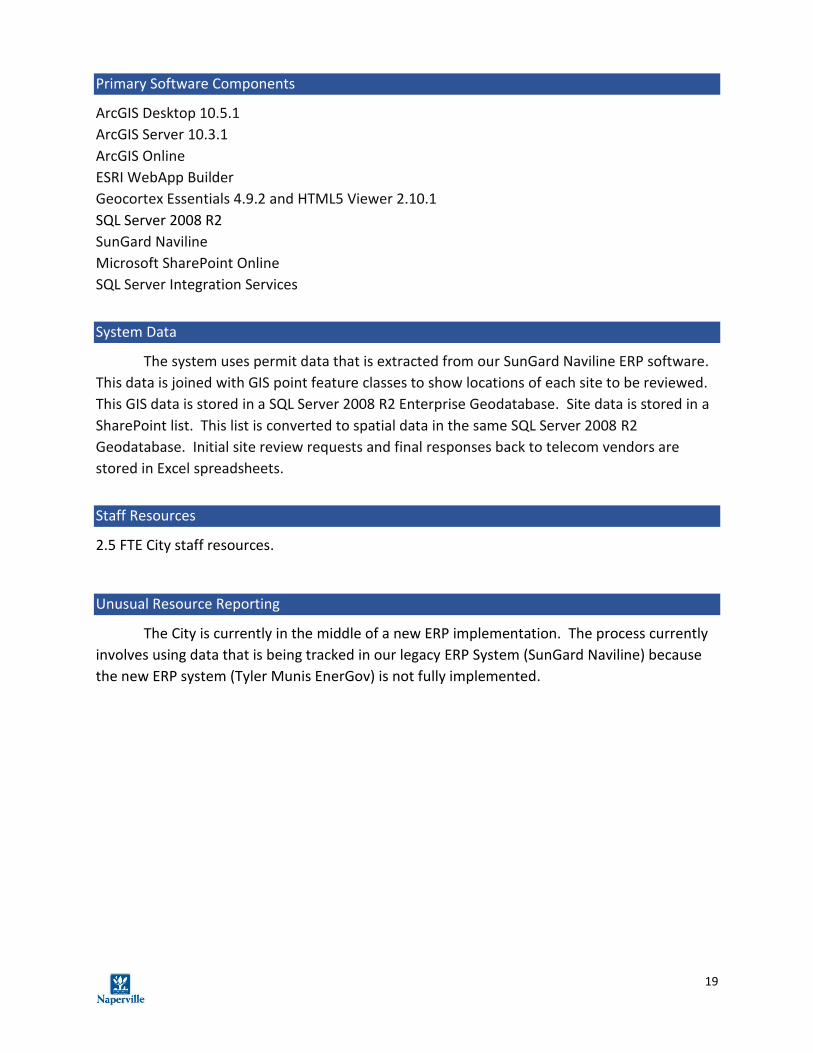
Primary Software Components ............................................................................................................................... 19
System Data ............................................................................................................................................................. 19
Staff Resources ........................................................................................................................................................ 19
Unusual Resource Reporting ................................................................................................................................... 19
Attachments ................................................................................................................................................................ 20
Attachment A ........................................................................................................................................................... 20
Attachments B, C, and D .......................................................................................................................................... 21

2
Section A: System Information System Names
Streamlining a City-Wide Process for Optimal Small Cell Locations: a Collaborative Approach
Exemplary Systems in Government Category
Enterprise Systems
Letter from Executive Administrator Authorizing Submission
See Attachment A
System Summary
In 2018, Illinois passed a state law, Illinois Public Act 100-585, the Small Cell Wireless Facilities
Deployment Act which will assist in speeding up the implementation of 5G networks by private companies and
result in requiring local authorities to rapidly issue new policies that would manage the deployment of small cell
wireless infrastructure within their jurisdiction. Like many other cities across the country who have found
themselves in a similar circumstance, the City of Naperville had to
quickly pull together a multi-department business process for incoming
wireless vendor applications that needed to be reviewed. This quickly
assembled ad-hoc process was composed of a variety of different
applications such as city emails, Excel spreadsheets, Microsoft One Note,
Microsoft SharePoint, and GIS maps.
In order to streamline the application submittals, the City Small Cell
Site Review Team worked with GIS and IT staff to assist with designing a
process that would result in all wireless providers submitting their data
with geographic coordinates. Automation processes were created to use
these coordinates to automatically populate a SharePoint list and a
Geocortex Web map application to help guide staff during the review
process and rapidly coordinate with providers to find optimal site
locations.
Developing the methods to update the SharePoint list and web maps required a creative technical
approach to fully automate the process due to the large variety of data sources. Each would have to be
streamlined to provide City staff with the information needed to make quick and accurate decisions. The IT-GIS
team used a combination of scripting resources such as PowerShell, Python, ArcPy, and SQL Server Integration
services to integrate with SharePoint and to import data from our ERP software into the GIS database.
The reason this system is exemplary is because the timeline, complexity, and cross-departmental nature
of this project required both extensive communication and technical effort. After many months and numerous
meetings, idea gathering sessions, and iterative testing we succeeded in automating the following processes used
by the Small Cell Site Review Team to review incoming applications for optimal site locations:
• The initial small cell application submittal from wireless vendors for review of prospective pole sites, along with tracking the status of each proposed site location • Daily update of data used in mapping applications for communicating site review status to both city staff and external telecom companies • Update of SharePoint list and dashboard used to track inquiries

3
• Download of existing site applications from the City’s permit system SunGard Naviline • Email notification to City staff when new sites were submitted or when the review period has been completed • Notification of vendor when the review of an entire batch submitted is complete • Update of GIS feature datasets that are under review as potential sites • Location of small cell sites that have already been reviewed for either approval or rejection as an
optimal site
• Location of all city-owned pole for electric utility poles, streetlight poles, and traffic signals (over
18,000 poles)
• Location of all poles that have existing permitted small cell hardware mounted shared in the
web map
Automation of the above tasks allowed City staff to focus on the actual site location review, rather than administration of the inquiries and creation of reports needed for telecom vendors.
Testimonial Letters
See Attachments B, C, and D
Section B: Jurisdiction City of Naperville, Illinois
The City of Naperville has a population of 147,682. It has a City Council-City Manager form of government. The Naperville Municipal Center is located at 400 South Eagle Street, Naperville IL 60540. The City covers approximately 39.24 square miles, and is located approximately 30 miles west of Chicago. The annual operating budget is $451.4 million.
Mayor Steve Chirico
400 South Eagle Street
Naperville, IL 60540
City Manager Doug Krieger
400 South Eagle Street
Naperville, IL 60540
Application Contact GIS Coordinator
Eva Cancino
400 South Eagle Street
Naperville, IL 60540
Phone: (630) 548-1318
Fax: (630) 305-5957

4
Section C: System Design Motivation for Change
After the Small Cell Wireless Facilities Deployment Act was implemented, it quickly became apparent that it would be necessary to define a more efficient and timely workflow for reviewing optimal site locations for small cell devices on street lights and utility poles throughout the city. The original process of tracking site location requests from telecom companies and their vendors was implemented by operations staff in the Transportation, Development, and Engineering Department (TED) using City email and a Microsoft OneNote Notebook. GIS staff had also quickly implemented a web map that showed the location of existing electric, streetlight, and traffic signal poles, but did not show the location of poles being reviewed. The original workflow would eventually lack the capacity to handle the influx of applications from telecom vendors. The workflow needed to be automated and refined so that City staff would have access to all the data needed to make the decisions throughout the review process.
Screenshot of the notebook in Microsoft OneNote
Each inquiry had a checklist that tracked approvals or denials from the Small Cell Site
Review Team. This team consisted of members from the Legal Department, Public Works,
Engineering and Development, Water and Electric Utilities. The team would review each

5
inquiry and then they would check off whether the site was approved or denied and add
comments. If a pole was denied, an alternative location would be suggested.
As the team tracked an increased frequency of new requests, it quickly became difficult
to manage. Each batch of up to fifty requests needed to be tracked and replied to within three
weeks. This meant that each site location needed to be reviewed within that time period, and a
report sent back to the telecom vendor detailing the status of all site locations submitted.
Reports needed to be generated and the information was not in a format accessible to
reporting systems such as Power BI. The notification process was too costly to automate, and
the maps used were static images rather than interactive searchable mapping applications. The
system also had no way of saving the status of each site location, so City staff had to perform
manual text searches to determine if a site location had been previously reviewed.
The Small Cell Site Review Team decided to contact the Information Technology
Department’s GIS group to see how the review process could be automated. Specifically, they
wanted to improve the service the City was providing telecom companies to review small cell
site locations. City staff also wanted to improve interdepartmental communication of the
status of each site under review.
Services Targeted for improvement
After an initial meeting with the Small Cell Site Review Team and the Information
Technology’s GIS Team, the following goals were determined:
• Save time gathering information for each specific site using GIS mapping applications
• Improve communication between City departments during the review process
• Automate the process of updating interactive GIS mapping applications
• Automate the notification process for the telecom companies as location submittals are
completed
• Integrate data from the City’s permitting system into GIS to track the status of all small
cell installation permits
Six different departments and fourteen staff members were involved in the review
process. In addition, each major telecom company was affected by the application and review
process.
Unexpected Benefits
As the cross-departmental teams began working on improving the process, there were
several unintended benefits. As each step progressed, the group was finding more ways to
integrate data from different systems using scripting languages such as Python, PowerShell and
integration technologies such as SQL Server Integration Services (SSIS). Lessons learned from
previous GIS and automation projects were refined and altered to match the new scenario. The
IT GIS Team applied and refined their newly implemented project management initiative; the

6
Agile two-week sprint process. Applying the Agile methodology allowed the team to continue
to keep adapting as application requirements changed.
The team progressed through several new learning curves sharpening their skills in the
following areas:
• A new way to download and process Excel spreadsheets stored in SharePoint using
PowerShell
• New Geoprocessing libraries in Python’s ArcPy libraries
• New process mapping techniques
• A new way to schedule automation scripts using SQL Server Integration Service
Another unexpected result was the increased level of trust between operations staff at
the City and development staff in IT. Using the two-week sprint cycle reinforced this level of
trust and kept goals both clear and flexible as requirements changed over time.
System Design Problems Encountered
The initial system design faced two primary hurdles. The first and most difficult
challenge was that the business process was only recently implemented and still evolving. The
initial system design struggled to both stay flexible and find predicable opportunities for
automation. Bi-weekly meetings helped to keep constant communication between operational
staff on the Small Cell Site Review Team and development staff in IT. The challenge was to
keep two-week sprint cycle tasks focused on deliverables that were more certain in nature
rather than those that may face changes or be eliminated from the process altogether.
7
The second was a more technical hurdle. The PowerShell scripting libraries used to
download and process Excel files and update SharePoint lists would not work the same in
SharePoint Teams sites as they did for normal SharePoint sites. This required the team to go
through a learning curve with new PowerShell libraries. This proved to be only a minor hurdle
however and the IT-GIS team quickly adapted and were able to implement automation tasks in
time for the new system to go live.
What differentiates this system from others?
The original system for reviewing site locations was a manual process using email and
Microsoft OneNote. Most typical workflows that are targeted for automation work are not
usually completely manual in nature. Many times there are several disparate systems that
need to be integrated, and in this particular project, it was the equivalent of pen and paper as
the starting point.
In addition, the process was initiated based on a legally mandated requirement, which
meant that there were no existing resources to use as a starting point. That meant the entire
workflow automation was based on operational workflow that had never been established.
After the automation process was completed, the resulting system turned out to be a
unique integration of processes and automation technologies. The new site review system uses
a combination of PowerShell, Python and its GIS library ArcPy, SharePoint, InfoPath, Geocortex,
ArcGIS Server and SQL Server Integration Services. Although this was a single process
automation effort, this project affected each department involved in the site review process.
the City’s Water Utility, Electric Utility, Public Works, Transportation Engineering and Planning
(TED), Legal and Communications departments all benefited from the automation process.
Section D: Implementation Phases of Development
Phase 1: Design Phase The GIS Team and IT staff began the project by meeting with leaders of the Small Cell
Site Review Team and operational GIS staff technicians to define the existing business process
and identify opportunities for automation. During this meeting, the GIS team and IT Business
Analysts worked together to storyboard the process on a whiteboard and identified
opportunities for improvement. The initial desired business process was mapped and then
allowed to evolve over time.
The “Small Cell Pre-Application Business Process Model Diagram” walks the reviewer through
the entire process from initial submittal of the vendor request to final evaluation of the site
location.

8
The “Small Cell Pre-Application Review Workflow Diagram” maps out the technical workflow
that is launching the small cell review process.
Phase 2: Development and Automation Phase During the automation phase the IT-GIS team defined the automation tasks for
downloading Excel spreadsheets submitted by telecom vendors using PowerShell, creating
ArcGIS feature classes with Python using the location information in the spreadsheets, creating
interactive web applications and Power BI reports.

9
All resulting tasks were automated using SQL Server Integration Services.
Phase 3: GIS Web App Development Phase Internal Web Mapping Application
The internal viewer was created to facilitate the review process and to give
departmental reviewers spatial context in order to make the best decision for locating optimal
site locations. While the SharePoint List was a beneficial way to track and update the data, the
map viewer allows users to work with multiple data source such as location of right of way
trees and existing small cell locations.
Powershell
downloadPreAppInquiries.ps1Python
CreateInquiryPoints.py
Powershell
uploadPreAppInquiryTemplate.ps1
Powershell
uploadPreAppinquiriesToList.ps1
Powershell
generatePreAppReport.ps1

10
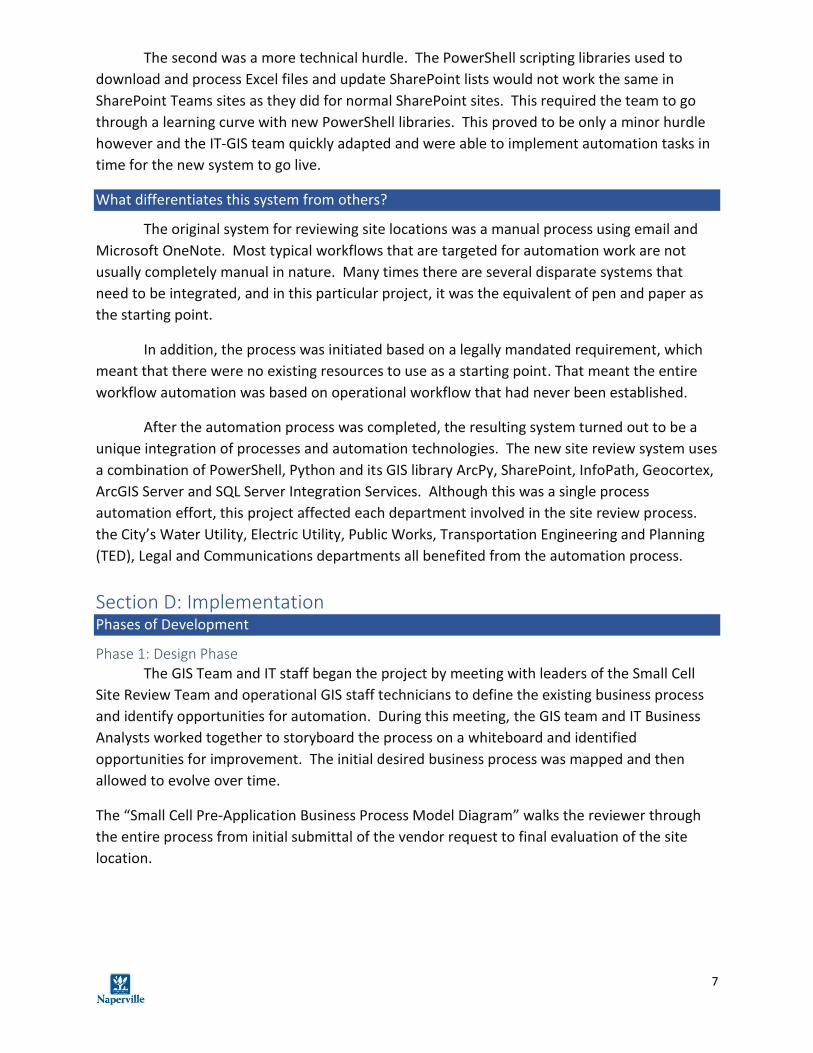
External Web Mapping Application
The external viewer was created as a means to communicate to interested telecom
vendors the location of City-owned poles and poles that have existing permitted hardware
installed on them. Because the public facing viewer only needed basic functionality, we chose
to use the ESRI Web App Builder for its ability to be hosted on ArcGIS Online and for the easy-
to-navigate interface.
11
Modifications to the Original System Design
Currently no modifications to the original system design have been needed. However,
we do anticipate as we move forward there will be opportunities to integrate some of the new
capabilities in Office 365 such as Microsoft Flow and Microsoft PowerApps.
Section E: Organizational Impact User community the system serves
This system serves both internal and external user communities. Internally, the system
serves the cross departmental Small Cell Review Team listed below. As the telecom companies
begin to ramp up their efforts to install small cell devices, an influx of requests is expected. The
initial process in place was manual, prone to errors, and did not provide the information
needed by the review team for each step in the process. The following list of reviewers
highlights the cross departmental nature of the review team and shows each step of automated
notifications during the process.

12
Externally, the system supports both the telecom community and Naperville residents.
The system is designed with the purpose of streamlining the City’s response to site location
requests, and ensuring that Naperville residents are kept informed so that they’re aware of
right-of-way construction projects, as well as how they will benefit from them. Interactive
status maps communicate to telecom vendors which sites have been approved, and residents
can see where work is taking place now, as well as where it will occur in the future.
Decisions Operation and Services Affected
The new process put in place provides City staff with information to make informed
decisions regarding the site review process. Reports and analytics showing the status of
submittals provide decision makers with information to track the number of requests, as well as
the timeliness of city responses.
Interactive maps communicate to decision makers as well. City operations for road
construction, or right-of-way improvement projects are improved as City staff can see ahead of
time where small cell installations will be taking place. Call takers at the City can quickly
respond to residents who call inquiring about installations of small cell devices occurring in
their neighborhoods with up-to-date data that is easily searchable.

13
The City will also be able to handle far more inquiries than the previous manual system
would have allowed. This means better service to both telecom companies and residents who
ultimately benefit from the small cell installations.
Beyond these direct impacts, the City’s IT-GIS team has been affected in a positive
manner as well. The team went through several learning curves using new technologies that
will benefit future projects throughout the City. This makes the IT-GIS team more responsive to
automation projects of all kinds.
Qualitative Impacts
The qualitative improvements to this process cannot be underestimated. The initial
manual system required a tremendous amount of time to keep up-to-date and responsive to
the onslaught of requests. This process was prone to errors, and inefficiencies. The City is
required by law to respond to site review requests within a few short weeks. The automated
nature of this system eliminated the manual data entry process and ensured the data in
SharePoint and GIS systems were kept in sync.
Another qualitative impact was the improvement in notifications. Without an
automated way to track submittals in batches, it would have been very easy to produce
incomplete or inaccurate responses to telecom vendors.

14
Screenshot of spreadsheet returned to vendor showing the status of each site:
Quantitative Impacts
Quantitatively, the new system increases the number of requests that the City can
respond to within the legally defined period. City staff can see quantitative reports highlighting
which submittals need to processed first, and the system provides up-to-date reports and
dashboards that are kept in sync between SharePoint and GIS.
The new system also serves to reduce the overall number of site requests to be
reviewed. Telecom companies can view on an interactive map which sites have already been
approved or denied, saving them the effort of submitting duplicate requests. This reduces the
stress on City staff, and allows telecom companies to focus on more productive efforts.

15
Effects on Productivity
The main increases in productivity came from the reduction in the amount of time the
Small Cell Site Review Team needed to respond to incoming requests. The original system
required an enormous amount of manual data entry, as well as the manual creation of static
map images. City staff is now freed up to work on more productive tasks within their
departments.
The new system has also reduced the total number of duplicate submittals. Internal
web mapping applications allow City staff to instantly see if a site has previously been reviewed.

16
Other Impacts of the System
The process of automating the review brought on several positive changes. Cross-
department teams began interacting more closely and a sense of teamwork and trust was
created. Business Systems Analysts in IT worked with Project Managers on the Development
Team to map out business processes, as well as streamline the use of SharePoint lists. The GIS-
IT Team used these to find opportunities to automate the process.
Communication between all teams created a new network of talent that can be used in
future projects that may involve similar processes. In this manner, this project can serve as a
model for cross departmental cooperation.
Finally, this project created a more amicable relationship between the telecom vendors
and the Small Cell Site Review Team. The telecom vendors have higher confidence that their
site review requests will be handled efficiently and in a timely manner, and City staff can better
track the requests and provide more detailed responses.
Changes in How Business is Conducted
The original system required the Small Cell Site Review Team Project Manager to
manually create a Microsoft OneNote page for each site review request. This required
extensive manual data entry to copy the data from the excel spreadsheet that the telecom
vendors provided. In the new system, the manager only needs to copy the spreadsheet
submitted by telecom vendors into a SharePoint folder. The automation scripts perform a
check each day to see if a new spreadsheet exists. If so, the scripts create a batch submittal ID
number and then inserts each item into the SharePoint list.
Spreadsheet submitted by telecom vendors for each site to be reviewed.

17
The automation scripts also perform a check of each location submitted to see if they
have previously been approved or denied. If it has been previously reviewed, the review status
is automatically updated when the new list item is created. The Python portion of the
automation creates point features based on x,y coordinates in a GIS dataset. These datasets
are hosted in web map applications used both internally and externally.
Screenshot of PowerShell scripts upload Excel data to SharePoint list.
The original system also required the Small Cell Site Review Team Project Manager to
periodically perform a manual review of approval/denial check boxes in hundreds of Microsoft
OneNote documents. While these documents were meticulously maintained, it made tracking
entire batches of requests extremely difficult. The Project Manager had to review each
individual site in a batch to see if all of them had been reviewed or not. This manual review
process was replaced with a SharePoint dashboard. All members of the Small Cell Site Review
Team can now see the status of each site in each batch submitted.
City staff would also have to manually create a spreadsheet with review notes to send to
the telecom vendors once a submitted batch was complete. This process was replaced with a
daily automation script that checks the status of each site request in each submittal. Once each
site request has been either approved or denied, the automation script creates a spreadsheet
with each site request, as well as notes of approval or denial. This spreadsheet is then
automatically emailed to the Small Cell Site Review Team manager for review before
forwarding to the telecom vendors.

18
Finally, the daily automation scripts update each site location in GIS based on any
changes that may have occurred in the SharePoint list. This ensures that the data is kept in sync
between systems with no manual data entry
Screenshot of Python Script to create GIS dataset points.
Section F: System Resources Primary Hardware Components
ArcGIS Server 10.3.1
Windows Server 2012 R2
100 GB, 28 GB RAM, 12 CPUs
Geocortex Essentials Server
Windows Server 2012 R2
70 GB, 8 GB RAM, 4 CPUs
Automation Server
Windows Server 2012 R2
60 GB, 16 GB RAM, 4 CPUs
SQL Server
Windows Server 2008 R2
280 GB, 132 GB RAM, 16 CPUs
19
Primary Software Components
ArcGIS Desktop 10.5.1
ArcGIS Server 10.3.1
ArcGIS Online
ESRI WebApp Builder
Geocortex Essentials 4.9.2 and HTML5 Viewer 2.10.1
SQL Server 2008 R2
SunGard Naviline
Microsoft SharePoint Online
SQL Server Integration Services
System Data
The system uses permit data that is extracted from our SunGard Naviline ERP software.
This data is joined with GIS point feature classes to show locations of each site to be reviewed.
This GIS data is stored in a SQL Server 2008 R2 Enterprise Geodatabase. Site data is stored in a
SharePoint list. This list is converted to spatial data in the same SQL Server 2008 R2
Geodatabase. Initial site review requests and final responses back to telecom vendors are
stored in Excel spreadsheets.
Staff Resources
2.5 FTE City staff resources.
Unusual Resource Reporting
The City is currently in the middle of a new ERP implementation. The process currently
involves using data that is being tracked in our legacy ERP System (SunGard Naviline) because
the new ERP system (Tyler Munis EnerGov) is not fully implemented.

20
Attachments Attachment A

21
Attachments B, C, and D

22

23


