25


g
TABLE OF CONTENTSPERFORMANACE MEASUREMENT PLAN
Section Title Page
1.0 INTRODUCTION ...................................................................................................................................................................5
1.1 PLAN DEVELOPMENT REQUIREMENTS.......................................................................................................................................51.2 METRIC REPORTS .......................................................................................................................................................................5
2.0 SCOPE.......................................................................................................................................................................................5
3.0 ORGANIZATION STRUCTURE.........................................................................................................................................5
3.1 ROLES AND RESPONSIBILITIES...................................................................................................................................................53.2 TEAMING AND SUBCONTRACTING .............................................................................................................................................6
4.0 PERFORMANCE MANAGEMENT PROCESSES...........................................................................................................7
4.1 INTEGRATED COST AND SCHEDULE PLANNING.........................................................................................................................84.2 EARNED VALUE PROCESS ..........................................................................................................................................................9
4.2.1 Establish the Plan .............................................................................................................................................................94.2.2 Monitor Progress Against The Plan ..............................................................................................................................104.2.3 Forecast Future Progress By Extrapolating Past Performance To Future Work .......................................................114.2.4 Corrective Action............................................................................................................................................................11
5.0 MRDOC MANAGEMENT INFORMATION SYSTEM (MIMS)..................................................................................11
5.1 MIMS INFORMATION ENGINE .................................................................................................................................................125.2 WEB-BASED ACCESS ................................................................................................................................................................13
6.0 PERFORMANCE REPORTS AND METRICS ...............................................................................................................13
6.1 METRICS ...................................................................................................................................................................................156.1.1 Cost and Schedule Metrics .............................................................................................................................................156.1.2 Technical Performance Metrics .....................................................................................................................................186.1.3 Configuration Management Metrics..............................................................................................................................18
6.2 COST AND PROGRESS TRACKING, CONTROLLING, AND REPORTING......................................................................................186.3 PROBLEM SOLVING AND RESOLUTION ....................................................................................................................................19
7.0 RISK MANAGEMENT ........................................................................................................................................................19
7.1 EARLY PROJECT PLANNING RISK MANAGMENT .....................................................................................................................207.2 LIFE-CYCLE RISK MANAGEMENT............................................................................................................................................217.3 RISK RADAR SYSTEM ...............................................................................................................................................................21
APPENDIX A.......................................................................................................................................................................................22
TERMS AND DEFINITIONS ..................................................................................................................................................................22

g
TABLE OF FIGURESPERFORMANACE MEASUREMENT PLAN
Figure Title Page
FIGURE 1 FDC MRDOC PROGRAM ORGANIZATION. ......................................................................................................................6FIGURE 2 ROLES OF TEAM MEMBERS IN THE MRDOC PROGRAM ORGANIZATION........................................................................7FIGURE 3 MRDOC CLOSED-LOOP PERFORMANCE MANAGEMENT PROCESS .................................................................................8FIGURE 4 PERFORMANCE MEASUREMENT PROCESS ........................................................................................................................9FIGURE 5 EARNED VALUE PERFORMANCE MEASUREMENT TECHNIQUES.....................................................................................10FIGURE 6 MRDOC INFORMATION MANAGEMENT SYSTEM (MIMS) ............................................................................................12FIGURE 7 CAT II CAPABILITIES......................................................................................................................................................13FIGURE 8 MRDOC MONTHLY REPORT ..........................................................................................................................................14FIGURE 9 PERFORMANCE METRICS.................................................................................................................................................15FIGURE 10 MRDOC RISK MANAGEMENT ........................................................................................................................................20

g
1.0 Introduction
This Performance Measurement Plan is submitted in response to the requirements of NASA contract NAS3-99155,DID No.: CD-01. The Performance Measurement Plan will describe the structure and contents that will be utilizedto document the current status of MRDOC activities. The plan will discuss specific performance measurementmetrics, the processes used to develop them, and how they will be used to manage MRDOC.
1.1 Plan Development Requirements
As stated in DID No.: CD-01 the plan will address how the fixed price and cost portions of the contract will bereported. Separate monthly performance reports will be provided for the FCF and each Delivery Order. The dateof submittal will be on each report. The plan will list each report, the number of copies to be submitted and theprocess used to develop the reports. At a minimum, the monthly Performance Measurement Reports will consistof:
A) Schedules: i) Project Milestone Schedule, ii) System Level Schedule, iii) Major Concept Level ScheduleB) Technical Accomplishments organized by appropriate WBS levelC) Near Term Activities organized by appropriate WBS levelD) Problems/Issues/Risks/Mitigation Strategies organized by the appropriate WBS level.
1.2 Metric Reports
The Performance Measurement Plan will identify a list of metrics that will be used by the FDC to daily manageMRDOC activities. Submitted reports will include a definition, source of data, computation approach, desiredoutcome, frequency of reporting and period of measurement.
All financial reports will be submitted in accordance with NPG 9501.2C (ref. NASA Form 533 reports)
2.0 Scope
The Performance Measurement Plan is applicable to all FDC and subcontractor team activities in support ofMRDOC and related delivery orders and options. All Functional managers on the FDC MRDOC Team will begiven a copy of the plan and briefed on its contents.
The Performance Measurement Plan is based on industry best practices for bringing project management disciplineto MRDOC. As a teaming partner with FDC, Robbins-Gioia will establish and sustain an effective business andproject management planning and control architecture for MRDOC. The Performance Measurement Plan willdiscuss the project management processes and set forth the requirements for team members to enable effectivecollection and use of MRDOC performance measurement metrics.
3.0 Organization Structure
3.1 Roles and Responsibilities
See Figure 1. The organization clearly divides responsibilities and authorities to focus on the development ofspecific products. Single points of responsibility and accountability are established for the FCF, ISS integrationand TSC operations, and PI experiments. Each FCF rack and each Exhibit 2 and Exhibit 3 DO has a ProjectManager with cost, schedule, and performance responsibility and the authority to plan and manage the day-to-dayperformance of the project.

g
3.2 Teaming and Subcontracting
See Figure 2. FDC teaming partners are proven NASA performers, having executed contracts with similarrequirements at GRC, GSFC, JSC, MSFC, and KSC. In addition, four partners are small businesses that havedemonstrated the same responsiveness and dedication that have characterized FDC’s prior relationships with GRC.
In the area of Program Planning and Control, FDC has teamed with Robbins-Gioia, Inc (R-G). R-G was selectedfor its extensive government and commercial project management experience and proven systems (CAT II). R-Ghas developed and implemented the MRDOC Information Management System (MIMS) which enables the FDCTeam to manage MRDOC through performance measures using an integrated business systems approach.
Figure 1 FDC MRDOC Program Organization.
Raytheon
FCF Director
Christopher Pestak
Analex
Product Assurance andSafety Manager
Will Quinn
HEI
MRDOC Program ManagerDr. Guion Bluford
Deputy Program ManagerMichael Korba
FDC
FDC
Program Planning &Control Manager
Bill Harding
R-G
Integration & OperationsDirector
Brian Finley(acting)
FDCPI Experiments Director
Brian Finley
FDC
FCF SE/Common
SubsystemsManager
Dr. NoraBozzolo
Analex
MDCAManager
CIR Manager
Martin O’Toole
Analex
FIR Manager
Andrew Peddie
FDC
SARManager
AndrewPeddie(acting)
FDCMission
IntegrationPlanningManager
MichaelJohanson
FDC
TSCDevelop-
mentManager
Brian Finley(Acting)
Analex
TSCOperationsManager
ChuckSommer
J&T
LMMManager
EdHovenac
•ISO 9001 Quality Mgmt•System Safety•Materials & Processes•Reliability & Maintainability•Software Assurance
•Utilization &Integration•Logistics &Operations
•Performance Measurement•Property Management•Configuration & Data Mgmt•Other Admin. Functions
Richard Lillie(Manager)
PTCU
FDC
TonyJohnson
Finance and Contracts
Jack Reilly
FDC
Analex

g
Figure 2 Roles of Team Members in the MRDOC Program Organization
TeamMember
MRDOC Role
FDC Program Management, FCF FIR/SAR,TSC IT, mission integration, and fluidsPI-specific experiments
Analex FCF CIR, TSC, mission integration,combustion PI-specific experiments
J&T TSC and mission operation, flighthardware fabrication, groundintegration
HEI Safety, reliability, and qualityassurance
Raytheon ISS training simulators and softwaredevelopment
Robbins-Gioia
Program planning, control and analysis
4.0 Performance Management Processes
Defined and repeatable business and program management processes are the cornerstone of the MRDOCPerformance Measurement. The tailored processes ensure discipline and visibility in the following areas:
• Planning, scheduling, and budgeting work• Statusing, reporting, tracking, and forecasting performance• Financial and change management reporting.
Figure 3 is a summary view of the processes used to plan, baseline, and measure MRDOC performance.

g
Figure 3 MRDOC Closed-Loop Performance Management ProcessB
aseline/Change M
anagement
Tracking and Reporting
No
Exec
utio
nPl
anni
ngYesMRDOC Delivery
Order/SOW
MeasureProgress
AnalyzeVariances
No
Yes
Evaluate Impactof Change
(Cost, Schedule,Technical)
Yes
RiskManagement
Process
DevelopCorrectiveAction Plan
PerformanceMeasurement
Baseline
Changeto Contract
Req’mnt
CPP Baseline
EngineeringChange
Proposals
CWBS
ScheduleWP Time
Cost
$
Contract Budget
J A S O
Qty
TimeResources
Changeto
Baseline?
No CorrectiveAction?
ExecuteCPP
PM Reviews &Monthly Performance
Reports (CD-02)
MRDOC Team performance measurements are based on the FDC system of integrated cost and schedule planning,earned value management, risk management, and configuration management.
4.1 Integrated Cost and Schedule Planning
For the current Contractor Project Plans (CPPs) and for all future CPPs, the FDC Team decomposes the ContractWork Breakdown Structure (CWBS) to the appropriate level, based on the requirements of each project. TheCWBS is expanded to lower levels for projects that are large/complex or are fixed price and require sufficientlevels of decomposition for cost and schedule estimating and control. The lowest level of CWBS is assigned to aWork Package Lead authorized to perform the work package.
The work package becomes the basis for establishing the task activity network schedule, estimating resources, andestablishing budgets. The work packages are:
• Fully mapped and traceable to the lowest level of the task• Sufficiently detailed to include activity identification and descriptions, activity precedence and
relationships, and durations• Mapped and traceable to in-process and end item deliverables, CDRLs, and progress payment
schedules• Appropriately resourced, identifying labor, material, and special requirements such as GFE, contractor-
furnished equipment (CFE), and travel.

g
4.2 Earned Value Process
Meeting a project’s cost and schedule goals is the significant measure of success. The ability to influence successrequires the capability to identify and resolve problems before they reach criticality. Earned value management canbe defined as a process that allows management to have visibility into cost and schedule progress of a program.This process has four steps, as follows:
ESTABLISH THE PLAN: Where were you supposed to be?MONITOR PROGRESS AGAINST THE PLAN: Where are you?FORECAST FUTURE PROGRESS: Are you going to get there?CORRECTIVE ACTION: What do you do now?
Figure 4 Performance Measurement Process
4.2.1 Establish the Plan
The plan is the Performance Measurement Baseline (PMB) against which progress will be measured. It is a time-phased budget allocating expenditures for various activities by time period. The first step is to decompose theprogram objectives into discrete, manageable work packages and activities by using a Work Breakdown Structure(WBS) to describe the program deliverables and the work to be accomplished. FDC, and our subcontractor teamhas prepared the MRDOC WBS down to where responsibility can be assigned and charges applied to a single cost(control) account. The WBS is constructed so each level includes all the elements required to complete the nexthigher level. In this manner, as the WBS is rolled-up to subsequently higher levels, costs can be accumulated. TheMRDOC WBS is the basis for both the activity network (schedule) and the project resources (budget): hence atime-phased budget.
Using the MRDOC WBS as the foundation, we prepare an activity network (logic diagram) for each lower levelelement of the WBS by listing all the activities that must be accomplished to complete the WBS element. Theseactivities are then logically sequenced, and relationships among the activities are determined. These relationshipsor constraints depict what activities must be performed sequentially and which can be performed in parallel. Wedesign the activity network in such a manner that networks may be broken out by the various entities(Configuration Items (CIs), Exhibits, project milestones, etc.) so we can assign responsibility and track progressaccordingly. We ensure that every project deliverable is specifically identified in the activity network so they areappropriately scheduled and monitored. Design of the network will include determining an estimated duration to
ESTABLISHTHE PLAN
MONITOR PROGRESSAGAINST THE PLAN
FORECAST FUTUREPROGRESS
CORRECTIVE ACTION
g
accomplish each activity. With a completed network and estimated durations, an automated project managementtool (CAT II MIMS) is used to calculate the schedule.
Work packages constitute the basic building blocks used in planning, controlling, and measuring contractperformance. A work package is a low level, detailed, short-span task or job assignment identified by the costaccount manager as part of a cost (control) account. The MRDOC WBS is time-phased and includes estimatedcosts for each month during the life of the contract. The WBS is the performance measurement baseline for costcontrol. This is also known as the Budgeted Cost for Work Scheduled (BCWS).
4.2.2 Monitor Progress Against The Plan
With the MRDOC WBS in place as the Performance Measurement Baseline (PMB), work is authorized andinitiated. This is the start of the performance data collection phase that is concerned with the accumulation ofearned value derived from technical accomplishments and the actual incurred costs associated with the technicaleffort. The measurement of performance and identification of significant variances are the focus of this phase andwill lead to analysis of performance indices, forecasts of impact, and recommendations for corrective action.
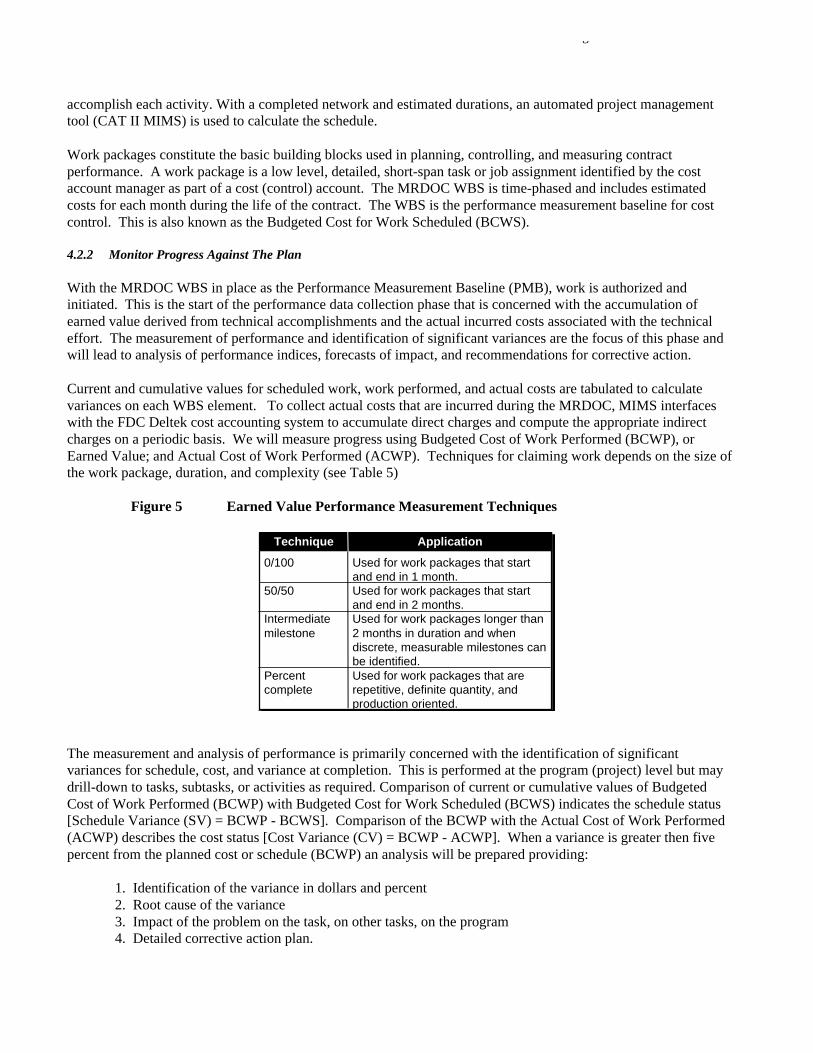
Current and cumulative values for scheduled work, work performed, and actual costs are tabulated to calculatevariances on each WBS element. To collect actual costs that are incurred during the MRDOC, MIMS interfaceswith the FDC Deltek cost accounting system to accumulate direct charges and compute the appropriate indirectcharges on a periodic basis. We will measure progress using Budgeted Cost of Work Performed (BCWP), orEarned Value; and Actual Cost of Work Performed (ACWP). Techniques for claiming work depends on the size ofthe work package, duration, and complexity (see Table 5)
Figure 5 Earned Value Performance Measurement Techniques
Technique
0/100
50/50
Intermediatemilestone
Percentcomplete
Application
Used for work packages that startand end in 1 month.Used for work packages that startand end in 2 months.Used for work packages longer than2 months in duration and whendiscrete, measurable milestones canbe identified.Used for work packages that arerepetitive, definite quantity, andproduction oriented.
The measurement and analysis of performance is primarily concerned with the identification of significantvariances for schedule, cost, and variance at completion. This is performed at the program (project) level but maydrill-down to tasks, subtasks, or activities as required. Comparison of current or cumulative values of BudgetedCost of Work Performed (BCWP) with Budgeted Cost for Work Scheduled (BCWS) indicates the schedule status[Schedule Variance (SV) = BCWP - BCWS]. Comparison of the BCWP with the Actual Cost of Work Performed(ACWP) describes the cost status [Cost Variance (CV) = BCWP - ACWP]. When a variance is greater then fivepercent from the planned cost or schedule (BCWP) an analysis will be prepared providing:
1. Identification of the variance in dollars and percent2. Root cause of the variance3. Impact of the problem on the task, on other tasks, on the program4. Detailed corrective action plan.

g
4.2.3 Forecast Future Progress By Extrapolating Past Performance To Future Work
A careful analysis of the cost and/or schedule variances occurring from the interaction of the three basic parameters(BCWS, BCWP, and ACWP) is the next step and will provide important information regarding program condition.Completion of these analyses on a monthly basis enables the tracking of program performance. The CostPerformance Index (CPI), [CPI = BCWP/ACWP], indicates the efficiency attained for the resources expended. TheSchedule Performance Index (SPI), [ SPI = BCWP/BCWS], calculates the efficiency achieved regardingcompletion of scheduled work. In each case a 100% CPI and SPI would indicate that the project is on cost and onschedule as compared to the baseline.
Calculating Estimate At Completion (EAC) is a quick method to forecast what the program may really cost basedon current data. However, an in-depth analysis should be conducted before taking management actions basedsolely on the Independent Estimate at Completion (IEAC). The various IEAC formulae all take the remainingwork, divide it by a performance factor (say, CPI), and add to it the total actual cost incurred to date. MRDOCperformance measurement techniques will provide needed insight into the status of the program and help forecastfuture performance based upon present trends.
4.2.4 Corrective Action
Regardless of the quality of the cost control system, problems may occur. The procedure for resolution is toidentify the problem as early as possible, drive the problem back to its source, determine the likely impact(s), anddevelop alternatives for presentation to management.
Some typical problems that cause variances and require resolution are estimating errors, changing requirements,and changing economic conditions. The process for corrective action planning will:
• Describe actions taken to minimize the risk• Identify the individual/organization taking the required action• Present a schedule for the plan with get-well dates• If no corrective action is possible, explain why and discuss impact• Monitor the corrective action plan and show results.
5.0 MRDOC Management Information System (MIMS)
The FDC MRDOC Team employs the widely used Deltek accounting software, a fully integrated, off-the-shelf, joborder, accounting, purchasing and inventory. This system accumulates cost data and provides an integratedproperty management and material control capability. MRDOC performance measurement is fully integrated withDeltek’s cost accounting data. This integration allows us to use cost control, tracking, and reporting processes as anintegral part of MRDOC performance measurement system. The full integration of these systems and capabilitiesconstitutes MIMS.
As shown in Figure 6 MIMS supports the MRDOC management processes and provides a surveillance interface toGRC. The MRDOC Team establishes the project baselines with the Contractor Project Plans (CPPs), and theseform the basis of performance reporting for GRC surveillance/insight and support the management decisionprocesses. Actual cost, schedule, and technical performance data are collected during FCF and DO execution,captured in the MIMS, and analyzed to obtain earned values, conduct variance analyses, and prepare performancemetric reports. Reporting to GRC will be at the fourth level of the WBS or higher for Exhibit 1 and the third levelor higher for Exhibit 2 and 3 delivery orders. Further details will be below this level within discrete work packagesto meet management oversight needs.

g
Figure 6 MRDOC Information Management System (MIMS)
CDRL/Product/Financial ManagementCDRL/Product/Financial Management
Delivery ManagementDelivery Management
Actual Time & Material ChargesActual Time & Material Charges
Earned Value and Variance AnalysisEarned Value and Variance Analysis
DeliveryOrder
ContractorProject Plan
DeliveryOrder
Surveillance Plan Inputs:• Earned Value-Driven Performance Metrics• Problem & Resolution Reports• CDRL Deliverables• Completed Milestones & Events• Critical Path Performance• Technical Performance Metrics
Web-Enabled Reportingto GRC
CPP Baseline
FCF/DO Execution
FCF
DO1
DO2
DOs
SchedulePerformance
MaterialManagement
ConfigurationManagement
CostPerformance
RiskManagement
PropertyManagement
TechnicalPerformance
MIMSMIMS
•••
Cost and Property AccountingCost and Property Accounting
Performance Measurement SystemCAT II
Performance Measurement SystemCAT II
Insight
20042003200220012000
5.1 MIMS Information Engine
Because MRDOC is a large, complex program with tight cost, schedule, and performance requirements, FDCselected the Robbin’s-Gioia CAT II project management tool to serve as the integrated repository of all MIMS cost,schedule, and technical performance information. Built around the CAT II capabilities (see Figure 7) the MIMShas been engineered to make the most of FDC’s corporate financial and purchasing systems and, supplementedwith industry commercial off-the-shelf (COTS) products, to provide MRDOC with a robust capability to plan,control, and monitor performance. The Government will have full and complete access to nonproprietary data andinformation maintained in MIMS via secure, Web-based access.

g
Figure 7 CAT II Capabilities
Feature
Earned Value
WebAccessibleOpenSystemsArchitectureWhat-IfModeling
ManagementReporting
Benefit
Enhanced decision information byfully integrating cost, schedule, andtechnical performanceImproved information availabilitythrough convenience of desktop PCEasy integration of disparatebusiness and technical managementsystemsOptimize performance byassessing alternatives withoutaffecting the baselineFocused management attentionthrough exception-based reporting
5.2 Web-based Access
A unique feature of MIMS is its interactive Web-accessible project reporting. This provides a timely, top-to-bottom view of project status, issues, and risk mitigation strategies. MIMS Web-accessible project reportingprovides full “drill-down” capability to access the lowest level needed to uncover the root cause of issues.Performance reports (CD-02) and cost reports (CD-03) will be Web accessible 7 days a week, 24 hours a day.Access will be password protected and controlled to allow appropriate access depending on functionalresponsibility.
6.0 Performance Reports and Metrics
Cost, schedule, and technical performance is derived from measuring performance against baseline ContractorProject Plans (CPPs). The FDC Team will make management reports available to GRC via the MIMS Web site.Hardcopy reports will also be submitted monthly (CD-02 and CD-03). Figure 8 outlines the proposed table ofcontents for the MRDOC Monthly Report. Using CAT II’s report writer, new reporting requirements will bedefined, created, and included in CD-02 and CD-03 and made available on the MIMS Web site. All reports andgraphs will focus management attention by highlighting tasks that are behind schedule, in jeopardy, over cost, orscheduled in the next 30, 60, or 90 days.

g
Figure 8 MRDOC Monthly Report
MRDOC MONTHLY REPORTNASA CONTRACT NAS 3-99155
1 Technical Performance
2 Near Term Activities
3 WBS Comments3.1 Problems/Issues/Risks3.2 Mitigation Strategies
APPENDICES
A. SchedulesA1 Project MilestonesA2 Major Concept Level ScheduleA3 System LevelA4 CDRLs on timeA5 Planned hours versus actual by WBS and labor categoryA6 Work package status (plan/open/closed)
B. Earned Value PerformanceB1 Earned Value Performance Metrics
(Cost Variance, Schedule Variance, Cost Index, Schedule Index, Estimate at Completion [EAC])B2 Cost Variance Report
Explanation for variances exceeding 5% thresholdB3 Schedule Variance Report
Explanation for variances exceeding 5% threshold
C. CostC1 Funds Status – obligations versus expendituresC2 NASA Form 533M/QC3 Actual staffing versus plan
D. Technical AccomplishmentsD1 Top 5 IssuesD2 Major program events next 30/60/90 daysD3 Major accomplishments since last reportD4 Risk statusD5 Critical perform parameters (weight, size, power, etc.) maturityD6 Requirements stabilityD7 S/W lines of codeD8 S/W units coded, reviewed, and testedD9 S/W problem reports time to closeD10 S/W qualityD11 CDRL rejections
E. Surveillance PlanE1 SubcontractorsE2 Failure Review Board (FRB) AnomaliesE3 Test AnomaliesE4 Audit ResultsE5 Facilities and Test Equipment
F. Configuration ManagementF1 H/W problem reports open/closedF2 H/W defectsF3 Deviation/waiver requestsF4 Engineering Change Proposal (ECP) StatusF5 Documentation – Drawings/Documents/SoftwareF6 S/W problem reports open/closed

g
6.1 Metrics
Metrics focus management attention so solutions can be developed early enough to respond to problems, risks, orissues. MRDOC team corrective actions will be timely and technically manageable and optimize cost, schedule,and performance. Metrics driving the basis of estimate for each CPP will be baselined and measured. Historicalperformance will be factored in future DO CPPs. This is part of the closed loop ISO 9001 process to ensure thatlessons learned and historical performance are integrated into estimating and planning processes.
6.1.1 Cost and Schedule Metrics
Earned value is the basic tool to measure MRDOC cost, schedule, and technical performance. Current values forwork scheduled and work performed will be tabulated by CAT II monthly. Actual costs will be compared to thetabulated costs and variances calculated. Performance will be measured using the budgeted cost of work performed(BCWP) against budgeted cost of work scheduled (BCWS) and actual cost of work performed (ACWP) todetermine earned value. As appropriate, each work package will have associated technical performance metricsthat measure actual progress toward meeting technical performance objectives. Work Package Leads areaccountable for performance. The types of performance metrics the FDC Team will use to measure progress onMRDOC projects are set forth in Figure 9.
Figure 9 Performance Metrics
Metric Definition Source of Data ComputationApproach
Desired Outcome Frequency ofReporting
Period ofMeasurement
Earned ValuePerformance
Report showing budgeted andactual work performed andscheduled; monthly andcumulative cost and schedulevariances/indices; estimates atcompletion compared to theplan
FDC DELTEK(actual hours);MIMS (schedulestatus)
Compare budgetedhours/costs againstexpendedhours/costs
Cost and schedulevariances within5% of budget;indices 100% orbetter efficiency
Monthly As of end ofpreceding monthand cumulative
Cost variancereport (above/belowthreshold)
Report explaining WBS itemsoutside 5% variance
FDC DELTEK(actual hours);MIMS (schedulestatus)
CV=BCWP-ACWP Cost varianceswithin 5% ofbudget
Monthly As of end ofpreceding monthand cumulative
Co
st
Actual Staffing vsPlan
Histogram showing actual andplanned staffing by month
FDC DELTEK(Project Plan)
Compare staffagainst staffing andwork projections
Staffing inline withprojections
Semi-Monthly As of preparationdate and cumulative
Funds Status -obligations vsexpenditures
Report comparing monthlyobligations with expendituresby WBS item
FDC DELTEK(WBS budget)
Compare actualexpenditures withtime phased WBSbudget
Expenditures inlinewith budget
Monthly As of end ofpreceding month
NASA Fm 533M/Q Report showing actuals,planned, cum, and final esthours/costs in NASA 533format
FDC DELTEK(WBS budget)
Compute actual,planned, andestimated finalhours/costs
Hours/costs inlinewith plan
Monthly As of end ofpreceding monthand cumulative
Baselined ProjectMilestone Schedule
Schedule Gantt showingproject baseline milestonesand current milestone status
MIMS (schedulestatus - ProjectManager)
Milestonesprecedenced andmaintained in masterschedule
Maintain baselinemilestone schedule
Monthly As of end ofpreceding month
Sch
edu
le
Project MajorConcept Schedule
Schedule Gantt rollup showinglevel 3 WBS activities
MIMS (scheduleanalysis)
MIMS masterschedule rolled up tolevel 3 WBS
Maintain WBSlevel 3 activitieswithin schedulevariance limits
Monthly As of end ofpreceding month

g
Metric Definition Source of Data ComputationApproach
Desired Outcome Frequency ofReporting
Period ofMeasurement
Project SystemLevel Schedule
Schedule Gantt to the WBSwork package level
MIMS (schedulestatus - FunctionalManagers)
MIMS masterschedule -Precedence DiagramMethod (PDM)analysis
Maintain schedulewithin variancelimits
Monthly As of end ofpreceding month
Schedule Network Precedence Diagram Method(PDM) chart to the workpackage level
MIMS (schedulestatus - FunctionalManagers)
MIMS masterschedule -Precedence DiagramMethod (PDM)analysis
Maintain schedulewithin variancelimits
As required As of preparationdate
CDRLs on time Histogram showing thenumber of CDRLs due andthose delivered on time
Data Management Track CDRL duedates and deliverydates
100% on time Monthly As of end ofpreceding monthand cumulative
Sch
edu
le
Planned hours vrsactual by WBS andlabor cat
533M Report FDC DELTEK(WBS budget)
Compute actual,planned, andestimated finalhours/costs
Hours/costs inlinewith plan
Semi-Monthly As of preparationdate and cumulative
Work PackageStatus(plan/open/closed)
Schedule report showing theplanned/actual starts andfinish dates for each costcoded WBS
MIMS (schedulestatus - FunctionalManagers)
MIMS masterschedule -Precedence DiagramMethod (PDM)analysis
Manage workpackage scheduleto maintainschedule withinvariances
Monthly As of end ofpreceding month
Schedule variancereport (abovethreshold)
Report explaining WBS level 3items exceeding 5% schedulevariance
FDC DELTEK(actual hours);MIMS (schedulestatus)
SV=BCWP-BCWS Schedulevariances within5% of baseline
Monthly As of end ofpreceding monthand cumulative
Top 5 Issues Report highlighting the top fiveissues at the project level
Project Manager Project Managerestimation
Issue resolution Monthly As of end reportingperiod
Majoraccomplishmentssince last report
Report highlighting majoraccomplishments at theproject level for the reportingperiod
Project Manager Project Managerestimation
Technical/schedulesuccess
Monthly As of end reportingperiod
Risk Status Risk Radar Report showingcurrent risks and assessingthe risk impact on the project.
Project Manager /FunctionalManagers
Identify risks andtrack status throughelimination,avoidance, ormitigation
Identify major risksand maintain thelowest level ofproject riskpossible
Monthly As of end ofpreceding monthand cumulative
Tec
hn
ical
Per
form
ance
Critical performanceparameters (weight,size, power, etc.)maturity
Report showing currentengineering values versus ICDvalues.
Package leadprovide values asparts arefabricated orpurchased.
Compare ICD valueswith currentengineering values.
Identifyperformanceparameters andinitiate controltechniques
MonthlyQuarterly and atmajor milestonereviews.
As of end ofpreceding reportingperiod andcumulative
S/W Lines of Code Source Lines of Codeidentified as Comments andExecutable
Engineering Modeland Flight Code
Per Reporting Period
Cumulative Totals
Tracking ofSoftware Lines ofCode Completed
Monthly Engineering ModelDevelopmentthroughUnit Test
S/W units coded,reviewed, & tested
Engineering Model and FlightCode units identified duringFCF Software CDR
Engineering Modeland Flight Codeunits identifiedduring FCFSoftware CDR
Cumulative PercentComplete for unitscoded, formallyinspected, andtested
Tracking ofPercent CompleteActuals to Planned
Monthly Engineering ModelDevelopmentthroughUnit Test
S/W problemreports time toclose
Software Problem Reportsidentified and tracked afterformal baselining of software
Software ProblemReporting andCorrective ActionSystem
Reports closedwithin 7 Days, 14Days, 21 Days, and30 Days. ActionPlan for thoseexceeding 30 days
Timely Closure ofall identifiedSoftware ProblemReports
Monthly Formal Baseline ofFlight CodeuntilDelivery

g
Metric Definition Source of Data ComputationApproach
Desired Outcome Frequency ofReporting
Period ofMeasurement
S/W quality Software Quality Metrics asidentified by SEI CapabilityMaturity Model (CMM) Level 3
Engineering Modeland Flight Code
Per Reporting Period Tracking ofSoftware Qualityper identifiedSoftware Metrics
Monthly Life Cycle ofSoftwareDevelopment
Tec
hn
ical
Per
form
ance
Major programevents next30/60/90 days
Report type (complexity) andnumber of events over period.
Schedule Calculatepercentage of effortused to prepare forevent as comparedto hardwarepreparation.
Use information toidentify staffing,schedule, and costrisks.
Monthly As of end ofpreceding monthand cumulative
CDRL rejections Report of number of rejectionsand type of reasons forrejection.
MIMS will trackCDRL rejectionsand type based onCustomer feedback.
Compute percentageof each type ofrejection (editorial,format, engineeringcontent, etc)
Correct approachto CDRL sign offand submission,and to planstaffing/schedule.
Monthly As of end ofpreceding monthand cumulative
H/W problemreports open/closed
Report number of problemissues associated with thebuild of hardware and software
ConfigurationStatus AccountingSystem (CSAS)
Identify problemreports pendingdisposition (open)and resolved(closed)
Ensure timelyresolution ofproblem issues
Monthly As of end ofpreceding monthand cumulative
H/W defects Report the number of defects,type of defects, anddisposition for eachsubassembly.
ConfigurationStatus AccountingSystem (CSAS)
Track the defect rateand type ofdisposition.
Identify problemareas in fabricationand design.Identify schedule,cost andperformance risk.
Monthly As of end ofpreceding monthand cumulative
Co
nfi
gu
rati
on
Man
agem
ent
Request forDeviation/Waivers(RDW)
Report number of Deviationsand waivers generated andthose accepted.
ConfigurationStatus AccountingSystem (CSAS)
Track open/closed,corrective action,and status
Determine causesassociated with thegeneration ofRDWs.
Monthly As of end ofpreceding monthand cumulative
EngineeringChange Proposals(ECPs)
Report number ECPsgenerated and disposition
ConfigurationStatus AccountingSystem (CSAS)
Track ECP statusand disposition
Determine trendsin generatingECPs
Monthly As of end ofpreceding monthand cumulative
Documentation –Drawings/Documents/Software
Report status of engineeringdata in review, released, andchanged
ConfigurationStatus AccountingSystem (CSAS)
Track status of alldocumentationissued
Ensuredocumentationprogresses withschedule
Monthly As of end ofpreceding monthand cumulative
Logistics MilestonePlan
Planned vs. actual foracquisition activities. Criticalparts tracking – actual deliveryvs need date
DELTEK / Bill ofMaterial
Analyze collectedand tracked data
Ordering anddeliveries aredriven by and meetintegratedschedule
Monthly As of end ofpreceding monthand cumulative
Su
rvei
llan
ceP
lan
Subcontractors Track surveys, inspections,audits, deliveries,assessments, andconcerns/issues/problems
FDC Contracting Analyze collectedand tracked data
Insuresubcontractorsmeet programresponsibilities
Monthly As of end reportingperiod
Failure ReviewBoard (FRB)Anomalies
Track FRB actions bycomponent/subsystem. Trackopen/closed and time to closereports
Quality Assurance Computeopen/closure ratesand average time toclosure
Provide analyzedfailure data andprocessimprovement toreduce failure rates
Monthly As of end ofpreceding monthand cumulative

g
Metric Definition Source of Data ComputationApproach
Desired Outcome Frequency ofReporting
Period ofMeasurement
Test Anomalies Track test process times,generation of reports andcorrective actions
EngineeringTest/QualityAssurance
Collect and analyzequantity, times,cause and correctiveactions of anomalies
Provide testanomaly data toimprove designand processes
Monthly As of end ofpreceding monthand cumulative
Audit Results Track audit findings. Developtrends relating to open/closeditems, time to closure. Trackcorrective actions.
Program Manager Track data anddevelop analysisreport
Time closure andaffective correctiveactions
Monthly As of end reportingperiod
Facilities and TestEquipment
Report status of facilities, testequipment, tools, and supportequipment.
Functional andprogrammanagement
Track data anddevelop analysisreport
Prevent delaysrelated to facilitiesand equipment
Monthly As of end reportingperiod
6.1.2 Technical Performance Metrics
MRDOC Engineering Management will assess requirement volatility, design stability, and plan verses actualoutcome metrics to insure the project is on schedule and to plan resources. Requirements volatility will beassessed by tracking change orders that affect requirements. Engineering management and ConfigurationManagement Team will evaluate change orders to determine the change rate, schedule impact, and cost of changerequirements affecting the project. Design stability will be assessed by measuring the number and type of changesmade to baseline drawings. Subsystem managers will evaluate the effectiveness of the revision process and assessthe rate of drawing change. Plan verses actual outcome will be assessed by tracking specifications released andtests completed. The Software Team will provide the lines of code released and accepted. Engineering metrics willbe reported monthly and at Life-Cycle reviews.
6.1.3 Configuration Management Metrics
Configuration Management (CM) establishes and defines the responsibilities and processes for controlling projectrequirements and interfaces. Using functional (established at the Preliminary Design Review), allocated(established prior to the Critical Design Review), and production (established prior to integration and test) baselinesCM tracks changes to drawings, specifications, technical documentation, and software. Specific CM metricsreported monthly to MRDOC executive and functional managers include: hardware problem reports open/close;hardware defects reported/resolved; Requests for Deviation/Waivers (RDWs) open/closed; Engineering ChangeProposals (ECPs) pending/approved; and documentation status.
6.2 Cost and Progress Tracking, Controlling, and Reporting
The MRDOC Team will monitor and control performance by using a uniform performance measurement processfor all CPPs. This includes:
• Timely and regular status collection cycles• Scheduled and ad hoc management reviews• Integrated earned value performance measurement• Proactive what-if modeling.
Once baselined, the CPP is the basis for measuring cost, schedule, and technical performance. All Work PackageManagers will update the status of schedule performance every two weeks. This includes identifying actual starts,actual finishes, and percent complete for each ongoing activity. Schedule performance will be summarized and

g
performance will be measured against the baseline. Work Package Managers will also be provided information onactual versus planned labor hours every two weeks from MIMS. Labor hour tracking is the fundamental tool usedto control cost. Gantt charts, developed and produced by CAT II, will depict schedule performance and be used asa management tool in weekly DO Project Manager’s meetings along with the labor hour reports. Riskidentification is an ongoing process and the responsibility of each member of the FDC Team. DO ProjectManagers will review, assess, and prioritize risks weekly. Risks that merit further analyses will be assigned to aProgram Planning and Control Facilitator to develop appropriate risk mitigation strategies. Costs will be collectedand summarized monthly. This tracking process fully captures FDC labor, subcontractor labor, ODCs and materialand integrates schedule performance.
Each Work Package Manager will use the integrated cost, schedule, and technical performance earned value reportsand analyses to redirect resources, staff, and expertise to optimize performance. Each manager will have a ProgramPlanning and Control Facilitator to assist in performing cost and scheduling what-if modeling, which ensures thatperformance against CPP baselines remains realistic and achievable. The approach is to manage performancetoward a specific goal, measure progress against the baseline, and adjust performance to ensure success.
6.3 Problem Solving and Resolution
Problem identification and analysis are performed at the project level and at the level of the work packages, tasks,or subtasks as required. When problems that affect performance are identified following a 2-week labor cycle or amonthly integrated cost and schedule reporting cycle, a Variance Analysis Report is automatically generated ande-mailed to the appropriate Work Package Lead. The Work Package Lead has one week to:
• Identify the root cause of the variance• Assess the impact of the problem on the task• Create a detailed corrective action plan.
The Program Planning and Control Facilitator will assist each Work Package Lead in preparing responses, asneeded. The facilitator will also make projections of the impact of task variances on other tasks and the project as awhole. These corrective action plans will be updated as appropriate and tracked through closure. The WorkPackage Lead’s assessments and facilitator’s impact projections will be forwarded, via MIMS, to the appropriateProject Manager, Director, Program Manager, and Deputy Program Manager and will form the basis of theirweekly technical reviews.
7.0 Risk Management
MRDOC risk management involves two fundamental processes. The first process is embedded in early projectplanning efforts. The second process provides early identification of problems throughout the life of each DO.Product assurance plays a vital role in identifying those risks not immediately identified at project initiation.Resolution of an emergent problem could be as simple as allocation of management reserve or as complex as amajor replanning. Some typical emergent risks are estimating errors, changing requirements, dynamic schedules,and technical complexity. These potential risks are addressed during the preparation of the Contractor Project Plans(CPPs) and mitigated by implementing the MRDOC risk management methodology. Figure 10 describes the riskmanagement process.

g
Figure 10 MRDOC Risk Management
• Quantify• Qualify• Prioritize• Assess impact
Analysis
• Avoidance• Mitigation• Acceptance• Transfer
Management
PlanningPlanning
• Earned value reporting andanalysis
• Project meetings• Strategies implemented• Watchlists
Monitoring
• Product assurance• Delphi method (brainstorming)• Historical data• Interview of key personnel• Checklists
Identification
7.1 Early Project Planning Risk Managment
Planning. Risk planning begins with the development of technical and cost proposals.
Identification. During preparation of the CPPs, risk areas are identified using senior management reviews, “what-if” exercises, product assurance, project documentation, and subject matter experts. From this information, a list ofprobable risk events is developed.
Analysis. Next the risks are quantified and qualified as much as possible. Each risk is evaluated for probability ofoccurrence and potential impact in terms of cost, schedule, and technical performance. Where quantification is notpossible, a rough magnitude is assigned to assist prioritizing risk events. Also considered are GRC and NASApriorities. Occurrence and consequence are each assigned a rating of low, moderate, or high.

g
Management. Three basic risk response strategies are employed in the management of identified MRDOC risks:avoidance, mitigation, or acceptance. Generally we will accept the consequences of low-risk events, eliminate therisk inducing cause for high-risk events, and reduce moderate risk by minimizing the probability of occurrence,minimizing the magnitude of the impact, or sharing the consequences with another stakeholder. In no case willrisks be transferred to the Government.
Monitoring. As MRDOC is implemented, the MRDOC Team will watch for and respond to emergent risks notidentified in the planning process. Project Managers and Work Package Leads are responsible for implementingcorrective action. Initial contingency planning is focused on those remaining low-risk events that have not beeneliminated, avoided, or mitigated.
7.2 Life-Cycle Risk Management
Risk management is a continuous, closed-loop process. As project tasks and subtasks are completed, lessonslearned are applied to the risk management process to reduce the risk associated with remaining project events. TheMRDOC Team employs a risk management facilitator in Program Planning and Control to make maximum use oflessons learned. The MRDOC Team will manage emergent risk by taking the following actions:
• Identify potential risk events and assess the probability of occurrence and the severity of the consequences• Identity the organization and individual responsible for corrective action• Prepare a corrective action plan and schedule, as necessary• Implement corrective action• Monitor and report the status of corrective action until the risk is mitigated.
7.3 Risk Radar System
The FDC MRDOC Team has chosen the Risk Radar system to identify, prioritize, and communicate project risks.Risk Radar provides standard database functions to add and delete risks, together with specialized functions forprioritizing and retiring project risks. A set of standard short- and long-form reports and viewgraphs can begenerated to share project risk information with all members of the MRDOC team. The number of risks in eachprobability/impact category by time frame can be displayed graphically, allowing the user to visualize risk prioritiesand uncover increasing levels of detail on specific risks.

g
Appendix A
Terms and Definitions
1. Activity is a unit of work with an identifiable start and end point, consumes resources and produces anoutput. It is the lowest level of detail that is tracked within the planning and control system. Activity isinterchangeable with task. It is at the activity or task level that dependencies and durations are used tocalculate plan dates.
2. Activity Network is a logically sequenced or constrained listing of the work planned for the MRDOCProject at the lowest level of detail. The term activity network is interchangeable with System LevelSchedule. The Summary Master Schedule represents a high level roll-up of detail planning.
3. Actual Cost of Work Performed (ACWP) is the cost actually incurred to accomplish the workperformed within a given time period. For all direct labor, material and ODC costs are identified in theDeltek financial accounting system and downloaded directly into the CAT II MIMS.
4. Analex is Analex Corporation.
5. Apportioned Effort means an effort that by itself is not readily divisible into short-span work packagesbut which is related in direct proportion to the measured effort.
6. Budget at Completion (BAC) represents the total budgeted resources associated with a given scope ofwork. The BAC is equal to the sum of the time-phased budgets (BCWS) for all work packages andplanning packages along with management reserve for that given scope of work. The terms TotalAllocated Budget (TAB) and Budget At Completion are interchangeable.
7. Budgeted Cost of Work Performed (BCWP) is the sum of the budgets for all completed work packagesand completed portions of open work packages, plus the applicable portion of the budgets for level ofeffort and apportioned effort. It is the budgeted value of the work completed for a given period of time.Also known as Earned Value (EV). BCWP is computed at the work package level and rolled up to theproject level.
8. Budgeted Cost of Work Scheduled (BCWS) is the sum of the budgets for all work packages, planningpackages, etc., scheduled to be accomplished (including in-process work packages), plus the amount oflevel of effort and apportioned effort to be accomplished within a given time period. The sum of theBCWS for a task is the BAC for the task. BCWS is the time phased baseline plan for performancemeasurement. Also known as Planned Value (PV). BCWS is computed at the work package level androlled up to the project level.
9. Capability Maturity Model (CMM) is a model for judging the maturity of the software processes of anorganization and for identifying the key practices that are required to increase the maturity of theseprocesses.
10. CAT II means Control and Analysis Tool. It is a software package used to produce some of theindividual reports that comprise the monthly Performance Measurement Report.
11. Commercial Off The Shelf (COTS) is material that is readily available to purchase through normalbusiness avenues. It is not material that is custom built.
12. Constraint or dependency is the relationship one task has on another. It is by identifying dependenciesbetween tasks, that Critical Path Method analysis is conducted to determine the status of the MRDOCplans.
13. Contract Data Requirement List (CDRL) is a compilation of all data requirements that FDC isobligated to submit to NASA.
14. Contract Work Breakdown Structure is the WBS for the entire contract. There is a WBS for eachDelivery Order.
15. Contractor Project Plan (CPP) is complete definition of the work to be performed by the contractorwith schedules, deliverables, documents, plans, costs, etc.

g
16. Cost Account is the level of the Work Breakdown Structure (WBS) at which exists organizationalresponsibility for individual WBS elements. It is the point where the Contract Statement of Work,Schedule and Budget are integrated. Comparison of BCWP with BCWS and with ACWP is made atthe cost account level. Cost Accounts consist of an aggregation of work packages and planningpackages which is the responsibility of a single organization. Managerial authority and responsibilityfor corrective action exists at this point making the Cost Account a key management control point.
17. Cost Performance Index (CPI) is = BCWP/ACWP: The CPI is also known as the Performance Factor.This represents actual cost efficiency. Greater than 1 is favorable while less than 1 indicates costoverruns.
18. Cost Variance (CV) is the difference between the BCWP and ACWP. This is calculated both monthlyand cumulatively per the following formula, Cost Variance (CV) = BCWP - ACWP. A positivevariance is favorable and indicates cost underruns whereas a negative cost variance indicates costoverruns. Cost Variance can also be expressed in a percentage per the following formula, CostVariance (CV) % = (BCWP - ACWP) / BCWP) x 100%
19. Critical Path Method (CPM) is a method for identification and assessment of schedule priorities andimpacts. It identifies the contiguous path that has no float or allowance for delay in completion of anactivity. A delay of any activity on the critical path is an indication that the completion of the projectwill be delayed.
20. Deltek is the FDC financial accounting package where all charges are initially collected and reconciledprior to transfer to the CAT II MIMS system.
21. DID is Data Item Deliverable, an item on the Contract Data Requirements List. It describes in detailthe content and format of the deliverable.
22. Direct charge is any labor or material that is charged directly and entirely to a work package leveleffort. Typically engineering and technical personnel are direct charges.
23. Earned Value Management (EVM) is a methodology by which an integrated system uses earned valueto measure progress objectively.
24. Earned value see Budgeted Cost of Work Performed.
25. Estimate at Completion (EAC) represents the forecasted total cost at completion for a given task. TheEAC equals the actual costs incurred to date (ACWP) plus the estimated required resources to complete(ETC) the remaining work scope. The terms Estimate at Completion (EAC) and Latest RevisedEstimate (LRE) are used interchangeably. EAC is computed at the work package level and rolled up tothe project level.
26. Estimate to Complete (ETC) is The ETC represents the estimated resource requirements to complete agiven task. Cost Account Managers based on performance to date, knowledgeable projections of futureperformance, and the forecasted economic environment prepare ETCs. ETC is computed at the workpackage level and rolled up to the project level.
27. FDC is Federal Data Corporation.
28. GRC is the NASA Glenn Research Center in Cleveland, OH.
29. GSFC is the NASA Goddard Space Flight Center in Greenbelt, MD.
30. HEI is Hernandez Engineering, Inc.
31. Independent Estimate at Completion (IEAC) represents a mathematical calculation of the estimate atcompletion based on the existing cost efficiency continuing through to completion of the task. It isused independently to validate existing management projections. IEAC = BAC/CPI
g
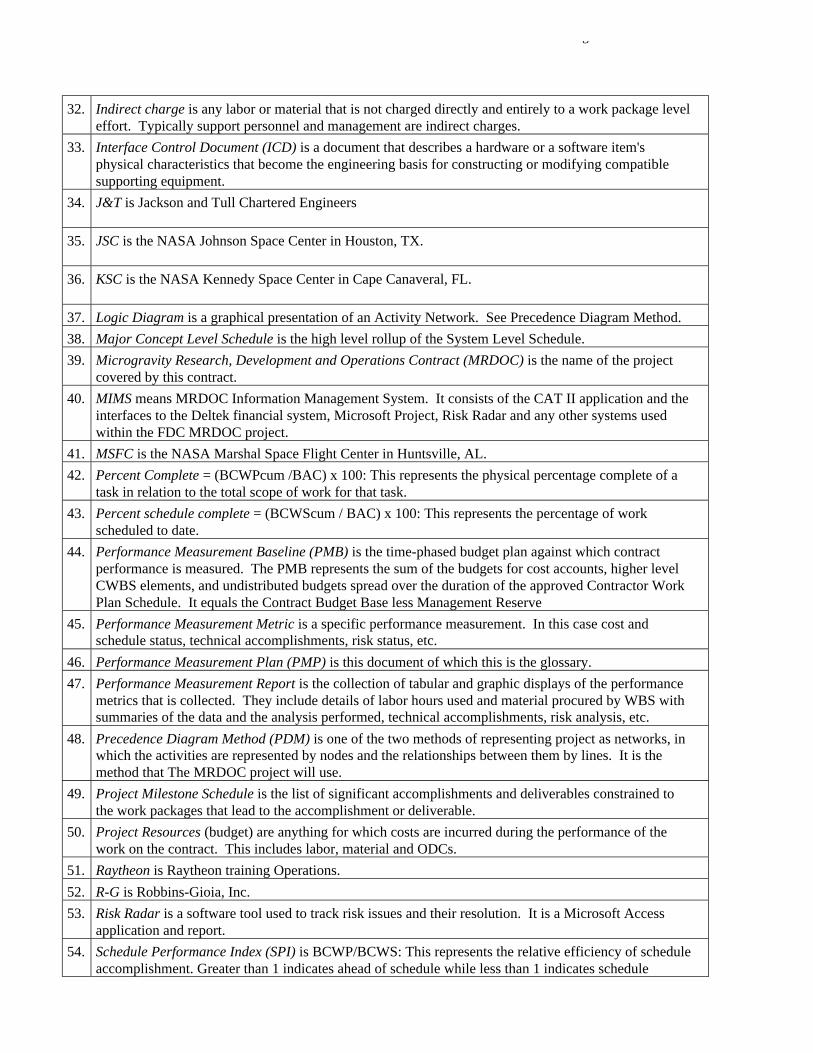
32. Indirect charge is any labor or material that is not charged directly and entirely to a work package leveleffort. Typically support personnel and management are indirect charges.
33. Interface Control Document (ICD) is a document that describes a hardware or a software item'sphysical characteristics that become the engineering basis for constructing or modifying compatiblesupporting equipment.
34. J&T is Jackson and Tull Chartered Engineers
35. JSC is the NASA Johnson Space Center in Houston, TX.
36. KSC is the NASA Kennedy Space Center in Cape Canaveral, FL.
37. Logic Diagram is a graphical presentation of an Activity Network. See Precedence Diagram Method.
38. Major Concept Level Schedule is the high level rollup of the System Level Schedule.
39. Microgravity Research, Development and Operations Contract (MRDOC) is the name of the projectcovered by this contract.
40. MIMS means MRDOC Information Management System. It consists of the CAT II application and theinterfaces to the Deltek financial system, Microsoft Project, Risk Radar and any other systems usedwithin the FDC MRDOC project.
41. MSFC is the NASA Marshal Space Flight Center in Huntsville, AL.
42. Percent Complete = (BCWPcum /BAC) x 100: This represents the physical percentage complete of atask in relation to the total scope of work for that task.
43. Percent schedule complete = (BCWScum / BAC) x 100: This represents the percentage of workscheduled to date.
44. Performance Measurement Baseline (PMB) is the time-phased budget plan against which contractperformance is measured. The PMB represents the sum of the budgets for cost accounts, higher levelCWBS elements, and undistributed budgets spread over the duration of the approved Contractor WorkPlan Schedule. It equals the Contract Budget Base less Management Reserve
45. Performance Measurement Metric is a specific performance measurement. In this case cost andschedule status, technical accomplishments, risk status, etc.
46. Performance Measurement Plan (PMP) is this document of which this is the glossary.
47. Performance Measurement Report is the collection of tabular and graphic displays of the performancemetrics that is collected. They include details of labor hours used and material procured by WBS withsummaries of the data and the analysis performed, technical accomplishments, risk analysis, etc.
48. Precedence Diagram Method (PDM) is one of the two methods of representing project as networks, inwhich the activities are represented by nodes and the relationships between them by lines. It is themethod that The MRDOC project will use.
49. Project Milestone Schedule is the list of significant accomplishments and deliverables constrained tothe work packages that lead to the accomplishment or deliverable.
50. Project Resources (budget) are anything for which costs are incurred during the performance of thework on the contract. This includes labor, material and ODCs.
51. Raytheon is Raytheon training Operations.
52. R-G is Robbins-Gioia, Inc.
53. Risk Radar is a software tool used to track risk issues and their resolution. It is a Microsoft Accessapplication and report.
54. Schedule Performance Index (SPI) is BCWP/BCWS: This represents the relative efficiency of scheduleaccomplishment. Greater than 1 indicates ahead of schedule while less than 1 indicates schedule

g
slippage
55. Schedule Variance (SV) is the difference between BCWP and BCWS. This is calculated both monthlyand cumulatively per the following formula, Schedule Variance (SV) = BCWP - BCWS.
A positive schedule variance indicates an ahead of schedule position, whereas a negative schedulevariance indicates schedule slippage. Schedule Variance can also be expressed in a percentage per thefollowing formula, Schedule Variance (SV)% = (BCWP - BCWS) / BCWS) x 100
56. System Level Schedule is the lowest level of planning for work packages. See Activity Network.
57. To Complete Performance Index (TCPI = (BAC - BCWP) / (EAC - ACWP): Also known as theverification index. This is a ratio of work remaining against resources remaining to complete the work.This represents the cost efficiency that must be achieved to complete the budgeted scope within thecurrent cost projection (EAC).
58. Variance Analysis Report is a narrative report that is required when a WBS element has a cost orschedule variance of more than 5% of the planned value. This includes cost underrun and ahead ofschedule as well as cost overrun and behind schedule.
59. Variance at Completion (VAC) represents the forecasted cost underrun or overrun at completion for agiven task. The VAC is equal to the Budget at Completion (BAC) minus the Estimate at Completion(EAC), or BAC-EAC = VAC. A positive VAC is favorable and indicates the effort will be completedat lower total cost (ACWP) than budgeted (BAC). Conversely a negative VAC is unfavorable andindicates actual costs to complete the effort will exceed the budget.
60. What-if modeling is a technique whereby managers are able to take a copy of a baselined schedule andchange resources and durations to see what impact these changes will have on the cost and schedule. Itis used to assist in determining what is necessary to mitigate a cost or schedule problem.
61. Work Breakdown Structure (WBS) is a product-oriented family tree of hardware, software, services andother work tasks which organizes, displays and defines the product to be developed and/or producedand relates the elements of the work to be accomplished to each other and the end product(s).
62. Work Package is the subdivision of a Cost Account and constitutes the basic building blocks forauthorizing, measuring and controlling contract performance. A work package represents a detailedtask and describes the work to be accomplished by a specific organization. In most cases, WorkPackages are the levels of the WBS where BCWS, BCWP, ACWP, EAC and BAC are first comparedand variances are generated.


