84
1

1

2
This work was prepared as an account of work sponsored by an agency of the United States Government with the assistance of BW Research Partnership and is based on primary data collected on behalf of the United States
Department of Energy (OMB Control No. 1910-5179) and secondary data from the United States Department of
Labor’s Quarterly Census of Employment and Wages for Q1 of 2016. Neither the United States Government nor any
agency thereof, nor any of their employees, nor any of their contractors, subcontractors or their employees makes
any warranty, express or implied, or assumes any legal liability or responsibility for the accuracy, completeness or
any third party’s use or the results of such use of any information, apparatus, product, or process disclosed, or represents that its use would not infringe privately owned
rights. Reference therein to any specific commercial product, process, or service by trade name, trademark,
manufacturer, or otherwise does not necessarily constitute or imply an endorsement on the part of the United States Government, the U.S. Department of Energy or any other
referenced Federal agency.
For inquiries regarding this report, please contact:

3
Table of Contents
Table of Contents ......................................................................................................................................... 3
Table of Figures ............................................................................................................................................ 5
Preface .......................................................................................................................................................... 7
Findings ..................................................................................................................................................... 8
Methodology ........................................................................................................................................... 10
Energy-Related Employment Within Existing Industries, by NAICS Codes ............................................. 15
Introduction ............................................................................................................................................ 20
Summary ................................................................................................................................................. 21
Electric Power Generation and Fuels Employment by Industry ........................................................... 24
Agriculture and Forestry .................................................................................................................... 24
Mining, Extraction, and Utility Generation ....................................................................................... 25
Construction ....................................................................................................................................... 26
Manufacturing .................................................................................................................................... 26
Wholesale Trade ................................................................................................................................. 27
Professional and Business Services ................................................................................................... 27
Electric Power Generation and Fuels Employment by Technology ...................................................... 28
Electric Power Generation ................................................................................................................. 28
Fuels .................................................................................................................................................... 30
Generation and Fuels – Workforce Characteristics ............................................................................... 31
Solar Electric Generation.................................................................................................................... 37
Wind Electric Generation ................................................................................................................... 39
Coal Electric Generation and Fuels .................................................................................................... 40
Oil Electric Generation and Petroleum Fuels .................................................................................... 41
Natural Gas Electric Generation and Fuels ........................................................................................ 42
Combined Heat and Power Electric Generation................................................................................ 43
Hydroelectric Generation ................................................................................................................... 44
Nuclear Electric Generation and Fuels............................................................................................... 45
Bioenergy/Biomass Electric Generation and Biofuels ...................................................................... 46
Corn Ethanol Fuels .............................................................................................................................. 47
Other Ethanol and Non-Woody Biomass Fuels, including Biodiesel ................................................ 47
Woody Biomass Fuel for Energy and Cellulosic Biofuels .................................................................. 47
4
Other Biofuels ..................................................................................................................................... 48
Introduction ............................................................................................................................................ 49
Summary ................................................................................................................................................. 49
Transmission, Distribution, and Storage Employment by Industry ...................................................... 50
Utilities ................................................................................................................................................ 51
Construction ....................................................................................................................................... 51
Manufacturing .................................................................................................................................... 52
Wholesale Trade ................................................................................................................................. 53
Professional and Business Services ................................................................................................... 54
Transmission, Distribution, and Storage Employment by Sub-technology .......................................... 55
Transmission, Distribution, and Storage – Workforce Characteristics ................................................. 56
Introduction ............................................................................................................................................ 60
Summary ................................................................................................................................................. 61
Energy Efficiency Employment by Industry ........................................................................................... 63
Construction ....................................................................................................................................... 63
Manufacturing .................................................................................................................................... 63
Wholesale Trade ................................................................................................................................. 64
Professional and Business Services ................................................................................................... 64
Energy Efficiency Employment by Technology ...................................................................................... 65
Energy Efficiency – Workforce Characteristics ...................................................................................... 67
Introduction ............................................................................................................................................ 70
Summary ................................................................................................................................................. 71
Alternative Fuel Vehicles ....................................................................................................................... 73
Manufacturing ........................................................................................................................................ 75
Motor Vehicle Parts and Fuel Economy ................................................................................................ 75
Motor Vehicles – Workforce Characteristics ......................................................................................... 77
Conclusions ................................................................................................................................................. 80
Appendix A: Survey and Analysis Methods ............................................................................................... 81
Appendix B: Primary Energy Consumption by Source and Sector, 2014 (Quadrillion Btu) ..................... 83
Appendix C: ENERGY STAR® Unit Shipment and Market Penetration Report Calendar Year 2015 Summary ..................................................................................................................................................... 84

5
Table of Figures
Figure 1. Change in Net Generation by Energy Source (Thousand MWh), 2006 – Sept 2016 YTD ............ 22 Figure 2. Generation Employment by Industry, Q1 2016 ........................................................................... 23 Figure 3: Expected Employment Growth by Industry (Q4 2016 – Q4 2017) .............................................. 23 Figure 4. Fuels Employment by Industry, Q1 2016 ..................................................................................... 24 Figure 5: Expected Employment Growth by Industry (Q4 2016 – Q4 2017) .............................................. 24 Figure 6. Mining and Extraction Employment, Q1 2016 ............................................................................. 25 Figure 7. Utilities Employment, Q1 2016 .................................................................................................... 26 Figure 8. Construction Employment, Q1 2016 ............................................................................................ 26 Figure 9. Manufacturing Employment, Q1 2016 ........................................................................................ 27 Figure 10. Wholesale Trade, Distribution, and Transport Employment, Q1 2016 ..................................... 27 Figure 11. Professional and Business Services Employment, Q1 2016 ........................................................ 28 Figure 12. Electric Power Generation Employment by Technology, Q2 2015 - Q1 2016 ........................... 30 Figure 13. Fuels Employment by Technology, Q1 2016 .............................................................................. 31 Figure 14: Occupational Distribution - Electric Power Generation, Q4 2016 ............................................. 33 Figure 15: Occupational Distribution - Fuels, Q4 2016 ............................................................................... 33 Figure 16. Hiring Difficulty by Industry – Electric Power Generation, Q4 2016 .......................................... 34 Figure 17. Hiring Difficulty by Industry – Fuels, Q4 2016 ............................................................................ 34 Figure 18: Solar Employment Growth by Industry, 2010-2016 .................................................................. 37 Figure 19. Transmission, Distribution, and Storage Employment by Industry Sectors, Q2 2015 - Q1 2016 .................................................................................................................................................................... 50 Figure 20. Utilities Employment, Q1 2016 .................................................................................................. 51 Figure 21. Construction Employment, Q1 2016 .......................................................................................... 52 Figure 22. Manufacturing Employment, Q1 2016 ...................................................................................... 53 Figure 23. Wholesale Trade, Q1 2016 ......................................................................................................... 53 Figure 24. Retail Trade Employment, Q1 2016 ........................................................................................... 54 Figure 25. Professional and Business Services Employment, Q1 2016 ....................................................... 54 Figure 26. Employment by Transmission, Distribution, and Storage Sub-Technologies (Q1 2016) ........... 55 Figure 27. Transmission, Distribution, and Storage Sub-Technologies, Q2 2015 - Q1 2016 ...................... 56 Figure 28: Expected Employment Growth by Industry (Q4 2016 – Q4 2017) ............................................ 56 Figure 29: Occupational Distribution – Transmission, Distribution, and Transport, Q4 2016 .................... 57 Figure 30. Hiring Difficulty by Industry - Transmission, Distribution, and Transport, Q4 2016 .................. 58 Figure 31: Expected Employment Growth by Industry (Q4 2016 – Q4 2017) ............................................ 61 Figure 32. Energy Efficiency Employment by Industry Sectors, Q1 2016 ................................................... 62 Figure 33. Construction Employment, Q1 2016 .......................................................................................... 63 Figure 34. Manufacturing Employment (Q2 2015) ..................................................................................... 64 Figure 35. Wholesale Trade Employment (Q2 2015) .................................................................................. 64 Figure 36. Professional and Business Services Employment (Q2 2015) ..................................................... 65 Figure 37. Energy Efficiency Employment by Sub Technologies (Q2 2015 – Q1 2016) .............................. 66 Figure 38: Occupational Distribution – Energy Efficiency, Q4 2016 ........................................................... 68 Figure 39. Hiring Difficulty by Industry (Q4 2016) ...................................................................................... 68 Figure 40. Motor Vehicle Employment by Industry Sectors, Q2 2015 – Q1 2016 ...................................... 71 Figure 41: Expected Employment Growth by Industry (Q4 2016 – Q4 2017) ............................................ 72 Figure 42: Motor Vehicles and Component Parts Employment by Sub-technology (Q1 2016) ................. 74

6
Figure 43: Parts Offered by Type of Fuel Used, Component Parts ............................................................. 74 Figure 44: Motor Vehicles and Component Parts Manufacturing Employment by Sub-technology (Q1 2016) ........................................................................................................................................................... 75 Figure 45: Fuel Economy Employment in Component Parts (Q1 2016) ..................................................... 76 Figure 46: Revenue Attributable to Products that Increase Fuel Economy................................................ 76 Figure 47: Revenue Attributable to Products that Increase Fuel Economy by Primary Vehicle Type ........ 77 Figure 48: Occupational Distribution – Motor Vehicles and Component Parts, Q4 2016 .......................... 78 Figure 49: Hiring Difficulty by Industry – Motor Vehicles and Component Parts, Q4 2016 ....................... 78

7
Preface Among the recommendations in the U.S. Department of Energy’s (DOE) 2015 Quadrennial Energy Review (QER) was Recommendation 8.6 entitled, Reform Existing Energy Jobs Data Collection Systems. Specifically, Recommendation 8.6 reads:
DOE should establish an interagency working group—including the Departments of Labor and Commerce—to reform existing data collection systems and provide consistent and complete definitions and quantification of energy jobs across all sectors of the economy.
DOE had identified four major gaps in existing energy employment data. These included: 1) business activities essential to the operation of traditional energy companies classified by the North American Industry Classification System (NAICS) within the business activities of other sectors, 2) jobs associated with the production of renewable energy such as wind, solar, geothermal, etc., 3) jobs associated with energy efficiency, and 4) jobs associated with energy efficiency in manufacturing processes. Today, DOE is releasing the second annual United States Energy and Employment Report (USEER) as an ongoing step toward providing a more complete definition and quantification of energy employment across the economy. The 2017 USEER presents direct employment data for the first three of the gaps identified; the fourth will be addressed in a separate report on U.S. energy and manufacturing employment. Additional work between DOE and other federal agencies will continue to refine the necessary data collection methodologies. Finally, the survey supporting the 2017 USEER also includes state-level energy and employment data. Each state is provided with a short energy and employment profile, giving a high-level snapshot of the traditional energy sector, energy efficiency, and the motor vehicle industry. For more details about the data and its accessibility, please contact David Keyser through the DOE Office of Energy Policy and Systems Analysis. We want to thank our colleagues at the Bureau of Labor Statistics for their review of the survey methodology that underlies the USEER as well as our colleagues throughout the DOE.
8
Findings The 2017 U.S. Energy and Employment Report (USEER) finds that the Traditional Energy and Energy Efficiency sectors today employ approximately 6.4 million Americans. These sectors increased in 2016 by just under 5 percent, adding over 300,000 net new jobs, roughly 14% of all those created in the country. The 2017 USEER analyzes four sectors of the U.S. economy. The first two of those sectors make up the Traditional Energy sector:
• Electric Power Generation and Fuels • Transmission, Distribution and Storage • Energy Efficiency • Motor Vehicles
Electric Power Generation and Fuels technologies directly employ more than 1.9 million workers. In 2016, 55 percent, or 1.1 million, of these employees worked in traditional coal, oil, and gas, while almost 800,000 workers were employed in low carbon emission generation technologies, including renewables, nuclear, and advanced/low emission natural gas. Just under 374,000 individuals work, in whole or in part, for solar firms, with more than 260,000 of those employees spending the majority of their time on solar. There are an additional 102,000 workers employed at wind firms across the nation. The solar workforce increased by 25% in 2016, while wind employment increased by 32%. The 2017 USEER also identifies about 2.3 million jobs in Transmission, Distribution, and Storage, with approximately 982,000 working in retail trade (gasoline stations and fuel dealers) and another 830,000 working across utilities and construction. Exclusive of the retail trade sector, Transmission, Wholesale Trade, Distribution and Storage firms —our country’s energy infrastructure—added over 65,000 jobs primarily by utility and construction companies, as they invested in hardening the nation’s energy infrastructure and building new transmission and distribution lines. Overall, 31.5 percent of respondent employers working in this sector reported that a majority of their revenues come from grid modernization or other utility-funded modernization projects. The 2017 USEER also shows that 2.2 million Americans are employed, in whole or in part, in the design, installation, and manufacture of Energy Efficiency products and services, adding

9
133,000 jobs in 2016. (Energy Efficiency employment is defined as the production or installation of energy efficiency products certified by the Environmental Protection Agency’s ENERGY STAR® program or installed pursuant to the ENERGY STAR® program guidelines or supporting services thereof). Almost 1.4 million Energy Efficiency jobs are in the construction industry. In addition, construction firms involved in the Energy Efficiency sector have experienced an increase in the percentage of their workers who spend at least 50% of their time on Energy Efficiency-related work, rising from 64.8 percent in 2015 to 74.0 percent in 2016. Finally, an improved USEER survey methodology identified almost 290,000 manufacturing jobs, producing Energy Star® certified products and energy efficient building materials in the United States. The Motor Vehicles and Component Parts industry employs just over 2.4 million workers, exclusive of auto dealerships. Currently, more than 259,000 employees work with alternative fuels vehicles, including natural gas, hybrids, plug-in hybrids, all electric, and fuel cell/hydrogen vehicles, an increase of 69,000 jobs in 2016. Hybrids, plug-in hybrids, and all electric vehicles make up over 76 percent of this number, supporting 198,000 employees. Over 489,000 employees of Motor Vehicles Parts companies are now contributing to more fuel efficient vehicles. One-sixth (17%) of all firms involved in Motor Vehicle component parts derive all of their revenue from products that increase fuel economy for Motor Vehicles. At least 710,000 jobs in the Motor Vehicle sector are focused on increasing fuel economy or transitioning to alternative fuels.1 Overall, firms covered by the survey anticipate roughly five percent employment growth for 2017. Energy Efficiency employers project the highest growth rate over the next 12 months (nine percent), followed by Electric Power Generation (seven percent); Transmission, Distribution, and Storage (six percent), and Motor Vehicles (just over three percent, although manufacturing will remain flat). The Fuels sector reported an expected decline of about three percent over the next 12 months. These energy-related sectors are relatively less diverse compared to the overall national workforce. Women are a smaller portion of the workforce in these sectors, ranging from 22 to 34 percent, compared to the overall economy, where women make up 47 percent of the workforce. The percentage of ethnic and racial minorities is slightly lower than the national average for Hispanic or Latino workers (14 percent versus 16 percent) and Black or African American workers (eight percent versus 12 percent). Veterans, however, comprise about one in ten workers, higher than the national average of seven percent. About 22 percent of the workforce is 55 years of age or older; this proportion is significantly higher in Fuels and Motor Vehicles, but lower in Generation; Transmission, Distribution, and Storage; and Energy Efficiency. Almost three-quarters of employers across these sectors (73 percent) reported difficulty hiring qualified workers over the last 12 months; 26 percent noted it was very difficult.
1 This number assumes that the percentage of employment working on component parts to improve fuel economy is the same for gasoline/diesel and alternative fuel vehicles.
10
Methodology The U.S. Department of Energy’s (DOE) U.S. Energy and Employment Report (USEER) provides a quantitative lens with which to evaluate the employment impact of new energy technologies, shifting fuels deployment, and evolving transmission and distribution systems. It also presents a unique snapshot of energy efficiency employment in key sectors of the economy, including construction and manufacturing. Finally, the report illustrates how fuel efficiency as well as new technologies and materials affect employment in the motor vehicle industry. The USEER examines four sectors of the economy – “Electric Power Generation and Fuels”, “Transmission, Distribution, and Storage”, “Energy Efficiency”, and “Motor Vehicles”. The first two of these sectors, Electric Power Generation and Fuels and Transmission, Distribution, and Storage make up what are generally considered the “Traditional Energy” sectors. Energy Efficiency cuts across a range of occupations, especially construction and professional services, but includes manufacturing as well. The Motor Vehicles industry is included because its products play a special role in modern society’s use of energy with transportation representing 71 percent of the country’s daily domestic oil consumption and 28 percent of overall energy usage.2 For this reason, a complete report on energy and employment should describe how the motor vehicle industry is changing by vehicle fuel type and efficiency. As noted in the 2016 USEER Preface, we have expanded our survey of the motor vehicles industry to provide a deeper look at its parts’ industry and more fully understand the role of fuel efficiency throughout the supply chain. Current Bureau of Labor Statistics (BLS) Quarterly Census of Employment and Wages (QCEW) labor market data tracks employment across many energy production, transmission, and distribution subsectors. These include utility generation; oil, gas and coal extraction; electrical generation manufacturing; and transmission, for instance. However, the industry classification structure used in data collection assigns a portion of the nation’s energy and energy efficiency work to broad categories of non-energy specific industry classifications, including construction, wholesale trade, and professional services. Within these classifications, certain subsectors contain both energy and non-energy related jobs. Analyzing these industry subsectors is particularly important in understanding employment trends in emerging technologies such as wind, solar, geothermal, biomass, and hydrogen and fuel cells, as well as new energy infrastructure, including storage and smart grid.3 These subsector analyses also provide insight into the distribution of the Energy Efficiency workforce as well as the role of new technologies in a rapidly evolving Motor Vehicle industry.
2 U.S. Energy Information Administration, November 2016 Monthly Energy Review. This figure does not include manufacture, sale, or repair of fuel efficient vehicles (only component parts), a significant exclusion given that a recent study found that 58% of cars manufactured in the U.S. meet current CAFE standards and 52% achieved at least 23 miles per gallon (Consumer Federation of America, Automakers Are on the Road to Meeting Fuel Efficiency Standards) 3 The report does not detail employment related to power generation from hydrogen and fuel cells. Fuel cell manufacturing and employment have experienced a high rate of growth in the production of fuel cells for stationary, combined heat and power, and backup applications. These new areas of employment growth may be addressed in future reports.

11
In order to better enhance QCEW data, BLS conducts two supplemental surveys. The first is the Multiple Worksite Report (MWR), which is collected each quarter to disaggregate the employment and wages of numerous establishments owned by a single employer into their individual worksite locations. This survey allows the employment and wages for each worksite location to be placed in their correct industrial and geographical category, thereby improving the accuracy of QCEW data. Thus, with the MWR, new business births and deaths, and their associated employment are identified each quarter in a timely manner. This rapid identification of births and deaths improves the QCEW. The second survey is the Annual Refiling Survey (ARS), which is conducted each year to update the classification codes (industrial, geographical, and ownership) currently assigned to the establishments on the QCEW which ensures the accuracy of detailed industry and geographic (such as county level) data. In a time of rapid technological change that affects how society produces and uses energy, such an approach is especially helpful in understanding the relationship between energy and employment. The 2017 U.S. Energy and Employment Report (USEER) relies on a supplemental survey to identify energy-related employment within key subsectors of the broader industries as classified by the BLS and assign them into their component energy and energy efficiency sectors. This analysis is not a replacement for existing BLS employment data; instead, it provides an additional lens with which to refine and evaluate the role of Traditional Energy, Energy Efficiency, and Motor Vehicles within the labor market as a whole. In combination, the employment figures reported in the USEER refer only to direct employment and not to indirect employment or induced employment.4 While the methodology is substantially similar to the 2016 USEER, this 2017 report is better aligned with Department of Energy definitions and programs. As a result, not all data points are directly comparable between 2016 and 2017. Such instances are noted and comparable data are provided where available. The USEER provides a unique, but time-sensitive, snapshot of the intersection of our energy and employment systems. Future reports will be adjusted, as necessary, to record this dynamic interaction between technology, energy, and employment within our nation’s economy. 4 A direct job is created by the firm specific to the industry, while indirect jobs support these firms via supply or contracting services. Induced jobs are a result of the economic impact of direct and indirect employees spending their earnings.

12
The U.S. energy system continues to evolve. Technological innovation, expanded production, gains in efficiency, and changing business models have resulted in changes in employment that are more difficult to track over time. The diversity and breadth of energy industries across the United States create significant challenges for economic modeling and traditional labor market data collection.5 While many of its segments, such as utility scale power generation, fossil fuel extraction, electric and gas transmission and distribution, are inarguably part of the energy sector, other activities that include storage technologies and energy efficiency products and services are difficult to define and isolate from other sectors of the economy. Given the complex relationship between energy and the overall economy, the 2017 USEER does not attempt to redefine the term “energy job”. Instead, it investigates, with a special supplemental survey, two traditional energy sectors—Electric Power Generation and Fuels (Generation and Fuels) and Transmission, Distribution, and Storage —followed by individual analyses of employment in two important energy end-use sectors—Energy Efficiency and Motor Vehicles. Employment data collected by the Bureau of Labor Statistics (BLS) provides information on many, but not all, energy-related job categories. Most notably, BLS does not filter by energy technology across business segments. For instance, residential solar installation establishments are typically labeled as electrical contractors (together with all other traditional electrical businesses) without being identified specifically as solar companies. Petroleum-engineering firms are included in engineering services, with civil, mechanical, and other engineers, while electric vehicle prototype manufacturers are combined with gasoline and diesel-fueled vehicle manufacturing. As a result, employment data that differentiates between new technologies and old has been difficult to capture.6 The spread of business activities within each of the four analyzed sectors presents additional taxonomic challenges, as early stage research and development, repair and maintenance, or professional and technical services vary across energy, energy efficiency, and manufacturing. Natural gas business activities, for instance, differ from those of advanced building materials and solar photovoltaics.
5 See generally; Robert Bacon and Masami Kojima, Issues in Estimating the Employment Generated by Energy Sector Activities, The World Bank Sustainable Energy Department, 2011. 6 Id.

13
Historically, supplemental surveys have been conducted by BLS to acquire more complete information on new industries, specific demographic profiles within the workforce, or new labor force trends such as the role of contingent workers. Thus, significant modification to the current BLS structure of industry and occupational classifications is avoided by capturing the required energy employment data using a supplemental survey tool based on existing BLS data and classifications. The 2017 USEER relies on such a comprehensive survey of 30,000 business representatives across the United States, conducted by BW Research Partnership on behalf of the United States Department of Energy. The survey data are used to filter and analyze the concentration, intensity, and distribution of various energy technologies and activities throughout traditional industry sectors, using 2016 Q1 employment data from the Bureau of Labor Statistics (BLS) Quarterly Census of Employment and Wages (QCEW). USEER data also provides an additional layer of information to track sector-specific growth potential, obstacles, and opportunities. The data presented in the USEER are not intended to remove, replace, or replicate existing data from the BLS QCEW but instead reorganize categories and provide insight for policymakers and the public regarding shifts in energy production and consumption across the United States. Within the definitions below, the USEER provides data for direct employment only and does not attempt to estimate indirect employment or induced employment related to the analyzed sectors. Many employment studies such as that included in Chapter 8 of the Quadrennial Energy Review: First Installment (DOE 2015) generate employment estimates that rely on input/output modeling. These studies typically define an activity based on reported expenditures or expenditures and associated levels of employment reported by a defined industry or activity (e.g., U.S. solar PV installation). In this example, solar PV installation firm employment would be the “direct” jobs. Most studies go at least one step further, identifying “indirect” employment, which includes the supply chain or other support services to the industry. In the solar example, these would include U.S. manufacturing jobs related to producing PV equipment used in domestic installations (and their suppliers and vendors) as well as consulting, tax, legal, and other professional services to support domestic PV installation companies. Another typical calculation is “induced” jobs, which includes jobs created or supported by wages paid and other benefits provided by employers of direct and indirect employees. In the USEER, by comparison, the direct job category of interest is defined as the solar industry generally, including utility-scale solar, residential and commercial installations, as well as the manufacturing, professional services, and wholesale trade that make up the sector. However, the indirect jobs that support this industry are not included, such as polysilicon production (the raw material used in solar panels), aluminum production and extrusion activities for frame manufacturing, or other aspects of the solar value stream. Induced jobs—those created throughout the economy as a result of the spending of wages by the employees whose income derives, in whole or part, from this industry—are also not included For this survey, a Qualifying Firm is:
“An organization with employees in the United States that is directly involved with researching, developing, producing, manufacturing, distributing, selling, implementing,

14
installing, or repairing components, goods or services related to Electric Power Generation; Electric Power Transmission, Distribution, and Storage; Energy Efficiency, Including Heating, Cooling and Building Envelope; Fuels, including Extraction, Processing, Production, and Distribution; and Transportation, including Motor Vehicles. This also includes supporting services such as consulting, finance, tax, and legal services related to energy, fuels, energy efficiency, or motor vehicles.”
Qualifying Workers are:
“Employees of a qualifying firm that spend some portion of their time supporting the qualifying energy, energy-efficiency, or motor vehicle portion of the business.”7
This report provides detail into levels of employment activity that include both “a portion of their time” and “a majority of their time” when referencing qualifying employees. This is especially true within the Energy Efficiency sector where the employing construction or repair firms frequently are engaged in both traditional energy-related construction or installation as well as high-efficiency activities that qualify for ENERGY STAR® designation. Energy end-use in the U.S. is divided into four primary categories: 1) Electric Power Generation (38.5 percent); 2) Residential and Commercial Buildings (11.3 percent); 3) Industrial (21.4 percent); and 4) Transportation (28 percent). In 2015, 74.1 percent of electricity was consumed by Residential and Commercial Buildings, 25.7 percent by Industrial, and .2 percent by Transportation. Thus, Residential and Commercial Buildings were the end-use consumers of approximately 39.8 percent of all energy production (direct end-use + electricity).8 As with the 2016 report, the 2017 USEER captures only energy efficiency products certified by the Environmental Protection Agency’s ENERGY STAR® program or installed pursuant to the 7 Data presented in this report excludes retail employees. Qualifying Energy Workers will be referenced as energy-related jobs. Where “portion of their time” includes employees whose activities are less than 50 percent of their time, specific reference will be noted. 8 http://www.eia.gov/energy_in_brief/article/major_energy_sources_and_users.cfm

15
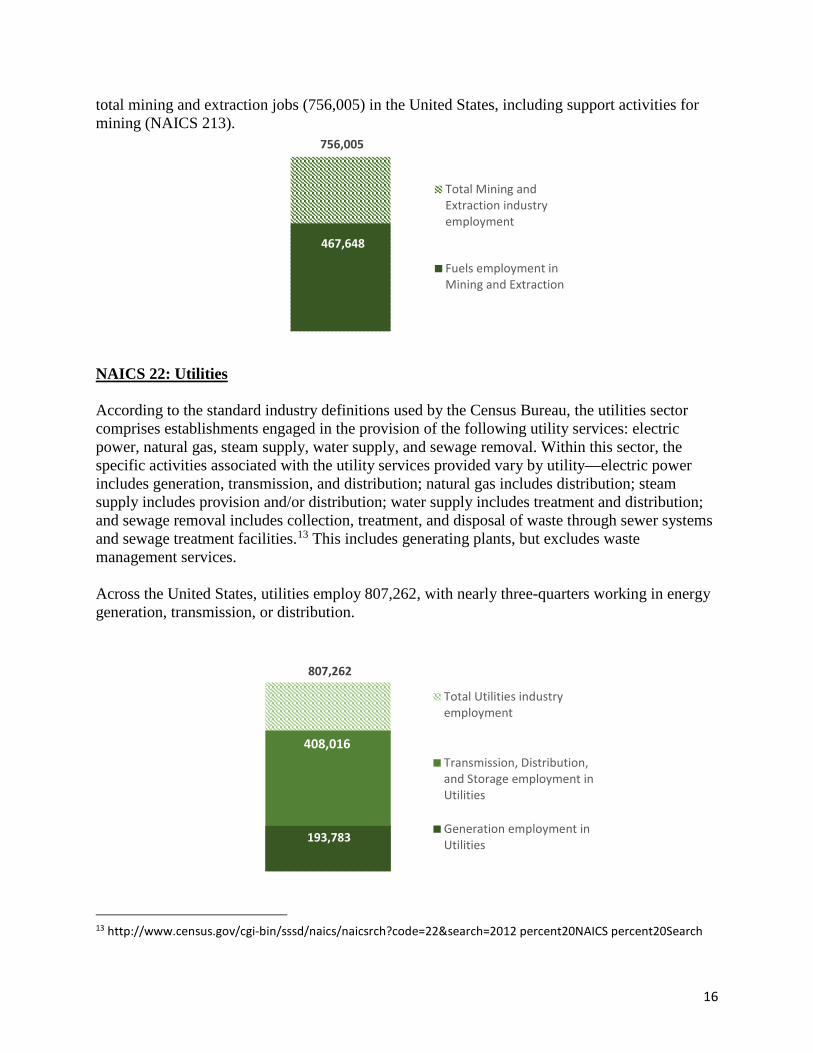
ENERGY STAR® program guidelines. Thus, the following Energy Efficiency employment figures encompass work with efficient technologies or building design and retrofits. The USEER does not capture employment related to energy-efficient manufacturing processes. Future U.S. Energy and Employment Reports may address this gap; in the meantime, the Energy Productivity and Economic Prosperity Index9 provides insight into these areas. Motor Vehicles are included in this report primarily due to their intensive use of energy and contribution to carbon emissions.10 This report delineates employment between traditional gas and diesel motor vehicles, hybrid and plug-in hybrid, electric, natural gas, hydrogen, and fuel cell technologies, as well as Motor Vehicle component parts for such vehicles. For the first time this year, USEER also includes an estimate for Motor Vehicle component parts that contribute to increased fuel economy. It does not, however, cover all sectors of transportation, such as aviation and maritime. According to the Energy Information Administration (EIA), 28 percent of domestic energy is used for transportation, and 71 percent of the oil consumed in the U.S. on a daily basis.11 BW Research Partnership, an independent research organization, collected and analyzed data at the direction of Department of Energy staff. The data set includes technology, value-chain, and energy employment data to the county-level in all 50 U.S. states. In a time of rapid change in energy technologies across the board, continued refinement of supplemental surveys will continue to be an important tool in analyzing existing BLS data sets. Another benefit of using the QCEW framework and supplemental survey is the ability to understand and report the concentration of energy-related activities within traditional industries, such as construction, manufacturing, and utilities. This helps to illustrate the significant impact that energy and energy-related activities have on the overall economy. The impacts to the various selected industries are illustrated briefly below.12 Energy-Related Employment Within Existing Industries, by NAICS Codes NAICS 21: Mining, Quarrying, and Oil and Gas Extraction (Mining and Extraction) The USEER 2017 survey finds that 467,648 jobs (100 percent in fuels) are associated with the mining and extraction of oil, gas, coal, and nuclear fuel stock. This represents 62 percent of the
9 Blok, Kornelis, et al. The 2015 Energy Productivity and Economic Prosperity Index. 10 The Index covers motor vehicle employment across vehicle parts manufacturing, automotive repair and maintenance, as well as vehicle, parts, and supplies wholesalers, including air, rail, water, and truck transportation of motor vehicle parts and supplies. It does not capture jobs associated with the final assembly of some transportation equipment such as forklifts and golf carts. 11 U.S. Energy Information Administration, Annual Energy Outlook, 2015; 12 Because USEER uses modeling to estimate fuel-stock employment in agriculture and forestry, and because these industry codes are not effectively captured by QCEW, no estimate is made as to the percent of the total industry captured by USEER.
16
total mining and extraction jobs (756,005) in the United States, including support activities for mining (NAICS 213).
NAICS 22: Utilities According to the standard industry definitions used by the Census Bureau, the utilities sector comprises establishments engaged in the provision of the following utility services: electric power, natural gas, steam supply, water supply, and sewage removal. Within this sector, the specific activities associated with the utility services provided vary by utility—electric power includes generation, transmission, and distribution; natural gas includes distribution; steam supply includes provision and/or distribution; water supply includes treatment and distribution; and sewage removal includes collection, treatment, and disposal of waste through sewer systems and sewage treatment facilities.13 This includes generating plants, but excludes waste management services. Across the United States, utilities employ 807,262, with nearly three-quarters working in energy generation, transmission, or distribution.
13 http://www.census.gov/cgi-bin/sssd/naics/naicsrch?code=22&search=2012 percent20NAICS percent20Search
756,005
467,648
Total Mining andExtraction industryemployment
Fuels employment inMining and Extraction
807,262
408,016
193,783
Total Utilities industryemployment
Transmission, Distribution,and Storage employment inUtilities
Generation employment inUtilities
17
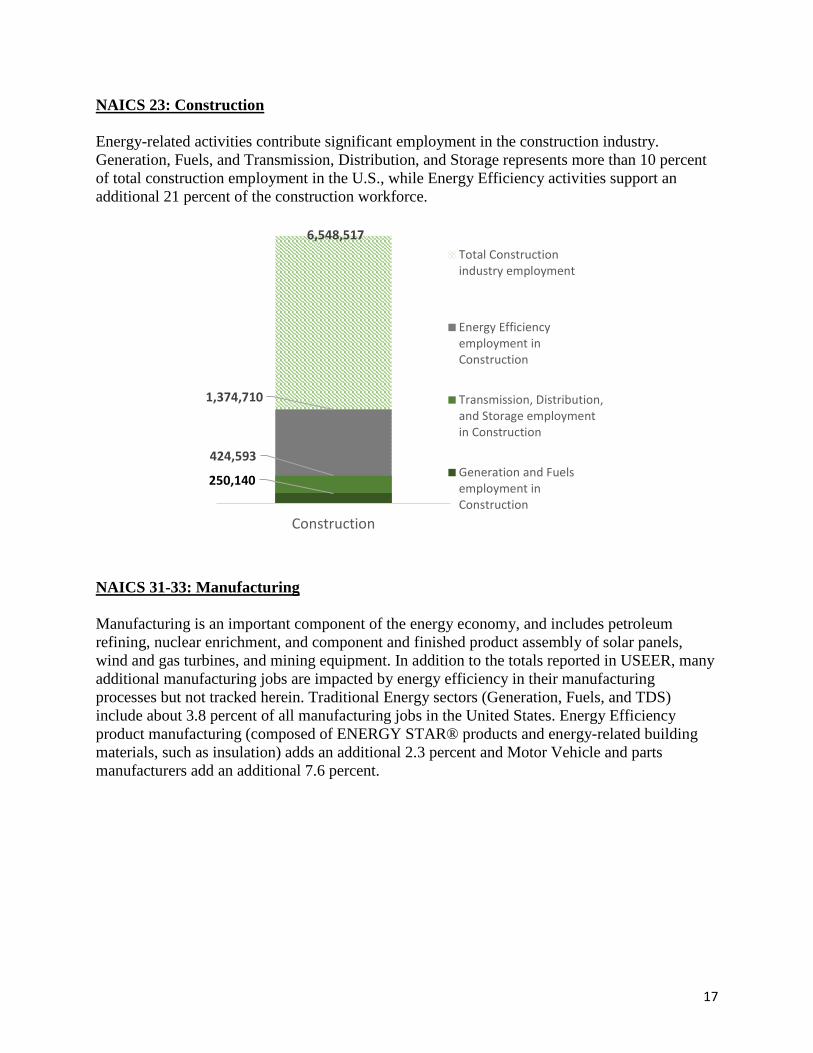
NAICS 23: Construction Energy-related activities contribute significant employment in the construction industry. Generation, Fuels, and Transmission, Distribution, and Storage represents more than 10 percent of total construction employment in the U.S., while Energy Efficiency activities support an additional 21 percent of the construction workforce.
NAICS 31-33: Manufacturing Manufacturing is an important component of the energy economy, and includes petroleum refining, nuclear enrichment, and component and finished product assembly of solar panels, wind and gas turbines, and mining equipment. In addition to the totals reported in USEER, many additional manufacturing jobs are impacted by energy efficiency in their manufacturing processes but not tracked herein. Traditional Energy sectors (Generation, Fuels, and TDS) include about 3.8 percent of all manufacturing jobs in the United States. Energy Efficiency product manufacturing (composed of ENERGY STAR® products and energy-related building materials, such as insulation) adds an additional 2.3 percent and Motor Vehicle and parts manufacturers add an additional 7.6 percent.
6,548,517
1,374,710
424,593
250,140
Construction
Total Constructionindustry employment
Energy Efficiencyemployment inConstruction
Transmission, Distribution,and Storage employmentin Construction
Generation and Fuelsemployment inConstruction

18
NAICS 42, 486, and Commodity Flow Data: Wholesale Trade, Distribution, and Transport (“Wholesale Trade”) Wholesale trade, distribution, and transport includes wholesale equipment and supplies merchant wholesalers of goods that are linked to the energy industry (including motor vehicles and motor vehicle parts and building materials). Also included in this NAICS category is all employment related to the pipeline transportation of fuels and the transport (via truck, rail, air, and water) of energy commodities such as coal, fuel oil, gas, motor vehicles, and petroleum. NAICS 52 and 54: Finance, Insurance, Professional and Business Services (Professional and Business Services) Professional and business services provide support for energy related activity in the United States. Firms from this sector are primarily involved in finance and insurance, real estate and rental and leasing, professional, scientific and technical services, and administrative support and waste management and remediation services. Energy Efficiency contributes approximately 1.4 percent of the workforce in this large, diverse sector. NAICS 81: Other Services (Repair and Maintenance/Other) Other services are important to the energy economy, including repair and maintenance and non-profit activity. Motor Vehicles account for over one-fifth (21.3 percent) of the workforce in the larger industry, driven by employment in automotive repair and maintenance. Generation and Fuels combine for just under one percent of the overall workforce in other services. How to Use this Report The 2017 USEER relies on a survey of 30,000 business representatives to analyze existing data from the Bureau of Labor Statistics with technology and value chain definitions that reflect the
12,303,630
936,248289,01190,733380,642
Manufacturing
Total Manufacturing industryemployment
Motor Vehicles employment inManufacturing
Energy Efficiency employmentin Manufacturing
Transmission, Distribution, andStorage employment inManufacturing
Generation and Fuelsemployment in Manufacturing

19
activities of the Department of Energy. The survey is conducted using a stratified sampling method, which relies on survey quotas based on specific characteristics of companies, to ensure representation. BW Research uses three characteristics in this sampling plan: 1) NAICS industry; 2) state location; 3) company size. Using the NAICS framework and building the sample frame using establishment totals from the Quarterly Census of Employment and Wages allows for more accurate and efficient data collection and analysis. Further, it demonstrates changes in business models. If a utility, for example, outsources a portion of its activities to a construction firm, USEER’s methodology allows for those jobs to continue to be counted and tracked. At the same time, employment is allocated based on NAICS industries only. In the utility-outsourcing example used above, the USEER would still count the jobs as energy employment, but would allocate those jobs to construction rather than utilities. Because the supplemental survey captures employment across a wide range of activities and industries, the report includes more than a million jobs that would not otherwise be identified as part of the Traditional Energy sectors. The 2017 USEER is organized into four chapters. The first two chapters, representing “Electric Power Generation and Fuels” and “Transmission, Distribution, and Storage”, describe Traditional Energy jobs, from fuel extraction to processing, generation, transmission, and distribution. These chapters include fossil, nuclear, and renewable energy sources and their value chains. The report also includes two sectors selected for their importance to energy demand: Energy Efficiency and Motor Vehicles.

20
Introduction Electric Power Generation and Fuels employment covers the entire range of business activities that support both fuel extraction and production, as well as utility-scale and distributed electric power generation. While data in this chapter were presented in cumulative totals last year, Electric Power Generation and Fuels are disaggregated for further analysis in the 2017 USEER.
• Electric Power Generation covers all utility employment across electric generating technologies including fossil fuels, nuclear, or renewable energy technologies. Also included in the employment totals are any firms engaged in facility construction, turbine and other generation equipment manufacturing, as well as wholesale parts distribution of all electric generation technologies.
• Fuels employment encompasses all work related to fuel extraction and mining, including petroleum refineries and firms that support coal mining, oil, and gas field machinery manufacturing. Workers across both the forestry and agriculture industries that support fuel production with corn ethanol, biodiesels, and fuel wood are also included in the fuel employment estimates.
Electric Power Generation and Fuels employment is embedded within a range of industries across the United States. It is important to note that while some of these industries, such as fossil fuel power generation or natural gas distribution, are wholly focused on energy-related activities, others work across a wider range of technologies, such as construction, professional and business services, manufacturing, and wholesale trade.
Such industries are particularly important in understanding components of the emerging generation and fuel technology spheres that are not captured through generation and fuel extraction NAICS alone. For example, a subset of semiconductor manufacturers produces solar panels, while others assemble computer components or medical equipment. Consequently, federal labor market data alone presents an incomplete picture of generation and fuel sector employment. This is particularly true of renewable electricity generation. In the wind and solar industries, for instance, much of the generation capacity is owned by development companies or by building owners, not Utilities. Thus, the employment related to this generation appears under other NAICS codes than those that typically capture utility employment. However, inclusion of these additional industries in their entirety would result in exaggerated employment figures, while their exclusion would underestimate the sector’s workforce.
21
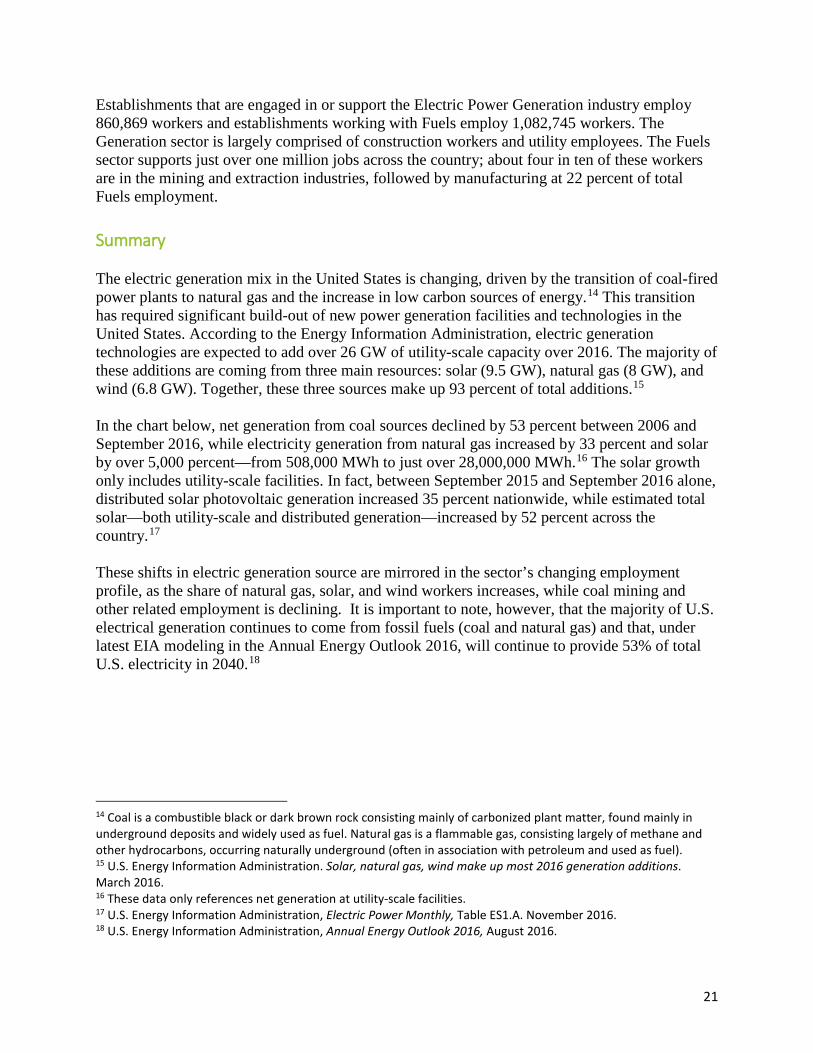
Establishments that are engaged in or support the Electric Power Generation industry employ 860,869 workers and establishments working with Fuels employ 1,082,745 workers. The Generation sector is largely comprised of construction workers and utility employees. The Fuels sector supports just over one million jobs across the country; about four in ten of these workers are in the mining and extraction industries, followed by manufacturing at 22 percent of total Fuels employment. Summary The electric generation mix in the United States is changing, driven by the transition of coal-fired power plants to natural gas and the increase in low carbon sources of energy.14 This transition has required significant build-out of new power generation facilities and technologies in the United States. According to the Energy Information Administration, electric generation technologies are expected to add over 26 GW of utility-scale capacity over 2016. The majority of these additions are coming from three main resources: solar (9.5 GW), natural gas (8 GW), and wind (6.8 GW). Together, these three sources make up 93 percent of total additions.15 In the chart below, net generation from coal sources declined by 53 percent between 2006 and September 2016, while electricity generation from natural gas increased by 33 percent and solar by over 5,000 percent—from 508,000 MWh to just over 28,000,000 MWh.16 The solar growth only includes utility-scale facilities. In fact, between September 2015 and September 2016 alone, distributed solar photovoltaic generation increased 35 percent nationwide, while estimated total solar—both utility-scale and distributed generation—increased by 52 percent across the country.17 These shifts in electric generation source are mirrored in the sector’s changing employment profile, as the share of natural gas, solar, and wind workers increases, while coal mining and other related employment is declining. It is important to note, however, that the majority of U.S. electrical generation continues to come from fossil fuels (coal and natural gas) and that, under latest EIA modeling in the Annual Energy Outlook 2016, will continue to provide 53% of total U.S. electricity in 2040.18 14 Coal is a combustible black or dark brown rock consisting mainly of carbonized plant matter, found mainly in underground deposits and widely used as fuel. Natural gas is a flammable gas, consisting largely of methane and other hydrocarbons, occurring naturally underground (often in association with petroleum and used as fuel). 15 U.S. Energy Information Administration. Solar, natural gas, wind make up most 2016 generation additions. March 2016. 16 These data only references net generation at utility-scale facilities. 17 U.S. Energy Information Administration, Electric Power Monthly, Table ES1.A. November 2016. 18 U.S. Energy Information Administration, Annual Energy Outlook 2016, August 2016.
22
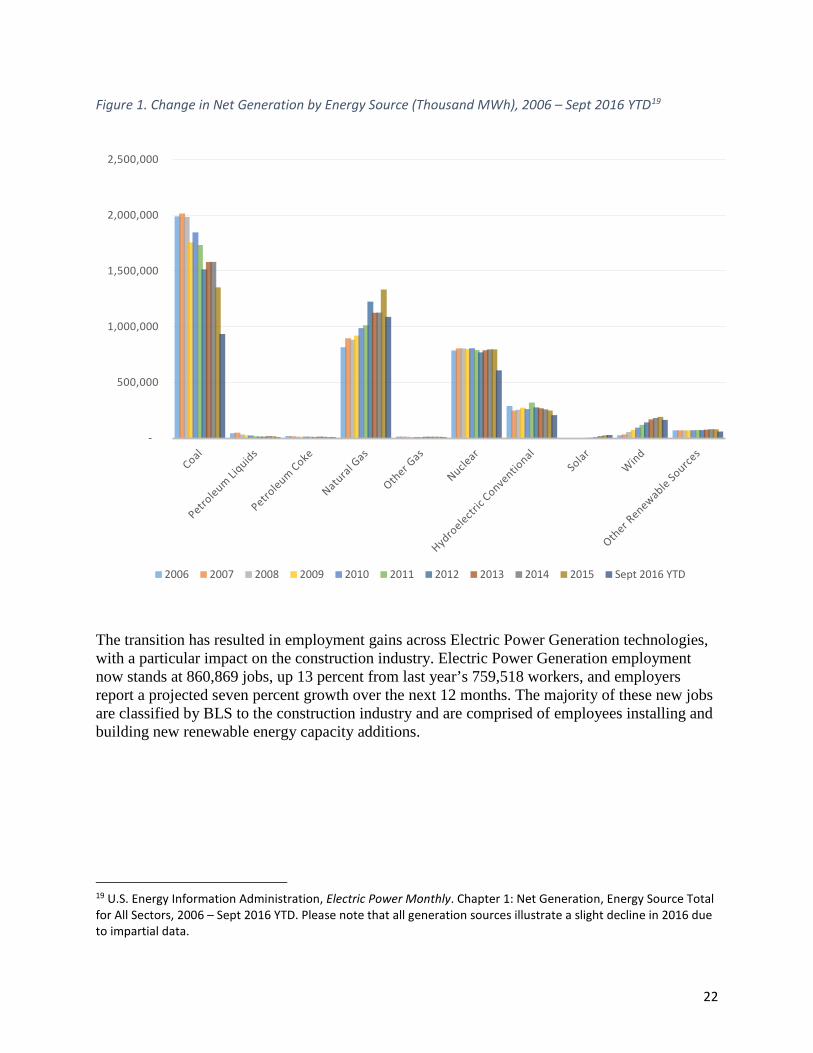
Figure 1. Change in Net Generation by Energy Source (Thousand MWh), 2006 – Sept 2016 YTD19
The transition has resulted in employment gains across Electric Power Generation technologies, with a particular impact on the construction industry. Electric Power Generation employment now stands at 860,869 jobs, up 13 percent from last year’s 759,518 workers, and employers report a projected seven percent growth over the next 12 months. The majority of these new jobs are classified by BLS to the construction industry and are comprised of employees installing and building new renewable energy capacity additions. 19 U.S. Energy Information Administration, Electric Power Monthly. Chapter 1: Net Generation, Energy Source Total for All Sectors, 2006 – Sept 2016 YTD. Please note that all generation sources illustrate a slight decline in 2016 due to impartial data.
-
500,000
1,000,000
1,500,000
2,000,000
2,500,000
2006 2007 2008 2009 2010 2011 2012 2013 2014 2015 Sept 2016 YTD
23
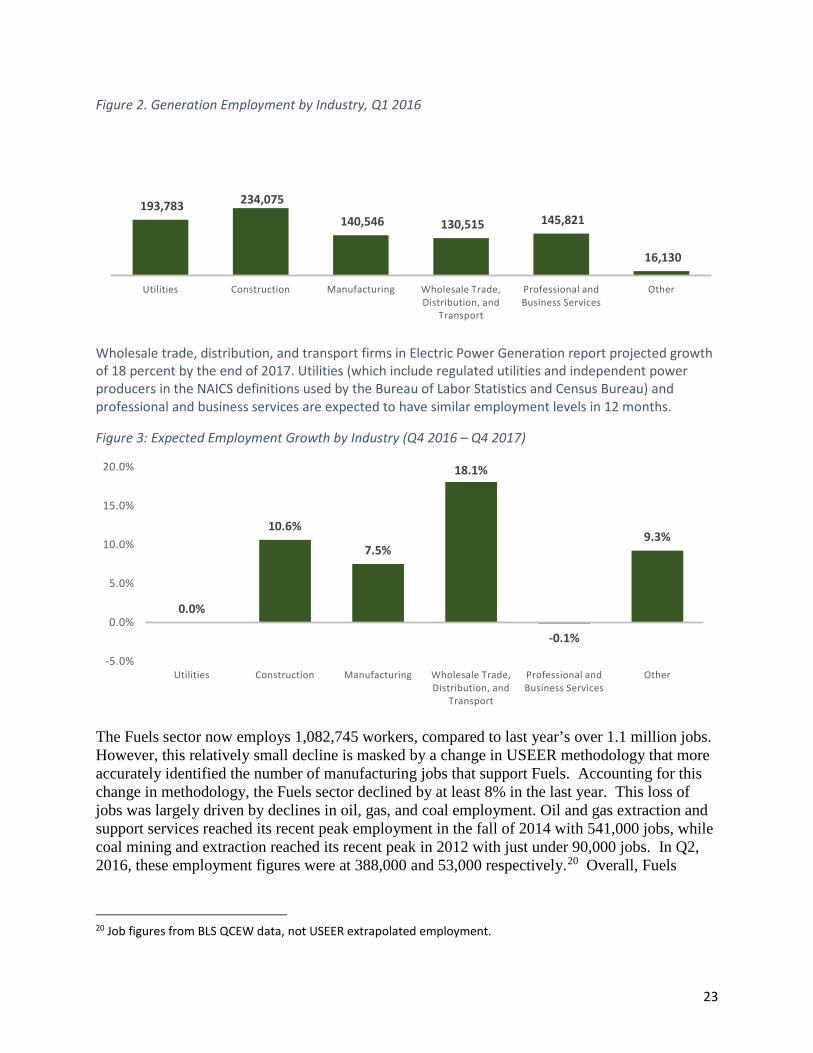
Figure 2. Generation Employment by Industry, Q1 2016
Wholesale trade, distribution, and transport firms in Electric Power Generation report projected growth of 18 percent by the end of 2017. Utilities (which include regulated utilities and independent power producers in the NAICS definitions used by the Bureau of Labor Statistics and Census Bureau) and professional and business services are expected to have similar employment levels in 12 months.
Figure 3: Expected Employment Growth by Industry (Q4 2016 – Q4 2017)
The Fuels sector now employs 1,082,745 workers, compared to last year’s over 1.1 million jobs. However, this relatively small decline is masked by a change in USEER methodology that more accurately identified the number of manufacturing jobs that support Fuels. Accounting for this change in methodology, the Fuels sector declined by at least 8% in the last year. This loss of jobs was largely driven by declines in oil, gas, and coal employment. Oil and gas extraction and support services reached its recent peak employment in the fall of 2014 with 541,000 jobs, while coal mining and extraction reached its recent peak in 2012 with just under 90,000 jobs. In Q2, 2016, these employment figures were at 388,000 and 53,000 respectively.20 Overall, Fuels
20 Job figures from BLS QCEW data, not USEER extrapolated employment.
193,783 234,075
140,546 130,515 145,821
16,130
Utilities Construction Manufacturing Wholesale Trade, Distribution, and
Transport
Professional and Business Services
Other
0.0%
10.6%
7.5%
18.1%
-0.1%
9.3%
-5.0%
0.0%
5.0%
10.0%
15.0%
20.0%
Utilities Construction Manufacturing Wholesale Trade, Distribution, and
Transport
Professional and Business Services
Other
24
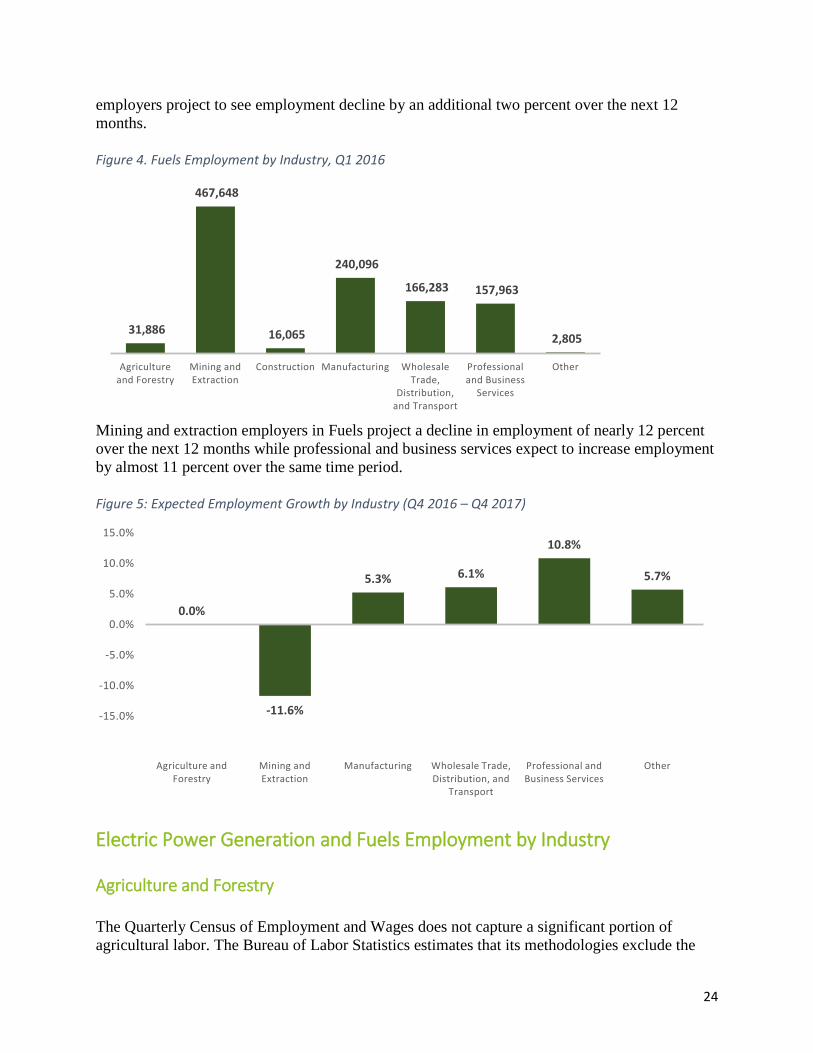
employers project to see employment decline by an additional two percent over the next 12 months. Figure 4. Fuels Employment by Industry, Q1 2016
Mining and extraction employers in Fuels project a decline in employment of nearly 12 percent over the next 12 months while professional and business services expect to increase employment by almost 11 percent over the same time period. Figure 5: Expected Employment Growth by Industry (Q4 2016 – Q4 2017)
Electric Power Generation and Fuels Employment by Industry Agriculture and Forestry The Quarterly Census of Employment and Wages does not capture a significant portion of agricultural labor. The Bureau of Labor Statistics estimates that its methodologies exclude the
31,886
467,648
16,065
240,096
166,283 157,963
2,805
Agriculture and Forestry
Mining and Extraction
Construction Manufacturing Wholesale Trade,
Distribution, and Transport
Professional and Business
Services
Other
0.0%
-11.6%
5.3% 6.1%
10.8%
5.7%
-15.0%
-10.0%
-5.0%
0.0%
5.0%
10.0%
15.0%
Agriculture and Forestry
Mining and Extraction
Manufacturing Wholesale Trade, Distribution, and
Transport
Professional and Business Services
Other
25
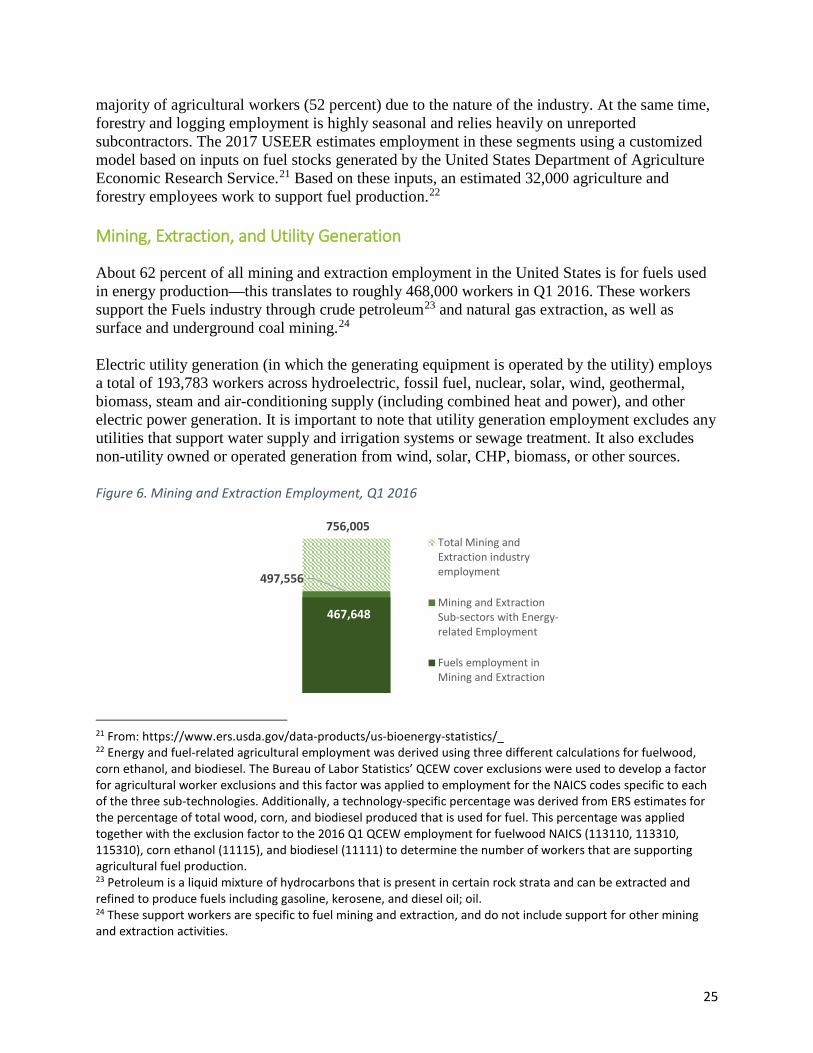
majority of agricultural workers (52 percent) due to the nature of the industry. At the same time, forestry and logging employment is highly seasonal and relies heavily on unreported subcontractors. The 2017 USEER estimates employment in these segments using a customized model based on inputs on fuel stocks generated by the United States Department of Agriculture Economic Research Service.21 Based on these inputs, an estimated 32,000 agriculture and forestry employees work to support fuel production.22 Mining, Extraction, and Utility Generation About 62 percent of all mining and extraction employment in the United States is for fuels used in energy production—this translates to roughly 468,000 workers in Q1 2016. These workers support the Fuels industry through crude petroleum23 and natural gas extraction, as well as surface and underground coal mining.24 Electric utility generation (in which the generating equipment is operated by the utility) employs a total of 193,783 workers across hydroelectric, fossil fuel, nuclear, solar, wind, geothermal, biomass, steam and air-conditioning supply (including combined heat and power), and other electric power generation. It is important to note that utility generation employment excludes any utilities that support water supply and irrigation systems or sewage treatment. It also excludes non-utility owned or operated generation from wind, solar, CHP, biomass, or other sources. Figure 6. Mining and Extraction Employment, Q1 2016
21 From: https://www.ers.usda.gov/data-products/us-bioenergy-statistics/_ 22 Energy and fuel-related agricultural employment was derived using three different calculations for fuelwood, corn ethanol, and biodiesel. The Bureau of Labor Statistics’ QCEW cover exclusions were used to develop a factor for agricultural worker exclusions and this factor was applied to employment for the NAICS codes specific to each of the three sub-technologies. Additionally, a technology-specific percentage was derived from ERS estimates for the percentage of total wood, corn, and biodiesel produced that is used for fuel. This percentage was applied together with the exclusion factor to the 2016 Q1 QCEW employment for fuelwood NAICS (113110, 113310, 115310), corn ethanol (11115), and biodiesel (11111) to determine the number of workers that are supporting agricultural fuel production. 23 Petroleum is a liquid mixture of hydrocarbons that is present in certain rock strata and can be extracted and refined to produce fuels including gasoline, kerosene, and diesel oil; oil. 24 These support workers are specific to fuel mining and extraction, and do not include support for other mining and extraction activities.
756,005
497,556
467,648
Total Mining andExtraction industryemployment
Mining and ExtractionSub-sectors with Energy-related Employment
Fuels employment inMining and Extraction

26
Figure 7. Utilities Employment, Q1 2016
Construction Out of 6.5 million construction workers in the United States, roughly one-tenth of employment is contained in construction subsectors with workers that support electricity generating technologies. Within these subsectors, there are 250,140 construction workers that support both Electric Generation and Fuels production technologies. The majority of these employees are engaged in the construction and installation of the nation’s new electric generation technologies. Figure 8. Construction Employment, Q1 2016
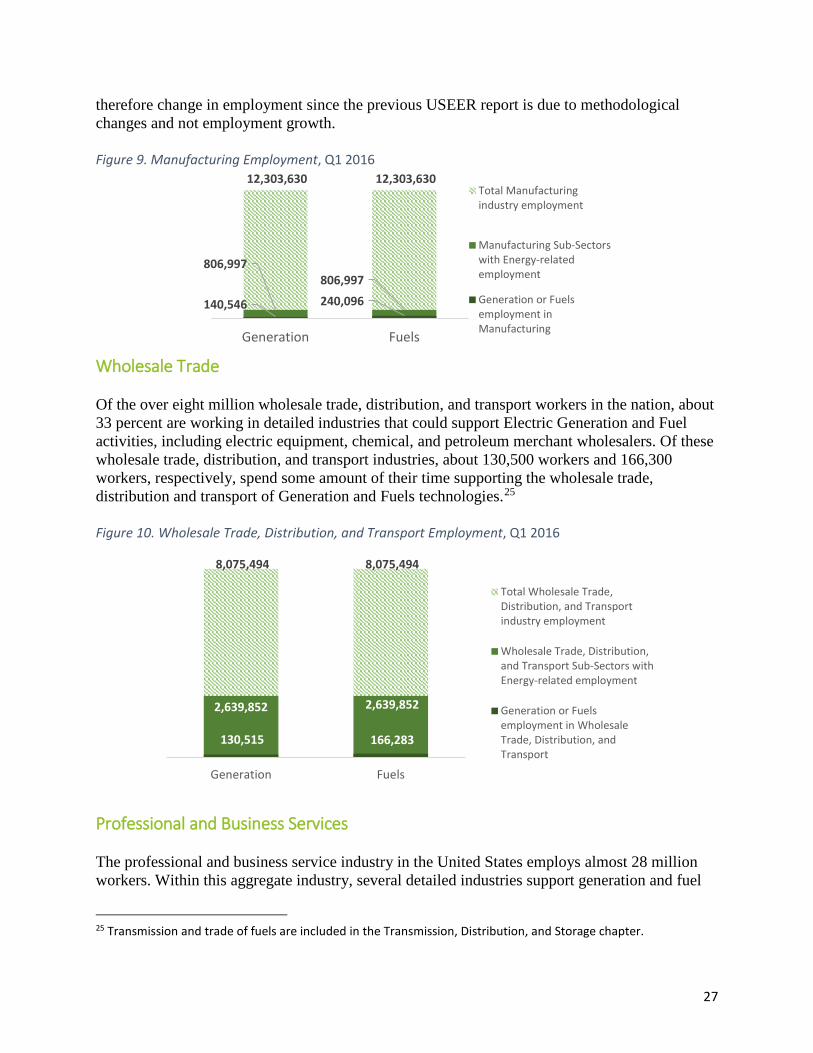
Manufacturing The national manufacturing industry employs just over 12.3 million workers. About 6.6 percent of overall manufacturing employment is comprised of subsectors that could support Electric Power Generation and Fuels technologies, including petrochemical, turbine, and generator manufacturing. These detailed industries account for nearly 807,000 workers, most of which support Fuels. Generation and Fuels manufacturers include those firms working on photovoltaic arrays, turbine generators, oil and gas field machinery, and other motor or generator manufacturing. The 2017 USEER methodology was expanded in order to capture more energy manufacturing jobs (i.e. ENERGY STAR® appliance and other product manufacturing, etc.),
807,262
193,783
Total Utilitiesindustryemployment
Generationemployment inUtilities
6,548,517 6,548,517
1,626,149 1,626,149 234,075 16,065
Generation Fuels
Total Constructionindustry employment
Construction Sub-Sectors with Energy-related employment
Generation or Fuelsemployment inConstruction
27
therefore change in employment since the previous USEER report is due to methodological changes and not employment growth. Figure 9. Manufacturing Employment, Q1 2016
Wholesale Trade Of the over eight million wholesale trade, distribution, and transport workers in the nation, about 33 percent are working in detailed industries that could support Electric Generation and Fuel activities, including electric equipment, chemical, and petroleum merchant wholesalers. Of these wholesale trade, distribution, and transport industries, about 130,500 workers and 166,300 workers, respectively, spend some amount of their time supporting the wholesale trade, distribution and transport of Generation and Fuels technologies.25 Figure 10. Wholesale Trade, Distribution, and Transport Employment, Q1 2016
Professional and Business Services The professional and business service industry in the United States employs almost 28 million workers. Within this aggregate industry, several detailed industries support generation and fuel
25 Transmission and trade of fuels are included in the Transmission, Distribution, and Storage chapter.
12,303,630 12,303,630
806,997 806,997
140,546 240,096
Generation Fuels
Total Manufacturingindustry employment
Manufacturing Sub-Sectorswith Energy-relatedemployment
Generation or Fuelsemployment inManufacturing
8,075,494 8,075,494
2,639,852 2,639,852
130,515 166,283
Generation Fuels
Total Wholesale Trade,Distribution, and Transportindustry employment
Wholesale Trade, Distribution,and Transport Sub-Sectors withEnergy-related employment
Generation or Fuelsemployment in WholesaleTrade, Distribution, andTransport
28
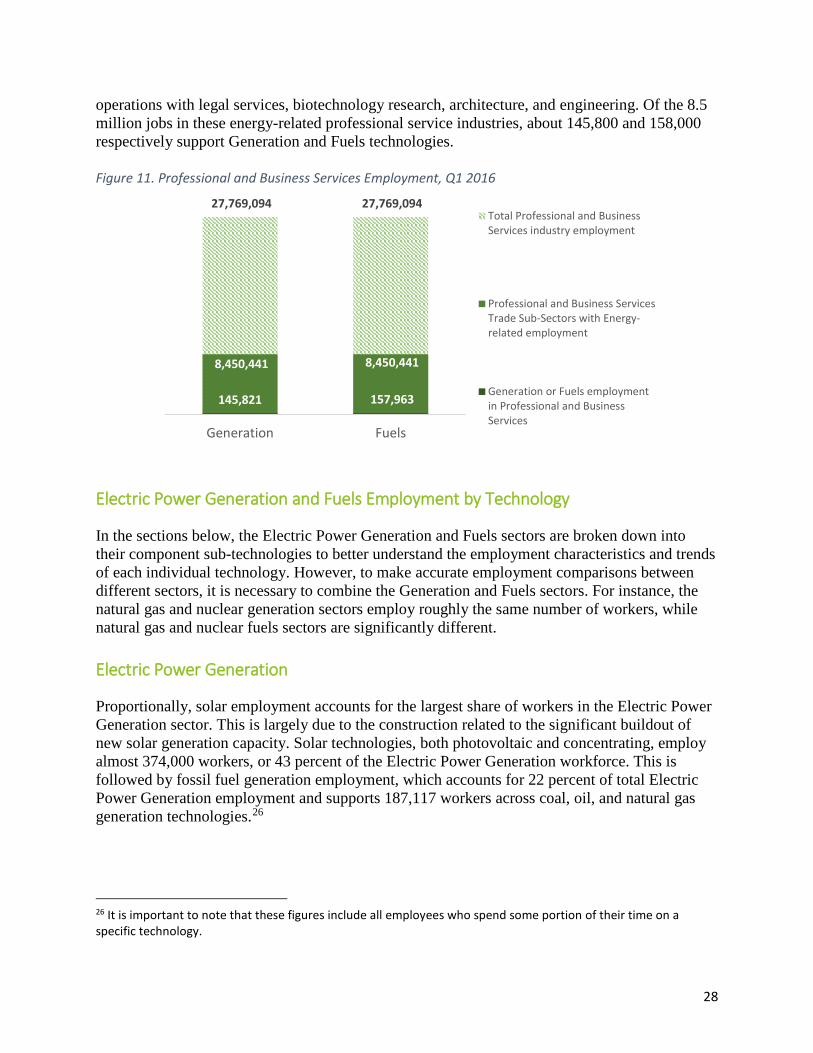
operations with legal services, biotechnology research, architecture, and engineering. Of the 8.5 million jobs in these energy-related professional service industries, about 145,800 and 158,000 respectively support Generation and Fuels technologies. Figure 11. Professional and Business Services Employment, Q1 2016
Electric Power Generation and Fuels Employment by Technology In the sections below, the Electric Power Generation and Fuels sectors are broken down into their component sub-technologies to better understand the employment characteristics and trends of each individual technology. However, to make accurate employment comparisons between different sectors, it is necessary to combine the Generation and Fuels sectors. For instance, the natural gas and nuclear generation sectors employ roughly the same number of workers, while natural gas and nuclear fuels sectors are significantly different. Electric Power Generation Proportionally, solar employment accounts for the largest share of workers in the Electric Power Generation sector. This is largely due to the construction related to the significant buildout of new solar generation capacity. Solar technologies, both photovoltaic and concentrating, employ almost 374,000 workers, or 43 percent of the Electric Power Generation workforce. This is followed by fossil fuel generation employment, which accounts for 22 percent of total Electric Power Generation employment and supports 187,117 workers across coal, oil, and natural gas generation technologies.26
26 It is important to note that these figures include all employees who spend some portion of their time on a specific technology.
27,769,094 27,769,094
8,450,441 8,450,441
145,821 157,963
Generation Fuels
Total Professional and BusinessServices industry employment
Professional and Business ServicesTrade Sub-Sectors with Energy-related employment
Generation or Fuels employmentin Professional and BusinessServices
29
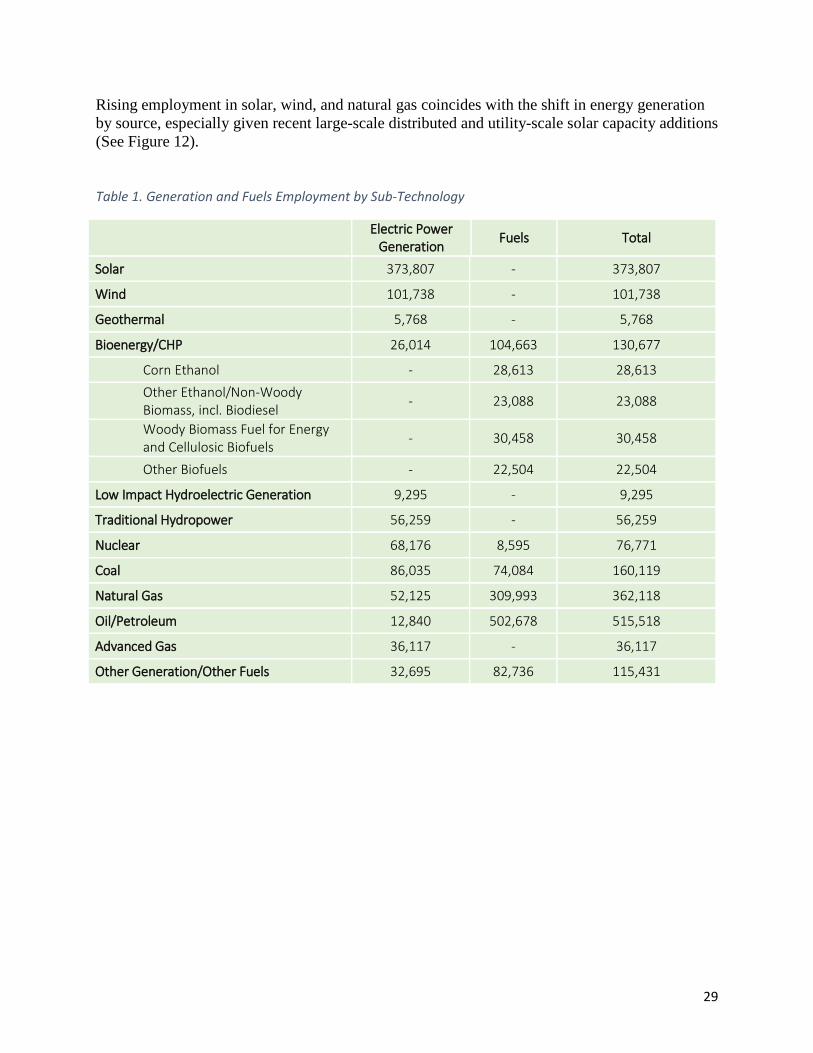
Rising employment in solar, wind, and natural gas coincides with the shift in energy generation by source, especially given recent large-scale distributed and utility-scale solar capacity additions (See Figure 12). Table 1. Generation and Fuels Employment by Sub-Technology
Electric Power Generation Fuels Total
Solar 373,807 - 373,807
Wind 101,738 - 101,738
Geothermal 5,768 - 5,768
Bioenergy/CHP 26,014 104,663 130,677
Corn Ethanol - 28,613 28,613 Other Ethanol/Non-Woody Biomass, incl. Biodiesel - 23,088 23,088
Woody Biomass Fuel for Energy and Cellulosic Biofuels - 30,458 30,458
Other Biofuels - 22,504 22,504
Low Impact Hydroelectric Generation 9,295 - 9,295
Traditional Hydropower 56,259 - 56,259
Nuclear 68,176 8,595 76,771
Coal 86,035 74,084 160,119
Natural Gas 52,125 309,993 362,118
Oil/Petroleum 12,840 502,678 515,518
Advanced Gas 36,117 - 36,117
Other Generation/Other Fuels 32,695 82,736 115,431

30
Figure 12. Electric Power Generation Employment by Technology, Q2 2015 - Q1 201627
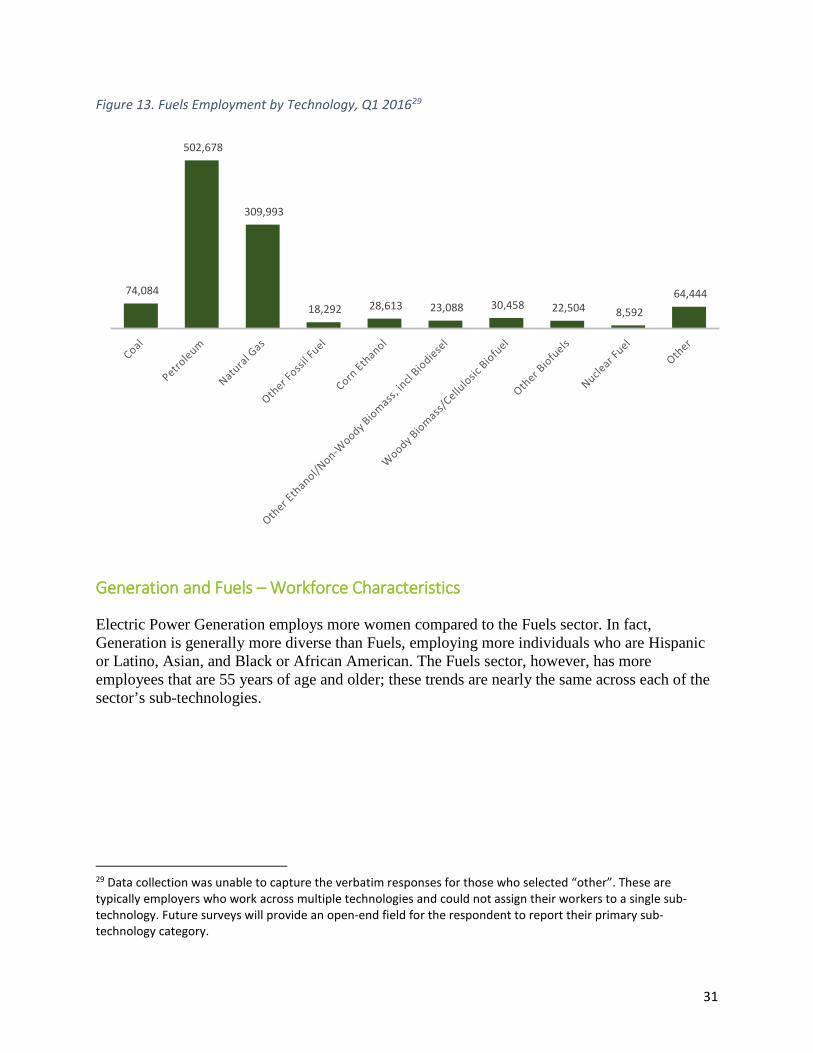
Fuels Of the over one million workers in the Fuels sector, almost half (46 percent) are working with petroleum fuels, followed by 29 percent in natural gas—or 502,900 and 310,000 workers respectively.28
27 For this report, Bioenergy was broken out into Bioenergy and CHP and Fossil was delineated into Coal, Oil, and Natural Gas. The aggregates are displayed in the chart to illustrate the year-over-year comparison, but total employment is delineated in the figure labels. Advanced, low-emission natural gas is efficient, low-emission, leak-free natural gas, including systems that use any of the following technologies: High Efficiency Compressor, Advanced Low NOx Combustion Technology, First Application of Closed Loop Steam Cooling in an Industrial Gas Turbine, Advanced Turbine Blade and Vane Materials, High Temperature TBC and Abradable Coatings, Advanced Row 4 Turbine Blades, 3-D Aero Technology, or Advanced Brush Seal. *Methodology was revised in 2016 to capture subcontractor employment in Nuclear and Traditional Hydro. 28 Respondents for USEER 2017 were asked to place energy workers into sub-technologies where they are most involved. Since petroleum and natural gas are extracted at the same time, workers in mining and extraction could spend a large portion of their time working concurrently in petroleum and natural gas.
300,192
77,088
7,645 19,559 8,608
52,845 56,185
135,898
35,980 19,396
373,807
101,738
5,768
Bioenergy: 7,980CHP: 18,034
9,295 56,259
68,176
Oil: 12,840Natural Gas: 52,125
Coal: 86,035
36,117 32,695
2015
2016
31
Figure 13. Fuels Employment by Technology, Q1 201629
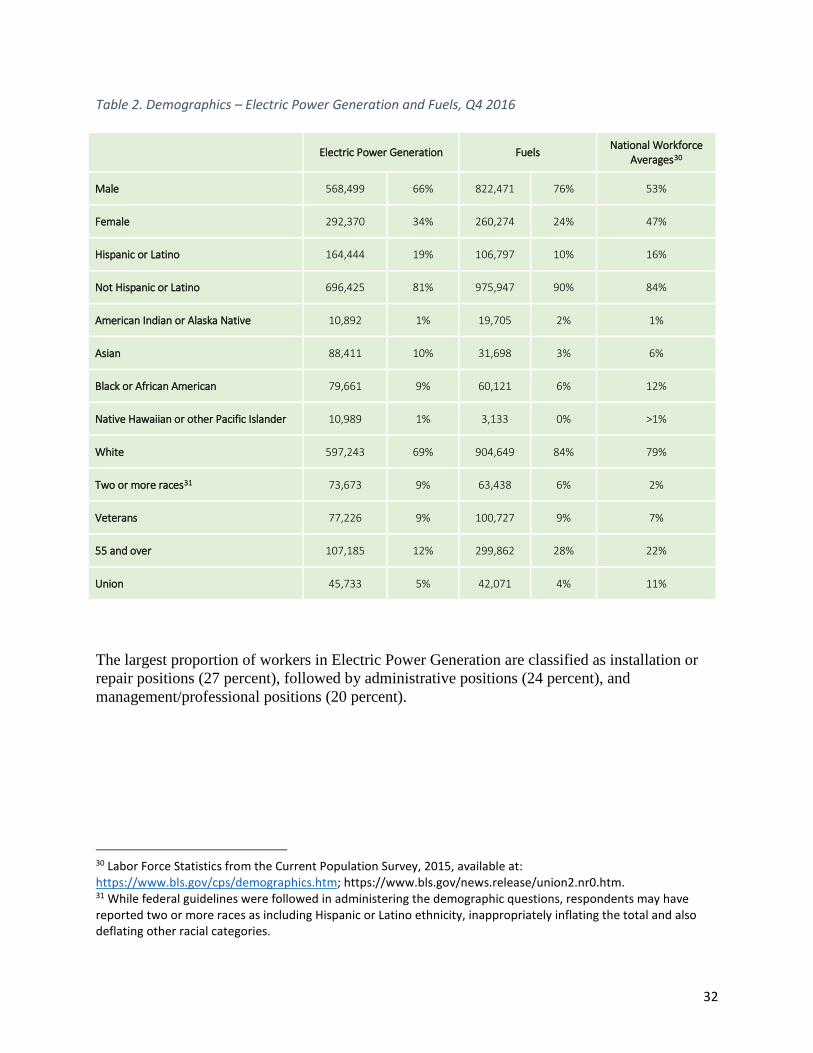
Generation and Fuels – Workforce Characteristics Electric Power Generation employs more women compared to the Fuels sector. In fact, Generation is generally more diverse than Fuels, employing more individuals who are Hispanic or Latino, Asian, and Black or African American. The Fuels sector, however, has more employees that are 55 years of age and older; these trends are nearly the same across each of the sector’s sub-technologies. 29 Data collection was unable to capture the verbatim responses for those who selected “other”. These are typically employers who work across multiple technologies and could not assign their workers to a single sub-technology. Future surveys will provide an open-end field for the respondent to report their primary sub-technology category.
74,084
502,678
309,993
18,292 28,613 23,088 30,458 22,504 8,592 64,444
32
Table 2. Demographics – Electric Power Generation and Fuels, Q4 2016
Electric Power Generation Fuels National Workforce Averages30
Male 568,499 66% 822,471 76% 53%
Female 292,370 34% 260,274 24% 47%
Hispanic or Latino 164,444 19% 106,797 10% 16%
Not Hispanic or Latino 696,425 81% 975,947 90% 84%
American Indian or Alaska Native 10,892 1% 19,705 2% 1%
Asian 88,411 10% 31,698 3% 6%
Black or African American 79,661 9% 60,121 6% 12%
Native Hawaiian or other Pacific Islander 10,989 1% 3,133 0% >1%
White 597,243 69% 904,649 84% 79%
Two or more races31 73,673 9% 63,438 6% 2%
Veterans 77,226 9% 100,727 9% 7%
55 and over 107,185 12% 299,862 28% 22%
Union 45,733 5% 42,071 4% 11%
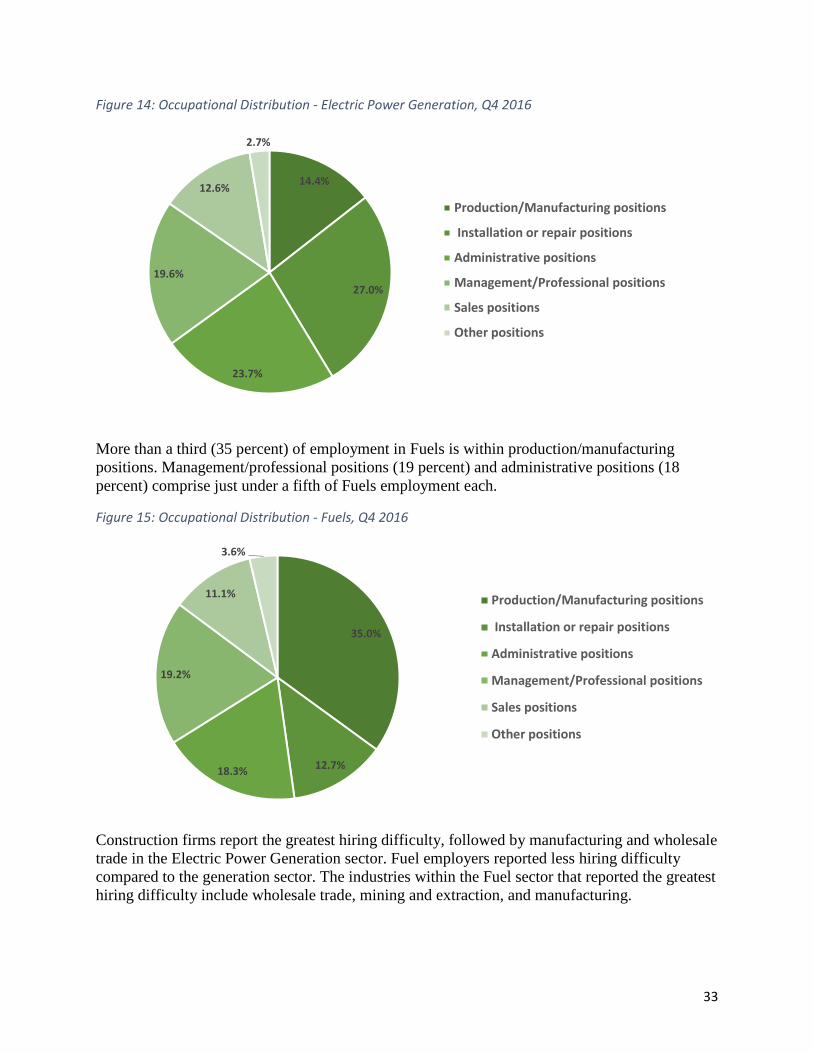
The largest proportion of workers in Electric Power Generation are classified as installation or repair positions (27 percent), followed by administrative positions (24 percent), and management/professional positions (20 percent).
30 Labor Force Statistics from the Current Population Survey, 2015, available at: https://www.bls.gov/cps/demographics.htm; https://www.bls.gov/news.release/union2.nr0.htm. 31 While federal guidelines were followed in administering the demographic questions, respondents may have reported two or more races as including Hispanic or Latino ethnicity, inappropriately inflating the total and also deflating other racial categories.
33
Figure 14: Occupational Distribution - Electric Power Generation, Q4 2016
More than a third (35 percent) of employment in Fuels is within production/manufacturing positions. Management/professional positions (19 percent) and administrative positions (18 percent) comprise just under a fifth of Fuels employment each.
Figure 15: Occupational Distribution - Fuels, Q4 2016
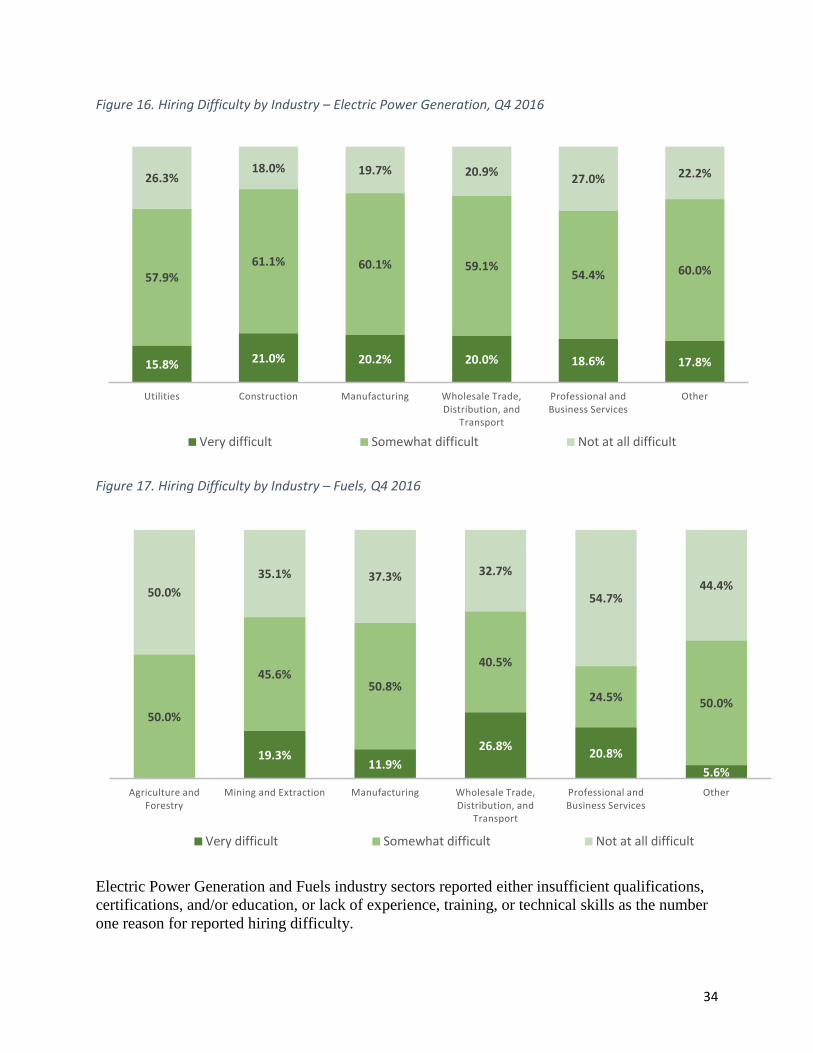
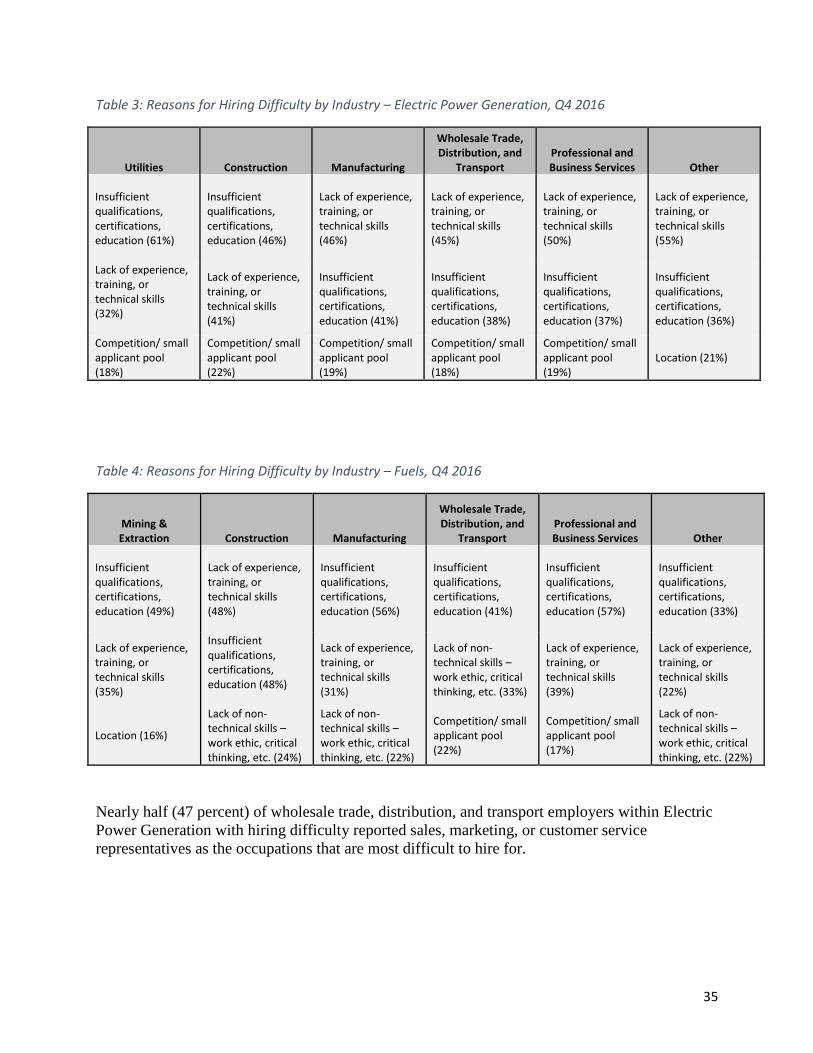
Construction firms report the greatest hiring difficulty, followed by manufacturing and wholesale trade in the Electric Power Generation sector. Fuel employers reported less hiring difficulty compared to the generation sector. The industries within the Fuel sector that reported the greatest hiring difficulty include wholesale trade, mining and extraction, and manufacturing.
14.4%
27.0%
23.7%
19.6%
12.6%
2.7%
Production/Manufacturing positions
Installation or repair positions
Administrative positions
Management/Professional positions
Sales positions
Other positions
35.0%
12.7%18.3%
19.2%
11.1%
3.6%
Production/Manufacturing positions
Installation or repair positions
Administrative positions
Management/Professional positions
Sales positions
Other positions
34
Figure 16. Hiring Difficulty by Industry – Electric Power Generation, Q4 2016
Figure 17. Hiring Difficulty by Industry – Fuels, Q4 2016
Electric Power Generation and Fuels industry sectors reported either insufficient qualifications, certifications, and/or education, or lack of experience, training, or technical skills as the number one reason for reported hiring difficulty.
15.8% 21.0% 20.2% 20.0% 18.6% 17.8%
57.9%61.1% 60.1% 59.1%
54.4% 60.0%
26.3%18.0% 19.7% 20.9% 27.0% 22.2%
Utilities Construction Manufacturing Wholesale Trade, Distribution, and
Transport
Professional and Business Services
Other
Very difficult Somewhat difficult Not at all difficult
19.3%11.9%
26.8% 20.8%5.6%
50.0%
45.6%50.8%
40.5%
24.5% 50.0%
50.0%35.1% 37.3% 32.7%
54.7%44.4%
Agriculture and Forestry
Mining and Extraction Manufacturing Wholesale Trade, Distribution, and
Transport
Professional and Business Services
Other
Very difficult Somewhat difficult Not at all difficult
35
Table 3: Reasons for Hiring Difficulty by Industry – Electric Power Generation, Q4 2016
Utilities Construction Manufacturing
Wholesale Trade, Distribution, and
Transport Professional and Business Services Other
Insufficient qualifications, certifications, education (61%)
Insufficient qualifications, certifications, education (46%)
Lack of experience, training, or technical skills (46%)
Lack of experience, training, or technical skills (45%)
Lack of experience, training, or technical skills (50%)
Lack of experience, training, or technical skills (55%)
Lack of experience, training, or technical skills (32%)
Lack of experience, training, or technical skills (41%)
Insufficient qualifications, certifications, education (41%)
Insufficient qualifications, certifications, education (38%)
Insufficient qualifications, certifications, education (37%)
Insufficient qualifications, certifications, education (36%)
Competition/ small applicant pool (18%)
Competition/ small applicant pool (22%)
Competition/ small applicant pool (19%)
Competition/ small applicant pool (18%)
Competition/ small applicant pool (19%)
Location (21%)
Table 4: Reasons for Hiring Difficulty by Industry – Fuels, Q4 2016
Mining & Extraction Construction Manufacturing
Wholesale Trade, Distribution, and
Transport Professional and Business Services Other
Insufficient qualifications, certifications, education (49%)
Lack of experience, training, or technical skills (48%)
Insufficient qualifications, certifications, education (56%)
Insufficient qualifications, certifications, education (41%)
Insufficient qualifications, certifications, education (57%)
Insufficient qualifications, certifications, education (33%)
Lack of experience, training, or technical skills (35%)
Insufficient qualifications, certifications, education (48%)
Lack of experience, training, or technical skills (31%)
Lack of non-technical skills – work ethic, critical thinking, etc. (33%)
Lack of experience, training, or technical skills (39%)
Lack of experience, training, or technical skills (22%)
Location (16%)
Lack of non-technical skills – work ethic, critical thinking, etc. (24%)
Lack of non-technical skills – work ethic, critical thinking, etc. (22%)
Competition/ small applicant pool (22%)
Competition/ small applicant pool (17%)
Lack of non-technical skills – work ethic, critical thinking, etc. (22%)
Nearly half (47 percent) of wholesale trade, distribution, and transport employers within Electric Power Generation with hiring difficulty reported sales, marketing, or customer service representatives as the occupations that are most difficult to hire for.
36
Table 5: Reported Occupations with Hiring Difficulty by Industry – Electric Power Generation, Q4 2016
Utilities Construction Manufacturing
Wholesale Trade,
Distribution, and Transport
Professional and Business Services Other
Technician or technical support (29%)
Installation workers (29%) Engineers (40%)
Sales, marketing, or customer service representatives (47%)
Engineers (30%)
Managers, directors, or supervisors (27%)
Managers, directors, or supervisors (19%)
Sales, marketing, or customer service representatives (29%)
Sales, marketing, or customer service representatives (26%)
Managers, directors, or supervisors (22%)
Managers, directors, or supervisors (30%)
Sales, marketing, or customer service representatives (27%)
Engineers (16%)
Managers, directors, or supervisors (27%)
Managers, directors, or supervisors (22%)
Engineers (15%)
Sales, marketing, or customer service representatives (11%)
Technician or technical support (24%)
The following table (Table 5) lists the most difficult occupations to hire for by industry within the Fuels sector as reported by employers. Table 6: Reported Occupations with Hiring Difficulty by Industry – Fuels, Q4 2016
Mining & Extraction Construction Manufacturing
Wholesale Trade,
Distribution, and Transport
Professional and Business Services Other
Managers, directors, or supervisors (32%)
Technician or technical support (32%)
Electricians (27%)
Sales, marketing, or customer service representatives (23%)
Engineers (31%)
Sales, marketing, or customer service representatives (20%)
Engineers (22%)
Managers, directors, or supervisors (23%)
Administrative support (14%)
Technician or technical support (17%)
Managers, directors, or supervisors (19%)
Administrative support (10%)
Technician or technical support (14%)
Electricians/ construction workers (18%)
Sales, marketing, or customer service representatives (11%)
Managers, directors, or supervisors (16%)
Technician or technical support (15%)
Managers, directors, or supervisors (10%)

37
Solar Electric Generation The solar sector is an example of the limitation of BLS labor market data to completely capture employment across photovoltaic and Concentrating Solar Power (CSP) technologies. Presently, BLS reports that utilities employ just over 2,800 workers for solar-specific generation. However, this figure does not count any jobs in the construction or other value chain industries for projects financed, owned, or directed by utilities. The data suggest that utilities are directly responsible for at least 25 percent of the solar jobs in the U.S., yet no other NAICS codes yet exist for the sector. Existing labor market data therefore dramatically underestimate the additional workers engaged in solar-related work. There are currently 373,807 Americans that spend some portion of their time working to manufacture, install, distribute, or provide professional services to solar technologies across the nation; of these, roughly seven in ten workers—or about 260,077—spend at least half of their time supporting the solar portion of business. Solar employers reported that they expect to increase employment by seven percent over the next year. The majority of total employment is in photovoltaic technologies, with a small portion—just over nine percent—of workers supporting concentrating solar technologies.32 Construction/installation represents the largest share of employment in this sector—almost four in ten workers—followed by wholesale trade, manufacturing, and professional services. Given high capacity additions across both distributed and utility-scale photovoltaic solar, the sector saw a growth rate of about 25 percent for workers that spend the majority of their time on solar work.
Figure 18: Solar Employment Growth by Industry, 2010-201633
32 The terms “photovoltaic” and “concentrating” solar refer to specific sub-technologies within the solar sector. When references are made to either distributed generation or utility-scale development, these include both solar photovoltaic and concentrating solar technologies. 33 The Solar Foundation National Solar Jobs Census Series
-100%-50%
0%50%
100%150%200%250%300%350%
2010 2011 2012 2013 2014 2015 2016
Overall Installation ManufacturingSales & Distribution Project Developers Other
36.7%
26.5%
18.5%
15.3%
2.3% 0.7%
Solar Employment by Industry
Construction and Installation
Wholesale Trade
Manufacturing
Professional Services
Other
Utilities

38
In 2016, The Solar Energy Industries Association (SEIA) reported that recent solar capacity additions have predominantly been in commercial and utility-scale solar photovoltaic generation. This fact is reflected in the high employment growth in the project development subsector in Figure 18 between 2015 and 2016, as project development typically involves utility-scale projects. Currently, a majority of U.S. photovoltaic generation capacity is utility-scale and is owned or operated by utilities—roughly 28,081,000 MWh compared to 16,974,000 MWh of distributed solar generation from January through October 2016.34 However, in 2016, over half of the nation’s solar workers were spending the majority of their time working on residential solar projects during this time frame. This imbalance reflects the fact that utility-scale generation typically produces more MWh’s per labor unit installed compared to distributed generation. About a third of the solar workforce is female, roughly two in ten workers are Hispanic or Latino, and one in ten are Asian, Black or African American. Solar photovoltaic technologies have a higher concentration of workers aged 55 and over compared to concentrating solar technologies.
Demographics Solar Photovoltaic Concentrating Solar
Power National Workforce
Averages
Male 67.4% 67.4% 53%
Female 32.6% 32.6% 47%
Hispanic or Latino 21.5% 21.0% 16%
Not Hispanic or Latino 78.5% 79.0% 84%
American Indian or Alaska Native 1.2% 1.1% 1%
Asian 9.7% 9.7% 6%
Black or African American 9.0% 6.8% 12%
Native Hawaiian or other Pacific Islander 1.4% 1.5% >1%
White 70.2% 73.2% 79%
Two or more races 8.6% 7.7% 2%
Veterans 11.1% 10.6% 7%
55 and over 12.9% 10.8% 22%
Union 3.4% 4.7% 11%
34 U.S. Energy Information Administration, Electric Power Monthly. Chapter 1: Net Generation, Energy Source Total for All Sectors, through October 2016.
54.7%24.7%
20.6%
Solar Workers by Project Scale
Residential
Commercial
Utility-scale
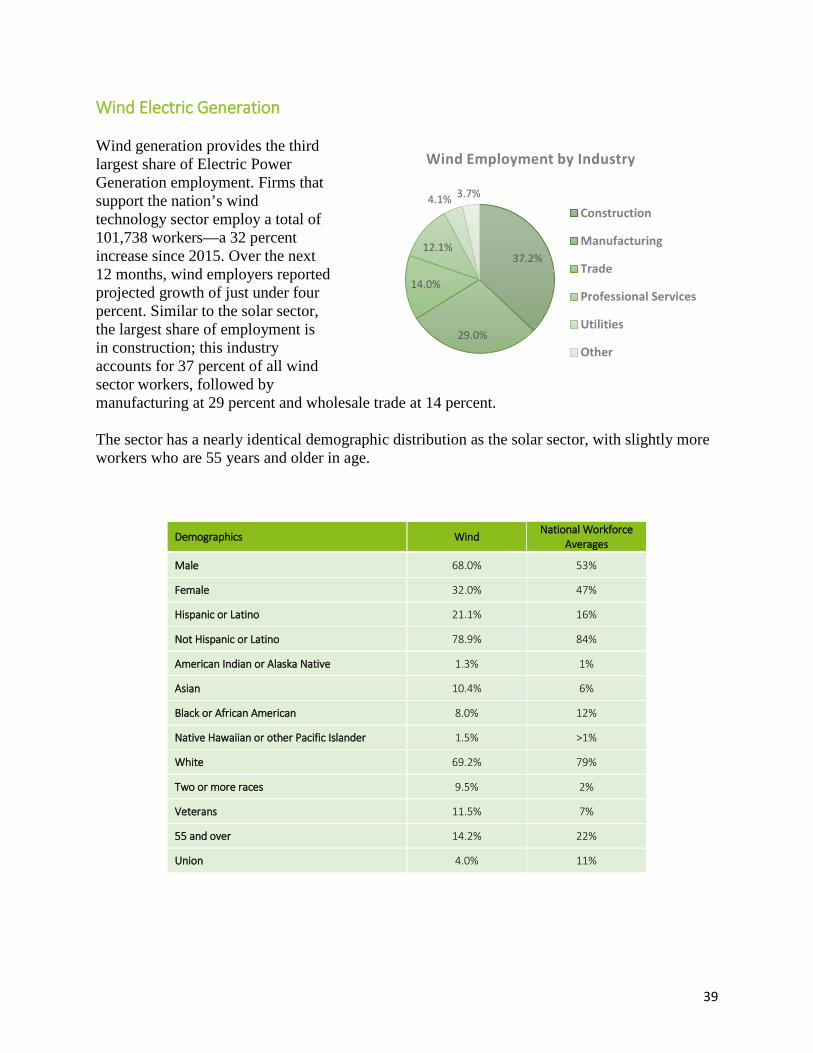
39
Wind Electric Generation Wind generation provides the third largest share of Electric Power Generation employment. Firms that support the nation’s wind technology sector employ a total of 101,738 workers—a 32 percent increase since 2015. Over the next 12 months, wind employers reported projected growth of just under four percent. Similar to the solar sector, the largest share of employment is in construction; this industry accounts for 37 percent of all wind sector workers, followed by manufacturing at 29 percent and wholesale trade at 14 percent. The sector has a nearly identical demographic distribution as the solar sector, with slightly more workers who are 55 years and older in age.
Demographics Wind National Workforce
Averages
Male 68.0% 53%
Female 32.0% 47%
Hispanic or Latino 21.1% 16%
Not Hispanic or Latino 78.9% 84%
American Indian or Alaska Native 1.3% 1%
Asian 10.4% 6%
Black or African American 8.0% 12%
Native Hawaiian or other Pacific Islander 1.5% >1%
White 69.2% 79%
Two or more races 9.5% 2%
Veterans 11.5% 7%
55 and over 14.2% 22%
Union 4.0% 11%
37.2%
29.0%
14.0%
12.1%
4.1% 3.7%
Wind Employment by Industry
Construction
Manufacturing
Trade
Professional Services
Utilities
Other
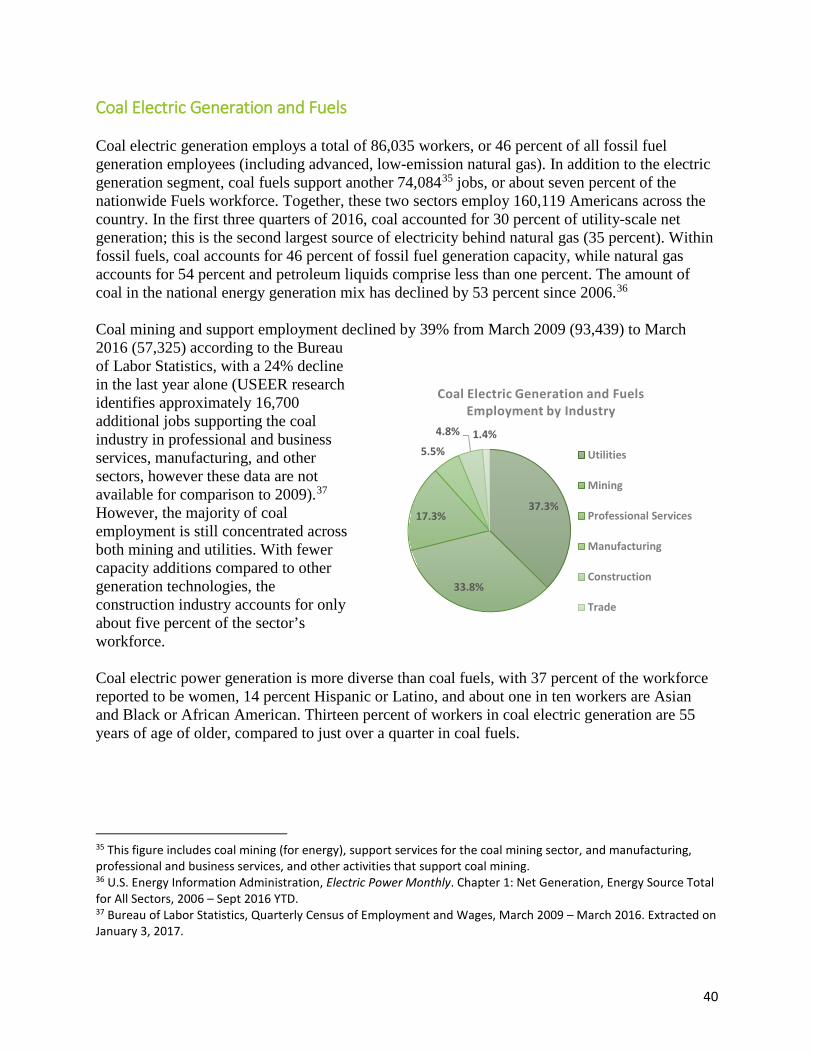
40
37.3%
33.8%
17.3%
5.5%
4.8% 1.4%
Coal Electric Generation and Fuels Employment by Industry
Utilities
Mining
Professional Services
Manufacturing
Construction
Trade
Coal Electric Generation and Fuels Coal electric generation employs a total of 86,035 workers, or 46 percent of all fossil fuel generation employees (including advanced, low-emission natural gas). In addition to the electric generation segment, coal fuels support another 74,08435 jobs, or about seven percent of the nationwide Fuels workforce. Together, these two sectors employ 160,119 Americans across the country. In the first three quarters of 2016, coal accounted for 30 percent of utility-scale net generation; this is the second largest source of electricity behind natural gas (35 percent). Within fossil fuels, coal accounts for 46 percent of fossil fuel generation capacity, while natural gas accounts for 54 percent and petroleum liquids comprise less than one percent. The amount of coal in the national energy generation mix has declined by 53 percent since 2006.36 Coal mining and support employment declined by 39% from March 2009 (93,439) to March 2016 (57,325) according to the Bureau of Labor Statistics, with a 24% decline in the last year alone (USEER research identifies approximately 16,700 additional jobs supporting the coal industry in professional and business services, manufacturing, and other sectors, however these data are not available for comparison to 2009).37 However, the majority of coal employment is still concentrated across both mining and utilities. With fewer capacity additions compared to other generation technologies, the construction industry accounts for only about five percent of the sector’s workforce. Coal electric power generation is more diverse than coal fuels, with 37 percent of the workforce reported to be women, 14 percent Hispanic or Latino, and about one in ten workers are Asian and Black or African American. Thirteen percent of workers in coal electric generation are 55 years of age of older, compared to just over a quarter in coal fuels. 35 This figure includes coal mining (for energy), support services for the coal mining sector, and manufacturing, professional and business services, and other activities that support coal mining. 36 U.S. Energy Information Administration, Electric Power Monthly. Chapter 1: Net Generation, Energy Source Total for All Sectors, 2006 – Sept 2016 YTD. 37 Bureau of Labor Statistics, Quarterly Census of Employment and Wages, March 2009 – March 2016. Extracted on January 3, 2017.
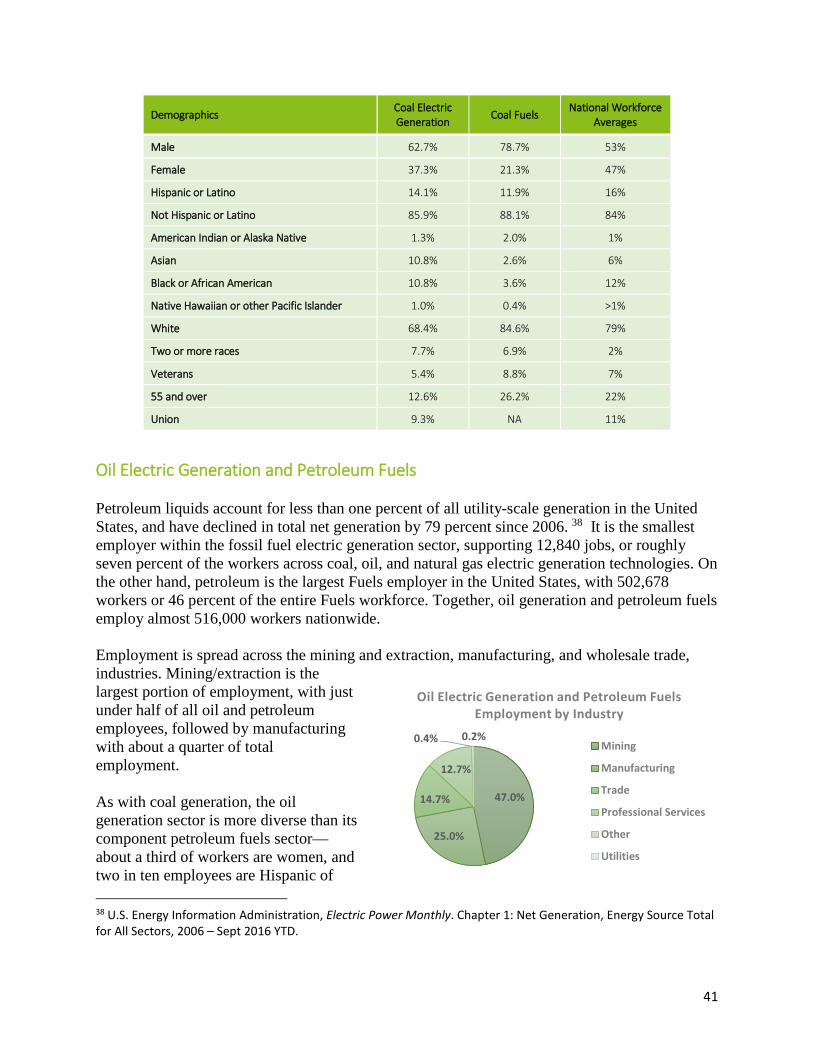
41
Demographics Coal Electric Generation
Coal Fuels National Workforce
Averages
Male 62.7% 78.7% 53%
Female 37.3% 21.3% 47%
Hispanic or Latino 14.1% 11.9% 16%
Not Hispanic or Latino 85.9% 88.1% 84%
American Indian or Alaska Native 1.3% 2.0% 1%
Asian 10.8% 2.6% 6%
Black or African American 10.8% 3.6% 12%
Native Hawaiian or other Pacific Islander 1.0% 0.4% >1%
White 68.4% 84.6% 79%
Two or more races 7.7% 6.9% 2%
Veterans 5.4% 8.8% 7%
55 and over 12.6% 26.2% 22%
Union 9.3% NA 11%
Oil Electric Generation and Petroleum Fuels Petroleum liquids account for less than one percent of all utility-scale generation in the United States, and have declined in total net generation by 79 percent since 2006. 38 It is the smallest employer within the fossil fuel electric generation sector, supporting 12,840 jobs, or roughly seven percent of the workers across coal, oil, and natural gas electric generation technologies. On the other hand, petroleum is the largest Fuels employer in the United States, with 502,678 workers or 46 percent of the entire Fuels workforce. Together, oil generation and petroleum fuels employ almost 516,000 workers nationwide. Employment is spread across the mining and extraction, manufacturing, and wholesale trade, industries. Mining/extraction is the largest portion of employment, with just under half of all oil and petroleum employees, followed by manufacturing with about a quarter of total employment. As with coal generation, the oil generation sector is more diverse than its component petroleum fuels sector—about a third of workers are women, and two in ten employees are Hispanic of 38 U.S. Energy Information Administration, Electric Power Monthly. Chapter 1: Net Generation, Energy Source Total for All Sectors, 2006 – Sept 2016 YTD.
47.0%
25.0%
14.7%
12.7%
0.4% 0.2%
Oil Electric Generation and Petroleum Fuels Employment by Industry
Mining
Manufacturing
Trade
Professional Services
Other
Utilities
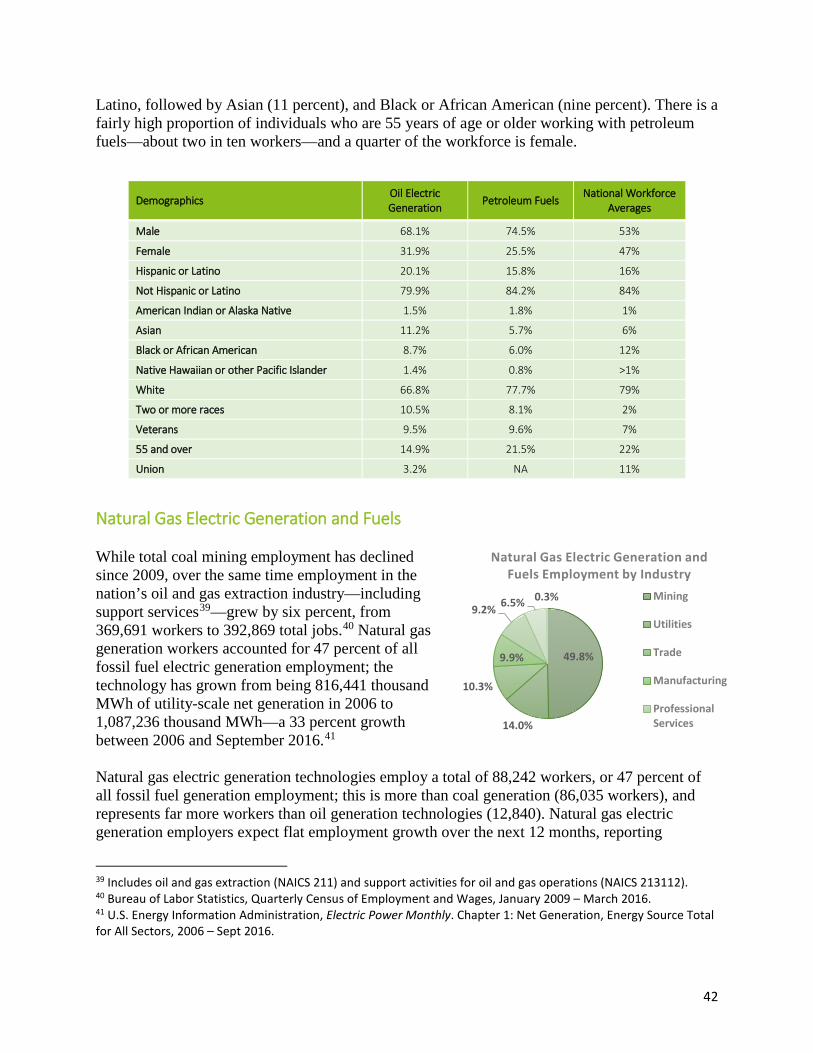
42
Latino, followed by Asian (11 percent), and Black or African American (nine percent). There is a fairly high proportion of individuals who are 55 years of age or older working with petroleum fuels—about two in ten workers—and a quarter of the workforce is female.
Demographics Oil Electric Generation
Petroleum Fuels National Workforce
Averages
Male 68.1% 74.5% 53%
Female 31.9% 25.5% 47%
Hispanic or Latino 20.1% 15.8% 16%
Not Hispanic or Latino 79.9% 84.2% 84%
American Indian or Alaska Native 1.5% 1.8% 1%
Asian 11.2% 5.7% 6%
Black or African American 8.7% 6.0% 12%
Native Hawaiian or other Pacific Islander 1.4% 0.8% >1%
White 66.8% 77.7% 79%
Two or more races 10.5% 8.1% 2%
Veterans 9.5% 9.6% 7%
55 and over 14.9% 21.5% 22%
Union 3.2% NA 11%
Natural Gas Electric Generation and Fuels While total coal mining employment has declined since 2009, over the same time employment in the nation’s oil and gas extraction industry—including support services39—grew by six percent, from 369,691 workers to 392,869 total jobs.40 Natural gas generation workers accounted for 47 percent of all fossil fuel electric generation employment; the technology has grown from being 816,441 thousand MWh of utility-scale net generation in 2006 to 1,087,236 thousand MWh—a 33 percent growth between 2006 and September 2016.41 Natural gas electric generation technologies employ a total of 88,242 workers, or 47 percent of all fossil fuel generation employment; this is more than coal generation (86,035 workers), and represents far more workers than oil generation technologies (12,840). Natural gas electric generation employers expect flat employment growth over the next 12 months, reporting
39 Includes oil and gas extraction (NAICS 211) and support activities for oil and gas operations (NAICS 213112). 40 Bureau of Labor Statistics, Quarterly Census of Employment and Wages, January 2009 – March 2016. 41 U.S. Energy Information Administration, Electric Power Monthly. Chapter 1: Net Generation, Energy Source Total for All Sectors, 2006 – Sept 2016.
49.8%
14.0%
10.3%
9.9%
9.2% 6.5% 0.3%
Natural Gas Electric Generation and Fuels Employment by Industry
Mining
Utilities
Trade
Manufacturing
ProfessionalServices
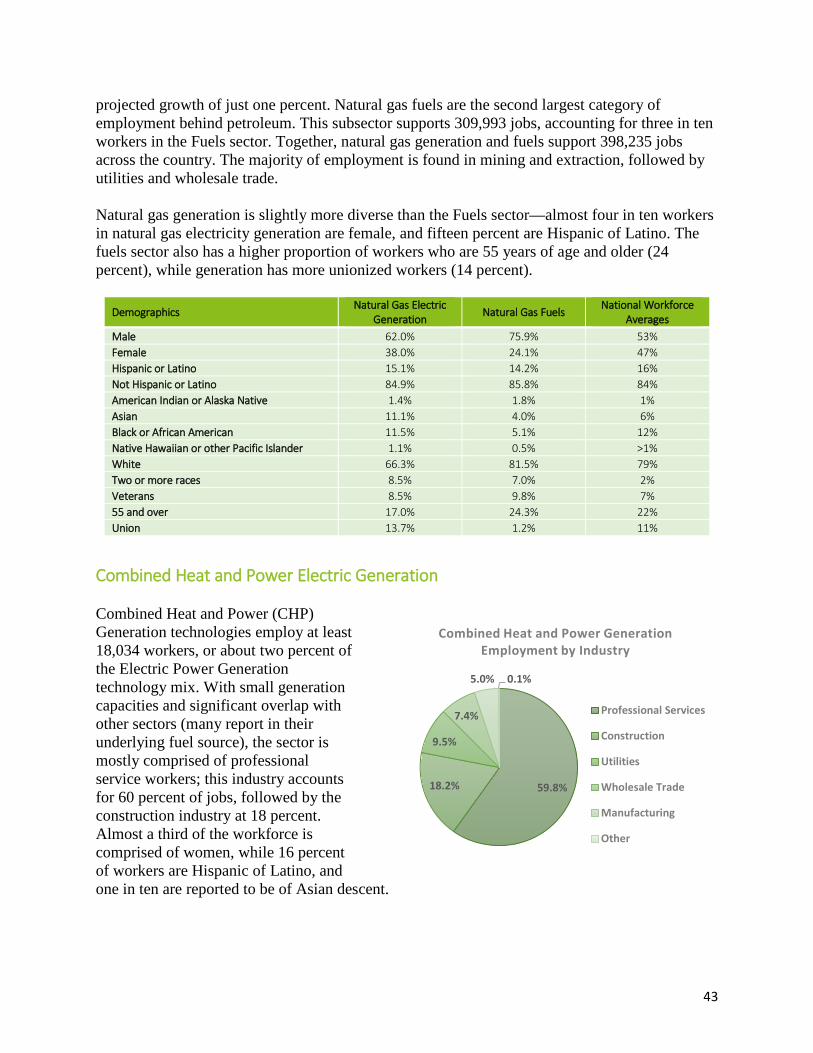
43
projected growth of just one percent. Natural gas fuels are the second largest category of employment behind petroleum. This subsector supports 309,993 jobs, accounting for three in ten workers in the Fuels sector. Together, natural gas generation and fuels support 398,235 jobs across the country. The majority of employment is found in mining and extraction, followed by utilities and wholesale trade. Natural gas generation is slightly more diverse than the Fuels sector—almost four in ten workers in natural gas electricity generation are female, and fifteen percent are Hispanic of Latino. The fuels sector also has a higher proportion of workers who are 55 years of age and older (24 percent), while generation has more unionized workers (14 percent).
Demographics Natural Gas Electric
Generation Natural Gas Fuels National Workforce
Averages Male 62.0% 75.9% 53% Female 38.0% 24.1% 47% Hispanic or Latino 15.1% 14.2% 16% Not Hispanic or Latino 84.9% 85.8% 84% American Indian or Alaska Native 1.4% 1.8% 1% Asian 11.1% 4.0% 6% Black or African American 11.5% 5.1% 12% Native Hawaiian or other Pacific Islander 1.1% 0.5% >1% White 66.3% 81.5% 79% Two or more races 8.5% 7.0% 2% Veterans 8.5% 9.8% 7% 55 and over 17.0% 24.3% 22% Union 13.7% 1.2% 11%
Combined Heat and Power Electric Generation Combined Heat and Power (CHP) Generation technologies employ at least 18,034 workers, or about two percent of the Electric Power Generation technology mix. With small generation capacities and significant overlap with other sectors (many report in their underlying fuel source), the sector is mostly comprised of professional service workers; this industry accounts for 60 percent of jobs, followed by the construction industry at 18 percent. Almost a third of the workforce is comprised of women, while 16 percent of workers are Hispanic of Latino, and one in ten are reported to be of Asian descent.
59.8%18.2%
9.5%
7.4%
5.0% 0.1%
Combined Heat and Power Generation Employment by Industry
Professional Services
Construction
Utilities
Wholesale Trade
Manufacturing
Other
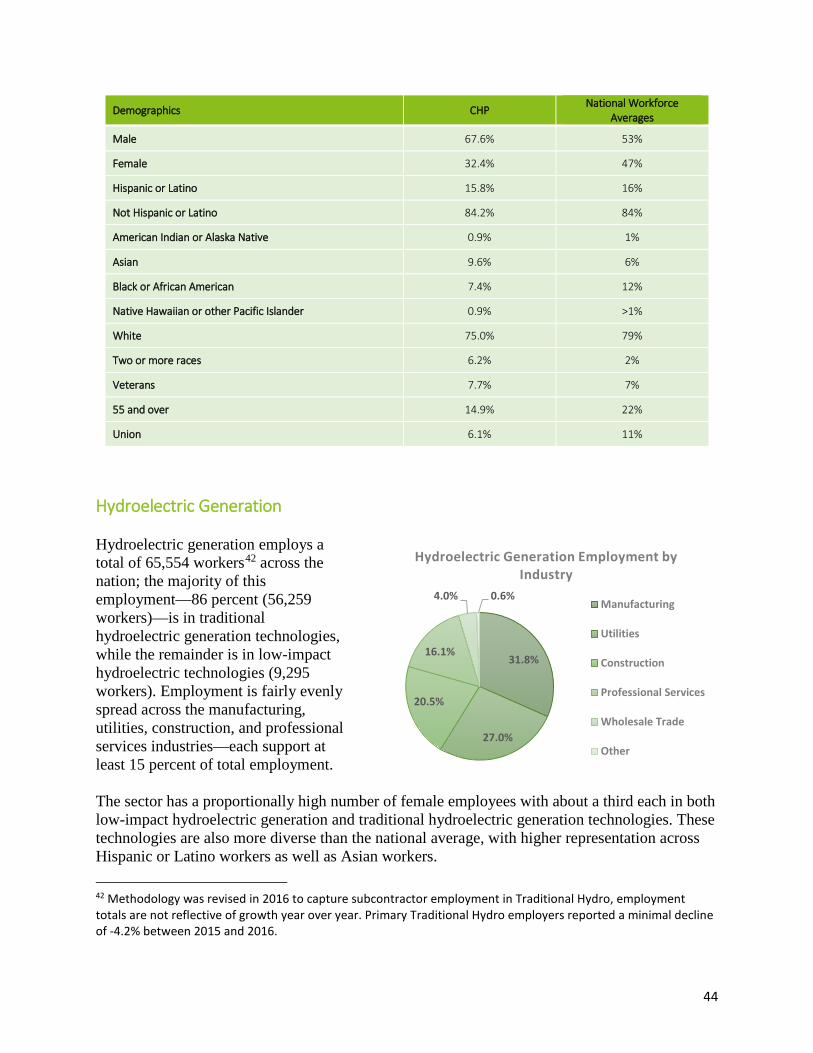
44
Demographics CHP National Workforce
Averages
Male 67.6% 53%
Female 32.4% 47%
Hispanic or Latino 15.8% 16%
Not Hispanic or Latino 84.2% 84%
American Indian or Alaska Native 0.9% 1%
Asian 9.6% 6%
Black or African American 7.4% 12%
Native Hawaiian or other Pacific Islander 0.9% >1%
White 75.0% 79%
Two or more races 6.2% 2%
Veterans 7.7% 7%
55 and over 14.9% 22%
Union 6.1% 11%
Hydroelectric Generation Hydroelectric generation employs a total of 65,554 workers42 across the nation; the majority of this employment—86 percent (56,259 workers)—is in traditional hydroelectric generation technologies, while the remainder is in low-impact hydroelectric technologies (9,295 workers). Employment is fairly evenly spread across the manufacturing, utilities, construction, and professional services industries—each support at least 15 percent of total employment. The sector has a proportionally high number of female employees with about a third each in both low-impact hydroelectric generation and traditional hydroelectric generation technologies. These technologies are also more diverse than the national average, with higher representation across Hispanic or Latino workers as well as Asian workers. 42 Methodology was revised in 2016 to capture subcontractor employment in Traditional Hydro, employment totals are not reflective of growth year over year. Primary Traditional Hydro employers reported a minimal decline of -4.2% between 2015 and 2016.
31.8%
27.0%
20.5%
16.1%
4.0% 0.6%
Hydroelectric Generation Employment by Industry
Manufacturing
Utilities
Construction
Professional Services
Wholesale Trade
Other
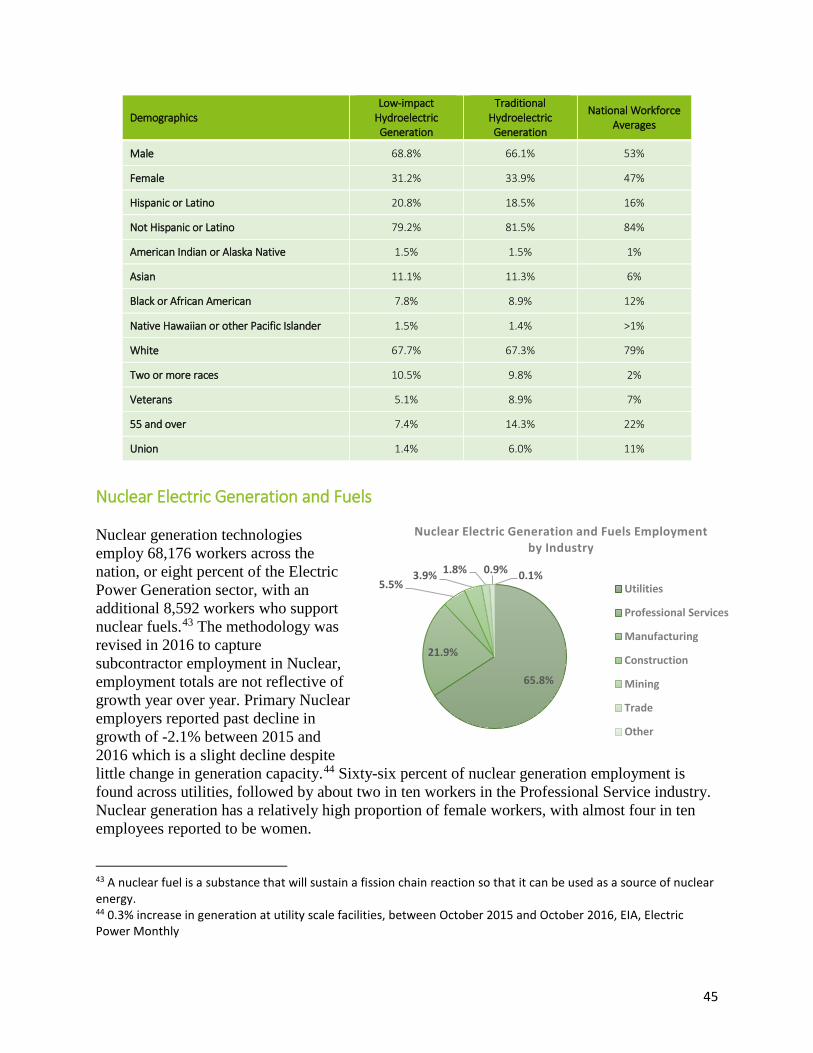
45
Demographics Low-impact
Hydroelectric Generation
Traditional Hydroelectric Generation
National Workforce Averages
Male 68.8% 66.1% 53%
Female 31.2% 33.9% 47%
Hispanic or Latino 20.8% 18.5% 16%
Not Hispanic or Latino 79.2% 81.5% 84%
American Indian or Alaska Native 1.5% 1.5% 1%
Asian 11.1% 11.3% 6%
Black or African American 7.8% 8.9% 12%
Native Hawaiian or other Pacific Islander 1.5% 1.4% >1%
White 67.7% 67.3% 79%
Two or more races 10.5% 9.8% 2%
Veterans 5.1% 8.9% 7%
55 and over 7.4% 14.3% 22%
Union 1.4% 6.0% 11%
Nuclear Electric Generation and Fuels Nuclear generation technologies employ 68,176 workers across the nation, or eight percent of the Electric Power Generation sector, with an additional 8,592 workers who support nuclear fuels.43 The methodology was revised in 2016 to capture subcontractor employment in Nuclear, employment totals are not reflective of growth year over year. Primary Nuclear employers reported past decline in growth of -2.1% between 2015 and 2016 which is a slight decline despite little change in generation capacity.44 Sixty-six percent of nuclear generation employment is found across utilities, followed by about two in ten workers in the Professional Service industry. Nuclear generation has a relatively high proportion of female workers, with almost four in ten employees reported to be women.
43 A nuclear fuel is a substance that will sustain a fission chain reaction so that it can be used as a source of nuclear energy. 44 0.3% increase in generation at utility scale facilities, between October 2015 and October 2016, EIA, Electric Power Monthly
65.8%
21.9%
5.5%3.9% 1.8% 0.9% 0.1%
Nuclear Electric Generation and Fuels Employment by Industry
Utilities
Professional Services
Manufacturing
Construction
Mining
Trade
Other

46
Demographics Nuclear Electric
Generation Nuclear
Fuels National Workforce
Averages
Male 61.9% 71.2% 53%
Female 38.1% 28.8% 47%
Hispanic or Latino 13.9% 16.1% 16%
Not Hispanic or Latino 86.1% 83.9% 84%
American Indian or Alaska Native 1.4% 1.4% 1%
Asian 11.1% 9.1% 6%
Black or African American 11.5% 6.1% 12%
Native Hawaiian or other Pacific Islander 1.0% 1.0% >1%
White 66.8% 74.2% 79%
Two or more races 8.1% 8.2% 2%
Veterans 5.1% 8.4% 7%
55 and over 12.2% 18.4% 22%
Union 9.7% 3.5% 11%
Bioenergy/Biomass Electric Generation and Biofuels Bioenergy electric generation and biofuel sub-technologies employ a total of 112,642 workers. The generation sector is a small component of the overall bioenergy and biofuel workforce. Only 7,980 of these individuals work exclusively with bioenergy or biomass electric generation technologies, while the remainder work across each of the fuel technologies discussed below. Most employment for bioenergy and biomass generation is encompassed in the construction industry, followed by utilities. Bioenergy/biomass electric generation technologies employ more women than each of the individual biofuel technologies. The generation sector is also more diverse than each of the component fuels, employing both more Hispanic or Latino and Asian individuals.
63.7%18.8%
14.1%
3.5%
Bioenergy/Biomass Electric Generation Employment by Industry
Construction
Utilities
Professional Services
Manufacturing
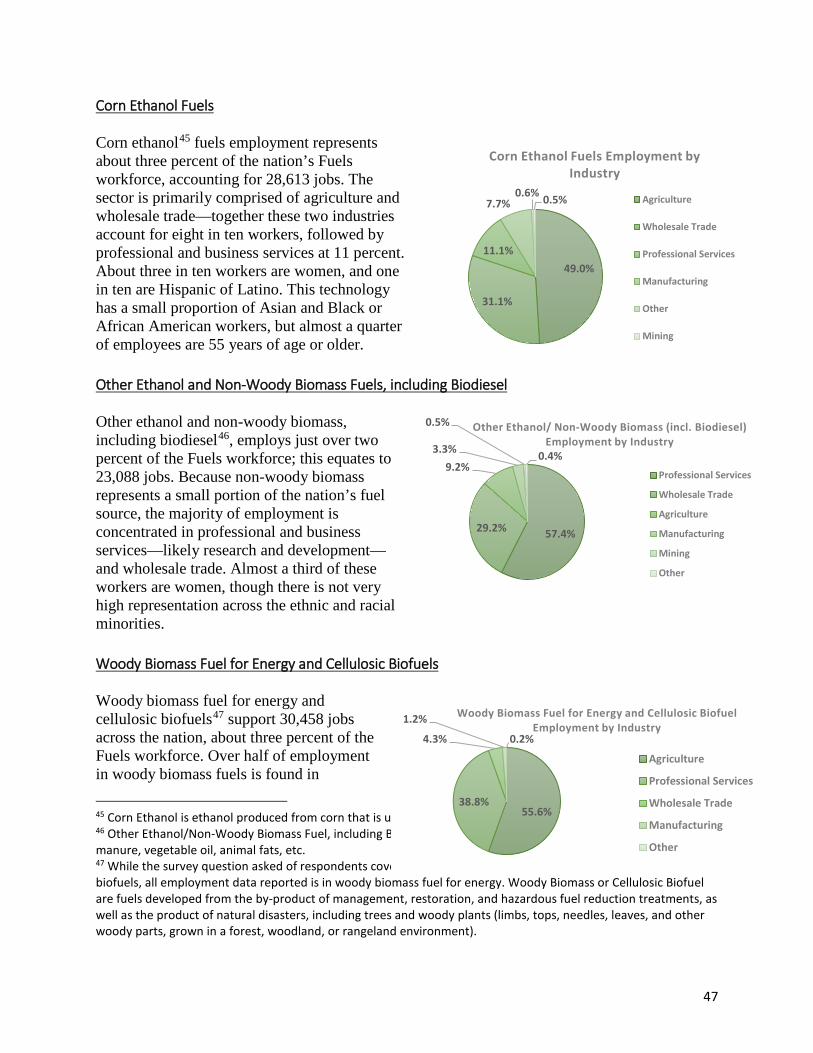
47
Corn Ethanol Fuels Corn ethanol45 fuels employment represents about three percent of the nation’s Fuels workforce, accounting for 28,613 jobs. The sector is primarily comprised of agriculture and wholesale trade—together these two industries account for eight in ten workers, followed by professional and business services at 11 percent. About three in ten workers are women, and one in ten are Hispanic of Latino. This technology has a small proportion of Asian and Black or African American workers, but almost a quarter of employees are 55 years of age or older. Other Ethanol and Non-Woody Biomass Fuels, including Biodiesel Other ethanol and non-woody biomass, including biodiesel46, employs just over two percent of the Fuels workforce; this equates to 23,088 jobs. Because non-woody biomass represents a small portion of the nation’s fuel source, the majority of employment is concentrated in professional and business services—likely research and development—and wholesale trade. Almost a third of these workers are women, though there is not very high representation across the ethnic and racial minorities. Woody Biomass Fuel for Energy and Cellulosic Biofuels Woody biomass fuel for energy and cellulosic biofuels47 support 30,458 jobs across the nation, about three percent of the Fuels workforce. Over half of employment in woody biomass fuels is found in 45 Corn Ethanol is ethanol produced from corn that is used as a biomass. 46 Other Ethanol/Non-Woody Biomass Fuel, including Biodiesel is fuel made from other materials such as straw, manure, vegetable oil, animal fats, etc. 47 While the survey question asked of respondents covered both woody biomass fuel for energy and cellulosic biofuels, all employment data reported is in woody biomass fuel for energy. Woody Biomass or Cellulosic Biofuel are fuels developed from the by-product of management, restoration, and hazardous fuel reduction treatments, as well as the product of natural disasters, including trees and woody plants (limbs, tops, needles, leaves, and other woody parts, grown in a forest, woodland, or rangeland environment).
49.0%
31.1%
11.1%
7.7%0.6% 0.5%
Corn Ethanol Fuels Employment by Industry
Agriculture
Wholesale Trade
Professional Services
Manufacturing
Other
Mining
57.4%29.2%
9.2%3.3%
0.5%
0.4%
Other Ethanol/ Non-Woody Biomass (incl. Biodiesel) Employment by Industry
Professional Services
Wholesale Trade
Agriculture
Manufacturing
Mining
Other
55.6%38.8%
4.3%
1.2%
0.2%
Woody Biomass Fuel for Energy and Cellulosic BiofuelEmployment by Industry
Agriculture
Professional Services
Wholesale Trade
Manufacturing
Other
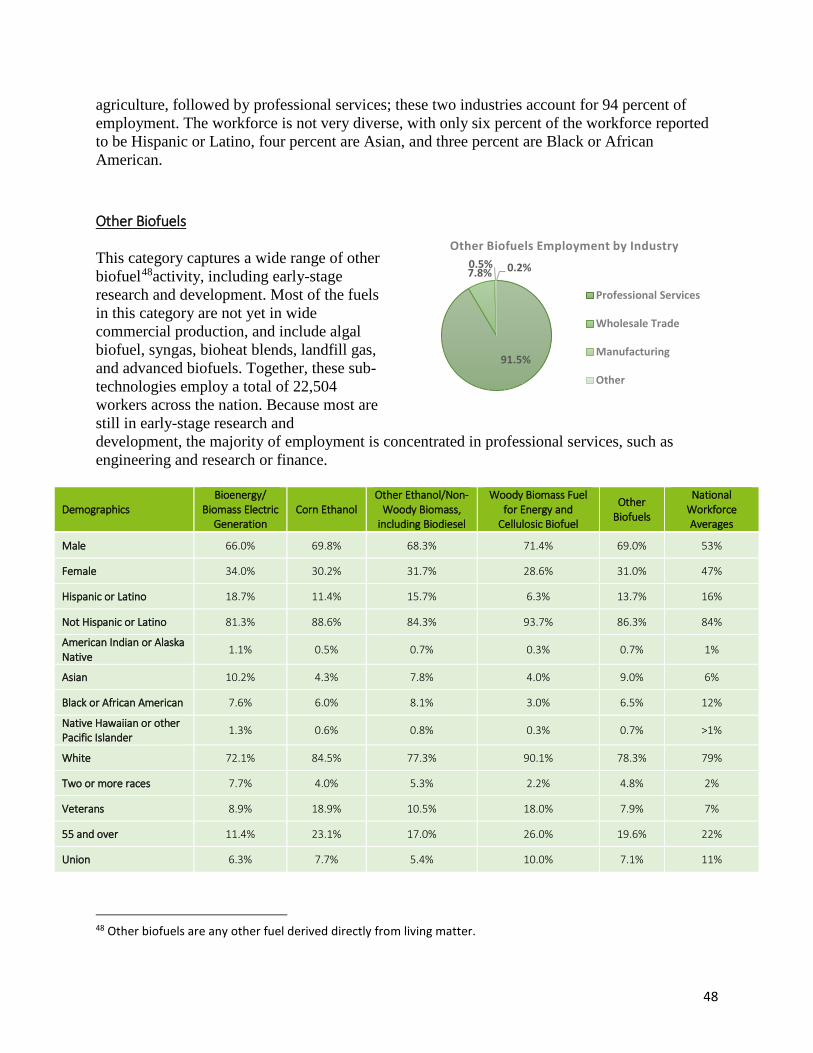
48
agriculture, followed by professional services; these two industries account for 94 percent of employment. The workforce is not very diverse, with only six percent of the workforce reported to be Hispanic or Latino, four percent are Asian, and three percent are Black or African American.
Other Biofuels This category captures a wide range of other biofuel48activity, including early-stage research and development. Most of the fuels in this category are not yet in wide commercial production, and include algal biofuel, syngas, bioheat blends, landfill gas, and advanced biofuels. Together, these sub-technologies employ a total of 22,504 workers across the nation. Because most are still in early-stage research and development, the majority of employment is concentrated in professional services, such as engineering and research or finance.
Demographics Bioenergy/
Biomass Electric Generation
Corn Ethanol Other Ethanol/Non-
Woody Biomass, including Biodiesel
Woody Biomass Fuel for Energy and
Cellulosic Biofuel
Other Biofuels
National Workforce Averages
Male 66.0% 69.8% 68.3% 71.4% 69.0% 53%
Female 34.0% 30.2% 31.7% 28.6% 31.0% 47%
Hispanic or Latino 18.7% 11.4% 15.7% 6.3% 13.7% 16%
Not Hispanic or Latino 81.3% 88.6% 84.3% 93.7% 86.3% 84%
American Indian or Alaska Native
1.1% 0.5% 0.7% 0.3% 0.7% 1%
Asian 10.2% 4.3% 7.8% 4.0% 9.0% 6%
Black or African American 7.6% 6.0% 8.1% 3.0% 6.5% 12%
Native Hawaiian or other Pacific Islander
1.3% 0.6% 0.8% 0.3% 0.7% >1%
White 72.1% 84.5% 77.3% 90.1% 78.3% 79%
Two or more races 7.7% 4.0% 5.3% 2.2% 4.8% 2%
Veterans 8.9% 18.9% 10.5% 18.0% 7.9% 7%
55 and over 11.4% 23.1% 17.0% 26.0% 19.6% 22%
Union 6.3% 7.7% 5.4% 10.0% 7.1% 11%
48 Other biofuels are any other fuel derived directly from living matter.
91.5%
7.8%0.5% 0.2%
Other Biofuels Employment by Industry
Professional Services
Wholesale Trade
Manufacturing
Other
49
Introduction Electric power transmission and distribution, often referenced as “the grid”, is the bulk transfer of electricity from power plant supply to centers of demand. Transmission, Distribution, and Storage encompasses the entire network of power lines that transmit electricity from generating stations to customers as well as activities that support power and pipeline construction, fuel distribution and transport, and electrical transmission equipment manufacturing. Since electric provision is fundamentally dependent on source of supply, transmission and distribution is often thought of in conjunction with utility generation. However, the designation of business activity is variable across these sectors. While Electric Power Generation and Fuels rely more heavily on mining, agriculture, and semiconductor manufacturers, electrical supply depends on fuel transport and power line construction. In addition, fuels transportation also supports non-electric heat production for commercial and residential use and motor vehicle usage. Several NAICS codes actively track employment across utility transmission, including natural gas distribution, as well as electrical transmission line construction and fossil fuel pipeline transportation. The sector’s remaining employment is found within energy-related industry subsectors in construction, manufacturing, and wholesale trade. Summary Transmission, Distribution, and Storage technologies employ more than 2.3 million workers across the nation. About 36 percent of this employment is contained across utilities and construction firms,49 while approximately 982,000 employees work in retail trade and distribution in this sector, with about 906,000 of these working at gasoline stations.50 Just over 18 percent of the 2.3 million workers are employed by construction companies to construct pipeline and other infrastructure that support the Transmission, Distribution, and Storage sector, including both fuels and electricity.51 This is up significantly from last year,
49 Hydrogen and fuel cell technologies are split among motor vehicles, storage, and other generation, depending on application – however, the numbers were too small to report separately within the latter two. 50 Bureau of Labor Statistics, Quarterly Census of Employment and Wages 2016 Q1 51 This includes transportation employment which is calculated using commodity flow data and employment data on rail, truck, air, and sea transportation.

50
demonstrating the growing use of construction firms as subcontractors to the utility sector. Overall, 31.5 percent of respondent employers working in Transmission, Distribution, and Storage reported that a majority of their revenues come from grid modernization or other utility-funded modernization projects. Employers project to hire workers at a rate of six percent over the next 12 months. Figure 19. Transmission, Distribution, and Storage Employment by Industry Sectors, Q2 2015 - Q1 201652
Transmission, Distribution, and Storage Employment by Industry Transmission, Distribution, and Storage, a key segment of the nation’s energy infrastructure, employs 1,317,032 workers. As noted, an additional 982,513 work in Retail industries such as fuel dealers (76,030), gasoline stations with convenience stores (802,030) and other gasoline
52 It should be noted that any changes in the manufacturing industry are not directly comparable to employment totals from the 2016 report. The USEER 2017 significantly improved its methodology and scope to capture more manufacturing jobs. As a result, changes in the methodology account for the majority of the apparent and observed growth, if compared to 2016 data.
415,206
352,535
8,235
235,529
36,411
408,016 424,593
90,733
242,078
133,047
18,566
Utilities Construction Manufacturing Wholesale Trade,
Distribution, and Transport
Professional and Business Services
Other
2015
2016
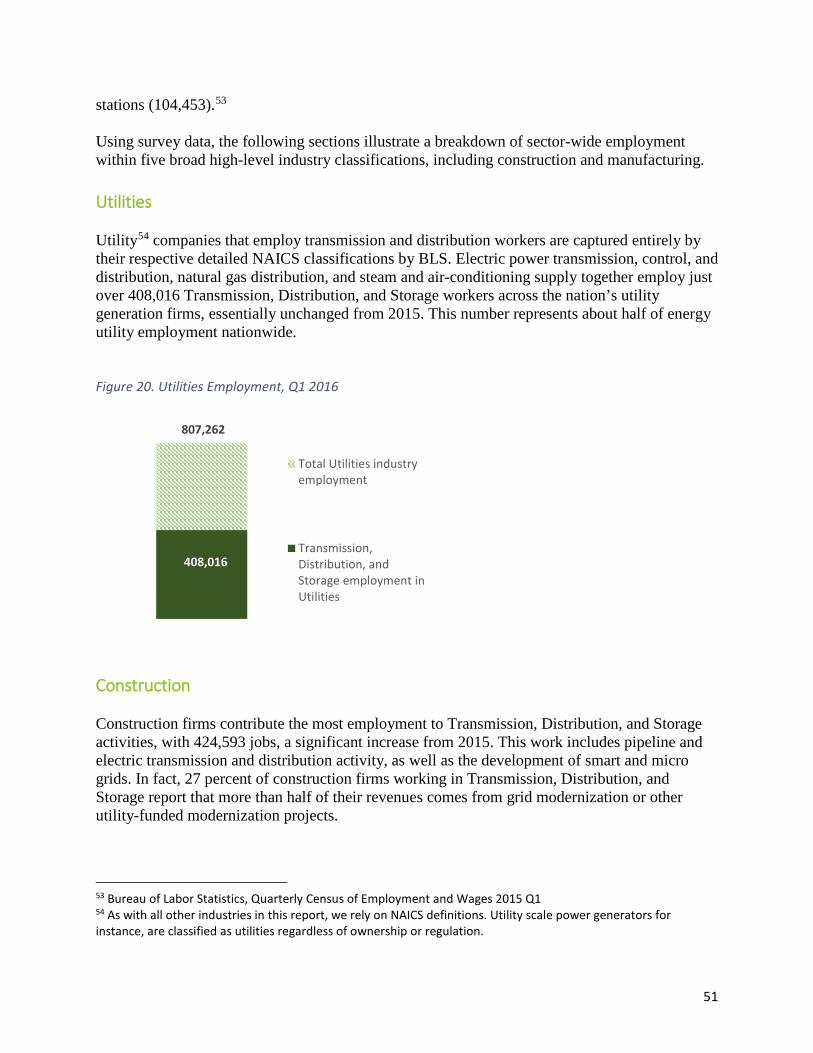
51
stations (104,453).53 Using survey data, the following sections illustrate a breakdown of sector-wide employment within five broad high-level industry classifications, including construction and manufacturing. Utilities Utility54 companies that employ transmission and distribution workers are captured entirely by their respective detailed NAICS classifications by BLS. Electric power transmission, control, and distribution, natural gas distribution, and steam and air-conditioning supply together employ just over 408,016 Transmission, Distribution, and Storage workers across the nation’s utility generation firms, essentially unchanged from 2015. This number represents about half of energy utility employment nationwide. Figure 20. Utilities Employment, Q1 2016
Construction Construction firms contribute the most employment to Transmission, Distribution, and Storage activities, with 424,593 jobs, a significant increase from 2015. This work includes pipeline and electric transmission and distribution activity, as well as the development of smart and micro grids. In fact, 27 percent of construction firms working in Transmission, Distribution, and Storage report that more than half of their revenues comes from grid modernization or other utility-funded modernization projects.
53 Bureau of Labor Statistics, Quarterly Census of Employment and Wages 2015 Q1 54 As with all other industries in this report, we rely on NAICS definitions. Utility scale power generators for instance, are classified as utilities regardless of ownership or regulation.
807,262
408,016
Total Utilities industryemployment
Transmission,Distribution, andStorage employment inUtilities

52
Figure 21. Construction Employment, Q1 2016
Manufacturing The manufacturing of Transmission, Distribution, and Storage technologies is not entirely captured by a single NAICS classification in BLS data, and, as with other manufacturing data, are traditionally more difficult to classify. The USEER 2017 significantly improved its methodology and scope to capture more of these manufacturing jobs. As a result, comparisons to USEER 2016 are not recommended, as change in methodology accounts for the majority of the growth. Over the last year, in fact, manufacturers primarily focused on Electric Power and Fuel Transmission, Distribution, and Storage technologies reported employment declines equal to five percent from a year prior. The manufacturing jobs in Transmission, Distribution, and Storage are found within several energy-related detailed manufacturing industries. These include bulk manufacturing firms that assemble storage batteries, current-carrying wiring devices, air and gas compressors, sheet metal, and other electrical and non-electrical equipment or components. Of the nation’s total 12.4 million manufacturing jobs, almost 7 percent or nearly 829,000 are contained within such energy-related detailed industries that may support transmission-related infrastructure and 11 percent, or nearly 91,000 workers, produce products for Transmission, Distribution, and Storage.
6,548,517
1,241,144 424,593
Construction
Total Constructionindustry employment
Construction Sub-Sectorswith Energy-relatedemployment
Transmission, Distribution,and Storage employmentin Construction
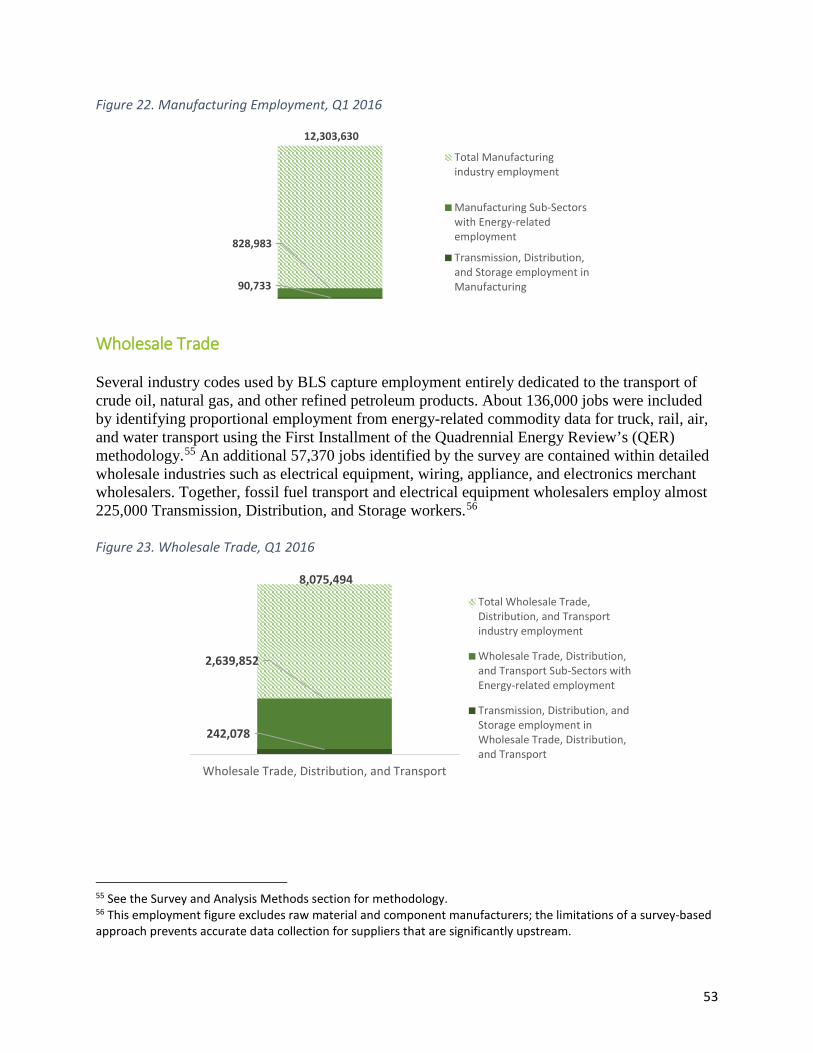
53
Figure 22. Manufacturing Employment, Q1 2016
Wholesale Trade Several industry codes used by BLS capture employment entirely dedicated to the transport of crude oil, natural gas, and other refined petroleum products. About 136,000 jobs were included by identifying proportional employment from energy-related commodity data for truck, rail, air, and water transport using the First Installment of the Quadrennial Energy Review’s (QER) methodology.55 An additional 57,370 jobs identified by the survey are contained within detailed wholesale industries such as electrical equipment, wiring, appliance, and electronics merchant wholesalers. Together, fossil fuel transport and electrical equipment wholesalers employ almost 225,000 Transmission, Distribution, and Storage workers.56 Figure 23. Wholesale Trade, Q1 2016
55 See the Survey and Analysis Methods section for methodology. 56 This employment figure excludes raw material and component manufacturers; the limitations of a survey-based approach prevents accurate data collection for suppliers that are significantly upstream.
12,303,630
828,983
90,733
Total Manufacturingindustry employment
Manufacturing Sub-Sectorswith Energy-relatedemployment
Transmission, Distribution,and Storage employment inManufacturing
8,075,494
2,639,852
242,078
Wholesale Trade, Distribution, and Transport
Total Wholesale Trade,Distribution, and Transportindustry employment
Wholesale Trade, Distribution,and Transport Sub-Sectors withEnergy-related employment
Transmission, Distribution, andStorage employment inWholesale Trade, Distribution,and Transport
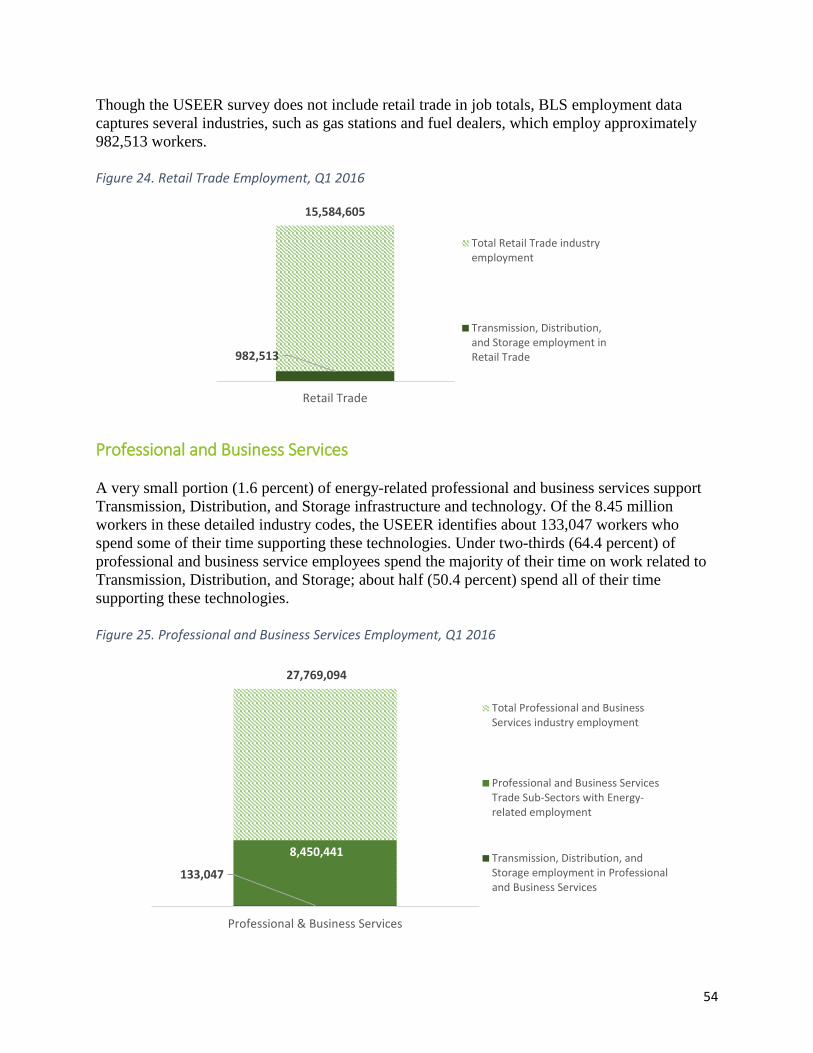
54
Though the USEER survey does not include retail trade in job totals, BLS employment data captures several industries, such as gas stations and fuel dealers, which employ approximately 982,513 workers. Figure 24. Retail Trade Employment, Q1 2016
Professional and Business Services A very small portion (1.6 percent) of energy-related professional and business services support Transmission, Distribution, and Storage infrastructure and technology. Of the 8.45 million workers in these detailed industry codes, the USEER identifies about 133,047 workers who spend some of their time supporting these technologies. Under two-thirds (64.4 percent) of professional and business service employees spend the majority of their time on work related to Transmission, Distribution, and Storage; about half (50.4 percent) spend all of their time supporting these technologies. Figure 25. Professional and Business Services Employment, Q1 2016
15,584,605
982,513
Retail Trade
Total Retail Trade industryemployment
Transmission, Distribution,and Storage employment inRetail Trade
27,769,094
8,450,441
133,047
Professional & Business Services
Total Professional and BusinessServices industry employment
Professional and Business ServicesTrade Sub-Sectors with Energy-related employment
Transmission, Distribution, andStorage employment in Professionaland Business Services
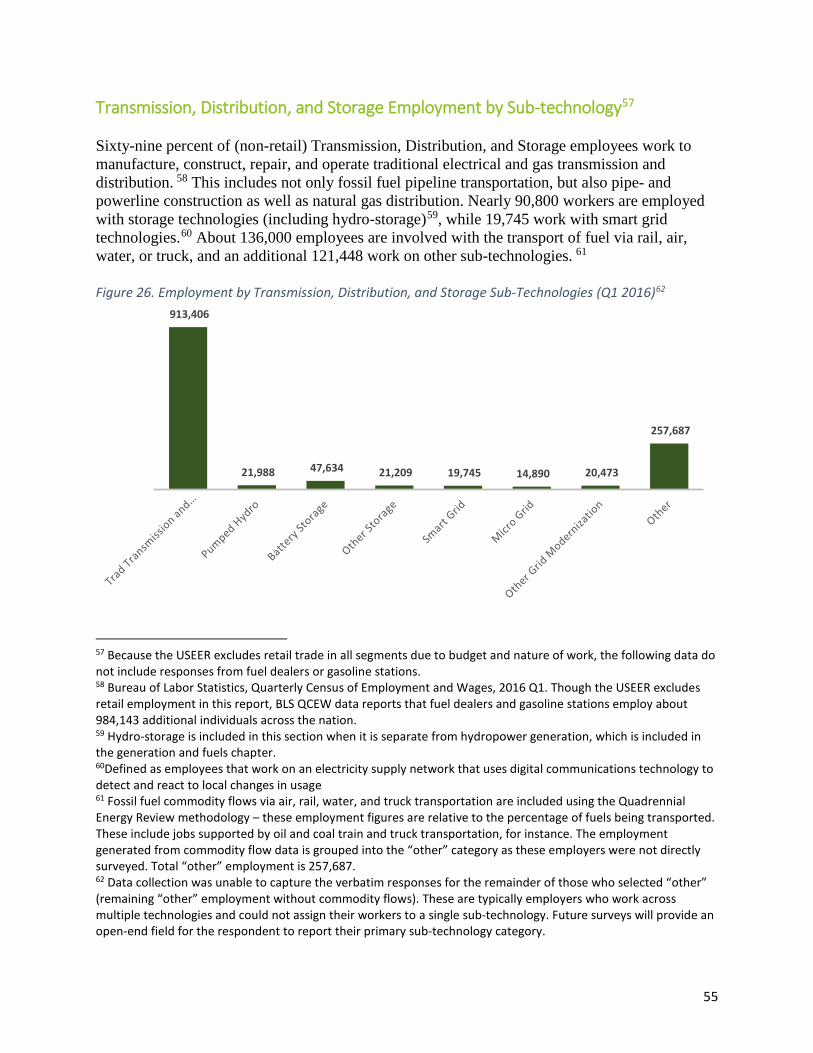
55
Transmission, Distribution, and Storage Employment by Sub-technology57 Sixty-nine percent of (non-retail) Transmission, Distribution, and Storage employees work to manufacture, construct, repair, and operate traditional electrical and gas transmission and distribution. 58 This includes not only fossil fuel pipeline transportation, but also pipe- and powerline construction as well as natural gas distribution. Nearly 90,800 workers are employed with storage technologies (including hydro-storage)59, while 19,745 work with smart grid technologies.60 About 136,000 employees are involved with the transport of fuel via rail, air, water, or truck, and an additional 121,448 work on other sub-technologies. 61 Figure 26. Employment by Transmission, Distribution, and Storage Sub-Technologies (Q1 2016)62
57 Because the USEER excludes retail trade in all segments due to budget and nature of work, the following data do not include responses from fuel dealers or gasoline stations. 58 Bureau of Labor Statistics, Quarterly Census of Employment and Wages, 2016 Q1. Though the USEER excludes retail employment in this report, BLS QCEW data reports that fuel dealers and gasoline stations employ about 984,143 additional individuals across the nation. 59 Hydro-storage is included in this section when it is separate from hydropower generation, which is included in the generation and fuels chapter. 60Defined as employees that work on an electricity supply network that uses digital communications technology to detect and react to local changes in usage 61 Fossil fuel commodity flows via air, rail, water, and truck transportation are included using the Quadrennial Energy Review methodology – these employment figures are relative to the percentage of fuels being transported. These include jobs supported by oil and coal train and truck transportation, for instance. The employment generated from commodity flow data is grouped into the “other” category as these employers were not directly surveyed. Total “other” employment is 257,687. 62 Data collection was unable to capture the verbatim responses for the remainder of those who selected “other” (remaining “other” employment without commodity flows). These are typically employers who work across multiple technologies and could not assign their workers to a single sub-technology. Future surveys will provide an open-end field for the respondent to report their primary sub-technology category.
913,406
21,988 47,634 21,209 19,745 14,890 20,473
257,687

56
Figure 27. Transmission, Distribution, and Storage Sub-Technologies, Q2 2015 - Q1 201663
Professional and business services firms within Transmission, Distribution, and Storage reported expected growth of nearly 18% by the end of 2017. Figure 28: Expected Employment Growth by Industry (Q4 2016 – Q4 2017)64
Transmission, Distribution, and Storage – Workforce Characteristics Roughly one quarter of Transmission, Distribution, and Storage employees across the nation are women and one in ten are African American. Commodity flow employment is not included in this section as commodity flow employers were not directly surveyed for USEER 2017. 63 The change in employment for storage is due to methodological improvements and not representative of actual growth. 64 This does not include commodity flow employers, as they were not surveyed for USEER 2017.
832,290
27,140 12,880
173,605
913,406
90,831 19,745
293,050
Traditional Transmission
Storage Smart Grid Other
2015 2016
3.7%4.8%
3.8%6.0%
17.9%
11.0%
Utilities Construction Manufacturing Wholesale Trade, Distribution, and
Transport
Professional and Business Services
Other
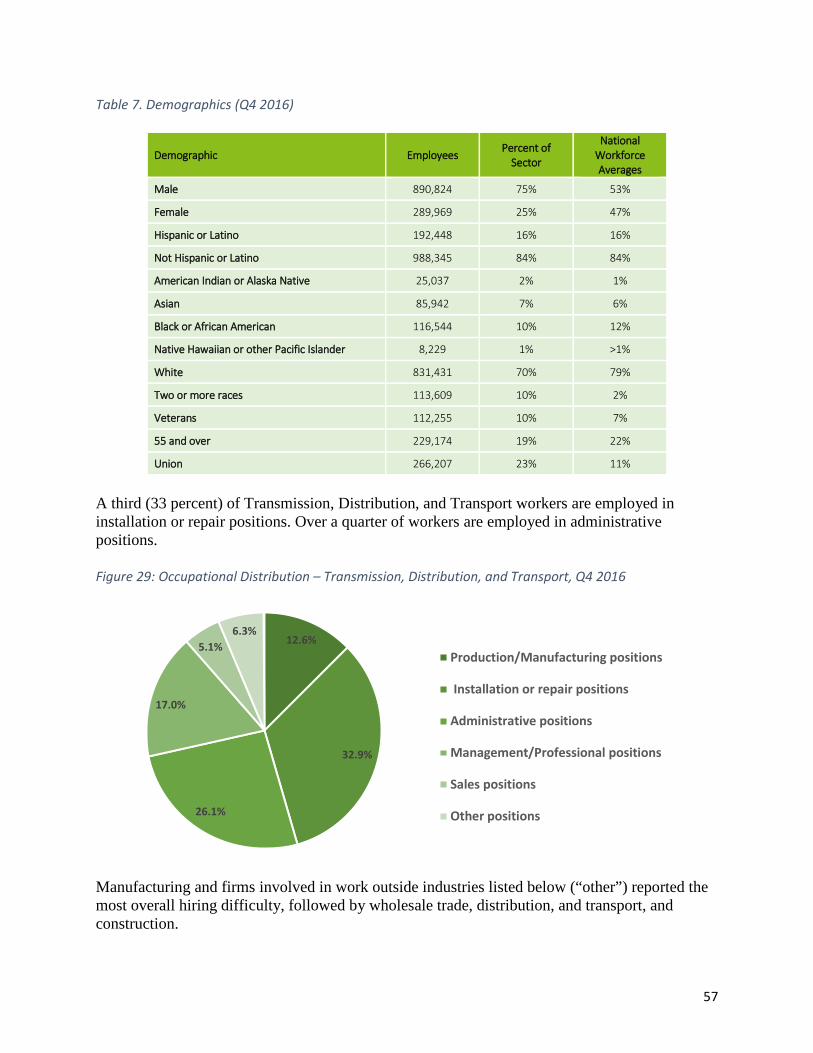
57
Table 7. Demographics (Q4 2016)
Demographic Employees Percent of
Sector
National Workforce Averages
Male 890,824 75% 53%
Female 289,969 25% 47%
Hispanic or Latino 192,448 16% 16%
Not Hispanic or Latino 988,345 84% 84%
American Indian or Alaska Native 25,037 2% 1%
Asian 85,942 7% 6%
Black or African American 116,544 10% 12%
Native Hawaiian or other Pacific Islander 8,229 1% >1%
White 831,431 70% 79%
Two or more races 113,609 10% 2%
Veterans 112,255 10% 7%
55 and over 229,174 19% 22%
Union 266,207 23% 11%
A third (33 percent) of Transmission, Distribution, and Transport workers are employed in installation or repair positions. Over a quarter of workers are employed in administrative positions. Figure 29: Occupational Distribution – Transmission, Distribution, and Transport, Q4 2016
Manufacturing and firms involved in work outside industries listed below (“other”) reported the most overall hiring difficulty, followed by wholesale trade, distribution, and transport, and construction.
12.6%
32.9%
26.1%
17.0%
5.1%6.3%
Production/Manufacturing positions
Installation or repair positions
Administrative positions
Management/Professional positions
Sales positions
Other positions
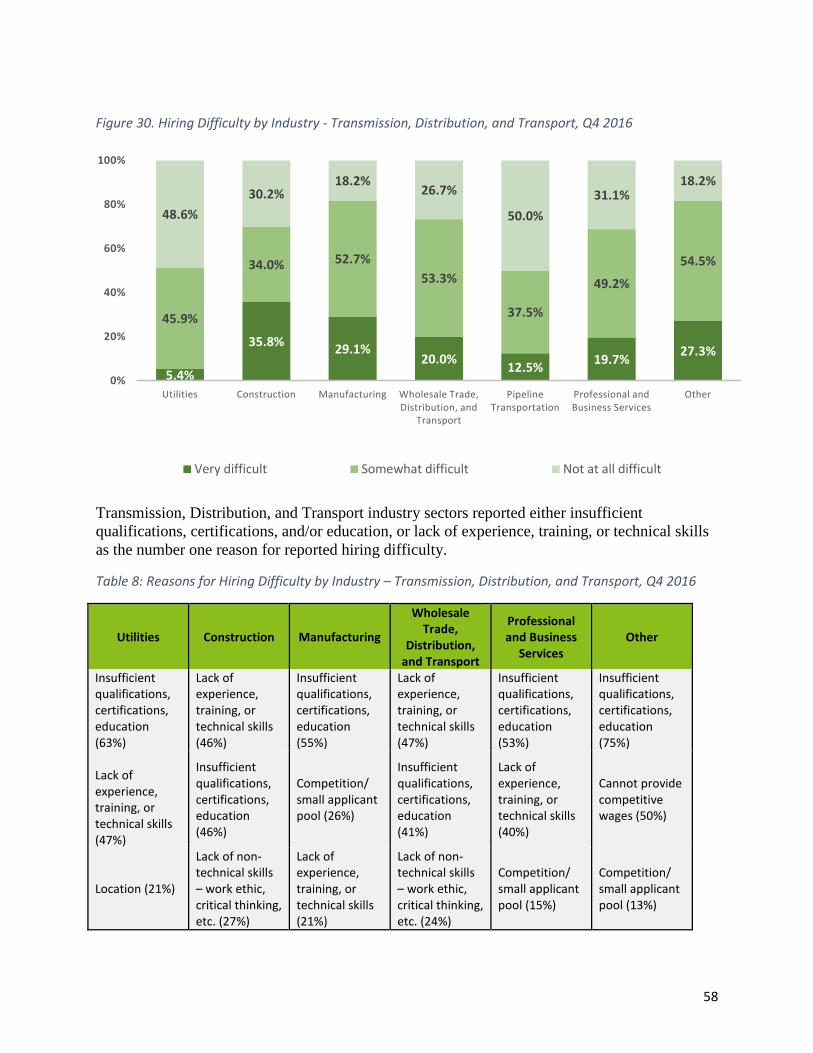
58
Figure 30. Hiring Difficulty by Industry - Transmission, Distribution, and Transport, Q4 2016
Transmission, Distribution, and Transport industry sectors reported either insufficient qualifications, certifications, and/or education, or lack of experience, training, or technical skills as the number one reason for reported hiring difficulty.
Table 8: Reasons for Hiring Difficulty by Industry – Transmission, Distribution, and Transport, Q4 2016
Utilities Construction Manufacturing
Wholesale Trade,
Distribution, and Transport
Professional and Business
Services Other
Insufficient qualifications, certifications, education (63%)
Lack of experience, training, or technical skills (46%)
Insufficient qualifications, certifications, education (55%)
Lack of experience, training, or technical skills (47%)
Insufficient qualifications, certifications, education (53%)
Insufficient qualifications, certifications, education (75%)
Lack of experience, training, or technical skills (47%)
Insufficient qualifications, certifications, education (46%)
Competition/ small applicant pool (26%)
Insufficient qualifications, certifications, education (41%)
Lack of experience, training, or technical skills (40%)
Cannot provide competitive wages (50%)
Location (21%)
Lack of non-technical skills – work ethic, critical thinking, etc. (27%)
Lack of experience, training, or technical skills (21%)
Lack of non-technical skills – work ethic, critical thinking, etc. (24%)
Competition/ small applicant pool (15%)
Competition/ small applicant pool (13%)
5.4%
35.8% 29.1%20.0% 12.5% 19.7% 27.3%
45.9%
34.0% 52.7%53.3%
37.5%
49.2%
54.5%
48.6%30.2%
18.2%26.7%
50.0%31.1%
18.2%
0%
20%
40%
60%
80%
100%
Utilities Construction Manufacturing Wholesale Trade, Distribution, and
Transport
Pipeline Transportation
Professional and Business Services
Other
Very difficult Somewhat difficult Not at all difficult
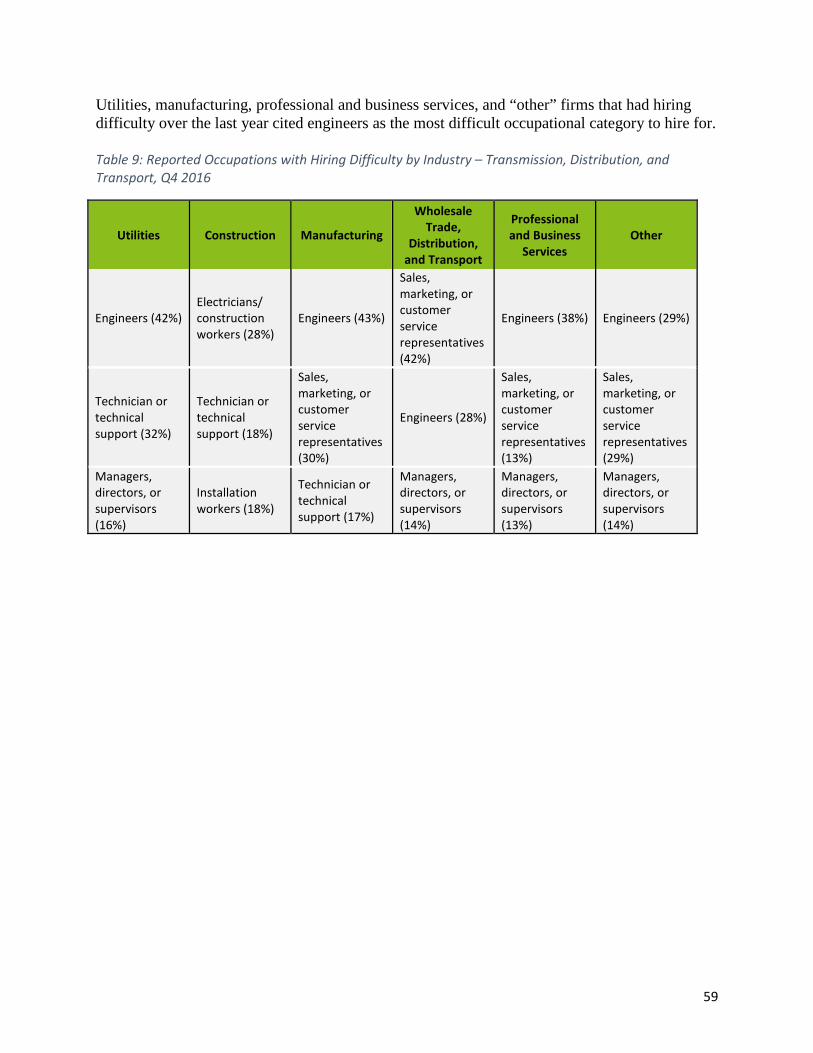
59
Utilities, manufacturing, professional and business services, and “other” firms that had hiring difficulty over the last year cited engineers as the most difficult occupational category to hire for. Table 9: Reported Occupations with Hiring Difficulty by Industry – Transmission, Distribution, and Transport, Q4 2016
Utilities Construction Manufacturing
Wholesale Trade,
Distribution, and Transport
Professional and Business
Services Other
Engineers (42%) Electricians/ construction workers (28%)
Engineers (43%)
Sales, marketing, or customer service representatives (42%)
Engineers (38%) Engineers (29%)
Technician or technical support (32%)
Technician or technical support (18%)
Sales, marketing, or customer service representatives (30%)
Engineers (28%)
Sales, marketing, or customer service representatives (13%)
Sales, marketing, or customer service representatives (29%)
Managers, directors, or supervisors (16%)
Installation workers (18%)
Technician or technical support (17%)
Managers, directors, or supervisors (14%)
Managers, directors, or supervisors (13%)
Managers, directors, or supervisors (14%)

60
Introduction There are no single NAICS codes that can be entirely allocated to Energy Efficiency employment. Thus, BLS has no specific data sets that exclusively count jobs in this sector. Energy Efficiency employment covers both the production of energy-saving products and the provision of services that reduce end-use energy consumption. These services include not only the manufacture of ENERGY STAR® appliances and other ENERGY STAR® labeled products, but also building design and contracting services that provide insulation, improve natural lighting, and reduce overall energy consumption across homes and businesses.65 However, the USEER only captures employment with certified66 energy efficiency products or those installed according to ENERGY STAR® guidelines, as well as advanced building materials such as insulation. The USEER Energy Efficiency employment figures include only work with these efficient technologies or building design and retrofits. The report does not capture employment related to energy-efficient manufacturing processes. Unlike 2016, however, it does capture employment associated with combined heat and power (CHP) and waste heat to power (WHP), though these technologies are included in the Electric Power Generation and Fuels chapter. In the meantime, please see the recently released Energy Productivity and Economic Prosperity Index for more information on manufacturing process efficiency.67 Demand growth for efficient technology and building upgrades has driven expansion across many traditional industries including construction trades, appliance manufacturing, building materials, lighting, and other energy-saving goods and services. As such, Energy Efficiency workers are found across many subsets of traditional industries. The 2017 USEER has identified approximately 2.2 million workers across the construction, manufacturing, wholesale trade, and professional and business service industries that spend some or all of their time working with energy-efficient technologies and services as defined earlier in this report.
65 Estimates do not include retail employment. 66 Environmental Protection Agency’s ENERGY STAR® Program certification 67 Blok, Kornelis, et al. The 2015 Energy Productivity and Economic Prosperity Index.
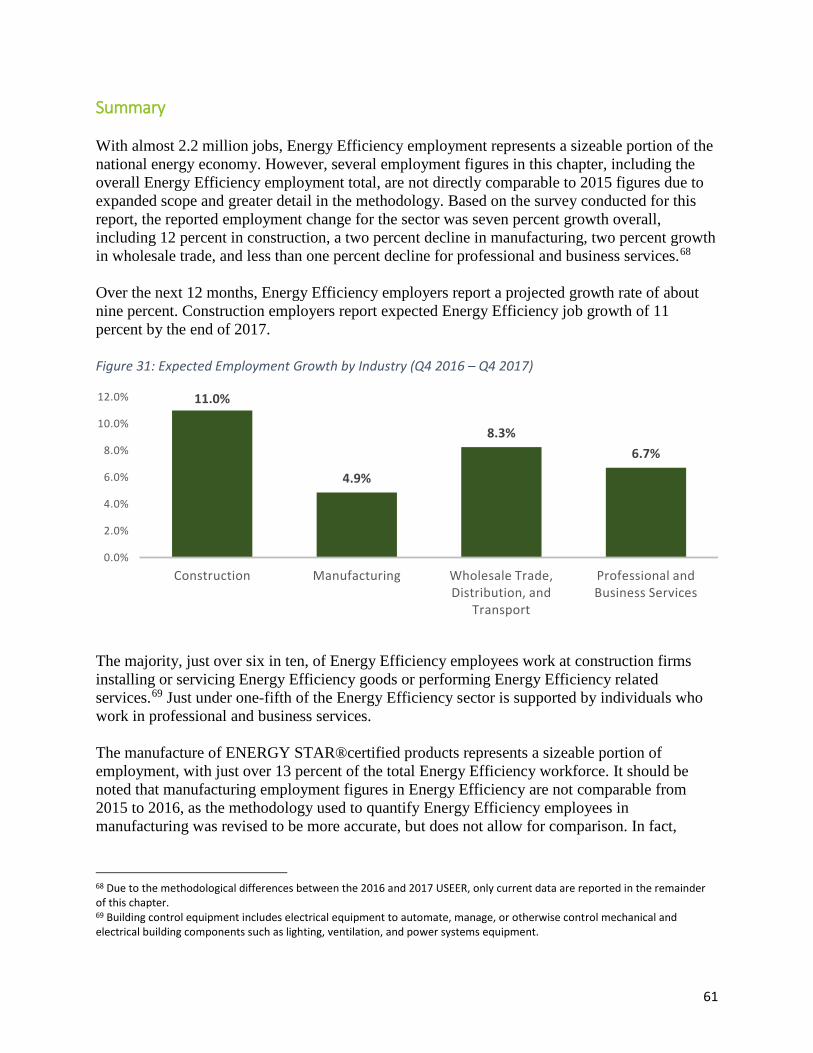
61
Summary With almost 2.2 million jobs, Energy Efficiency employment represents a sizeable portion of the national energy economy. However, several employment figures in this chapter, including the overall Energy Efficiency employment total, are not directly comparable to 2015 figures due to expanded scope and greater detail in the methodology. Based on the survey conducted for this report, the reported employment change for the sector was seven percent growth overall, including 12 percent in construction, a two percent decline in manufacturing, two percent growth in wholesale trade, and less than one percent decline for professional and business services.68 Over the next 12 months, Energy Efficiency employers report a projected growth rate of about nine percent. Construction employers report expected Energy Efficiency job growth of 11 percent by the end of 2017. Figure 31: Expected Employment Growth by Industry (Q4 2016 – Q4 2017)
The majority, just over six in ten, of Energy Efficiency employees work at construction firms installing or servicing Energy Efficiency goods or performing Energy Efficiency related services.69 Just under one-fifth of the Energy Efficiency sector is supported by individuals who work in professional and business services. The manufacture of ENERGY STAR®certified products represents a sizeable portion of employment, with just over 13 percent of the total Energy Efficiency workforce. It should be noted that manufacturing employment figures in Energy Efficiency are not comparable from 2015 to 2016, as the methodology used to quantify Energy Efficiency employees in manufacturing was revised to be more accurate, but does not allow for comparison. In fact,
68 Due to the methodological differences between the 2016 and 2017 USEER, only current data are reported in the remainder of this chapter. 69 Building control equipment includes electrical equipment to automate, manage, or otherwise control mechanical and electrical building components such as lighting, ventilation, and power systems equipment.
11.0%
4.9%
8.3%6.7%
0.0%
2.0%
4.0%
6.0%
8.0%
10.0%
12.0%
Construction Manufacturing Wholesale Trade, Distribution, and
Transport
Professional and Business Services
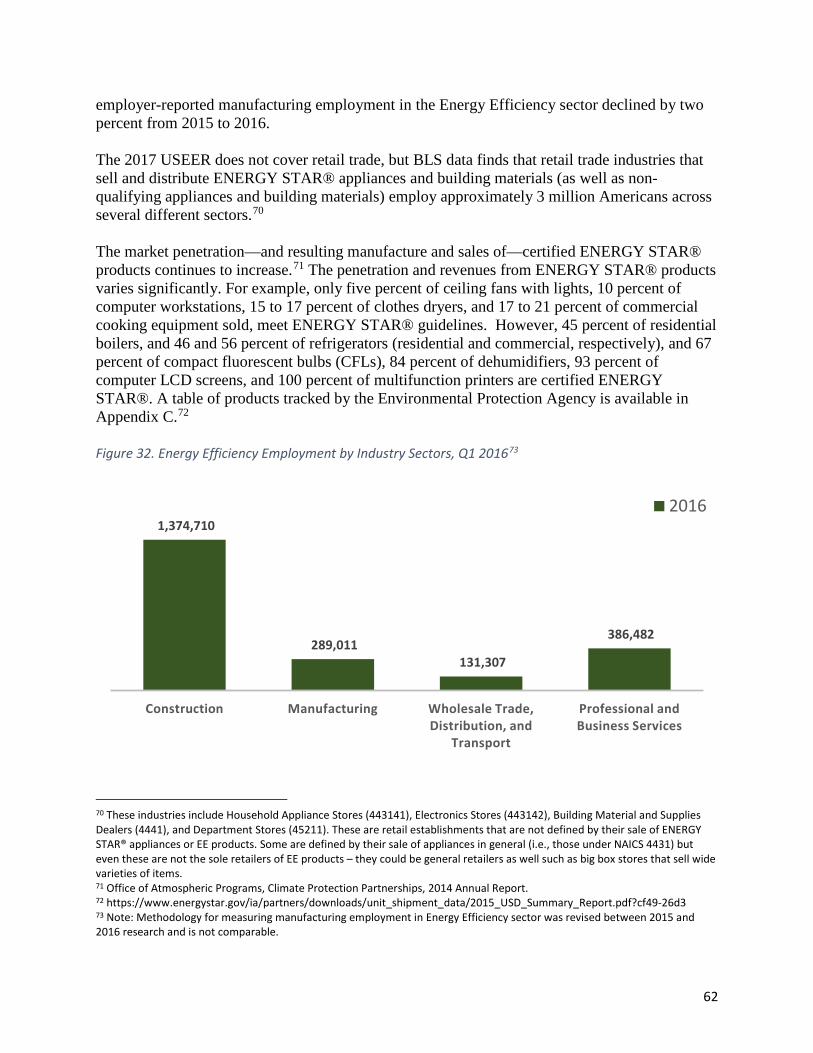
62
employer-reported manufacturing employment in the Energy Efficiency sector declined by two percent from 2015 to 2016. The 2017 USEER does not cover retail trade, but BLS data finds that retail trade industries that sell and distribute ENERGY STAR® appliances and building materials (as well as non-qualifying appliances and building materials) employ approximately 3 million Americans across several different sectors.70 The market penetration—and resulting manufacture and sales of—certified ENERGY STAR® products continues to increase.71 The penetration and revenues from ENERGY STAR® products varies significantly. For example, only five percent of ceiling fans with lights, 10 percent of computer workstations, 15 to 17 percent of clothes dryers, and 17 to 21 percent of commercial cooking equipment sold, meet ENERGY STAR® guidelines. However, 45 percent of residential boilers, and 46 and 56 percent of refrigerators (residential and commercial, respectively), and 67 percent of compact fluorescent bulbs (CFLs), 84 percent of dehumidifiers, 93 percent of computer LCD screens, and 100 percent of multifunction printers are certified ENERGY STAR®. A table of products tracked by the Environmental Protection Agency is available in Appendix C.72 Figure 32. Energy Efficiency Employment by Industry Sectors, Q1 201673
70 These industries include Household Appliance Stores (443141), Electronics Stores (443142), Building Material and Supplies Dealers (4441), and Department Stores (45211). These are retail establishments that are not defined by their sale of ENERGY STAR® appliances or EE products. Some are defined by their sale of appliances in general (i.e., those under NAICS 4431) but even these are not the sole retailers of EE products – they could be general retailers as well such as big box stores that sell wide varieties of items. 71 Office of Atmospheric Programs, Climate Protection Partnerships, 2014 Annual Report. 72 https://www.energystar.gov/ia/partners/downloads/unit_shipment_data/2015_USD_Summary_Report.pdf?cf49-26d3 73 Note: Methodology for measuring manufacturing employment in Energy Efficiency sector was revised between 2015 and 2016 research and is not comparable.
1,374,710
289,011 131,307
386,482
Construction Manufacturing Wholesale Trade, Distribution, and
Transport
Professional and Business Services
2016
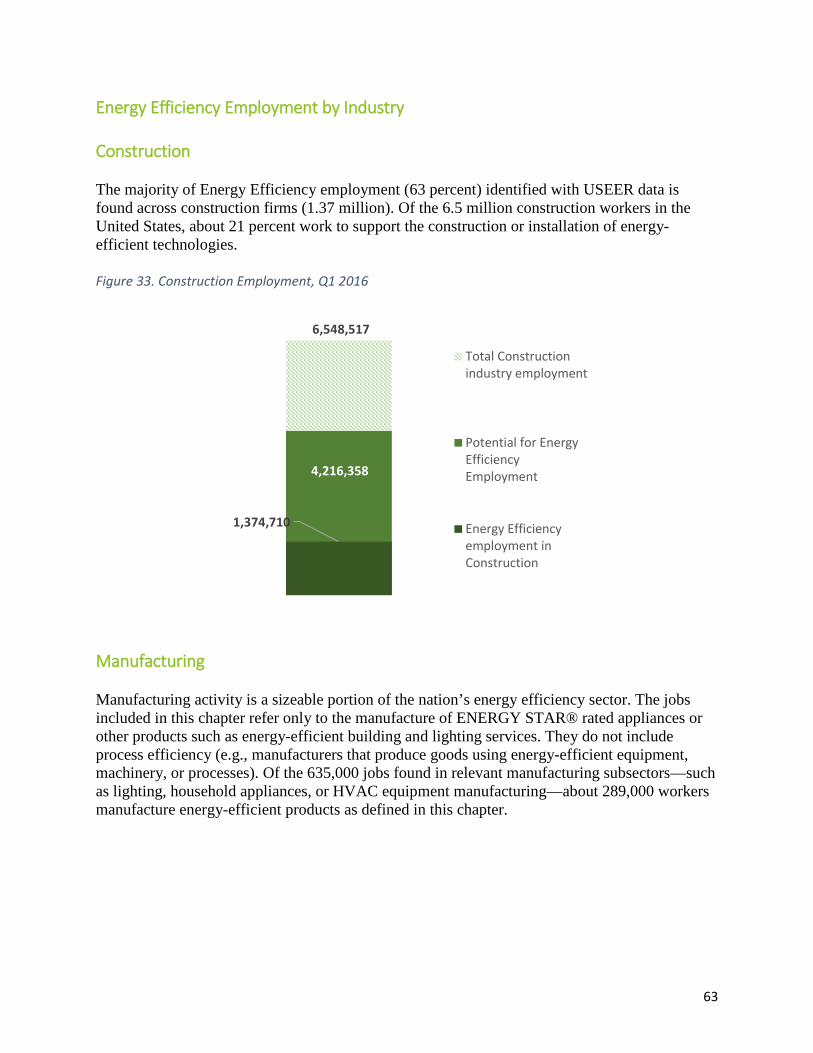
63
Energy Efficiency Employment by Industry Construction The majority of Energy Efficiency employment (63 percent) identified with USEER data is found across construction firms (1.37 million). Of the 6.5 million construction workers in the United States, about 21 percent work to support the construction or installation of energy-efficient technologies. Figure 33. Construction Employment, Q1 2016
Manufacturing Manufacturing activity is a sizeable portion of the nation’s energy efficiency sector. The jobs included in this chapter refer only to the manufacture of ENERGY STAR® rated appliances or other products such as energy-efficient building and lighting services. They do not include process efficiency (e.g., manufacturers that produce goods using energy-efficient equipment, machinery, or processes). Of the 635,000 jobs found in relevant manufacturing subsectors—such as lighting, household appliances, or HVAC equipment manufacturing—about 289,000 workers manufacture energy-efficient products as defined in this chapter.
6,548,517
4,216,358
1,374,710
Total Constructionindustry employment
Potential for EnergyEfficiencyEmployment
Energy Efficiencyemployment inConstruction

64
Figure 34. Manufacturing Employment (Q2 2015)
Wholesale Trade A small subset of the almost six million wholesale trade jobs across the nation are engaged in the trade and distribution of roofing, siding, and insulation material, household appliance, plumbing and heating, or HVAC equipment wholesalers; within these subsectors, a proportion of individuals are also working to supporting the trade of energy-efficient products. Of these 511,000 jobs, USEER survey data identifies about a quarter of workers are engaged in efficiency-related work. Figure 35. Wholesale Trade Employment (Q2 2015)
Professional and Business Services Approximately one in six professional and business service jobs may support the Energy Efficiency industry through finance, management, and legal services. Of these detailed subsectors, USEER survey data identifies nearly five percent of employees, or 386,000, work to support energy-efficient products and services.
12,303,630
635,439
289,011
Total Manufacturingindustry employment
Potential for EnergyEfficiencyEmployment
Energy Efficiencyemployment inManufacturing
5,811,665
511,033
131,307
Total WholesaleTrade industryemploymentPotential for EnergyEfficiencyEmploymentEnergy Efficiencyemployment inWholesale Trade

65
Figure 36. Professional and Business Services Employment (Q2 2015)
Energy Efficiency Employment by Technology ENERGY STAR® appliances, including high efficiency heating and cooling equipment, employs just over a quarter of the Energy Efficiency workforce. The second largest category of employment is found in the traditional heating, ventilation, or air-conditioning (HVAC) industry, with just under a quarter (24 percent) of the sector’s employment. These employees spend a majority of their time working with traditional HVAC goods and services, but a portion of their time is also dedicated to energy-efficient technologies. This is an important distinction, particularly with installers, because the majority of these employees would also have specific training in high-efficiency HVAC systems.74 The third largest category of employment is found in advanced building materials followed by energy-efficient lighting. In addition, construction75 firms working in the Energy Efficiency sector, have experienced an increase in the percentage of their workers who spend at least 50 percent of their time on energy efficiency-related work, from 64.8 percent in 2015 to 74.0 percent in 2016. Not only did the number of energy efficiency construction workers increase, but so did the amount of time each worker spent on efficiency-related work.
74 Unlike the installation and repair of ENERGY STAR® appliance, such as dishwashers, refrigerators, or other energy-efficient products, high-efficiency HVAC systems often have very specific certifications or training requirements in order to properly install and maintain. Manufacturers often require such certifications for warranty purposes, and EPA has a specific credentialing program for ENERGY STAR® heating and cooling (see: http://www.energystar.gov/index.cfm?c=bldrs_lenders_raters.nh_hvac_contractors_become). 75 Construction is the only industry in the Energy Efficiency sector that used a comparable survey methodology from 2015 to 2016 to allow for comparison of year to year results.
27,769,094
8,450,441
386,482
Professional & Business Services
Total Professional andBusiness Services industryemployment
Professional and BusinessServices Trade Sub-Sectorswith Energy-relatedemployment
Energy Efficiencyemployment in Professionaland Business Services
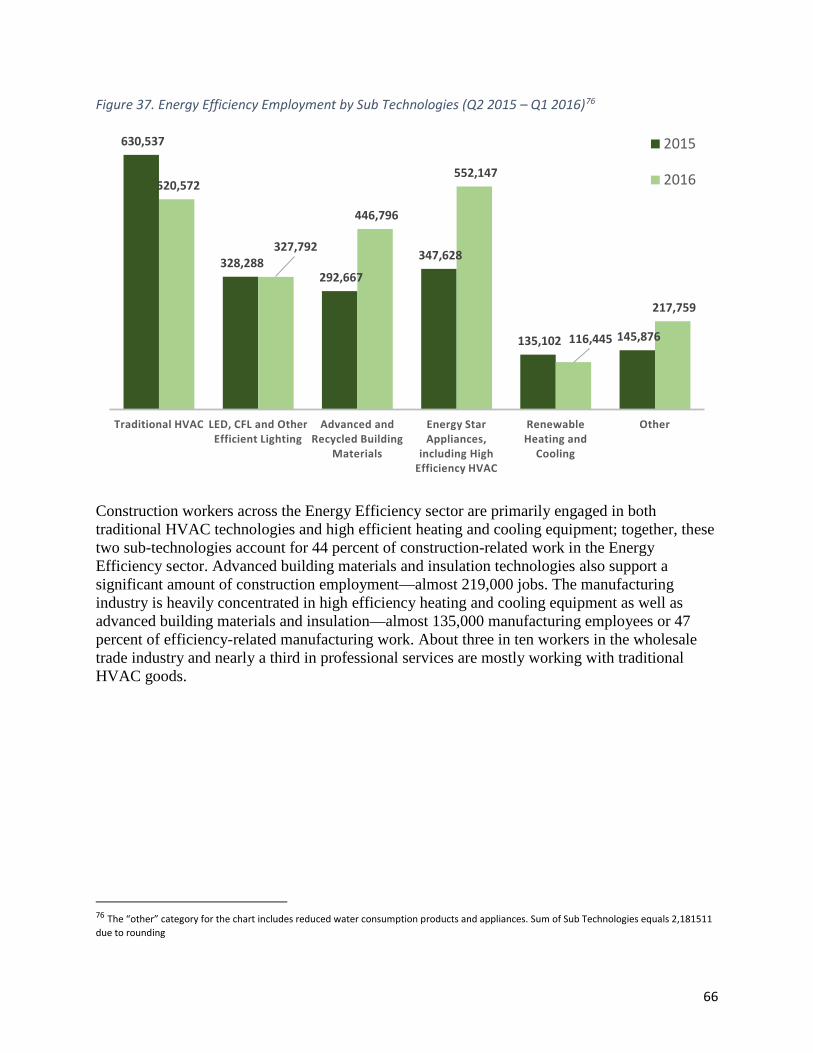
66
Figure 37. Energy Efficiency Employment by Sub Technologies (Q2 2015 – Q1 2016)76
Construction workers across the Energy Efficiency sector are primarily engaged in both traditional HVAC technologies and high efficient heating and cooling equipment; together, these two sub-technologies account for 44 percent of construction-related work in the Energy Efficiency sector. Advanced building materials and insulation technologies also support a significant amount of construction employment—almost 219,000 jobs. The manufacturing industry is heavily concentrated in high efficiency heating and cooling equipment as well as advanced building materials and insulation—almost 135,000 manufacturing employees or 47 percent of efficiency-related manufacturing work. About three in ten workers in the wholesale trade industry and nearly a third in professional services are mostly working with traditional HVAC goods. 76 The “other” category for the chart includes reduced water consumption products and appliances. Sum of Sub Technologies equals 2,181511 due to rounding
630,537
328,288 292,667
347,628
135,102 145,876
520,572
327,792
446,796
552,147
116,445
217,759
Traditional HVAC LED, CFL and Other Efficient Lighting
Advanced and Recycled Building
Materials
Energy Star Appliances,
including High Efficiency HVAC
Renewable Heating and
Cooling
Other
2015
2016
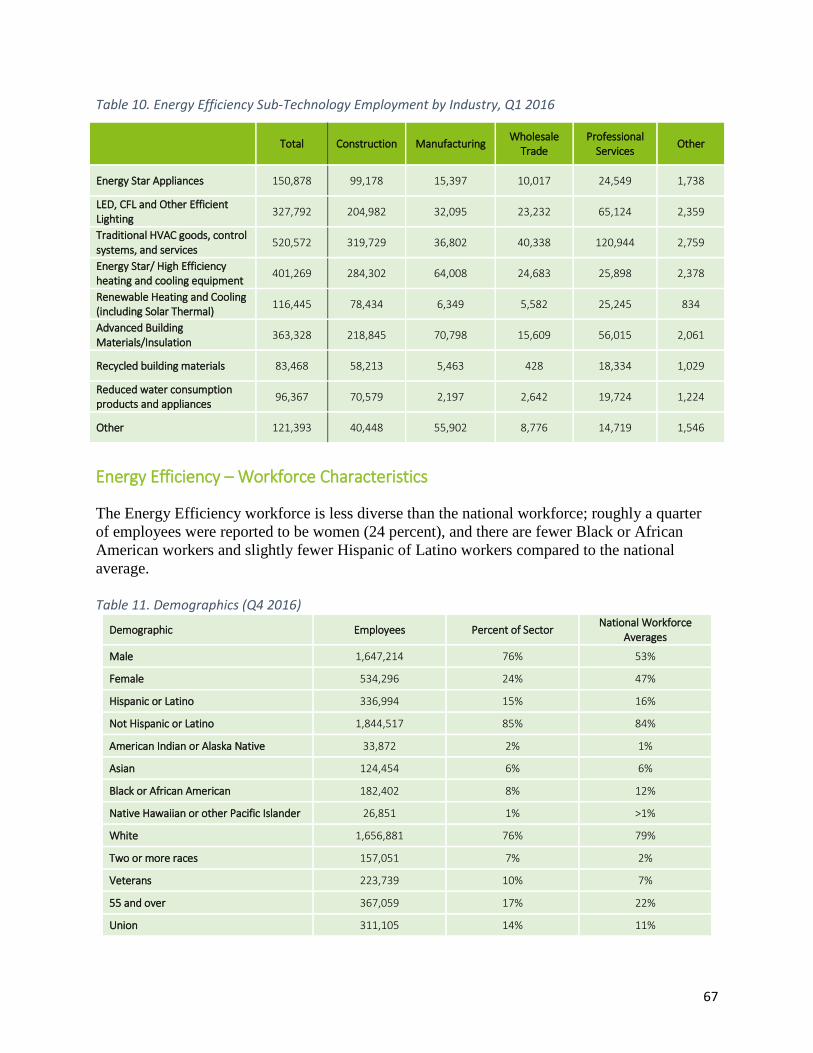
67
Table 10. Energy Efficiency Sub-Technology Employment by Industry, Q1 2016
Total Construction Manufacturing Wholesale
Trade Professional
Services Other
Energy Star Appliances 150,878 99,178 15,397 10,017 24,549 1,738
LED, CFL and Other Efficient Lighting 327,792 204,982 32,095 23,232 65,124 2,359
Traditional HVAC goods, control systems, and services
520,572 319,729 36,802 40,338 120,944 2,759
Energy Star/ High Efficiency heating and cooling equipment
401,269 284,302 64,008 24,683 25,898 2,378
Renewable Heating and Cooling (including Solar Thermal) 116,445 78,434 6,349 5,582 25,245 834
Advanced Building Materials/Insulation
363,328 218,845 70,798 15,609 56,015 2,061
Recycled building materials 83,468 58,213 5,463 428 18,334 1,029
Reduced water consumption products and appliances 96,367 70,579 2,197 2,642 19,724 1,224
Other 121,393 40,448 55,902 8,776 14,719 1,546
Energy Efficiency – Workforce Characteristics The Energy Efficiency workforce is less diverse than the national workforce; roughly a quarter of employees were reported to be women (24 percent), and there are fewer Black or African American workers and slightly fewer Hispanic of Latino workers compared to the national average. Table 11. Demographics (Q4 2016)
Demographic Employees Percent of Sector National Workforce
Averages
Male 1,647,214 76% 53%
Female 534,296 24% 47%
Hispanic or Latino 336,994 15% 16%
Not Hispanic or Latino 1,844,517 85% 84%
American Indian or Alaska Native 33,872 2% 1%
Asian 124,454 6% 6%
Black or African American 182,402 8% 12%
Native Hawaiian or other Pacific Islander 26,851 1% >1%
White 1,656,881 76% 79%
Two or more races 157,051 7% 2%
Veterans 223,739 10% 7%
55 and over 367,059 17% 22%
Union 311,105 14% 11%

68
The majority of workers in Energy Efficiency are employed in installation or repair positions (31 percent) or administrative positions (29 percent). Nearly 17 percent of workers are classified as production/manufacturing positions. Figure 38: Occupational Distribution – Energy Efficiency, Q4 2016
In the Energy Efficiency sector, over 80 percent of employers reported at least some difficulty finding qualified job applicants, and over 40 percent indicated it was very difficult. Wholesale trade reported the second highest hiring difficulty with over three-quarters (77 percent) of employers reporting at least some difficulty and over a quarter (28 percent) indicating it was very difficult. Seventy percent or more of Energy Efficiency employers in each of the industries reported at least some difficulty in hiring. Figure 39. Hiring Difficulty by Industry (Q4 2016)
16.7%
30.9%
29.3%
13.7%
6.7%2.8%
Production/Manufacturing positions
Installation or repair positions
Administrative positions
Management/Professional positions
Sales positions
Other positions
43.5%25.0% 27.9% 21.5% 26.5%
38.1%
45.5%49.3% 54.5% 48.5%
18.4%29.5% 22.9% 24.0% 25.0%
0%
20%
40%
60%
80%
100%
Construction Manufacturing Wholesale Trade, Distribution, and
Transport
Professional and Business Services
Other
Very difficult Somewhat difficult Not at all difficult
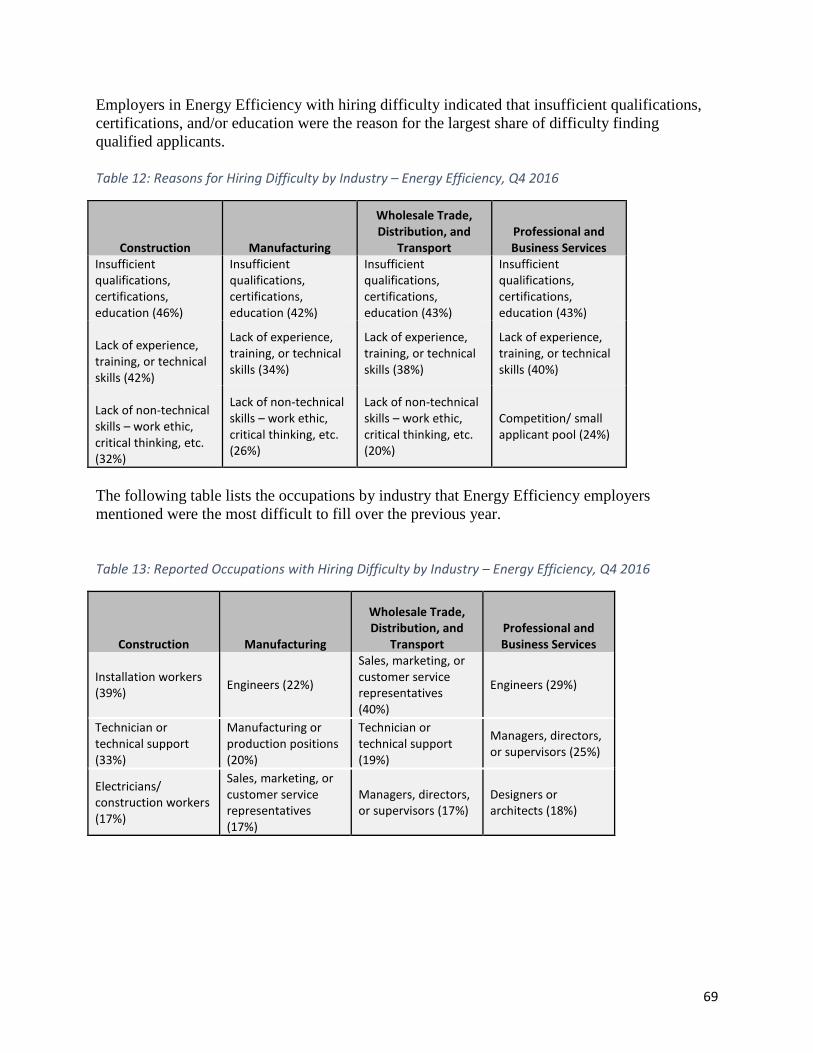
69
Employers in Energy Efficiency with hiring difficulty indicated that insufficient qualifications, certifications, and/or education were the reason for the largest share of difficulty finding qualified applicants. Table 12: Reasons for Hiring Difficulty by Industry – Energy Efficiency, Q4 2016
Construction Manufacturing
Wholesale Trade, Distribution, and
Transport Professional and Business Services
Insufficient qualifications, certifications, education (46%)
Insufficient qualifications, certifications, education (42%)
Insufficient qualifications, certifications, education (43%)
Insufficient qualifications, certifications, education (43%)
Lack of experience, training, or technical skills (42%)
Lack of experience, training, or technical skills (34%)
Lack of experience, training, or technical skills (38%)
Lack of experience, training, or technical skills (40%)
Lack of non-technical skills – work ethic, critical thinking, etc. (32%)
Lack of non-technical skills – work ethic, critical thinking, etc. (26%)
Lack of non-technical skills – work ethic, critical thinking, etc. (20%)
Competition/ small applicant pool (24%)
The following table lists the occupations by industry that Energy Efficiency employers mentioned were the most difficult to fill over the previous year. Table 13: Reported Occupations with Hiring Difficulty by Industry – Energy Efficiency, Q4 2016
Construction Manufacturing
Wholesale Trade, Distribution, and
Transport Professional and Business Services
Installation workers (39%) Engineers (22%)
Sales, marketing, or customer service representatives (40%)
Engineers (29%)
Technician or technical support (33%)
Manufacturing or production positions (20%)
Technician or technical support (19%)
Managers, directors, or supervisors (25%)
Electricians/ construction workers (17%)
Sales, marketing, or customer service representatives (17%)
Managers, directors, or supervisors (17%)
Designers or architects (18%)

70
Introduction Though not considered a sector of the Traditional Energy industry, Motor Vehicles,77 which include cars, light-duty and heavy-duty trucks, and component parts, is included in this report, given both high-energy consumption during production and end-use energy dependence. The Motor Vehicle sector is a large and complex component of the United States economy, which is only partially captured in existing industry codes. Further complicating the use of existing labor market data is that the NAICS classification system is inconsistent with classifications used by the Department of Energy and the Environmental Protection Agency, creating significant confusion in understanding the data.78 Several NAICS industry codes capture motor vehicle and parts manufacturing, automotive repair and maintenance, and wholesale trade, which comprise the Motor Vehicles and Component Parts sector. However, some employment is also embedded within industry subsectors including electrical equipment manufacturing, raw materials, goods transportation, warehousing, and professional services. In addition, this report provides employment data by fuel type, including gas and diesel vehicles, hybrid, electric, natural gas, as well as hydrogen and fuel cell technologies. It also analyzes how the component parts’ sector contributes to increasing the fuel economy of vehicles. As with most other sections of the 2017 USEER, raw materials and retail trade are excluded from the data, and employment totals refer to workers that spend some or all of their time working with a specific technology. Also, to be consistent with other chapters, employment is categorized by the establishment’s NAICS code, meaning that research and development, professional and management positions, and all other non-assembly jobs are included in the manufacturing total if the establishment is primarily focused on producing vehicles or component parts.
77 Motor Vehicle and Component Parts employers are defined as any firm that contributes to the manufacture, wholesale distribution, transport, and repair and maintenance of gas and diesel, hybrid, electric, natural gas, as well as hydrogen and fuel cell, or other vehicle technologies. 78 NAICS segments the manufacture of motor vehicles into automobiles, light duty trucks and utility vehicles, and heavy duty trucks. EPA uses weight to classify motor vehicles into light duty, medium duty, and heavy duty.
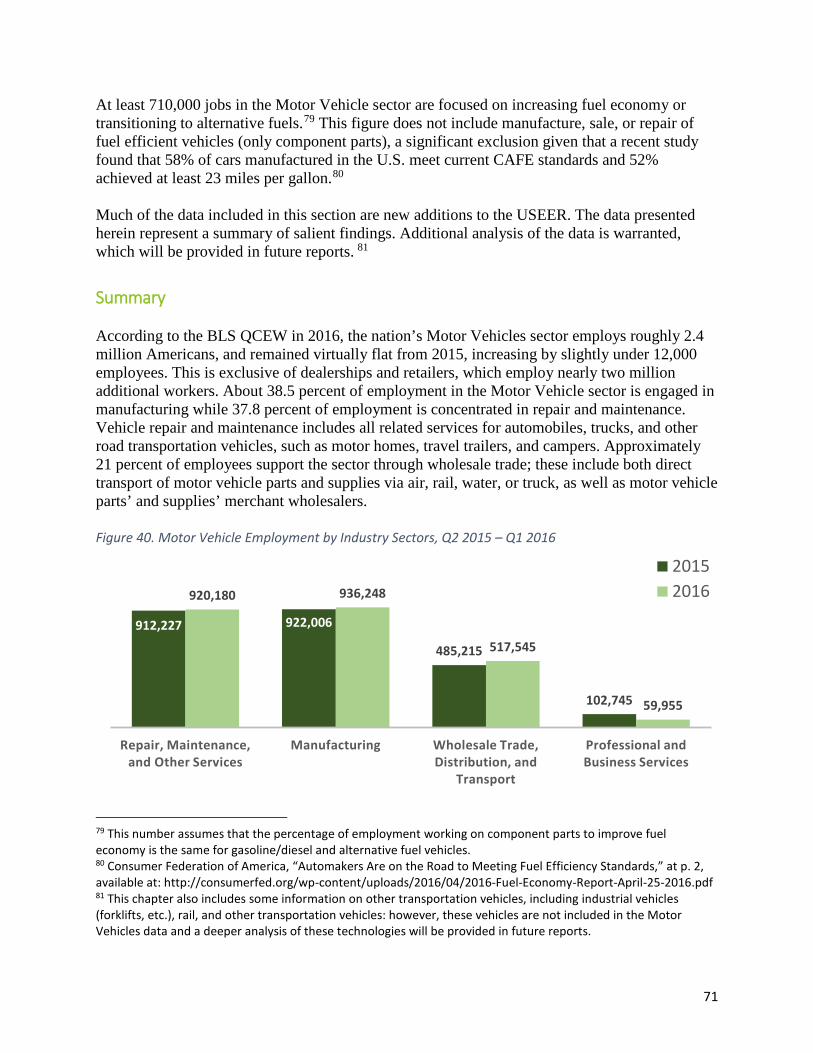
71
At least 710,000 jobs in the Motor Vehicle sector are focused on increasing fuel economy or transitioning to alternative fuels.79 This figure does not include manufacture, sale, or repair of fuel efficient vehicles (only component parts), a significant exclusion given that a recent study found that 58% of cars manufactured in the U.S. meet current CAFE standards and 52% achieved at least 23 miles per gallon.80 Much of the data included in this section are new additions to the USEER. The data presented herein represent a summary of salient findings. Additional analysis of the data is warranted, which will be provided in future reports. 81
Summary According to the BLS QCEW in 2016, the nation’s Motor Vehicles sector employs roughly 2.4 million Americans, and remained virtually flat from 2015, increasing by slightly under 12,000 employees. This is exclusive of dealerships and retailers, which employ nearly two million additional workers. About 38.5 percent of employment in the Motor Vehicle sector is engaged in manufacturing while 37.8 percent of employment is concentrated in repair and maintenance. Vehicle repair and maintenance includes all related services for automobiles, trucks, and other road transportation vehicles, such as motor homes, travel trailers, and campers. Approximately 21 percent of employees support the sector through wholesale trade; these include both direct transport of motor vehicle parts and supplies via air, rail, water, or truck, as well as motor vehicle parts’ and supplies’ merchant wholesalers. Figure 40. Motor Vehicle Employment by Industry Sectors, Q2 2015 – Q1 2016
79 This number assumes that the percentage of employment working on component parts to improve fuel economy is the same for gasoline/diesel and alternative fuel vehicles. 80 Consumer Federation of America, “Automakers Are on the Road to Meeting Fuel Efficiency Standards,” at p. 2, available at: http://consumerfed.org/wp-content/uploads/2016/04/2016-Fuel-Economy-Report-April-25-2016.pdf 81 This chapter also includes some information on other transportation vehicles, including industrial vehicles (forklifts, etc.), rail, and other transportation vehicles: however, these vehicles are not included in the Motor Vehicles data and a deeper analysis of these technologies will be provided in future reports.
912,227 922,006
485,215
102,745
920,180 936,248
517,545
59,955
Repair, Maintenance, and Other Services
Manufacturing Wholesale Trade, Distribution, and
Transport
Professional and Business Services
20152016
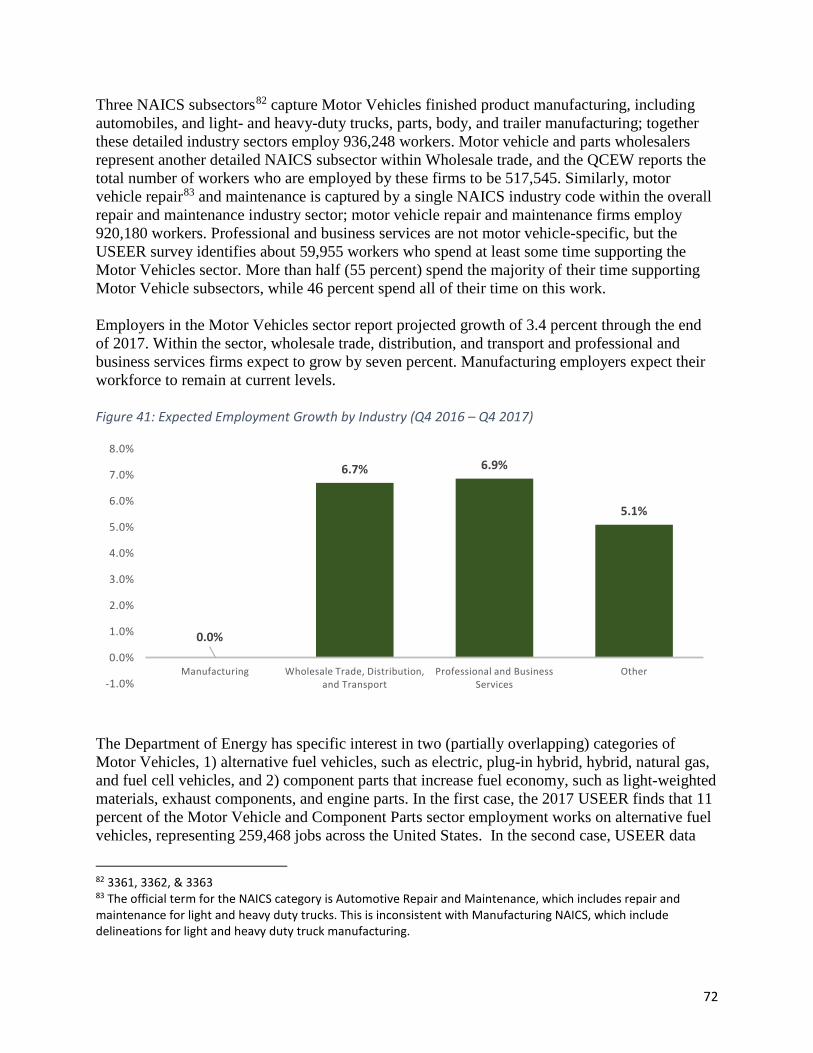
72
Three NAICS subsectors82 capture Motor Vehicles finished product manufacturing, including automobiles, and light- and heavy-duty trucks, parts, body, and trailer manufacturing; together these detailed industry sectors employ 936,248 workers. Motor vehicle and parts wholesalers represent another detailed NAICS subsector within Wholesale trade, and the QCEW reports the total number of workers who are employed by these firms to be 517,545. Similarly, motor vehicle repair83 and maintenance is captured by a single NAICS industry code within the overall repair and maintenance industry sector; motor vehicle repair and maintenance firms employ 920,180 workers. Professional and business services are not motor vehicle-specific, but the USEER survey identifies about 59,955 workers who spend at least some time supporting the Motor Vehicles sector. More than half (55 percent) spend the majority of their time supporting Motor Vehicle subsectors, while 46 percent spend all of their time on this work. Employers in the Motor Vehicles sector report projected growth of 3.4 percent through the end of 2017. Within the sector, wholesale trade, distribution, and transport and professional and business services firms expect to grow by seven percent. Manufacturing employers expect their workforce to remain at current levels. Figure 41: Expected Employment Growth by Industry (Q4 2016 – Q4 2017)
The Department of Energy has specific interest in two (partially overlapping) categories of Motor Vehicles, 1) alternative fuel vehicles, such as electric, plug-in hybrid, hybrid, natural gas, and fuel cell vehicles, and 2) component parts that increase fuel economy, such as light-weighted materials, exhaust components, and engine parts. In the first case, the 2017 USEER finds that 11 percent of the Motor Vehicle and Component Parts sector employment works on alternative fuel vehicles, representing 259,468 jobs across the United States. In the second case, USEER data
82 3361, 3362, & 3363 83 The official term for the NAICS category is Automotive Repair and Maintenance, which includes repair and maintenance for light and heavy duty trucks. This is inconsistent with Manufacturing NAICS, which include delineations for light and heavy duty truck manufacturing.
0.0%
6.7% 6.9%
5.1%
-1.0%
0.0%
1.0%
2.0%
3.0%
4.0%
5.0%
6.0%
7.0%
8.0%
Manufacturing Wholesale Trade, Distribution, and Transport
Professional and Business Services
Other
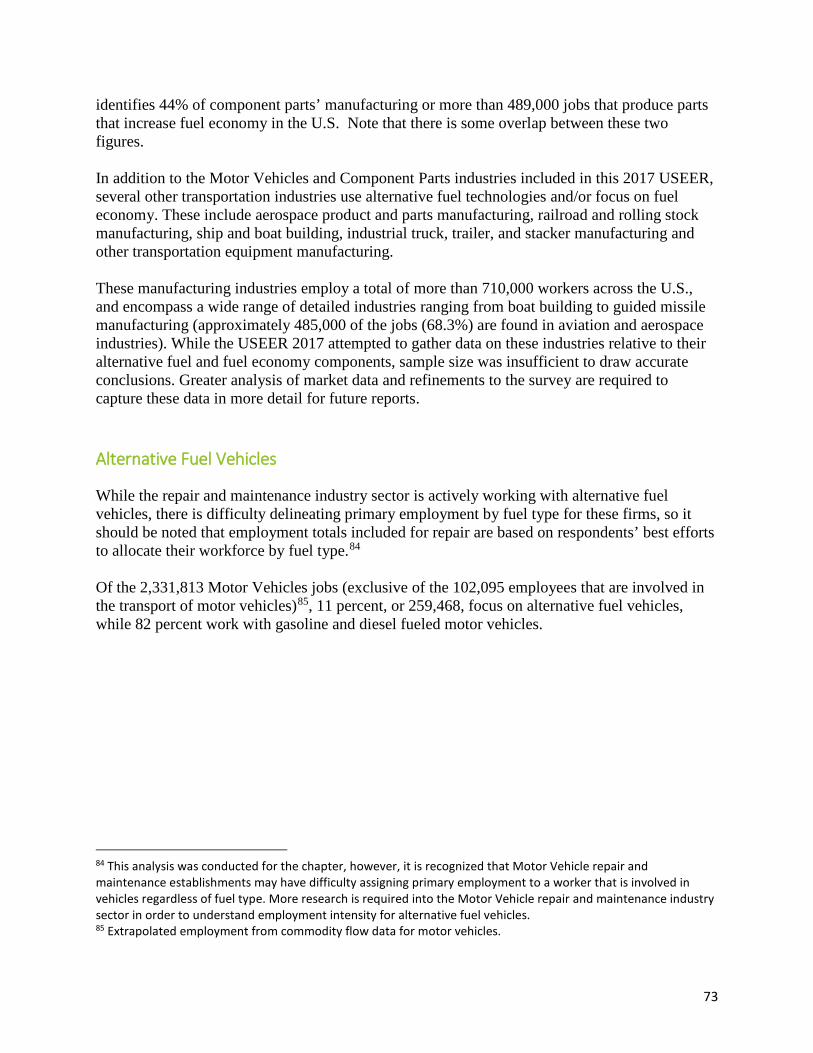
73
identifies 44% of component parts’ manufacturing or more than 489,000 jobs that produce parts that increase fuel economy in the U.S. Note that there is some overlap between these two figures. In addition to the Motor Vehicles and Component Parts industries included in this 2017 USEER, several other transportation industries use alternative fuel technologies and/or focus on fuel economy. These include aerospace product and parts manufacturing, railroad and rolling stock manufacturing, ship and boat building, industrial truck, trailer, and stacker manufacturing and other transportation equipment manufacturing. These manufacturing industries employ a total of more than 710,000 workers across the U.S., and encompass a wide range of detailed industries ranging from boat building to guided missile manufacturing (approximately 485,000 of the jobs (68.3%) are found in aviation and aerospace industries). While the USEER 2017 attempted to gather data on these industries relative to their alternative fuel and fuel economy components, sample size was insufficient to draw accurate conclusions. Greater analysis of market data and refinements to the survey are required to capture these data in more detail for future reports. Alternative Fuel Vehicles While the repair and maintenance industry sector is actively working with alternative fuel vehicles, there is difficulty delineating primary employment by fuel type for these firms, so it should be noted that employment totals included for repair are based on respondents’ best efforts to allocate their workforce by fuel type.84 Of the 2,331,813 Motor Vehicles jobs (exclusive of the 102,095 employees that are involved in the transport of motor vehicles)85, 11 percent, or 259,468, focus on alternative fuel vehicles, while 82 percent work with gasoline and diesel fueled motor vehicles.
84 This analysis was conducted for the chapter, however, it is recognized that Motor Vehicle repair and maintenance establishments may have difficulty assigning primary employment to a worker that is involved in vehicles regardless of fuel type. More research is required into the Motor Vehicle repair and maintenance industry sector in order to understand employment intensity for alternative fuel vehicles. 85 Extrapolated employment from commodity flow data for motor vehicles.

74
Figure 42: Motor Vehicles and Component Parts Employment by Sub-technology (Q1 2016)
Nearly nine out of ten (86 percent) of Motor Vehicle parts firms offer parts for gasoline and diesel motor vehicles, while more than a quarter (28 percent) offer component parts for hybrid electric vehicles. Figure 43: Parts Offered by Type of Fuel Used, Component Parts86
86 Firms were permitted to offer multiple responses, percentages sum to over 100%.
991,281
87,492 35,121 35,794 16,709 16,207
42,653
924,691
24,455 9,295 6,197 27,664 533 113,721
Gasoline andDiesel Motor
Vehicles(excluding freight
transport)
Hybrid ElectricVehicles
Plug-In HybridVehicles
Electric Vehicles Natural GasVehicles
Hydrogen andFuel Cell Vehicles
Other
Motor Vehicles Component Parts
86.4%
27.6%15.7% 15.9% 13.8%
5.4% 9.2%
Gasoline andDiesel Motor
Vehicles(excluding
freighttransport)
Hybrid ElectricVehicles
Plug-In HybridVehicles
Electric Vehicles Natural GasVehicles
Hydrogen/FuelCell Vehicles
Other

75
Manufacturing Gasoline and diesel motor vehicles represent nearly 84 percent of all Motor Vehicles and manufacturing by employment. Seven percent of manufacturing employment, or 62,549 jobs, in the sector is focused on alternative fuel categories, while ten percent is categorized within “other/multiple.” Figure 44: Motor Vehicles and Component Parts Manufacturing Employment by Sub-technology (Q1 2016)87
Motor Vehicle Parts and Fuel Economy Nearly half a million (489,039) Component Parts employees work with parts that increase fuel economy for vehicles. This represents 44 percent of the 1,106,655 workers currently employed in the sector. The Component Parts sector includes firms focused on vehicle engine and drive parts, exhaust system parts, vehicle body parts, and other vehicle parts (including some battery production). This does not include mining and extraction for elements used in vehicle parts production, rolled aluminum manufacturing, or production equipment manufacturing. 87 365 employees within hydrogen and fuel cell vehicles work on component parts, less than 10 employees are focused on motor vehicles manufacturing.
172,906
3,361 906 7,868 5,490 >1016,419
609,423
16,117 6,126 4,084 18,232 365 74,949
Gasoline andDiesel Motor
Vehicles(excluding
freight transport)
Hybrid ElectricVehicles
Plug-In HybridVehicles
Electric Vehicles Natural GasVehicles
Hydrogen andFuel Cell Vehicles
Other
Motor Vehicles Component Parts
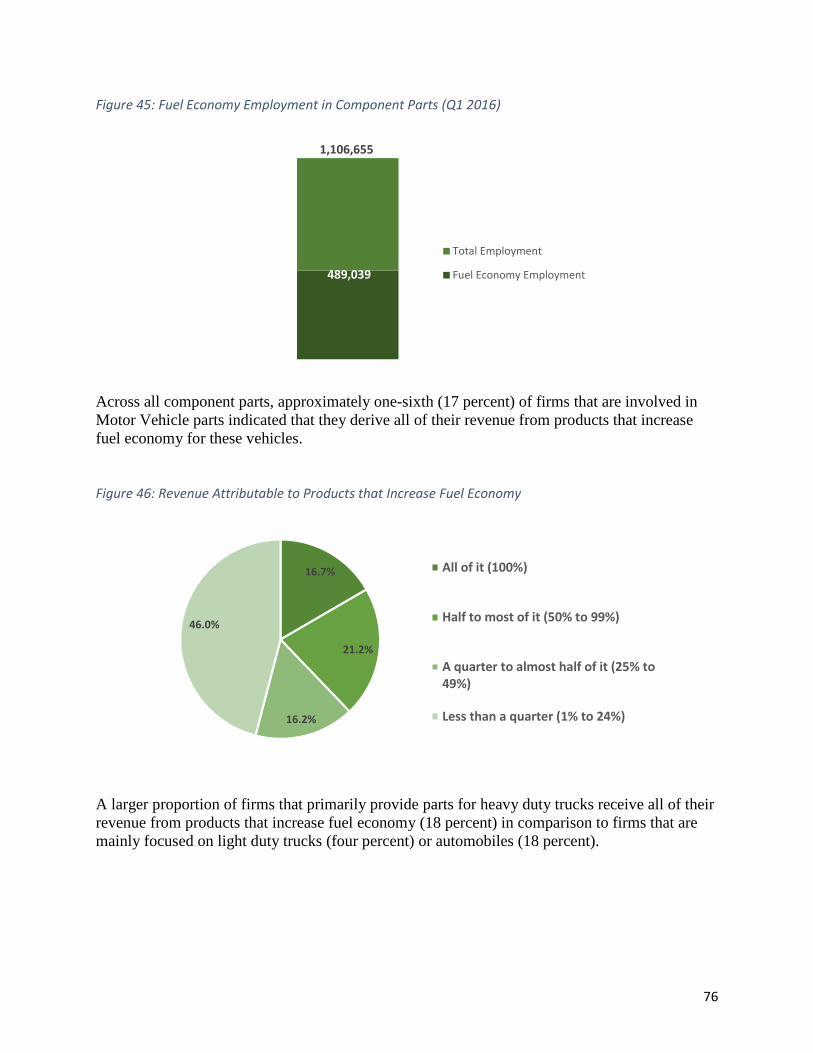
76
Figure 45: Fuel Economy Employment in Component Parts (Q1 2016)
Across all component parts, approximately one-sixth (17 percent) of firms that are involved in Motor Vehicle parts indicated that they derive all of their revenue from products that increase fuel economy for these vehicles. Figure 46: Revenue Attributable to Products that Increase Fuel Economy
A larger proportion of firms that primarily provide parts for heavy duty trucks receive all of their revenue from products that increase fuel economy (18 percent) in comparison to firms that are mainly focused on light duty trucks (four percent) or automobiles (18 percent).
489,039
1,106,655
Total Employment
Fuel Economy Employment
16.7%
21.2%
16.2%
46.0%
All of it (100%)
Half to most of it (50% to 99%)
A quarter to almost half of it (25% to49%)
Less than a quarter (1% to 24%)
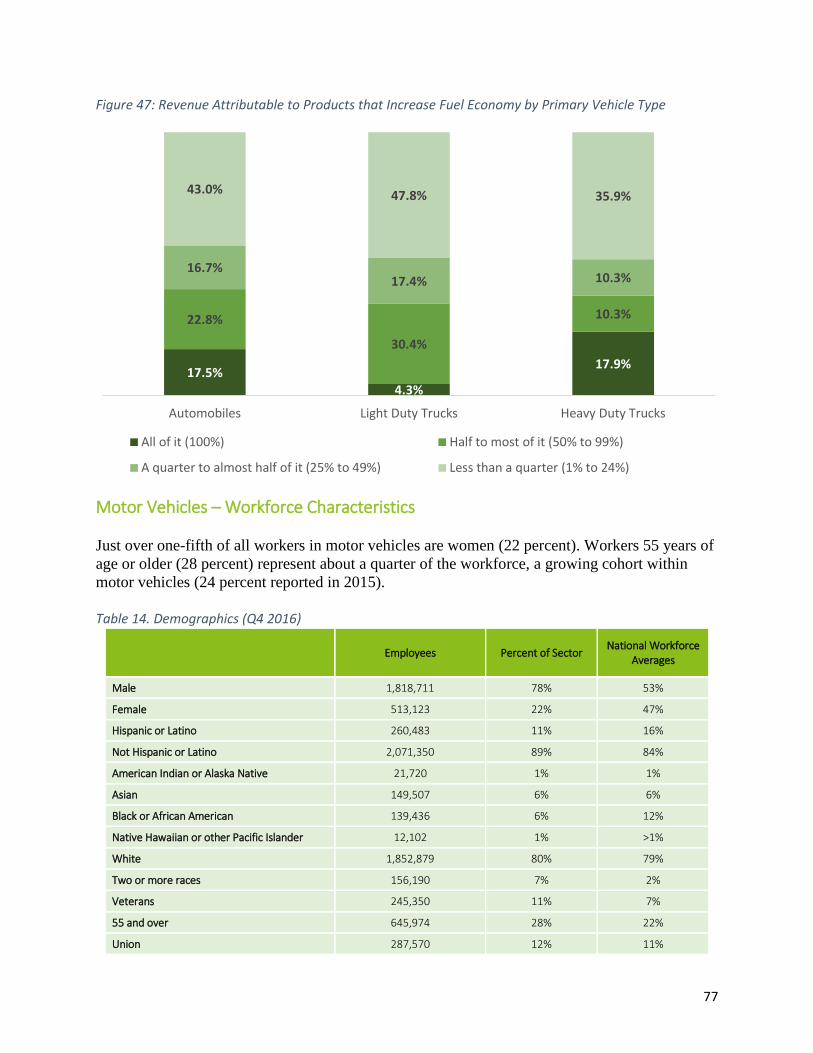
77
Figure 47: Revenue Attributable to Products that Increase Fuel Economy by Primary Vehicle Type
Motor Vehicles – Workforce Characteristics Just over one-fifth of all workers in motor vehicles are women (22 percent). Workers 55 years of age or older (28 percent) represent about a quarter of the workforce, a growing cohort within motor vehicles (24 percent reported in 2015). Table 14. Demographics (Q4 2016)
Employees Percent of Sector National Workforce
Averages
Male 1,818,711 78% 53%
Female 513,123 22% 47%
Hispanic or Latino 260,483 11% 16%
Not Hispanic or Latino 2,071,350 89% 84%
American Indian or Alaska Native 21,720 1% 1%
Asian 149,507 6% 6%
Black or African American 139,436 6% 12%
Native Hawaiian or other Pacific Islander 12,102 1% >1%
White 1,852,879 80% 79%
Two or more races 156,190 7% 2%
Veterans 245,350 11% 7%
55 and over 645,974 28% 22%
Union 287,570 12% 11%
17.5%4.3%
17.9%
22.8%
30.4%
10.3%
16.7%17.4% 10.3%
43.0% 47.8% 35.9%
Automobiles Light Duty Trucks Heavy Duty Trucks
All of it (100%) Half to most of it (50% to 99%)
A quarter to almost half of it (25% to 49%) Less than a quarter (1% to 24%)
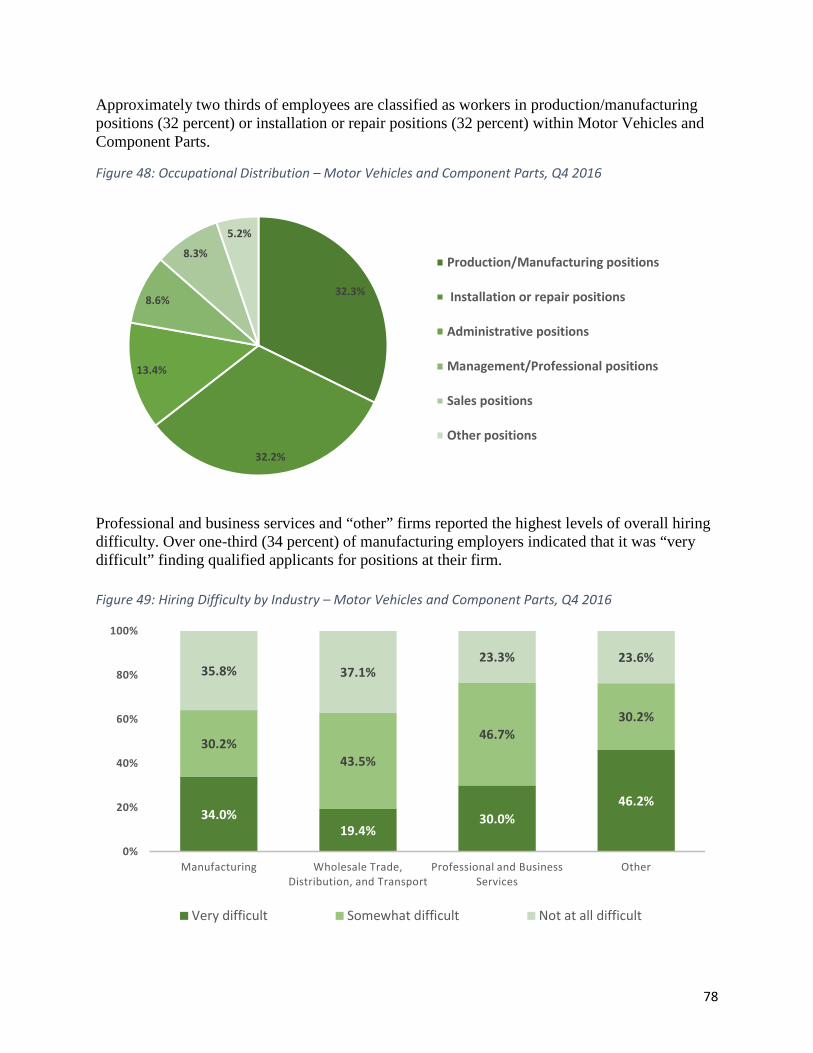
78
Approximately two thirds of employees are classified as workers in production/manufacturing positions (32 percent) or installation or repair positions (32 percent) within Motor Vehicles and Component Parts.
Figure 48: Occupational Distribution – Motor Vehicles and Component Parts, Q4 2016
Professional and business services and “other” firms reported the highest levels of overall hiring difficulty. Over one-third (34 percent) of manufacturing employers indicated that it was “very difficult” finding qualified applicants for positions at their firm. Figure 49: Hiring Difficulty by Industry – Motor Vehicles and Component Parts, Q4 2016
32.3%
32.2%
13.4%
8.6%
8.3%
5.2%
Production/Manufacturing positions
Installation or repair positions
Administrative positions
Management/Professional positions
Sales positions
Other positions
34.0%19.4%
30.0%46.2%
30.2%43.5%
46.7%30.2%
35.8% 37.1%23.3% 23.6%
0%
20%
40%
60%
80%
100%
Manufacturing Wholesale Trade, Distribution, and Transport
Professional and Business Services
Other
Very difficult Somewhat difficult Not at all difficult

79
Insufficient qualifications, certifications, and/or education was the number one reason for hiring difficulty as reported by manufacturing, wholesale trade, distribution, and transport, and professional and business services firms in Motor Vehicles and Component Parts. Table 15: Reasons for Hiring Difficulty by Industry – Motor Vehicles and Component Parts, Q4 2016
Manufacturing Wholesale Trade, Distribution, and
Transport
Professional and Business Services Other
Insufficient qualifications, certifications, education (42%)
Insufficient qualifications, certifications, education (41%)
Insufficient qualifications, certifications, education (64%)
Lack of experience, training, or technical skills (41%)
Lack of non-technical skills – work ethic, critical thinking, etc. (31%)
Lack of non-technical skills – work ethic, critical thinking, etc. (36%)
Lack of experience, training, or technical skills (41%)
Insufficient qualifications, certifications, education (41%)
Lack of experience, training, or technical skills (25%)
Lack of experience, training, or technical skills (33%)
Competition/ small applicant pool (18%)
Lack of non-technical skills – work ethic, critical thinking, etc. (36%)
Three of the industry sectors in Motor Vehicles and Component Parts listed technician or technical support as the occupational category that is most difficult to fill at their firms. Table 16: Reported Occupations with Hiring Difficulty by Industry – Fuels, Q4 2016
Manufacturing Wholesale Trade, Distribution, and
Transport
Professional and Business Services Other
Engineers (27%) Technician or technical support (48%)
Technician or technical support (22%)
Technician or technical support (49%)
Plant electricians (23%) Sales, marketing, or customer service representatives (35%)
Engineers (17%) Electricians (36%)
Manufacturing or production positions (16%)
Managers, directors, or supervisors (18%)
Sales, marketing, or customer service representatives (17%)
Managers, directors, or supervisors (12%)

80
Conclusions As reported in the findings of the 2017 USEER, the country’s Traditional Energy, Energy Efficiency, and Motor Vehicle sectors have contributed significant gains to the U.S. economy and now represent more than 6% of all jobs nationwide. Rebuilding our energy infrastructure and modernizing the grid, diversifying our energy mix, and reducing our energy consumption in both our built environment and motor vehicles, America’s labor markets are being revitalized by our new energy and transportation technologies. But within this overall story of growth is also an uneven trajectory where some states experience new jobs and others grapple with decline. States such as California and Texas, which have abundant solar, wind, and fossil fuel resources, have shown dramatic employment gains, despite some losses linked to low fossil fuel prices. Coal-dependent states, such as West Virginia and Wyoming, have seen declines in employment since 2015. This is the challenge that the 2017 USEER and its successor reports are designed to address at the national and local level. Evidence-based approaches are essential to ensuring a competitive energy economy and a workforce that is adaptable to meet 21st Century challenges. The data in the 2017 USEER provides federal, state, and local leaders critical labor market metrics to realize this vision. The report also finds that firms covered by the survey anticipate roughly five percent employment growth for 2017, representing a significant source of economic growth and development for both local communities and the nation.
81
Appendix A: Survey and Analysis Methods The 2017 USEER methodology relies on the most recently available data from the Bureau of Labor Statistics Quarterly Census of Employment and Wages (QCEW, Quarter 1), together with a detailed supplemental survey of business establishments across the United States designed and conducted by BW Research Partnership on behalf of the Department of Energy. DOE conducted a comprehensive review of the methodology underlying the 2017 USEER and consulted with the Bureau of Labor Statistics for consistency. During a time of rapid change in energy technology and business employment structure, supplemental surveys are an important tool to capture developing trends. Taken together, the BLS and survey data provide the most comprehensive calculation of energy-related employment available. The methodology has been used for local, state, and federal energy related data collection and analysis for nearly a decade, including The Solar Foundation’s National Solar Jobs Census series, clean energy reports for state agencies in the Commonwealth of Massachusetts, State of Vermont, and State of Rhode Island, and numerous nonprofit agencies across the U.S. The 2017 USEER survey uses a stratified sampling plan that is representative by industry code (NAICS or ANAICS), establishment size, and geography to determine the proportion of establishments that work with specific energy-related technologies, as well as the proportion of workers in such establishments that work with the same. These data are then analyzed and applied to existing public data published by the Bureau of Labor Statistics, effectively constraining the potential universe of energy establishments and employment. The 2017 USEER survey was administered by telephone (more than 500,000 outbound calls) and by web, with more than 60,000 emails sent to participants throughout the U.S. The phone survey was conducted by Braun Research, Issues & Answers, and Mountain West. The web instrument was programmed internally and each respondent was required to use a unique ID in order to prevent duplication. The sample was split into two categories, referred to as the known and unknown universes. The known universe includes establishments that have previously identified as energy-related, either in prior research or some other manner, such as membership in an industry association or participation in government programs. These establishments were surveyed census-style, and their associated establishment and employment totals were removed from the unknown universe for both sampling and for resulting employment calculations and estimates. The unknown universe includes hundreds of thousands of businesses in potentially energy-related NAICS codes, across agriculture, mining, utilities, construction, manufacturing, wholesale trade, Professional Services, and repair and maintenance. Each of these segments and their total reported establishments (within the Bureau of Labor Statistics QCEW) were carefully analyzed by state to develop representative clusters for sampling. In total, approximately 30,000 business establishments participated in the survey effort, with approximately 10,000 providing full responses to the survey. These responses were used to develop incidence rates among industries (by state) as well as to apportion employment across various industry categories in ways currently not provided by state and federal labor market information agencies. The margin of error for incidence in the index is +/-0.76 percent at a 95 percent confidence interval.

82
For several industries, particularly transportation of goods, the USEER uses the methodology developed by the Department of Energy and the National Renewable Energy Laboratory for the First Installment of the Quadrennial Energy Review (QER). Proportion of employment was calculated by dividing commodity shipments by value (millions of $) for coal, fuel oil, gas, motor vehicles, petroleum, and other coal and petroleum products out of total commodity value at the state level by truck, rail, air, and water transport. This proportion was applied to NAICS employment for truck transportation (484), water transportation (483), air transportation (481), and Railroad Retirement Board employment for rail transportation at the state level. With this analysis, truck transportation represents the majority of energy-related transportation employment (65 percent), followed by rail (25 percent), water (9 percent), and air (1 percent). Of important note, the USEER expressly excludes any employment in retail trade NAICS codes. This excludes motor vehicle dealerships, appliance and hardware stores and other retail establishments. Where relevant, separate reference is made to retail employment (gasoline stations and fuel dealers). All data in the USEER rely on the Bureau of Labor Statistics Quarterly Census of Employment and Wages data for the end of quarter 1 of 2016. The USEER survey was administered between October 8, 2016 and November 24, 2016 and averaged 16.5 minutes in length.
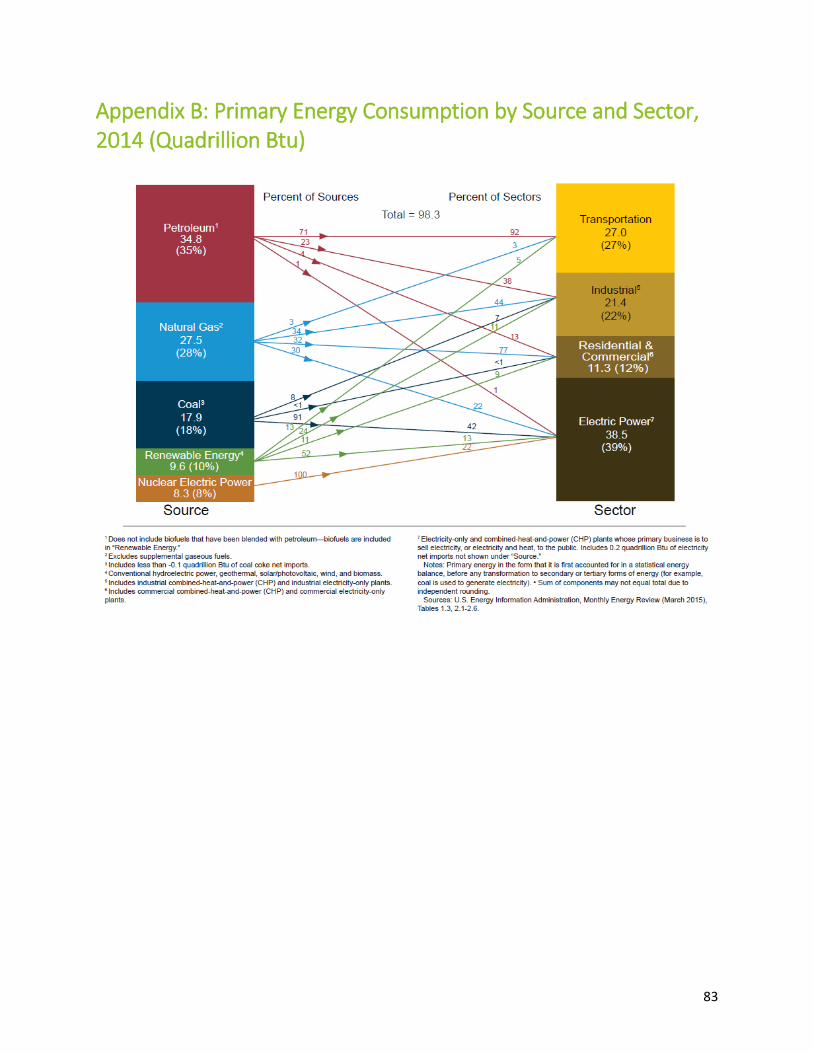
83
Appendix B: Primary Energy Consumption by Source and Sector, 2014 (Quadrillion Btu)
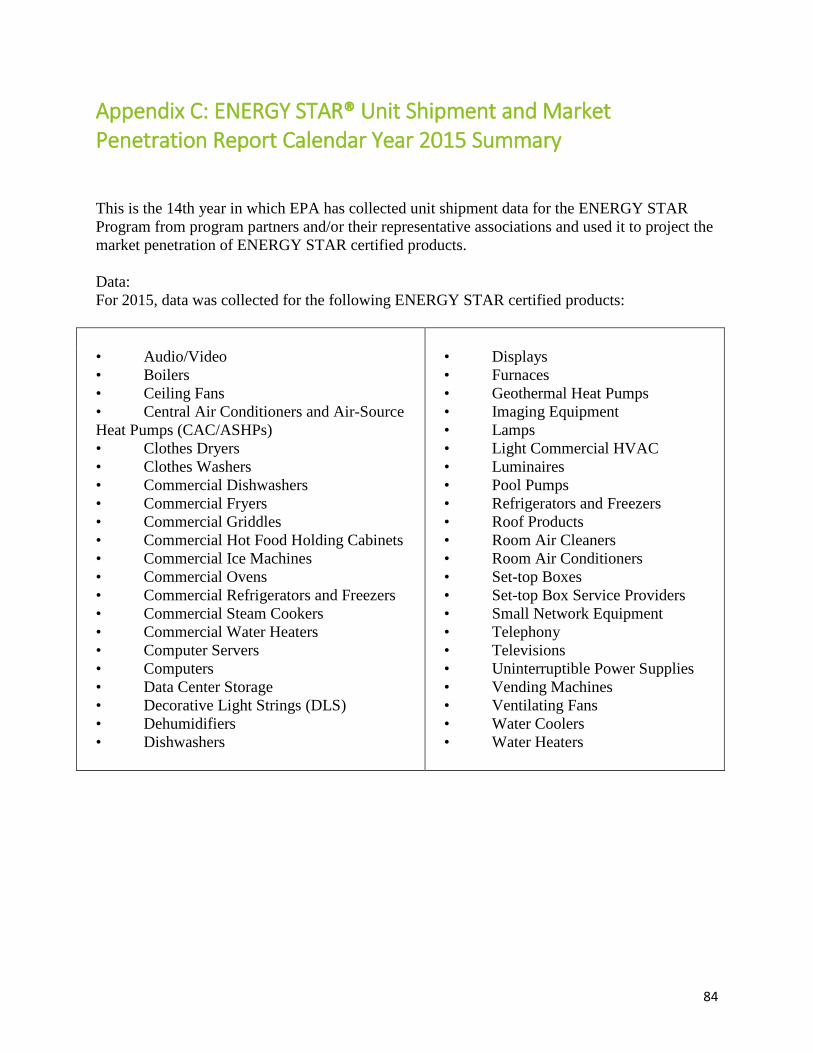
84
Appendix C: ENERGY STAR® Unit Shipment and Market Penetration Report Calendar Year 2015 Summary
This is the 14th year in which EPA has collected unit shipment data for the ENERGY STAR Program from program partners and/or their representative associations and used it to project the market penetration of ENERGY STAR certified products. Data: For 2015, data was collected for the following ENERGY STAR certified products:
• Audio/Video • Boilers • Ceiling Fans • Central Air Conditioners and Air-Source Heat Pumps (CAC/ASHPs) • Clothes Dryers • Clothes Washers • Commercial Dishwashers • Commercial Fryers • Commercial Griddles • Commercial Hot Food Holding Cabinets • Commercial Ice Machines • Commercial Ovens • Commercial Refrigerators and Freezers • Commercial Steam Cookers • Commercial Water Heaters • Computer Servers • Computers • Data Center Storage • Decorative Light Strings (DLS) • Dehumidifiers • Dishwashers
• Displays • Furnaces • Geothermal Heat Pumps • Imaging Equipment • Lamps • Light Commercial HVAC • Luminaires • Pool Pumps • Refrigerators and Freezers • Roof Products • Room Air Cleaners • Room Air Conditioners • Set-top Boxes • Set-top Box Service Providers • Small Network Equipment • Telephony • Televisions • Uninterruptible Power Supplies • Vending Machines • Ventilating Fans • Water Coolers • Water Heaters

![ispe 4prov1 draft rev 1[c onsult] - WIPO · pct/gl/ispe/4 prov. 1 page 3 pct international search and preliminary examination guidelines (as in force from …. table of contents3](https://static.documents.pub/doc/80x56/5b8bbac409d3f231638be32c/ispe-4prov1-draft-rev-1c-onsult-pctglispe4-prov-1-page-3-pct-international.jpg)


