2016 LCRWPG WATER PLAN 5-i Lower Colorado Regional Water Planning Group November 2015 TABLE OF CONTENTS – CHAPTER FIVE CHAPTER 5.0: IDENTIFICATION, EVALUATION, AND SELECTION OF WATER MANAGEMENT STRATEGIES BASED ON NEED ................................................. 5-1 5.1 POTENTIAL WATER MANAGEMENT STRATEGIES......................................................... 5-1 5.2 RECOMMENDED WATER MANAGEMENT STRATEGIES................................................ 5-2 5.2.1 Utilization of Return Flows ......................................................................................... 5-3 5.2.1.1 COA Return Flows Strategy .......................................................................... 5-4 5.2.1.2 Downstream Return Flows ............................................................................ 5-7 5.2.2 Conservation ............................................................................................................... 5-7 5.2.2.1 LCRA Conservation ...................................................................................... 5-8 5.2.2.1.1. Enhanced Municipal and Industrial Conservation........................ 5-8 5.2.2.1.2. Agricultural Conservation ........................................................... 5-9 5.2.2.2 COA Conservation ........................................................................................ 5-9 5.2.2.3 Municipal Conservation .............................................................................. 5-12 5.2.2.4 Irrigation Conservation ................................................................................ 5-19 5.2.2.4.1. On-Farm Conservation ............................................................. 5-19 5.2.2.4.2. Irrigation Operations Conveyance Improvements ...................... 5-24 5.2.2.4.3. Conservation through Sprinkler Irrigation ................................. 5-26 5.2.3 Wholesale Water Provider Management Strategies .................................................... 5-29 5.2.3.1 LCRA Water Management Strategies .......................................................... 5-29 5.2.3.1.1. General LCRA Strategy - LCRA System Operation Approach .. 5-30 5.2.3.1.2. Amendments to Water Management Plan.................................. 5-31 5.2.3.1.3. Amendments to ROR Rights, including Garwood ..................... 5-34 5.2.3.1.4. LCRA Contract Amendments ................................................... 5-36 5.2.3.1.5. LCRA New Water Sale Contracts ............................................. 5-38 5.2.3.1.6. Conservation ............................................................................ 5-40 5.2.3.1.7. Groundwater Supply for FPP (On-site) ..................................... 5-40 5.2.3.1.8. Groundwater Supply for FPP (Off-site) ..................................... 5-41 5.2.3.1.9. Expand Use of Groundwater in Bastrop County (Carrizo-Wilcox Aquifer).................................................................................... 5-43 5.2.3.1.10. Off-Channel Reservoirs ............................................................ 5-45 5.2.3.1.11. Acquire Additional Water Rights .............................................. 5-52 5.2.3.1.12. Downstream Return Flows........................................................ 5-53 5.2.3.1.13. Description of the Impact of the Management Strategies on Navigation ................................................................................ 5-53 5.2.3.2 City of Austin (COA) Water Management Strategies ................................... 5-53 5.2.3.2.1. Water Conservation .................................................................. 5-54 5.2.3.2.2. Water Reclamation Initiative (Direct Reuse) ............................. 5-54 5.2.3.2.3. Aquifer Storage and Recovery .................................................. 5-57 5.2.3.2.4. Longhorn Dam Operation Improvements .................................. 5-59 5.2.3.2.5. Rainwater Harvesting ............................................................... 5-60 5.2.3.2.6. Lake Long Enhanced Storage ................................................... 5-62 5.2.3.2.7. Other Reuse.............................................................................. 5-64 5.2.3.2.8. Capture Local Inflows to Lady Bird Lake ................................. 5-65 5.2.3.2.9. Indirect Potable Reuse through Lady Bird Lake ........................ 5-66 5.2.3.2.10. Lake Austin Operations ............................................................ 5-68 5.2.4 Regional Water Management Strategies..................................................................... 5-69
Transcript
2016 LCRWPG WATER PLAN 5-i
Lower Colorado Regional Water Planning Group November 2015
TABLE OF CONTENTS – CHAPTER FIVE
CHAPTER 5.0: IDENTIFICATION, EVALUATION, AND SELECTION OF WATER MANAGEMENT STRATEGIES BASED ON NEED ................................................. 5-1
5.1 POTENTIAL WATER MANAGEMENT STRATEGIES ......................................................... 5-1 5.2 RECOMMENDED WATER MANAGEMENT STRATEGIES ................................................ 5-2
5.2.1 Utilization of Return Flows ......................................................................................... 5-3 5.2.1.1 COA Return Flows Strategy .......................................................................... 5-4 5.2.1.2 Downstream Return Flows ............................................................................ 5-7
5.2.3 Wholesale Water Provider Management Strategies .................................................... 5-29 5.2.3.1 LCRA Water Management Strategies .......................................................... 5-29
5.2.3.1.1. General LCRA Strategy - LCRA System Operation Approach .. 5-30 5.2.3.1.2. Amendments to Water Management Plan.................................. 5-31 5.2.3.1.3. Amendments to ROR Rights, including Garwood ..................... 5-34 5.2.3.1.4. LCRA Contract Amendments ................................................... 5-36 5.2.3.1.5. LCRA New Water Sale Contracts ............................................. 5-38 5.2.3.1.6. Conservation ............................................................................ 5-40 5.2.3.1.7. Groundwater Supply for FPP (On-site) ..................................... 5-40 5.2.3.1.8. Groundwater Supply for FPP (Off-site) ..................................... 5-41 5.2.3.1.9. Expand Use of Groundwater in Bastrop County (Carrizo-Wilcox
Aquifer).................................................................................... 5-43 5.2.3.1.10. Off-Channel Reservoirs ............................................................ 5-45 5.2.3.1.11. Acquire Additional Water Rights .............................................. 5-52 5.2.3.1.12. Downstream Return Flows........................................................ 5-53 5.2.3.1.13. Description of the Impact of the Management Strategies on
Navigation ................................................................................ 5-53 5.2.3.2 City of Austin (COA) Water Management Strategies ................................... 5-53
5.2.3.2.1. Water Conservation .................................................................. 5-54 5.2.3.2.2. Water Reclamation Initiative (Direct Reuse) ............................. 5-54 5.2.3.2.3. Aquifer Storage and Recovery .................................................. 5-57 5.2.3.2.4. Longhorn Dam Operation Improvements .................................. 5-59 5.2.3.2.5. Rainwater Harvesting ............................................................... 5-60 5.2.3.2.6. Lake Long Enhanced Storage ................................................... 5-62 5.2.3.2.7. Other Reuse .............................................................................. 5-64 5.2.3.2.8. Capture Local Inflows to Lady Bird Lake ................................. 5-65 5.2.3.2.9. Indirect Potable Reuse through Lady Bird Lake ........................ 5-66 5.2.3.2.10. Lake Austin Operations ............................................................ 5-68
5.2.4 Regional Water Management Strategies..................................................................... 5-69
2016 LCRWPG WATER PLAN 5-ii
Lower Colorado Regional Water Planning Group November 2015
5.2.5 Municipal Water Management Strategies ................................................................. 5-121 5.2.5.1 Municipal Conservation ............................................................................ 5-122 5.2.5.2 Volente ..................................................................................................... 5-122 5.2.5.3 Bastrop County ......................................................................................... 5-124 5.2.5.4 Reuse ........................................................................................................ 5-128
5.2.5.4.1. City of Bastrop ....................................................................... 5-129 5.2.5.4.2. City of Buda ........................................................................... 5-130 5.2.5.4.3. City of Flatonia....................................................................... 5-132 5.2.5.4.4. City of Llano .......................................................................... 5-133 5.2.5.4.5. City of Pflugerville ................................................................. 5-134 5.2.5.4.6. City of Horseshoe Bay ............................................................ 5-135 5.2.5.4.7. City of Marble Falls ................................................................ 5-135
5.2.6 Irrigation Water Management Strategies .................................................................. 5-136 5.2.7 Manufacturing Water Management Strategies .......................................................... 5-138 5.2.8 Mining Water Management Strategies ..................................................................... 5-138 5.2.9 Steam Electric Power Water Management Strategies ............................................... 5-138
5.2.9.1 COA Steam Electric Water Management Strategies ................................... 5-138 5.2.9.2 STP Nuclear Operating Company Water Management Strategies ............... 5-140
2016 LCRWPG WATER PLAN 5-iii
Lower Colorado Regional Water Planning Group November 2015
5.2.9.2.1. Blend Brackish Surface Water in STPNOC Reservoir ............. 5-140 5.2.9.2.2. Alternate Canal Delivery ........................................................ 5-141 5.2.9.2.3. LCRA Contract Amendment ................................................... 5-142 5.2.9.2.4. Water Right Permit Amendment ............................................. 5-142
5.2.9.3 Other Steam Electric Water Management Strategies .................................. 5-143 5.3 ALTERNATIVE WATER MANAGEMENT STRATEGIES ............................................... 5-143
5.3.1 Alternative Strategies for LCRA Wholesale Water Supply ....................................... 5-143 5.3.1.1 Groundwater Importation - Carrizo-Wilcox to LCRA System .................... 5-144 5.3.1.2 Import Return Flows from Williamson County .......................................... 5-145 5.3.1.3 Supplement Bay and Estuary Inflows with Brackish Groundwater ............. 5-148 5.3.1.4 Brackish Groundwater Desalination from the Gulf Coast Aquifer
5.3.2 City of Austin Alternative Strategies........................................................................ 5-155 5.3.2.1 COA Brackish Groundwater Desalination.................................................. 5-155 5.3.2.2 COA Reclaimed Water Bank Infiltration to Colorado Alluvium ................. 5-156
5.3.3 Other Alternative Water Management Strategies...................................................... 5-158 5.3.3.1 HCPUA Pipeline (Alternative) .................................................................. 5-158 5.3.3.2 Direct Potable Reuse ................................................................................. 5-158
5.4 CONSIDERED, BUT NOT RECOMMENDED OR ALTERNATIVE STRATEGIES.......... 5-160 5.5 ENVIRONMENTAL IMPACTS OF WATER MANAGEMENT STRATEGIES ................. 5-165
5.5.2 Strategies Carried Forward from the 2011 Regional Plan ......................................... 5-170 5.5.3 Environmental Impact of Strategies Added Since 2011 Regional Water Plan ........... 5-170
LIST OF FIGURES
Figure 5.1 Buena Vista Regional Water Project Location .................................................................... 5-99 Figure 5.2 East Lake Buchanan Regional Project Location ............................................................... 5-102 Figure 5.3 Marble Falls Regional Project Location ........................................................................... 5-104 LIST OF TABLES
Table 5-1: Example of Austin Municipal Return Flow Partitioning ....................................................... 5-5 Table 5-2: Estimated Continued Benefits of Projected City of Austin Return Flows in the 2016 Region
K Plan. ................................................................................................................................ 5-6 Table 5-3: Downstream Return Flows ................................................................................................... 5-7 Table 5-4: Additional Water Savings from Enhanced Conservation (ac-ft/yr) ........................................ 5-8 Table 5-5: Water Management Strategies (ac-ft/yr) ............................................................................. 5-11 Table 5-6 Cost Estimate for City of Austin Conservation .................................................................... 5-11 Table 5-7: Municipal Water Conservation Savings (ac-ft/yr) ............................................................... 5-15 Table 5-8 Cost Estimate for Municipal Conservation Strategies .......................................................... 5-17 Table 5-9: On-Farm Conservation Estimates of Water Savings ........................................................... 5-20
2016 LCRWPG WATER PLAN 5-iv
Lower Colorado Regional Water Planning Group November 2015
Table 5-10 Estimated Unit Cost of Agricultural Conservation Improvements ...................................... 5-21 Table 5-11 On-Farm Conservation Costs ........................................................................................... 5-21 Table 5-12: Irrigation District Conveyance Improvement Estimates .................................................... 5-25 Table 5-13 Irrigation District Conveyance Improvements Costs ......................................................... 5-26 Table 5-14 Sprinkler Irrigation Estimate of Water Savings.................................................................. 5-28 Table 5-15 Sprinkler Irrigation Costs .................................................................................................. 5-29 Table 5-16: Summary of LCRA Water Management Strategies (ac-ft/yr) ............................................ 5-30 Table 5-17: Available Interruptible LCRA Water Supply for Agricultural Use .................................... 5-33 Table 5-18: Recommended LCRA Contract Amendments .................................................................. 5-37 Table 5-19: Recommended New LCRA Contracts .............................................................................. 5-39 Table 5-20 LCRA Groundwater for FPP (on-site) Cost ....................................................................... 5-41 Table 5-21 LCRA Groundwater for FPP (off-site) Cost ...................................................................... 5-43 Table 5-22: LCRA Expand Use of Groundwater (Carrizo-Wilcox) Cost.............................................. 5-44 Table 5-23: LCRA Lane City Off-Channel Reservoir Cost .................................................................. 5-46 Table 5-24: LCRA Prairie Site Off-Channel Reservoir Cost ................................................................ 5-48 Table 5-25: LCRA Mid-Basin Reservoir Cost ..................................................................................... 5-49 Table 5-26: LCRA Excess Flows Reservoir Project Yield ................................................................... 5-51 Table 5-27: LCRA Excess Flows Reservoir Cost ................................................................................ 5-51 Table 5-28: COA Water Management Strategies (ac-ft/yr) .................................................................. 5-54 Table 5-29: Anticipated Reclaimed Water Capacity (Direct Reuse) ..................................................... 5-55 Table 5-30: Cost Estimate for City of Austin Direct Reuse Strategy .................................................... 5-56 Table 5-31: Projected COA Return Flows by Decade* ........................................................................ 5-57 Table 5-32: City of Austin Aquifer Storage and Recovery Project Yields ............................................ 5-58 Table 5-33: City of Austin Aquifer Storage and Recovery Strategy Costs ........................................... 5-58 Table 5-34: City of Austin Longhorn Dam Operation Improvements Yield ......................................... 5-59 Table 5-35: City of Austin Longhorn Dam Operations Improvements Costs ....................................... 5-60 Table 5-36: City of Austin Rainwater Harvesting Yield ...................................................................... 5-61 Table 5-37: City of Austin Rainwater Harvesting Cost ........................................................................ 5-62 Table 5-38: City of Austin Lake Long Enhanced Storage Project Yields ............................................. 5-63 Table 5-39: City of Austin Lake Long Enhanced Storage Cost ............................................................ 5-63 Table 5-40: City of Austin Other Reuse Project Yield ......................................................................... 5-65 Table 5-41: City of Austin Other Reuse Cost ...................................................................................... 5-65 Table 5-42: City of Austin Capture Local Inflows to Lady Bird Lake Project Yield ............................ 5-66 Table 5-43: City of Austin Capture Local Inflows to Lady Bird Lake Cost .......................................... 5-66 Table 5-44: City of Austin Indirect Potable Reuse through Lady Bird Lake Project Yield ................... 5-67 Table 5-45: City of Austin Indirect Potable Reuse through Lady Bird Lake Cost................................. 5-67 Table 5-46: City of Austin Lake Austin Operations Project Yield ....................................................... 5-68 Table 5-47: City of Austin Lake Austin Operations Cost ..................................................................... 5-69 Table 5-48: Carrizo-Wilcox Aquifer Expansions................................................................................. 5-70 Table 5-49: Carrizo-Wilcox Aquifer Expansion Costs......................................................................... 5-71 Table 5-50: Ellenburger-San Saba Aquifer Expansions ....................................................................... 5-72 Table 5-51: Ellenburger-San Saba Aquifer Expansion Costs ............................................................... 5-73 Table 5-52: Edwards-BFZ Aquifer Expansions ................................................................................... 5-74 Table 5-53: Edwards-BFZ Aquifer Expansion Costs ........................................................................... 5-74 Table 5-54: Gulf Coast Aquifer Expansions ........................................................................................ 5-75 Table 5-55: Gulf Coast Aquifer Expansion Costs ................................................................................ 5-76 Table 5-56: Hickory Aquifer Expansions ............................................................................................ 5-77 Table 5-57: Hickory Aquifer Expansion Costs .................................................................................... 5-78
2016 LCRWPG WATER PLAN 5-v
Lower Colorado Regional Water Planning Group November 2015
Table 5-58: Marble Falls Aquifer Expansions ..................................................................................... 5-79 Table 5-59: Marble Falls Aquifer Expansion Costs ............................................................................. 5-79 Table 5-60: Sparta Aquifer Expansions ............................................................................................... 5-80 Table 5-61: Sparta Aquifer Expansion Costs ....................................................................................... 5-81 Table 5-62: Trinity Aquifer Expansions .............................................................................................. 5-82 Table 5-63: Trinity Aquifer Expansion Cost ....................................................................................... 5-83 Table 5-64: Carrizo-Wilcox Aquifer Development.............................................................................. 5-84 Table 5-65: Carrizo-Wilcox Aquifer Development Costs .................................................................... 5-84 Table 5-66: Gulf Coast Aquifer Development ..................................................................................... 5-85 Table 5-67: Gulf Coast Aquifer Development Costs ........................................................................... 5-86 Table 5-68: Hickory Aquifer Development ......................................................................................... 5-87 Table 5-69: Hickory Aquifer Development Costs................................................................................ 5-87 Table 5-70: Queen City Aquifer Development .................................................................................... 5-88 Table 5-71: Queen City Aquifer Development Costs........................................................................... 5-89 Table 5-72: Trinity Aquifer Development ........................................................................................... 5-89 Table 5-73: Trinity Aquifer Development Costs ................................................................................. 5-90 Table 5-74: Hays County Pipeline Water Supplies .............................................................................. 5-91 Table 5-75: Hays County Pipeline Costs for Region K ........................................................................ 5-92 Table 5-76: HCPUA Pipeline Water Supplies for Region K ................................................................ 5-93 Table 5-77: HCPUA Pipeline Costs for Region K ............................................................................... 5-93 Table 5-78: Edwards / Middle Trinity ASR Project Yields .................................................................. 5-95 Table 5-79: Edwards / Middle Trinity ASR Costs .............................................................................. 5-95 Table 5-80: Saline Edwards ASR Project Yields ................................................................................. 5-97 Table 5-81: Saline Edwards ASR Costs .............................................................................................. 5-98 Table 5-82: Buena Vista Regional Project Yields .............................................................................. 5-100 Table 5-83: Buena Vista Regional Project Costs ............................................................................... 5-101 Table 5-84: East Lake Buchanan Project Yield ................................................................................. 5-102 Table 5-85: East Lake Buchanan Regional Project Costs................................................................... 5-103 Table 5-86: Marble Falls Regional Project Yields ............................................................................. 5-105 Table 5-87: Marble Falls Regional Project Costs............................................................................... 5-106 Table 5-88: Water Purchase Strategy Suppliers and Yields .............................................................. 5-107 Table 5-89: Brush Control Yields ..................................................................................................... 5-110 Table 5-90: Brush Control Costs ....................................................................................................... 5-111 Table 5-91: Drought Management for Municipal WUGs ................................................................... 5-114 Table 5-92: Drought Management for Irrigation WUGs .................................................................... 5-120 Table 5-93: Village of Volente Yield Associated with New Surface Water Infrastructure .................. 5-123 Table 5-94: Village of Volente Infrastructure Costs Needed for a Surface Water Contract ................. 5-123 Table 5-95: City of Bastrop New Surface Water Infrastructure for LCRA Contract Yield ................. 5-125 Table 5-96: City of Bastrop Infrastructure Costs Needed for New LCRA Contract ............................ 5-125 Table 5-97: City of Elgin New Surface Water Infrastructure for LCRA Contract Yield ..................... 5-126 Table 5-98: City of Elgin Infrastructure Costs Needed for New LCRA Contract ............................... 5-126 Table 5-99: Aqua WSC New Surface Water Infrastructure for LCRA Contract Yield ....................... 5-128 Table 5-100: Aqua WSC Infrastructure Costs Needed for New LCRA Contract ................................ 5-128 Table 5-101: Direct Reuse Summary of Project Yields...................................................................... 5-129 Table 5-102: Direct Reuse Summary of Project Costs ....................................................................... 5-129 Table 5-103 Irrigation Water Needs (ac-ft/yr) ................................................................................... 5-136 Table 5-104: Irrigation Water Needs in the Rice-Growing Counties (ac-ft/yr) ................................... 5-136
2016 LCRWPG WATER PLAN 5-vi
Lower Colorado Regional Water Planning Group November 2015
Table 5-105 Summary of Recommended Water Management Strategies to Meet Irrigation Needs in Colorado, Matagorda, and Wharton Counties .................................................................. 5-137
Table 5-106 Unmet Mining Needs in Region K ................................................................................ 5-138 Table 5-107: COA Steam Electric Power Water Demand (ac-ft/yr) ................................................... 5-139 Table 5-108: COA Steam-Electric Supplies and Water Management Strategies (ac-ft/yr) .................. 5-139 Table 5-109: Alternate Canal Delivery Project Yield ........................................................................ 5-141 Table 5-110: Cost Estimate for STP Alternate Canal Delivery .......................................................... 5-142 Table 5-111: Gulf Coast Aquifer Development Costs........................................................................ 5-143 Table 5-112: LCRA Wholesale Water Supply Alternative Water Management Strategies (ac-ft/yr) ... 5-144 Table 5-113: LCRA Alternative Groundwater Importation Cost ........................................................ 5-145 Table 5-114: LCRA Alternative Import Return Flows from Williamson County Cost ....................... 5-146 Table 5-115: Total Water Needs Comparison between Brazos and Colorado River
Basins (Ac-Ft/Yr)......................................................................................................... 5-147 Table 5-116: LCRA Alternative Supplement Bay & Estuary Inflows with Brackish Groundwater
Cost. ............................................................................................................................... 5-149 Table 5-117: LCRA Alternative Brackish Groundwater Desalination Cost ........................................ 5-149 Table 5-118: LCRA Alternative Baylor Creek Reservoir Cost .......................................................... 5-151 Table 5-119: LCRA Aquifer Storage and Recovery Cost .................................................................. 5-153 Table 5-120: LCRA Alternative Enhanced Recharge Cost ................................................................ 5-155 Table 5-121: COA Alternative Brackish Groundwater Desalination Project Yield ............................. 5-155 Table 5-122: COA Alternative Brackish Groundwater Desalination Costs ........................................ 5-156 Table 5-123: COA Alternative Reclaimed Water Bank Infiltration Project Yield .............................. 5-157 Table 5-124: COA Alternative Reclaimed Water Bank Infiltration Costs .......................................... 5-157 Table 5-125: Alternative HCPUA Pipeline Project Yield .................................................................. 5-158 Table 5-126: Alternative HCPUA Pipeline Project Costs .................................................................. 5-158 Table 5-127: City of Goldthwaite Channel Dam Project Firm Yield ................................................. 5-162 Table 5-128: City of Goldthwaite Channel Dam Cost ...................................................................... 5-162 Table 5-129: City of Goldthwaite Raw Water Supply Line Yield ...................................................... 5-163 Table 5-130: City of Goldthwaite Raw Water Supply Line Costs ...................................................... 5-164 Table 5-131: City of Wharton Water Supply Strategy Yield .............................................................. 5-165 Table 5-132: City of Wharton Water Supply Strategy Costs .............................................................. 5-165 Table 5-133: Comparison of BBEST recommendations for Matagorda Bay Inflows from Colorado
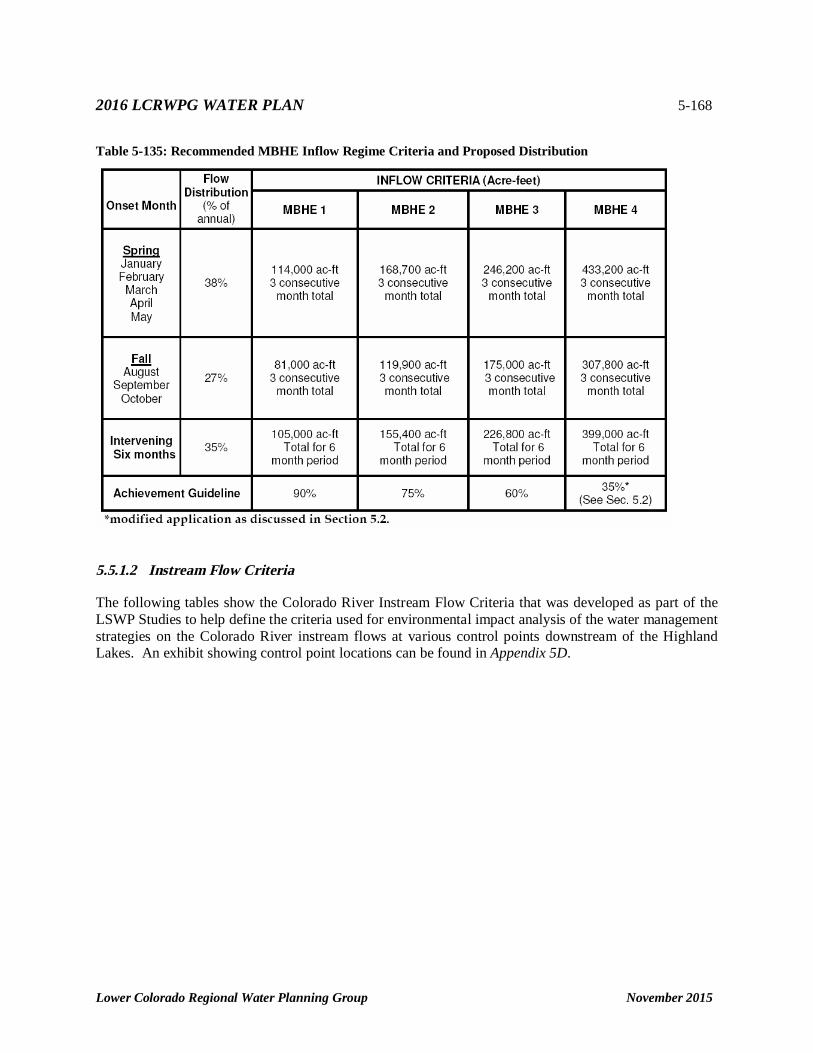
River Basin to WAM Run3 values .............................................................................. 5-166 Table 5-134: Inflow Categories and Range of Inflow Criteria ........................................................... 5-167 Table 5-135: Recommended MBHE Inflow Regime Criteria and Proposed Distribution ................... 5-168 Table 5-136: Instream Flow Guidelines for the Lower Colorado River Specific to the LSWP (cfs) .... 5-169 Table 5-137: Instream Flow Guidelines for the Lower Colorado River (ac-ft/yr)) .............................. 5-169 APPENDICES
APPENDIX 5A: Potentially Feasible Water Management Strategies APPENDIX 5B: Recommended and Alternative Water Management Strategy Tables APPENDIX 5C: Water Management Strategy Cost Summary Tables APPENDIX 5D: Environmental Impacts of New Strategies in the 2016 Region K Plan APPENDIX 5E: Environmental Impacts of Strategies from the 2011 Region K Plan APPENDIX 5F: TWDB DB17 Reports
2016 LCRWPG WATER PLAN 5-1
Lower Colorado Regional Water Planning Group November 2015
CHAPTER 5.0: IDENTIFICATION, EVALUATION, AND SELECTION OF WATER MANAGEMENT STRATEGIES BASED ON NEED
Chapter 4 identified the WUGs in the region with water needs. Appendix 4A lists all WUGs within Region K with shortages. This chapter (Chapter 5) describes the analysis regarding the identification, evaluation, and selection of appropriate water management strategies for the Region K. Water management strategies have been defined for each of the identified future water shortages within Region K as required by the regional water planning process. Included within this chapter are:
Description of the potentially feasible water management strategies
Definition of the recommended and alternative water management strategies
Allocation of selected strategies to specific WUGs
In addition to the above, this chapter has a sub-section specifically to address water conservation, including any recommended water conservation management strategies.
5.1 POTENTIAL WATER MANAGEMENT STRATEGIES
Region K presented their process for identifying potential water management strategies for public comment at the January 9, 2013, Region K meeting.
TWDB regional water planning guidelines provide a list of potentially feasible water management strategies that should include, but is not limited to:
Expanded use of existing supplies.
New supply development.
Conservation and drought management measures.
Reuse of wastewater.
Interbasin transfers.
Emergency transfers.
The Region K process that was used to identify potentially feasible water management strategies for the region includes the following:
1. Define groupings or common areas with supply deficiencies.
2. Develop a comprehensive list of potentially feasible strategies for each area.
• Recommended and alternative strategies from 2011 Region K Water Plan
• Strategies documented in local plans
• Suggestions from the public
2016 LCRWPG WATER PLAN 5-2
Lower Colorado Regional Water Planning Group November 2015
3. Meet with potential suppliers/WUGs for each area to determine current strategies under consideration.
4. Prepare qualitative rating based on cost, reliability, environmental impact, and political acceptability for the various strategies.
5. Select one or more additional strategies for each area, if appropriate.
6. Present proposed shortlist at Public Meeting during Region K Planning Group meeting for modification and/or approval.
The complete list of potentially feasible water management strategies considered in the 2016 RWP are included in Appendix 5A. Appendix 5A also includes a table that identifies whether each category of water management strategy required for consideration by TWDB is potentially feasible or is not potentially feasible for each Water User Group (WUG) with water needs.
5.2 RECOMMENDED WATER MANAGEMENT STRATEGIES
The primary emphasis of the regional water planning effort is the development of regional water management strategies sufficient to meet the projected needs of WUGs throughout the state. Water needs are determined by comparing user group water demands to the water supplies available to that user group. The following sections present information concerning the identification, evaluation, and selection of specific water management strategies to meet specific projected water supply shortages for the LCRWPA (Region K). If a project sponsor wishes to be considered for certain types of State funding, the project that the funding is requested for must be included in the Regional and State Water Plan. It should be noted that local plans that are not inconsistent with the regional water supply plan are also eligible to apply for certain types of TWDB financial assistance to implement those local plans even though they have not been specifically recommended in this plan.
The identified water needs presented in Chapter 4 are based on conservative water availability estimates, which assume only water available during a repeat of the worst DOR, that all rights are being fully and simultaneously utilized, and exclude water available from LCRA on an interruptible basis and water available as a result of municipal return flows to the Colorado River. The water management strategies are intended to alleviate these projected water supply shortages (water needs). A table of the recommended water management strategies by WUG is contained in Appendix 5B. Appendix 5C contains the TWDB Costing Tool Cost Summary for each applicable strategy.
Regional water planning groups are required to take into account and report water loss estimates in the evaluation of water management strategies. A summary of water loss for Region K is provided at the end of Chapter 1. It shows an average real loss of 9.8% for the region. Reported real losses for individual municipal WUG from the 2010 audit submitted to TWDB range from 0% to 57%. These real losses are embedded in the water use survey data that the TWDB uses to project municipal water demands and determine water needs in the regional water planning process. Certain conservation strategies recommended in the 2016 Region K Water Plan are intended to decrease the water loss percentage for existing infrastructure, both for municipal and for irrigation water users. Drought management strategies recommended in this plan have no associated water losses. Strategies involving new or amended contracts or the purchase of water from a supplier are assumed to have no additional water losses with the use of existing infrastructure.
2016 LCRWPG WATER PLAN 5-3
Lower Colorado Regional Water Planning Group November 2015
Recommended and alternative surface water strategies such as new reservoirs have water losses associated with evaporation that are included in the modeling analyses. Surface water strategies containing new infrastructure such as pump stations and transmission pipelines are assumed to have negligible water losses. Reuse projects are assumed to have negligible water losses as well.
Recommended and alternative groundwater strategies include aquifer storage and recovery (ASR), expansion of existing groundwater supplies, and development of new groundwater supplies, including importation from outside of the region. ASR reduces the water losses associated with evaporation from a reservoir, but there can be water losses due to recovery efficiency from the aquifer. Migration rates vary depending on the aquifer used for storage, and impacts will depend on how long the stored water remains in the aquifer. Recovery efficiency will have some impacts on water volume, but should have negligible impacts on the firm yield volumes. Groundwater expansion strategies that assume additional yield from existing infrastructure have no additional water losses associated with them. Groundwater expansion, development, and importation strategies that require new infrastructure are assumed to have negligible water losses.
Alternative desalination strategies in this plan have yields that are assumed to account for approximately 10 percent water loss, due to concentrate disposal.
5.2.1 Utilization of Return Flows
Approximately 60 percent of all municipal diversions by the City of Austin (COA) and others are currently returned to the Colorado River as effluent discharges. Unless otherwise authorized by permit, once discharged to the river, this water is subject to diversion under existing water rights’ permits. State law currently allows a water right holder to consumptively use all of the water authorized by permit, unless discharge is required by permit. Direct reuse is one possible manner in which a water right holder may increase consumptive use of the water authorized for diversion and use under the water right. The Region K Cutoff WAM for the Colorado River that was used for determining water supply in this round of planning excludes all sources of return flows from the model. The inclusion of return flows in the model is proposed as a water management strategy for the benefit of water rights and environmental flows and indirect reuse by the City of Austin in future regional water plans, consistent with a settlement agreement between Austin and the Lower Colorado River Authority.
The exclusion of all return flows in the determination of water supply leads to conservatively low estimates of available surface water supply for planning purposes. Water shortages for entities that currently use and rely upon the return flows may not be realistic as long as upstream return flow discharges continue into the future. For purposes of this plan, the water management strategies include use of projected state surface water that result from discharge of return flows by the COA and the City of Pflugerville. Strategies related to COA’s reuse of treated effluent are described in Section 5.2.3.2. This plan assumed projected levels of effluent to be discharged by the City of Pflugerville of 60 percent of the total projected demand after water savings for drought management, conservation, and reuse have been accounted for in each planning decade. Effluent not being directly reused by Austin as a strategy and these other projected levels of effluent were made available to help meet environmental flow needs of the river and Matagorda Bay and water rights, according to the prior appropriation doctrine. Therefore, return flow assumptions for purposes of developing LCRA’s water strategies incorporate and reflect the COA’s proposed strategies of reuse of effluent to meet portions of municipal and manufacturing demand and COA’s steam electric demand in Travis County, including use of reclaimed water at the Sand Hill Energy Center, and the return flow sharing strategy described in Section 5.2.1.1.
2016 LCRWPG WATER PLAN 5-4
Lower Colorado Regional Water Planning Group November 2015
5.2.1.1 COA Return Flows Strategy
In 2007, the City of Austin and LCRA signed a settlement agreement that resolved several permitting disputes and outlined a proposed arrangement for shared rights to the beneficial use of return flows discharged by the City of Austin. According to the settlement agreement, the two parties will seek regulatory approval to effectuate the strategy of joint return flow benefit. The settlement contemplates that the return flows will be managed between the two parties to first help satisfy environmental flow needs before Austin conducts indirect reuse. If Austin has an indirect reuse project in operation that is consistent with the terms and conditions of the Settlement Agreement, LCRA will not call on return flow passage for diversion under LCRA’s water rights unless, first, environmental needs and, second, Austin’s indirect reuse needs are met.
At this time, the City of Austin has not developed plans for implementing an indirect reuse project under the COA-LCRA Joint Application for Reuse pending at TCEQ, as outlined by the City of Austin and LCRA 2007 Settlement Agreement. Future Region K plans are expected to include assumptions related to indirect reuse under this pending joint COA-LCRA permit. Consistent with the 2007 settlement agreement language regarding the shared rights to the beneficial use of return flows and because Austin has not proposed a specific indirect reuse project under the pending joint COA-LCRA permit, return flows were modeled for downstream water right availability only as an illustration of concept. First, return flows were allocated towards meeting environmental flow requirements (instream flow and bay and estuary freshwater inflow requirements) of LCRA’s Water Management Plan, as contained in the Region K Cutoff model, as well as the Environmental Flow Standards for base flow at the Bastrop gage, as needed. Thereafter, the return flows were made available for use by downstream water rights according to the doctrine of prior appropriation.
In this plan, after meeting the environmental flow requirements, as needed, in the Region K Cutoff model, the projected remaining return flows were made available to meet all downstream demands, including environmental, municipal, irrigation, and industrial (including steam electric) water needs, in accordance with the prior appropriation doctrine. The partitioning of Austin’s municipal return flows between environmental flow requirements and water rights is indicated by Table 5-1. It should be noted that the partitioning of return flows shown in Table 5-1 is dependent on the modeling assumptions used in the Region K Cutoff model and is presented here only as an illustration of concept. Environmental flow requirements will likely change in the future based on the latest scientific studies and actual water right utilization levels throughout the basin. The settlement agreement contemplates a framework for joint management between the two parties so that environmental flow requirements, as based on the best available science at the time, will be satisfied with Austin’s return flows prior to beneficial use by either party’s water rights.
2016 LCRWPG WATER PLAN 5-5
Lower Colorado Regional Water Planning Group November 2015
Table 5-1: Example of Austin Municipal Return Flow Partitioning
Modeling for Table 5-1 uses the Region K Cutoff assumption, the 2010 LCRA Water Management Plan environmental flow requirements for Lakes Travis and Buchanan, the Environmental Flow Standards for base flow at the Bastrop gage, and assumes all water rights are exercised according to their fully authorized amounts. City of Austin municipal return flows are added to the model according to the decadal projection of discharge to the river as given by Table 5-2.
Until the City of Austin and LCRA have been granted regulatory approval for the strategy of joint return flow benefit and until Austin implements an indirect reuse project consistent with the terms and conditions of the Settlement Agreement, the beneficial use of these return flows as a water management strategy as indicated in Table 5-2 helps meet the projected needs identified in Chapter 4 which were the result of the conservative modeling assumptions used in Chapter 3.
The quantity of return flows is projected to increase over the 50-year planning period due to increased water demands in the Austin area even though the quantity of water reused during this period will increase as well. However, beyond 2070, the COA projects that it will significantly increase its reuse of treated effluent to nearly 100 percent through direct and indirect reuse with the indirect reuse being implemented only in accordance with the 2007 settlement agreement. As return flows discharged by Austin diminish in the future due to enhanced reclamation of water, other sources may need to be dedicated or developed to meet needs that may currently be met by return flows discharged by Austin.
2020 2030 2040 2050 2060 2070Total Projected Austin Municipal Return Flow Discharged to the Stream After Reuse Projects, ac-ft/yr
77,013 73,057 80,023 85,707 89,806 101,578
Average Return Flow Used to Satisfy 2010 WMP Environmental Flows During 1950's Drought, ac-ft/yr
42,784 40,875 45,087 48,628 51,308 58,434
Average Return Flow Used to Satisfy SB3 Baseflows at Bastrop During 1950's Drought, ac-ft/yr
1,609 1,642 1,927 2,200 2,448 2,931
Average Return Flow Available to Water Rights After Satisfying Environmental Flows During 1950's Drought, ac-ft/yr
32,620 30,540 33,009 34,879 36,050 40,213
Total 77,013 73,057 80,023 85,707 89,806 101,578
Average Return Flow Used to Satisfy 2010 WMP Environmental Flows for 1940 to 2013 Period of Record, ac-ft/yr
26,775 26,395 30,001 33,299 36,114 42,230
Average Return Flow Used to Satisfy SB3 Baseflows at Bastrop for 1940 to 2013 Period of Record, ac-ft/yr
5,876 5,015 4,881 4,571 4,103 3,863
Average Return Flow Available to Water Rights After Satisfying Environmental Flows for 1940 to 2013 Period of Record, ac-ft/yr
44,362 41,648 45,142 47,837 49,590 55,485
Total 77,013 73,057 80,023 85,707 89,806 101,578
2016 LCRWPG WATER PLAN 5-6
Lower Colorado Regional Water Planning Group November 2015
Table 5-2: Estimated Continued Benefits of Projected City of Austin Return Flows in the 2016 Region K Plan
COA Return Flows 2020 2030 2040 2050 2060 2070
Projected COA Effluent minus reuse 77,013 73,057 80,023 85,707 89,806 101,578
Estimated Benefit to Matagorda Bay 13,485 13,140 9,639 14,025 11,723 13,231 Note: Estimates derived originally from 2006 Region K Plan RJ Brandes Company preliminary modeling using updated demands. 1 The benefits for each major water right were computed by adjusting the estimated benefits from the modeling work completed in the 2006 Region K Plan for return flow amounts projected in the 2016 Region K Plan. The benefits represent the estimated increase in firm supply available to each water right due to the addition of the City of Austin return flows in the model. 2 These values represent the gains due to return flows in the portions of the water rights used for non-irrigation purposes. 3 This value represents the gains due to return flows in the portion of the Irrigation ROR water rights that are used for irrigation purposes.
Opinion of Probable Costs
There are no capital costs associated with the diversion of this water because the diversions are done under existing water rights permits with existing infrastructure.
Environmental Considerations
Return flows provide a positive impact to the instream flows as they travel downstream to either reach the bay as freshwater inflows, or be diverted by downstream water users. Benefits to the bay are shown in Table 5-2.
Agricultural and Natural Resources Considerations
Return flows, when available for diversion by the downstream irrigators, provide a positive impact to agriculture. Benefits to irrigation are shown in Table 5-2.
Issues and Considerations
Issues related to ownership of treated wastewater effluent are discussed in Chapter 8 (Section 8.1.8).
2016 LCRWPG WATER PLAN 5-7
Lower Colorado Regional Water Planning Group November 2015
5.2.1.2 Downstream Return Flows
In addition to the COA, return flows for the City of Pflugerville were also taken into consideration. This plan assumed projected levels of effluent to be discharged by the City of Pflugerville of 60 percent of the total projected demand after water savings for drought management, conservation, and reuse have been accounted for in each planning decade. Table 5-3 shows the estimated benefits of these return flows by planning decade. These downstream return flows are assigned as a benefit to LCRA.
Table 5-3: Downstream Return Flows
Water Management Strategies (ac-ft/yr)
2020 2030 2040 2050 2060 2070
5,086
5,834
6,784
8,636
8,997
10,453
Opinion of Probable Costs
There are no capital costs associated with the diversion of this water because the diversions are done with existing infrastructure or proposed infrastructure with costs identified in other strategies.
Environmental Considerations
Return flows provide a positive impact to the instream flows as they travel downstream to a diversion point. A potential diversion point for LCRA for these downstream return flows is the proposed Mid-Basin Reservoir project diversion point. Environmental impacts beyond the diversion point would be up to 10,453 acre-feet/year of diverted flow.
Agricultural and Natural Resources Considerations
If the return flows are diverted for storage in the proposed Mid-Basin Reservoir by LCRA, the potential benefit for agriculture that would come from those flows traveling further downstream and being available for run-of-river irrigation diversions would be negligible.
Issues and Considerations
Issues related to ownership of treated wastewater effluent are discussed in Chapter 8 (Section 8.1.8).
5.2.2 Conservation
The LCRWPG supports conservation as an important component of water planning. It is more effective and less costly to use less water than to develop new sources. Conservation can be implemented at the municipal, industrial, and agricultural levels.
All entities applying for a new water right or an amendment to an existing water right are required to prepare and implement a water conservation plan. The plan is to be submitted to TCEQ along with the application.
2016 LCRWPG WATER PLAN 5-8
Lower Colorado Regional Water Planning Group November 2015
Additional entities that are required to prepare and submit conservation plans include municipal, industrial, and other non-agricultural water right holders of 1,000 acre-feet per year or greater; and agricultural water right holders of 10,000 acre-feet per year or greater.
Online model water conservation plans are available at the following link:
As a new requirement by TWDB for the 2011-2016 Planning Cycle, this section of the report consolidates the recommended conservation-related strategies.
5.2.2.1 LCRA Conservation
5.2.2.1.1. Enhanced Municipal and Industrial Conservation
LCRA recently completed its 2014 Water Conservation Plan that addresses water conservation practices for its firm water customers (municipal, industrial, power generation and recreational). These efforts include five-year and 10-year implementation plans that will guide effective water conservation throughout communities in LCRA’s rapidly growing service area. More details on the 2014 Water Conservation Plan can be found online at: http://www.lcra.org/water/save-water/Documents/2014-Water-Conservation-Plan.pdf Conservation measures include regulations, financial incentives and education for water efficiency. All customers with new or renewing contracts must develop and implement water conservation plans. Along with the basic requirements, staff actively encourages customers to adopt additional measures such as a permanent watering schedule limiting use to twice per week and irrigation standards for new development. Financial incentives include providing cost-share_ grants to firm water customers and offering financial incentives for landscape irrigation technologies. Education efforts include providing irrigation evaluation training and assistance for wholesale customers' staff, community outreach presentations and participating in the coordination of the Central Texas Water Efficiency Network annual water conservation symposium. Table 5-4 below shows the expected additional water savings from the enhanced municipal and industrial conservation strategy.
Table 5-4: Additional Water Savings from Enhanced Conservation (ac-ft/yr)
The cost for this strategy was developed as part of the Water Supply Resource Plan: Water Supply Option Analysis for LCRA. For the 2016 Region K Plan, capital costs were updated to $45,875,000 (September
Lower Colorado Regional Water Planning Group November 2015
2013 dollars). The TWDB Cost Estimating Tool was used to calculate total project costs at $64,099,000. The total annual cost is $5,634,000, generating a unit cost of $268 per ac-ft of water saved. The cost per volume of water is expected to vary over implementation, and LCRA anticipates a range between $300 and $400 per ac-ft, allowing that some of the costs associated with the conservation measures would not be capital. The most cost effective conservation measures would be expected to be implemented first, and thus the cost per volume saved would expect to increase over time.
Environmental Impact
Conservation program does not require additional infrastructure which has the potential to require environmental mitigation or other measures to address impacts.
The impacts of this strategy should be considered negligible, as the impacts are already accounted for in the individual conservation strategies identified in Sections 5.2.2.2, 5.2.2.3, and 5.2.2.4.
Agricultural and Natural Resources Considerations
Impacts to agriculture are anticipated to be negligible, as enhanced municipal and industrial conservation will reduce a just a small portion of the expected increases to firm demands over time.
5.2.2.1.2. Agricultural Conservation
Irrigators in Colorado, Wharton, and Matagorda Counties have the largest irrigation needs in Region K. LCRA’s strategies to be implemented as part of its sale of water to Williamson County under HB 1437 and those under its Agricultural Water Supply Resource Plan (WSRP)1 are designed to extend the availability of interruptible water supply to meet irrigation demands beyond that which would be expected without those improvements. The recommended plan to meet the rice irrigation shortage that is reflected in the Agricultural WSRP is based on the studies done for the LCRA-SAWS water project, published between 2006 and 2008, and incorporated in the 2011 Regional Water Plan. Stakeholders participating in these studies included several rice irrigators, representatives from the affected counties, representatives from LCRA, environmental representatives, and representatives interested in the impacts on the Highland Lakes. The strategies, which are outlined in detail in Section 5.2.2.4 rely heavily on adoption of the various strategies in the Agricultural WSRP.
5.2.2.2 COA Conservation
The COA began an aggressive water conservation campaign in the mid-1980s in response to rapid growth and a series of particularly dry years. COA has achieved significant reductions in both per capita consumption and peak day to average day demand ratio. For the per capita use calculations, the COA used a modified GPCD from year 2011 approved by the LCRWPG and TWDB as their base year since the COA had mandatory water conservation measures in place from September through December that year.
In 1990, the City’s conservation program evolved from primarily reacting to high summertime demands to a comprehensive program with the goals of reducing both per capita consumption and peak day
1 “Water Supply Strategies for Agriculture, a supplement to the water supply resource plan.” LCRA. November 2011.
2016 LCRWPG WATER PLAN 5-10
Lower Colorado Regional Water Planning Group November 2015
demand. To achieve these broader goals, the City has implemented and anticipates continuing water conservation efforts and programs in a number of areas including:
Leak reduction, leak response, and water loss reduction
Water main replacement program
Drought tolerant WaterWise landscaping
Irrigation system audits and efficiency programs
Water use efficiency programs including irrigation system and vehicle wash facility assessments
Public education and outreach including school programs
Rebate and incentive programs
Local ordinances that increase water efficiency by customers
Support of legislation that increases water efficiency in plumbing products and appliances at both the State and Federal level,
Increased water efficiency in utility operations
Conservation-oriented rate structures
A/C Condensate recovery and cooling tower rebates
Meter and water use efficiency programs
Through its various water conservation programs, the COA has made significant advances in reducing per capita water use in its service area. The COA is committed to continuing to seek ways to reduce its per capita demands as a best management practice for its utility. In 2009, the Austin City Council charged the Citizens Water Conservation Implementation Task Force (CWCITF) with producing a list of possible conservation measures to reduce water use in Austin beyond the savings that were expected from recommendations from a previous City Council created water conservation task force, the 2007 Water Conservation Task Force. As directed by Council resolution in May 2010, Austin Water evaluated the savings potential of the CWCITF strategies along with the savings expected from ongoing and planned efforts and developed an action plan to reduce water use in Austin to 140 gallons per capita, per day or lower by 2020. In harmony with this goal, efforts are made to increase Austin’s customers’ understanding of their water use and to educate them on ways to use water more efficiently. The following strategies were identified by Austin Water 140 GPCD Conservation Plan (140 Plan) to meet the following program goals:
Reach 140 GPCD by 2020
Reduce peak demand
Pursue cost effective strategies
Ensure conservation reaches all customer sectors
Ensure consumer awareness of conservation
Promote innovation in water conservation
2016 LCRWPG WATER PLAN 5-11
Lower Colorado Regional Water Planning Group November 2015
Projected savings from municipal and manufacturing conservation are shown in the following table. Note that these projected savings from conservation represent estimated savings from programs generally outlined above. These savings do not include additional potential savings from water conservation and demand reduction measures such as graywater use, rainwater harvesting, and water reuse. Additional conservation savings from these other demand reduction strategies are discussed in upcoming sections.
Table 5-5: Water Management Strategies (ac-ft/yr)
Water Management Strategies (ac-ft/yr)
2020 2030 2040 2050 2060 2070
22,969 24,559 28,317 31,220 33,822 36,899
Costs Implications of Proposed Strategy
Costs were calculated to include a variety of conservation measures. The Texas Water Development Board (TWDB) Cost Estimating Tool methodology was used to determine capital costs, annual costs, and unit costs, once the construction costs were developed. The unit cost is presented as an average, with some conservation measures being more expensive and some being less. A change from previous Region K water planning cycles is that capital costs have been included for conservation measures. Capital costing efforts focused on smart meters and leak detection and repair, but were meant to encompass other types of capital-cost associated conservation measures as well. Capital costs for leak detection and repair were estimated using information from City of Austin on their current expenditures for water line replacements. Smart meters were assumed a cost of $100 per home. Non-capital cost conservation measures were included in the total costs at an average of $250/acre-foot of water savings. Many of the non-capital cost measures are mentioned above, but it is not an exclusive list, and Region K encourages the TWDB to provide funding for all types of conservation measures for WUGs and wholesale water providers within Region K and around the state.
Table 5-6 Cost Estimate for City of Austin Conservation
Total Construction
Cost
Total Capital Cost
Largest Annual
Cost
Unit Cost ($/ac-ft)
$41,434,437 $41,434,437 $7,855,398 $342.00
Environmental Considerations
Water conservation holds several advantages over alternative strategies. For example, water conservation strategies do not require the movement of water between locations. Water conservation can cause changes to wastewater concentrations over time, in which case treatment processes may need to be adjusted to maintain permitted discharge parameters. In addition, water conservation generally does not result in adverse impacts to environmental flows or other environmental considerations. Conservation by the City of Austin could leave up to approximately 37,000 acre-feet/year in the lakes and aquifers.
2016 LCRWPG WATER PLAN 5-12
Lower Colorado Regional Water Planning Group November 2015
Agricultural & Natural Resources Considerations
Negligible impacts to agriculture are anticipated as a result of this strategy.
5.2.2.3 Municipal Conservation
Reduction of municipal water demand through conservation was a focal point of the 2011 round of Regional Water Planning in Texas and continues to be a focal point for the 2016 round. The water demands approved by TWDB and the individual Regional Water Planning Groups (RWPGs) have already been adjusted to incorporate the effects of the 1991 State Water Saving Performance Standards for Plumbing Fixtures Act. In addition, RWPGs are required to consider further water conservation measures in their plan or explain reasons for not recommending conservation for Water User Groups (WUG) with water needs.
The LCRWPA currently anticipates 61 municipal WUGs with shortages in the year 2070. Forty-one (41) of these WUGs have per capita water demands in excess of the 140 gallons per capita per day (gpcd) limit proposed by the Water Conservation Implementation Task Force (WCITF) and may be able to reduce their shortages through conservation practices. In addition, many of the WUGs have per capita water demands in excess of 200 gpcd.
A methodology was developed to determine the anticipated municipal water conservation savings for the WUGs within the LCRWPA. First, WUGs were required to meet the following criteria to be chosen for conservation measures:
Be a municipal WUG.
Have a year 2020 per capita water usage of greater than 140 gpcd indicating a potential for savings through conservation.
Conservation was considered, regardless of whether a municipality had a water need.
Per capita water demands were determined from the measured or projected population and water demands for each WUG during each decade. The following methodology was used in calculating water demand reductions:
If the 2020 GPCD is greater than 200
– Apply a 10% GPCD reduction per decade until 200 GPCD is reached.
– Then apply a 5% GPCD reduction per decade until 140 GPCD is reached.
If the 2020 GPCD is greater than 140
– 5% GPCD reduction per decade until 140 GPCD is reached.
If the 2020 GPCD is less than 140
– No conservation considered
2016 LCRWPG WATER PLAN 5-13
Lower Colorado Regional Water Planning Group November 2015
Defer to Water Conservation goals, if applicable
This method follows the recommendation of a 1 percent per year reduction in per capita water demand in order to reach of 200 gpcd, followed by a 0.5 percent per year reduction in per capita water demand until the target demand of 140 gpcd was reached, as proposed by WCITF. Conservation was applied immediately in 2020 regardless of the beginning year of a WUG shortage so that conservation could be implemented early enough to have significant effects on demand by the time the shortage was realized.
A lower limit of 140 gpcd was set, unless a WUG specified in their Water Conservation Plan their intent to reduce further. This was done so that conservation was only recommended to reach reasonable levels. For WUGs that were anticipated to reach a per capita usage below 140 gpcd without conservation in later decades, the lower demands approved by the Regional Planning Group and TWDB were carried forward.
The new per capita usage for each decade was then used along with the WUG population to determine the new water demands for each decade. These values were subtracted from the original water demands to determine the amount of water conserved in each decade.
Burnet County-Other did not fall under the above criteria, but is recommended to receive water from the Buena Vista Regional Project (Section 5.2.4.5.1 ) through an interbasin transfer, requiring that the highest practicable level of achievable water conservation be considered. Therefore, municipal conservation is recommended for Burnet County-Other, Brazos Basin, based on the achievement of 130 gpcd by 2020 and 125 gpcd by 2030.
This strategy is recommended using the criteria above, and is shown in Table 5-7. The City of Austin Water Conservation is a separate strategy and is discussed in Section 5.2.2.2; therefore, it is not included in this table.
Examples of measures that can be implemented to meet this strategy include the following: Utility water loss audits and repair. System water audits are required every five years for all retail utilities and every year for utilities over 3,300 connections. To maximize the benefits of this measure, a utility would use the information from the water audit to revise meter testing and repair practices, reduce unauthorized water use, improve accounting for unbilled water, and implement effective water loss management strategies. Water loss strategies for new development to minimize the need for line flushing can include the addition of extra meters along various line routes to collect more accurate data on water flowing through those routes, creating loops in the water distribution lines, and placing chlorine injection stations strategically throughout the development to avoid the need for excessive flushing to keep chlorine residuals in compliance. “Smart” meters and automatic meter infrastructure (AMI). A "smart" water meter is a measuring device that has the ability to store and transmit consumption data frequently. Sometimes "smart" meters are referred to as "time-of-use" meters because in addition to measuring the volume consumed, they also record the date and time the consumption occurs. "Smart" meters can be read remotely and more frequently, providing instant access to water consumption information for both customers and water utilities. "Smart" water meters are one component of an automated meter infrastructure (AMI) system that water utilities may choose to deploy. AMI systems using "smart" water meters are capable of measuring, collecting, and analyzing water use information and then communicating this information back to the customer via the internet either on request or on a fixed schedule. AMI systems can include
2016 LCRWPG WATER PLAN 5-14
Lower Colorado Regional Water Planning Group November 2015
hardware, software, communications, consumer water use portals and controllers, and other related systems. AMI differs from automatic meter reading (AMR) in that it enables two-way communications with the meter and the water utility. AMI extends current advanced meter reading (AMR) technology by providing two-way meter communications for purposes such as real-time usage and pricing information, leak and abnormal usage detection, and targeted water efficiency messaging. Customer behavioral engagement software. Software programs are now available that utilize customer water use data to develop individual water use reports for customers. This software works best when a utility has AMI, but can also be used without AMI. The objectives of this measure are to assist customers with their personal water management, identify potential water savings, achieve water and cost savings, and increase customer participation in the utility’s incentive programs. These software programs can provide information in a variety of ways and have the ability to run on multiple platforms, including computers, tablets and mobile phone devices. One utility utilizing this type of program identified a 3-5% savings in total water use of customers utilizing this information compared to a control group. A permanent landscape watering schedule limiting spray irrigation of ornamental landscape to no more than twice per week. Several communities in Region K have already adopted a permanent watering schedule for the hot periods of the year, typical from May 1 to September 30 each year. The City of Austin has adopted a year round similar schedule on a year-round basis. This measure, if enforced, saves a substantial amount of water and also lowers peak use during the summer, reducing pressure on water treatment plants and extending the period of time before a new plant is needed. TCEQ 344 landscape irrigation standards for all new development. House Bill 1656, passed in 2007, requires all municipalities with a population of more than 20,000 to adopt these standards. Municipal utility districts and water control improvement districts were also allowed to adopt the standards. Some of the requirements include requiring licensed irrigators to properly design and install the irrigation including proper pressure and zoning for plan requirements, installing a rain sensor, no spray on narrow strips of landscape and other design standards. The licensed irrigator is also required to leave a water schedule and design plan with the customer. Landscape standards for new development. Several Region K WUGs have adopted a variety of landscape standards, including requiring the use of native and adapted plants and drought tolerant turf, limits on irrigated landscape or turf area and a minimum of six inches of adequate soil. The Capital Area Homebuilder’s Association has recently adopted recommended standards for new development that have many of these same requirements. Landscape irrigation evaluations. WUGs can provide or hire a service to provide this service if a majority of customers in the utility service area utilize automatic in-ground irrigation systems. These evaluations can identify irrigation system issues such as leaks, as well as provide the customer with an efficient, appropriate watering schedule. This service also provides a positive customer service image for the utility and can effect positive behavior change through face to face site visits with individual customers.
Public outreach and education programs. To be effective, water conservation education and outreach should be planned and implemented in a consistent and continual manner. Traditional methods such as print and electronic media activities and staffing of community events can be combined effectively with social media applications to relay messaging quickly and frequently to a wide audience with little cost. For smaller utilities, there are many low-cost or free resources available that can be utilized to implement effective public outreach and education programs.
2016 LCRWPG WATER PLAN 5-15
Lower Colorado Regional Water Planning Group November 2015
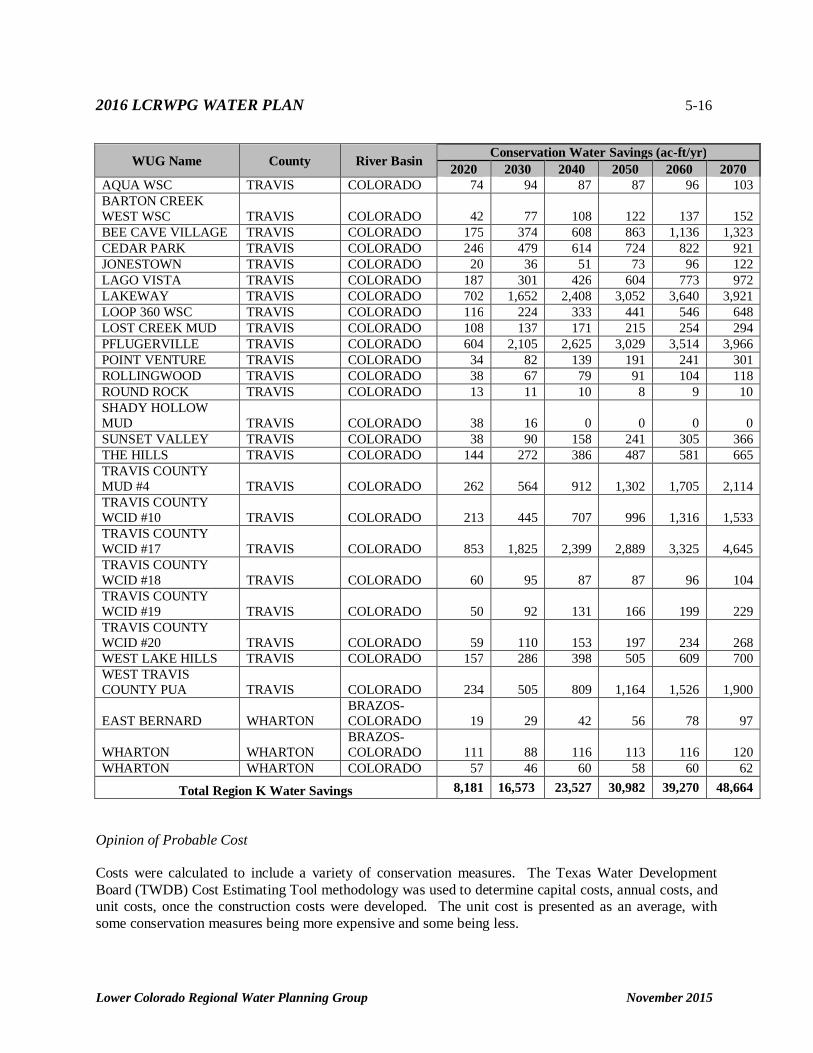
Region K encourages the TWDB to provide funding for all types of conservation measures for WUGs and wholesale water providers within Region K and around the state. The Texas Water Conservation Advisory Council provides ongoing development and updates of many conservation measures – or best management practices (BMPs) – that can meet a WUGs water conservation strategy. More information can be found at the Council’s website www.savetexaswater.org. Table 5-7: Municipal Water Conservation Savings (ac-ft/yr)
WUG Name County River Basin Conservation Water Savings (ac-ft/yr) 2020 2030 2040 2050 2060 2070
Total Region K Water Savings 8,181 16,573 23,527 30,982 39,270 48,664
Opinion of Probable Cost
Costs were calculated to include a variety of conservation measures. The Texas Water Development Board (TWDB) Cost Estimating Tool methodology was used to determine capital costs, annual costs, and unit costs, once the construction costs were developed. The unit cost is presented as an average, with some conservation measures being more expensive and some being less.
2016 LCRWPG WATER PLAN 5-17
Lower Colorado Regional Water Planning Group November 2015
A change from previous Region K water planning cycles is that capital costs have been included for conservation measures. Capital costing efforts focused on smart meters and leak detection and repair, but were meant to encompass other types of capital-cost associated conservation measures as well. Capital costs for leak detection and repair were estimated using information from City of Austin on their current expenditures for water line replacements, and applied proportionally to the smaller municipal WUGs in the region by comparing populations. Smart meters were assumed a cost of $100 per home, with the assumption that 50 percent of homes would implement this strategy in the first decade.
Non-capital cost conservation measures were included in the total costs at an average of $250/acre-foot of water savings. These costs could include both labor and materials associated with implementing standards, incentives and education and outreach. The following table provides the cost information for the WUGs that have a recommended conservation strategy. Table 5-8 Cost Estimate for Municipal Conservation Strategies
BAY CITY MATAGORDA BRAZOS-COLORADO $405,403 $405,403 $84,675 $336
GOLDTHWAITE MILLS COLORADO $41,809 $41,809 $4,486 $449 SAN SABA SAN SABA COLORADO $91,823 $91,823 $31,295 $275 AQUA WSC TRAVIS COLORADO $146,071 $146,071 $26,025 $352 BARTON CREEK WEST WSC TRAVIS COLORADO $38,391 $38,391 $11,855 $282
Conservation has other potential impacts for WUGs that are served by groundwater. Communities that are served by surface water will divert less water from streams, meaning more water will remain in channels for downstream uses. However, groundwater communities contribute to streamflow by discharging treated groundwater into streams (typically 60 percent of water supplied is discharged following treatment.) Conservation measures implemented by these WUGs may lead to an overall decrease in streamflow, which is derived from groundwater sources. However, streamflow would not be expected to be decreased if the conservation is in the irrigation usage sector. Individual WUG implementation has negligible impacts to the region, but full regional implementation could leave up to 49,000 acre-feet/year in the lakes and aquifers. This additional water would increase storage levels, delay drought triggers, and increase springflows.
5.2.2.4 Irrigation Conservation
Several types of conservation measures are recommended to meet Irrigation needs, specifically in Colorado, Matagorda, and Wharton counties. The following sections describe the recommended measures in more detail.
5.2.2.4.1. On-Farm Conservation
The water needed for irrigation in Colorado, Wharton, and Matagorda Counties is the largest deficit identified within the LCRWPA. On-farm water conservation for irrigation is one of the water management strategies developed to address the issue.
Analysis
It is anticipated that significant water savings can be achieved through the use of precision land leveling, multiple field inlets, and reduced levee intervals. The estimated amount of water savings from on-farm water conservation accomplished from 2011 to 2014 is substantial with more than 20,000 acres of land leveled and almost 20,000 acres with multiple inlets installed during that timeframe. Seventy percent of the land leveled and 80 percent of the acreage with multiple inlets installed was in Colorado County. This is likely due to the fact that since 2011, the only irrigation division receiving water from the Colorado River was Garwood, which is 70 percent in Colorado County. However, for many years there has been low participation in Matagorda County, so for maximum water savings to be realized, participation in NRCS’s Environmental Quality Incentives Program (EQIP) in Matagorda County must increase substantially. The maximum potential acreage was taken from LCRA’s Agricultural WSRP, which was based on the studies done for the LCRA-SAWS water project from 2006-2008.
2016 LCRWPG WATER PLAN 5-20
Lower Colorado Regional Water Planning Group November 2015
The conservation estimate was based on updated estimates of total rice acreage in each of LCRA’s irrigation operations, developed from an LCRA-SAWS water project study in 2008. These acreages are the same as those used in the 2011 Region K Water Plan. The estimate also assumes 50 percent adoption of conservation tillage, 55 percent adoption of land leveling, 10 percent adoption of tailwater recovery, and 70 percent adoption of multiple inlets.
Recent changes to the conservation water savings estimates are reflected in Table 5-9.
Table 5-9: On-Farm Conservation Estimates of Water Savings
WUG Name County River Basin Water Management Strategies (ac-ft/yr) 2020 2030 2040 2050 2060 2070
TOTAL 20,000 26,000 32,000 38,000 44,000 50,000 Note: Demand reductions through advanced conservation were distributed to county-basin irrigation WUGs based on the location of shortages.
Rice utilizes significantly more water than many other Texas crops because of the growing environment adopted for rice production. Rice is grown in standing water primarily due to the plant’s requirement for saturated soil moisture conditions during most of its vegetative and reproductive stages, and secondarily to minimize competition from undesirable plants. The flood culture is not required to grow rice, but is currently the only practical method for maintaining the required saturated soil conditions.
Levees are used to separate the individual cuts in a rice field. Maintenance of a uniform shallow water depth allows the levees to maintain greater freeboard or levee height above the water surface. If there is insufficient freeboard, rainfall can cause the levees to overtop and fail with the worst-case result being loss of water from the entire field. Minimizing the flooding depth allows the producer to capture rainwater, replacing an equal amount of water that would normally have been diverted from the river or pumped from wells. The amount of water saved can vary with rainfall during the growing season, but can replace a significant quantity of the water normally diverted from the river and minimize the amount of tail water or rice field runoff water.
There are many potential on-farm irrigation improvements, but in general water savings can best be achieved by minimizing flooding depth and improving management of the flushing and flooding operations. The techniques that have the most significant impact in accomplishing these goals include
2016 LCRWPG WATER PLAN 5-21
Lower Colorado Regional Water Planning Group November 2015
precision or laser land leveling, use of permanent levees with permanent water control structures, use of a field lateral with multiple field inlets, reducing the vertical interval or elevation difference between levees, and improved management of water control activities. Individual water conservation measures are discussed in the following sections.
Opinion of Probable Cost
The total estimated cost for the on-farm strategies recommended in the LCRA’s Agricultural Water Supply Resource Plan is $97,578,000. Many of these on-farm conservation strategies are eligible for funding of up to 70 percent through the EQIP program. Funding for this program in the affected Region K counties may be expanded due to a recent federal grant. Individual producers and landowners bear the costs associated with these on-farm strategies except for that portion that may be eligible for re-imbursement through EQIP or HB1437 grants. Table 5-10 shows the cost of the various conservation strategies based on September 2013 costs. Table 5-11 shows the construction, capital, annual, and unit cost by WUG.
Table 5-10 Estimated Unit Cost of Agricultural Conservation Improvements
Improvement Improvement Cost per Acre Land Leveling $430 Multiple Inlets $88
Lower Colorado Regional Water Planning Group November 2015
Environmental Considerations
On-farm conservation for rice production could influence the instream water balance during dry, summer months in two ways: (1) by reducing the amount of return flows introduced to streams, and (2) by reducing the amount of water diverted from streams. The balance of these two impacts could potentially result in a net gain or loss in dry weather instream flows, depending on the farming practices used. First, the reduced return flows from irrigated fields would negatively impact flows downstream of the fields. These return flows would typically occur during the summer months when this discharge can provide habitat for species and other ecological benefits. However, conservation could have a positive impact on instream flows by reducing the amount of water diverted for irrigation thereby increasing the amount of store water potentially available to meet environmental flow needs over the long term. Overall, it is likely that there would be negligible impacts to streamflow and the bay.
Agricultural and Natural Resources Considerations
On-farm conservation methods have the potential benefit to agriculture in that by reducing the demand for water overall, they increase the likelihood that demands for water could be met on a more consistent basis. In some cases, grant funding and low-interest loan funding availability is critical to local implementation. Impacts to agriculture are mainly cost-related, as shown in Table 5-11.
Laser Land Leveling
In the production of rice, there are many benefits to having fields that are almost level but still have some slope for drainage, typically 0.15 foot or less in elevation change for 100 feet of distance. An almost level field will allow a more uniform shallow water depth across the field, reducing the total amount of water applied to the field. Land grading can give a field this desired condition by using a laser-guided grader.
Precision leveling or land grading can reduce the amount of water used by 25 to 30 percent and increase production by 10 to 15 percent. A 2012 savings verification study prepared for LCRA by the University of Texas LBJ School of Public Affairs2 found that precision leveling, in and of itself, accounts for a 0.30 ac-ft/ac reduction in on-farm water use for the first crop at a 95 percent confidence interval when compared to water use in unleveled fields. Fields where permanent levees were utilized as part of the precision leveling process saved more water than fields that were just land leveled. Fields that were precision leveled and had some levees removed showed an average savings of 0.70 acre-feet per acre. Unfortunately, this higher estimate is not statistically significant. From 2009 to 2012, this study developed, tested and validated qualitative and statistical methods for evaluating how on-farm water usage varies in LCRA’s Lakeside Irrigation Division between fields and between farmers by analyzing water use data from 2006-2011. This study estimates the water savings from precision land leveling, compared to other factors that influence water use.
Interest in large investments in long-term land improvements such as precision land leveling in the rice industry is greater among those rice growers who own their own land. In that case, improvements benefit the landowner and make sense economically, particularly when there is matching grant money available from the Natural Resources Conservation Service. However, in many cases, land is leased on an annual basis for rice production. There is no long-term agreement between the landowner and farmer. This
2 Ramirez, A.K. and Eaton, D. J. “Statistical Testing for Precision Graded Verification,” a report from the University of Texas at Austin to the Lower Colorado River Authority, Austin, TX, September, 2012
2016 LCRWPG WATER PLAN 5-23
Lower Colorado Regional Water Planning Group November 2015
makes it difficult for the farmer to justify a significant capital expenditure, and limits the amount of land where precision leveling is being implemented. The topography and soil type also may limit the amount of land where this practice could be implemented.
Use of Multiple Field Inlets
Another method used by rice producers to conserve water is the utilization of multiple field inlets for applying water to the individual cuts or land sections between levees. The use of multiple inlets allows for many benefits that result in water savings. The water savings is further enhanced when multiple inlets are applied in combination with land leveling. Most of the acreage that has been land leveled through EQIP since 2011 had multiple inlets installed as well. Limited funding and increased competitiveness of the EQIP program led many producers to include both practices in their EQIP applications as a means of increasing their chances of having their applications funded. The most significant benefit of multiple inlets is the ability to apply water where and when it is needed and at a shallower depth. Because of the shallow water, rice production is increased while the total water applied is minimized. A side lateral with multiple inlets is often paired with a similar drain, as opposed to draining all water from a field through the lowest cut. This allows the field to drain more quickly, shortening the time to harvest and increasing the potential for production of a ratoon crop.
Reduced Levee Intervals
Another approach to minimizing the water depth is to reduce the typical contour interval between levees from 0.2 feet to 0.15 feet. The cost associated with making this change can be minimal with only a few additional levees plowed into place at the beginning of the rice growing season. There would be additional costs associated with 1) reduced yield due to a higher percentage of acreage being in levees that produce significantly less rice than flat field areas; 2) increased labor costs associated with monitoring and managing more levees and water control structures; and 3) increased number of water control structures required to be purchased and installed. The smaller interval allows average flooding depth to be minimized, allowing more freeboard for capturing rainfall. Reducing the levee interval can save about 0.3 feet per acre irrigated when used in conjunction with precision land leveling and 0.4 feet per acre irrigated when applied without precision leveling.
Permanent Perimeter Levees
In addition to reduced levee intervals, permanent, taller levees can be installed around the perimeter and in the interior of the rice field. Permanent levees can allow a farmer the ability to hold deeper water for the purpose of safely utilizing rainfall without the fear of breaching the smaller, more traditional levees. The permanent levees are much less likely to be damaged or breached by heavy rain events.
Combining Land Leveling With Multiple Field Inlets
Several combinations of conservation practices could be evaluated, but the LCRWPG Rice Irrigation Working Group decided that the most common combined approach that would result in the greatest water savings would be the combination of land leveling with the use of multiple inlets. In many cases the farmers that use these two conservation practices may also implement permanent levees or reduced levee interval, but the cost associated with the additional combination of conservation practices becomes less discernible as does the water savings.
2016 LCRWPG WATER PLAN 5-24
Lower Colorado Regional Water Planning Group November 2015
The water needed for irrigation in Colorado, Wharton, and Matagorda Counties is the largest deficit identified within the LCRWPA. Irrigation operation conveyance improvement is one of the water management strategies identified in LCRA’s Agricultural WSRP to address the issue.
Analysis
In addition to the water conservation measures implemented on-farm, substantial water can be saved by improving the efficiency of the canal systems that deliver water to the individual irrigator. These improvements would include: 1) improving the efficiency of water delivery in canal systems by automating the operation of major checks structures within the irrigation division; 2) creating a centralized control system for each irrigation division, allowing each canal system to be monitored and operated remotely; 3) automating the operation of flow control structures delivering water to individual fields (turnouts); 4) adding flow regulating reservoirs to balance flows; 5) targeted lining of high-loss canal segments; and 6) regular maintenance of canal banks, including vegetation control and repairing sections damaged by cattle and other animals.
Centralized SCADA control is an essential back bone to upgrading the efficiency of water delivery in the canal systems and can be accomplished at a much lower cost in LCRA’s irrigation divisions than originally anticipated in the LCRA-SAWS water project studies by taking advantage of existing SCADA infrastructure that currently connects each of LCRA’s pumping plants to LCRA’s radio-based communications system. LCRA has automated the majority of major check structures in the eastern canal section of the Gulf Coast Irrigation Division, and began improvements on the western canal section of the Gulf Coast Irrigation Division in 2014. The combination of centralized control and automation of all major check structures required to operate the system remotely are expected to eliminate 50 to 70 percent of estimated overflows lost from the end of the system, for a savings of 3.5 percent of average historical water use. This savings estimate was developed for upstream control gates. LCRA is pursuing the development of software to allow downstream control of these gates, which could increase savings substantially by relaying downstream water demand information real-time to upstream gates, rather than simply maintaining a constant upstream level at each site. The estimated total cost to complete the Gulf Coast system is $2.3 million, with $1.4 million spent as of 2015.
The 2008 LSWP PVA estimated 65,000 ac-ft/yr of water savings from improved efficiency of rice irrigation delivery system by the LCRA irrigation divisions in an average scenario. This amount of water savings was shown in the 2011 Region K Plan. A slightly smaller total amount of water savings is shown in the 2016 Region K Plan.
Details of this conservation estimate can be found in a report titled Conservation Strategies in the LCRA Irrigation Divisions – 2007 dated May 23, 2008. Recent changes to the conservation estimates are reflected in the table below.
2016 LCRWPG WATER PLAN 5-25
Lower Colorado Regional Water Planning Group November 2015
Table 5-12: Irrigation District Conveyance Improvement Estimates
WUG Name County River Basin Water Management Strategies (ac-ft/yr) 2020 2030 2040 2050 2060 2070
TOTAL 5,200 17,000 29,000 41,000 53,000 64,300 Note: Demand reductions through advanced conservation were distributed to county-basin irrigation WUGs based on the location of shortages.
Opinion of Probable Cost
The total estimated cost for the irrigation district conveyance improvement strategies recommended in the LCRA’s Agricultural Water Supply Resource Plan is $155,057,000, excluding the Lane City Reservoir Project. There is currently no mechanism in place to pay for the irrigation conveyance improvements recommended in this plan with the exception of the lower basin reservoir project. Table 5-13 shows the construction, capital, annual, and unit cost by WUG. The unit cost shown in the table represents an average of more expensive strategies, such as balancing reservoirs, and less expensive options, such as automated canal gates.
2016 LCRWPG WATER PLAN 5-26
Lower Colorado Regional Water Planning Group November 2015
Table 5-13 Irrigation District Conveyance Improvements Costs
The improvement of existing irrigation conveyances that provide water to farms will allow for customers to be served with fewer losses in transmission. This will result in a reduced overall demand for water and will reduce the volume of diversions that will have to be dedicated to maintaining flow in canals. If fully implemented, impacts to streamflows and the bay are approximately 50% of the conservation savings, or up to 32,150 ac-ft/yr by 2070.
Agricultural and Natural Resources Considerations
Irrigation conveyance improvement conservation methods have the potential benefit to agriculture in that by reducing the demand for water overall, they increase the likelihood that demands for water could be met on a more consistent basis. Impacts to agriculture are mainly cost-related, as shown in Table 5-13.
5.2.2.4.3. Conservation through Sprinkler Irrigation
An additional form of conservation that farmers could undertake to reduce water demands when growing rice involves converting the method used from field flooding to sprinkler irrigation. The following is an excerpt from the Texas Rice Producers Legislative Group’s supporting documentation for submittal of an ETF grant application, and was provided by Ronald Gertson. The excerpt has been slightly modified from its original form.
Analysis
Recently, in South America and the US Midwest, rice growers have had moderate success in growing rice under sprinkler irrigation. New technologies need to be demonstrated and adopted for rice farmers to decrease annual water use while maintaining profitable production. Pivot/linear-move sprinkler shows
2016 LCRWPG WATER PLAN 5-27
Lower Colorado Regional Water Planning Group November 2015
great promise as being an economic alternative to flood irrigation with much lower water use. The development of these alternative systems while maintaining a saturated soil environment to allow maximum yields and restrict weed growth is key for rice growing. Water use efficiency in rice is focused on having an effective water delivery system and optimizing grower water management decision-making.
The primary concept being deployed in this investigation is the use of sprinkler-delivered irrigation water as a means of both eliminating the standard two to four flushing periods at the beginning of the growing season and as a means of shortening the duration of the traditional flood irrigation period. Flushing is the standard method for maintaining soil moisture during the early growing season when rice plants are not sufficiently mature to thrive in a flood culture. A flush is essentially a temporary flood in which water is moved through the field by gravity. Each flush results in the loss of considerable tailwater as water is removed from the field. One flush uses 5 to 7 inches of water, while a sprinkler could efficiently accomplish the needed field wetting with the application of only 1 to 2 inches, yielding a water use reduction of 4 to 5 inches per flush. A number of commonly used weed herbicides in rice require water applications for maximum effectiveness. Timely sprinkler applications for the activation of these herbicides offers some hope for reducing weed pressures early thereby potentially enabling the delay of the permanent flood and therefore reducing the period that flood waters are lost to direct evaporation.
Weed control has been the major limiting factor in the use of sprinkler technology in rice production. LEPA (low elevation precision application) is one of the most efficient irrigation technologies. LEPA discharges water from very low hanging and closely spaced nozzles, which may enhance weed control in comparison to other sprinkler irrigation. LEPA also makes possible the elimination of water application to the panicles of mature rice plants (as occurs with traditional impact sprinkler nozzles). This should greatly reduce the fissuring of rice grains which often occurs with the use of sprinkler irrigation in rice.
Table 5-14 provides the potential water savings for each WUG by implementing sprinkler irrigation as a strategy. An assumed water savings of 12 inches per acre was used for the calculation.
2016 LCRWPG WATER PLAN 5-28
Lower Colorado Regional Water Planning Group November 2015
Table 5-14 Sprinkler Irrigation Estimate of Water Savings
WUG Name County River Basin
Water Management Strategies (ac-ft/yr) 2020 2030 2040 2050 2060 2070
TOTAL 1,430 7,150 14,300 17,875 17,875 17,875 Note: Demand reductions through advanced conservation were distributed to county-basin irrigation WUGs based on the location of shortages.
Cost Implication of Proposed Strategy
Costs for the strategy were assumed using a study performed for Region A on water management strategies for reducing irrigation demands. The cost for converting to sprinkler irrigation, updated to September 2013 dollars, was $310 per acre modified. Capital costs, annual costs, and unit costs were determined using the TWDB Cost Estimating Tool. Unit costs were calculated to be $36 per acre-foot of water savings. Table 5-15 shows the breakdown of cost by WUG.
2016 LCRWPG WATER PLAN 5-29
Lower Colorado Regional Water Planning Group November 2015
This type of irrigation will reduce the flooding in the fields that is released as return flows. If fully implemented, impacts to streamflows and the bay are approximately 100% of the conservation savings, or up to 17,185 ac-ft/yr by 2070. Agricultural and Natural Resources Considerations
The proposed strategy replaces the method of water supply to rice field. No impact is expected as a result of this strategy. One of the important considerations is whether irrigators’ have the ability to pay for the improvements. Grant funding and low-interest loan funding availability is a critical factor in local implementation. Impacts to agriculture are mainly cost-related, as shown in Table 5-15.
5.2.3 Wholesale Water Provider Management Strategies
There are two Wholesale Water Providers, as defined by the State planning process in Region K, LCRA and the COA. The COA is also a water customer of LCRA, and together they supply a large portion of Region K’s water needs for multiple beneficial purposes.
5.2.3.1 LCRA Water Management Strategies
LCRA holds surface water rights to over 2.1 million ac-ft of water in the Colorado River Basin, and also holds groundwater permits for industrial use, as well as rights to develop groundwater in Bastrop County. Combined, LCRA’s surface water rights authorize every legal purpose of use, and also help meet certain environmental flow needs. The LCRA is directed by the Texas Legislature to be the steward of its water rights in serving as the regional water supplier. The LCRA supplies water for municipal, agricultural, manufacturing, steam electric, mining, and other water uses. The LCRA currently has contracts to supply
2016 LCRWPG WATER PLAN 5-30
Lower Colorado Regional Water Planning Group November 2015
water to entities in Bastrop, Burnet, Colorado, Fayette, Gillespie, Hays, Lampasas (Region G), Llano, Mason, Matagorda, San Saba, Travis, Wharton, and Williamson (including the portion of Williamson in Region G) counties.
LCRA has firm municipal and industrial water needs beginning in 2060, as identified in Table 4.16 of Chapter 4. With additional new contracts and contract amendments that are recommended in this plan, the firm water needs for LCRA begin in the 2020 decade. In addition, the new critical drought period and reduced water availability is requiring LCRA to look at a variety of water supply options. LCRA’s strategy for meeting the region’s changing and future water needs will be predicated on LCRA’s ability to continue to use all of its water rights as a system. This includes not only the amendment of its water rights to meet changing and future water needs, but also an aggressive water conservation efforts program and the development of new water supplies. Table 5-16 below provides a summary of all of the recommended strategies related to the LCRA as a wholesale water provider. The sections following the tables discuss the strategies in more detail.
Table 5-16: Summary of LCRA Water Management Strategies (ac-ft/yr)
Lane City Off-Channel Reservoir 90,000 90,000 90,000 90,000 90,000 90,000 Prairie Site Off-Channel Reservoir 0 18,000 18,000 18,000 18,000 18,000 Mid-Basin Off-Channel Reservoir 18,000 18,000 18,000 18,000 18,000 18,000 Excess Flows Permit (5731) Off-Channel Reservoir 15,257 15,543 15,830 16,117 16,404 16,691 Enhanced Municipal and Industrial Conservation 4,500 10,000 15,000 20,000 20,000 20,000 Development of New Groundwater - Onsite FPP 700 700 700 700 700 700 Development of New Groundwater - Offsite FPP 2,500 2,500 2,500 2,500 2,500 2,500 Expand Use of Groundwater - Carrizo-Wilcox aquifer 300 300 300 300 300 300 Downstream Return Flows 5,086 5,834 6,784 8,636 8,997 10,453
Acquire New Water Rights 250 250 250 250 250 250 Amendment of ROR Water Rights, including Garwood N/A N/A N/A N/A N/A N/A New Firm Contracts (2,877) (14,154) (19,154) (22,154) (28,654) (33,654) Firm Contract Amendments (32,963) (40,487) (45,037) (54,323) (65,634) (77,263)
5.2.3.1.1. General LCRA Strategy - LCRA System Operation Approach
The State has directed LCRA to optimize and conserve available water to meet the existing and future water needs of the region. To meet existing water needs in the basin, LCRA has traditionally used its
2016 LCRWPG WATER PLAN 5-31
Lower Colorado Regional Water Planning Group November 2015
larger water rights together as a system, including its water rights for lakes Buchanan and Travis as well as its downstream run-of-river (ROR) rights. To date, LCRA has largely done this through its Water Management Plan (discussed below) and thus, its efforts have been focused on the management of lakes Buchanan and Travis to meet projected firm municipal and industrial customer demands while continuing to provide interruptible supplies to downstream agricultural operations and provide both firm and interruptible supplies to help meet certain environmental flow needs.3 More recently, LCRA has increased use of its ROR rights and groundwater rights to meet downstream needs that would otherwise have been met from stored water released from lakes Buchanan and Travis. Indeed, most of LCRA’s firm contracts provide operational flexibility to LCRA by recognizing that LCRA can meet its commitments from any source available to LCRA. As water needs increase and change over time, LCRA will continue to employ a system approach that considers all of its water supplies and the most efficient way to meet water needs within LCRA’s service area. LCRA may pursue amendments to its existing water rights, acquire or develop new water supplies, and implement aggressive water conservation measures and water use efficiencies, all to provide LCRA with the flexibility it needs to help meet future water demands within its service area.
Issues and Considerations
The use of a system approach allows LCRA greater flexibility to help meet water needs throughout its service area from a variety of water supply sources. The system approach may involve a number of specific strategies, including amendments to its existing water rights, acquisition or development of new water supplies, and implementation of aggressive water conservation measures and water use efficiencies, which are examined in greater detail in succeeding sections, with an analysis of the environmental consequences of each.
5.2.3.1.2. Amendments to Water Management Plan
LCRA’s current Water Management Plan was approved in January 2010 (2010 WMP) and, for the last several years, because of the ongoing drought, LCRA has operated under emergency orders issued by TCEQ that have allowed it to depart from various requirements of the 2010 WMP related to supply of interruptible stored water and water for instream flows during spawning of the Blue Sucker. In addition, LCRA has pending an application to amend the 2010 WMP to adjust the conditions under which it will provide water from lakes Buchanan and Travis for interruptible agricultural purposes and environmental flows to ensure that it can satisfy the demands of its firm customers, considering a level of demand about halfway between year 2010 and year 2020 projected demands and 2010 demands for downstream agricultural operations. To ensure that LCRA can meet projected firm customer demands over the fifty-year planning horizon covered by this plan, and as LCRA implements other water supply strategies that affect how it operates its system of water supplies, LCRA will likely seek further amendments to its Water Management Plan to adjust the conditions under which it will provide water from lakes Buchanan and Travis to help meet demands for firm, interruptible agricultural, and environmental flows purposes.
Environmental Flow Assumptions for WMP Revisions
For the simulation of 2020 and 2070 conditions, the modeling incorporates all of the key environmental flow elements of the 2010 WMP , including critical instream flow and bay and estuary freshwater inflow criteria engaged all of the time, and target instream flow criteria, target freshwater inflow criteria and the maximum environmental flow caps implemented as stipulated in the 2010 WMP. The RWPG used the 3 For a general description of the LCRA Water Management Plan (WMP), see Section 3.2.1.1.2.1.
2016 LCRWPG WATER PLAN 5-32
Lower Colorado Regional Water Planning Group November 2015
2010 WMP because this is the WMP in effect. LCRA filed a proposed new WMP in October 2014 that is still under review by TCEQ and which proposes a number of significant changes from the 2010 WMP as it relates to environmental flow criteria and other issues.
Issues and Considerations
The 2010 WMP commits 33,440 acre feet of firm water for instream and bay and estuary inflows. In addition, interruptible water is also supplied to help meet environmental flow needs under the 2010 WMP. Firm and interruptible water provided by LCRA will provide some additional benefit to instream flows and bay and estuary inflows. However, the main issue of growth in municipal, manufacturing and steam electric demand has a potential to reduce the amount of interruptible supply LCRA can make available for environmental flow needs in the future. To the extent that LCRA is able to provide interruptible water to the lower counties for agricultural use could also benefit environmental flows. Interruptible water traveling downstream to the point of diversion also helps meet instream flow needs. In addition, some agricultural return flows make their way to the river and Matagorda Bay system.
Available Interruptible Water Supply for Agriculture
The LCRA supplies interruptible water to four major agricultural operations within the three lower counties. These operations include the Lakeside, Gulf Coast, and Garwood agricultural divisions, which are owned and operated by LCRA and Pierce Ranch. Historically, LCRA has supplied water to these four agricultural operations using its four ROR water rights to the extent that flows in the river are available. However, often in the height of the irrigation season, ROR flows available in the Colorado River are insufficient to meet the needs of the four operations. LCRA may make stored water from lakes Buchanan and Travis available on an interruptible basis at any time that the actual demand for stored water under firm commitments is less than the combined firm yield of lakes Buchanan and Travis. The conditions under which LCRA can provide interruptible stored water are set forth in detail in the LCRA’s Water Management Plan, as amended from time to time. Consistent with these conditions, LCRA has provided interruptible stored water from lakes Buchanan and Travis to meet the demands of these four operations consistent with the Water Management Plan, except when operating pursuant to TCEQ emergency orders from 2012-2015 suspended releases of interruptible stored water for downstream agricultural use in Gulf Coast, Lakeside and Pierce Ranch. Generally speaking, the amount of interruptible stored water that can be made available from lakes Buchanan and Travis is curtailed as combined storage in the lakes drops. The 2010 WMP provides that, when storage in the two lakes on January 1 is at 1.4 MAF, 273,000 acre-feet of interruptible stored water may be made available for diversion. This amount decreases to 195,000 acre-feet at 1.15 MAF of storage and to 160,000 acre-feet at 325,000 acre-feet of storage. The 2010 WMP provides that all interruptible supply is cut off when the combined storage is less than 325,000 ac-ft on January 1 or after certain specific criteria have been met and the LCRA Board has declared a drought worse than a drought of record at 600,000 acre-feet of storage.
LCRA’s firm customers’ demands are well below their full contract commitments and LCRA does not expect firm customers’ demands to increase to their full commitments for some time. Therefore, LCRA expects that, absent extraordinary drought conditions such as those that have been experienced since 2011, it will be able to supply interruptible water to the agricultural operations in many years without frequent or significant curtailment. However, over time, as the LCRA’s current firm customers draw fully on their commitments and as LCRA contracts to provide more firm water, there will be less interruptible
2016 LCRWPG WATER PLAN 5-33
Lower Colorado Regional Water Planning Group November 2015
water available for agricultural purposes in the lower basin and the conditions of curtailment and allocation of available interruptible supply among the agricultural operations will be modified.4
LCRA has submitted a request to amend the 2010 WMP that substantially changes the curtailment triggers, but these proposed amendments are still under review by TCEQ. Therefore, this plan incorporates the 2010 WMP curtailment triggers that affect the availability for interruptible water from the Highland Lakes to meet agricultural demands within the four irrigation operations.
As discussed above, Table 5-17 presents an analysis of the amount of interruptible water expected to be available during each decade of the planning period using a modified version of the Region K Cutoff Model based on incorporating regional water planning demand projections for LCRA’s existing firm customers, updated estimates for future agricultural water needs in LCRA’s lower basin agricultural operations, and assumed levels of water conservation discussed elsewhere in this plan. The amount of interruptible water available for agricultural use is estimated to decrease from approximately 77,880 ac-ft/yr in 2020 to 0 ac-ft/yr in 2060 due to increased firm demands in the basin. Interruptible water availability reported in this section is for the Gulf Coast, Lakeside and Pierce Ranch water rights. Irrigation water available to the Garwood water right is reported in Chapter 3.
Table 5-17: Available Interruptible LCRA Water Supply for Agricultural Use
Decade Available 1 Interruptible Water Supply (ac-ft/yr)
2020 77,880 2030 2 48,664 2040 19,448
2050 2 9,724 2060 2 0 2070 0
1 Annual supply of interruptible stored water available during the critical drought year having the minimum run-of-river supply for the LCRA’s downstream water rights (1956).
2 Simulations were conducted for only 2020, 2040, and 2070. Information for other decades was interpolated from the results from those decades.
As the table indicates, the availability of interruptible water supply is expected to decrease significantly in the future as the demands for firm water increase.
Cost Implications of Proposed Strategy
Capital expenditures for water supply purposes would not be required to implement this alternative since diversions would be made under existing water rights. Where allowed, the cost of raw water is included in the overall cost of service to deliver the water within each agricultural operation under this alternative. Rates between LCRA’s agricultural divisions vary based on various factors, including canal operation costs and contractual restrictions. The cost in 2011, when LCRA last supplied interruptible water to the Gulf Coast and Lakeside divisions was ranged from about $40 to $50 per ac-ft of water delivered from the canal system. Current (2015) Garwood rates are about $50 per ac-ft. 4 When LCRA purchased both the Garwood Irrigation Company and Pierce Ranch water rights, it made certain commitments to provide interruptible stored water based upon specific requirements in the purchase agreements. This affects the manner in which LCRA allocates available interruptible water supply among the four irrigation operations.
2016 LCRWPG WATER PLAN 5-34
Lower Colorado Regional Water Planning Group November 2015
Issues and Considerations
The availability of interruptible supply is determined under the 2010 WMP on an annual basis as a function the content of the lakes on January 1. LCRA’s pending amendments to the WMP would determine availability of interruptible supply more frequently, by season. How this may be handled in future amendments to the WMP during the planning period cannot be known at this time; however, it is clear that actual availability of this supply from year to year, or by season, can vary greatly, largely as a function of drought conditions, lake levels, inflows into the lakes, and demands for firm water.
Environmental Considerations
As noted above, the increasing municipal, manufacturing and steam electric demands will reduce the amount of interruptible water that is available over time for the downstream agricultural operations. This could indirectly reduce the water available in the lower basin to help meet instream and bay and estuary inflows needs. In the earlier planning decades, this strategy can provide additional streamflow of up to approximately 78,000 ac-ft/yr, as shown in Table 5-17.
Agricultural & Natural Resources Considerations
Interruptible water, when it’s available, has a positive impact on agriculture. The impact decreases over time as the availability decreases over time. In the earlier planning decades, this strategy can provide additional water for agriculture of up to approximately 78,000 ac-ft/yr, as shown in Table 5-17. 5.2.3.1.3. Amendments to ROR Rights, including Garwood
LCRA owns run-of-river (ROR) water rights authorizing diversions of up to 503,750 ac-ft/yr on the lower Colorado River in the Lakeside, Gulf Coast, and Pierce Ranch agricultural divisions. Projected 2030 agricultural water demand used in the LCRA WMP amendment application for these three operations is projected to be approximately 274,000 ac-ft/yr.
LCRA also owns the most senior portion of the former Garwood Irrigation Company water right, which authorizes the diversion of up to 133,000 ac-ft of water per year from the Colorado River at a November 1, 1900 priority date. Projected water demands in the Garwood operation are estimated to be approximately 87,000 ac-ft/yr.
Potential exists to make additional water supplies from these water rights available to meet future water demands throughout the LCRA service area. These water rights are already authorized for multiple beneficial purposes. Portions of these ROR water rights could be used as part of a LCRA’s management of its entire system of water rights to meet firm demands in their existing locations, or elsewhere in the LCRA service area by amending the rights to add new diversion points and the right to store the water in off-channel reservoirs or existing reservoirs.
For example, LCRA is already using part of its Gulf Coast ROR water rights to supply industrial demands and has amended the right to add off-channel storage as part of its new Lane City reservoir project. LCRA also has a pending application to amend its Garwood water right to add additional points of diversion from Lake Travis and various points downstream, so that it can use the right to meet firm customer demands to the extent the water is not needed to meet its contractual obligations within the Garwood
2016 LCRWPG WATER PLAN 5-35
Lower Colorado Regional Water Planning Group November 2015
operations. This water management strategy recognizes that LCRA intends to amend any and all of its downstream water rights to meet future and changing water needs.
Cost Implications of Proposed Strategy
Capital expenditures for water supply purposes would not be required to implement this strategy to the extent that the diversions of these rights for other purposes will be done at locations already authorized for diversion under other water rights held by LCRA using existing infrastructure and stored in existing reservoirs. The annual cost of providing raw water under this alternative is the September 2013 LCRA system rate for water diverted, which is $151 per ac-ft.
Issues and Considerations
Conversion of agricultural rights to serve municipal, manufacturing, and steam electric needs may not have a significant impact on downstream instream and bay and estuary flows if the firm water demands that are being satisfied are located downstream or as long as water from other sources is provided to meet the downstream agricultural needs. In addition, use of ROR water for municipal needs upstream could result in a greater volume of return flows, which if returned to the river in the Austin and surrounding area locations, would help off-set any reduction in downstream ROR flows and help provide for instream flow needs. In addition, municipal return flows are more constant than the flows required for agricultural use. Municipal return flows are expected to be discharged year round whereas downstream agricultural demands are significantly reduced during the winter months.
Environmental Considerations Impacts related to the amendment of the Gulf Coast and Lakeside water rights can be considered negligible because they are already quantified and accounted for under the off-channel reservoir strategies, as discussed in Section 5.2.3.1.10. It’s anticipated that amendments to the Pierce Ranch water right would have negligible impacts during times of drought, due to the limited available water. The water right has an authorized diversion of 55,000 ac-ft/yr. Depending on the location of the new diversion and the diversion amount based on the amendment, instream flows could be reduced during wet years. Impacts will be evaluated during the TCEQ permitting process and the amended water right will be subject to instream flow requirements. The Garwood water right is less impacted by drought years. To the extent the water is not needed to meet its contractual obligations, up to 133,000 ac-ft/yr could be diverted at alternative locations and reduce instream flows (See Section 5.5.3 for additional information). Any impacts will be evaluated during the TCEQ regulatory process for evaluating such amendments and the amended water right will be subject to instream flow requirements. Agricultural & Natural Resources Considerations
Amendments to LCRA’s ROR rights could reduce availability of that water for agricultural purposes. Impacts related to the amendment of the Gulf Coast and Lakeside water rights can be considered negligible because they are already quantified and accounted for under the off-channel reservoir strategies, as discussed in Section 5.2.3.1.10. It’s anticipated that amendments to the Pierce Ranch water right would have negligible impacts during times of drought, due to the limited available water. The water right has an authorized diversion of 55,000 ac-ft/yr. However, LCRA has a contractual obligation to deliver up to 30,000 ac-ft/yr to Pearce Ranch. Run-of-river water deliveries to irrigation above 30,000 ac-ft/yr are not from this water right and no impact would occur to agriculture by the transfer of a portion
2016 LCRWPG WATER PLAN 5-36
Lower Colorado Regional Water Planning Group November 2015
of this water right. The Garwood water right is less impacted by drought years. To the extent the water is not needed to meet its contractual obligations, water for irrigation could be reduced by up to 100,000 ac-ft/yr.
5.2.3.1.4. LCRA Contract Amendments
LCRA has contracts or Board reservations for raw water supply with numerous water user groups (WUGs). LCRA has indicated that it expects to continue providing water to these entities throughout the 50-year planning period and expects to meet these customers’ projected increased demands for water through amendments to existing contracts to increase contract quantities. For purposes of this plan, water supplied to these customers largely comes from lakes Buchanan and Travis. However, as discussed in more detail elsewhere in this chapter, LCRA operates its water rights as a system. To the extent that these customers have obtained contracts or amendments to contracts since 1999, their current LCRA contract provides that water may be supplied under the contract from any source available to LCRA at the time the customer uses water. Water sources include supply from lakes Buchanan and Travis, LCRA’s ROR rights, groundwater, or other sources that might come under LCRA’s control. To the extent that existing customers’ contracts do not contain this language, and such customers need to renew their contracts or increase the contract quantity, the new contracts will include similar language regarding source of supply.
In most cases, capital expenditures for water supply purposes were not assumed to be required to implement this alternative. In some cases, the contract amendments are associated with other capital projects that are discussed later in the chapter. The average cost of providing raw water under this alternative is $151 per ac-ft in September 2013 dollars. Table 5-18 contains a summary of the WUGs for which this strategy applies and the amount of water planned for in the contract amendment (where increased amounts of water are needed). The WUGs that will have new planned infrastructure associated with the LCRA contract amendment are identified in the table with an asterisk, and the infrastructure projects themselves are discussed in more detail in Section 5.2.4.5.
2016 LCRWPG WATER PLAN 5-37
Lower Colorado Regional Water Planning Group November 2015
* These WUGs require additional surface water infrastructure in Burnet County. Cost Implications of Proposed Strategy
Capital expenditures for water supply purposes were not assumed to be required to implement this alternative. The average cost of providing raw water under this strategy is currently (September 2013) $151 per ac-ft. The additional infrastructure costs associated with the WUGs listed in Table 5-18 with an asterisk are detailed in Section 5.2.4.5.
Issues and Considerations
Amendment of existing contracts to meet increasing municipal, manufacturing, and steam electric demands will provide for the needs of a growing population, but could reduce the amount of interruptible water available for agricultural use and environmental flows, as demands actually materialize and depending on what other strategies are implemented by LCRA to further enhance and optimize operation of its system of water supplies. Similarly, as firm water customers use more and more of their contracted water, the available interruptible supply could be reduced.
Environmental Considerations
Depending on the location of the contracted water, some environmental impacts to instream flows and freshwater inflows to Matagorda Bay can be expected from increased use of water under LCRA contracts, including amendments to existing contracts and new water sale contracts. Increased firm demands for municipal and industrial uses will reduce the amount of interruptible water available for release.
2016 LCRWPG WATER PLAN 5-38
Lower Colorado Regional Water Planning Group November 2015
Interruptible water provides a benefit to instream flows as it travels downstream to the diversion points. Increased contract volumes for users at the downstream end of the basin would also increase instream flows. Individual WUG implementation of this strategy has negligible impacts to streamflows and the bay, but full regional implementation could remove up to 77,000 ac-ft/yr from the Highland Lakes or other proposed LCRA reservoirs by 2070 (See Section 5.5.3 for additional information). Approximately 23,000 ac-ft/yr would provide additional instream flows from the release point down to Matagorda County. Agricultural & Natural Resources Considerations
The increasing municipal and manufacturing needs for water will have a significant impact on agriculture as the available supply of interruptible water gradually diminishes over time. See Section 5.2.3.1.2. for additional details and volumes. The extent of these impacts to interruptible water availability will be affected by the rate at which firm demands actually materialize and could also be affected by the timing and implementation of other strategies by LCRA to further enhance and optimize operation of its system of water supplies.
5.2.3.1.5. LCRA New Water Sale Contracts
Region K has identified shortages within LCRA’s service area that are not currently covered by a water sale contract from LCRA but for which LCRA may be willing and able to provide raw water. In particular, many of these include rural communities in the upper portion of the LCRWPA and certain current wholesale customers of the City of Austin whose contract is expected to expire during the planning period. Certain wholesale customers currently receiving water from Austin may need to obtain raw water contracts directly from LCRA in the future. Austin plans to continue to treat and transport this water. This raw water contracting approach generally does not apply to City of Austin wholesale customers that are Municipal Utility Districts (MUDs), since the City generally plans to annex these areas in the future, consistent with the MUD’s creation agreements with the City.
Additional new contracts are also recommended for several municipal WUGs throughout the region that will require new infrastructure to obtain and treat the water. These WUGs are highlighted in Table 5-19 with an asterisk or two, and they are discussed in more detail in Section 5.2.4.5, Section 5.2.5.2 , and Section 5.2.5.3. As new customers, contracts for water supplied to these customers will come from any source available to LCRA at the time the customer uses water. Table 5-19 summarizes recommended new LCRA contracts over the planning horizon.
2016 LCRWPG WATER PLAN 5-39
Lower Colorado Regional Water Planning Group November 2015
West Lake Hills Travis 0 1,300 1,300 1,300 1,300 1,300
TOTAL 2,877 14,154 19,154 22,154 28,654 33,654 * These WUGs require additional surface water infrastructure in Bastrop County or Travis County. **These WUGs require additional surface water infrastructure in Burnet County. Cost Implications of Proposed Strategy
For the WUGs listed in Table 5-19 without an asterisk, capital expenditures for water supply purposes were not assumed to be required to implement this strategy. The average cost of providing raw water under this strategy is $151 per ac-ft in September 2013 dollars. The additional infrastructure costs associated with the WUGs listed in Table 5-19 with an asterisk or two are detailed in Section 5.2.4.5, Section 5.2.5.2 , and Section 5.2.5.3.
Issues and Considerations
Much of the water that would be dedicated to new LCRA contracts in Travis County is already being supplied from LCRA’s water rights through the City of Austin. Based on Austin’s raw water contracting plans in this manner, the only change will be that LCRA will contract directly with those certain wholesale customers for raw water instead of the City of Austin and Austin will continue to treat and transport the water to these entities.
Environmental Considerations
Individual WUG implementation of this strategy has negligible impacts to streamflows and the bay, but full regional implementation could remove up to 34,000 ac-ft/yr from the Highland Lakes or other proposed LCRA reservoirs by 2070 (See Section 5.5.3 for additional information).
2016 LCRWPG WATER PLAN 5-40
Lower Colorado Regional Water Planning Group November 2015
Agricultural & Natural Resources Considerations
Any large new contracts that would need to use supplies from lakes Buchanan and Travis or other LCRA firm water supplies may decrease over time the amount of interruptible water available for agriculture. See Section 5.2.3.1.2. for additional details and volumes. The extent of these impacts to interruptible water availability will be affected by the rate at which firm demands actually materialize and could also be affected by the timing and implementation of other strategies by LCRA to further enhance and optimize operation of its system of water supplies.
5.2.3.1.6. Conservation
TWDB requires that all conservation strategies be located within a single Conservation section in the 2016 Region K Water Plan. LCRA conservation strategies are covered in Section 5.2.2.1, LCRA Conservation.
5.2.3.1.7. Groundwater Supply for FPP (On-site)
LCRA and the City of Austin jointly own the Fayette Power Project (FPP) in Fayette County. LCRA has been evaluating possible water supplies to augment LCRA’s share of the surface water supply provided to the FPP cooling water reservoir (Cedar Creek Reservoir) used for process and cooling water. Currently, water at FPP is diverted from Cedar Creek Reservoir, and LCRA’s share of water in Cedar Creek Reservoir comes water from local inflows from Cedar Creek, and stored water released from the Highland Lakes.
For its share of water supply for FPP, the City of Austin relies on a firm water contract with LCRA as well as a run-of-river water right it owns that allows diversion and use at FPP. Groundwater may provide another source of water to address surface water filtering concerns (algae) and help alleviate potential drought contingency plan cutbacks from the Colorado River. Water supply sources identified include groundwater from the Oakville Sandstone and the Catahoula Tuff, which are part of the Gulf Coast Aquifer. The general well field location was assumed to be on-site of the FPP.
Available groundwater under the MAG (Modeled Available Groundwater – See Chapter 3) will be used for sizing potential water supply strategies. Based on these criteria, this groundwater source strategy will consist of:
Obtain a groundwater pumping permit from the Fayette County Groundwater Conservation District, construction of groundwater wells, raw water transmission line, and a pump station.
As stated previously, groundwater can be provided from the Catahoula Tuff or the Oakville Sandstone both of which are part of the Gulf Coast Aquifer. The available yield for groundwater in this aquifer would be approximately 700 acre-feet/year (0.6 MGD Average) for all planning decades. The infrastructure required for this strategy was determined by LCRA consultants. The quantity and sizing of the infrastructure was modified to match the water yield projected for the aquifers. The following infrastructure was proposed.
Two (2) 500 gpm Water Supply Wells and well transmission piping
2016 LCRWPG WATER PLAN 5-41
Lower Colorado Regional Water Planning Group November 2015
Approximately one (1) mile of raw water transmission piping and appurtenances
Pump Station
Cost Implications of Proposed Strategy
In order to provide a comparable cost consistent with other strategies in this report, costs were developed using the Texas Water Development Board (TWDB) Cost Estimating Tool in September 2013 dollars. The Cost Estimating Tool was also used to determine operating costs. The capital cost for this strategy is primarily driven by the cost of the well field and pump station.
The following table shows the estimated costs associated with this strategy.
Table 5-20 LCRA Groundwater for FPP (on-site) Cost
Total Construction
Cost
Total Capital
Cost
Largest Annual
Cost
Unit Cost
($/ac-ft)
$1,954,000 $2,749,000 $347,000 $496.00
Environmental Considerations
This strategy would replace surface water supplied from the Colorado River, which could reduce releases from the Highland Lakes (thus increasing lake levels), and cause a resulting reduction in river flows that help meet instream flow needs. However, it is also possible that LCRA will continue to have an obligation to provide water to help meet certain instream flows that offset any such impacts. The water supply is within the Modeled Available Groundwater (MAG), so drawdown in the aquifer could be up to 12 feet, relative to 1999 conditions (See Section 5.5.3 for additional information). It is assumed that using water within the stated available yield should result in negligible impacts to springflows, but aquifer levels and springflows should be monitored.
Refer to Chapter 1, Appendix 1A, for the complete list by County of threatened and endangered species in the Lower Colorado Regional Water Planning Area. These species may need to be considered during construction of infrastructure.
Agricultural & Natural Resources Considerations
No impacts to agriculture are expected, as a result of implementing this strategy.
5.2.3.1.8. Groundwater Supply for FPP (Off-site)
LCRA has been evaluating water supply sources to replace the stored water supply from the Highland Lakes to the FPP cooling water reservoir (Cedar Creek Reservoir). The LCRA has been working with
2016 LCRWPG WATER PLAN 5-42
Lower Colorado Regional Water Planning Group November 2015
consultants to develop water supply strategies for these sources. A water supply source identified is groundwater in northwestern Fayette County. The preliminary analysis indicates that a groundwater well field could not be located near the FPP due to high levels of total dissolved solids (TDS). It was recommended that a groundwater well field could be constructed in the Carrizo Wilcox Aquifer in Fayette and/or Bastrop counties. Additional studies would be required to determine a specific location. For cost estimating purposes, the general well field location is approximately 24 miles from the Cedar Creek Reservoir in Fayette County. There are two options for delivery of groundwater to the Cedar Creek Reservoir. The first option (Option 1) proposed a 24-mile pipeline from the well field to the Cedar Creek Reservoir. The second option (Option 2) proposed piping the groundwater to the Colorado River and obtaining a bed & banks permit to convey the water in the Colorado River to an existing LCRA river intake/pump station being used for FPP. For the 2016 Regional Water Plan, only Option 1 is evaluated. The source water balance values will be used for sizing potential water supply strategies. Based on these criteria, the groundwater source strategy will consist of:
Obtain a groundwater pumping permit from the regulating groundwater conservation district, construction of groundwater wells, raw water transmission line, and a pump station.
Groundwater could be provided from the Carrizo-Wilcox Aquifer or the Yegua-Jackson Aquifer or from both. It was assumed for this analysis that groundwater would be provided from both the Carrizo-Wilcox Aquifer and the Yegua-Jackson Aquifer, both located in Fayette County for this analysis, but the Carrizo-Wilcox aquifer water could potentially be from Bastrop County as well. The estimated volumes of groundwater for this project would be approximately 500 acre-feet/year from the Carrizo-Wilcox Aquifer and 2,000 acre-feet/year from the Yegua-Jackson Aquifer for a total of 2,500 acre-feet/year (2.2 MGD Average) for all planning decades.
The quantity and sizing of the infrastructure was modified, from that determined by LCRA consultants, to match the water yield projected for the aquifers. The following infrastructure was proposed.
Three (3) 1,000 gpm Water Supply Wells and well transmission piping
Approximately 24 miles of raw water transmission piping and appurtenances
Primary Pump Station
Three (3) Booster Pump Stations and Storage Tanks
Cost Implications of Proposed Strategy
A capital cost estimate was provided by LCRA consultants as part of their analysis. However, the cost estimate was for larger infrastructure than what was sized based on availability under the MAG. In order to provide a comparable cost consistent with other strategies in this report, costs were developed using the Texas Water Development Board (TWDB) Cost Estimating Tool in September 2013 dollars. The Cost Estimating Tool was also used to determine operating costs.
2016 LCRWPG WATER PLAN 5-43
Lower Colorado Regional Water Planning Group November 2015
The capital cost for this strategy is primarily driven by the cost of the transmission pipeline and pump stations. Groundwater purchase rates for municipal and industrial customers were not available and were not included in the costing.
The following table shows the estimated costs associated with this strategy.
Table 5-21 LCRA Groundwater for FPP (off-site) Cost
Total Construction
Cost
Total Capital
Cost
Largest Annual
Cost
Unit Cost ($/ac-ft)
$13,475,000 $20,107,000 $2,782,000 $1,113.00
Environmental Considerations
This strategy would replace surface water supplied from the Colorado River, which could reduce releases from the Highland Lakes (thus increasing lake levels), and cause a resulting reduction in river flows that help meet instream flow needs. However, it is also possible that LCRA will continue to have an obligation to provide water to help meet certain instream flows that offset any such impacts. The water supply is within the Modeled Available Groundwater (MAG), so drawdown in the aquifer could be up to 75 feet (See Section 5.5.3 for additional information). It is assumed that using water within the stated available yield should result in negligible impacts to springflows, but aquifer levels and springflows should be monitored.
Refer to Chapter 1, Appendix 1A, for the complete list by County of threatened and endangered species in the Lower Colorado Regional Water Planning Area. These species may need to be considered during construction of infrastructure.
Agricultural & Natural Resources Considerations
No impacts to agriculture are expected, as a result of implementing this strategy.
5.2.3.1.9. Expand Use of Groundwater in Bastrop County (Carrizo-Wilcox Aquifer)
LCRA plans to pursue expansion of groundwater sources to meet future demands. LCRA currently holds groundwater permits from the Lost Pines Groundwater Conservation District for production wells in the Carrizo-Wilcox Aquifer in Bastrop County and LCRA plans obtain and develop additional groundwater in Bastrop County. A preliminary analysis from LCRA indicated that a well field would be located on the Griffith League Ranch in central Bastrop County and pumped to Lake Bastrop for municipal or industrial use. For the 2016 Regional Water Plan, water available under the MAG was used for sizing potential water supply strategies. Based on these criteria, the groundwater source strategy will consist of:
Construction of groundwater wells, raw water transmission line, and a pump station.
2016 LCRWPG WATER PLAN 5-44
Lower Colorado Regional Water Planning Group November 2015
The available groundwater under the MAG in the Carrizo-Wilcox Aquifer in the Colorado Basin would be approximately 300 acre-feet/year (0.3 MGD Average) for all planning decades. If permits become available, this water yield value could increase to as much as 10,000 acre-feet/year (8.9 MGD Average). The following infrastructure would be required.
Two (2) 300 gpm Water Supply Wells and well transmission piping
Approximately 4.5 miles of raw water transmission piping and appurtenances
Primary and Booster Pump Stations
Booster Pump Storage Tank
Cost Implications of Proposed Strategy
In order to provide a comparable cost consistent with other strategies in this report, costs were developed using the Texas Water Development Board (TWDB) Cost Estimating Tool in September 2013 dollars. The Cost Estimating Tool was also used to determine operating costs.
The capital cost for this strategy is primarily driven by the cost of the well field and pump station.
The following table shows the estimated costs associated with this strategy.
Table 5-22: LCRA Expand Use of Groundwater (Carrizo-Wilcox) Cost
This strategy would replace surface water supplied from the Colorado River, which could reduce releases from the Highland Lakes (thus increasing lake levels), and cause a resulting reduction in river flows that help meet instream flow needs. However, it is also possible that LCRA will continue to have an obligation to provide water to help meet certain instream flows that offset any such impacts. The water supply is within the Modeled Available Groundwater (MAG), so drawdown in the aquifer could be up to 237 feet (See Section 5.5.3 for additional information). It is assumed that using water within the stated available yield should result in negligible impacts to springflows, but aquifer levels and springflows should be monitored.
The Griffith League Ranch and part of the identified route of the transmission main to Lake Bastrop are located in an area of Bastrop County that is home to the Houston Toad, and thus is impacted by the Lost Pines Habitat Conservation Plan. In addition, there are several endangered or threatened species that may need to be taken into consideration during design. Appendix 1A in Chapter 1 provides a list of rare,
2016 LCRWPG WATER PLAN 5-45
Lower Colorado Regional Water Planning Group November 2015
threatened, and endangered species by County. These species may need to be considered during construction of infrastructure.
Agricultural & Natural Resources Considerations
No impacts to agriculture are expected, as a result of implementing this strategy.
5.2.3.1.10. Off-Channel Reservoirs
Lane City
In January 2012, the LCRA Board of Directors adopted a goal of adding 100,000 acre-feet per year to the region’s water supply by 2017. In order to meet this objective, the LCRA is in the process of constructing the Lane City Reservoir Project in the lower Colorado River Basin. The reservoir will be off the main channel of the Colorado River, near Lane City, in Wharton County and is expected to add up to 90,000 acre-feet per year to LCRA’s firm water supply.
Though final design is not complete, the proposed project anticipates construction of an off-channel reservoir of up to 40,000 acre-feet normal storage, a new river outfall, a new re-lift pump station, and upgrades to the existing pump station and canal system. The project will use existing surface water rights to increase the LCRA’s overall available water supply.
The normal storage capacity in the reservoir will be up to 40,000 acre-feet of water at a time and could potentially be filled, released, and refilled multiple times within a year, allowing LCRA to capture available stream flows that are not needed by senior water rights. The enhanced operational flexibility and efficiencies provided by this project will assist the LCRA in meeting firm customer and environmental needs and will also improve availability of interruptible water.
Except where LCRA’s ROR rights can be used, LCRA releases Highland Lakes’ water to its firm industrial and interruptible agricultural customers near the coast and to fulfill environmental flow requirements. The Lane City Reservoir will lessen the need for Highland Lakes’ releases and improve the reliability and efficiency of water distribution for downstream uses. Currently, when water is released from the Highland Lakes to downstream water users, it takes a long time (several days) to reach those users, because the lakes are far from the point of use. If it rains in the time it takes for the stored water to get from the release point to the point of use, the released stored water may no longer be needed at that time, but could be captured and stored in the off-channel reservoir to be beneficially used at a later time in lieu of additional releases of stored water. Additionally, since this off-channel reservoir would be located a shorter distance to the users than the existing release points, released water from this reservoir would reach the users sooner.
In September 2014, the Texas Water Development Board approved a $255 million loan to fund the project.
The LCRA began construction in early 2015 and the reservoir is anticipated to be operational in 2017.
2016 LCRWPG WATER PLAN 5-46
Lower Colorado Regional Water Planning Group November 2015
Cost Implications of Proposed Strategy
The LCRA has received approval for a TWDB loan for $255 million, including a 50-year repayment term and interest-only payments for the first 10 years which will cover the costs of planning, acquisition, design, and construction.
A capital cost estimate was provided by LCRA from the preliminary engineering report prepared by CH2MHill in April 2014. For regional water planning purposes, and in order to provide a comparable cost consistent with other strategies in this report, loan interest and operation and maintenance costs were developed using the Texas Water Development Board (TWDB) Cost Estimating Tool in September 2013 dollars. The following table shows the estimated costs associated with this strategy.
Table 5-23: LCRA Lane City Off-Channel Reservoir Cost
Total Construction
Cost
Total Capital Cost
Largest Annual
Cost
Unit Cost ($/ac-
ft) $156,800,000 $218,593,000 $20,027,000 $223.00
Issues and Considerations
The Lane City Reservoir is in early stages of implementation and no identified issues or considerations to completion are anticipated at the time of this plan’s writing. Construction began in early 2015, with project completion expected in early 2018.
Environmental Considerations The Lane City Reservoir is off-channel and relies on using existing water rights and capturing available river flows for its yield. Thus environmental impacts, as compared to an on-channel reservoir, are minimal. In addition, the reservoir will enable LCRA to enhance its ability to manage flows in the lower portion of the Colorado Basin, including releases to Matagorda Bay, and to manage waterfowl habitat and coastal wetlands.
The environmental impacts to instream flows and bay and estuary inflows were analyzed for this project as part of the 2016 Region K Plan. Because the reservoir uses existing water rights, the instream flows showed some variation, both increases and decreases, as compared to a model without the reservoir. Certain assumptions were included in this analysis. Future changes to how LCRA might manage its system could change the variations. This strategy could potentially remove up to 90,000 ac-ft/yr from the Colorado River, but will create additional waterfowl habitat (See Section 5.5.3 for additional information).
Due to this project being mostly located in an upland area and largely on prior disturbed land, very little of the project is subject to Section 404 of the Clean Water Act.
2016 LCRWPG WATER PLAN 5-47
Lower Colorado Regional Water Planning Group November 2015
Agricultural & Natural Resources Considerations
Agricultural users in the lower Colorado River Basin predominantly rely on interruptible water supply provided from ROR rights and stored water released from the Highland Lakes. Due to recent historic drought in the Basin, characterized by low inflows and reservoir storage condition, interruptible water releases from the Highland Lakes for agricultural use were largely stopped after 2011, with the exception of the Garwood operations. The construction of the Lane City Reservoir will lessen the need to release Highland Lakes’ water to meet firm water demands near the coast, and improve interruptible agricultural water reliability and efficiency. The new reservoir will increase LCRA’s operational flexibility, which, in turn, has the potential to enhance the water availability in the lower basin for a variety of purposes, including agriculture. This strategy could potentially make available up to 54,000 ac-ft/yr of water for agricultural purposes, depending on firm customer needs.
Prairie Site This strategy consists of a new earthen ring dike off-channel reservoir of normal storage up to 40,000 acre-feet, located near the City of Eagle Lake, approximately 2.9 miles from the Colorado River.
The purpose of an off-channel reservoir is to capture river flows when available under the water right and store the captured water for later use. The reservoir could either release water directly into Lakeside agricultural division canals or back to the river. The source of the water is diversions from the Colorado River under LCRA’s existing water rights. The demands served by this strategy could range from industrial or other firm demands, to agricultural users near the coast, and environmental flow needs.
This strategy would provide other benefits. Currently, when water is released from the Highland Lakes to downstream water users, it takes a long time (several days) to reach those users, because the lakes are far from the point of use. If it rains in the time it takes for the stored water to get from the release point to the point of use, the released stored water may no longer be needed at that time, but could be captured and stored in the off-channel reservoir to be beneficially used at a later time in lieu of additional releases of stored water. Additionally, since this off-channel reservoir would be located a shorter distance to the users than the existing release points, released water from this reservoir would reach the users sooner.
The infrastructure required to implement this strategy includes:
New 40,000 acre-foot earthen ring dike reservoir
Modified existing river intake and pump station (to pump from Colorado River to Prairie Canal)
Modified Prairie Canal (expand canal and provide new geo membrane liner with concrete cover)
Modified existing Prairie Re-Lift Pump Station (to pump from Prairie Canal to new reservoir)
New pipeline from new reservoir back to Colorado River (to return flows back to river)
New pipeline from Re-Lift Pump Station to Reservoir
The firm yield from this strategy is projected to be about 20,000 acre-feet per year, and is not projected to be implemented until the year 2030, but could be implemented earlier depending on funding opportunities. This assumes the Lane City off-channel reservoir (currently under construction as of early 2015) is completed and online.
2016 LCRWPG WATER PLAN 5-48
Lower Colorado Regional Water Planning Group November 2015
Cost Implications of Proposed Strategy Costs for this strategy were developed based on information provided by LCRA, and the Texas Water Development Board (TWDB) Cost Estimating Tool. Consistent with the tool, all costs are given in September 2013 dollars. The following table shows the estimated costs associated with this strategy.
Table 5-24: LCRA Prairie Site Off-Channel Reservoir Cost
Total Construction
Cost
Total Capital Cost
Largest Annual
Cost
Unit Cost ($/ac-ft)
$269,000,000 $376,000,000 $27,805,000 $1,545
Environmental Considerations The Prairie Reservoir is off-channel and would rely on utilizing existing water rights and capturing available river flows for its yield. Thus environmental impacts, as compared to an on-channel reservoir, are minimal. In addition, the reservoir will enable LCRA to enhance its ability to manage flows in the lower portion of the Colorado River, including releases to Matagorda Bay, and to manage waterfowl habitat and coastal wetlands.
The environmental impacts to instream flows and bay and estuary inflows were analyzed for this project as part of the 2016 Region K Plan. Because the reservoir uses existing water rights, the instream flows showed some variation, both increases and decreases, as compared to a model without the reservoir. Certain assumptions were included in this analysis. Future changes to how LCRA might manage its system could change the variations. This strategy could potentially remove up to 18,000 ac-ft/yr from the Colorado River, but will create additional waterfowl habitat (See Section 5.5.3 for additional information).
Agricultural & Natural Resources Considerations Agricultural users in the lower Colorado River Basin predominantly rely on interruptible water supply provided from ROR rights and stored water released from the Highland Lakes. Due to current historic drought in the Basin, characterized by low inflows and reservoir storage condition, interruptible water releases from the Highland Lakes for agricultural use were largely stopped after 2011, with the exception of the Garwood operations. The construction of the Prairie Reservoir will lessen the need to release Highland Lakes’ water to meet firm water demands near the coast and improve interruptible agricultural water reliability and efficiency. The new reservoir will increase LCRA’s operational flexibility, which, in turn, has the potential to enhance the water availability in the lower basin for a variety of purposes, including agriculture. This strategy could potentially make available up to 18,000 ac-ft/yr of water for agricultural purposes, depending on firm customer needs.
2016 LCRWPG WATER PLAN 5-49
Lower Colorado Regional Water Planning Group November 2015
Mid-Basin
This strategy consists of a new off-channel reservoir, preliminarily named the Mid-Basin Off-Channel Reservoir. The precise location and size are yet to be determined, but for this planning process, the location is assumed to be in Bastrop County and the size is expected to be comparable to the Lane City off-channel reservoir at up to 40,000 acre-feet of normal storage.
The purpose of an off-channel reservoir is to capture available flows from the Colorado River that are not needed to meet senior water rights or environmental flow obligations. The source of the water would be diversions under existing water rights, although a water right permit amendment would be required to authorize diversion and storage of available flows at a mid-basin location. The demands served by this strategy would be municipal, industrial, agricultural, environmental flows, and other beneficial uses near the site and downstream.
The infrastructure required to implement this strategy includes:
New off-channel reservoir.
A new river intake, pump station, and pipeline, to pump from the river to the reservoir.
A new pipeline from the reservoir to the river, to return flows.
A new pump station and/or pipeline from the reservoir to the point of use.
The firm yield from this strategy is projected to be about 20,000 acre-feet per year, and is not projected to be implemented until the year 2020, but could be implemented earlier depending on funding opportunities. This assumes the Lane City off-channel reservoir (currently under construction as of early 2015) is completed and online.
Cost Implications of Proposed Strategy For planning purposes, costs for this strategy were estimated by taking the average of the Lane City and Prairie Site reservoir capital costs. These costs were developed based on information provided by LCRA. The Texas Water Development Board (TWDB) Cost Estimating Tool was used to develop the project, annual, and unit costs. Consistent with the tool, all costs are given in September 2013 dollars. The following table shows the estimated costs associated with this strategy.
Table 5-25: LCRA Mid-Basin Reservoir Cost
Total Construction
Cost
Total Capital Cost
Largest Annual
Cost
Unit Cost
($/ac-ft)
$213,000,000 $298,000,000 $22,089,000 $1,227
Environmental Considerations The Mid-Basin Off-Channel Reservoir is off-channel and would rely on capturing available river flows under existing amended water rights for its yield. Thus environmental impacts compared to an on-
2016 LCRWPG WATER PLAN 5-50
Lower Colorado Regional Water Planning Group November 2015
channel reservoir are minimal. In addition, the reservoir will enable LCRA enhanced ability to manage flows in the river, including releases to Matagorda Bay, managed waterfowl habitat, and coastal wetlands.
The environmental impacts to instream flows and bay and estuary inflows were analyzed for this project as part of the 2016 Region K Plan. Because the reservoir uses existing water rights, the instream flows showed some variation, both increases and decreases, as compared to a model without the reservoir. Certain assumptions were included in this analysis. Future changes to how LCRA might manage its system could change the variations. This strategy could potentially remove up to 18,000 ac-ft/yr from the Colorado River, but will create additional waterfowl habitat (See Section 5.5.3 for additional information).
Agricultural & Natural Resources Considerations Agricultural users in the lower Colorado River Basin predominantly rely on interruptible water supply provided from ROR rights and stored water released from the Highland Lakes. Due to current historic drought in the Basin, characterized by low inflows and reservoir storage condition, interruptible water releases from the Highland Lakes for agricultural use were largely stopped after 2011, with the exception of the Garwood operations. The construction of the Mid-Basin Off-Channel will lessen the need to release Highland Lakes’ water to meet firm water demands near the coast and could improve interruptible agricultural water reliability and efficiency. The new reservoir will increase LCRA’s operational flexibility, which, in turn, has the potential to enhance the water availability in the lower basin for a variety of purposes, including agriculture. This strategy could potentially make available up to 18,000 ac-ft/yr of water for agricultural purposes, depending on firm customer needs.
Excess Flows Permit This strategy consists of a new off-channel reservoir, preliminarily named the Excess Flows Off-Channel Reservoir. LCRA already holds TCEQ Water Use Permit No. 5731, which authorizes LCRA to divert, store and use for various beneficial purposes up to 853,514 ac-ft per year from the Colorado River, subject to significant environmental flow requirements, into one or more off-channel reservoirs (up to 500,000 acre-feet of off-channel storage) located within Colorado, Wharton, and Matagorda counties. No location and size are yet determined, but for cost estimating purposes and assignment with the TWDB database, Colorado County is used as the location, and the size is expected to be comparable to the Lane City off-channel reservoir at 40,000 acre-feet, although it could be smaller or larger. This facility is one of a potential series of reservoirs that are authorized under this permit. This proposed strategy differs from two of the other potential off-channel reservoirs discussed in previous sections of this report (Prairie and Mid-Basin OCR) in that the TCEQ Permit No. 5731 already authorizes the storage facility, subject to a permit amendment specifying its location, and various other requirements, including but not limited to dam safety review It is also possible that, in lieu of a separate additional off-channel reservoir, the Excess Flows Permit could be used in conjunction with other water rights as a source of supply for the Prairie Site or Lane City reservoirs.
The purpose of an off-channel reservoir is to capture available river flows not needed downstream and store the captured water for later use. The reservoir could supply water directly to end users, or release water back to the river for use downstream. The demands served by this strategy could range from municipal and industrial uses to agricultural users near the coast, and environmental flow needs.
This strategy would provide other benefits. Currently, when water is released from the Highland Lakes to downstream water users; it takes a long time (several days) to reach those users, because the lakes are far
2016 LCRWPG WATER PLAN 5-51
Lower Colorado Regional Water Planning Group November 2015
from the point of use. If it rains in the time it takes for the water to get from the release point to the point of use, the released stored water may no longer be needed at that time, but could be captured and stored in the off-channel reservoir to be beneficially used at a later time in lieu of additional releases of stored water. Additionally, since this off-channel reservoir would be located a shorter distance to the users than the existing release points, released water from this reservoir would reach the users sooner.
The infrastructure required to implement this strategy includes:
New off-channel reservoir.
A new river intake, pump station, and pipeline, to pump from the river to the reservoir.
A new pipeline from the reservoir to the river, to return flows.
A new pump station and/or pipeline from the reservoir to the point of use.
The projected yields from this strategy were determined using the Region K Cutoff Model, and are shown by decade in Table 5-26.
15,257 15,543 15,830 16,117 16,404 16,691 Cost Implications of Proposed Strategy For planning purposes, costs for this strategy were estimated by taking the average of the Lane City and Prairie reservoir costs. These costs were developed based on information provided by LCRA, and the Texas Water Development Board (TWDB) Cost Estimating Tool. Consistent with the tool, all costs are given in September 2013 dollars. The following table shows the estimated costs associated with this strategy.
Table 5-27: LCRA Excess Flows Reservoir Cost
Total Construction
Cost
Total Capital Cost
Largest Annual
Cost
Unit Cost
($/ac-ft)
$213,000,000 $298,000,000 $22,065,000 $1,446.00
Environmental Considerations The Excess Flows Off-Channel Reservoir is off-channel and would rely for its yield on capturing river flows available only after meeting significant instream flow and freshwater inflow requirements. Due to the environmental restrictions in the permit, diversions are not expected to have any significant environmental impacts. In addition, the reservoir will enhance LCRA’s ability to manage flows in the lower Basin, including potential use of the water for managed waterfowl habitat and, with further amendments, water stored in the reservoir might be released to help meet inflow needs of Matagorda Bay.
2016 LCRWPG WATER PLAN 5-52
Lower Colorado Regional Water Planning Group November 2015
This strategy could potentially remove up to 16,691 ac-ft/yr from the Colorado River (See Section 5.5.3 for additional information).
Agricultural & Natural Resources Considerations Agricultural users in the lower Colorado River Basin predominantly rely on interruptible water supply provided from ROR rights and stored water released from the Highland Lakes. Due to current historic drought in the Basin, characterized by low inflows and reservoir storage condition, interruptible water releases from the Highland Lakes for agricultural use were largely stopped after 2011, with the exception of the Garwood operations. The construction of the Excess Flows Off-Channel Reservoir will lessen the need to release Highland Lakes’ water to meet firm water demands near the coast and improve interruptible agricultural water reliability and efficiency. The new reservoir will increase LCRA’s operational flexibility, which, in turn, has the potential to enhance the water availability in the lower basin for a variety of purposes, including agriculture. This strategy could potentially make available up to 16,691 ac-ft/yr of water for agricultural purposes, depending on firm customer needs.
5.2.3.1.11. Acquire Additional Water Rights
From time to time, some owners offer to sell water rights and there are situations where it could be useful to LCRA to buy water rights. These situations include: the desire to acquire water rights that are “senior” to the priority date of the Highland Lakes, thereby reducing independent water rights that affect the reliable supply of the lakes; acquisition of water rights in order to streamline management of river diversions; acquisition of water rights in an area where LCRA needs additional water resources to meet needs, and other situations. Acquisition of water rights by LCRA could occur in any of LCRA’s water service area counties, and these counties include all of the counties in the Region K regional planning area. For purposes of describing a water management strategy, the acquisition could be for a water right authorizing run-of-river diversions up to 500 ac-ft per year. However, the quantity could also vary considerably from the amount assumed, dependent on the actual amount and location of water rights available for purchase, which cannot be predicted with any certainty at this time. Further, for planning purposes, the water right is assumed to have a reliable supply of about one-half of its diversion right, or about 250 ac-ft/year of reliable water acquired for each water right.
Issues and Considerations
Issues and considerations for the transfer of ownership and/or use of a surface water right is site-specific and depends on several factors, including: whether the water right is currently being used; whether the water right will continue being used for its current purpose, or moved elsewhere; current environmental requirements on the water right; amended environmental requirements added by TCEQ; and, whether the diversion point of the water right may be moved.
Cost Implications of Proposed Strategy
The acquisition cost used for the analysis is $500 per ac-ft of reliable water (one-time cost, which can be considered a capital investment). This will be a capital cost of $125,000.
Environmental Considerations
2016 LCRWPG WATER PLAN 5-53
Lower Colorado Regional Water Planning Group November 2015
There is a potential positive benefit of up to 250 ac-ft/yr to environmental flows for the situation where upstream water rights are acquired and the diversion point is moved downstream, thereby leaving water in a portion of the river that otherwise would have been diverted upstream. For the situation where a water right is moved upstream, the TCEQ typically will impose permit conditions to protect intervening water right holders and address instream environmental impacts.
Agricultural & Natural Resources Considerations
If existing agricultural irrigation water rights are acquired, and the water rights are currently being used, and the purchased water rights are converted to another use, then there could be an impact to agriculture of up to 250 ac-ft/yr due to the slightly reduced water supply unless the farmer has an alternate source of supply.
5.2.3.1.12. Downstream Return Flows
Downstream return flows from the City of Pflugerville are discussed in Section 5.2.1.2. This benefit is assigned to LCRA, and through a bed and banks permit, the return flows could be transported to a diversion location for an LCRA customer or to be stored in an off-channel reservoir.
5.2.3.1.13. Description of the Impact of the Management Strategies on Navigation
The overall impact on navigation in Region K is negligible in the area of the Colorado River and Matagorda Bay that is tidally influenced. This is the area where the most shipping occurs and navigation will be least affected in this zone. Once beyond the tidally influenced areas, the overall impact of the management strategies will be to reduce the amount of currently available interruptible water supplies as the current WUGs increase in demand over time through growth in population. However, the current LCRA Water Management Plan calls for a release of up to 33,440 acre feet. Navigation on the Colorado upstream of the tidally influenced areas is primarily for pleasure craft, and the impact of the mandated releases under the LCRA Management Plan plus other downstream flows may provide sufficient water for navigation purposes. Based in terms of a high, medium, or low impact, the estimated impact to navigation will be low.
5.2.3.2 City of Austin (COA) Water Management Strategies
The COA provides water for municipal, manufacturing, and steam electric water uses. COA’s existing service area covers portions of Travis, Williamson, and Hays Counties. The COA water management strategies and total water amounts for each strategy are summarized in the following table.
2016 LCRWPG WATER PLAN 5-54
Lower Colorado Regional Water Planning Group November 2015
Table 5-28: COA Water Management Strategies (ac-ft/yr)
COA Strategies 2020 2030 2040 2050 2060 2070 Municipal and Manufacturing Conservation - Leak reduction, landscaping, efficiency, etc. 22,969 24,559 28,317 31,220 33,822 36,899 Rainwater Harvesting 83 828 4,141 8,282 12,423 16,564 City of Austin Direct Reuse 5,429 10,429 20,429 22,929 25,429 27,929 Other Reuse - decentralized, graywater, etc. 1,000 1,000 1,500 2,000 2,500 3,000 Drought Management 16,516 19,260 22,206 24,484 26,524 28,937 Longhorn Dam Operation Improvements 3,000 3,000 3,000 3,000 3,000 3,000 Lake Long Enhanced Storage – COA Municipal and Manufacturing 20,000 20,000 20,000 20,000 20,000 20,000 Capture local inflows to Lady Bird Lake 1,000 1,000 1,000 1,000 1,000 1,000 Aquifer Storage and Recovery 10,000 25,000 25,000 50,000 50,000 50,000 Strategies for Drought Management Indirect Potable Reuse through Lady Bird Lake 20,000 20,000 20,000 20,000 20,000 20,000 Lake Austin operations 2,500 2,500 2,500 2,500 2,500 2,500 Alternate Strategies Down-dip brackish groundwater 0 5,000 5,000 5,000 5,000 5,000 Reclaimed water bank infiltration to Colorado Alluvium 0 15,000 20,000 25,000 30,000 30,000
Steam Electric Lake Long Enhanced Storage - COA Steam Electric 2,000 2,000 2,000 2,000 2,000 2,000 Additional LCRA Contracts 6,000 7,000 9,000 11,000 13,000 15,000 Direct Reuse - Steam Electric 3,500 7,500 7,500 8,500 9,500 10,500 5.2.3.2.1. Water Conservation
The COA conservation strategy is discussed in detail in Section 5.2, Conservation, as required by the TWDB. 5.2.3.2.2. Water Reclamation Initiative (Direct Reuse)
The COA reclaimed water program is also referred to as the City’s Water Reclamation Initiative. This direct reuse program includes continued development of water distribution systems to provide reclaimed water to meet non-potable water demands within the City's service area. The City has established its Central Reclaimed Water System from the Walnut Creek Wastewater Treatment Plant (WWTP) and its South system from the South Austin Regional WWTP. These systems are expected to have a planning horizon capacity of over 40,000 ac-ft/yr. Austin has also evaluated the feasibility of developing reclaimed water facilities in other areas of the City as part of its reclaimed water system master planning efforts. The City projects that it will need to develop the use of reclaimed water to the maximum extent possible, up to and if necessary, 100 percent reuse of its effluent to meet future needs. As the level of
2016 LCRWPG WATER PLAN 5-55
Lower Colorado Regional Water Planning Group November 2015
authorized reclaimed water use in the COA increases, the amount of flow it returns to the Colorado River may decrease accordingly. In addition to the water conservation measures the COA has implemented to reduce water demands, the COA is pursuing the development of reclaimed water as an additional supply of water to meet non-potable demands in the area. To meet the total projected water demands, the Water Reclamation Initiative would need to supply up to an additional 28,000 ac-ft/yr for direct municipal and manufacturing non-potable purposes by the year 2070, plus approximately 10,500 ac-ft/yr of COA direct non- potable use for steam electric needs in Travis County. The approximate total amount of this direct reuse supply in Travis County is approximately 43,000 ac-ft/yr, which includes approximately 4,600 ac-ft/yr of existing direct reuse supply. The City is currently using reclaimed water from its existing reclaimed system to irrigate several golf courses, provide water for cooling towers, and meet other non-potable needs. The City estimates this use to be approximately 4,600 ac-ft/yr. In order to expand the availability and use of reclaimed water, the COA has completed a series of planning activities, including the publication of the 1998 Water Reclamation Initiative (WRI) Planning Document, and completion of the north and south system master plans. In addition, COA completed a Title XVI federal cost-share program feasibility study in conjunction with the Federal Bureau of Reclamation (FBR). The City anticipates that the use of reclaimed water will increase steadily from the current level of 4,600 ac-ft/yr with construction of additional major infrastructure components of the reclaimed system, including pump stations, storage, reclaimed water mains, and wastewater treatment plant filter and process improvements at multiple facilities. The COA will continue to pursue implementation of its WRI and anticipates that additional capacity will be available in the future as the needs increase over the planning horizon. Table 5-29 shows the projected capacity increases for the three main categories of reuse for each decade of the planning period. Note: WRI system master plans have been developed to a system capacity level of approximately 30,000 ac-ft/yr. Additional non-potable water demand and system infrastructure will be required to increase the direct reuse system capacity to achieve the increased volumes included in this plan. Table 5-29: Anticipated Reclaimed Water Capacity (Direct Reuse)
Note: Anticipated capacity information provided by COA.
Through its ongoing water resources planning efforts, COA evaluates its water reuse program and options for expansion. Future plan updates will reflect changes as additional Austin water reclamation program information becomes available.
2016 LCRWPG WATER PLAN 5-56
Lower Colorado Regional Water Planning Group November 2015
Projected Reduction of Return Flows
The COA recognizes that the water demand projections contained in the Lower Colorado Regional Water Plan are only projections. Actual water demands may increase faster or slower than projected. The City will monitor the growth of its water demands and adjust its reclaimed water program, as well as its other water conservation programs, accordingly. As a result, the City has indicated that it may increase the use of reclaimed water at a faster rate than projected in this plan. The City believes that the increased use of reclaimed water will provide, in addition to the benefit of conserving sources of raw water, a monetary benefit to the COA through decreased raw water costs and delayed capital expenditures. As return flows discharged by Austin diminish in the future due to increasing reclamation of water, other sources may need to be dedicated or developed to meet needs that may currently be met by return flows discharged by Austin. Any decrease in municipal return flows will likely be gradual. However, the City projects that it will increase its use of reclaimed water to the maximum extent feasible to meet demands above 325,000 ac-ft/yr, whether those demands occur before or after 2070.
Opinion of Probable Costs
In addition to water conservation, the use of reclaimed water has been identified as a significant source of water to meet the COA’s projected demand deficits in 2070. The City has completed planning studies for a Reclaimed Water System to serve potential customers in the City. The system will provide a portion of the water supply required to meet the COA's identified needs. Cost Implications of Proposed Strategy
Costs for this strategy were developed based on background information provided by the City of Austin, and the Texas Water Development Board (TWDB) Cost Estimating Tool. Consistent with the tool, all costs are given in September 2013 dollars.
The following table shows the estimated costs associated with this strategy for the planning, design, and construction of the additional major infrastructure components of the reclaimed system, including pump stations, storage, reclaimed water mains, and wastewater treatment plant filter and process improvements at multiple facilities.
Table 5-30: Cost Estimate for City of Austin Direct Reuse Strategy
The water quality impacts from direct reuse of reclaimed water are regulated by the TCEQ through 30 TAC Chapter 210. Reclaimed water projects authorized under these regulations are presumed to be protective of human health and the environment. The potential impacts generated through the
2016 LCRWPG WATER PLAN 5-57
Lower Colorado Regional Water Planning Group November 2015
construction of the proposed pipelines and pump stations will need to be addressed in the preliminary engineering studies to be conducted for these projects.
The use of reclaimed water presents an alternative for providing water for non-potable uses without the development of new water supplies for the City of Austin for the planning period. The costs and environmental impacts of expanding the City’s current reuse system will have to be determined as more specific information, such as the locations of customers to be served, is identified. The extent of pipeline and other transmission facilities will have to be determined before specific environmental impacts can be estimated. However, the majority of the facilities needed will most likely be placed in existing easements and, therefore, minimize the impact upon natural resources.
Table 5-2 shows the expected return flows from the COA after accounting for reuse and other demand reduction measures. Over the planning period, return flow amounts are projected to increase. The environmental impact analysis for this strategy compared the impact of return flows less the amount of reuse to the impact of no return flows for 2020 and 2070 scenarios. As would be expected, the impacts to instream flows and freshwater inflows to Matagorda Bay showed mainly flow increases. Agricultural & Natural Resources Considerations
Impact to agriculture is low based on the projected return flow amounts over the planning period, as shown in Table 5-31.
Table 5-31: Projected COA Return Flows by Decade*
COA Return Flows 2020 2030 2040 2050 2060 2070 Projected COA Return Flows 77,013 73,057 80,023 85,707 89,806 101,578
*Based on data provided by COA. These are projected return flow amounts after accounting for the City’s projected conservation, direct reuse, and other projects utilizing the City’s treated effluent. These projections are subject to change and are updated each planning cycle.
As allowed by state law and as contemplated by the City of Austin and LCRA 2007 Settlement Agreement, the City intends to use reclaimed water to the maximum extent feasible to meet demands above 325,000 ac-ft/yr, whether those demands occur before or after 2070. As a result, although current projections do not indicate that the City will need to reuse all of its effluent during this planning cycle, this strategy could result in the City potentially reusing all of its effluent to meet growing demands and, ultimately, the City could have zero return flow to the Colorado River from its wastewater treatment plants (WWTP).
5.2.3.2.3. Aquifer Storage and Recovery
Aquifer storage and recovery is a strategy in which water can be stored in an aquifer during wetter periods and recovered for use during drier periods. Storing water in an aquifer can improve drought preparedness by providing supply during drier periods if water is banked underground, especially during wetter periods. Additionally, storing water underground reduces the amount of water that evaporates compared to water storage in above ground reservoirs. By providing a water-banking system and reducing evaporation, aquifer storage and recovery offers an opportunity to improve water supply during drought and to reduce evaporative losses. This type of strategy is currently being used by cities in Texas including San Antonio, Kerrville and El Paso.
2016 LCRWPG WATER PLAN 5-58
Lower Colorado Regional Water Planning Group November 2015
This strategy requires a suitable aquifer with sufficient available storage capabilities. For the City of Austin aquifer storage and recovery strategy, treated Colorado River water under the City’s existing water rights and contract agreements is a potential source of water particularly during non-drought years. Additionally, treated effluent from the Walnut Creek Wastewater Treatment Plant (WWTP) is one of the water sources to be considered for the aquifer storage and recovery project. Potential storage aquifers to be considered for the strategy include the Northern Edwards Aquifer, the Trinity Aquifer, brackish Edwards Aquifer, and the Carrizo/Wilcox Aquifer.
An aquifer and project study would be required for the identified aquifer to determine feasibility and implementation requirements. Significant land acquisition by the City of Austin may be required for the aquifer storage and recovery wells and other facilities. Analysis of treatment requirements to provide acceptable water quality for aquifer injection and for distribution will be conducted. Pipelines from the water source to the wells and from the wells to the distribution system will be required.
This strategy will likely have an implementation time of 3 to 5+ years. The estimated yield is shown in the following table.
Table 5-32: City of Austin Aquifer Storage and Recovery Project Yields
Water Management Strategies (ac-ft/yr)
2020 2030 2040 2050 2060 2070
10,000 25,000 25,000 50,000 50,000 50,000
Cost Implications of Proposed Strategy
Costs for this strategy were developed based on background information provided by the City of Austin, and the Texas Water Development Board (TWDB) Cost Estimating Tool. Consistent with the tool, all costs are given in September 2013 dollars.
The capital cost for this strategy is primarily driven by additional treatment, length of the proposed new pipelines, the purchase of easement/land, and the construction of the proposed aquifer storage and recovery wells.
The following table shows the estimated costs associated with this strategy.
Table 5-33: City of Austin Aquifer Storage and Recovery Strategy Costs
Total Construction
Cost
Total Capital Cost
Largest Annual
Cost
Unit Cost ($/ac-ft)
$225,000,000 $312,316,000 $30,185,000 $604.00
Environmental Considerations
The aquifer storage and recovery stagey will require extensive permitting to ensure it complies with all environmental considerations. An aquifer study is required to determine the impact of the strategy on the
2016 LCRWPG WATER PLAN 5-59
Lower Colorado Regional Water Planning Group November 2015
proposed storage aquifer. Project planning will include identification of permit requirements, including environmental permitting, to implement the strategy.
Limited environmental impacts are assumed for the reduced effluent flow in project options using reclaimed water as a portion of the supply that will be diverted to the aquifer storage and recovery wells. See Table 5-31 for the volume of return flows to the Colorado River after reuse strategy volumes are accounted for. While reusing water supplies rather than returning them downstream can reduce instream flows and bay and estuary inflows, particularly during drought or low flow conditions, reuse is a responsible way of increasing water supplies over time and should be encouraged when possible.
Refer to Chapter 1, Appendix 1A, for the complete list by County of threatened and endangered species in the Lower Colorado Regional Water Planning Area. These species may need to be considered during construction of infrastructure.
Agricultural & Natural Resources Considerations
Limited impacts are expected to agriculture or natural resources in project options using reclaimed water as a portion of the supply that will be diverted to the aquifer storage and recovery wells. Reuse could potentially reduce return flows that become available run-of-river water for downstream water users. See Table 5-31 for the volume of return flows to the Colorado River after reuse strategy volumes are accounted for.
5.2.3.2.4. Longhorn Dam Operation Improvements
This storage efficiency strategy consists of making improvements to the operation of the Longhorn Dam. The Longhorn Dam bascule gates are used as the primary source for the releases for water from the dam. The bascule gates operate by lowering the crest height of the gate to allow water to flow through the gate. Austin Energy has recently completed an improvement project for the dam’s two bascule gates, thus improving their hydraulic efficiency. Additionally, Austin Energy and LCRA have coordinated on making additional gate adjustments for improved hydraulic efficiency through the dam’s two existing knife gates. The hydraulic efficiency improvements to the bascule gates and the adjustments to the existing knife gates are expected to deliver approximately 3,000 acre-feet per year of water savings, as shown in the following table.
Table 5-34: City of Austin Longhorn Dam Operation Improvements Yield
Water Management Strategies (ac-ft/yr)
2020 2030 2040 2050 2060 2070
3,000 3,000 3,000 3,000 3,000 3,000
Cost Implications of Proposed Strategy
Costs for this strategy were developed based on background information provided by the City of Austin, and the Texas Water Development Board (TWDB) Cost Estimating Tool. Consistent with the tool, all costs are given in September 2013 dollars.
2016 LCRWPG WATER PLAN 5-60
Lower Colorado Regional Water Planning Group November 2015
The capital cost for this strategy is primarily driven by the improvements to the bascule gates. There are also operations and maintenance costs associated with making adjustments to the knife gate. The following table shows the estimated costs associated with this strategy.
Table 5-35: City of Austin Longhorn Dam Operations Improvements Costs
Total Construction
Cost
Total Capital Cost
Largest Annual
Cost
Unit Cost ($/ac-ft)
$741,000 $1,036,000 $87,000 $29.00
Environmental Considerations
No environmental impacts are assumed for completing the bascule gate improvement project and adjusting the existing knife gates at the Longhorn Dam.
Agricultural & Natural Resources Considerations
No impacts to agriculture or natural resources are expected as a result of implementing this strategy.
5.2.3.2.5. Rainwater Harvesting
The implementation of rainwater harvesting as a water management strategy is dependent upon the catchment area, storage capacity, rainfall frequency and water demand of the end user. On average, the Austin area generally receives about 32 inches of rainfall per year. This rainfall is not distributed uniformly during the year and, as a result, implementation of rainwater harvesting as a water management strategy should consider water demands and supplies over multi-month period.
Typically, rooftops serve as the catchment area for rainwater harvesting systems, either from a single residence or a group of buildings. A catchment area of 2,000 square feet basically yields about 1,000 gallons for 1 inch of rainfall. The required storage capacity is a function of the rainfall frequency and water demand. As stated above, the variability of rainfall results in a need to consider sizing facilities to provide storage over a multi-month period in order to balance rainfall with water demand.
If rainwater harvesting is considered for non-potable, secondary uses, as opposed to being a primary water supply, the significance of storage is lessened and the only remaining concern is the distribution system to deliver the water. This distribution system typically consists of a pump and pressure tank. However, some rainwater catchment systems are gravity driven, where pressurized systems are not required.
If rainwater harvesting is considered as the primary potable water supply, additional considerations concerning filtration and disinfection must be considered. The filtration is readily available with cloth and carbon filtration units. The disinfection is readily available with either chemical or ultraviolet systems. Similar to the non-potable use, a distribution system is required and includes a pump and pressure tank.
For the purposes of this planning round, it is envisioned that the City’s rainwater harvesting water management strategy provides supplemental auxiliary water for meeting on-site non-potable needs.
2016 LCRWPG WATER PLAN 5-61
Lower Colorado Regional Water Planning Group November 2015
However, rainwater harvesting and rainwater capture is to be studied in more detail as part of the City’s Integrated Water Resources Planning (IWRP) process which is beginning in early 2015. Through this IWRP process, it is anticipated that rainwater harvesting concepts will be further explored and developed in through the City’s IWRP process.
During the summer of 2014, an Austin City Council-appointed Water Resource Planning Task Force made a number of recommendations related to further evaluation of rainwater harvesting and exploration of ways to increase its use including storm water treatment systems to maximize infiltration, etc.
The estimated yield from this strategy is shown in the following table.
Table 5-36: City of Austin Rainwater Harvesting Yield
Water Management Strategies (ac-ft/yr) 2020 2030 2040 2050 2060 2070
Costs for this strategy, were developed based on maximizing the use of the City of Austin’s current rainwater harvesting rebate program allowances. Austin’s current rebate program allows up to a total maximum lifetime rebate amount of $5,000 per site. Cost estimates are based on the long-term decade utilization of this strategy using the yield estimate for 2070. It was assumed that this strategy could meet an average water demand of 0.12 acre feet per year per site. Based on the projected yield of this strategy in 2070, approximately 138,000 sites or systems would be required to produce an approximately 16,500 acre-feet/year level of use. It should be noted that this assumption would be an average across the system for all customer types for non-potable purposes, such as irrigation, washing equipment, and filling fountains. Additionally, in coordination with the City’s Watershed Protection Department, Austin Water is participating in processes to explore potentially expanded use of rainwater harvesting for additional non-potable auxiliary water purposes such as toilet flushing and other non-potable purposes around the home.
For the purposes of estimating the costs of this strategy as a City of Austin water management strategy, the current $5,000 maximum rebate per site amount was used to calculate an overall Total Capital and Project Cost (in 2070) of just over $690,000,000 based on this rebate amount and estimated number of sites. This represents the strategy cost that would be potentially incurred by the City of Austin. While based on the maximum lifetime rebate, this cost is only a portion of the cost of installing a full system and does not include full system costs or operations and maintenance costs which would be borne by the system owner. Another infrastructure option for this water management strategy may be to plan, design, and construct City of Austin rainwater harvesting facilities on a community scale. For additional information on rainwater harvesting and Austin Water rebates:
Lower Colorado Regional Water Planning Group November 2015
Table 5-37: City of Austin Rainwater Harvesting Cost
Total Construction
Cost
Total Capital Cost
Largest Annual Cost
Unit Cost ($/ac-ft)
$690,167,000 $690,167,000 $57,752,712 $3,487 Environmental Considerations The benefit of rainfall harvesting is a decreased use of surface water or groundwater. The close distance between the rainwater storage and the end use on the property, the gravity fed collection system, and the small footprints of storage tanks, this option does not have significant environmental or energy consumption impacts. Rainwater harvesting can additionally be beneficial from a stormwater management standpoint by reducing runoff during large storm events. Overall impacts to the environment and agricultures are expected to be negligible. In some states, water rights permits or authorizations are required for rainwater harvesting projects. Texas, however, does not require authorization for rainwater harvesting projects.
5.2.3.2.6. Lake Long Enhanced Storage
Decker Power Station Plant takes its cooling water needs from Lake Long (sometimes also referred to as Decker Lake). Currently, water from Colorado River is diverted to make up for evaporation losses, and maintain the level required for steam-electric cooling purposes at Decker Power Station Plant. Enhanced operation of Lake Long would allow for more fluctuation in lake level, up to approximately 25 feet. This strategy is aimed at increasing use of Lake Long storage by operating the lake as an off-channel reservoir with a variable lake level. This would help in saving water in lakes Travis and Buchanan through strategic Lake Long refill and release operations. The power plant would need to be taken off-line as part of this strategy. Austin Energy is exploring options for replacing the current power plant, which creates potential opportunities for this strategy to be implemented.
Lake Long holds approximately 30,000 acre-feet of water when full. The strategy can be implemented through coordination with LCRA, and through timely releases from Lake Long’s dam to satisfy downstream environmental flow requirements and other beneficial water uses, including a portion of Austin’s steam-electric needs in Fayette County. Improvements to Colorado River pump station will be required as part of this strategy, to increase pumping capacity and ability to refill lake. Additionally, a reclaimed water pipeline from Walnut Creek WWTP to Lake Long will be required. The proposed reclaimed water line can serve other purposes beyond the needs of this strategy in future.
The estimated yield for this strategy is shown in the following table.
2016 LCRWPG WATER PLAN 5-63
Lower Colorado Regional Water Planning Group November 2015
Table 5-38: City of Austin Lake Long Enhanced Storage Project Yields
WUG Name County River
Basin Water Management Strategies (ac-ft/yr)
2020 2030 2040 2050 2060 2070
Austin Travis Colorado 20,000
20,000
20,000
20,000
20,000
20,000
Steam-Electric Fayette Colorado
2,000
2,000
2,000
2,000
2,000
2,000
Costs Implications of Proposed Strategy The capital cost for this strategy is primarily driven by the length of the proposed new pipelines, and Colorado River pump station improvements. The cost of this strategy was estimated based on delivering 22,000 acre-feet per year. The pipeline proposed for this strategy is 30-inch in diameter, spanning approximately 5.0 miles from Lake Long to Walnut Creek WWTP, and 2.2 miles from existing Colorado River pump station to the southern edge of Lake Long.
Costs for this strategy were developed based on the Texas Water Development Board (TWDB) Cost Estimating Tool. Consistent with the tool, all costs are given in September 2013 dollars.
The following table shows the estimated costs associated with this strategy.
Table 5-39: City of Austin Lake Long Enhanced Storage Cost
Total Construction
Cost
Total Capital Cost
Largest Annual
Cost
Unit Cost ($/ac-ft)
$22,320,000 $31,041,000 $4,119,000 $187.00
Environmental Considerations Water rights, including amendments to existing City of Austin rights, should be addressed as part of this strategy. Additionally, wastewater discharge permits will be required. This strategy has potential to impact recreational water users. As discussed earlier, the power plant will need to be taken off-line when this strategy is engaged, which requires approval by Electric Reliability Council of Texas (ERCOT).
The environmental impact analysis for reuse compares the impact of return flows less the amount of reuse to the impact of no return flows. As would be expected, the impacts to instream flows and freshwater inflows to Matagorda Bay showed mainly flow increases. See Table 5-31 for the volume of return flows to the Colorado River after reuse strategy volumes are accounted for.
Refer to Chapter 1, Appendix 1A, for the complete list by County of threatened and endangered species in the Lower Colorado Regional Water Planning Area. These species may need to be considered during construction of infrastructure.
2016 LCRWPG WATER PLAN 5-64
Lower Colorado Regional Water Planning Group November 2015
Agricultural & Natural Resources Considerations
Negligible impacts to agriculture are anticipated as a result of this strategy.
5.2.3.2.7. Other Reuse
Concepts such as decentralization and graywater use are types of reuse projects that can be implemented on a local level.
The decentralized concept is the idea that reuse of storm water and treated wastewater can be efficiently managed by treating it and reusing it as close as possible to where it is generated. The City currently operates and maintains a number of decentralized wastewater treatment facilities. The effluent from some of these facilities is used in the area for turf irrigation. Decentralized infrastructure improvements are typically funded through Austin Water’s (AW) capital improvements program, through developer funded improvements, or City cost participation with the developer.
For the 2016 Regional Water Plan, this other water reuse strategy would consist of providing localized treatment of storm water and wastewater and local storage and transmission capabilities. These reuse strategies including decentralized concepts and graywater reuse are to be studied in more detail as part of the City’s Integrated Water Resources Planning (IWRP) process which is beginning in early 2015. Through this IWRP process, it is anticipated that rainwater harvesting concepts will be further explored and developed in through the City’s IWRP process.
For this strategy, it was assumed that two (2) neighborhoods would be identified to implement the decentralized concept.
Based on this assumption, the following infrastructure was proposed for each neighborhood.
One (1) 1.0 MGD Average Wastewater Treatment Plant
Booster Pump Station with one (1) Storage Tank
Approximately one (1) mile of transmission piping and appurtenances
A component of decentralization includes gray water. Graywater is defined as relatively clean wastewater containing minimal to no amounts of human waste, and is differentiated from blackwater or sewage which is discharged by toilets. Graywater is generated from hand washing basins, showers, and baths, and can also include wastewater from washing machines, dishwashers, and kitchen sinks. This water can be recycled locally for such uses as toilet flushing and landscape irrigation. The amount of infrastructure required for graywater is small compared to the infrastructure required for overall decentralization, so the graywater infrastructure and costs are assumed to be part of the overall decentralization infrastructure and costs.
2016 LCRWPG WATER PLAN 5-65
Lower Colorado Regional Water Planning Group November 2015
Table 5-40: City of Austin Other Reuse Project Yield
Water Management Strategies (ac-ft/yr)
2020 2030 2040 2050 2060 2070
1,000 1,000 1,500 2,000 2,500 3,000 Cost Implications of Proposed Strategy A capital cost estimate was developed using the Texas Water Development Board (TWDB) Cost Estimating Tool in September 2013 dollars. The Cost Estimating Tool was also used to determine operating costs.
The capital cost for this strategy is primarily driven by the cost of a treatment facility.
The following table shows the estimated costs associated with this strategy.
Table 5-41: City of Austin Other Reuse Cost
Total Construction
Cost
Total Capital Cost
Largest Annual
Cost
Unit Cost ($/ac-ft)
$15,518,000 $21,772,000 $3,067,000 $1,022.00 Environmental Considerations There are no environmental impacts from this strategy. The City of Austin currently has large regional wastewater treatment collection and treatment systems. The decentralized concept will reduce contributions to these systems from new development. It would eliminate additional discharges of treated wastewater from the regional treatment plants. Agricultural and Natural Resources Considerations No impacts to agriculture are expected, as a result of implementing this strategy. 5.2.3.2.8. Capture Local Inflows to Lady Bird Lake
This strategy consists of installing floating pump intake below Tom Miller Dam, and constructing transmission main to pump water from Lady Bird Lake (LBL) to the intake at Ullrich Water Treatment Plant. The strategy also includes capturing spring flows, including Barton Springs, and storm flows when they are not need for environmental flow maintenance or for downstream senior water rights.
This strategy is expected to provide approximately 1,000 acre-feet per year, once implemented, as shown in the following table.
2016 LCRWPG WATER PLAN 5-66
Lower Colorado Regional Water Planning Group November 2015
Table 5-42: City of Austin Capture Local Inflows to Lady Bird Lake Project Yield
Water Management Strategies (ac-ft/yr)
2020 2030 2040 2050 2060 2070
1,000 1,000 1,000 1,000 1,000 1,000
Cost Implications of Proposed Strategy The cost of this strategy was estimated using the Texas Water Development Board (TWDB) Cost Estimating Tool in September 2013 dollars. The capital cost for this strategy is primarily driven by the length of the proposed new pipeline, floating intake barge, and pump station additions. The cost of this strategy was estimated based on delivering 1,000 acre-feet per year of flow. The pipeline would span approximately 1,000 ft from Lady Bird Lake, downstream of Tom Miller Dam, and connecting to the intake of Ullrich Water Treatment Plant.
The following table shows the estimated costs associated with this strategy.
Table 5-43: City of Austin Capture Local Inflows to Lady Bird Lake Cost
Total Construction
Cost
Total Capital Cost
Largest Annual
Cost
Unit Cost ($/ac-ft)
$2,108,000 $2,949,000 $297,000 $297.00
Environmental Considerations Capturing storm and spring flows that would otherwise spill downstream could minimally reduce instream flows and possibly bay and estuary inflows, although needed environmental flows or flows to be passed downstream to meet the needs of senior water right would not be captured. The relatively small volume associated with this strategy should have negligible impacts on the overall volume of water in the Colorado River downstream to Matagorda Bay.
Refer to Chapter 1, Appendix 1A, for the complete list by County of threatened and endangered species in the Lower Colorado Regional Water Planning Area. These species may need to be considered during construction of infrastructure.
Agricultural & Natural Resources Considerations
Negligible impacts to agriculture are anticipated as a result of this strategy.
5.2.3.2.9. Indirect Potable Reuse through Lady Bird Lake
Due to the on-going drought conditions and water supply status, the City of Austin has been evaluating demands that can be met with water supply augmentation sources, water supply system operational enhancement projects, and demand-side management options. As part of their plan for potential water management strategies, the City of Austin is considering a potential river and reservoir system operational
2016 LCRWPG WATER PLAN 5-67
Lower Colorado Regional Water Planning Group November 2015
enhancement using Indirect Potable Reuse through Lady Bird Lake as a strategy in the 2016 Regional Water Plan.
The strategy would consist of conveying a portion of the South Austin Regional (SAR) Wastewater Treatment Plant (WWTP) discharge to Lady Bird Lake via reclaimed water mains. Water would be withdrawn from Lady Bird Lake with an intake pump station and pumped into the Ullrich Water Treatment Plant (WTP) intake line. The City’s 2014 Austin Water Resource Planning Task Force (AWRPTF) recommended that this option be considered for implementation in the event of 400,000 acre-feet of combined storage or less in Lakes Buchanan and Travis. Therefore, this option is only being considered at this time as a source of supply under certain extreme drought conditions.
Consultants for the City of Austin estimated that yields up to 20,000 acre-feet/year could be provided with this strategy, as shown in the following table.
Table 5-44: City of Austin Indirect Potable Reuse through Lady Bird Lake Project Yield
Water Management Strategies (ac-ft/yr) 2020 2030 2040 2050 2060 2070
20,000 20,000 20,000 20,000 20,000 20,000 The major infrastructure required for this strategy includes:
Acceleration of construction of reclaimed water lines identified in the Reclaimed Master Plan Water Intake and Pump Station Transmission piping and appurtenances
Improvements at SAR WWTP for a portion of the effluent to have additional treatment before discharge into Lady Bird Lake
As part of developing the indirect potable reuse strategy a number of permitting and engineering analyses will need to be conducted. Project components to be addressed include water quality modeling and TCEQ permitting.
Cost Implications of Proposed Strategy
A capital cost estimate was provided by the City of Austin. In order to provide a comparable cost consistent with other strategies in this report, operational costs were developed using the Texas Water Development Board (TWDB) Cost Estimating Tool in September 2013 dollars. The following table shows the estimated costs associated with this strategy.
Table 5-45: City of Austin Indirect Potable Reuse through Lady Bird Lake Cost
Total Construction
Cost
Total Capital Cost
Largest Annual
Cost
Unit Cost ($/ac-ft)
$30,000,000 $41,970,000 $3,593,000 $180.00
2016 LCRWPG WATER PLAN 5-68
Lower Colorado Regional Water Planning Group November 2015
Environmental Considerations As stated previously, additional treatment for nutrient removal may be required for the portion of water potentially being discharged in Lady Bird Lake. The AWRPTF recommended that discharge into the Lake should occur for the shortest possible time. Additional investigation will be required to evaluate environmental and water quality considerations and permitting in Lady Bird Lake.
The environmental impact analysis for reuse compared the impact of return flows less the amount of reuse to the impact of no return flows. As would be expected, the impacts to instream flows and freshwater inflows to Matagorda Bay showed mainly flow increases. See Table 5-31 for the volume of return flows to the Colorado River after reuse strategy volumes are accounted for.
Refer to Chapter 1, Appendix 1A, for the complete list by County of threatened and endangered species in the Lower Colorado Regional Water Planning Area. These species may need to be considered during construction of infrastructure.
Agricultural and Natural Resources Considerations No impacts to agriculture are expected, as a result of implementing this strategy. 5.2.3.2.10. Lake Austin Operations
Lake Austin is normally operated as a relatively constant level lake. This strategy would allow Lake Austin to operate with a varying level in the event that combined storage in Lakes Travis and Buchanan drops below 600,000 acre feet, as recommended by the AWRPTF. This would allow local flows to be captured during storm events and stored for use. The level could vary by approximately 3 feet during months outside of the peak recreational period for Lake Austin. The period of time for operating with a variable level was recommended to potentially be in the months of October through May.
There are no capital costs and no new permits associated with this strategy, and it could be implemented fairly quickly. However, potential stored water benefits would only be available when rainfall and lake level conditions allow. The City of Austin plans to conduct a robust public outreach and education process in advance of possible implementation of this strategy.
The projected yields from this strategy are shown in the following table.
Table 5-46: City of Austin Lake Austin Operations Project Yield
Water Management Strategies (ac-ft/yr)
2020 2030 2040 2050 2060 2070
2,500 2,500 2,500 2,500 2,500 2,500
Cost Implications of Proposed Strategy
Annual and unit costs were provided by consultants to the City of Austin and are shown in the table below. No capital and project costs were assumed.
2016 LCRWPG WATER PLAN 5-69
Lower Colorado Regional Water Planning Group November 2015
Table 5-47: City of Austin Lake Austin Operations Cost
Total Construction
Cost
Total Capital Cost
Largest Annual
Cost
Unit Cost ($/ac-ft)
$0 $0 $25,000 $10.00 Environmental Considerations Environmental impacts are expected to be negligible. Agricultural and Natural Resources Considerations No impacts to agriculture are expected, as a result of implementing this strategy. 5.2.4 Regional Water Management Strategies
There are several water management strategies that apply to multiple WUG categories, applied throughout the region. These strategies are discussed in this regional water management section of the report. For strategies specific to a category of water use, (Municipal, Irrigation, Manufacturing, Mining, and Steam Electric Power) refer to later sections of the report.
For municipal WUGs with shortages, water conservation was considered before these regional strategies, please refer to Section 5.2.2.3.
5.2.4.1 Expansion of Current Groundwater Supplies
This group of strategies includes WUGs with existing groundwater sources that may be seeking to expand the amount of groundwater they produce from that source or sources to meet their increasing needs.
5.2.4.1.1. Carrizo-Wilcox Aquifer
This alternative would involve pumping additional groundwater from the Carrizo-Wilcox aquifer, either using the WUG’s existing wells or drilling additional wells. This additional water, referred to as remaining supply, was determined by subtracting the water that is currently allocated from the available water under the Modeled Available Groundwater (MAG).
Table 5-48 presents the WUGs that would utilize this strategy along with the implementation decade and the amount of water to be pumped. Additional groundwater was only allocated to meet each WUG’s individual shortage.
2016 LCRWPG WATER PLAN 5-70
Lower Colorado Regional Water Planning Group November 2015
Table 5-48: Carrizo-Wilcox Aquifer Expansions
WUG Name County River Basin Water Management Strategies (ac-ft/yr)
Bastrop County Total for Colorado River Basin 415 447 180 211 784 749
This strategy was applied to the following WUGs in Bastrop County: Aqua WSC, Bastrop County WCID #2, County-Other, and Elgin. Elgin falls into both Bastrop and Travis Counties in Region K, and a portion of the strategy supplies for Elgin were allocated to the Travis County portion.
Cost Implications of Proposed Strategy
Table 5-49 presents a summary of the probable costs for each WUG utilizing this strategy. The four cost components analyzed during cost estimation of this strategy were: Total Construction Cost, Total Capital Cost, Annual Cost, and Unit Cost.
The costs of the groundwater supply strategies were estimated using the Texas Water Development Board (TWDB) Cost Estimating Tool. For all these strategies, it was assumed that a new well field and transmission piping (interconnecting well piping) was provided.
A peaking factor of two (2) was assumed (twice the largest quantity of water supplied). The number of new wells was determined in the Cost Estimating Tool, based on the largest quantity of water supplied over the planning period. Wells were all assumed to be the same type, size, at the same elevation, and to have an efficiency of 80%. The well field layout was determined by two wells per “node”, a 0.5 mile transmission line between each well and its node, and an additional 0.5 mile “trunk” line connecting to the next node.
No new distribution piping was assumed for expansion projects, and a 5-mile distribution pipeline (with no pump station) was assumed for new projects. From a cost standpoint, the Carrizo-Wilcox Aquifer Expansion for Aqua WSC was treated as a new project, due to its large size. The distribution line was assumed to be one pipe, five miles long, with a diameter based on a velocity of 5 ft/s at peak flow.
Additional capital costs including engineering, legal services, contingencies, environmental and archeology studies and mitigation, land acquisition and surveying, and interest during construction were estimated using the Cost Estimating Tool. Annual costs including debt service, operation and maintenance, and pumping energy costs were also estimated using the tool.
2016 LCRWPG WATER PLAN 5-71
Lower Colorado Regional Water Planning Group November 2015
Environmental Considerations The environmental impacts of expanded groundwater use will vary depending upon site characteristics. Some impacts may occur from the expansion of existing groundwater infrastructure, but well sites are generally small in areal extent, and the disturbance from pipeline construction is temporary. Availability numbers were developed by the Lost Pines Groundwater Conservation District for this aquifer in Bastrop County, and they attempt to limit the groundwater use to the amount that can be replenished on an annual basis. If this is the case, then the impact on the environment should be low. The water supply is within the Modeled Available Groundwater (MAG), so drawdown in the aquifer could be up to 237 feet. It is assumed that using water within the stated available yield should result in negligible impacts to springflows, but aquifer levels and springflows should be monitored. The Groundwater Conservation Districts will monitor the aquifer levels for any needed changes to the identified available volume. Refer to Chapter 1, Appendix 1A, for the complete list by County of threatened and endangered species in the Lower Colorado Regional Water Planning Area. These species may need to be considered during construction of infrastructure. Agricultural and Natural Resources Considerations There are currently no irrigation WUGs with supplies of irrigation water or livestock water from the Carrizo-Wilcox Aquifer in Region K. This is not a source of choice, probably because of the depth of the aquifer. In addition, the terrain in Bastrop County is often not conducive to irrigated agriculture. Therefore, the impact on agriculture is negligible. 5.2.4.1.2. Ellenburger-San Saba Aquifer
This alternative would involve pumping additional groundwater from the Ellenburger-San Saba aquifer, either using the WUG’s existing wells or drilling additional wells. This additional water, referred to as remaining supply, was determined by subtracting the water that is currently allocated from the available water.
2016 LCRWPG WATER PLAN 5-72
Lower Colorado Regional Water Planning Group November 2015
Table 5-50 presents the WUGs that would utilize this strategy along with the implementation decade and the amount of water to be pumped. Additional groundwater was only allocated to meet each WUG’s individual shortage.
Table 5-50: Ellenburger-San Saba Aquifer Expansions
WUG Name County River Basin Water Management Strategies (ac-ft/yr)
2020 2030 2040 2050 2060 2070
County-Other Blanco Colorado 0 0 0 55 55 55
Johnson City Blanco Colorado 175 175 175 175 175 175
Blanco County Total for Colorado River Basin 175 175 175 230 230 230
Burnet County Total for Colorado River Basin 1,680 1,680 1,680 1,680 1,680 1,680 Manufacturing Gillespie Colorado 626 626 626 626 626 626
Gillespie County Total for Colorado River Basin 626 626 626 626 626 626
This strategy was applied to the following WUGs: County-Other and Johnson City in Blanco County, Bertram and Mining in Burnet County, and Manufacturing in Gillespie County.
Cost Implications of Proposed Strategy
Table 5-51 presents a summary of the probable costs for each WUG utilizing this strategy. The four cost components analyzed during cost estimation of this strategy were: Total Construction Cost, Total Capital Cost, Annual Cost, and Unit Cost.
The costs of the groundwater supply strategies were estimated using the Texas Water Development Board (TWDB) Cost Estimating Tool. For all these strategies, it was assumed that a new well field and transmission piping (interconnecting well piping) was provided.
A peaking factor of two (2) was assumed (twice the largest quantity of water supplied). The number of new wells was determined in the Cost Estimating Tool, based on the largest quantity of water supplied over the planning period. Wells were all assumed to be the same type, size, at the same elevation, and to have an efficiency of 80%. The well field layout was determined by two wells per “node”, a 0.5 mile transmission line between each well and its node, and an additional 0.5 mile “trunk” line connecting to the next node. No new distribution piping was assumed.
Additional capital costs including engineering, legal services, contingencies, environmental and archeology studies and mitigation, land acquisition and surveying, and interest during construction were estimated using the Cost Estimating Tool. Annual costs including debt service, operation and maintenance, and pumping energy costs were also estimated using the tool.
2016 LCRWPG WATER PLAN 5-73
Lower Colorado Regional Water Planning Group November 2015
Table 5-51: Ellenburger-San Saba Aquifer Expansion Costs
Manufacturing Gillespie Colorado $2,535,000 $3,880,000 $372,000 $594.00 Environmental Considerations The environmental impacts of expanded groundwater use from the Ellenburger-San Saba Aquifer will vary depending upon site characteristics but are not expected to be significant. Some impacts may occur from the expansion of existing groundwater infrastructure, but well sites are generally small in areal extent and the disturbance from pipeline construction is temporary. The water supply is within the Modeled Available Groundwater (MAG), so drawdown in the aquifer could be up to 2 feet. It is assumed that using water within the stated available yield should result in negligible impacts to springflows, but aquifer levels and springflows should be monitored. The Groundwater Conservation Districts will monitor the aquifer levels for any needed changes to the identified available volume.
Refer to Chapter 1, Appendix 1A, for the complete list by County of threatened and endangered species in the Lower Colorado Regional Water Planning Area. These species may need to be considered during construction of infrastructure.
Agricultural and Natural Resources Considerations
The Ellenburger-San Saba is a source of water supply for agricultural interests in Burnet, Blanco, Gillespie and Llano Counties. The additional drafting of this aquifer has the potential to draw down the static and pumping water levels and increase the cost of production for agricultural users, but impacts are likely to be negligible. 5.2.4.1.3. Edwards-BFZ Aquifer
This alternative would involve pumping additional groundwater from the Edwards-BFZ aquifer, either using the WUG’s existing wells or drilling additional wells. This additional water, referred to as remaining supply, was determined by subtracting the water that is currently allocated from the available water.
Table 5-52 presents the WUG that would utilize this strategy along with the implementation decade and the amount of water to be pumped. Additional groundwater was only allocated to meet each WUG’s individual shortage.
2016 LCRWPG WATER PLAN 5-74
Lower Colorado Regional Water Planning Group November 2015
Table 5-52: Edwards-BFZ Aquifer Expansions
WUG Name County River Basin Water Management Strategies (ac-ft/yr)
This strategy was applied to the Pflugerville WUG in Travis County.
Cost Implications of Proposed Strategy
Table 5-53 presents a summary of the probable costs for each WUG utilizing this strategy. The four cost components analyzed during cost estimation of this strategy were: Total Construction Cost, Total Capital Cost, Annual Cost, and Unit Cost.
The costs of the groundwater supply strategies were estimated using the Texas Water Development Board (TWDB) Cost Estimating Tool. For all these strategies, it was assumed that a new well field and transmission piping (interconnecting well piping) was provided.
A peaking factor of two (2) was assumed (twice the largest quantity of water supplied). The number of new wells was determined in the Cost Estimating Tool, based on the largest quantity of water supplied over the planning period. Wells were all assumed to be the same type, size, at the same elevation, and to have an efficiency of 80%. The well field layout was determined by two wells per “node”, a 0.5 mile transmission line between each well and its node, and an additional 0.5 mile “trunk” line connecting to the next node. No new distribution piping was assumed.
Additional capital costs including engineering, legal services, contingencies, environmental and archeology studies and mitigation, land acquisition and surveying, and interest during construction were estimated using the Cost Estimating Tool. Annual costs including debt service, operation and maintenance, and pumping energy costs were also estimated using the tool.
Table 5-53: Edwards-BFZ Aquifer Expansion Costs
WUG Name County River Basin Total
Construction Cost
Total Capital
Cost
Largest Annual
Cost
Unit Cost
($/ac-ft) Pflugerville Travis Colorado $2,564,000 $3,729,000 $371,000 $371.00 Environmental Considerations The environmental impacts of expanded groundwater use will vary depending upon site characteristics. Some impacts may occur from the expansion of existing groundwater infrastructure, but well sites are generally small in areal extent, and the disturbance from pipeline construction is temporary. Water supply is within the MAG, so spring/streamflow should be maintained at 42 ac-ft/month or higher. It is assumed that using water within the stated available yield should result in negligible impacts to springflows, but aquifer levels and springflows should be monitored.
2016 LCRWPG WATER PLAN 5-75
Lower Colorado Regional Water Planning Group November 2015
Refer to Chapter 1, Appendix 1A, for the complete list by County of threatened and endangered species in the Lower Colorado Regional Water Planning Area. These species may need to be considered during construction of infrastructure.
Agricultural and Natural Resources Considerations
Negligible impacts to agriculture are expected as a result of implementing this strategy. 5.2.4.1.4. Gulf Coast Aquifer
This alternative would involve pumping additional groundwater from the Gulf Coast aquifer, either using the WUG’s existing wells or drilling additional wells. This additional water, referred to as remaining supply, was determined by subtracting the water that is currently allocated from the available water.
Table 5-54 presents the WUGs that would utilize this strategy along with the implementation decade and the amount of water to be pumped. Additional groundwater was only allocated to meet each WUG’s individual shortage.
Table 5-54: Gulf Coast Aquifer Expansions
WUG Name County River Basin Water Management Strategies (ac-ft/yr)
Fayette County Total for Lavaca River Basin 1,129 1,129 1,129 1,129 1,129 1,129
This strategy was applied to County-Other in Colorado County, and County-Other, Mining, Flatonia, and Manufacturing in Fayette County;
Cost Implications of Proposed Strategy
Table 5-55 presents a summary of the probable costs for each WUG utilizing this strategy. The four cost components analyzed during cost estimation of this strategy were: Total Construction Cost, Total Capital Cost, Annual Cost, and Unit Cost.
2016 LCRWPG WATER PLAN 5-76
Lower Colorado Regional Water Planning Group November 2015
The costs of the groundwater supply strategies were estimated using the Texas Water Development Board (TWDB) Cost Estimating Tool. For all these strategies, it was assumed that a new well field and transmission piping (interconnecting well piping) was provided.
A peaking factor of two (2) was assumed (twice the largest quantity of water supplied). The number of new wells was determined in the Cost Estimating Tool, based on the largest quantity of water supplied over the planning period. Wells were all assumed to be the same type, size, at the same elevation, and to have an efficiency of 80%. The well field layout was determined by two wells per “node”, a 0.5 mile transmission line between each well and its node, and an additional 0.5 mile “trunk” line connecting to the next node. No new distribution piping was assumed.
Additional capital costs including engineering, legal services, contingencies, environmental and archeology studies and mitigation, land acquisition and surveying, and interest during construction were estimated using the Cost Estimating Tool. Annual costs including debt service, operation and maintenance, and pumping energy costs were also estimated using the tool.
The environmental impacts of expanded groundwater use will vary depending upon site characteristics but are not expected to be significant. Some impacts may occur from the expansion of existing groundwater infrastructure, but well sites are generally small in areal extent and the disturbance from pipeline construction is temporary. No Gulf Coast aquifer use is expected to surpass the current, available yield of the aquifers as determined in Chapter 3. However, personal observation of springs in the area by Bob Pickens has occurred. Based on his observations, it is not possible to tell whether the springs noted are from perched water tables from years of higher precipitation or springs from the Gulf Coast Aquifer. In any event, the Gulf Coast Aquifer formally had springs identified, but the known springs from the past have not flowed for many years. The water supply is within the Modeled Available Groundwater (MAG), so drawdown in the aquifer could be up to 12 feet, relative to 1999 conditions. It is assumed that using water within the stated available yield should result in negligible impacts to springflows, but aquifer levels and springflows should be monitored.
2016 LCRWPG WATER PLAN 5-77
Lower Colorado Regional Water Planning Group November 2015
Refer to Chapter 1, Appendix 1A, for the complete list by County of threatened and endangered species in the Lower Colorado Regional Water Planning Area. These species may need to be considered during construction of infrastructure. Agricultural and Natural Resources Considerations
Impacts to agriculture from this strategy are negligible, due to the locations and volumes of water. 5.2.4.1.5. Hickory Aquifer
This alternative would involve pumping additional groundwater, either using their existing wells or drilling additional wells. The WUGs were assumed to pump this additional water from their current supply. Table 5-56 presents the WUGs that would utilize this strategy along with the implementation decade and the amount of water to be pumped. Additional groundwater was only allocated to meet each WUG’s individual shortage.
Table 5-56: Hickory Aquifer Expansions
WUG Name County River Basin Water Management Strategies (ac-ft/yr)
2020 2030 2040 2050 2060 2070
County-Other Blanco Colorado 0 0 0 55 55 55
Blanco County Total for Colorado River Basin 0 0 0 55 55 55 Mining Burnet Colorado 0 500 1,000 1,800 1,800 1,800
Burnet County Total for Colorado River Basin 0 500 1000 1800 1800 1800
This strategy was applied to County-Other in Llano County and to Mining in Burnet County.
Cost Implications of Proposed Strategy
Table 5-57 presents a summary of the probable costs for each WUG utilizing this strategy. The four cost components analyzed during cost estimation of this strategy were: Total Construction Cost, Total Capital Cost, Annual Cost, and Unit Cost. The costs of the groundwater supply strategies were estimated using the Texas Water Development Board (TWDB) Cost Estimating Tool. For all these strategies, it was assumed that a new well field and transmission piping (interconnecting well piping) was provided.
A peaking factor of two (2) was assumed (twice the largest quantity of water supplied). The number of new wells was determined in the Cost Estimating Tool, based on the largest quantity of water supplied over the planning period. Wells were all assumed to be the same type, size, at the same elevation, and to have an efficiency of 80%. The well field layout was determined by two wells per “node”, a 0.5 mile transmission line between each well and its node, and an additional 0.5 mile “trunk” line connecting to the next node. No new distribution piping was assumed.
Additional capital costs including engineering, legal services, contingencies, environmental and archeology studies and mitigation, land acquisition and surveying, and interest during construction were
2016 LCRWPG WATER PLAN 5-78
Lower Colorado Regional Water Planning Group November 2015
estimated using the Cost Estimating Tool. Annual costs including debt service, operation and maintenance, and pumping energy costs were also estimated using the tool.
Environmental Considerations The sustainable yield of the Hickory aquifer has been provided by analysis of drawdown and pumping records, in the absence of a current model of the aquifer. The impacts from well construction and pipeline construction are limited to the disturbance during construction, and should not be a major environmental factor. The intent is to use no more from the aquifer than is returned to it on an annual basis, maintaining 100% saturated thickness in Burnet County. Drawdown of up to 7 feet could occur in Blano County, based on the MAG. This aquifer has limited springs, but in the absence of a model, it is assumed that using water within the stated available yield should result in negligible impacts to springflows, but aquifer levels and springflows should be monitored. Refer to Chapter 1, Appendix 1A, for the complete list by County of threatened and endangered species in the Lower Colorado Regional Water Planning Area. These species may need to be considered during construction of infrastructure. Agricultural and Natural Resources Considerations
The Hickory aquifer is used for both livestock watering and irrigation in Burnet, Gillespie, Llano, and San Saba Counties. The amounts used for these activities are far in excess of the amounts proposed in this strategy. As a result, anticipated impact on agriculture is negligible. 5.2.4.1.6. Marble Falls Aquifer
This alternative would involve pumping additional groundwater from the Marble Falls aquifer, either using the WUG’s existing wells or drilling additional wells. This additional water, referred to as remaining supply, was determined by subtracting the water that is currently allocated from the available water.
Table 5-58 presents the WUG that would utilize this strategy along with the implementation decade and the amount of water to be pumped. Additional groundwater was only allocated to meet each WUG’s individual shortage.
2016 LCRWPG WATER PLAN 5-79
Lower Colorado Regional Water Planning Group November 2015
Table 5-58: Marble Falls Aquifer Expansions
WUG Name County River Basin Water Management Strategies (ac-ft/yr)
2020 2030 2040 2050 2060 2070
Mining Burnet Colorado 0 0 0 0 1,000 1,500
This strategy was applied to the Mining WUG in Burnet County.
Cost Implications of Proposed Strategy
Table 5-59 presents a summary of the probable costs for each WUG utilizing this strategy. The four cost components analyzed during cost estimation of this strategy were: Total Construction Cost, Total Capital Cost, Annual Cost, and Unit Cost.
The costs of the groundwater supply strategies were estimated using the Texas Water Development Board (TWDB) Cost Estimating Tool. For all these strategies, it was assumed that a new well field and transmission piping (interconnecting well piping) was provided.
A peaking factor of two (2) was assumed (twice the largest quantity of water supplied). The number of new wells was determined in the Cost Estimating Tool, based on the largest quantity of water supplied over the planning period. Wells were all assumed to be the same type, size, at the same elevation, and to have an efficiency of 80%. The well field layout was determined by two wells per “node”, an 0.5 mile transmission line between each well and its node, and an additional 0.5 mile “trunk” line connecting to the next node. No new distribution piping was assumed.
Additional capital costs including engineering, legal services, contingencies, environmental and archeology studies and mitigation, land acquisition and surveying, and interest during construction were estimated using the Cost Estimating Tool. Annual costs including debt service, operation and maintenance, and pumping energy costs were also estimated using the tool.
The environmental impacts of expanded groundwater use will vary depending upon site characteristics. Some impacts may occur from the expansion of existing groundwater infrastructure, but well sites are generally small in areal extent, and the disturbance from pipeline construction is temporary. The water supply is within the Modeled Available Groundwater (MAG), so 100% saturated thickness should be maintained. It is assumed that using water within the stated available yield should result in negligible impacts to springflows, but aquifer levels and springflows should be monitored.
2016 LCRWPG WATER PLAN 5-80
Lower Colorado Regional Water Planning Group November 2015
Refer to Chapter 1, Appendix 1A, for the complete list by County of threatened and endangered species in the Lower Colorado Regional Water Planning Area. These species may need to be considered during construction of infrastructure.
Agricultural and Natural Resources Considerations
No impacts to agriculture are expected as a result of implementing this strategy.
5.2.4.1.7. Sparta Aquifer
This alternative would involve pumping additional groundwater, either using their existing wells or drilling additional wells. Table 5-60 presents the WUGs that would utilize this strategy along with the implementation decade and the amount of water to be pumped. Additional groundwater was only allocated to meet each WUG’s individual shortage.
Table 5-60: Sparta Aquifer Expansions
WUG Name County River Basin Water Management Strategies (ac-ft/yr)
2020 2030 2040 2050 2060 2070
Mining Fayette Guadalupe 66 42 13 0 0 0 This strategy was applied to the Mining WUG in Fayette County.
Cost Implications of Proposed Strategy
Table 5-61 presents a summary of the probable costs for each WUG utilizing this strategy. The four cost components analyzed during cost estimation of this strategy were: Total Construction Cost, Total Capital Cost, Annual Cost, and Unit Cost.
The costs of the groundwater supply strategies were estimated using the Texas Water Development Board (TWDB) Cost Estimating Tool. For all these strategies, it was assumed that a new well field and transmission piping (interconnecting well piping) was provided.
A peaking factor of two (2) was assumed (twice the largest quantity of water supplied). The number of new wells was determined in the Cost Estimating Tool, based on the largest quantity of water supplied over the planning period. Wells were all assumed to be the same type, size, at the same elevation, and to have an efficiency of 80%. The well field layout was determined by two wells per “node”, a 0.5 mile transmission line between each well and its node, and an additional 0.5 mile “trunk” line connecting to the next node. No new distribution piping was assumed.
Additional capital costs including engineering, legal services, contingencies, environmental and archeology studies and mitigation, land acquisition and surveying, and interest during construction were estimated using the Cost Estimating Tool. Annual costs including debt service, operation and maintenance, and pumping energy costs were also estimated using the tool.
2016 LCRWPG WATER PLAN 5-81
Lower Colorado Regional Water Planning Group November 2015
Table 5-61: Sparta Aquifer Expansion Costs
WUG Name County River Basin Total
Construction Cost
Total Capital
Cost
Largest Annual
Cost
Unit Cost
($/ac-ft) Mining Fayette Guadalupe $512,000 $753,000 $68,000 $1,030.00 Environmental Impact Water from this strategy is within the identified available groundwater from the aquifer. The impact on the environment from construction of wells and pipelines is expected to be low, with most of the impact occurring during the construction process itself. The water supply is within the Modeled Available Groundwater (MAG), so drawdown in the aquifer could be up to 60 feet. It is assumed that using water within the stated available yield should result in negligible impacts to springflows, but aquifer levels and springflows should be monitored.
Refer to Chapter 1, Appendix 1A, for the complete list by County of threatened and endangered species in the Lower Colorado Regional Water Planning Area. These species may need to be considered during construction of infrastructure.
Agricultural and Natural Resources Considerations
Sparta water is used extensively for agricultural purposes in Fayette County. The increase in demand for mining is small in comparison to amounts already produced for irrigation, and should have a negligible impact on agriculture.
5.2.4.1.8. Trinity Aquifer
This alternative would involve pumping additional groundwater, either using their existing wells or drilling additional wells. The WUGs were assumed to pump this additional water from their current supply. Table 5-62 presents the WUGs that would utilize this strategy along with the implementation decade and the amount of water to be pumped. Additional groundwater was only allocated to meet each WUGs individual shortage.
2016 LCRWPG WATER PLAN 5-82
Lower Colorado Regional Water Planning Group November 2015
Table 5-62: Trinity Aquifer Expansions
WUG Name County River Basin Water Management Strategies (ac-ft/yr)
Travis County Total for Colorado River Basin 500 1,100 1,100 2,100 2,100 2,100
This strategy was applied to Mining in Hays County; Irrigation in Mills County; and Lakeway, Manor, and Manville WSC in Travis County.
Cost Implications of Proposed Strategy
Table 5-63 presents a summary of the probable costs for each WUG utilizing this strategy. The four cost components analyzed during cost estimation of this strategy were: Total Construction Cost, Total Capital Cost, Annual Cost, and Unit Cost. The costs of the groundwater supply strategies were estimated using the Texas Water Development Board (TWDB) Cost Estimating Tool. For all these strategies, it was assumed that a new well field and transmission piping (interconnecting well piping) was provided.
A peaking factor of 2 was assumed (twice the largest quantity of water supplied). The number of new wells was determined in the Cost Estimating Tool, based on the largest quantity of water supplied over the planning period. Wells were all assumed to be the same type, size, at the same elevation, and to have an efficiency of 80%. The well field layout was determined by two wells per “node”, a 0.5 mile transmission line between each well and its node, and an additional 0.5 mile “trunk” line connecting to the next node. No new distribution piping was assumed.
Additional capital costs including engineering, legal services, contingencies, environmental and archeology studies and mitigation, land acquisition and surveying, and interest during construction were estimated using the Cost Estimating Tool. Annual costs including debt service, operation and maintenance, and pumping energy costs were also estimated using the tool.
2016 LCRWPG WATER PLAN 5-83
Lower Colorado Regional Water Planning Group November 2015
The Trinity aquifer was modeled to allow the use of water from the aquifer until the simulated drought of record springflow with no pumpage from the aquifer was still equal to 90 percent of the observed springflow during the drought of record. In Travis County, water supply within the MAG could cause drawdown of up to 124 feet, depending on the formation. It is assumed that using water within the stated available yield should result in negligible impacts to springflows, but aquifer levels and springflows should be monitored. The impacts of construction of wells and pipelines, if properly managed, are expected to produce negligible impacts to the environment, and primarily during the construction period itself.
Refer to Chapter 1, Appendix 1A, for the complete list by County of threatened and endangered species in the Lower Colorado Regional Water Planning Area. These species may need to be considered during construction of infrastructure.
Agricultural and Natural Resources Considerations This strategy provides small amounts of water for irrigation in Mills County, which will have a positive impact on agriculture. Increased drawdown from the municipal demands to be served from the aquifer will likely have a negligible impact on agriculture.
5.2.4.2 Development of New Groundwater Supplies
This group of strategies includes those WUGs that are obtaining groundwater from new groundwater sources which they have not tapped previously.
5.2.4.2.1. Carrizo-Wilcox Aquifer
This strategy would involve developing a new well field to pump water from the Carrizo-Wilcox aquifer in the Colorado and Guadalupe river basins. A new well field will consist of acquisition of a site, new wells, 5 miles of transmission line, one-half mile segments of line between wells and nodes, and will assume that the WUG has the available storage capacity to store this additional water. Table 5-64 presents the WUGs that would utilize this strategy along with the implementation decade and the amount of water needed. Additional groundwater was only allocated as available under the MAG.
2016 LCRWPG WATER PLAN 5-84
Lower Colorado Regional Water Planning Group November 2015
Table 5-64: Carrizo-Wilcox Aquifer Development
WUG Name County River Basin Water Management Strategies (ac-ft/yr)
2020 2030 2040 2050 2060 2070
Bastrop Bastrop Colorado 300 300 300 300 300 0
Mining Bastrop Guadalupe 0 0 466 466 466 466
This strategy was applied to the City of Bastrop and the Mining WUG in Bastrop County.
Cost Implications of Proposed Strategy
Table 5-65 presents a summary of the probable costs for each WUG utilizing this strategy. The four cost components analyzed during cost estimation of this strategy were: Total Construction Cost, Total Capital Cost, Annual Cost, and Unit Cost. The costs of the groundwater supply strategies were estimated using the Texas Water Development Board (TWDB) Cost Estimating Tool. For all these strategies, it was assumed that a new well field and transmission piping (including interconnecting well piping) was provided.
A peaking factor of two (2) was assumed (twice the largest quantity of water supplied). The number of new wells was determined in the Cost Estimating Tool, based on the largest quantity of water supplied over the planning period. Wells were all assumed to be the same type, size, at the same elevation, and to have an efficiency of 80%. The well field layout was determined by two wells per “node”, a 0.5 mile transmission line between each well and its node, and an additional 0.5 mile “trunk” line connecting to the next node.
A 5-mile transmission pipeline (with no pump station) was assumed. The transmission line was assumed to be one pipe, five miles long, with a diameter based on a velocity of 5 ft/s at peak flow.
Additional capital costs including engineering, legal services, contingencies, environmental and archeology studies and mitigation, land acquisition and surveying, and interest during construction were estimated using the Cost Estimating Tool. Annual costs including debt service, operation and maintenance, and pumping energy costs were also estimated using the tool.
Table 5-65: Carrizo-Wilcox Aquifer Development Costs
Lower Colorado Regional Water Planning Group November 2015
Environmental Considerations
The impacts to the environment from the additional yield being sought from the Carrizo-Wilcox aquifer area expected to be low. Impacts from construction of wells and pipelines should be limited primarily to the construction period as long as care is taken to avoid environmentally sensitive areas and provide proper restoration to the surface when complete. The water supply is within the Modeled Available Groundwater (MAG), so drawdown in the aquifer could be up to 237 feet. It is assumed that using water within the stated available yield should result in negligible impacts to springflows, but aquifer levels and springflows should be monitored.
Refer to Chapter 1, Appendix 1A, for the complete list by County of threatened and endangered species in the Lower Colorado Regional Water Planning Area. These species may need to be considered during construction of infrastructure.
Agricultural and Natural Resources Considerations
There are currently no irrigation WUGs with supplies of irrigation water or livestock water from the Carrizo-Wilcox Aquifer in Region K. This is not a source of choice, probably because of the depth of the aquifer. In addition, the terrain in Bastrop County is often not conducive to irrigated agriculture. Therefore, the impact on agriculture should be negligible.
5.2.4.2.2. Gulf Coast Aquifer
This alternative would involve developing a new well field to pump water from the Gulf Coast aquifer. A new well field will consist of acquisition of a site, new wells, 5 miles of transmission line, one-half mile segments of line between wells and nodes, and will assume that the WUG has the available storage capacity to store this additional water. Table 5-66 presents the WUGs that would utilize this strategy along with the implementation decade and the amount of water needed. Additional groundwater was only allocated to meet each WUG’s individual shortage.
Table 5-66: Gulf Coast Aquifer Development
WUG Name County River Basin Water Management Strategies (ac-ft/yr)
This strategy was applied to the Steam-Electric WUG in Wharton County.
Cost Implications of Proposed Strategy
Table 5-67 presents a summary of the probable costs for the WUG utilizing this strategy. The four cost components analyzed during cost estimation of this strategy were: Total Construction Cost, Total Capital Cost, Annual Cost, and Unit Cost.
2016 LCRWPG WATER PLAN 5-86
Lower Colorado Regional Water Planning Group November 2015
The costs of the groundwater supply strategies were estimated using the Texas Water Development Board (TWDB) Cost Estimating Tool. For all these strategies, it was assumed that a new well field and transmission piping (interconnecting well piping) was provided.
A peaking factor of two (2) was assumed (twice the largest quantity of water supplied). The number of new wells was determined in the Cost Estimating Tool, based on the largest quantity of water supplied over the planning period. Wells were all assumed to be the same type, size, at the same elevation, and to have an efficiency of 80%. The well field layout was determined by two wells per “node”, a 0.5 mile transmission line between each well and its node, and an additional 0.5 mile “trunk” line connecting to the next node.
A 5-mile transmission pipeline (with no pump station) was assumed. The transmission line was assumed to be one pipe, five miles long, with a diameter based on a velocity of 5 ft/s at peak flow.
Additional capital costs including engineering, legal services, contingencies, environmental and archeology studies and mitigation, land acquisition and surveying, and interest during construction were estimated using the Cost Estimating Tool. Annual costs including debt service, operation and maintenance, and pumping energy costs were also estimated using the tool.
The impacts to the environment from the additional yield being sought from the Gulf Coast aquifer area expected to be negligible. Impacts from construction of wells and pipelines should be limited primarily to the construction period as long as care is taken to avoid environmentally sensitive areas and provide proper restoration to the surface when complete.
Refer to Chapter 1, Appendix 1A, for the complete list by County of threatened and endangered species in the Lower Colorado Regional Water Planning Area. These species may need to be considered during construction of infrastructure.
Agricultural and Natural Resources Considerations
Negligible impacts to agriculture are expected as a result of implementing this strategy.
5.2.4.2.3. Hickory Aquifer
This strategy would involve developing a new well field to pump water from the Hickory aquifer. A new well field will consist of acquisition of a site, new wells, 5 miles of transmission line, one-half mile segments of line between wells and nodes, and will assume that the WUG has the available storage
2016 LCRWPG WATER PLAN 5-87
Lower Colorado Regional Water Planning Group November 2015
capacity to store this additional water. Table 5-68 presents the WUG that would utilize this strategy along with the implementation decade and the amount of water needed. Table 5-68: Hickory Aquifer Development
WUG Name County River Basin Water Management Strategies (ac-ft/yr)
Table 5-69 presents a summary of the probable costs for each WUG utilizing this strategy. The four cost components analyzed during cost estimation of this strategy were: Total Construction Cost, Total Capital Cost, Annual Cost, and Unit Cost.
The costs of the groundwater supply strategies were estimated using the Texas Water Development Board (TWDB) Cost Estimating Tool. For all these strategies, it was assumed that a new well field and transmission piping (interconnecting well piping) was provided.
A peaking factor of two (2) was assumed (twice the largest quantity of water supplied). The number of new wells was determined in the Cost Estimating Tool, based on the largest quantity of water supplied over the planning period. Wells were all assumed to be the same type, size, at the same elevation, and to have an efficiency of 80%. The well field layout was determined by two wells per “node”, a 0.5 mile transmission line between each well and its node, and an additional 0.5 mile “trunk” line connecting to the next node.
A 5-mile transmission pipeline (with no pump station) was assumed. The transmission line was assumed to be one pipe, five miles long, with a diameter based on a velocity of 5 ft/s at peak flow.
Additional capital costs including engineering, legal services, contingencies, environmental and archeology studies and mitigation, land acquisition and surveying, and interest during construction were estimated using the Cost Estimating Tool. Annual costs including debt service, operation and maintenance, and pumping energy costs were also estimated using the tool.
Table 5-69: Hickory Aquifer Development Costs
WUG Name County River Basin Total
Construction Cost
Total Capital
Cost
Largest Annual
Cost
Unit Cost
($/ac-ft) Llano Llano Colorado $1,848,000.00 $2,743,000 $254,000 $1,270.00 Environmental Considerations The additional pumping from the Hickory aquifer is within the available yield of the aquifer for all decades. The construction of well sites and pipelines is anticipated to have a low environmental impact primarily during the construction period, if proper precautions are taken to avoid environmentally
2016 LCRWPG WATER PLAN 5-88
Lower Colorado Regional Water Planning Group November 2015
sensitive areas. The water supply is within the Modeled Available Groundwater (MAG), so drawdown in the aquifer could be up to 7 feet. It is assumed that using water within the stated available yield should result in negligible impacts to springflows, but aquifer levels and springflows should be monitored.
Refer to Chapter 1, Appendix 1A, for the complete list by County of threatened and endangered species in the Lower Colorado Regional Water Planning Area. These species may need to be considered during construction of infrastructure.
Agricultural and Natural Resources Considerations The location of this proposed strategy currently has no irrigation wells, so no impact to agriculture is expected. 5.2.4.2.4. Queen City Aquifer
This strategy would involve developing a new well field to pump water from the Queen City aquifer. A new well field will consist of acquisition of a site, new wells, 5 miles of transmission line, one-half mile segments of line between wells and nodes, and will assume that the WUG has the available storage capacity to store this additional water. Table 5-70 presents the WUGs that would utilize this strategy along with the implementation decade and the amount of water needed.
Table 5-70: Queen City Aquifer Development
WUG Name County River Basin Water Management Strategies (ac-ft/yr)
Table 5-71 presents a summary of the probable costs for the WUG utilizing this strategy. The four cost components analyzed during cost estimation of this strategy were: Total Construction Cost, Total Capital Cost, Annual Cost, and Unit Cost.
The costs of the groundwater supply strategies were estimated using the Texas Water Development Board (TWDB) Cost Estimating Tool. For all these strategies, it was assumed that a new well field and transmission piping (interconnecting well piping) was provided.
A peaking factor of two (2) was assumed (twice the largest quantity of water supplied). The number of new wells was determined in the Cost Estimating Tool, based on the largest quantity of water supplied over the planning period. Wells were all assumed to be the same type, size, at the same elevation, and to have an efficiency of 80%. The well field layout was determined by two wells per “node”, a 0.5 mile transmission line between each well and its node, and an additional 0.5 mile “trunk” line connecting to the next node.
2016 LCRWPG WATER PLAN 5-89
Lower Colorado Regional Water Planning Group November 2015
A 5-mile transmission pipeline (with no pump station) was assumed. The transmission line was assumed to be one pipe, five miles long, with a diameter based on a velocity of 5 ft/s at peak flow.
Additional capital costs including engineering, legal services, contingencies, environmental and archeology studies and mitigation, land acquisition and surveying, and interest during construction were estimated using the Cost Estimating Tool. Annual costs including debt service, operation and maintenance, and pumping energy costs were also estimated using the tool.
Smithville Bastrop Colorado $1,776,000 $2,620,000 $241,000 $1,607.00 Environmental Considerations The additional pumping from the Queen City aquifer is within the available yield of the aquifer for all decades. The construction of well sites and pipelines is anticipated to have a low environmental impact primarily during the construction period, if proper precautions are taken to avoid environmentally sensitive areas. The water supply is within the Modeled Available Groundwater (MAG), so drawdown in the aquifer could be up to 13 feet. It is assumed that using water within the stated available yield should result in negligible impacts to springflows, but aquifer levels and springflows should be monitored.
Refer to Chapter 1, Appendix 1A, for the complete list by County of threatened and endangered species in the Lower Colorado Regional Water Planning Area. These species may need to be considered during construction of infrastructure.
Agricultural and Natural Resources Considerations Negligible impacts to agriculture are expected as a result of implementing this strategy.
5.2.4.2.5. Trinity Aquifer
This strategy would involve developing a new well field to pump water from the Trinity aquifer. A new well field will consist of acquisition of a site, new wells, 5 miles of transmission line, one-half mile segments of line between wells and nodes, and will assume that the WUG has the available storage capacity to store this additional water. Table 5-72 presents the WUGs that would utilize this strategy along with the implementation decade and the amount of water needed.
Table 5-72: Trinity Aquifer Development
WUG Name County River Basin
Water Management Strategies (ac-ft/yr)
2020 2030 2040 2050 2060 2070
Sunset Valley Travis Colorado 0 0 200 200 200 200
2016 LCRWPG WATER PLAN 5-90
Lower Colorado Regional Water Planning Group November 2015
Cost Implications of Proposed Strategy
Table 5-73 presents a summary of the probable costs for the WUG utilizing this strategy. The four cost components analyzed during cost estimation of this strategy were: Total Construction Cost, Total Capital Cost, Annual Cost, and Unit Cost.
The costs of the groundwater supply strategies were estimated using the Texas Water Development Board (TWDB) Cost Estimating Tool. For all these strategies, it was assumed that a new well field and transmission piping (interconnecting well piping) was provided.
A peaking factor of two (2) was assumed (twice the largest quantity of water supplied). The number of new wells was determined in the Cost Estimating Tool, based on the largest quantity of water supplied over the planning period. Wells were all assumed to be the same type, size, at the same elevation, and to have an efficiency of 80%. The well field layout was determined by two wells per “node”, a 0.5 mile transmission line between each well and its node, and an additional 0.5 mile “trunk” line connecting to the next node.
A 5-mile transmission pipeline (with no pump station) was assumed. The transmission line was assumed to be one pipe, five miles long, with a diameter based on a velocity of 5 ft/s at peak flow.
Additional capital costs including engineering, legal services, contingencies, environmental and archeology studies and mitigation, land acquisition and surveying, and interest during construction were estimated using the Cost Estimating Tool. Annual costs including debt service, operation and maintenance, and pumping energy costs were also estimated using the tool.
Table 5-73: Trinity Aquifer Development Costs
WUG Name County River Basin
Total Construction
Cost
Total Capital
Cost
Largest Annual
Cost
Unit Cost
($/ac-ft)
Sunset Valley Travis Colorado $1,464,000 $2,228,000 $207,000 $1,035.00
Environmental Considerations As noted during the section on expansion of groundwater, this aquifer was modeled to maintain 90 percent of springflow with no pumping during the critical period of the drought of record. If that level is sufficiently protective of local species, then environmental impacts are expected to be low. Impacts from construction of well sites and pipelines are also expected to be negligible, and confined primarily to the construction period. In Travis County, water supply within the MAG could cause drawdown of up to 124 feet, depending on the formation. It is assumed that using water within the stated available yield should result in negligible impacts to springflows, but aquifer levels and springflows should be monitored.
Refer to Chapter 1, Appendix 1A, for the complete list by County of threatened and endangered species in the Lower Colorado Regional Water Planning Area. These species may need to be considered during construction of infrastructure.
2016 LCRWPG WATER PLAN 5-91
Lower Colorado Regional Water Planning Group November 2015
Agricultural and Natural Resources Considerations This area of the aquifer has limited agricultural activity associated with it. As such, impacts to agriculture should be negligible.
5.2.4.3 Groundwater Importation
The strategies discussed in this section bring groundwater into Region K from outside of the region. These strategies have been requested for inclusion in both the Region K Plan and the South Central Texas (Region L) Plan. Coordination with Region L has occurred on the strategies in this section. 5.2.4.3.1. Hays County Pipeline
This strategy encompasses two regions, Region K and Region L. It involves bringing water from a delivery point near the Kyle area to Western Hays County. It is not itself a source of supply, but rather provides the infrastructure required to import potential water supplies from multiple areas around Central Texas. The Region L portion of this strategy includes a pipeline capable of conveying up to 15,000 acre-feet per year from multiple potential sources to Wimberley. The Region K portion of this strategy would upsize this pipeline to allow conveyance of an additional 4,000 acre-feet per year, or 19,000 acre-feet/year total. It would also add an additional pipeline capable of conveying the 4,000 acre-feet per year from a point to be determined between Kyle and Wimberley to Dripping Springs. This strategy for Region K assumes the 4,000 acre-feet/year of water is from the Carrizo-Wilcox aquifer in Gonzales County. The table below shows the projected use for only the Region K water user groups. Table 5-74: Hays County Pipeline Water Supplies
WUG Name County River Basin
Importing From Water Management Strategies (ac-ft/yr)
Region County Aquifer 2020 2030 2040 2050 2060 2070 County-Other Hays Colorado L Gonzales Carrizo-
West Travis County PUA Hays Colorado L Gonzales Carrizo-
Wilcox 0 1,000 1,000 1,000 1,000 1,000
Cost Implications of Proposed Strategy
The table below shows the estimated costs for this strategy. Only the additional costs required for the Region K portion of the strategy are shown. The Region L costs are shown in the separate 2016 South Central Texas Regional Water Plan.
2016 LCRWPG WATER PLAN 5-92
Lower Colorado Regional Water Planning Group November 2015
Table 5-75: Hays County Pipeline Costs for Region K
West Travis County PUA Hays Colorado $4,079,750 $5,869,750 $708,000 $708.00
Environmental and Other Considerations
The environmental impacts of the construction should be able to be minimized, as long as care is taken to avoid environmentally sensitive areas and provide proper restoration to the surface when complete. There are local groups who have voiced concerns with this proposed strategy, so communication with the public may be key in the development of this project. Water supply is within the MAG. It is assumed that using water within the stated available yield should result in negligible impacts to springflows, but aquifer levels and springflows should be monitored.
Refer to the 2016 South Central Texas Regional Water Plan, Region L, for any impacts associated with the Region L portion of the strategy.
Refer to Chapter 1, Appendix 1A, for the complete list by County of threatened and endangered species in the Lower Colorado Regional Water Planning Area. These species may need to be considered during construction of infrastructure. Agricultural & Natural Resources Considerations
Negligible impacts are anticipated on agriculture and natural resources. Refer to the 2016 South Central Texas Regional Water Plan for any impacts associated with the Region L portion of the strategy.
5.2.4.3.2. HCPUA Pipeline
This strategy involves the withdrawal and transport of groundwater from the Carrizo-Wilcox aquifer in Gonzales County to the I-35 Corridor area near San Marcos, Kyle and Buda. This is primarily a Region L strategy, but a large portion of Buda is within Region K. The infrastructure required to implement this strategy includes:
New well fields in Caldwell and Gonzales Counties.
New treatment facilities near the new well fields.
New pump stations and pipelines to convey the water to a delivery point near the Hays-Caldwell county line, approximately 5 miles northeast of San Marcos.
The following table below lists the projected water use of this strategy.
2016 LCRWPG WATER PLAN 5-93
Lower Colorado Regional Water Planning Group November 2015
Table 5-76: HCPUA Pipeline Water Supplies for Region K
WUG Name County River Basin
Importing From Water Management Strategies (ac-ft/yr)
Region County Aquifer 2020 2030 2040 2050 2060 2070
Detailed information on this strategy, including Region L water user groups and yields, are included in the 2016 South Central Texas Regional Water Plan.
Cost Implications of Proposed Strategy
The following table below describes the estimated costs for this strategy. The costs identified are Buda’s portion of the overall project cost.
More detailed cost information for this strategy is included in the 2016 South Central Texas Regional Water Plan.
Environmental Considerations
Water supply is within the MAG. It is assumed that using water within the stated available yield should result in negligible impacts to springflows, but aquifer levels and springflows should be monitored. There are also several rare species that are located in the vicinity of the project. Of these, the only one that is protected by USFWS or TPWD is the Cagle’s map turtle.
Refer to Chapter 1, Appendix 1A, for the complete list by County of threatened and endangered species in the Lower Colorado Regional Water Planning Area. These species may need to be considered during construction of infrastructure.
Agricultural & Natural Resources Considerations
Negligible impacts are anticipated on agriculture and natural resources.
5.2.4.4 Aquifer Storage and Recovery
5.2.4.4.1. BS/EACD –Edwards/Middle Trinity ASR
The basic definition of aquifer storage and recovery (ASR) is the storage of water in a suitable aquifer during times of excess water supply, and the recovery of the water from the same aquifer during times of
2016 LCRWPG WATER PLAN 5-94
Lower Colorado Regional Water Planning Group November 2015
greater water demand. Water is injected and removed from the aquifer through wells. ASR has the benefit of underground storage, so there is no evaporation, and dedicated storage tanks or reservoirs do not have to be built. There are also fewer environmental issues compared to surface storage because it does not change the surface of the land. This type of strategy is currently being used by cities in Texas including San Antonio, Kerrville and El Paso.
One of the key challenges of this strategy is that it requires an aquifer with suitable storage characteristics, which is not currently being utilized by another entity. Preferably, the aquifer should be located close to the water source for injection into the aquifer and close to the distribution system once removed from the aquifer.
The proposed aquifer for this strategy by the Barton Springs/Edwards Aquifer Conservation District (BS/EACD) is the Middle Trinity aquifer. This aquifer overlaps with the Edwards aquifer and is located deeper.
The proposed source of water for this strategy is the Edwards (Balcones Fault Zone, or BFZ) aquifer. Water would be drawn only during non-drought years.
The potential users identified to date for this water include the City of Buda, small rural users in Hays County, mining industrial use in Hays County, and residential users in Sunset Valley and Mountain City.
The infrastructure required to implement this strategy includes:
New extraction wells, to extract the water from the Edwards aquifer.
New treatment facilities to treat the water to standards suitable for injection into the Middle Trinity aquifer. A minimal level of treatment is assumed, as the extracted groundwater should be relatively clean.
New injection wells, to inject the water into the Middle Trinity aquifer. Since the Middle Trinity aquifer overlaps with the Edwards aquifer, it is assumed that the wells extracting from Edwards and the wells injecting into Middle Trinity can be located in close proximity. Thus, no intermediate pump stations or pipelines are assumed.
New extraction wells, to extract the water from Middle Trinity for use.
New transmission pump stations and pipelines to convey the water to the points of use. It is assumed that 1 mile of pipeline is sufficient to convey the water into the existing distribution system, for the various water users. Costs would be higher or lower, depending on actual distance.
Other requirements for this strategy include an extensive aquifer study for the identified aquifer to determine feasibility and implementation requirements. The land required for the aquifer storage and recovery wells would also have to be purchased.
The yield from this strategy is projected to be 1,144 acre-feet/year. This includes 600 acre-feet per year for the City of Buda, 200 for Hays County rural users, 100 for mining, 200 for Sunset Valley, and 44 for
2016 LCRWPG WATER PLAN 5-95
Lower Colorado Regional Water Planning Group November 2015
Mountain City (Region L). The water use for each is projected to start in the 2030 planning decade. The table below shows the yields by decade for this strategy.
Table 5-78: Edwards / Middle Trinity ASR Project Yields
WUG Name County River Basin
Water Management Strategies (ac-ft/yr)
2020 2030 2040 2050 2060 2070
Buda Hays Colorado 0 600 600 600 600 600
County-Other Hays Colorado 0 200 200 200 200 200
Mining Hays Colorado 0 100 100 100 100 100
Mountain City Hays (L) Guadalupe 0 44 44 44 44 44
Sunset Valley Travis Colorado 0 200 200 200 200 200
Cost Implications of Proposed Strategy Costs for this strategy were developed based on background information provided by BS/EACD, and the Texas Water Development Board (TWDB) Cost Estimating Tool. Consistent with the tool, all costs are given in September 2013 dollars.
The table below shows the estimated costs for this strategy.
Sunset Valley Travis Colorado $1,613,636 $2,272,727 $244,755 $1,291.00
2016 LCRWPG WATER PLAN 5-96
Lower Colorado Regional Water Planning Group November 2015
Environmental Considerations While environmental considerations for underground storage are less than that for surface storage, extensive permitting will still be required to ensure the facility complies with all environmental considerations. This includes an aquifer study to determine the impact of the strategy on the proposed storage aquifer. During average rainfall, the strategy may decrease springflow by removing up to an additional 1,140 ac-ft/yr for storage. There should be negligible impacts during drought periods.
Refer to Chapter 1, Appendix 1A, for the complete list by County of threatened and endangered species in the Lower Colorado Regional Water Planning Area. These species may need to be considered during construction of infrastructure.
Agricultural & Natural Resources Considerations Negligible impacts to agriculture or natural resources are expected as a result of implementing this strategy. It is possible that agricultural users will benefit from increased water availability during times of drought, but this depends on whether there will be any agricultural users of this water source.
5.2.4.4.2. BS/EACD – Saline Edwards ASR
The basic definition of aquifer storage and recovery (ASR) is the storage of water in a suitable aquifer during times of excess water supply, and the recovery of the water from the same aquifer during times of greater water demand. Water is injected and removed from the aquifer through wells. ASR has the benefit of underground storage, so there is no evaporation, and dedicated storage tanks or reservoirs do not have to be built. There are also fewer environmental issues compared to surface storage because it does not change the surface of the land. This type of strategy is currently being used by cities in Texas including San Antonio, Kerrville and El Paso.
One of the key challenges of this strategy is that it requires an aquifer with suitable storage characteristics, which is not currently being utilized by another entity. Preferably, the aquifer should be located close to the water source for injection into the aquifer and close to the distribution system once removed from the aquifer.
The proposed aquifer for this strategy by the Barton Springs/Edwards Aquifer Conservation District (BS/EACD) is the saline portion of the Edwards (BFZ) aquifer. This portion of the aquifer is more suited for storage, as it has lower transmission rates and much higher residence times than the freshwater portion. This is a benefit for storage; however, it also results in the water staying in contact with limestone longer, dissolving mineral solids and increasing in salinity. Depending on the length of storage time, when extracted, the water may need to be treated through desalination.
There are multiple potential sources for the water for this strategy, including freshwater Edwards aquifer wells, desalinated water, or municipal supply. Depending on the water source, the water may have to be treated prior to injection as well. For the purposes of this report, the water source is assumed to be groundwater from the freshwater Edwards aquifer. Since the stored water may need to be desalinated, to increase the yield of the project, it is assumed that additional wells would pump water directly from the Saline Zone. Blending the saline water with the ASR water would reduce the salinity and decrease treatment costs.
2016 LCRWPG WATER PLAN 5-97
Lower Colorado Regional Water Planning Group November 2015
The potential users identified to date for this water include the City of Buda, small rural users in Hays County, and residential users through the Creedmoor-Maha Water Supply Corporation.
The infrastructure required to implement this strategy includes:
Depending on what is used as the water source, new treatment facilities to treat the water to standards suitable for injection.
New transmission pump stations and pipelines to transport the water from the source to the injection location. The injection and extraction location is assumed to be the Texas Disposal Systems site in Creedmoor, TX. The source is assumed to be in the vicinity of northeast Buda, near the boundary of the freshwater and saline zones of the Edwards aquifer. The pipeline between the source and injection location is assumed to be 5 miles long.
New injection wells, to inject the water into the saline zone of the Edwards aquifer.
New extraction wells, to extract the water from the saline zone for use.
New desalination treatment facilities to treat the water once extracted. It is assumed that the water will be brackish groundwater.
New transmission pump stations and pipelines to convey the water to the points of use. It is assumed that 1 mile of pipeline is sufficient to convey the water into the existing distribution system, for the various water users.
Other requirements for this strategy include an aquifer study for the identified aquifer to determine feasibility and implementation requirements. The land required for the aquifer storage and recovery wells would also have to be purchased.
The yield from this strategy is projected to be 1,000 acre-feet per year. This includes 500 acre-feet per year for the City of Buda, 200 for Hays County rural users, and 300 for the Creedmoor-Maha WSC. The water use for each is projected to start in the 2030 planning decade. Of the total yield of 1,000 acre-feet per year, 301 is projected to come from the freshwater Edwards aquifer and 699 from the saline zone. The table below shows the projected yields by decade for this strategy.
Lower Colorado Regional Water Planning Group November 2015
Cost Implications of Proposed Strategy Costs for this strategy were developed based on background information provided by BS/EACD, and the Texas Water Development Board (TWDB) Cost Estimating Tool. Consistent with the tool, all costs are given in September 2013 dollars.
The table below shows the estimated costs for this strategy.
Environmental Considerations While environmental considerations for underground storage is less than that for surface storage, extensive permitting will still be required to ensure the facility complies with all environmental considerations. This includes an aquifer study to determine the impact of the strategy on the proposed storage aquifer. It also includes consideration of environmental impacts of disposal of the brine generated by the desalination treatment process.
Using up to 700 AFY of water from the Saline Zone may allow the same volume to remain in the freshwater zone during drier times. During average rainfall, may decrease springflow by removing an additional 300 ac-ft/yr for storage. There should be negligible impacts during drought periods.
Refer to Chapter 1, Appendix 1A, for the complete list by County of threatened and endangered species in the Lower Colorado Regional Water Planning Area. These species may need to be considered during construction of infrastructure.
Agricultural & Natural Resources Considerations Negligible impacts to agriculture or natural resources are expected as a result of implementing this strategy. It is possible that agricultural users will benefit from increased water availability during times of drought, but this depends on whether there will be any agricultural users of this water source.
2016 LCRWPG WATER PLAN 5-99
Lower Colorado Regional Water Planning Group November 2015
5.2.4.5 Burnet County Regional Projects
5.2.4.5.1. Buena Vista5
The Buena Vista Regional Project would serve the Cities of Burnet and Bertram and the Cassie and Buena Vista subdivisions as shown below in Figure 5.1. Figure 5.1 Buena Vista Regional Water Project Location
Currently, the City of Burnet gets its water from Inks Lake via a raw water intake (RWI), water treatment plant (WTP), and 18-inch transmission main. The City of Bertram obtains it water from four (4) groundwater wells in the Felps Well field with additional backup supply of groundwater wells pulling from the Trinity aquifer. The Cassie subdivision has a small water system supplied by two wells and supplemented by private wells of homeowners. The Buena Vista Water System has a fixed RWI on Inks Lake and small treatment facilities serving a gravity distribution system. Between these systems water reliability, quality, and pressure requirements within the system are all concerns. Additionally, future demand exceeds current capacity provided by the existing systems. Thus, possible benefits could be achieved by converting to a regional water system as discussed below.
The following table shows the yields for this strategy.
5 Source: Roth, S. (2011). North Option 3: Burnet, Bertram, Buena Vista, and Cassie. In Burnet-Llano County Regional Facility Study (pp. 72-74).
2016 LCRWPG WATER PLAN 5-100
Lower Colorado Regional Water Planning Group November 2015
County-Other Burnet Colorado 500 1,000 1,000 1,000 1,000 1,000 The City of Bertram and a portion of County-Other is located in the Brazos River basin and because the water supplied by the Buena Vista Regional Project is coming from Lake Buchanan in the Colorado River basin, the project will require an interbasin transfer permit (IBT) under Texas Water Code 11.085. However, many provisions of 11.085, including 11.085(k), which requires an analysis of the water needs in the basin of origin and the receiving basin, will not apply to an IBT permit for this project. TWC 11.085(v)(4) stipulates that projects transferring water from one river basin to another, but within a single county, must obtain authorization for the interbasin transfer, but that only TWC 11.085(a) applies. Because City of Bertram and County-Other are in Burnet County, which is also the location of the water supply, the exemption provided by TWC 11.085(v)(4) applies. Proposed Water Supply Infrastructure and Capacity For the proposed Buena Vista Regional Project, the City of Burnet’s existing RWI, WTP, and 18-inch transmission main would remain in place and serve as the core of the regional water system. The RWI, WTP and associated high service pump station (HSPS) firm capacities would all be expanded to 5,130 ac-ft/yr (4.58 MGD) by the year 2015 to meet the added demand of the other entities.
Over time, the RWI, WTP, and HSPS will each be expanded incrementally, reaching an ultimate firm capacity of 9,766 ac-ft/yr (8.72 MGD) in the year 2040. This includes a peaking factor of two on the yields shown in the table above.
In 2015, new transmission mains (8-inch for Buena Vista; 6-inch extension for Cassie) would be extended west and northwest from the WTP to serve the Buena Vista and Cassie Subdivision areas. Additionally, an 18-inch raw water pipeline sized to meet the year 2040 water demands will be installed alongside the existing 16-inch raw water line that runs from the RWI to the WTP. The flow within the existing 18-inch potable water transmission line would also need to be increased, requiring the construction of a 200,000 gallon ground storage tank and booster pump about 3.1 miles east of the existing WTP.
The City of Bertram would maintain the Felps well field with an approximate capacity 1,048 ac-ft/yr (0.94 MGD) but would need to meet future water demands with treated surface water from the City of Burnet system. Current estimates project that the City of Bertram demand will exceed this capacity by 2019. At that time, a new regional transmission main (10-12 inches) that run from the City of Burnet to Bertram would be constructed. Treated surface water from the existing plant could then be delivered to Bertram via excess capacity in the City of Burnet’s existing 18-inch transmission main that runs from the WTP to Burnet and then flow by gravity from Burnet to Bertram via the proposed 10-inch and 12-inch
2016 LCRWPG WATER PLAN 5-101
Lower Colorado Regional Water Planning Group November 2015
regional transmission main, assuming the City of Burnet would be in favor of using its existing Post Mountain tanks to balance the system.
It is estimated that the combined water demand of Burnet and Bertram will exceed the capacity provided via the 18-inch line, booster pump, and storage tank in the year 2034. When this occurs, a new 12-inch transmission main would be constructed along the route of the existing 18-inch transmission main from the WTP to the City of Burnet to supplement its capacity. The new transmission main would be tied into the intermediate storage tank and booster pump station.
Cost Implications of Proposed Strategy
Costs for this strategy were developed using the Texas Water Development Board (TWDB) Cost Estimating Tool. Consistent with the tool, all costs are given in September 2013 dollars.
The table below shows the estimated costs for this strategy.
Note that there is an additional $151 per acre-foot required for water purchase that is not included in the annual and unit costs above. This cost is captured in the additional LCRA contracts section of this report.
Environmental and Agricultural Considerations This project covers several miles. This project could remove up to 5,000 ac-ft/yr of water from the Highland Lakes, with no return flows. Impacts from construction of intakes, treatment plants, and pipelines should be limited primarily to the construction period as long as care is taken to avoid environmentally sensitive areas and provide proper restoration to the surface when complete.
Refer to Chapter 1, Appendix 1A, for the complete list by County of threatened and endangered species in the Lower Colorado Regional Water Planning Area. These species may need to be considered during construction of infrastructure.
Impacts to agriculture should be relatively limited. Up to 5,000 ac-ft/yr would be removed from the Highland Lakes. As firm municipal and industrial demands increase in the future, less interruptible water will be available to meet downstream agriculture demands.
2016 LCRWPG WATER PLAN 5-102
Lower Colorado Regional Water Planning Group November 2015
5.2.4.5.2. East Lake Buchanan6
A portion of the water user group (WUG) defined as County-Other in Burnet County currently receives their water from multiple groundwater sources. This water supply is unreliable and contaminated with radionuclides. To help alleviate concerns of water reliability and quality, Burnet County has proposed the East Lake Buchanan Project, a water supply system for the surrounding region. The project consists of replacing the existing groundwater sources with a new surface water supply. A new raw water intake would pump to a regional water treatment plant located near Bonanza Beach, along the northeast side of Lake Buchanan, as shown below in Figure 5.2. This location was chosen because it is a relatively undeveloped part of the lake’s eastern shore that offers access to an even deeper part of the lake. A proposed high service pump station and transmission mains would deliver water south to Council Creek Village and north to the other participants in this area.
Figure 5.2 East Lake Buchanan Regional Project Location
The following table shows the yield for this strategy. Table 5-84: East Lake Buchanan Project Yield
WUG Name County River Basin
Water Management Strategies (ac-ft/yr)
2020 2030 2040 2050 2060 2070
County-Other Burnet Colorado 935 935 935 935 935 935 Proposed Water Supply Infrastructure and Capacity Based on the LCRA Lake Buchanan bathometry map, the lowest contour near the proposed intake structure location is 950 ft-MSL, which is 33.7 feet below the historical low water surface elevation for
6 Source: Roth, S. (2011). North Option 2A: NE Buchanan Regional Alternative (Intake near Bonanza Beach). In Burnet-Llano County Regional Facility Study (pp. 71-72).
2016 LCRWPG WATER PLAN 5-103
Lower Colorado Regional Water Planning Group November 2015
the lake. The raw water intake and pump station are planned to have a firm capacity of 997 ac-ft/yr (0.89 MGD) in the year 2015. Both will subsequently be expanded to reach a capacity of 1,871 ac-ft/yr (1.67 MGD) by the year 2040 to meet increased demand in the area. This includes a peaking factor of two on the yield shown in the table above. A 10-inch raw water pipeline will be used to transport pumped raw water from the intake to the water treatment plant. This 10-inch line will be sized to meet the demands of 1,871 ac-ft/yr expected for the year 2040. This includes a peaking factor of two on the yield shown in the table above. A high service pump station will be constructed, initially with a capacity of 997 ac-ft/yr, at the water treatment plant to pump finished water from the water treatment plant to the regional transmission main and then to the participating distribution systems. This high service pump station will later be expanded to reach a capacity of 1,871 ac-ft/yr. This includes a peaking factor of two on the yield shown in the table above. A 12-inch regional transmission main will be constructed east along an easement to FM 2341 at the southern edge of Council Creek Village. The 12-inch main will extend to the delivery point to Council Creek Village, where it would be reduced to a 10-inch transmission main extending northwest along FM 2341 to Bonanza Beach, South Silver Creek (I, II and III), and Burnet County MUD No. 2 with a branch to other northeast Lake Buchanan developments. An extension would provide treated water to Paradise Point via a 4-inch underwater crossing of Lake Buchanan. The regional transmission mains would deliver water to each participant’s existing distribution system or into their existing water storage tanks. A 50,000 gallon regional storage tank is also recommended to maintain system pressure and improve pump operating conditions at the high service pump station. Cost Implications of Proposed Strategy
Costs for this strategy were developed using the Texas Water Development Board (TWDB) Cost Estimating Tool. Consistent with the tool, all costs are given in September 2013 dollars.
The table below shows the estimated costs for this strategy.
Table 5-85: East Lake Buchanan Regional Project Costs
Note that there is an additional $151 per acre-foot required for water purchase that is not included in the annual and unit costs above. This cost is captured in the additional LCRA contracts section of this report.
Environmental and Agricultural Considerations This project covers several miles. This project could remove up to 935 ac-ft/yr of water from the Highland Lakes, with no return flows. Impacts from construction of intakes, treatment plants, and
2016 LCRWPG WATER PLAN 5-104
Lower Colorado Regional Water Planning Group November 2015
pipelines should be limited primarily to the construction period as long as care is taken to avoid environmentally sensitive areas and provide proper restoration to the surface when complete.
Refer to Chapter 1, Appendix 1A, for the complete list by County of threatened and endangered species in the Lower Colorado Regional Water Planning Area. These species may need to be considered during construction of infrastructure.
Impacts to agriculture should be relatively limited. Up to 935 ac-ft/yr would be removed from the Highland Lakes. As firm municipal and industrial demands increase in the future, less interruptible water will be available to meet downstream agriculture demands.
5.2.4.5.3. Marble Falls7
The Marble Falls Regional Water System would serve the City of Marble Falls and surrounding areas including the City of Cottonwood Shores, and County-Other entities, including Blanco San Miguel, Capstone Water System, Quail Creek Water System, Windermere Oaks WSC, Ridge Harbor Water System, Spicewood Beach Water System, and Smithwick Mills Water System. This regional system has been proposed to address water reliability issues in several of these communities and to serve future development needs along Highway 281 and Highway 71. The system would also provide interconnects for either permanent or emergency water needs throughout the service area, which is shown in Figure 5.3 below.
Figure 5.3 Marble Falls Regional Project Location
The following table shows the yields for this strategy. 7 Source: Roth, S. (2011). South Option 2: Southeast Burnet County Regional System. In Burnet-Llano County Regional Facility Study (pp. 76-78).
2016 LCRWPG WATER PLAN 5-105
Lower Colorado Regional Water Planning Group November 2015
Marble Falls Burnet Colorado 500 4,000 4,000 4,000 4,000 4,000 Proposed Water Supply Infrastructure and Capacity The Marble Falls Regional Water Supply System would keep the City of Marble Falls’ existing 4,257 ac-ft/yr (3.80 MGD) raw water pump station (RWPS) and water treatment plant (WTP) in service. However, a new raw water intake (RWI) and pump station and WTP would be constructed upstream of Max Starcke Dam. A high service pump station (HSPS) would also be constructed at the WTP to pump finished potable water out into the transmission system. The regional plan also includes the incorporation of existing and addition of new transmission lines to serve the City of Cottonwood Shores and future County-Other Burnet community developments along Highways 71 and 281. Two new storage tanks (one ground, one elevated) and a booster pump station out in the transmission system are also planned.
The new RWI, RWPS, WTP, and HSPS are planned to be built in 2015 and will be expanded incrementally to its ultimate capacity based on the projected demand in 2040. The raw water and transmission pipelines will be installed in 2015, but the capacity will be based on the anticipated flow rates of 2040.
The pump stations and plant would be installed to a firm capacity of 2,352 ac-ft/yr (2.10 MGD) in 2015, and have a planned ultimate firm capacity of 11,155 ac-ft/yr (9.96 MGD) in 2040. The suggested expansions within this strategy will take place between the years 2015 and 2035.
As mentioned previously, the Marble Falls Regional Water System also involves the addition of the several transmission mains. An 18” main would need to be constructed that runs from the proposed WTP located at Max Starcke Dam to a new elevated storage tank (EST) and booster pump station located at Highway 71. At Highway 71, the main transitions into a 16” line that runs to a proposed ground storage tank (GST) at the Blanco/Burnet county line for water to serve Blanco San Miguel. Blanco San Miguel would be responsible for building their own pump station at the GST.
Additionally, a new 10” line would be built starting at the EST and booster pump station at Highway 71 and heading 2.6 miles southeast to Quail Creek and another 2.7 miles to the Spicewood Turnoff. At this point one 6-inch water transmission main would extend to Windermere Oaks WSC and another 6-inch water main extends to Spicewood Beach. Furthermore, a proposed 8” transmission main that extends 3.1 miles from the intersection of Highway C415 and Highway 71 southeast to the City of Cottonwood Shores would need to be built. Finally, a 4” main is needed that originates in Hamilton Creek and extends 5.1 miles northwest to LCRA Smithwick Mills.
2016 LCRWPG WATER PLAN 5-106
Lower Colorado Regional Water Planning Group November 2015
Cost Implications of Proposed Strategy
Costs for this strategy were developed using the Texas Water Development Board (TWDB) Cost Estimating Tool. Consistent with the tool, all costs are given in September 2013 dollars.
The table below shows the estimated costs for this strategy.
Environmental and Agricultural Considerations This project covers several miles. This project could remove up to 5,600 ac-ft/yr of water from the Highland Lakes, with no return flows. Impacts from construction of intakes, treatment plants, and pipelines should be limited primarily to the construction period as long as care is taken to avoid environmentally sensitive areas and provide proper restoration to the surface when complete.
Refer to Chapter 1, Appendix 1A, for the complete list by County of threatened and endangered species in the Lower Colorado Regional Water Planning Area. These species may need to be considered during construction of infrastructure.
Impacts to agriculture should be relatively limited. Up to 5,600 ac-ft/yr would be removed from the Highland Lakes. As firm municipal and industrial demands increase in the future, less interruptible water will be available to meet downstream agriculture demands.
5.2.4.6 Water Purchase
This strategy acknowledges that certain WUGs in the region purchase water from water providers other than the two Wholesale Water Providers in Region K. It is likely that these WUGs will purchase additional water as population and demands increase over time.
Table 5-88 lists the WUGs that will implement this strategy, along with the volume of water needed and the entity supplying the water. The assumption used for this strategy is that the water is sold at retail cost, so there is no additional cost to the WUG. No capital costs are associated with this strategy.
There are no environmental, agricultural, or natural resource impacts associated with this strategy.
2016 LCRWPG WATER PLAN 5-107
Lower Colorado Regional Water Planning Group November 2015
Table 5-88: Water Purchase Strategy Suppliers and Yields
WUG Name County River Basin Supplier
Water Management Strategies (ac-ft/yr)
2020 2030 2040 2050 2060 2070
Dripping Springs Hays Colorado Dripping
Springs WSC 0 31 104 198 307 432
Goforth SUD Hays Colorado GBRA 0 0 0 0 0 46
Goforth SUD Travis Colorado GBRA 0 0 0 0 0 2
Mining Hays Colorado Buda (Reuse) 0 0 500 500 500 500 Bee Cave Village Travis Colorado West Travis
The following is a condensed version of the draft “Brush Control as a Water Management Strategy” prepared by HDR for Region G Planning Group and proposed for inclusion in Region K.
Introduction Brush control is a potential water management strategy that could possibly create additional water supply in Texas. The Texas Brush Control Program, created in 1985 and operated by the Texas State Soil and Water Conservation Board (TSSWCB), served to study and implement brush control programs until September 2011. HB1808 established a new program in 2012, the Water Supply Enhancement Program (WSEP), with the purpose and intent of increasing available surface and ground water supplies through the selective control of brush species detrimental to water conservation.
The TSSWCB collaborates with soil water conservation districts and other local, regional, state, and federal agencies to identify watersheds across the state where it is feasible to implement brush control in order to enhance water supplies. The TSSWCB uses a competitive grant process to rank feasible projects and allocate WSEP grant funds, giving priority to projects that balance the most critical water conservation need of municipal water user groups with the highest projected water yield from brush control.
Brush control for water supply enhancement is addressed differently by the 16 Regional Water Planning Groups (RWPG). It typically is described as, alternatively, brush control, brush management, land stewardship, or range management. Brush control is a possible recommended or alternative Water Management Strategy which may have a quantified yield or a zero yield; the 2012 State Water Plan identifies only 2 regions (Regions F and J) where it is a recommended strategy with a corresponding entry in the TWDB water planning database.
2016 LCRWPG WATER PLAN 5-108
Lower Colorado Regional Water Planning Group November 2015
In prioritizing projects for funding, brush control for water supply enhancement must be viewed favorably by the RWPG where the proposed project is located. “Viewed favorably” is distinguished as a recommended or alternative Water Management Strategy or as a Policy Recommendation. Otherwise, the application is considered not to qualify for funding (State Water Supply Enhancement Plan, TSSWCB, July 2014).
Brush Control Implementation Brush control is a land management practice that converts land that is covered with brush (such as juniper, mesquite, and saltcedar) to grasslands. The impact of these practices can increase water availability through reduced extraction of soil water for transpiration and increased recharge to shallow groundwater and emergent springs. To a lesser extent, there is the potential for increased runoff during rainfall events (Brush Control and Range Management: 2011 Brazos G Regional Water Plan).
Grazing management is very important following any type of upland brush control to allow the desirable forages to exert competition with the brush plants and to maintain good herbaceous groundcover, which hinders establishment of woody plant seedlings. Continued maintenance of brush is necessary to ensure the benefits of this potential strategy.
Target species are those noxious brush species that consume water to a degree that is detrimental to water conservation (i.e., phreatophytes).
Eligible Species:
mesquite (Prosopis spp.)
juniper (Juniperus spp.)
saltcedar (Tamarix spp.)
Other species of interest conditionally eligible:
huisache (Acacia smallii)
Carrizo cane (Arundo donax)
The following methods of brush control are commonly practiced in Texas and have shown to have effective results.
Mechanical Brush Control
A wide variety of mechanical brush control methods are available. The simplest is selective brush control with a hand axe and chain saw. Grubbing and piling is frequently done with a bulldozer. This may be either clear-cut or selective.
Moderate to heavy mesquite or cedar can be grubbed (bulldozer with a 3-foot-wide grubbing attachment) or root plowed for $110 to $185/acre. Two-way chaining can be effective on moderate to heavy cedar, but it often just breaks off mesquite and they re- sprout profusely from the bud zones below ground. Using hydraulic shears mounted on Bobcat loaders can be effective on blueberry juniper (a non-sprouting species) for a cost of $55 to $160/acre. If the shears are used on mesquite or redberry juniper one must spray the stump immediately with a herbicide, which will cost in the range of $0.10 to $0.35 per plant.
2016 LCRWPG WATER PLAN 5-109
Lower Colorado Regional Water Planning Group November 2015
Chemical Brush Control
Several herbicides are approved for brush control and may be applied by aircraft, from booms on tractor-pulled spray rigs, or from hand tanks. Some herbicides are also available in pellet form.
Chemical treatments with Triclopyr (Remedy®) and Clopyralid methyl (Reclaim®) were shown to achieve about 70 percent root kill in studies around the state and in adjacent states. Generally, commercial aerial applications are not as effective, which is most likely due to fewer controls. Other herbicide treatments are available, but many will achieve little root kill. Aerial spraying of brush such as mesquite costs about $28 per acre and does not vary with plant density or canopy cover.
Brush Control by Prescribed Burning
Prescribed burning is defined as the application of fire to a predetermined area. The burn is conducted under prescribed conditions to achieve the desired effects. Prescribed burning allows for the control or suppression of undesirable vegetation to facilitate distribution of grazing and browsing animals, to improve forage production and/or quality, and to improve wildlife habitat.
Prescribed burning is estimated at $17 per acre for the TSSWCB programs. Actual costs will depend on how rocky the soils are and the amount of large brush to remove from the fire guards (i.e., a once-over pass with a maintainer versus clearing heavy brush with a bulldozer, then smoothing up the fire guard). Prescribed burning will only be effective under the right environmental conditions, and with an adequate amount of fine fuel (dead or dormant grasses). For successful burns, a pasture deferment is essential for part or all of the growing season prior to burning, and burned pastures must be rested after the burn. On average, a 12-month deferment is necessary, which may increase costs if a rancher cannot utilize the land for livestock grazing.
Burning rarely affects moderate to heavy stands of mature mesquite. Burning only topkills the smooth-bark of mesquite plants and they re-sprout profusely. For mesquite, fire only gives short-term suppression, and stimulates the development of heavier canopy cover than was present pre-burn. Burning is not usually an applicable tool in moderate to heavy cedar (juniper) because these stands suppress production of an adequate amount of grass for fine fuel. Burning can be excellent for controlling junipers over 4 feet tall, if done correctly. Prescribed burning is often not recommended for initial clearing of heavy brush due to the concern that the fire could become too hot and sterilize the soil. Burning is often used for maintenance of brush removal.
Bio-Control of Brush
Bio-control of salt cedar is a relatively new technique to be used in Texas. This control method has been studied for nearly 20 years and there have been pilot studies in the Lake Meredith watershed and most recently in the Colorado River Basin. Research has shown that the Asian leaf beetle can consume substantial quantities of salt cedar in a relatively short time period, and generally does not consume other plants. Different subspecies of the Asian beetle appear to be sensitive to varying climatic conditions, and there is on-going research on appropriate subspecies for Texas. It is recommended that this control method be integrated with chemical and mechanical removal to best control re-growth. The cost per acre is unknown.
2016 LCRWPG WATER PLAN 5-110
Lower Colorado Regional Water Planning Group November 2015
Supply Attained by Brush Control Although the actual supply benefit resulting from a brush control project is site specific, a recent study of the Pedernales River/Lake Travis watershed projected an annual water yield of approximately 3,400 acre-feet/year. Based on this projection, this yield has been allocated to eight counties west of I-35 in the Region K area. This allocation is listed under County-Other at a value of 425 acre-feet per county, as shown in Table 5-89.
Brush control projects are site specific and costs can vary widely. For this strategy, costs were taken from the Pedernales/Lake Travis Watershed study and applied across the counties. Table 5-90 identifies the capital, project, annual, and unit costs associated with brush control in the region.
2016 LCRWPG WATER PLAN 5-111
Lower Colorado Regional Water Planning Group November 2015
Environmental Considerations Brush control can positively affect the environment depending on the type of control method used, location, and extent of application. However, if brush removal is not planned properly or implemented as part of a comprehensive range management strategy, negative environmental impacts can result.
Mechanical treatment using mechanized equipment to root plow, brush mow, bulldoze or scrape the ground surface could result in moderate to high levels of soil disturbance causing erosion and sedimentation into adjacent streams and water bodies. There would also be a change in vegetation communities toward earlier succession species. Soil disturbance would favor re-establishment of both grasses and forbs (herbaceous) in addition to re-invasion of woody brush and shrub species, prompting the need for re- treatment in future years. Soil disturbance would also have the potential of disturbing cultural or archeological artifacts, if present within 12 inches of the ground surface. The probability of cultural and archeological artifacts being present is higher for sites along water courses and old homesteads and settlements. However, cultural and archeological surveys are not required for private property included in the State Brush Program. Some federal cost sharing programs may require archeological surveys.
The State Brush Program requires all participants to follow recommended practices in the application of herbicides. The two most commonly used herbicides in the State Program are Triclopyr (Remedy®) and Clopyralid methyl (Reclaim®). Both of these chemicals are to be used only on upland areas and are not approved for use in or near water. If improperly applied, aerial or ground spraying could have possible biological impacts to wildlife through direct contact and/or potential pollution of surface water. Remedy® is toxic to aquatic organisms, while the toxicity of Reclaim® to birds, mammals and fish is low. A number of other herbicides are also toxic to aquatic life. There could also be effects to non-target plant species from broadcast applications.
2016 LCRWPG WATER PLAN 5-112
Lower Colorado Regional Water Planning Group November 2015
Prescribed fire could adversely affect other vegetation such as damaging or killing established trees not intended for treatment. In addition, prescribed fire can be difficult to control if applied during the wrong season or during improper weather conditions and could affect air quality regulated under federal and state laws.
Overall implementation of this strategy could increase streamflow in the region by up to 3,400 ac-ft/yr. Overall impacts to agriculture can be considered negligible.
Refer to Chapter 1, Appendix 1A, for the complete list by County of threatened and endangered species in the Lower Colorado Regional Water Planning Area. Implementation Issues The extent of brush control that may be desired by landowners will depend on how they plan to manage their land for wildlife and how the brush control will affect the value of the land for wildlife recreation purposes. In recent years, the value of ranch lands which have sufficient brush cover to support wildlife populations, particularly white-tailed deer, wild turkey, bobwhite and scaled quail, has increased at a faster rate than the value of those lands which are void of brush or woody vegetation. Consequently, many landowners can be expected to support brush control to the extent that it does not exclude wildlife populations.
Other implementation issues for land owner participation include the perceived economic benefit of brush control. If the land is currently not actively managed for ranching or wildlife recreation the owner may choose not to participate. Decreased profitability of sheep, goat and cattle grazing systems will influence the economics of brush control by ranchers, and consequently their willingness to participate. Also, the size of the land tracts can affect the total amount of brush removed and the effectiveness of a program. Watersheds that contain many small tracts are less likely to have the contiguous land owner participation that is needed to realize the water supply benefits associated with brush control.
On specific tracts where brush control would incorporate state or federal funding, regulatory compliance with the Texas Antiquities Code and National Historic Preservation Act may be required that may involve cultural resource surveys and incorporation of preservation measures. The Texas Commission on Environmental Quality has established regulations governing prescribed burning. There may also be local and county regulations associated with burning practices.
Recommendation as a Water Management Strategy Brush control is a recommended water management strategy in the 2016 Region K Regional Water Plan. For purposes of obtaining funding from the TSWWCB, a recommended brush control project is any project located in the Region K Regional Water Planning Area.
5.2.4.8 Drought Management
With the extremely low rainfall that occurred during 2011, severe, and even exceptional, states of drought continued in certain parts of Texas. As 2011 was the base year for developing the water demand projections for this planning cycle, drought management as a water management strategy was looked at more closely by several of the regional water planning groups, including the LCRWPG.
2016 LCRWPG WATER PLAN 5-113
Lower Colorado Regional Water Planning Group November 2015
Drought Management is different from conservation in that conservation tends to look at the long-term, and takes more permanent steps to reduce a community’s GPCD slowly over time. Actions such as replacing old water fixtures with new low-flow fixtures, providing public education to the community about native vegetation that requires less water, and performing audits on waterlines to check for leaks are examples of conservation measures that over time can reduce the amount of water that a community needs. Drought management, on the other hand, attempts to reduce a community’s GPCD by a larger amount over a shorter period of time. Both drought management and conservation can be important and effective in their own ways.
The GPCD numbers used in this plan are an annual average. The actual amount of water used is generally higher in the summer and lower in the winter, mainly due to outdoor watering in the warmer months. By restricting outdoor watering during the warmer months as a way of managing drought, the annual average GPCD for a community can be significantly lowered, depending on the level of restriction and the effort to provide the appropriate information to the public. Tiered water rates, which charge higher $/1000 gallon rates once a customer uses more than a specified amount, have also been found to be effective in reducing water use.
5.2.4.8.1. Municipalities
Some WUGs implemented mandatory water use restrictions during the summer of 2011. The Edwards-BFZ aquifer in Hays County and Travis County that is permitted by the BS/EACD reached Critical Drought Stage, which requires users to reduce water use by 30 percent. The City of Austin restricted outdoor watering to one day per week. Both types of restrictions were effective in reducing water use. The City of Austin showed that municipal WUGs that currently have their demands met (no shortage/need) can still be proactive by implementing drought management during times of reduced rainfall. Many others did not implement mandatory water restrictions until late in 2011 or early 2012. Thus, the water demand projections in the Region K Water Plan generally do not reflect implemented drought management water restrictions inherently. Based upon the restrictions implemented in recent years, it can be anticipated that in the future, during times of reduced rainfall comparable to 2011, water use restrictions would be implemented in a large portion of the region. Triggers associated with these recommended strategies include those referenced in the LCRA Water Management Plan and the individual municipality drought contingency plans. The Palmer Drought Severity Index is another resource that could be used for determining triggers for these strategies.
The methodology applied for the drought management strategy for municipalities is as follows:
Base GPCD (Year 2011) greater than 100 – 15% water demand reduction each decade
Base GPCD (Year 2011) less than 100 – 5% water demand reduction each decade
Defer to a WUG’s Drought Contingency Plan “Severe” trigger goal, when possible.
Consider whether mandatory water use restrictions were in place in 2011.
For this planning cycle, drought management is recommended for most municipal WUGs regardless of need. The LCRWPG encourages municipalities to follow their Drought Contingency Plans, as appropriate. For some of the WUGs that have drought management recommended as a strategy, the percent of water use reduction is as high as 30 percent because that is the amount they have to reduce by
2016 LCRWPG WATER PLAN 5-114
Lower Colorado Regional Water Planning Group November 2015
during a critical drought. Table 5-91 below shows the municipal WUGs that would utilize this strategy along with the implementation decade and the amount of water saved.
Lower Colorado Regional Water Planning Group November 2015
COUNTY
WUG NAME
BASIN
Drought Management Water Savings (ac-ft/yr)
2020 2030 2040 2050 2060 2070
BURNET COUNTY-OTHER COLORADO 351
359
316
333
362
405
BURNET GRANITE SHOALS COLORADO
33
38
43
48
53
57
BURNET HORSESHOE BAY COLORADO
187
262
326
386
440
487
BURNET KINGSLAND WSC COLORADO
2
3
3
3
4
4
BURNET MARBLE FALLS COLORADO 466
674
968
1,122
1,225
1,277
BURNET MEADOWLAKES COLORADO 170
204
233
261
286
308
COLORADO COLUMBUS COLORADO 170
175
178
185
191
197
COLORADO COUNTY-OTHER BRAZOS-COLORADO
23
23
23
24
25
26
COLORADO COUNTY-OTHER COLORADO 150
151
151
155
160
165
COLORADO COUNTY-OTHER LAVACA 48
49
49
50
52
54
COLORADO EAGLE LAKE BRAZOS-COLORADO
24
24
24
25
26
27
COLORADO EAGLE LAKE COLORADO 54
55
55
57
59
60
COLORADO WEIMAR COLORADO 27
28
29
30
30
32
COLORADO WEIMAR LAVACA 56
57
58
60
62
64
FAYETTE AQUA WSC COLORADO 1
1
1
1
1
1
FAYETTE COUNTY-OTHER COLORADO 133
145
153
161
168
173
FAYETTE COUNTY-OTHER GUADALUPE 6
6
6
7
7
8
FAYETTE COUNTY-OTHER LAVACA 47
51
54
57
59
61
FAYETTE FAYETTE WSC COLORADO 96
106
113
119
125
129
FAYETTE FAYETTE WSC GUADALUPE 6
7
7
8
8
8
FAYETTE FAYETTE WSC LAVACA 11
12
13
14
15
15
FAYETTE FLATONIA GUADALUPE 10
11
11
12
12
13
FAYETTE FLATONIA LAVACA 41
45
48
51
53
55
FAYETTE LA GRANGE COLORADO 130
144
153
161
168
174
FAYETTE LEE COUNTY WSC COLORADO
30
33
35
37
38
40
2016 LCRWPG WATER PLAN 5-116
Lower Colorado Regional Water Planning Group November 2015
COUNTY
WUG NAME
BASIN
Drought Management Water Savings (ac-ft/yr)
2020 2030 2040 2050 2060 2070
FAYETTE SCHULENBURG LAVACA 110
123
132
139
146
150
GILLESPIE COUNTY-OTHER COLORADO 263
274
284
299
315
331
GILLESPIE COUNTY-OTHER GUADALUPE 10
10
11
11
12
12
GILLESPIE FREDERICKSBURG COLORADO
472
499
521
551
580
609
HAYS AUSTIN COLORADO 1
13
25
63
152
275
HAYS BUDA COLORADO 177
251
342
456
586
734
HAYS COUNTY-OTHER COLORADO 466
554
693
852
987
1,121
HAYS DRIPPING SPRINGS COLORADO
96
107
122
141
163
188
HAYS DRIPPING SPRINGS WSC COLORADO
107
136
172
218
271
330
HAYS GOFORTH SUD COLORADO 21
33
46
64
84
106
HAYS PLUM CREEK WATER COMPANY
COLORADO 8
13
14
15
16
16
HAYS WEST TRAVIS COUNTY PUBLIC UTILITY AGENCY
COLORADO 819
1,152
1,559
2,069
2,645
3,302
LLANO COUNTY-OTHER COLORADO 31
28
28
28
27
25
LLANO HORSESHOE BAY COLORADO
464
486
484
474
490
507
LLANO KINGSLAND WSC COLORADO
45
51
50
47
52
56
LLANO LLANO COLORADO 129
134
132
128
133
137
LLANO SUNRISE BEACH VILLAGE COLORADO
4
4
4
3
3
3
MATAGORDA BAY CITY BRAZOS-COLORADO
567
578
581
590
598
605
MATAGORDA BAY CITY COLORADO 1
1
1
1
1
1
MATAGORDA COUNTY-OTHER BRAZOS-COLORADO
42
42
42
42
42
43
MATAGORDA COUNTY-OTHER COLORADO 9
9
9
9
9
9
MATAGORDA COUNTY-OTHER COLORADO-LAVACA
30
30
30
30
30
31
2016 LCRWPG WATER PLAN 5-117
Lower Colorado Regional Water Planning Group November 2015
COUNTY
WUG NAME
BASIN
Drought Management Water Savings (ac-ft/yr)
2020 2030 2040 2050 2060 2070
MATAGORDA PALACIOS COLORADO-LAVACA
102
104
104
105
107
108
MILLS COUNTY-OTHER BRAZOS 29
29
28
29
30
31
MILLS COUNTY-OTHER COLORADO 48
48
47
49
51
53
MILLS GOLDTHWAITE COLORADO 53
53
53
55
57
59
SAN SABA COUNTY-OTHER COLORADO 47
48
47
46
47
48
SAN SABA RICHLAND SUD COLORADO 25
26
25
25
25
26
SAN SABA SAN SABA COLORADO 228
236
235
230
235
240
TRAVIS AQUA WSC COLORADO 163
184
204
229
251
272
TRAVIS AUSTIN COLORADO 15,745
18,293
20,997
22,989
24,659
26,641
TRAVIS BARTON CREEK WEST WSC COLORADO
65
64
64
63
63
63
TRAVIS BEE CAVE COLORADO 355
409
459
516
567
614
TRAVIS BRIARCLIFF COLORADO 26
30
33
37
40
44
TRAVIS CEDAR PARK COLORADO 486
516
553
553
552
552
TRAVIS CREEDMOOR-MAHA WSC COLORADO
28
31
34
38
41
45
TRAVIS CREEDMOOR-MAHA WSC GUADALUPE
1
2
2
2
2
2
TRAVIS ELGIN COLORADO 38
53
67
83
98
112
TRAVIS GOFORTH SUD GUADALUPE 2
3
3
3
3
4
TRAVIS JONESTOWN COLORADO 82
86
90
95
99
104
TRAVIS LAGO VISTA COLORADO 374
437
498
566
628
686
TRAVIS LAKEWAY COLORADO 1,395
1,823
1,819
1,816
1,815
1,815
TRAVIS LEANDER COLORADO 170
436
753
813
843
882
TRAVIS LOOP 360 WSC COLORADO 176
183
190
197
204
211
TRAVIS LOST CREEK MUD COLORADO
218
214
211
211
211
211
TRAVIS MANOR COLORADO 171
234
294
362
422
477
2016 LCRWPG WATER PLAN 5-118
Lower Colorado Regional Water Planning Group November 2015
COUNTY
WUG NAME
BASIN
Drought Management Water Savings (ac-ft/yr)
2020 2030 2040 2050 2060 2070
TRAVIS MANVILLE WSC COLORADO 448
541
630
733
825
911
TRAVIS NORTH AUSTIN MUD #1 COLORADO
12
12
12
11
11
11
TRAVIS NORTHTOWN MUD COLORADO
104
120
135
152
167
180
TRAVIS PFLUGERVILLE COLORADO 3,194
4,276
5,311
6,474
7,503
8,463
TRAVIS POINT VENTURE COLORADO 52
66
80
96
109
122
TRAVIS ROLLINGWOOD COLORADO 58
57
56
56
56
57
TRAVIS ROUND ROCK COLORADO 19
21
24
26
29
31
TRAVIS SHADY HOLLOW MUD COLORADO
117
114
111
110
110
110
TRAVIS SUNSET VALLEY COLORADO 116
150
182
218
250
280
TRAVIS THE HILLS COLORADO 217
217
216
216
216
216
TRAVIS TRAVIS COUNTY MUD #4 COLORADO
522
602
677
762
837
907
TRAVIS TRAVIS COUNTY WCID #10 COLORADO
532
607
679
761
835
905
TRAVIS TRAVIS COUNTY WCID #17 COLORADO
1,268
1,508
1,653
1,678
1,722
1,776
TRAVIS TRAVIS COUNTY WCID #18 COLORADO
168
190
211
236
259
280
TRAVIS TRAVIS COUNTY WCID #19 COLORADO
100
99
99
99
99
99
TRAVIS TRAVIS COUNTY WCID #20 COLORADO
118
117
117
117
116
116
TRAVIS VOLENTE COLORADO 4
4
5
6
7
7
TRAVIS WELLS BRANCH MUD COLORADO
82
80
79
78
78
78
TRAVIS WEST LAKE HILLS COLORADO
313
310
308
307
306
306
TRAVIS WEST TRAVIS COUNTY PUBLIC UTILITY AGENCY
COLORADO 473
544
611
688
755
818
TRAVIS WILLIAMSON-TRAVIS COUNTY MUD #1
COLORADO 23
22
22
22
22
22
2016 LCRWPG WATER PLAN 5-119
Lower Colorado Regional Water Planning Group November 2015
COUNTY
WUG NAME
BASIN
Drought Management Water Savings (ac-ft/yr)
2020 2030 2040 2050 2060 2070
WHARTON COUNTY-OTHER BRAZOS-COLORADO
181
185
188
195
202
208
WHARTON COUNTY-OTHER COLORADO 87
89
90
94
97
100
WHARTON COUNTY-OTHER COLORADO-LAVACA
28
29
29
30
31
32
WHARTON COUNTY-OTHER LAVACA 3
3
3
3
3
3
WHARTON EAST BERNARD BRAZOS-COLORADO
57
59
61
63
65
67
WHARTON EL CAMPO COLORADO 1
1
1
1
1
1
WHARTON WHARTON BRAZOS-COLORADO
165
171
175
181
187
192
WHARTON WHARTON COLORADO 85
88
90
93
96
99
WILLIAMSON AUSTIN BRAZOS 770
954
1,184
1,432
1,713
2,021
WILLIAMSON NORTH AUSTIN MUD #1 BRAZOS
116
112
109
107
107
107
WILLIAMSON WELLS BRANCH MUD BRAZOS
6
6
6
6
6
6
TOTAL REGION K 38,852
46,136
53,328
60,085
66,877
74,531
Cost Implications of Proposed Strategy
There are two types of costs associated with drought management. One is the cost associated with this strategy are related mainly to public outreach and enforcement. Depending on the number of customers who need to be informed of the water use restrictions, and the methods chosen to reach the customers, along with the level of enforcement, the annual costs can vary. In some cases, increased water rates and fines can recover the expenses of public outreach. The East Bay Municipal Utility District (EBMUD) in California provided an example for costs by hiring a public outreach consultant with the goal of saving a certain amount of water. The contract was for $1.75 million with a goal of saving 36,000 ac-ft of water. After updating to September 2013 dollars, this works out to a unit cost of $50/ac-ft. (See www.ebmud.com, Meeting Action Summary 06/10/08 #9a for more information.) The second type of cost is that to the water supplier (utility) in reduced water sold, as well as economic impacts to the local area by not having that water. That cost will be determined using the TWDB Socioeconomic Impact Analysis of Unmet Needs, which will be provided to the LCRWPG by the TWDB after the Initially Prepared Plan is submitted.
Lower Colorado Regional Water Planning Group November 2015
Environmental Considerations
In many cases, reducing groundwater use during a drought allows for more springflow to provide water downstream. Reducing surface water use allows more water to remain in the streams, rivers, and lakes. Individual WUG implementation would be expected to have negligible impacts to the environment.
Agricultural and Natural Resources Considerations
No impacts to agriculture are expected.
5.2.4.8.2. Irrigation
Drought management is recommended for several of the Irrigation WUGs as well. Irrigation in Colorado, Matagorda, and Wharton counties has severe shortages throughout the planning period, and drought management may be a necessary strategy to implement. Rice farming is prominent in the lower basin, and generally involves growing both a first and second (ratoon) crop. Drought management would assume that most rice farmers would grow only a first crop, and not a second crop. To calculate water saved, it was determined that the ratoon crop requires a volume of water equal to approximately 25% of the total water demand for rice. It was assumed that 75% of rice growers would implement the strategy (no ratoon crop). The total water demand by decade was multiplied by the % rice in the county, the 75% implementation rate, and the 25% water volume to calculate a water savings for each Irrigation WUG in Colorado, Matagorda, and Wharton counties. The volumes of water saved (ac-ft/yr) are shown below in Table 5-92. Triggers associated with these recommended strategies include those referenced in the LCRA Water Management Plan.
In addition, drought management is recommended for Irrigation in Mills County (Brazos Basin.) There are limited supplies of water in that area of the county, and it is assumed that the growth of agriculture would be reduced based on water available. The Palmer Drought Severity Index is a resource that could be used for determining triggers for these strategies. As demand decreases over the planning period, the need for drought management as a strategy goes away over time. The volumes of water saved (ac-ft/yr) are also shown below in Table 5-92.
Table 5-92: Drought Management for Irrigation WUGs
COUNTY WUG NAME BASIN Drought Management Water Savings (ac-ft/yr)
2020 2030 2040 2050 2060 2070
COLORADO IRRIGATION BRAZOS-COLORADO
8,822
8,584
8,354
8,129
7,910
7,697
COLORADO IRRIGATION COLORADO 5,001
4,866
4,735
4,608
4,484
4,363
COLORADO IRRIGATION LAVACA 15,719
15,296
14,885
14,484
14,095
13,716
MATAGORDA IRRIGATION BRAZOS-COLORADO
16,484
16,034
15,596
15,170
14,756
14,353
MATAGORDA IRRIGATION COLORADO 2,354
2,290
2,227
2,167
2,108
2,050
2016 LCRWPG WATER PLAN 5-121
Lower Colorado Regional Water Planning Group November 2015
COUNTY WUG NAME BASIN Drought Management Water Savings (ac-ft/yr)
2020 2030 2040 2050 2060 2070
MATAGORDA IRRIGATION COLORADO-LAVACA
18,406
17,904
17,415
16,939
16,476
16,026
MILLS IRRIGATION BRAZOS 125
95
65
36
7 0
WHARTON IRRIGATION BRAZOS-COLORADO
15,042
14,637
14,243
13,860
13,487
13,125
WHARTON IRRIGATION COLORADO 8,078
7,861
7,649
7,443
7,243
7,048
WHARTON IRRIGATION COLORADO-LAVACA
4,735
4,608
4,484
4,363
4,246
4,132
TOTAL REGION K 94,766
92,175
89,653
87,199
84,812
82,510
Cost Implications of Proposed Strategy
Costs for drought management for irrigation were determined using the TWDB Socioeconomic Impact Analysis of Unmet Needs from the 2011 Region K Water Plan. The costs from the plan were adjusted to September 2013 dollars, and then applied proportionally to the volume of water savings achieved. Unit costs range from county to county. The unit cost for Irrigation WUGs in Colorado County is $163 per ac-ft; the unit cost for Irrigation WUGs in Matagorda County is $649 per ac-ft; the unit cost for Irrigation WUGs in Mills County is $123 per ac-ft; and the unit cost for Irrigation WUGs in Wharton County is $260 per ac-ft. No capital costs are associated with this strategy.
Environmental Considerations
In many cases, reducing groundwater use during a drought allows for more springflow to provide water downstream. Reducing surface water use generally allows more water to remain in the streams, rivers, and lakes. In the case of irrigation in the lower portion of the basin, second crop return flows can be valuable sources of streamflow during later summer months. This strategy would reduce irrigation return flows by up to 19,100 ac-ft/yr. It would also reduce the acreage of potential feedstock for migratory birds by approximately 48,000.
Agricultural and Natural Resources Considerations
The second rice crop is an important part of the economy in the lower three counties in the region. Not supplying water to meet irrigation needs has negative economic impacts to the entire agriculture economy and rural local economies. Cost impacts are described above.
5.2.5 Municipal Water Management Strategies
The municipal WUGs include cities, water utilities, and County-Other (rural/unincorporated areas of municipal water use aggregated on a county basis).
2016 LCRWPG WATER PLAN 5-122
Lower Colorado Regional Water Planning Group November 2015
Several strategies were identified to meet the municipal shortages including conservation; conservation was the first strategy considered for municipal WUGs with needs. For several municipal WUGs with shortages, the following regional management strategies were selected:
Expansion of Current Groundwater Supplies Development of New Groundwater Supplies Groundwater Importation Aquifer Storage and Recovery Water Purchase Drought Management
These regional strategies are explained in detail in Section 5.2.4 of this report.
In addition to these strategies, several municipal WUGs with shortages purchase water from the LCRA. Amendments to these LCRA contracts or new LCRA contracts are also identified as a strategy to meet shortages. These strategies are explained in Sections 5.2.3.1.4 and 5.2.3.1.5.
In addition to the strategies identified above, additional municipal strategies have been identified to meet specific WUG needs. The following sections provide a description, analysis, and cost breakdown for these municipal strategies.
5.2.5.1 Municipal Conservation
Municipal conservation is covered in the required consolidated Conservation section of Chapter 5. More specifically, it is discussed in Section 5.2.2.3, Municipal Conservation. 5.2.5.2 Volente
Drought-created lake levels have lowered the water table surrounding Lake Travis. The Village of Volente is at risk of being unable to access their current groundwater source. As such, the Village of Volente requested inclusion of a surface water source strategy in the 2016 Regional Water Plan. The surface water source strategy would consist of:
Constructing an intake on Lake Travis (Highland Lakes) to obtain water and provide treatment, storage, and transmission capabilities for the Village of Volente. This particular strategy would require obtaining a contract for surface water with the Lower Colorado River Authority (LCRA), and as a potential new customer, they have been included in Section 5.2.3.1.5 as part of the new LCRA contracts strategy. If the Village of Volente were to seek other options for surface water, such as purchasing treated water, a portion of the infrastructure detailed in this strategy would still be required, and the source of the water would still be the Highland Lakes.
Project yields were based on maximum planning period demands for the Village of Volente, and are estimated to be 142 acre-feet/year from 2020 to 2070, as shown in the following table.
2016 LCRWPG WATER PLAN 5-123
Lower Colorado Regional Water Planning Group November 2015
Table 5-93: Village of Volente Yield Associated with New Surface Water Infrastructure
WUG Name County River Basin
Water Management Strategies (ac-ft/yr)
2020 2030 2040 2050 2060 2070
Volente Travis Colorado 142 142 142 142 142 142 The infrastructure required for this strategy was determined by Gray Engineering in a preliminary design memorandum dated April 17, 2014 prepared for the Village of Volente. In this memorandum, it was determined that there are approximately 500 individual lots. Facility sizing for a potable water system supply was based on current Texas Commission on Environmental Quality (TCEQ) standards for potable water system supply. Based on these requirements, the following infrastructure was proposed.
Raw Water Intake and Pump Station
Approximately five (5) miles of transmission piping and appurtenances
0.1 MGD Average (0.5 MGD Peak) Water Treatment Plant
Booster Pump Station with one (1) Storage Tank
Cost Implications of Proposed Strategy
A construction cost estimate was provided by the Village of Volente from the preliminary design memorandum prepared by Gray Engineering. The cost estimate was in April 2014 dollars. In addition, the cost estimate included costs associated with distribution piping. In order to provide a comparable cost consistent with other strategies in this report, distribution piping was removed from this strategy and costs were developed using the Texas Water Development Board (TWDB) Cost Estimating Tool in September 2013 dollars. The Cost Estimating Tool was also used to determine operating costs. The capital cost for this strategy is primarily driven by the cost of a water treatment facility and the transmission system piping. The LCRA water rate for municipal and industrial customers in September 2013 was $151 per acre-foot. The following table shows the estimated costs associated with this strategy.
Table 5-94: Village of Volente Infrastructure Costs Needed for a Surface Water Contract
Total Construction
Cost
Total Capital Cost
Largest Annual Cost
Unit Cost ($/ac-ft)
$5,812,000 $8,263,000 $1,064,000 $7,493.00
2016 LCRWPG WATER PLAN 5-124
Lower Colorado Regional Water Planning Group November 2015
Environmental Considerations Water within Lake Travis is managed by the LCRA and the LCRA currently has multiple contracts with cities, industries, and agriculture farmers for water usage. It is not anticipated that a contract of this size with the Village of Volente will have any additional environmental impacts on this reservoir. Refer to Chapter 1, Appendix 1A, for the complete list by County of threatened and endangered species in the Lower Colorado Regional Water Planning Area. These species may need to be considered during construction of infrastructure. Agricultural and Natural Resources Considerations No impacts to agriculture are expected, as a result of implementing this strategy.
5.2.5.3 Bastrop County
In order to meet future water demands, the following entities within Bastrop County are likely to require a new contract with LCRA for surface water supply from the Highland Lakes; the City of Bastrop, the City of Elgin, and Aqua Water Supply Corporation (WSC). All would require new infrastructure to treat surface water as they currently have groundwater treatment and distribution infrastructure. Descriptions of the water strategies for each entity are described below. City of Bastrop The surface water source strategy for the City of Bastrop would consist of obtaining a contract for surface water with the Lower Colorado River Authority (LCRA) and building an intake on the Colorado River to obtain water and provide treatment, storage, and transmission capabilities for the City of Bastrop.
Surface water demands for the City of Bastrop are projected to be 2,500 acre-feet/year (2.2 MGD Average) starting in 2050. A peaking factor of 2.8 was used for infrastructure sizing.
The source of the raw water would likely be from the Colorado River, as part of LCRA’s additional water supply created by proposed projects. For planning purposes, distance for transmission was assumed to be two (2) miles. The infrastructure proposed was based on TCEQ standards for potable water system supply. Based on these requirements, the following infrastructure was proposed.
Raw Water Intake and Pump Station
Approximately two (2) miles of transmission piping and appurtenances
2.2 MGD Average (6.2 MGD Peak) Water Treatment Plant
The project yield is shown in the following table.
2016 LCRWPG WATER PLAN 5-125
Lower Colorado Regional Water Planning Group November 2015
Table 5-95: City of Bastrop New Surface Water Infrastructure for LCRA Contract Yield
WUG Name County River Basin
Water Management Strategies (ac-ft/yr)
2020 2030 2040 2050 2060 2070
Bastrop Bastrop Colorado 0 0 0
2,500
2,500
2,500 Cost Implications of Proposed Strategy
Capital Cost Estimates for each entity were developed using the Texas Water Development Board (TWDB) Cost Estimating Tool in September 2013 dollars. The Cost Estimating Tool was also used to determine operating costs.
The capital cost for the City of Bastrop strategy is primarily driven by the cost of the water treatment plant. The LCRA water rate for municipal and industrial customers in September 2013 was $151 per acre-foot.
The following table shows the estimated costs associated with this new LCRA Contract strategy.
Table 5-96: City of Bastrop Infrastructure Costs Needed for New LCRA Contract
Total Construction
Cost
Total Capital Cost
Largest Annual Cost
Unit Cost ($/ac-ft)
$24,903,000 $34,858,000 $5,526,000 $2,210.00 Environmental Considerations Water for this strategy would likely come from additional LCRA water supply created by one or more of the recommended or alternative strategies in the 2016 Region K Plan. Most of the projects divert and store water under existing water rights. This particular strategy should not have instream and bay and estuary inflow impacts that are additional in nature to any potential impacts from the LCRA projects.
Refer to Chapter 1, Appendix 1A, for the complete list by County of threatened and endangered species in the Lower Colorado Regional Water Planning Area. These species may need to be considered during construction of infrastructure.
Agricultural and Natural Resources Considerations Large new contracts that would need to utilize supplies from Lakes Buchanan and Travis or other LCRA firm water supplies may decrease the amount of water available for agriculture. For this strategy, that amount would be up to 2,500 ac-ft/yr.
2016 LCRWPG WATER PLAN 5-126
Lower Colorado Regional Water Planning Group November 2015
City of Elgin The surface water source strategy for the City of Elgin would consist of obtaining a contract for surface water with the Lower Colorado River Authority (LCRA) and building an intake on the Colorado River to obtain water and provide treatment, storage, and transmission capabilities for the City of Elgin.
Surface water demands for the City of Elgin are projected to be 3,500 acre-feet/year (3.1 MGD Average) starting in 2030. A peaking factor of 2.8 was used for infrastructure sizing.
The source of the raw water would likely be from the Colorado River, as part of LCRA’s additional water supply created by proposed projects. For planning purposes, distance for transmission was assumed to be thirteen (13) miles. The infrastructure proposed was based on TCEQ standards for potable water system supply. Based on these requirements, the following infrastructure was proposed.
Raw Water Intake and Pump Station
Approximately thirteen (13) miles of transmission piping and appurtenances
3.1 MGD Average (8.7 MGD Peak) Water Treatment Plant
Booster Pump Station with one (1) Storage Tank
The project yield is shown in the following table.
Table 5-97: City of Elgin New Surface Water Infrastructure for LCRA Contract Yield
WUG Name County River Basin
Water Management Strategies (ac-ft/yr)
2020 2030 2040 2050 2060 2070
Elgin Bastrop Colorado 0
3,500
3,500
3,500
3,500
3,500 Cost Implications of Proposed Strategy
The capital cost for the City of Elgin strategy is primarily driven by the cost of the water treatment plant. The LCRA water rate for municipal and industrial customers in September 2013 was $151 per acre-foot.
The following table shows the estimated costs associated with this strategy.
Table 5-98: City of Elgin Infrastructure Costs Needed for New LCRA Contract
Total Construction
Cost
Total Capital Cost
Largest Annual Cost
Unit Cost ($/ac-ft)
$43,955,000 $61,623,000 $8,986,000 $2,567.00
2016 LCRWPG WATER PLAN 5-127
Lower Colorado Regional Water Planning Group November 2015
Environmental Considerations Water for this strategy would likely come from additional LCRA water supply created by one or more of the recommended or alternative strategies in the 2016 Region K Plan. Most of the projects divert and store water under existing water rights. This particular strategy should not have instream and bay and estuary inflow impacts that are additional in nature to any potential impacts from the LCRA projects.
Refer to Chapter 1, Appendix 1A, for the complete list by County of threatened and endangered species in the Lower Colorado Regional Water Planning Area. These species may need to be considered during construction of infrastructure.
Agricultural and Natural Resources Considerations Large new contracts that would need to utilize supplies from Lakes Buchanan and Travis or other LCRA firm water supplies may decrease the amount of water available for agriculture. For this strategy, that amount would be up to 3,500 ac-ft/yr.
Aqua WSC The surface water source strategy for Aqua WSC would consist of obtaining a contract for surface water with the Lower Colorado River Authority (LCRA) and building an intake on the Colorado River to obtain water and provide treatment, storage, and transmission capabilities for the Aqua WSC service area. The service area for Aqua WSC comprises most of Bastrop County along with portions of Travis, Fayette, Lee, and Caldwell Counties. The service area is divided into eight (8) zones.
Surface water demands for Aqua WSC are projected to be 5,000 acre-feet/year (4.4 MGD Average) starting in 2050, increasing to 10,000 acre-feet/year (8.9 MGD Average) starting in 2060, and ultimately reaching 15,000 acre-feet/year (13.4 MGD Average) in 2070. A peaking factor of 2.8 was used for infrastructure sizing.
The source of the raw water would likely be from the Colorado River, as part of LCRA’s additional water supply created by proposed projects. For planning purposes, transmission piping was assumed to consist of two (2) pipe segments, one (1) to the northern zones and one (1) to the southern zones. The northern transmission pipeline was assumed to be nineteen (19) miles and the southern transmission pipeline was assumed to be six (6) miles. The infrastructure proposed was based on TCEQ standards for potable water system supply. Based on these requirements, the following infrastructure was proposed.
Two (2) Raw Water Intakes and Pump Stations
Approximately nineteen (19) miles of transmission piping and appurtenances for the northern zone and approximately six (6) miles of transmission piping and appurtenances for the southern zone
Two (2) 6.7 MGD Average (18.8 MGD Peak) Water Treatment Plants
The demands are shown in the following table.
2016 LCRWPG WATER PLAN 5-128
Lower Colorado Regional Water Planning Group November 2015
Table 5-99: Aqua WSC New Surface Water Infrastructure for LCRA Contract Yield
WUG Name County River Basin
Water Management Strategies (ac-ft/yr)
2020 2030 2040 2050 2060 2070
Aqua WSC Bastrop Colorado 0 0
5,000
5,000
10,000
15,000
Cost Implications of Proposed Strategy
The capital cost for Aqua WSC strategy is primarily driven by the cost of the two (2) water treatment plants. The LCRA water rate for municipal and industrial customers in September 2013 was $151 per acre-foot.
The following table shows the estimated costs associated with this strategy.
Table 5-100: Aqua WSC Infrastructure Costs Needed for New LCRA Contract
Total Construction
Cost
Total Capital Cost
Largest Annual Cost
Unit Cost ($/ac-ft)
$91,491,000 $127,538,000 $18,940,000 $1,263.00 Environmental Considerations Water for this strategy would likely come from additional LCRA water supply created by one or more of the recommended or alternative strategies in the 2016 Region K Plan. Most of the projects divert and store water under existing water rights. This particular strategy should not have instream and bay and estuary inflow impacts that are additional in nature to any potential impacts from the LCRA projects.
Refer to Chapter 1, Appendix 1A, for the complete list by County of threatened and endangered species in the Lower Colorado Regional Water Planning Area. These species may need to be considered during construction of infrastructure.
Agricultural and Natural Resources Considerations Large new contracts that would need to utilize supplies from Lakes Buchanan and Travis or other LCRA firm water supplies may decrease the amount of water available for agriculture. For this strategy, that amount would be up to 15,000 ac-ft/yr.
5.2.5.4 Reuse
Reuse is recommended as a strategy for several municipal WUGs within Region K. Table 5-101 and Table 5-102 summarize the project yields and associated costs, respectively, for each of the WUGs, with the exception of City of Austin, which is discussed in Section 5.2.3.2.2. Following the tables, each WUG then has an individual section where details are discussed further. Other municipal WUGs that have
2016 LCRWPG WATER PLAN 5-129
Lower Colorado Regional Water Planning Group November 2015
active reuse programs, but do not have a recommended reuse strategy include City of Burnet, City of Cedar Park, City of Lago Vista, Travis County MUD #4, Travis County WCID #17, and West Travis County PUA.
Table 5-101: Direct Reuse Summary of Project Yields
The City of Bastrop currently owns and operates two wastewater treatment plants. The reuse strategy consists of using effluent treated by the City of Bastrop’s wastewater treatment plants to supply reclaimed water to Lost Pines Golf Club and other potential users with irrigation needs. It is projected that the implementation of this strategy would decrease the water supply demand needed by the City of Bastrop beginning in the year 2020.
This strategy is estimated to deliver 300 acre-feet per year by 2020. An expansion of reclaimed water is considered and added for subsequent decades, depending on the expected increase in the flow received
2016 LCRWPG WATER PLAN 5-130
Lower Colorado Regional Water Planning Group November 2015
and treated by the City of Bastrop’s sewer treatment plants, up to 1,120 acre-feet per year in 2060. Future additions, mainly driven by growth will likely call for infrastructure expansion needed to meet higher demand volumes.
Cost Implications of Proposed Strategy
The cost of this strategy was estimated using the Texas Water Development Board (TWDB) Cost Estimating Tool. The capital cost for this strategy is primarily driven by the length of the proposed new pipeline, and pump station additions. It is assumed that the plants already have conventional treatment process for BOD removal and disinfection in replace to meet TCEQ reclaimed water type I requirements. The pipeline proposed for this strategy is 8-inch in diameter, spanning approximately 5.0 miles from the City of Bastrop’s Wastewater Treatment Plant to Lost Pines Golf Club or other irrigation sites of interest. It has been assumed that the reclaimed water users would bear the costs associated with this strategy and that the water would be for non-potable use only.
In September 2013 values, the probable cost for City of Bastrop to meet the identified reclaimed water needs is approximately $4,625,000. This strategy will have a total annual cost (including operations and maintenance) of approximately $502,000 per year. The opinion of probable unit cost of reclaimed water is $448 per ac-ft, or approximately $1.38 per 1,000 gallons.
Environmental Considerations
The main advantage the reuse water strategy has over other strategies is that it may be implemented at a low cost, while reducing the need for expanded water supplies. Return flows to the Colorado River will be reduced by up to 1,120 ac-ft/yr. The City of Bastrop is partially located within the Lost Pines Habitat Conservation Plan Area. Coordination and planning will be required during the design and construction to follow the Conservation Plan requirements.
Refer to Chapter 1, Appendix 1A, for the complete list by County of threatened and endangered species in the Lower Colorado Regional Water Planning Area. These species may need to be considered during construction of infrastructure.
Agricultural & Natural Resources Considerations
Limited impacts to agriculture are expected, as a result of implementing this strategy. Return flows would be reduced by up to 1,120 ac-ft/yr, as a result of reusing the effluent.
5.2.5.4.2. City of Buda
The City of Buda (City) currently owns one wastewater treatment plant, which is operated and maintained by the Guadalupe-Blanco River Authority (GBRA). Reclaimed water implementation for the City consists of multiple related projects funded through the City’s “Purple Pipe Fund.” This funding is provided for irrigation of some parks & road medians with Type I reclaimed water, along with the bulk sale of Type I reclaimed water for non-potable uses, improving the condition of grass/landscaping while reducing demand on the city’s drinking water supply. The City intends to expand reclaimed water implementation through its Capital Projects program, and anticipates the implementation of this strategy will continue to reduce the potable water supply demand by the City.
2016 LCRWPG WATER PLAN 5-131
Lower Colorado Regional Water Planning Group November 2015
In addition to the current City projects, an expansion of reclaimed water service is currently under consideration, and will be capable of providing an additional 1.9 million gallons per day to the Sunfield subdivision east of the City. This strategy could deliver approximately 2,240 acre-feet per year by 2020 to the proposed subdivision. Another potential user identified through the planning process is the Mining WUG in Hays County. Mining has water needs in Hays County, and does not require potable water to meet a large portion of those needs. Mining in Hays County is identified in Section 5.2.4.6 as a potential water purchaser of reuse water from the City of Buda. Effluent flow rates are expected to increase in subsequent years based on the demand projections of the contributing areas of the City. Future additions, mainly driven by growth will likely call for infrastructure expansion needed to meet higher demand volumes.
Cost Implications of Proposed Strategy
The cost of this strategy was estimated by the consulting engineer responsible for the Preliminary Design of the Effluent Pump Station as part of the Buda Wastewater Treatment Plant Phase III Expansion project. The capital cost for this strategy is primarily driven by the length of the proposed new pipeline and new effluent pump station additions. It is assumed that the plant already has conventional treatment processes for BOD removal and disinfection in place to meet TCEQ reclaimed water Type I requirements. The pipeline proposed for this strategy is 24-inch in diameter, spanning approximately 3.8 miles from the City’s wastewater treatment plant to the proposed Sunfield subdivision east of Buda, or other irrigation sites of interest, such as Stagecoach Park, City Park or various roadway medians. It has been assumed that the reclaimed water users would bear the costs associated with this strategy and that the water would be for non-potable use only.
In September 2013 values, the probable cost for City to meet the identified reclaimed water needs is approximately $6,075,000. This strategy will have a total annual cost (including operations and maintenance) of approximately $592,000 per year. The opinion of probable unit cost of reclaimed water is $264 per ac-ft, or approximately $0.81 per 1,000 gallons.
Environmental Considerations
The main advantage the reuse water strategy has over other strategies is that it may be implemented at a low cost, while reducing the need for expanded water supplies. The City discharges treated effluent to tributaries of Plum Creek, and by increasing the effluent reuse, will reduce the effluent discharge to natural waterways by up to 2,240 ac-ft/yr.
Refer to Chapter 1, Appendix 1A, for the complete list by County of threatened and endangered species in the Lower Colorado Regional Water Planning Area. These species may need to be considered during construction of infrastructure.
Agricultural & Natural Resources Considerations
No impacts to agriculture are expected, as a result of implementing this strategy.
Texas Disposal Systems
Under TCEQ Chapter 210 authorization, the treated effluent from could be used for new commercial and industrial developments in and around a Texas Disposal Systems (TDS) site. In exchange, a desalination
2016 LCRWPG WATER PLAN 5-132
Lower Colorado Regional Water Planning Group November 2015
facility on the TDS site would treat and produce desalinated Saline Edwards Aquifer water. This desalination strategy is covered in the “Aquifer Storage and Recovery – BSEACD Saline Edwards ASR Project” section of this report.
5.2.5.4.3. City of Flatonia
The City of Flatonia has requested the consideration of a water reuse strategy in the 2016 Regional Water Plan. The reuse strategy would consist of using effluent treated by the City of Flatonia’s Wastewater Treatment Plant to supply the Flatonia Golf Course and two nearby baseball parks with irrigation. It is projected that the implementation of this strategy would decrease the water supply demand needed by the City of Flatonia by the year 2020.
The volume of water available for reuse was determined based on water demands of Fayette County (in both the Guadalupe and Lavaca river basin). The strategy would utilize 40 percent of total demand for reuse by year 2020, resulting in approximately 134 acre-feet/year of supply. Based on demand projections it is expected that reuse strategy supply would increase to 182 acre-feet/year by year 2070.
City of Flatonia leaders have mentioned the reuse water strategy may later be expanded to include supply to restroom facilities such as, toilets and urinals. These future additions were excluded from the reuse strategy supply projections.
Cost Implications of Proposed Strategy
The cost of this strategy was based on a cost estimate provided by the City of Flatonia for the water reuse system, and estimated using the Texas Water Development Board (TWDB) Cost Estimating Tool.
The capital cost for this strategy is primarily driven by the length of the proposed new pipeline, pump station additions (such as tanks, hydrotank, pumps, etc), and the amount of effluent yield predicted for irrigation. The pipeline proposed for this strategy is composed of polyvinyl chloride (PVC) material, spanning 10,200 ft from the City of Flatonia’s Wastewater Treatment Plant to the local irrigation sites of interest. It has been assumed that the water would be for non-potable use only.
The direct reuse of the non-potable system would have a capacity of 134 ac-ft/year by 2020, increasing to 182 acre-feet/year in 2020. In September 2013 values, the probable cost for Flatonia to meet all of its planning horizon identified direct reuse needs through the use of reclaimed water is approximately $1,226,000. This would result in a total annual cost (including operations and maintenance [O&M]) of approximately $110,000 per year. The opinion of probable unit cost of reclaimed water is $821 per ac-ft, or approximately $2.52 per 1,000 gallons.
Capital costs for this strategy were updated to September 2013 dollars using the Engineering News Record (ENR) Construction Cost Index (CCI). No land acquisition costs were assumed for this project, while the remainder of the project costs were calculated using the TWDB Cost Estimating Tool.
Environmental Considerations
The main advantage the reuse water strategy has over other strategies is that it may be implemented at a very low cost, while reducing the need for expanded water supplies. Return flows will be reduced by up
2016 LCRWPG WATER PLAN 5-133
Lower Colorado Regional Water Planning Group November 2015
to 182 ac-ft/yr. Using effluent for irrigation purposes reduces the demands placed on the local groundwater aquifers.
Refer to Chapter 1, Appendix 1A, for the complete list by County of threatened and endangered species in the Lower Colorado Regional Water Planning Area. These species may need to be considered during construction of infrastructure.
Agricultural and Natural Resources Considerations
No impacts to agriculture are expected, as a result of implementing this strategy.
5.2.5.4.4. City of Llano
The reuse strategy consists of using effluent treated by the City of Llano’s wastewater treatment plant to supply reclaimed water to Llano Junior High School athletic field and other potential users with irrigation needs. It is projected that the implementation of this strategy would decrease the water supply demand needed by the City of Llano beginning in 2020.
This strategy will approximately deliver 100 acre-feet per year by 2020. An expansion of reclaimed water can be considered and added for subsequent years, depending on the expected increase in the flow received and treated by the City of Llano’s sewer treatment plants. Future additions, mainly driven by growth will likely call for infrastructure expansion needed to meet higher demand volumes.
Cost Implications of Proposed Strategy
The cost of this strategy was estimated using the Texas Water Development Board (TWDB) Cost Estimating Tool. The capital cost for this strategy is primarily driven by the length of the proposed new pipeline, and pump station additions. It is assumed that the plant already has conventional treatment process for BOD removal and disinfection in place to meet TCEQ reclaimed water type I requirements. The pipeline proposed for this strategy is 2-inch in diameter, spanning approximately 1.6 miles from the City of Llano’s Wastewater Treatment Plant to Llano Junior High School athletic field. The pipeline can be further extended to also serve Llano River Gold Course, which approximately another 3.4 miles away. The cost presented in this strategy is for serving the athletic field only, and does not include the construction cost associated with extending the pipeline to the golf course.
In September 2013 values, the probable cost for City of Llano to meet the identified non-potable reclaimed water needs is approximately $689,000,. This strategy will have a total annual cost (including operations and maintenance) of approximately $66,000 per year. The opinion of probable unit cost of reclaimed water is $660 per ac-ft, or approximately $2.03 per 1,000 gallons.
The City of Llano also requested this strategy to be evaluated for indirect potable use for discharge into Llano River Lake. According to a white paper published by Water Reuse Association, the additional cost for potable reuse treatment is in the range of $820 to $2,000 per ac-ft, which includes about $120 ac-ft for conveyance at the lower end of the cost range. For the City of Llano, the total opinion of probable cost for indirect potable water at the high end is about $3,027 per ac-ft, or $9.29 per 1,000 gallons.
2016 LCRWPG WATER PLAN 5-134
Lower Colorado Regional Water Planning Group November 2015
Environmental Considerations
The main advantage the reuse water strategy has over other strategies is that it may be implemented at a low cost, while reducing the need for expanded water supplies. The amount of effluent that is reused will decrease the amount of flow returned to the river. For this strategy, it is a relatively small amount and should have negligible impacts.
Refer to Chapter 1, Appendix 1A, for the complete list by County of threatened and endangered species in the Lower Colorado Regional Water Planning Area. These species may need to be considered during construction of infrastructure.
Agricultural & Natural Resources Considerations
No impacts to agriculture are expected as a result of implementing this strategy.
5.2.5.4.5. City of Pflugerville
As a means of meeting future water demands, the City of Pflugerville is considering a water reuse strategy to increase their use of effluent treated by the City of Pflugerville’s wastewater treatment plant. The City of Pflugerville’s wastewater treatment plant currently supplies reclaimed water to the Travis County Northeast Metropolitan Park to irrigate athletic fields and offers reclaimed water to local businesses with non-potable water demands. An increase in demand using reclaimed water could be for additional irrigation purposes at parks, medians, and golf courses and potential industrial purposes such as cooling supply. The reuse water source strategy would consist of:
Expanding the reuse storage and transmission capability of the City of Pflugerville wastewater treatment plant.
Estimated projections for reuse yields generated by this strategy for the City of Pflugerville are 500 acre-feet/year (0.45 MGD Average) in 2020 with projected growth to 4,000 acre-feet/year (3.6 MGD Average) in 2070.
An expansion of the water reuse facilities will be dependent on the expected increase in flow received and treated by the City of Pflugerville. The wastewater treatment plant is currently permitted for 5.85 MGD but is not yet at this treatment capacity.
For planning purposes, distance for transmission was assumed to be 5.5 miles from the wastewater treatment plant north on State Highway 130 to the northern limits of Pflugerville. Since the City of Pflugerville is already providing reuse water, no additional treatment improvements are proposed at the wastewater plant since these will be included with future treatment capacity expansion. Based on these requirements, the following infrastructure was proposed.
Reuse Pump Station and Storage Tank
Approximately 5.5 miles of transmission piping and appurtenances
2016 LCRWPG WATER PLAN 5-135
Lower Colorado Regional Water Planning Group November 2015
Cost Implications of Proposed Strategy
A capital cost estimate was developed using the Texas Water Development Board (TWDB) Cost Estimating Tool in September 2013 dollars. The Cost Estimating Tool was also used to determine operating costs.
The capital cost for this strategy is primarily driven by the length of the proposed reuse transmission pipeline. In September 2013 values, the probable cost for the City of Pflugerville to meet all of its planning horizon identified reuse supply needs is approximately $7,959,000. This would result in a total annual cost (including operations and maintenance of approximately $911,000 per year. The opinion of probable unit cost of water is $228 per acre foot, or approximately $0.70 per 1,000 gallons.
Environmental Considerations
The main advantage of a reuse water strategy is that it can be implemented at a low cost, while reducing the need to expand water supplies. Currently, the City of Pflugerville discharges into Gilleland Creek along with seven (7) other wastewater treatment facilities. During low flow, the water in Gilleland Creek consists mostly of treated wastewater effluent. With this water reuse strategy, the City of Pflugerville will discharge up to 4,000 ac-ft/yr less effluent into Gilleland Creek.
Refer to Chapter 1, Appendix 1A, for the complete list by County of threatened and endangered species in the Lower Colorado Regional Water Planning Area. These species may need to be considered during construction of infrastructure.
Agricultural and Natural Resources Considerations
No impacts to agriculture are expected, as a result of implementing this strategy.
5.2.5.4.6. City of Horseshoe Bay
The City of Horseshoe Bay currently supplies approximately 516 acre-feet per year of reuse water for irrigation of golf courses. This strategy assumes that an additional small amount of reuse will be used in the future. Because of the relatively small volume of additional water, no costs were associated with the strategy. There are no anticipated environmental or agricultural impacts associated with this strategy.
5.2.5.4.7. City of Marble Falls
The City of Marble Falls currently supplies approximately 750 acre-feet per year of reuse water for irrigation of city parks. The City requested a strategy to show that an additional 11 ac-ft/yr of reuse will be used in the future to irrigate athletic fields. Because of the small volume of additional water, no treatment or transmission-related costs were associated with the strategy. Distribution-level costs are not included in regional water planning. There are no anticipated environmental or agricultural impacts associated with this strategy.
2016 LCRWPG WATER PLAN 5-136
Lower Colorado Regional Water Planning Group November 2015
5.2.6 Irrigation Water Management Strategies
Region K has 246 WUGs, with 26 of them being Irrigation. The existing water supplies available to the irrigators in Region K are not sufficient to meet the projected needs. A shortage would occur in all decades of the planning period should the critical drought be repeated. Using the Region K Cutoff Model with no return flows and assuming full use of the ROR irrigation rights to meet irrigation demands in those operations, the maximum annual shortage is projected to decrease from 335,000 ac-ft/yr in 2020 to approximately 260,000 ac-ft/yr in 2070. The calculated shortages are expected to decrease due to projected decreases in water demand. Table 5-103 shows the water needs for all of the Irrigation WUGs in Region K and the number of WUGs with water deficits for each decade, and Table 5-104 shows the irrigation needs for the rice-growing counties (Colorado, Matagorda, and Wharton) in Region K.
Irrigation in Mills County has water needs decreasing from 605 acre-feet per year in 2020 to 460 acre-feet per year in 2070. The strategies identified to meet those needs are as follows:
Drought Management (Discussed in Section 5.2.4.8.2)
Expand Use of the Trinity Aquifer (Discussed in Section 5.2.4.1.8)
The water needs for Irrigation in Mills County are fully met through these two strategies.
Table 5-104: Irrigation Water Needs in the Rice-Growing Counties (ac-ft/yr)
TOTAL (334,884) (319,009) (303,561) (288,528) (273,900) (259,664)
The remaining Irrigation needs are identified in Table 5-104 and correspond to Colorado, Matagorda, and Wharton Counties. The strategies recommended by the LCRWPG for Irrigation in these counties are summarized in Table 5-105.
All of the recommended strategies are discussed in other sections of Chapter 5. The identified sections are as follows:
Drought Management (Discussed in Section 5.2.4.8.2)
On-Farm Conservation (Discussed in Section 5.2.2.4.1)
Irrigation Conveyance Improvements (Discussed in Section 5.2.2.4.2)
2016 LCRWPG WATER PLAN 5-137
Lower Colorado Regional Water Planning Group November 2015
Sprinkler Irrigation (Discussed in Section 5.2.2.4.3)
Return Flows (Discussed in Section 5.2.1.1)
LCRA WMP Interruptible Water (Discussed in Section 5.2.3.1.2)
In addition, while not a yield-producing strategy, HB 1437 is a funding mechanism for implementing strategies including those for irrigation. HB 1437 requires water being transported out of the Colorado River Basin to the Brazos River Basin to be replaced to the extent that there is no net loss of surface water in the Colorado River Basin. One of the methods for replacing that water is through on-farm conservation in the lower three counties. Through the HB 1437 process, farmers within LCRA’s irrigation divisions will receive funding of about 80 percent of the total costs, with farmers bearing 20 percent of the cost for implementing conservation.
Table 5-105 Summary of Recommended Water Management Strategies to Meet Irrigation Needs in Colorado, Matagorda, and Wharton Counties
* Availability of interruptible water will be increased using the Lane City OCR and other recommended OCRs; the estimated quantity is subject to WMP amendments through TCEQ and the hydrologic outcome of the current drought.
After the recommended strategies, there are remaining unmet needs for Irrigation in Colorado, Matagorda, and Wharton counties for the 2016 Region K Plan. The remaining unmet needs are identified in Table 5-105.
2016 LCRWPG WATER PLAN 5-138
Lower Colorado Regional Water Planning Group November 2015
5.2.7 Manufacturing Water Management Strategies
Several expand use of groundwater strategies have been identified to meet manufacturing WUG needs. The following regional water management strategies were selected to meet Manufacturing needs:
Expand Use of the Carrizo-Wilcox Aquifer (Discussed in Section 5.2.4.1.1)
Expand Use of the Ellenburger-San Saba Aquifer (Discussed in Section 5.2.4.1.2)
Expand Use of the Gulf Coast Aquifer (Discussed in Section 5.2.4.1.4)
5.2.8 Mining Water Management Strategies
The following regional water management strategies were selected to meet Mining needs:
Expand Use of current groundwater supplies (Discussed in Section 5.2.4.1
Development of new groundwater supplies (Discussed in Section 5.2.4.2)
Edwards/Middle Trinity ASR (Discussed in Section 5.2.4.4.1)
Water Purchase (Discussed in Section 5.2.4.6)
There is also identified unmet Mining needs in the 2016 Region K Plan. These needs were identified in Bastrop County in coordination with Region G. The mining industry in that area pumps groundwater to lower the water table in order to allow access to mining activities. It was determined that the Mining demands were not true demands, and therefore did not need to have recommended water management strategies. The unmet Mining WUG needs are as follows:
5.2.9 Steam Electric Power Water Management Strategies
Steam-electric needs in the region include those for City of Austin in Fayette and Travis counties, STPNOC in Matagorda County, and a smaller steam-electric entity in Wharton County. The following sections discuss the recommended strategies for meeting the Steam-Electric water needs.
5.2.9.1 COA Steam Electric Water Management Strategies
The City of Austin has steam-electric power needs in Fayette, Matagorda, and Travis Counties. Austin’s portion of the South Texas Project (STP) demand is included in the STP total steam-electric demand in
2016 LCRWPG WATER PLAN 5-139
Lower Colorado Regional Water Planning Group November 2015
Matagorda County, and is therefore not addressed here. The table below shows the steam-electric water demands in Fayette and Travis Counties.
Table 5-107: COA Steam Electric Power Water Demand (ac-ft/yr)
TOTAL 33,202 37,202 37,202 38,202 45,202 47,202 To meet Austin’s steam electric power needs, Austin has identified three main water management strategies in addition to current supplies. These are use of water released from the Increased Use of Lake Long Storage strategy (Section 5.2.3.2.6), LCRA contract amendment (Section 5.2.3.1.4), and additional direct water reuse (Section 5.2.3.2.2). These are summarized in the following table showing the steam- electric supplies and water management strategies in Fayette and Travis counties.
Table 5-108: COA Steam-Electric Supplies and Water Management Strategies (ac-ft/yr)
COA Supplies & Strategies 2020 2030 2040 2050 2060 2070 Fayette County Supplies Existing Supply (Steam Electric - Fayette) 7,887 7,016 7,016 7,016 7,016 7,016 Strategies Long Lake Enhanced (Steam Electric) Fayette 2,000 2,000 2,000 2,000 2,000 2,000 LCRA Contract Amendment (Steam Electric) Fayette 6,000 7,000 9,000 11,000 13,000 15,000
Fayette Total 15,887 16,016 18,016 20,016 22,016 24,016 Travis County Supplies Existing Supply (Steam Electric - Travis) 21,126 21,126 21,126 21,126 21,126 21,126 Strategies Direct Reuse (Steam Electric) Travis 3,500 7,500 7,500 8,500 9,500 10,500
Travis Total 24,626 28,626 28,626 29,626 30,626 31,626
Total Steam-Electric 40,513 44,642 46,642 49,642 52,642 55,642 It is anticipated that there will be additional infrastructure needed. The probable costs associated with Austin’s direct reuse water management strategy for supplying steam electric needs in Travis County are estimated to be approximately $1,347/ac-ft (as shown in the City of Austin direct reuse section of this chapter). The probable costs associated with Austin’s Long Lake off-channel enhanced storage strategy are estimated to be approximately $187/ac-ft (as shown in the City of Austin Long Lake section of this chapter). Costs to amend Austin Energy’s contract with LCRA are shown at $151/ac-ft, and are included in the LCRA Contract Amendment section of this chapter.
2016 LCRWPG WATER PLAN 5-140
Lower Colorado Regional Water Planning Group November 2015
5.2.9.2 STP Nuclear Operating Company Water Management Strategies
The South Texas Project Electric Generating Station (STP) is a nuclear power facility located southwest of Bay City, in Matagorda County. The facility’s demand of 105,000 acre-feet/year is based on higher availability of generation capacity, added generating capacity, and blowdown of the reservoir to maintain water quality. This demand during the 50-year planning horizon will be satisfied significantly through (1) the management strategies of continued run-of-the-river diversions of up to 102,000 ac-ft/yr, under Certificate of Adjudication No. 14-54378, (2) continued use of STPNOC’s existing off-channel reservoirs authorized under Certificate of Adjudication No. 14-5437; and (3) continued pumpage of groundwater for the purposes of incorporation in STPNOC’s processes. Supplementing its run-of-the-river diversions, STPNOC also has a contract with LCRA for firm backup water of 20,000 acre-feet for 2-unit operation and 40,000 acre-feet for additional generating units, for so long as electric generation facilities are operated at the site.
Based on current projections completed for the 2016 Region K Plan, shortages of approximately 25,000 ac-ft/yr or more have been identified commencing as early as 2020 for Steam Electric supplies in Matagorda County during a repeat of the DOR. It is of additional note that STPNOC’s run-of-the-river diversions can be affected by water quality at the STPNOC diversion point. In order to support a long-term reliable electric supply for Texas, alternative strategies have been identified for offsetting these shortages and to guard against the continuing escalation in upstream demands which may affect water quality at the current permitted diversion point near the plant, although the recent amendment to the water right to allow diversion upstream of the LCRA Bay City dam may provide some ability to mitigate any water quality impacts.
STPNOC and LCRA negotiated an extension and amendment to the water supply contract in 2006, which helps ensure a long-term, cost effective water supply for the STP plant. Additional and alternative strategies include but are not limited to the following:
Blend brackish surface water in STPNOC reservoir Alternate canal delivery LCRA contract amendment Dedication of return flows from other users Water right permit amendment
Conservation also is an integral part of STPNOC’s operational philosophy as documented in the Water Conservation Plan filed with the TCEQ.
5.2.9.2.1. Blend Brackish Surface Water in STPNOC Reservoir
During an emergency situation, when the STPNOC reservoir reaches 30 feet mean sea level (MSL), STPNOC and LCRA will pursue relief from the TCEQ to be allowed to pump brackish surface water to blend in with the existing fresh water in the STPNOC reservoir. A firm yield of 3,000 acre-feet was determined for each decade in the planning period. This strategy has no cost associated with it, no environmental impacts, and no impacts to agriculture.
8 STPNOC’s interest in the water rights evidenced in the certificate are as agent for the STPNOC owners, the City of San
Antonio acting through the City Public Service Board, COA, and NRG South Texas, LP.
2016 LCRWPG WATER PLAN 5-141
Lower Colorado Regional Water Planning Group November 2015
5.2.9.2.2. Alternate Canal Delivery
The STP facility currently has run of river rights and withdraws cooling water directly from the Lower Colorado River. However, the existing diversion point is very close to Matagorda Bay, which means it is mixed with high salinity water from the bay.
For this strategy, water would be withdrawn from the Lower Colorado River, upstream of the Bay City Dam, and transported to the cooling water reservoir adjacent to the STP. The water pulled upstream of the dam would be better quality (less saline) than the water withdrawn from the existing diversion point. STP’s current contract allows diversion from this point, but currently there are no physical means in place to facilitate this.
The source of the water is the same as the current source, flows from the Colorado River. Since this withdrawal is downstream of the new Lane City Off-Channel Reservoir (currently under construction as of the time of this report), releases from this reservoir, or other proposed sources of new LCRA supply, are also a potential source.
The infrastructure required to implement this strategy includes:
Existing LCRA pump station and irrigation canals, to transport the water through the canals as close as possible to the existing cooling water reservoir.
New pipeline to transport the water from the irrigation canals to the cooling water reservoir.
STP would have to pay LCRA for the use of their pump station and irrigation canal. The estimated cost is approximately $120-150 per acre-foot.
Since the existing irrigation canals are fairly close to the existing reservoir, the pipeline length to convey water from the canals to the reservoir is expected to be relatively short. For the purposes of this report, the length is assumed to be 1,000 feet.
The yield from this strategy is projected to be 12,727 acre-feet per year. This is based on continuous pumping of 32,000 gallons per minute over only the winter months out of the year. This duration is assumed at 90 days. This will only make up a small percentage of the currently permitted 102,000 acre-feet per year, so the majority of the volume is still expected to come from the existing diversion point. There are no plans to increase the permitted amount at the time of this report.
The project yield from this strategy is shown in the following table.
Lower Colorado Regional Water Planning Group November 2015
Cost Implications of Proposed Strategy
Costs for this strategy were developed based on background information provided by STP, and the Texas Water Development Board (TWDB) Cost Estimating Tool. Consistent with the tool, all costs are given in September 2013 dollars.
The following table shows the estimated costs associated with this strategy.
Table 5-110: Cost Estimate for STP Alternate Canal Delivery
Total Construction
Cost
Total Capital
Cost
Largest Annual
Cost
Unit Cost
($/ac-ft)
$5,475,000 $7,669,000 $2,593,000 $204.00
Environmental Considerations
Minimal environmental impacts are expected as a result of implementing this strategy, since the same amount of water is being withdrawn, only at a different point. The only potential impact would be to environmental uses between the new withdrawal point (Bay City Dam) and the existing withdrawal point. However, withdrawal could be managed to meet any environmental flows first, before withdrawing from the new withdrawal point. If additional flow is still required, it could be taken from the existing withdrawal point. Thus, environmental impacts should be negligible.
Refer to Chapter 1, Appendix 1A, for the complete list by County of threatened and endangered species in the Lower Colorado Regional Water Planning Area. These species may need to be considered during construction of infrastructure.
Agricultural & Natural Resources Considerations
Negligible impacts to agriculture or natural resources are expected as a result of implementing this strategy since the diversion is planned for the winter months (non-irrigation season).
5.2.9.2.3. LCRA Contract Amendment
An additional contract amendment for 10,000 acre-feet per year with LCRA for each of the planning decades is another way to meet STP needs. LCRA projects such as the Lane City Off-Channel Reservoir are ways to increase LCRA’s supply to meet these increased demands for new firm contracts and contract amendments. This strategy, and others, is described in detail in the Off-Channel Reservoirs section of the LCRA Water Management Strategies section.
5.2.9.2.4. Water Right Permit Amendment
A 5 year joint application (14-5437C) between STP and LCRA was filed in 2010 with TCEQ. The application is to amend the water right to allow an average diversion of 102,000 AF over any 5 consecutive years with a single year cap not to exceed 245,000 AF. There is no impact to existing water
2016 LCRWPG WATER PLAN 5-143
Lower Colorado Regional Water Planning Group November 2015
rights. There is no additional yield, no costs, and no impacts associated with this permit amendment. The joint application was filed with TCEQ in 2010 and is under “technical review”.
5.2.9.3 Other Steam Electric Water Management Strategies
An existing industrial plant in Wharton County has a need in 2060 based on their current demands, but also has future plans for expansion. Their run-of-river water right on the San Bernard River does not provide enough firm water to meet their current demands in 2060, leaving the plant with a need of 94 acre-feet per year, which increases to 200 acre-feet per year in 2070. The strategy recommended to meet this need and any potential future needs is the development of a new well field in the Gulf Coast Aquifer. The strategy is discussed further in Section 5.2.4.2.2.
Table 5-111: Gulf Coast Aquifer Development Costs
WUG Name County River Basin Total Capital Cost
Total Project Cost
Largest Annual Cost
Unit Cost ($/ac-ft)
Steam-Electric Wharton Brazos-
Colorado $1,502,000 $2,237,000 $207,000 $1,035.00
5.3 ALTERNATIVE WATER MANAGEMENT STRATEGIES
Due to the ongoing drought, LCRA and the City of Austin are looking at several options to help meet future needs in the decades to come, and would like to include some of the potential strategies as alternative strategies while the evaluation process continues. In addition, one of the Groundwater Importation strategies that have been coordinated with Region L has a modified version that is included in this Alternative Strategy section, and the City of Buda has a Direct Potable Reuse strategy as well.
5.3.1 Alternative Strategies for LCRA Wholesale Water Supply
This section contains alternative new water supply options for LCRA. This water would provide additional firm yield to LCRA as a wholesale water provider and could be used to meet various needs throughout Region K. Certain strategies were developed as part of the Water Supply Resource Plan: Water Supply Option Analysis, prepared by CH2M Hill for LCRA in July 2009, and the details from that Plan are provided in this report.
2016 LCRWPG WATER PLAN 5-144
Lower Colorado Regional Water Planning Group November 2015
Table 5-112: LCRA Wholesale Water Supply Alternative Water Management Strategies (ac-ft/yr)
LCRA Alternative Strategy 2020 2030 2040 2050 2060 2070
Aquifer Storage and Recovery 0 0 5,048 5,048 5,048 5,048 Enhanced Recharge and Conjunctive Use 10,000 10,000 10,000 10,000 10,000 10,000 Import Return Flows from Williamson County 25,000 25,000 25,000 25,000 25,000 25,000 Supplement Bay and Estuary Inflows with Brackish Groundwater 12,000 12,000 12,000 12,000 12,000 12,000 Baylor Creek Reservoir 0 0 18,000 18,000 18,000 18,000 Brackish Groundwater Desalination 0 0 22,400 22,400 22,400 22,400 Groundwater Importation - Carrizo-Wilcox 0 0 35,000 35,000 35,000 35,000
Total 47,000 47,000 127,448 127,448 127,448 127,448
5.3.1.1 Groundwater Importation - Carrizo-Wilcox to LCRA System
As part of their Water Supply Resource Plan, the LCRA developed several alternative water supply options to meet future demands. These new water supply options would provide additional firm yield to LCRA as a regional water provider and could be used to meet various needs throughout Region K. This water supply strategy involves developing approximately 35,000 acre-feet of untreated groundwater from outside the Planning Area and Colorado River Basin and transporting the water to eastern Travis County. This water supply option would utilize groundwater produced from the Simsboro Formation of the Carrizo-Wilcox aquifer in northern Burleson County. A pipeline with a single booster pump station would be required to convey the water to the conceptual delivery point in Travis County.
The basic infrastructure required to accomplish this transfer would include production wells, collection piping and other wellfield facilities, as well as an approximately 80-mile conveyance pipeline and pump stations. For purposes of including this alternate strategy, the well field is assumed to be located in Burleson County, with a delivery point in eastern Travis County at approximately State Highway 130 (SH130) and the Colorado River, but exact location of the well field and delivery point could depart from this assumption. The pipeline alignment conceptually follows SH21, FM 696, and US Highway 290 to its delivery point in the vicinity of SH130. Groundwater pumping rights are assumed to be leased, with annual payments included in the operation and maintenance costs. An alternative option would be to purchase the groundwater via a third party contract.
Cost Implications of Proposed Strategy
Costs for this strategy were developed using the Texas Water Development Board (TWDB) Cost Estimating Tool. Consistent with the tool, all costs are given in September 2013 dollars. The following table shows the estimated costs associated with this strategy.
2016 LCRWPG WATER PLAN 5-145
Lower Colorado Regional Water Planning Group November 2015
Table 5-113: LCRA Alternative Groundwater Importation Cost
A quantitative analysis of instream flows and freshwater inflows to Matagorda Bay was performed as part of the 2011 Region K Plan by assuming that 60 percent of the imported groundwater would be discharged as effluent to the Colorado River somewhere downstream of Lady Bird Lake. These additional return flows could increase instream flows and freshwater inflows by up to 21,000 ac-ft/yr.
Refer to Chapter 1, Appendix 1A, for the complete list by County of threatened and endangered species in the Lower Colorado Regional Water Planning Area. These species may need to be considered during construction of infrastructure.
No groundwater modeling was conducted as part of this analysis. It is assumed that the production of this volume would conform to the water management plan and rules of the Post Oak Savannah Groundwater Conservation District. However, review of the groundwater conservation district’s management plan suggests that 35,000 acre-ft may be available for production and use.
Agricultural & Natural Resources Considerations
There are no direct impacts to agriculture or natural resources anticipated from this strategy; however, to the extent that this strategy were implemented in a manner that reduced firm demands on the Colorado River supplies, it is possible that additional interruptible water of up to 35,000 ac-ft/yr could be made available for agricultural purposes. 5.3.1.2 Import Return Flows from Williamson County
LCRA has been evaluating water management strategies to develop water supplies by importing return flows (i.e. treated wastewater effluent) from entities in Williamson County that have contracts with LCRA for firm water from the Colorado River and for which exempt interbasin transfer permits have been issued allowing the water to be used in the Brazos River basin within Williamson County.
A recent engineering study evaluated various options for returning water back to the Colorado River basin. The most likely source of return flows is the Brushy Creek Regional Wastewater Treatment Plant (BCRWWTP) which currently discharges into Brushy Creek which is in the Brazos River Basin, but return flows could also be secured from the Leander wastewater treatment plant, which also discharges further upstream into Brushy Creek, in the Brazos River basin.
Two options have been considered: 1) return flows could be pumped directly from the BCRWWTP through a 16-mile transmission pipeline to the mid-basin reservoir proposed as an LCRA strategy in this regional plan or to other terminal storage, or 2) return flows could be discharged to Brushy Creek from the BCRWWTP and/or the Leander WWTP and a bed-and-banks permit would be used to transport the water downstream for diversion at a pump station that would pump the water through an 11-mile transmission pipeline to Wilbarger Creek which feeds into the Colorado River. The return flows can be
2016 LCRWPG WATER PLAN 5-146
Lower Colorado Regional Water Planning Group November 2015
transported by the bed-and-banks of Wilbarger Creek and the Colorado River to diversions points of LCRA’s firm customers, or to one of the off-channel reservoirs. Alignments and cost estimates were prepared for LCRA by the engineering consultant. LCRA may need to obtain an interbasin transfer permit to import return flows from the Brazos River basin to the Colorado River basin. LCRA will likely also secure a bed and banks permit to retain ownership and control of the imported return flows once discharged into the Colorado River basin.
For the 2016 Regional Water Plan, Option 1 has been evaluated since it has more infrastructure requirements and a longer pipeline route. Based on these criteria, the water management strategy will consist of:
Obtain necessary water rights permits, construction of tertiary treatment upgrades at BCRWWTP,
a pump station and storage tank at BCRWWTP, and a water transmission pipeline.
The BCRWWTP is located east of the city of Round Rock on Highway 79. For purposes of this strategy, the available yield of water from this project is assumed to be approximately 25,000 acre-feet/year (22.3 MGD Average) for all planning decades.
The infrastructure required for this strategy was determined by LCRA’s engineering consultant. The following infrastructure was proposed.
Pump Station and Storage Tank at BCRWWTP
Tertiary Treatment upgrade at BCRWWTP
Approximately sixteen (16) miles of transmission piping and appurtenances
Cost Implications of Proposed Strategy
A capital cost estimate was provided by the engineering consultant using the Texas Water Development Board (TWDB) Cost Estimating Tool. The Cost Estimating Tool was also used to determine operating costs. The capital cost for this strategy is primarily driven by the cost of the transmission pipeline.
The following table shows the estimated costs associated with this strategy. Costs are given in September 2013 dollars.
Table 5-114: LCRA Alternative Import Return Flows from Williamson County Cost
Lower Colorado Regional Water Planning Group November 2015
Environmental Considerations
Either option will need to ensure that water quality is not degraded as a result of discharge to a mid-basin reservoir or Wilbarger Creek. Infrastructure improvements identified at the WWTP include tertiary treatment for phosphorus removal before effluent can be discharged into a reservoir.
The discharge point shall be at a point in the reservoir or creek where it has sufficient capacity to handle the additional flow without detrimental effects to a reservoir or stream banks. The environmental impact should be low.
Depending on where the imported return flows are used, water available to help meet instream flows in the Colorado River could increase up to 25,000 ac-ft/yr as a result of the imported return flows. Return flows that are not stored and/or used to meet local or downstream demands could help meet freshwater inflow needs of Matagorda Bay.
Refer to Chapter 1, Appendix 1A, for the complete list by County of threatened and endangered species in the Lower Colorado Regional Water Planning Area. These species may need to be considered during construction of infrastructure.
Agricultural & Natural Resources Considerations
Depending on firm demands, imported return flows could be used by LCRA to meet firm demands that would otherwise be met from stored water releases from the Highland Lakes, potentially increasing availability of interruptible water supply up to 25,000 ac-ft/yr. Imported return flows may also be used to directly increase the amount of interruptible water supply available for agricultural water users.
Interbasin Transfer Considerations
In order to bring return flows from the Brazos River Basin to the Colorado River Basin, an interbasin transfer permit (IBT) will be required, under Texas Water Code §11.085. In order to implement this strategy, LCRA would need to comply with all of the provisions stated in the Code. One of the provisions requires a comparison of the water needs in the basin of origin to the water needs in the proposed receiving basin. The projected water needs (2020-2070) for the Brazos River Basin and the Colorado River Basin, as determined using data from DB17 provided by TWDB, are shown in the table below.
Table 5-115: Total Water Needs Comparison between Brazos and Colorado River Basins (Ac-Ft/Yr)
Total Water Needs 2020 2030 2040 2050 2060 2070
Brazos River Basin 1,362,351
1,471,274
1,601,219
1,719,960
1,795,282
1,974,436
Colorado River Basin 504,701
606,420
697,358
776,096
873,078
1,018,290
LCRA recently completed its 2014 Water Conservation Plan that addresses water conservation practices for its firm water customers (municipal, industrial, power generation and recreational). These efforts include five-year and 10-year implementation plans that will guide effective water conservation
2016 LCRWPG WATER PLAN 5-148
Lower Colorado Regional Water Planning Group November 2015
throughout communities in LCRA’s rapidly growing service area and may achieve highest practicable levels of water conservation. More details on the 2014 Water Conservation Plan can be found online at:
http://www.lcra.org/water/save-water/Documents/2014-Water-Conservation-Plan.pdf Details related to the conservation efforts recommended for LCRA as a wholesale water provider are discussed in Section 5.2.2.1.
5.3.1.3 Supplement Bay and Estuary Inflows with Brackish Groundwater
Brackish groundwater delivery to the Matagorda Bay Delta is considered as a potential water management strategy for the LCRA (wholesale water provider) to offset required releases from the Highland Lakes. By developing a new source to meet environmental needs, the firm supply normally released from the Highland Lakes to meet bay and estuary inflow requirements can remain in the Highland Lakes and become a firm supply for LCRA’s existing and future customers. Equivalence of brackish groundwater to achieve the same effect as a volume of water released from the Highland Lakes would be a function of the brackish and groundwater total dissolved solids (TDS) values, the effectiveness of delivery directly to the lower marsh versus through the channel, and the amount of released water that reaches the Bay.
As part of its plan for growth, LCRA is considering brackish groundwater delivery for Bay & Estuary needs as a potential water source strategy in the 2016 Regional Water Plan. The strategy would consist of:
Obtaining a permit from Coastal Plains GCD Developing a well field in the Matagorda Bay Delta with associated piping for discharge into the
lower marsh. A preliminary project concept sizes the well field supply with a capacity of 12,000 ac-ft/yr and a peak pumping capacity of 3,150 ac-ft per month could be potentially feasible, depending on results of future studies.
The infrastructure required for this strategy consists of:
Twelve (12) brackish groundwater wells, depths up to 1,200 ft
Simple Outfall Structure Cost Implications of Proposed Strategy
A project cost estimate was provided by LCRA. The capital cost estimate is in September 2013 dollars using the Texas Water Development Board (TWDB) Cost Estimating Tool. The capital cost for this strategy is primarily driven by the cost of the well fields.
The following table shows the estimated costs associated with this strategy.
Timing and location of delivery of brackish groundwater could have equal or possibly more effective impacts to the bay than releases from Highland Lakes’ storage. Modeling and potential pilot testing would be necessary to determine effects of incoming salinity and delivery location. Instream flows would possibly be reduced by up to 12,000 ac-ft/yr as a result of not releasing stored water.
Refer to Chapter 1, Appendix 1A, for the complete list by County of threatened and endangered species in the Lower Colorado Regional Water Planning Area. These species may need to be considered during construction of infrastructure.
Agricultural & Natural Resources Considerations
This strategy could be used by LCRA to help meet environmental needs that would otherwise be met from stored water releases from the Highland Lakes, potentially increasing availability of interruptible water supply by up to 12,000 ac-ft/yr. 5.3.1.4 Brackish Groundwater Desalination from the Gulf Coast Aquifer (Desalination)
This alternative strategy includes the extraction of brackish groundwater from the Gulf Coast Aquifer in Matagorda County, its treatment using reverse osmosis (RO), and the delivery of approximately 22,400 acre-feet per year (20 mgd) of potable to Bay City are for municipal and industrial use, beginning in the 2040 decade. The RO permeate (waste generated in the RO process) would be disposed of directly into the ground via a deep injection wellfield.
Cost Implications of Proposed Strategy
Costs for this strategy were developed using the Texas Water Development Board (TWDB) Cost Estimating Tool. Consistent with the tool, all costs are given in September 2013 dollars. The following table shows the estimated costs associated with this strategy.
Table 5-117: LCRA Alternative Brackish Groundwater Desalination Cost
Lower Colorado Regional Water Planning Group November 2015
Environmental Considerations
The Matagorda Bay region includes a significant amount of acreage designated as wetlands, which serve as the habitat for numerous terrestrial and marine species, some of which are threatened and/or endangered. Refer to Chapter 1, Appendix 1A, for the complete list by County of threatened and endangered species in the Lower Colorado Regional Water Planning Area. These species may need to be considered during construction of infrastructure.
Some additional potential environmental impacts would be related to the potential degradation of the quality of the groundwater in the vicinity of the proposed wells, and the management of the RO waste and byproducts such as concentrated salt solution. The current groundwater availability models do not include quality information or capability to model changes in water quality. For that reason, it is not possible to determine whether or not the flows being pumped will impact the overall quality of the aquifer in this area. Management of the concentrated salt solution by deep well injection should adequately confine the materials within deep aquifers with similar salt concentrations to minimize any negative impacts.
Using local groundwater sources could reduce the amount of water released by the Highland Lakes to meet downstream customer needs by up to 22,400 ac-ft/yr. The released water provides instream flows on its way to the customer, so the instream flows in the Colorado River could potentially be reduced by 22,400 ac-ft/yr.
Agricultural & Natural Resources Considerations
This strategy does not put increased demand on water supplies already being used by agriculture and does not move supply from agricultural uses to other usage. To the extent that the supplies would be used to offset a demand that may otherwise need to be met with Colorado River water, and depending on when those demands materialize, it is possible that incorporation of these supplies into LCRA’s system will allow additional interruptible water of up to 22,400 ac-ft/yr to be made available for agricultural purposes.
5.3.1.5 Baylor Creek Reservoir
This strategy consists of a new, 48,390 acre-foot earthen dam reservoir, located in Fayette County, adjacent to the Cedar Creek Reservoir (Lake Fayette) and the Fayette Power Project power plant. This facility is permitted by TCEQ; however, the permit states construction was to begin by September 18, 2014, and complete by September 18, 2017. LCRA has applied for a time extension to the permit for construction to start and a draft permit amendment has been issued by TCEQ.
The purpose of this reservoir is to capture available river not needed downstream and store the captured water for later use. The demand served by this strategy would be industrial use, in the form of cooling water requirements for the adjacent power plant. With water right amendments, the project could also provide water to downstream industrial demands and environmental uses.
The infrastructure required to implement this strategy includes:
New 48,390 acre-foot earthen dam reservoir.
2016 LCRWPG WATER PLAN 5-151
Lower Colorado Regional Water Planning Group November 2015
A new river intake, pump station, and two 108-inch diameter, 20,600-foot long pipelines, to pump from the river to the reservoir.
Two 108-inch diameter, 100-foot long pipelines, bypassing the pump station to return flows to the river.
Two stilling basins, one in the new reservoir and one in the existing river.
The maximum authorized impoundment amount for this reservoir is 48,390 acre-feet. Currently, the Baylor Creek permit only authorizes diversion and storage of water appropriated under the Highland Lakes water rights and use of that water for industrial purposes (steam-electric cooling). In order to develop a firm yield from the project, multiple permit amendments would be needed to the existing Baylor Creek permit and perhaps other LCRA ROR permits to authorize diversion and storage of ROR flows. Based on information provided by LCRA, the firm yield from this strategy could be 18,000 acre-feet per year, starting in the year 2040. This assumes the Lane City off-channel reservoir (currently under construction as of early 2015) is completed and online.
Cost Implications of Proposed Strategy
Costs for this strategy were developed based on information provided by LCRA, and the Texas Water Development Board (TWDB) Cost Estimating Tool. Consistent with the tool, all costs are given in September 2013 dollars.
The following table shows the estimated costs associated with this strategy.
Table 5-118: LCRA Alternative Baylor Creek Reservoir Cost
Total Construction
Cost
Total Capital Cost
Largest Annual
Cost
Unit Cost ($/ac-ft)
$130,000,000 $179,000,000 $16,200,000 $900
Environmental Considerations
The Baylor Creek Reservoir would rely on capturing available river flows for its yield. Thus environmental impacts compared to a reservoir on the Colorado River should be negligible.
This reservoir has limited environmental impact as diversions would be made under amended existing rights. The LCRA off-channel reservoir strategies (Lane City, Mid-Basin, and Excess Flows OCRs) allow for releases of water for improved water quantity and quality for environmental uses. This strategy could potentially remove up to 18,000 ac-ft/yr from the Colorado River that otherwise might not have been captured (See Section 5.5.3 for additional information).
Refer to Chapter 1, Appendix 1A, for the complete list by County of threatened and endangered species in the Lower Colorado Regional Water Planning Area. These species may need to be considered during construction of infrastructure.
2016 LCRWPG WATER PLAN 5-152
Lower Colorado Regional Water Planning Group November 2015
Agricultural & Natural Resources Considerations
The construction of the Baylor Creek Reservoir will lessen the need to send Highland Lakes’ water to customers near the coast and could improve agricultural water reliability and efficiency. The new reservoir will increase LCRA’s operational flexibility, which, in turn, has the potential to enhance the availability of freshwater to the region, including farmlands, managed waterfowl habitat and coastal wetlands. This project could potentially provide up to 18,000 ac-ft/yr of water for agriculture purposes, depending on firm customer needs.
5.3.1.6 Aquifer Storage and Recovery (ASR) Carrizo-Wilcox
This strategy utilizes surface water that is diverted from the Colorado River and treated at a surface water treatment facility. The treated water would either be delivered to meet existing demands, or diverted to aquifer storage for later recovery and use. A firm yield of 5,048 ac-ft/yr was determined for this strategy, beginning in 2040, which assumes the water is diverted when river flows exceed immediate water demands. It is assumed that the diversion point would be located in Bastrop County with the ASR wells located in an adjacent aquifer, but implementation of this strategy could occur at a more downstream diversion point as well.
The volume of surface water diversions is based on the October 2014 Colorado River basin water availability model. This project assumed the diversion would be a new appropriation, and thus a junior water right, and subject to yield determination from the TCEQ Colorado River WAM, rather than the Region K Cutoff Model, and that the TCEQ SB3 environmental flow standards apply to the permit. To create a firm supply, surface water flows are diverted when available, treated, and either delivered directly for use or stored in an adjacent aquifer for subsequent recovery. ASR wells will be required regardless of the aquifer that is used for storage. In the event the Carrizo-Wilcox Aquifer is used, the proposed ASR wells would likely be located in Bastrop County.
The source of the water for the project is assumed to be the Colorado River through a raw water intake in Bastrop County. Raw water would be conveyed to a new water treatment plant. Components of the WTP include an inline rapid mix, backwash supply pump station, recarbonation basin, gravity thickener, clarifier, oxidant/disinfection contactor, backwash waste equalization basing, centrifuges, all chemical storage and feed systems, media filters, treated water storage, high service pump station, and operations and maintenance buildings. To satisfy the water demand, a high service pump station would feed treated water through a 5 mile, 24-inch diameter pipeline along the SH-71 right-of-way, to a currently undetermined delivery point. The pipeline diameter was designed to maintain flow velocities between 5 and 7 feet per second. Treated water in excess of the demand would be sent to the ASR wellfield. A medium service pump station and ground storage tank are required at both the water treatment plant and the ASR wellfield. The dual locations are required to meet the peak day demands at all times. The ASR wellfield, would include nine (9), 6-inch diameter wells that are spaced at 0.5 mile intervals. Cost Implications of Proposed Strategy
2016 LCRWPG WATER PLAN 5-153
Lower Colorado Regional Water Planning Group November 2015
Costs for this strategy were developed using the Texas Water Development Board (TWDB) Cost Estimating Tool. Consistent with the tool, all costs are given in September 2013 dollars. The following table shows the estimated costs associated with this strategy. Table 5-119: LCRA Aquifer Storage and Recovery Cost
Total Construction
Cost
Total Capital Cost
Largest Annual
Cost
Unit Cost
($/ac-ft)
$28,162,000 $39,590,000 $5,430,000 $1,076.00
Environmental Considerations
Any diversion of surface water as a new appropriation will be subject to TCEQ’s SB3 environmental flow standards which are considered adequate to support a sound ecological environment, to the maximum extent reasonable, considering other public interests and other relevant factors. Therefore, since diversions will be subject to the standards, this strategy is not expected to significantly adversely impact environmental flows because diversions are not likely to be possible at times that could impair water quality or other environmental flow considerations.
Limited impacts are anticipated to instream flows and freshwater inflows, due to the junior status of the diversion. Compliance with target bay and estuary inflows would be slightly reduced, although applied SB3 environmental flow requirements are met. The environmental impacts of this strategy on the Colorado River and Matagorda Bay were re-evaluated in this round of planning. Discussion of the methodology behind the impact analysis is in Section 5.5. Results of the impact comparison are provided in Appendix 5D.
Refer to Chapter 1, Appendix 1A, for the complete list by County of threatened and endangered species in the Lower Colorado Regional Water Planning Area. These species may need to be considered during construction of infrastructure.
Agricultural & Natural Resources Considerations
The implementation of this strategy would lessen the need to send Highland Lakes’ water to potential customers in the Bastrop County area and could improve agricultural water reliability and efficiency. This strategy could increase LCRA’s operational flexibility, which, in turn, has the potential to enhance the availability of freshwater to the region, including farmlands, managed waterfowl habitat and coastal wetlands, of up to 5,048 ac-ft/yr. 5.3.1.7 Enhanced Recharge
Enhanced recharge is considered as a potential water management strategy for the LCRA for agricultural shortages in the lower Colorado River Basin. Enhanced recharge can be accomplished in a variety of ways: spreading basins, vadose zone injection wells, direct injection wells, and aquifer storage and recovery (ASR) wells. Only spreading basins are considered in this strategy.
2016 LCRWPG WATER PLAN 5-154
Lower Colorado Regional Water Planning Group November 2015
This strategy consists of diverting water from the Colorado River, when available, and pumping to one or more recharge basins located in the recharge zone of the Gulf Coast aquifer. The recharge basins would be designed and maintained to promote rapid entry of the water in the basins into the aquifer. The source of recharge water could be a low reliability junior water right, or it could be from one of LCRA’s senior ROR water rights, particularly in the winter months when water is not otherwise being diverted. If a new junior water right is used, environmental flow requirements and senior water rights must be satisfied before water can be diverted from the river, resulting in very low reliability as a direct supply. Water for recharge is not clearly defined by the water code as a beneficial use and if existing permits are used, amendments are likely needed to add recharge as an authorized use. During drought conditions, when backup surface water supplies are intermittent, the water stored underground by this project would be available to groundwater users in the area and also to wells that could augment canal flows. This project provides a place to store water diverted during high flows, prevents evaporative losses of the stored water, and provides a distribution system of the water through the groundwater aquifer. The strategy would consist of:
Providing engineered rapid infiltration basins and providing recovery wells utilizing existing diversions and canal systems.
Water conveyance capacity for the proposed recharge basins was evaluated for LCRA by a consultant and estimated an aquifer transmission capacity of 10,000 ac-ft/yr.
The following infrastructure was proposed.
Four (4) recharge basins 600’ wide x 1,500’ long x 4’ high
Simple Intake Structure with pipe extending to existing canal
Two (2) Pump Stations
Approximately 0.5 miles of transmission piping and appurtenances
Combination of 28 new and 27 leased wells
Cost Implications of Proposed Strategy
A capital cost estimate was provided by LCRA from a preliminary feasibility analysis. The capital cost estimate was in August 2011 dollars. In order to provide a comparable cost consistent with other strategies in this report, costs were adjusted to September 2013 dollars using the ENR Construction Cost Index. The capital cost for this strategy is primarily driven by the cost of the recharge basins and well fields.
Costs for this strategy were developed using the Texas Water Development Board (TWDB) Cost Estimating Tool. Consistent with the tool, all costs are given in September 2013 dollars. The following table shows the estimated costs associated with this strategy.
2016 LCRWPG WATER PLAN 5-155
Lower Colorado Regional Water Planning Group November 2015
Table 5-120: LCRA Alternative Enhanced Recharge Cost
Total Construction
Cost
Total Capital
Cost
Largest Annual
Cost
Unit Cost
($/ac-ft)
$37,352,000 $53,504,000 $8,335,000 $834.00
Environmental Considerations
If a new junior water right is used, instream flow and freshwater inflow requirements would be met before water can be diverted, thereby limiting impacts to the environment. Pulse flows in the river could potentially be reduced by up to 10,000 ac-ft/yr (See Section 5.5.3 for additional information).
Agricultural & Natural Resources Considerations
Positive impacts of up to 10,000 ac-ft/yr to agriculture are expected as a result of implementing this strategy, due to the ability to provide water supply for agricultural purposes that can be accessed during drought periods.
5.3.2 City of Austin Alternative Strategies
The City of Austin is looking at a number of strategies as a result of the work done by their Water Resources Planning Task Force in 2014. Two of the strategies they would like to keep in consideration, but did not wish to include as recommended strategies.
5.3.2.1 COA Brackish Groundwater Desalination
This strategy includes the extraction of brackish groundwater from down-dip brackish zone of the Edwards Aquifer, in the southeast area of Austin, near US Highway 183 and SH 130. Another potential source of brackish groundwater for consideration includes the Carrizo/Wilcox aquifer. This strategy will require a desalination plant, drilling and completion of 21 production wells and 8 disposal wells, and extensive land purchase. This strategy is expected to deliver approximately 5,000 acre-feet per year, once implemented.
The projected yield from the strategy is shown in the following table.
Table 5-121: COA Alternative Brackish Groundwater Desalination Project Yield
Water Management Strategies (ac-ft/yr)
2020 2030 2040 2050 2060 2070
0 5,000 5,000 5,000 5,000 5,000
2016 LCRWPG WATER PLAN 5-156
Lower Colorado Regional Water Planning Group November 2015
Cost Implication of Proposed Strategy
The cost of this strategy was estimated using the Texas Water Development Board (TWDB) Cost Estimating Tool. A source water TDS of 3,000 mg/L is assumed for cost calculations.
The following table shows the estimated costs associated with this strategy. All costs are given in September 2013 dollars.
Table 5-122: COA Alternative Brackish Groundwater Desalination Costs
Total Construction
Cost
Total Capital
Cost
Largest Annual
Cost
Unit Cost ($/ac-ft)
$38,672,000 $54,582,000 $7,613,000 $1,523.00
Environmental Considerations
Appropriate permits need to be obtained for disposal of concentrate brine. The strategy will require obtaining a permit from Baron Springs/Edward Aquifer Conservation District (BS/EACD). If water volumes for this strategy stay within the MAG, negligible impacts to aquifer levels and springflows are expected.
Refer to Chapter 1, Appendix 1A, for the complete list by County of threatened and endangered species in the Lower Colorado Regional Water Planning Area. These species may need to be considered during construction of infrastructure.
Agricultural & Natural Resources Considerations
No impact to agricultural resources is expected as part of this strategy.
5.3.2.2 COA Reclaimed Water Bank Infiltration to Colorado Alluvium
This storage strategy consists of using an infiltration basin to recharge the local Colorado Alluvium formation. Water in the Colorado Alluvium formation would be available for recapture, treatment and use by the City of Austin.
For this strategy, treated effluent from the South Austin Regional Wastewater Treatment Plant (SAR WWTP) is proposed as the water source. The effluent would be discharged into an infiltration basin where the water would be spread over the local Colorado Alluvium formation as a form of subsurface storage. Alluvial wells along the Colorado River would be constructed to recapture the water from the alluvium formation. The recaptured water would be pumped to a Water Treatment Plant (WTP) for treatment and distribution into the water system.
The application of this strategy would require the completion of several tasks. Significant land purchases would be required to construct the infiltration basin and alluvial wells. An infiltration basin and alluvial wells will have to be constructed for withdrawal of the water from the local Colorado Alluvium
2016 LCRWPG WATER PLAN 5-157
Lower Colorado Regional Water Planning Group November 2015
formation. The recaptured water will have to be pumped to the WTP requiring construction of a pump station, piping, and easements.
This strategy will have an implementation time of 5 to 10 years. The estimated yield is shown in the following table.
Table 5-123: COA Alternative Reclaimed Water Bank Infiltration Project Yield
Water Management Strategies (ac-ft/yr)
2020 2030 2040 2050 2060 2070
0 15,000 20,000 25,000 30,000 30,000
Cost Implications of Proposed Strategy
Costs for this strategy were developed based on background information provided by the City of Austin, and the Texas Water Development Board (TWDB) Cost Estimating Tool. Consistent with the tool, all costs are given in September 2013 dollars.
The capital cost for this strategy is primarily driven by the purchase of the required easements/land and construction of the proposed infiltration basin, alluvial wells, reclaimed pump station and pipelines.
The following table shows the estimated costs associated with this strategy.
Table 5-124: COA Alternative Reclaimed Water Bank Infiltration Costs
Total Construction
Cost
Total Capital Cost
Largest Annual
Cost
Unit Cost ($/ac-ft)
$108,675,000 $151,846,000 $12,706,000 $424.00
Environmental Considerations
The reclaimed water bank infiltration strategy will require treatment and other environmental permitting.
No environmental impacts are assumed for the reduced effluent flow from the SAR WWTP as a result of the effluent being diverted to the local Colorado Alluvium formation. Use of the effluent flow from the SAR WWTP will lower the effluent flow available for the City of Austin water reuse system. See Table 5-31 for the volume of return flows to the Colorado River after reuse strategy volumes are accounted for.
Refer to Chapter 1, Appendix 1A, for the complete list by County of threatened and endangered species in the Lower Colorado Regional Water Planning Area. These species may need to be considered during construction of infrastructure.
Agricultural & Natural Resources Considerations
No impacts to agriculture or natural resources are expected as a result of implementing this strategy.
2016 LCRWPG WATER PLAN 5-158
Lower Colorado Regional Water Planning Group November 2015
5.3.3 Other Alternative Water Management Strategies
The following two strategies are included in the 2016 Region K Water Plan as alternative strategies for the City of Buda. 5.3.3.1 HCPUA Pipeline (Alternative)
This strategy is described in detail in the Groundwater Importation section of this report as a recommended strategy. See Section 5.2.4.3.2 for additional information. This same strategy is included here as an alternative strategy. The only difference is for this alternative strategy, the amount of available groundwater is assumed to be greater, providing a larger yield for the WUG recipients of water from the project. This results in a greater size for the overall project and a better unit cost per acre-foot of water.
The following table below lists the projected water use of this strategy.
Table 5-125: Alternative HCPUA Pipeline Project Yield
WUG Name County River
Basin Importing From Water Management Strategies (ac-ft/yr)
Region County Aquifer 2020 2030 2040 2050 2060 2070
The following table below describes the estimated costs for this strategy. The unit cost decreases in the alternative version due to economy of scale for a larger overall project.
Table 5-126: Alternative HCPUA Pipeline Project Costs
Detailed information for this strategy is included in the previously mentioned section, and also in the 2016 South Central Texas Regional Water Plan.
5.3.3.2 Direct Potable Reuse
The City of Buda (City) has contracted with the consulting engineer responsible for design of the Buda WWTP Phase III Expansion project to perform a Feasibility Study for evaluation of direct potable water reuse (DPR) alternatives. A draft Feasibility Study Report was submitted in May, 2015 defining feasibility, anticipated treatment process, proposed improvements, regulatory requirements, and planning-level cost estimates for a potential 1.5 MGD to 2 MGD Direct Potable Reuse project. This reuse project would be in addition to the non-potable direct reuse project recommended for the City, as discussed in Section 5.2.5.4.2.
2016 LCRWPG WATER PLAN 5-159
Lower Colorado Regional Water Planning Group November 2015
As part of the feasibility study phase, the City of Buda met with all TCEQ staff involved in approval of DPR projects. This meeting confirmed the regulatory feasibility of the proposed DPR project and provided definition of the procedures required by TCEQ for implementation. The City of Buda plans to conduct 12 months of detailed effluent water quality sampling in 2016 in accordance with TCEQ’s requirements, in order to finalize the Feasibility Study Report for the City’s use in a decision on whether to proceed with DPR. If this decision (anticipated in 2017) is to proceed with development of a potential DPR project, the City will then proceed with pilot study design and pilot testing, to be followed by full scale design and construction of DPR facilities. Pilot testing through construction would take place over a 5 year period.
This strategy is expected to provide 2,240 ac-ft/yr of potable water supply, beginning in the 2020 decade and extending through the planning period to 2070.
Cost Implications of Proposed Strategy
Based on the Feasibility Study Report assumptions and preliminary findings, the cost estimate includes a DPR WTP with 2.0 MGD capacity; modifications at the Buda WWTP site including effluent transfer pumping facilities and biological denitrification process; facilities for treatment and disposal of wastes from the DPR WTP treatment process under a TPDES permit; and offsite finished water pipeline, storage, and blending facilities. In September 2013 values, the probable cost for City to develop this DPR project is approximately $26,779,000. This strategy will have a total annual cost (including operations and maintenance) of approximately $2,941,000 per year. The opinion of probable unit cost of reclaimed water is $1,313 per ac-ft.
Environmental Considerations
If the City of Buda decides to proceed with implementation of Direct Potable Reuse, it is anticipated that residuals from the DPR WTP treatment process would be further treated, then co-disposed with the Buda WWTP effluent under a TPDES permit. As a result, the Total Dissolved Solids (TDS) concentration of the WWTP effluent return flow to the Plum Creek watershed would be increased, but would remain within water-quality based limits authorized by TCEQ through the TPDES permitting process. Regulated constituents (chloride, sulfate) concentrations in the return flow to Plum Creek would also be increased, subject to TPDES permit limits.
For discharge to Andrews Branch, TCEQ’s water quality modeling method is based on existing ambient segment concentrations of 867.8 mg/L TDS, 117.5 mg/L chloride, and 88 mg/L sulfate, and segment criteria of 1,120 mg/L TDS, 350 mg/L chloride, and 150 mg/L sulfate. Preliminary evaluations done for the DPR Feasibility Study indicated that TPDES limits of 1,314 to 1,324 mg/L TDS and 178 mg/L sulfate may be needed for disposal of residuals from a proposed 2 MGD DPR WTP treatment process through co-discharge with 1.5 MGD of WWTP effluent. TPDES limits did not appear to be required for chloride. These anticipated discharge parameters will be better defined through the 12-month period of effluent water quality sampling planned to be performed during 2016. The required post-treatment for DPR WTP residuals and resulting blended discharge water quality parameters will be estimated based on the effluent water quality data.
2016 LCRWPG WATER PLAN 5-160
Lower Colorado Regional Water Planning Group November 2015
The City discharges treated effluent to tributaries of Plum Creek, and by increasing the effluent reuse, will reduce the effluent discharge to natural waterways by up to 2,240 ac-ft/yr.
Refer to Chapter 1, Appendix 1A, for the complete list by County of threatened and endangered species in the Lower Colorado Regional Water Planning Area. These species may need to be considered during construction of infrastructure.
Agricultural & Natural Resources Considerations
No impacts to agriculture are expected, as a result of implementing this strategy.
5.4 CONSIDERED, BUT NOT RECOMMENDED OR ALTERNATIVE STRATEGIES
The TWDB rules require the RWPG to evaluate all potentially feasible water management strategies to meet the Region’s identified demand deficits. Feasibility is based on evaluation criteria established by the TWDB and the RWPG including project cost, unit cost, yield, reliability, environmental impact, local preference, and institutional constraints. Several water management strategies were identified and evaluated in terms of the potential impact on the Lower Colorado Region as a whole. After initial evaluation, some water management strategies were determined by the RWPG to not be suitable for consideration at this time. These strategies are discussed in the following sections.
In-Channel Dams in Lower Basin The use of small in-channel inflatable dams on the main stem of the Lower Colorado River has previously been considered as a method to add additional system storage in the Lower Basin and to improve system operations and diversions for water systems in this area. A fairly detailed study of this strategy was conducted by the LCRA in 1997 which evaluated the feasibility of constructing various sized small channel dams using inflatable rubber “bladders” within the Lower Colorado River between Bastrop and Wharton.
The dams which were evaluated consisted of different sizes and designs ranging from approximately 3 to 10 feet in height depending on the channel characteristics at each location considered. Preliminary site locations were evaluated based on criteria designed to minimize impacts to the environment and enhance potential benefits by containing lake elevations inside the existing channel, allowing safe passage of floods by deflating the bladder and folding the dam into the channel during flood events, and providing positive impacts to local communities through enhanced water supply and recreation opportunities. System benefits were estimated in the previous study to potentially range from a combined 10,000-25,000 acre-feet/year through improvements in the flexibility of releases from the Highland Lakes and by allowing for reduced operational losses in the system.
The LCRWPG is interested in conducting future additional studies for this strategy in order to further evaluate the potential dam site locations and their respective water supply and operational benefits, and to quantify the expected environmental impacts of these in-channel dam structures as well as potential impacts to downstream water rights holders. Known environmental issues include the creation of: 1) increased fluctuation of water levels in the river, 2) temporary obstruction to fish migration, 3) potential barriers to sediment transport, and 4) possible eutrophication complications. At the same time, there are potential desirable environmental features created by these potential structures, such as providing: 1) locally increased river pool depths, 2) reduced extreme temperatures during summer and winter seasons,
2016 LCRWPG WATER PLAN 5-161
Lower Colorado Regional Water Planning Group November 2015
3) increased habitat variability, and 4) other smaller positive impacts. Further study is needed to determine if some, if not all, of the various issues associated with this future potential water management strategy could be mitigated.
Surface Water Infrastructure Expansion This water management strategy was scoped to be considered for water user groups or wholesale water providers that needed to expand/improve their infrastructure in order to utilize existing available surface water via current contracts or water rights to increase their water supply.
This strategy was included in the Scope of Work to be used as needed by water user groups, but in the case of the City of Austin, they determined to expand their distribution system rather than expand or provide new transmission capabilities.
Reduced Lake Evaporation by City of Austin The water management strategy consisted of applying a NSF-approved, biodegradable product to cover the surface of lakes to reduce and/or minimize water losses due evaporation.
The product is made from insoluble fatty acids from coconuts and palm, and comes in a powder form which biodegrades within 72 hours. Literature on the product and process indicates that evaporation could be reduced by 20 to 30%. The product would need to be regularly applied to the surface of lakes, using a spreading process such as application of the stern of a motor boat. It was expected that this strategy would deliver 1,000 acre-feet per year once implemented.
Issues that need to be considered as part of this strategy is the impact on the lake environment by limiting oxygen transfer between air and water, impact on lake temperature, and impact on recreational boaters. Further study would be required.
Move South Austin Regional (SAR) WWTP Discharge above Austin Gauge by City of Austin This water management strategy consisted of relocating a portion of the SAR WWTP treated effluent discharge to upstream of the Colorado River flow gauge, Austin Gauge. The gauge is currently located near US 183 bridge over the Colorado River, and downstream of the Longhorn Dam.
The goal is to use a portion of the discharge flow to meet environmental flow requirements at the Austin Gauge. LCRA’s Water Management Plan (WMP) requires LCRA to maintain a 46 cubic feet per second (cfs) minimum flow at the gauge. The impact of this strategy would be realized when maintaining environmental flow at this gauge is the controlling factor in LCRA releases from upstream reservoirs (Highland Lakes). Currently, the City of Austin has already constructed a reclaimed water line from the SAR WWTP to Roy Guerrero Park and Krieg Fields for irrigation. The Krieg Fields reclaimed water line could be used to discharge flow below Longhorn Dam.
After preliminary review, the City of Austin removed this strategy from consideration.
2016 LCRWPG WATER PLAN 5-162
Lower Colorado Regional Water Planning Group November 2015
Construct Goldthwaite Channel Dam in Mills County This strategy was considered by the Region K planning group, but was removed from the final adopted 2016 Region K Water Plan as a recommended strategy following the public comment period on the Initially Prepared Plan. To meet TWDB Scoping requirements, the details of the original analysis are provided below.
A strategy involving the construction of a new channel dam below the City’s existing diversion structure has been included in previous Region K Plans.
For this strategy, a channel dam below the City’s existing diversion structure would be constructed on the Colorado River. This dam structure would be located downstream of the City’s existing structure. The channel dam would be approximately 10-20 feet in height and the construction of this structure would provide a source of water for the City’s diversion pumps, allowing the City to continue providing service for a longer period without flow in the river. The water impounded behind this dam would provide a reasonably consistent source of water from which to pump, as well as an additional 400-1,100 ac-ft/yr when available; TCEQ WAM Run 3 modeling with SB3 environmental flow requirements applied showed that this supply would not be a firm supply during the drought-of-record. The City would consider entering into a partnership with the Fox Crossing Water District, LCRA, or private landowners to construct the channel dam. The actual size and location of this structure should be determined by engineering studies, this report only contains estimated values.
There is no firm yield associated with this strategy, as shown in the following table.
Table 5-127: City of Goldthwaite Channel Dam Project Firm Yield
WUG Name County River Basin
Water Management Strategies (ac-ft/yr)
2020 2030 2040 2050 2060 2070
Goldthwaite Mills Colorado 0 0 0 0 0 0
Capital costs for this strategy were developed based on scaling up the costs from the 2011 Region K Plan to September 2013 dollars, using the Construction Cost Indices in the Texas Water Development Board (TWDB) Cost Estimating Tool. The tool was also used to generate the project cost and annual cost. Since the firm yield is assumed to be zero, there is no unit cost given.
The following table shows the estimated costs associated with this strategy.
Table 5-128: City of Goldthwaite Channel Dam Cost
Total Construction
Cost
Total Capital
Cost
Largest Annual
Cost
Unit Cost ($/ac-ft)
$2,056,000 $3,583,000 $285,000 N/A
The following is a summary of the advantages and disadvantages for this alternative:
2016 LCRWPG WATER PLAN 5-163
Lower Colorado Regional Water Planning Group November 2015
Advantages
Operation of the City’s water system would remain the same
Disadvantages
Construction of the dam would require acquisition of land or the rights to inundate land Construction of a channel dam would require a water rights permit amendment Construction of a channel dam may have environmental impacts Future sedimentation of the reservoir may become an issue
Environmental Considerations
No downstream water rights would be affected due to the junior status of the reservoir, and compliance with target bay and estuary inflows would not be reduced, with applied SB3 environmental flow requirements being met. The environmental impacts of this strategy on the Colorado River and Matagorda Bay were re-evaluated in this round of planning.
City of Goldthwaite – San Saba Raw Water Supply Line This strategy was considered, but not recommended, because construction was completed during the planning process. The yield generated by this project is included in the 2016 Region K Water Plan as an existing supply in Chapter 3. To meet TWDB Scoping requirements, the details of the original analysis are provided below.
This strategy involves diverting raw water from a TCEQ-approved City of San Saba third diversion point on Mill Creek, downstream of Mill Pond. Mill Creek is a spring-fed creek in San Saba County. The water will be conveyed to the City of Goldthwaite’s existing raw water transmission infrastructure north of the Colorado River.
The infrastructure required to implement this strategy includes:
New intake structure.
13.4 miles of raw water transmission pipeline.
According to the Water Conservation and Drought Survey response, the estimated firm yield from this strategy is 245 acre-feet per year, as shown in the following table.
Table 5-129: City of Goldthwaite Raw Water Supply Line Yield
Lower Colorado Regional Water Planning Group November 2015
Costs for this strategy were developed based on bid information, and the Texas Water Development Board (TWDB) Cost Estimating Tool. Costs were developed in September 2013 dollars.
The following table shows the estimated costs associated with this strategy.
Table 5-130: City of Goldthwaite Raw Water Supply Line Costs
Total Construction
Cost
Total Capital Cost
Largest Annual Cost
Unit Cost ($/ac-ft)
$1,837,000 $2,911,000 $262,000 $1,069.00
Environmental Considerations
During construction of this pipeline, the contractor minimized impacts to nests or migratory bird species, in accordance with the Migratory Bird Treaty Act. The contractor also utilized best management practices to minimize impacts to mussel habitat downstream of the new intake location.
City of Wharton – Water Supply Strategy
The current drought and the diminishing reliability of additional groundwater supplies have combined to cause the City of Wharton (City) to proactively develop a water supply strategy that could enable the City to meet the water demands for area growth not otherwise planned for in regional water planning. The City believes that its proximity to the Houston area, the Texas Gulf Coast, and the new I-69 corridor could increase its municipal and industrial water demands during the next fifty years beyond those otherwise anticipated in regional water planning.
Components of the strategy include: 1. Converting an existing large groundwater irrigator to
surface water by making up to 20,000 AFY of surface water available through the combination of 10,000 AF of new In-Channel Detention (ICD) in the Colorado River to work in tandem with 10,000 AF of new Off Channel Storage (OCS).
2. Constructing a new municipal well field and pipeline outside of the City’s current ETJ to replace its existing wells and meet the City’s water needs for the next 50 years.
3. Treatment and reuse of 1,100 AFY of wastewater
effluent to develop an Aquifer Storage and Recovery (ASR) project to help mitigate future increases in its use of Gulf Coast Aquifer groundwater.
2016 LCRWPG WATER PLAN 5-165
Lower Colorado Regional Water Planning Group November 2015
This strategy proposes to yield the following water supply amounts between 2020 and 2070. The estimated amount of irrigation water may require additional study to determine the actual annual amount, based on availability:
Table 5-131: City of Wharton Water Supply Strategy Yield
WUG Name County River Basin Source Water Supply Strategy (ac-ft/yr)
26,603 26,603 26,603 26,603 26,603 26,603 Cost implications of Proposed Strategy Costs for this strategy were developed based on bid information, and the Texas Water Development Board (TWDB) Cost Estimating Tool. Costs were developed in September 2013 dollars.
Table 5-132: City of Wharton Water Supply Strategy Costs
WUG Supply Total Capital Largest Unit Cost Cost Annual Cost ($/ac-ft/yr)
This project was not developed with sufficient detail in time to be considered for inclusion as a recommended strategy in the 2016 Region K Water Plan. It has been included here as a developing strategy in recognition of the ongoing work being accomplished to make it possible for consideration as either a future amendment to the 2016 plan or as a recommended strategy in the 2021 plan. The City recognizes there are numerous studies, assessments and agreements that would be necessary to fully implement all of the components of this strategy. The lack of feasibility of any one or more component may not preclude the development of other components of the strategy.
5.5 ENVIRONMENTAL IMPACTS OF WATER MANAGEMENT STRATEGIES
Sufficient water to meet environmental needs and to maintain a sound ecological environment in the Colorado River and Matagorda Bay is important to the economic and environmental health of Region K. As part of the development of Chapter 5 for the 2016 Region K Plan, new water management strategies or changes to certain water management strategies from the 2011 Region K Plan were recommended. In addition, strategies that would require new or amended water rights were evaluated while incorporating
2016 LCRWPG WATER PLAN 5-166
Lower Colorado Regional Water Planning Group November 2015
the new TCEQ environmental flow requirements that were determined as part of the Senate Bill 3 (SB3) process.
As part of the SB3 process, the Colorado/Lavaca River and Matagorda Bay Basin Expert Science Team (BBEST) studied available data and developed a set of recommendations for the freshwater inflows that would be needed to maintain a sound ecological environment in Matagorda Bay. Table 5-133 compares the BBEST recommended freshwater inflow components and the attainment frequencies needed to maintain a sound ecological environment with WAM Run3 attainment frequencies. WAM Run3 provides information on the amount of unappropriated water available for meeting environmental flow needs and other demands assuming full use of water rights in the basin with no return flows. This information shows that with full use of water rights that the attainment frequencies for the 5 flow regimes will not be met under a WAM Run3 regime which represents a worst case scenario in the exercise of existing water rights in the Colorado River Basin. The members of the Region K water planning group are concerned about meeting environmental needs to maintain a sound ecological environment and we recommend that the planning group take proactive steps during the next round of planning to incorporate strategies to address this shortfall. The planning process is not currently designed to fully address environmental needs. Table 5-133: Comparison of BBEST recommendations for Matagorda Bay Inflows from Colorado River Basin to WAM Run3 values
Regime Title BBEST Recommended Value WAM Run3 Calculated Value Attainment Frequency for Threshold Regime
100% 65.5%
Attainment Frequency for MBHE1 Regime
90% 35.6%
Attainment Frequency for MBHE2 Regime
75% 16.9%
Attainment Frequency for MBHE3 Regime
60% 11.9%
Attainment Frequency for MBHE4 Regime
35% 8.5%
Coefficient of Variation for Volume
1.4 to 1.5 million acre-feet 877,000 acre-feet
Coefficient of Variation for Long-term Volume
Above 0.8 1.3
5.5.1 Criteria Used
The Region K Cutoff strategy model was used for the evaluation of the new or changed condition water management strategies. The assumptions used for the strategy model are listed in Chapter 3, Appendix 3B. For new or changed condition water management strategies in the 2016 Region K Plan, the flow criteria (recommended guidelines) presented in the LSWP Environmental Studies on both the Lower Colorado River, Texas Instream Flow Guidelines and the Matagorda Bay Health Evaluation was used. The use of these studies for the environmental impact analysis does not mean the LCRWPG endorses the
2016 LCRWPG WATER PLAN 5-167
Lower Colorado Regional Water Planning Group November 2015
results of the studies. These results meet the TWDB’s best available site-specific definition of environmental criteria, which is the reason for their use.
5.5.1.1 Freshwater Inflow Criteria
The following tables are taken from the Matagorda Bay Health Evaluation as part of the LSWP Studies to help define the criteria used for environmental impact analysis of the freshwater inflows to Matagorda Bay (Control Point M10000 in the Region K Cutoff model). An exhibit showing control point locations can be found in Appendix 5D.
Table 5-134: Inflow Categories and Range of Inflow Criteria
Table 5-134 above shows the different levels of criteria and gives a description of what each level of flow can provide to the bay. There are three categories of criteria: long-term, minimum, and the MBHE inflow regime, which consists of four levels of increasing flow volumes.
Table 5-135 shows specific numerical flow volumes for the four levels of the MBHE inflow regime, which are separated into three “seasons.” Achievement guidelines for the percentage of time a particular MBHE level should be met are also provided. It should be noted that the achievement guidelines are provided as information, but that the environmental impact analysis that was done for the water management strategies as part of the 2016 Region K Plan did not try to determine whether or not a strategy was reasonable based on whether the strategy caused the freshwater inflows to go above or below a particular value. Again, the main comparison for the study was the flow with and without the strategy implemented.
2016 LCRWPG WATER PLAN 5-168
Lower Colorado Regional Water Planning Group November 2015
Table 5-135: Recommended MBHE Inflow Regime Criteria and Proposed Distribution
5.5.1.2 Instream Flow Criteria
The following tables show the Colorado River Instream Flow Criteria that was developed as part of the LSWP Studies to help define the criteria used for environmental impact analysis of the water management strategies on the Colorado River instream flows at various control points downstream of the Highland Lakes. An exhibit showing control point locations can be found in Appendix 5D.
2016 LCRWPG WATER PLAN 5-169
Lower Colorado Regional Water Planning Group November 2015
Table 5-136: Instream Flow Guidelines for the Lower Colorado River Specific to the LSWP (cfs)
Table 5-136 provides the instream flow guidelines (in cfs) for three different categories of flow conditions and four separate reaches downstream of the Highland Lakes. The Austin Reach begins at Control Point I20000 in Travis County (see exhibit in Appendix 5D). The Bastrop Reach begins at Control Point J30000 in Bastrop County. The Columbus Reach begins at Control Point J10000 in Colorado County. The Wharton Reach begins at Control Point K20000 in Wharton County. The three categories of flow are: Subsistence, Base-Dry Conditions, and Base-Average Conditions. The LSWP report also recommends pulse flows, but the modeling used to analyze the environmental impacts is a monthly flow application, which makes it difficult to analyze pulse flows which occur on a daily level rather than monthly. The Austin Reach only has a Subsistence Flow guideline due to the limited locations of return flows downstream of the Longhorn Dam.
Table 5-137 provides the instream flow guidelines in ac-ft/yr.
Table 5-137: Instream Flow Guidelines for the Lower Colorado River (ac-ft/yr)) JAN FEB MAR APR MAY JUN JUL AUG SEP OCT NOV DEC
Lower Colorado Regional Water Planning Group November 2015
The instream flow impact analysis was focused on a comparison of the percentage of time the model met these values, both with and without the strategy was implemented. The impact is shown as the difference between the two scenarios, rather than how often either the base model or the model with the strategy met the criteria.
5.5.2 Strategies Carried Forward from the 2011 Regional Plan
Many of the strategies presented in the 2016 Region K Plan had a quantitative environmental impact analysis performed as part of the 2011 Region K Plan, and a determination was made that re-evaluating the individual strategy for the 2016 Region K Plan would not provide additional beneficial information. Please refer to Appendix 5E for the tabular results of the environmental impact analyses from the 2011 Region K Water Plan.
5.5.3 Environmental Impact of Strategies Added Since 2011 Regional Water Plan
Water management strategies added since the 2011 Region K Plan have not had a quantitative environmental impact analysis performed. For the 2016 Region K Plan, the impact of new strategies was generally quantified up to the full amount of the supply available from the strategy. The planning group acknowledges actual impacts will be lower. The actual impact of any individual strategy is subject to a number of mitigating effects which will likely result in lower impacts than reported in the 2016 Regional Water Plan. Actual impacts of a water management strategy must take into account a number of factors, including:
Current and future Water Management Plans for the Highland Lakes Return flows resulting from the recommended strategy Current water use by the affected water rights Use of a system approach to make diversions from multiple locations Environmental requirements placed on the project And other project-specific items.
2016 LCRWPG WATER PLAN
Lower Colorado Regional Water Planning Group November 2015
APPENDIX 5A
POTENTIALLY FEASIBLE WATER MANAGEMENT STRATEGIES
Table 5A-1: Region K Water Management Strategies Considered and Evaluated
Table 5A-2: Region K Potentially Feasible WMS Screening
2016 LCRWPG WATER PLAN
Lower Colorado Regional Water Planning Group November 2015
APPENDIX 5B
RECOMMENDED AND ALTERNATIVE WATER MANAGEMENT STRATEGY TABLES
2016 LCRWPG WATER PLAN
Lower Colorado Regional Water Planning Group November 2015
APPENDIX 5C
WATER MANAGEMENT STRATEGY COST SUMMARY TABLES
2016 LCRWPG WATER PLAN
Lower Colorado Regional Water Planning Group November 2015
APPENDIX 5D
ENVIRONMENTAL IMPACTS OF NEW STRATEGIES IN THE 2016 REGION K PLAN
2016 LCRWPG WATER PLAN
Lower Colorado Regional Water Planning Group November 2015
APPENDIX 5E
ENVIRONMENTAL IMPACTS OF STRATEGIES FROM THE 2011 REGION K PLAN
2016 LCRWPG WATER PLAN
Lower Colorado Regional Water Planning Group November 2015
APPENDIX 5F
TWDB DB17 REPORTS
WUG Second Tier Needs Summary
WUG Second Tier Needs
WUG Unmet Needs Summary
WUG Unmet Needs
WUG Recommended Water Management Strategies
Recommended Projects Associated with Water Management Strategies
WUG Alternative Water Management Strategies
Alternative Projects Associated with Water Management Strategies