101


2
TABLE OF CONTENTS
1 SUMMARY ...........................................................................................................................4
2 INTRODUCTION .................................................................................................................8
3 LITERATURE STUDY AND DEVELOPMENT OF TREATMENT CONCEPT (WP2) ...........................................................................................................................9
3.1 PW quality and flow.........................................................................................................9 3.2 TOP Water treatment targets..........................................................................................13 3.3 Development of the TOP Water treatment concept .......................................................16
3.3.1 Pre-treatment ...................................................................................................16 3.3.2 Removal of dispersed compounds ..................................................................18 3.3.3 Removal of remaining dissolved compounds .................................................20 3.3.4 Summary of treatment scheme........................................................................24
4 INITIAL FAILURE MODE ANALYSIS (WP2)..............................................................25 4.1 Characterisation of dispersed constituents in produced water .......................................27 4.2 Pre treatment with FIBRA filter.....................................................................................27 4.3 Membrane filtration........................................................................................................28 4.4 In-line adsorption with biological regeneration .............................................................28
5 CHARACTERISATION (WP3).........................................................................................29 5.1 Characterisation of solids and solid suspensions (Dudášová, 2008)..............................29
5.1.1 Surface properties and adsorption studied by the depletion method...............29 5.1.2 Adsorption studied by Quartz Crystal Microbalance......................................31 5.1.3 Single particle suspensions .............................................................................32 5.1.4 Binary and ternary particle suspensions..........................................................34 5.1.5 Produced water particles .................................................................................34
5.2 Characterisation of o/w emulsions .................................................................................35 5.2.1 30 wt% crude oil – lab scale experiments (Silset, 2008) ................................35 5.2.2 600 ppm crude oil – lab scale experiments (Aarhoug, 2008) .........................35 5.2.3 Stability measurements (Aarhoug 2008).........................................................38 5.2.4 Lab-scale hydrocyclone experiments (Silset, 2008) .......................................39
6 PRE-TREATMENT WITH FIBRA (WP2) ......................................................................43 6.1 Background for the FIBRA study ..................................................................................43 6.2 Discussion of results from the failure mode analysis.....................................................44
6.2.1 FIBRA filter module .......................................................................................44 6.2.2 Management of flush water and membrane concentrate.................................45
6.3 Experimental set-up with FIBRA in TOP Water ...........................................................45 6.4 Results from tests with FIBRA ......................................................................................47
6.4.1 Removal of dispersed oil.................................................................................47 6.4.2 Removal of particles .......................................................................................50 6.4.3 Bladder pressure and flow rate........................................................................51 6.4.4 Use of FIBRA as a coalescer ..........................................................................52 6.4.5 Flushing in filtration experiments and characterisation of fibres....................52
6.5 Discussion of tests with FIBRA and recommendation for further study .......................53 6.6 Proposal for flow sheet and layout for a FIBRA process on an off shore platform.......54
6.6.1 Design basis ....................................................................................................54 6.6.2 Proposal for process flow sheet and layout.....................................................55
7 TREATMENT CONCEPT FOR OIL EMULSIONS AND PARTICULATE REMOVAL (WP4) ......................................................................................................................58

3
7.1 Background for the studies in WP4................................................................................58 7.2 Cross-flow microfiltration of analogue PW – effect of operating conditions................58 7.3 Ultrasonic time domain reflectometry for assessing membrane fouling........................61 7.4 Fouling mitigation and control by back-pulsing ............................................................65 7.5 Fouling mitigation and control by ultrasonic-crossflow microfiltration........................69 7.6 Cleaning of fouled ceramic membranes.........................................................................71
7.6.1 Results of cleaning trials .................................................................................74
8 TREATMENT CONCEPT FOR THE DISSOLVED CONSTITUENTS (WP5)..........76 8.1 Background for the studies in WP5................................................................................76 8.2 Selective sorption of dissolved aromatic compounds – screening-tests ........................77
8.2.1 Comparing adsorption of acetic acid on chosen media...................................78 8.2.2 Assessment of adsorption kinetics at low hydraulic retention times ..............79 8.2.3 Assessment of media investigated in screening-tests......................................80 8.2.4 Effect of acetic acid concentration..................................................................81 8.2.5 Effect of salinity on adsorption .......................................................................82 8.2.6 Effect of temperature on adsorption................................................................83 8.2.7 Adsorption kinetics of the modified organoclay.............................................83 8.2.8 Overall conclusions of screening-tests............................................................84
8.3 Selective sorption and biological regeneration in a fluidized bed reactor .....................85 8.3.1 Screening-tests to determine BTX degraders..................................................85 8.3.2 Sorption study of BTX in the FBR without biodegradation ...........................87 8.3.3 Simultaneous sorption and biodegradation of BTX in the FBR .....................88 8.3.4 Off-line biological regeneration of the organoclay in the FBR ......................89
8.4 Overall conclusions from WP5 ......................................................................................89
9 FINAL TECHNOLOGY ASSESSMENT (WP2) .............................................................91 9.1 Discussion of achievements ...........................................................................................91
9.1.1 Objectives........................................................................................................91 9.2 Characterization of produced water ...............................................................................92 9.3 FIBRA filter module ......................................................................................................92 9.4 Filtration module with ceramic membrane ....................................................................92 9.5 In-line adsorption and fluidized bed reactor...................................................................93 9.6 Conclusions from the technology assessment workshop ...............................................93
10 CONCLUSIONS ..................................................................................................................94
11 LIST OF PUBLICATIONS ................................................................................................96
12 REFERENCES.....................................................................................................................98
13 APPENDIX .......................................................................................................................101 13.1 Appendix: Multivariate analysis ..................................................................................101

4
1 SUMMARY The project Treatment of Produced Water, characterisation and new treatment strategies (TOP Water) was initiated by StatoilHydro who contacted NTNU and SINTEF in 2004 with the intention to start a project where produced water (PW) treatment was studied in the perspective of zero harmful discharge and future discharge standards. The project was established as a KMB project (competence building project with user participation) in the PETROMAKS program with financial support from the Norwegian Research council (NRC) and oil and gas industry participants. In addition to StatoilHydro, Shell Technology Norway, TOTAL E&P Norge, ChevronTexaco Energy Technology Company, Aibel, Champion Technologies and DNV have been the industry participants. The aim of the project was to study water treatment technologies that could achieve future discharge standards. These were assumed to be very strict compared to current standards. In the application to the NRC this was quantified as oil in water (OiW) less than 5 ppm. However, the issue was addressed further in the initial phase of the project as discussed below. The TOP Water project was to study characterisation of PW and treatment of PW down stream of the initial well stream separation. This was a broad and loosely defined scope, and the initial task was therefore to define the basis and select cases for further studies (Figure 1).
??
?
Figure 1. Definition of cases and basis for study at the start of TOP Water.
Influent flow and PW quality data were compiled from open literature sources. Treatment technologies used for PW treatment were reviewed based on literature and vendor information. The results were presented in memos (Melin 2005a, b) and a work package report (Helness 2006). The main results are presented in the following sections. Future effluent standards were of course unknown and a task to assess these was performed in TOP Water using the Environmental Impact Factor (EIF). The EIF method is a tool to evaluate the risk of a harmful environmental impact from PW discharges. An EIF value can be calculated for a given case and used i.e. for evaluation of PW treatment options. The calculation of EIF is based on composition and flow for a given PW discharge. In TOP Water the EIF method was reversed and the required composition (concentrations of naturally occurring compounds) to achieve an EIF of 1 were calculated for typical PW discharges (Rye, 2005). The results were compared to the compiled data for influent quality and used both for defining which compounds that should be targeted for treatment and to set project internal goals for a PW effluent quality that

5
would correspond to a zero harmful discharge. The results were reported in a work package report (Helness 2006). The analysis showed that dispersed oil, BETX, naphthalene’s, 2-3 ring PAH, C0-C3 phenols and C4-C5 phenols should be targeted. The average concentration of these compounds in PW discharges on the Norwegian continental self (NCS) in the period 2002 – 2004 are shown in Table 1, together with the values found to correspond to an EIF equal to 1 in the calculations discussed above. The values for a PW discharge of 8000 m3/day were selected as treatment targets for evaluation of technologies in TOP Water.
Table 1. Comparison with average Norwegian continental shelf (NCS) discharge concentrations for 2002-2004.
0.06
1.7
0.025
0.35
2.8
4.6
3000 m3/day
Sum of comp.
0.08
3.5
0.13
1.0
8.6
18
Olf, average
02 – 04
0.02
0.61
0.009
0.13
1.0
1.6
8000 m3/day
Sum of comp.
0.46Aliphatics, (mg/l)
0.01Phenols C4-C5, (mg/l)
0.17Phenols C0-C3, (mg/l)
0.003PAH 2-3 ring, (mg/l)
0.04Naphthalenes, (mg/l)
0.28BTEX, (mg/l)
30000 m3/day
Sum of comp.
Compounds
Based on the selected cases for influent flows and quality and the defined effluent standards, a PW treatment concept was developed as a framework for further study in TOP Water and presented to the project steering committee (Helness 2005, 2006). The treatment concept can be divided in three main sections (Figure 2):
1. Pre-treatment 2. Removal of dispersed compounds 3. Removal of dissolved compounds
For the pre-treatment part of the concept it was chosen to study a fibre filter that is commercially available (Fibra Ltd). The FIBRA filter was chosen because the technology could potentially give removal of both particles and dispersed oil in a compact unit that could be flushed efficiently. Although the focus in TOP Water was to be on pre-treatment, the results were also used to evaluate FIBRA for use in PW treatment with the current discharge standards. For removal of dispersed compounds it was chosen to focus on membranes due to the very low effluent OiW required. A common problem with membranes is reduced capacity or operational problems due to fouling, and fouling of ceramic membranes by dispersed oil and methods for fouling control were chosen for study. Compared to the task on pre-treatment this was a more fundamental study and performed in a PhD. For removal of dissolved compound it was chosen to focus on BTEX and a treatment concept based on selective adsorption of these compounds combined with biological regeneration of the adsorbent. Compared to the other technologies studied, this was testing of an idea to assess if this method could be feasible. The study was performed in a second PhD.

6
Characterisation of the influent is the basis for design and operation of water treatment processes. In TOP Water characterisation of solids and solids suspensions and characterisation of o/w emulsions were studied in two other PhDs and one MSc.
Dischargeto sea
Productionseparator
Pre treatment
HydrocycloneFiber filter
Dispersed oiland solids
Ceramic membranes
Dissolvedcompounds
Adsorption andbiological regeneration
Waste/concentratetreatment
Recycle ofoil and water
Well stream
Gas
Oil
Produced water
Waste
Dischargeto sea
Productionseparator
Pre treatment
HydrocycloneFiber filter
Dispersed oiland solids
Ceramic membranes
Dissolvedcompounds
Adsorption andbiological regeneration
Waste/concentratetreatment
Recycle ofoil and water
Well stream
Gas
Oil
Produced water
Waste
Productionseparator
Pre treatment
HydrocycloneFiber filter
Dispersed oiland solids
Ceramic membranes
Dissolvedcompounds
Adsorption andbiological regeneration
Waste/concentratetreatment
Recycle ofoil and water
Well stream
Gas
Oil
Produced water
Waste
Figure 2. Concept and principle of proposed treatment scheme.
The treatment concept was analysed in a preliminary failure mode analysis (Lapique, 2006) where treatment targets for the individual parts of the concept were defined, and issues for further study were clarified through the discussion on failure modes and failure mechanisms. A more detailed presentation of the results is given in the following sections of the report. The main conclusions from the project were: The PhD and MSc studies on characterisation have identified variables influencing the behaviour of solid suspensions and o/w emulsions:
Asphaltene adsorption changes the surface properties of solid particles. The amount of adsorbed asphaltens depend more on the particle type than the origin of the asphaltenes. Furthermore, asphaltene coating increase the suspensions stability for kaolin, CaCO3, BaSO4, Fe3O4, and TiO2, while it slightly reduce the stability for FeS. The difference in behaviour is suggested to be due to the orientation of the asphaltenes on the particle surface.
The heavy crude oils in the data set are characterised by small droplets, rapid droplet growth and low interfacial elasticity. The low interfacial elasticity makes the oil droplets more susceptible to coalescence. Oils with these properties showed the best removal efficiency in the hydrocyclone experiments.

7
The “intermediate” heavy oils in the data set contain medium amounts of saturates, aromatics and resins and high amounts of asphaltenes and acids. The emulsion behaviour were then determined by a balance between flocculation and coalescence in the system (dependent on composition)
The light crude oils in the data set contain high amounts of saturates, low amounts of asphaltenes and resins and medium amounts of aromatics and acids. These conditions facilitate rapid formation of an elastic o/w interface, reducing or preventing coalescence. Oils with these properties had the poorest removal efficiency in the hydrocyclone experiments.
The results from the study on pre-treatment have shown that the FIBRA filter can remove dispersed oil and indicate that low effluent concentrations for dispersed oil can be achieved with different oil types and influent concentrations covering a range that is normal in produced water. However, low effluent concentrations required a low hydraulic loading rate.
With the three oil types tested, Exxsol D 60, Total B and Seillean, the main significant variables for oil removal measured as removal efficiency were: Bladder pressure, flow and dosage of flocculant.
Interfacial tension and the percentage of saturates in the oil were also found to be significant.
Efficient removal of inorganic particles (kaolin, median diameter 6 µm) was also achieved.
The main concerns for use of FIBRA offshore are the rather low flow rate giving a large footprint and a process with a high number of modules.
The two PhD studies on removal of dispersed and dissolved compounds have lead to an increased knowledge of oil fouling of ceramic membranes and adsorption of BTX with biological regeneration of the adsorbent.
Backpulsing and ultrasonic-crossflow filtration both improved the membrane performance by reducing the fouling rate.
With backpulsing it was shown that external fouling followed by internal fouling was the fouling mechanism for all membrane pore size. Smaller membrane pore size (0.1µm) required shorter frequency, longer duration and lower reversed membrane pressure than the bigger membrane pore size (0.2 µm and 0.5 µm) to obtain higher permeate permeability.
With ultrasound, the efficiency of the technique was dependent on the intensity and wavelengths chosen.
It was demonstrated that the cleaning efficiency of a fouled membrane is very much dependent on the choice of cleaning agents, the sequence in which they are used, and the procedure of the cleaning cycle (i.e. cleaning operating mode).
Further studies are required for a comprehensive assessment and recommendation of cleaning protocols best suited for a specific type of membrane and application (i.e. type of foulants), and to include scaling and the effects of supercritical fluids.
Selective sorption of BTX compounds from wastewater was demonstrated by using an organoclay. This sorbent showed good affinity for BTX compounds and at the same time retained only to a low extent acetic acid from wastewater.

8
Biological regeneration of the organoclay was demonstrated in a FBR by alternating sorption and biological regeneration steps in a time sequence simulating off-line regeneration.
Long-time off-line bio-regeneration experiments indicated that the organoclay bed lost a part of its sorption capacity over time. Possible causes for this phenomenon could be: accumulation of organic compounds and minerals, particle attrition, desorption and biodegradation of the tailoring agent (dimethyl dihydrogenated ammonium chloride).
There are still many unanswered questions regarding the design and use of a system for adsorption and fluidized bed reactor.
2 INTRODUCTION The project Treatment of Produced Water, characterisation and new treatment strategies (TOP Water) was initiated by StatoilHydro who contacted NTNU and SINTEF in 2004 with the intention to start a project where produced water (PW) treatment was studied in the perspective of zero harmful discharge and future discharge standards. The project was established as a KMB project (competence building project with user participation) in the PETROMAKS program with financial support from the Norwegian Research council (NRC) and oil and gas industry participants. In addition to StatoilHydro, Shell Technology Norway, TOTAL E&P Norge, Chevron Texaco Energy Technology Company, Aibel, Champion Technologies and DNV have been the industry participants. The aim of the project was to study water treatment technologies that could achieve future discharge standards. These were assumed to be very strict compared to current standards. In the application to the NRC this was quantified as oil in water (OiW) less than 5 ppm. However, the issue was addressed further in the initial phase of the project as discussed below. The TOP Water project was to study characterisation of PW and treatment of PW down stream of the initial well stream separation. This was a broad and loosely defined scope, and the initial task was therefore to define the basis and select cases for further studies (Figure 3).
??
?
Figure 3. Definition of cases and basis for study at the start of TOP Water.

9
3 LITERATURE STUDY AND DEVELOPMENT OF TREATMENT CONCEPT (WP2)
PW is characterised by large variations in quality and flow. The variations are both between different sites and long term (over lifetime of the field) as well as short term (hours, minutes) variations at a specific site. That treatment concepts for PW must be able to handle such variations is not a very special challenge compared to water treatment in other situations. The unique factor regarding offshore treatment of PW is the requirement for extremely compact (low foot print) processes due to space and weight constraints on the topsides of an offshore platform. The variations in both flow and quality imply that there will be not be a universal treatment concept that is applicable in all situations. A selection of cases as basis for the studies in the project was therefore required.
3.1 PW quality and flow
Data on PW flow and quality were compiled from several sources:
Environmental reports from the different installations on the Norwegian Continental Shelf (NCS) for 2003 and 2004, (Olf 2004, 2005).
Reports from the International Organisation of Oil & Gas Producers (OGP 2002, 2005). Annual report on discharges from OSPAR (OSPAR 2004). Miscellaneous reports, papers and presentations on the subject of PW.
The results from the initial literature survey have been presented in more detail than in this report in a project memo (Melin, 2005a). Table 2 shows the range of values found in the literature survey and the average values for the NCS for 2002, 2003 and 2004 reported by Olf. The parameters are grouped in the same manner as used for EIF calculations.

10
Table 2. Concentrations of compounds in PW used for EIF calculation. Minimum and
maximum values found in literature and average values for the NCS for the years 2002, 2003 and 2004.
- -
0.0003
0.0004
0.002
0.01
0.002
0.00004
0.004
0.3
0.001
0.02
0.08
0.04
10
Minimum
0.0826Zinc (Zn), (mg/l)
0.0033.1Nickel (Ni), (mg/l)
0.0042.1Lead (Pb), (mg/l)
0.000325Cadmium (Cd), (mg/l)
1864Aliphatics, (mg/l)
0.00010.3Mercury (Hg), (mg/l)
0.029.5Copper (Cu), (mg/l)
0.0020.32Phenols C6+, (mg/l)
0.0811Phenols C4-C5, (mg/l)
3.517Phenols C0-C3, (mg/l)
0.0020.04PAH 4-6 ring, (mg/l)
0.131.5PAH 2-3 ring, (mg/l)
1.09Naphthalenes, (mg/l)
8.638BTEX, (mg/l)
Olf, average 02 – 04MaximumCompounds
While these parameters could be used in an EIF calculation to assess the environmental risk of a discharge, additional parameters were needed or useful for evaluating treatment concepts. Suspended solids (SS) and pH would often be required and for biological treatment, organic acids and BOD needed to be known. Table 3 shows the range and average values for SS, organic acids and BOD found in the literature survey.
Table 3. Concentrations of SS, organic acids and BOD in PW. Minimum, maximum and average values found in the literature survey. The reference for the average value is shown in brackets.
40
300
3
Minimum
- -840Suspended solids, (mg/l)
241 (Olf 2002, 2003, 2004)1135Organic acids, (mg/l)
465 (OGP 2005)2000BOD, (mg/l)
Average, (ref.)MaximumCompounds
40
300
3
Minimum
- -840Suspended solids, (mg/l)
241 (Olf 2002, 2003, 2004)1135Organic acids, (mg/l)
465 (OGP 2005)2000BOD, (mg/l)
Average, (ref.)MaximumCompounds
Most PW quality data found in the literature survey were related to discharges of PW and therefore gave PW quality after treatment. To obtain an estimate of the PW quality before treatment, the increase in concentration of dispersed oil was estimated based on reported removal efficiencies with hydrocyclones. Figure 4 shows an estimate of the influent concentration of dispersed oil to the PW treatment based on data for removal efficiency with hydrocyclones. The data were from several sites operated by Hydro and Statoil (Thorsen Haugen 2004).

11
0 %
10 %
20 %
30 %
40 %
50 %
60 %
70 %
80 %
90 %
100 %
0 500 1000 1500 2000
Influent OiW, (mg/l)
Per
cen
t w
ith
infl
uen
t O
iW le
ss t
han
x-v
alu
e
1. stage sep. 2. stage sep. All data
Figure 4. Influent concentrations of dispersed oil (OiW) to the PW treatment process based on data for removal efficiency in hydrocyclones.
The data from the literature survey were used as basis for defining PW quality cases for use in TOP Water. The selected cases are shown in Table 4, where case 1 gives PW quality after the production separators and case 2 gives PW quality after treatment with hydrocyclones. The concentrations of several semi soluble PW compounds are correlated with the concentration of dispersed oil. For these compounds the concentrations in case 1 were estimated based on the increase in dispersed oil concentration from case 2 to case 1 and the results reported by Faksness, who studied partitioning of semi soluble compound between the water phase and oil droplets in PW (Faksness et.al. 2004).

12
Table 4. PW-quality after the production separators (Case 1) and after hydrocyclones
(Case 2) based on literature data.
300700BOD
5050Suspended solids, (mg/l)
250250Organic acids, (mg/l)
100100Metals (Zn), (µg/l)
25350Dispersed oil, (mg/l)
55Metals (Pb, Cd, Hg), (µg/l)
~7~7pH
2020Metals (Cu, Ni), (µg/l)
215Phenols C6+, (µg/l)
150400Phenols C4-C5, (µg/l)
40004000Phenols C0-C3, (µg/l)
230PAH 4+ ring, (µg/l)
1501800PAH 2-3 ring, (µg/l)
10006000Naphthalenes, (µg/l)
88BTEX, (mg/l)
Case 2Case 1Compounds
1
300700BOD
5050Suspended solids, (mg/l)
250250Organic acids, (mg/l)
100100Metals (Zn), (µg/l)
25350Dispersed oil, (mg/l)
55Metals (Pb, Cd, Hg), (µg/l)
~7~7pH
2020Metals (Cu, Ni), (µg/l)
215Phenols C6+, (µg/l)
150400Phenols C4-C5, (µg/l)
40004000Phenols C0-C3, (µg/l)
230PAH 4+ ring, (µg/l)
1501800PAH 2-3 ring, (µg/l)
10006000Naphthalenes, (µg/l)
88BTEX, (mg/l)
Case 2Case 1Compounds
1
1) The value of 25 mg oil/l in Case 2 was considered to be representative with use of water
treatment chemicals. Without use of chemicals higher values were expected and 50 mg oil/l was used for planning experiments later in the project.
Data on PW discharge flows were compiled for 27 sites. The data are presented in Figure 5 where the percent of sites with a PW discharge less than the x-axis value is shown. With the exception of two installations in British sector the data were from installations on the NCS. The dotted lines are placed at 3000, 8000 and 30000 m3/d. These flows were used in the EIF calculations presented in the next section, and were chosen to cover a broad range of discharge flows. The data showed that 3000 m3/day was close to the 40% percentile and that only 15 % of the installations had PW discharges higher than 30000 m3/day. A flow of 8000 m3/day was close to the 50% percentile in the data set. The quality cases were together with the data on PW discharge flows used as a general basis for evaluation of different treatment technologies. The PW quality in case 2 and a PW discharge flow of 8000 m3/day were proposed to be used as a basis for the evaluation in the initial failure mode analysis performed by DNV (see section 4 of this report).

13
0 %
10 %
20 %
30 %
40 %
50 %
60 %
70 %
80 %
90 %
100 %
0 10000 20000 30000 40000 50000 60000 70000
PW-discharge, (m3/day)
Per
cen
t w
ith
PW
-dis
char
ge
less
th
an x
-val
ue
Figure 5. PW discharge flow based on data for 2004. Dotted lines are for 3000, 8000 and 30000 m3/day.
3.2 TOP Water treatment targets
Performance standards vary between different regions. Using the NCS as basis, the performance standards in 2004 were 40 mg/l for dispersed oil calculated as a weighted monthly average. From the end of 2006 the value was reduced to 30 mg/l. In addition, the total quantity of oil in produced water discharged into the sea in the year 2006 from all offshore installations should be reduced by a minimum of 15 % compared to the equivalent discharge in the year 2000 (OSPAR 2001). There were no performance standards for other components in PW, but principal goals from the Norwegian government had been stated in white papers from 1996-1997, 2000-2001 and 2003-2003. White Paper No 25 (2002-2003) gave specific, operational goals for oil, natural components in produced water and chemicals. The Norwegian Pollution Control Authority (SFT), the Norwegian Petroleum Directorate (NPD) and the industry had agreed on targets for zero discharge that should be reached by the end of 2005 (SFT, NPD and OLF, 2003). Targets were set for both discharges of added chemicals and for oil and other naturally occurring substances. For discharges of oil and other naturally occurring substances the targets were:
No discharges, or minimisation of discharges of chemicals on the authorities list of chemicals for priority actions
No discharges of other substances if the discharges could lead to adverse effects in the environment.

14
Achieving these goals required an evaluation of the environmental risk of a discharge. On the NCS calculation of the environmental impact factor (EIF) was used to estimate the environmental risk of PW discharges and for ranking measures (i.e. treatment technologies, substitution of chemicals, produced water re-injection (PWRI)) for achieving the goal of zero harmful discharge. The EIF model calculations are based on input about the composition and flow of a PW discharge. The EIF model is used to simulate the spreading of a discharge and calculate the risk of a harmful effect in the recipient. The risk calculation is based on calculation the concentration of compounds (PEC) and comparing this with the concentration where no effect is expected (PNEC). The EIF for a discharge is related to a recipient water volume of 100000 m3 (a grid with cells of 100 x 100 x 10 m is used) and is the volume of water with a risk > 5 % divided by 100000. Standard data sets for ocean current are used and a calculation time of 30 days is used. The reported EIF is the maximum value calculated for the 30 day period. A more detailed description of EIF and results from EIF calculations found in the initial literature survey has been presented in a project memo (Melin, 2005a). In order to obtain a basis for defining treatment targets and evaluation of technologies EIF calculations were used to evaluate the concentration levels of naturally occurring components in PW that that would give a discharge with no harmful effect based on the EIF. To do this, it was needed to define an EIF value that would correspond to no harmful discharge and find the concentrations in the discharge that would give this EIF by repeating the EIF calculation several times with different discharge concentrations. For the purpose of the evaluation, an EIF = 1 or lower was defined as “zero harmful discharge”. This implied that the water volume impacted by the discharge where the probability of damage was higher than 5 % would be equal or less than 100000 m3 (10 x 100 x 100 m3 of recipient water volume).
Table 5. Concentration in the discharges, resulting in an EIF = 1 for each component discharged separately and for a discharges containing all the components. Weight factors for each component are shown in brackets.
0.000130.00080.000490.00310.00130.0076Mercury (Hg), (1)
0.003040.01820.0110.06990.03040.1734Lead (Pb), (1)
0.000470.00280.00170.01080.00470.0267Cadmium (Cd), (1)
0.020370.1220.07430.46850.20371.1627Nickel (Ni), (1)
0.000330.0020.00120.00770.00330.0191Copper (Cu), (1)
0.007680.0460.0280.17660.07680.4384Zinc (Zn), (1)
0.000460.002760.00160.01020.00460.0282Phenols C6+, (2)
0.006010.0360.02190.13820.06010.3431Phenols C4-C5, (1)
0.1669410.60883.84001.66949.5300Phenols C0-C3, (1)
0.000550.003450.0020.01280.00550.0353PAH 4-6 ring, (2)
0.00250.0150.00910.05760.0250.1430PAH 2-3 ring, (1)
0.035060.210.1280.80640.35062.0013Naphthalenes, (1)
0.283801.71.036.52802.83816.2010BTEX, (1)
0.461502.78761.623210.30204.61528.4820Dispersed oil, (2)
30000 m3/day
Sum of comp.
30000 m3/day
Individual
8000 m3/day
Sum of comp.
8000 m3/day
Individual
3000 m3/day
Sum of comp.
3000 m3/day
Individual
Compound, (weight)
The calculations were performed for discharges of 3000, 8000 and 30000 m3/day. The calculations were performed for discharges containing only one component and for a mixture of

15
all the components. In the last case the calculation was performed with the criteria that all the components should have equal contribution to the EIF. A more detailed description of the EIF calculations has been reported separately (Rye 2005). The results of the calculations are given in Table 5. It should be stressed that the concentration levels in Table 5 were not intended as a proposal for discharge standards. The calculations were performed to obtain a basis for defining treatment targets and for the evaluation of technologies in TOP Water. One may question the choice of EIF = 1 as definition for zero harmful discharge. However, by selecting an extreme value (0 would be meaningless) an estimate of the concentration levels one should work towards to achieve a discharge that can not give adverse effects in the environment was obtained. A comparison of the average values for the NCS with the concentrations found for the discharges containing all the components is shown in Table 6. Values found by the EIF calculation that are lower than the NCS averages for 2002 – 2004 are marked with bold font. Cells in the table where the NCS average is higher than all the EIF results are shaded yellow.
Table 6. Average values for the NCS with the concentrations found for the discharges containing all the components.
0.0013
0.0304
0.0047
0.2037
0.0033
0.0768
0.0046
0.0601
1.6694
0.0055
0.025
0.3506
2.838
4.615
3000 m3/day
Sum of comp.
0.0001
0.0003
0.004
0.003
0.1
0.02
0.002
0.08
3.5
0.002
0.13
1.0
8.8
18
Olf, average
02 – 04
0.00049
0.011
0.0017
0.0743
0.0012
0.028
0.0016
0.0219
0.6088
0.002
0.0091
0.128
1.03
1.6232
8000 m3/day
Sum of comp.
0.00033Zinc (Zn), (mg/l)
0.02037Nickel (Ni), (mg/l)
0.00047Lead (Pb), (mg/l)
0.00304Cadmium (Cd), (mg/l)
0.46150Aliphatics, (mg/l)
0.00013Mercury (Hg), (mg/l)
0.00768Copper (Cu), (mg/l)
0.00046Phenols C6+, (mg/l)
0.00601Phenols C4-C5, (mg/l)
0.16694Phenols C0-C3, (mg/l)
0.00055PAH 4-6 ring, (mg/l)
0.0025PAH 2-3 ring, (mg/l)
0.03506Naphthalenes, (mg/l)
0.28380BTEX, (mg/l)
30000 m3/day
Sum of comp.
Compounds
The results indicated that for discharges on the NCS dispersed oil, BTEX, naphthalenes and the most water soluble PAHs and Phenols should be the focus of improved PW treatment with respect to naturally occurring compounds. However, the optimal solution would be site specific and would also have to include the effect of added chemicals. As a basis for evaluation of treatment concepts and technologies it was assumed that effluent standards corresponding to the concentrations found in the EIF calculations for a discharge of 8000 m3/day containing all the components would have to be achieved (Table 5).

16
3.3 Development of the TOP Water treatment concept
End of pipe PW treatment, which has been addressed in TOP Water, is one measure for reducing the environmental risk of PW discharges and comes in addition to other PW management measures (i.e. water shut off, PWRI for pressure support, disposal by injection in other formations). The optimal solution/combination of measures will be site specific and include optimisation of existing processes. The aim in TOP Water was to study treatment processes that could meet future effluent standards. Although these standards were unknown, the analysis discussed above indicated that for discharges on the NCS dispersed oil, BTEX, naphthalenes and the most water soluble PAHs and Phenols should targeted, and that very low effluent concentrations would be required (OiW < 2 mg/l). To achieve this would require a treatment concept with a considerably higher treatment level than was currently used for offshore PW treatment. As discussed previously, the treatment process should also be extremely compact due to space and weight restrictions. Compact design of wastewater treatment processes can be achieved by dividing the process train in separate steps for removal of dispersed and dissolved compounds, as opposed to bulk treatment of both suspended and dissolved compounds. During the initial literature survey a number of different technologies were evaluated. Results from the literature survey and evaluation of technologies have been reported in memos (Melin 2005b, Helness 2005). The development of the treatment concept in TOP Water is discussed below. To be able to achieve the assumed effluent standard for dispersed oil (< 2 ppm), membrane filtration would most probably have to be part of the PW treatment. To minimise membrane fouling, a pre treatment step would be required and should probably produce a lower effluent concentration of dispersed oil than typically achieved with hydrocyclones. Solids should also be removed. In addition the treatment concept should remove selected water soluble compounds. The treatment process would therefore consist of three stages:
1. Pre-treatment 2. Removal of dispersed compounds 3. Removal of remaining dissolved compounds.
Based on the initial review of process technologies a selection of some possible alternatives for the different steps was made and presented in Figure 6 below. For removal of dissolved compounds two main alternatives are shown in addition to other technologies.
3.3.1 Pre-treatment
The aim of the pre-treatment should be removal of dispersed compounds (oil droplets and solids) down to the level required for down stream treatment. Enhanced pre-treatment could involve use of water treatment chemicals and/or an additional treatment step before membrane separation.
3.3.1.1 Epcon CFU
Use of Epcon CFU was one option. The process had been tested off shore and installed on several sites. An Epcon CFU could be placed after the hydrocyclones or directly after the production separators, and be installed as single step units or with 2 CFUs in series. Treatment results of 10 – 20 ppm dispersed oil could be achieved with a hydraulic loading rate of about 110 m/hour with 2

17
CFUs in series. This implied a net hydraulic loading rate of about 55 m/hour if Epcon CFU was compared with a single stage alternative. Combined with water treatment chemicals one could probably achieve an effluent concentration of 5 – 10 ppm dispersed oil (Epcon, 2005). An Epcon CFU process, alone or after hydrocyclones could therefore be the pre-treatment step before membrane separation. However, alternatives that were even more compact would be an advantage. Also, Epcon CTU was studied in another PETROMAX project (PETROMAX project no. 163487/S30).
Fibre filter
Hydrocyclone
Prod separator
Membrane separation
In line adsorptionBiological
regeneration
In line extraction/adsorptionSteam regeneration
Other technologies•Air or steam stripping•Oxidation processes•Membrane processes•Biological treatment•Extraction processes
Source
Pre treatment
Removal of disp. comp.
Removal of diss. comp.
Discharge oftreated water
Particles and HC
Epcon CFU Hydrocarbons (HC)
Discharge oftreated water
Discharge oftreated water
Concentrate (particles and HC) Spent cleaningsolution
Steam
HC
Discharge of sludge
AirSorbent
Cleaning chemicals
Spent sorbent to waste
Nutrients
HC
Figure 6. Schematic presentation of PW-treatment alternatives. The proposed main alternatives for removal of dissolved compounds are shown in addition to other technologies.
3.3.1.2 Fibre filters
Use of fibre filters for tertiary treatment of wastewater after conventional activated sludge processes, had been reported. Advantages of this type of filter compared to rapid sand filters were higher filtration velocity (20 times higher), increased surface area, high porosity (> 90%) and low pressure drop (BenAim et. al., 2004). A deep bed fibre filter packed with U-shaped fine polyamide fibres had been developed in Korea. FIBRA (Griffiths, 2005) was another type, where the fibre bundle was squeezed during filtration. This filter type was therefore not as deep (long if mounted horizontal) as the Korean fibre filter. Deep bed fibre filters are cleaned by flushing with water and air. The FIBRA filter is cleaned by releasing the pressure on the fibre bundle. This opens the filter bed and should be an advantage with respect to effective cleaning compared to

18
traditional back washing to expand the filter bed. In both types of fibre filters the flow direction in the filtration and cleaning mode are the same. Fibre filters had not been tested for produced water, but treatment of river water to drinking water standards (< 0.5 NTU) had been reported with an optimal hydraulic loading rate of 120 m/hour based on net water production (Lee et. al. 2005). FIBRA had also not been tested for produced water, but was used for wastewater treatment at concrete plants and had been tested for turbidity removal from drinking water. Hydraulic loadings of 1 – 2.5 m3/hour (130 – 320 m/hour) were reported for the smallest unit. The company was developing units for higher flows per unit, 5 m3/hour was being tested (Griffiths, 2005).
3.3.1.3 Pre treatment in TOP Water
Effective cleaning and the size of a pre-treatment filter were expected to be key factors. FIBRA had a potential advantage with respect to cleaning, and was therefore proposed to be tested as a pre treatment filter. FIBRA units were, however, only available for low flows and development of large flow modules/units would be required before this technology could be tested offshore. The size of the pre-treatment filter would be dependant on the hydraulic loading, and one would design for more than 100 % flow capacity to allow for down time during cleaning. A high hydraulic loading would therefore be a prerequisite for achieving a compact unit. The most attractive placement of the pre treatment filter would be after the production separators because this would remove the hydrocyclones and give a treatment concept with fewer steps. However, this would give short filtration runs and probably increase fouling. Initially it was therefore assume that the fibre filter should be placed after hydrocyclones. The waste stream from the pre-treatment filter would be “back wash” water and ripening water. This waste stream would have to be treated to remove solids and hydrocarbons. Water treatment chemicals could be used to enhance separation. A solution could be to first remove solids in a sand cyclone followed by oil removal in a second hydrocyclone. The water flow would be returned to the treatment process up stream of the pre-treatment. If water treatment chemicals were not needed to enhance separation of dispersed oil, the effluent from the sand cyclone could be recycled to hydrocyclones treating the main PW flow.
3.3.2 Removal of dispersed compounds
The assumed effluent standard of less than 2 mg/l OiW would probably require membrane separation and several options were reviewed.
3.3.2.1 Tubular membranes
Membrane filtration tests of PW with ultra filtration (UF) membranes had been reported by Bilstad and Espedal (1996). In tests with PW from Snorre using cross flow UF membranes and a pressure of 6 – 10 bars, a flux of 300 – 540 l/m2 hour (LMH) was achieved. The separation efficiency for dispersed oil was 95 – 99 % (effluent 2.3 – 1.4 ppm) depending on the operating conditions. Based on the test results a design for a 7000 m3/day plant was proposed requiring a foot print of 24 m2 with a weight of 6 tonnes. This gives a net hydraulic loading of about 12 m/hour. Some cost numbers and energy consumption were also reported: Investment: 600 000 GBP; Membrane cost: 50 000 GBP/year; Power: 160 kW. The tests were performed with tubular

19
membranes, which have a low specific membrane area per module volume, typically in the range 20 – 30 m2/m3. While a low area volume ratio is a disadvantage with respect to the size and investment cost of a membrane process, tubular membranes have an advantage in low risk of clogging and the possibility for effective cleaning.
3.3.2.2 Spiral wound membranes
Membrane separation of PW using spiral wound UF membranes had been reported by Lee and Frankiewicz (2005). The pre-treatment was a desanding cyclone followed by a deoiling cyclone and 5 or 10 µm cartridge filter. The results showed a decrease in obtainable flux with increased concentration of dispersed oil in the membrane influent, and that cleaning of the membrane could not restore the flux to the level of the new membrane. The interval between each cleaning was also reduced with used membranes and depended on the influent concentration. The conclusion was a recommended design flux of 8 GFD (gallon/day/ft2) (13.6 LMH) and a trans-membrane pressure of 50 psi (3.4 bar). The cleaning interval would be 4 days provided that the dispersed oil concentration in the influent was < 50 ppm. The effluent concentration was in the range of 1 ppm oil and grease. The study reported operating cost of 10 cents/bbl, where chemicals for cleaning and scale inhibition (3.81 cents/bbl), membrane replacement (every 2 years) 2.3 cents/bbl) and pumping costs (2.47 cents/bbl, (assumed 0.06 $/kW)) were the major contributors. Spiral wound membranes have a high area – volume ratio, typically in the range 800 – 1000 m2/m3. The advantage is a more compact process and lower membrane cost, but at the expense of increased risk of clogging and no possibility for mechanical cleaning or back flushing of the membrane.
3.3.2.3 Plate and frame membranes
The V*SEP process is based on plate and frame membrane modules and torsional vibration of the membrane surface to prevent membrane fouling (New Logic Research Inc., 2005). The membrane modules are mounted vertically, giving a low foot print. A membrane area of 2000 ft2 could be fitted in a module with horizontal cross section of 4’ x 4’, but the units required up to 17’ (5.2 m) ceiling clearance. This gave an area – volume ratio for V*SEP of 24 m2/m3, which is low compared to typical values for plate and frame modules (400 – 600 m2/m3). The supplier reported fluxes in the range of 15 to over 150 GFD (25.5 – 255 LMH) depending on process conditions, a required pressure of 250 psi (17.2 bar) to treat 55 gpm and an effluent concentration of about 1 ppm. Cost figures corresponding to 1.3 cents/bbl for power consumption (assumed 0.05 $/kW) and 1.6 cents/bbl for system maintenance and cleaning were also reported.
3.3.2.4 Removal of dispersed compounds with membranes in TOP Water
Foot print/plant size, membrane life time and required cleaning/cleaning interval would be key factors for a membrane plant for removal of dispersed compounds in PW. The size/foot print of a plant would depend on the area – volume ratio and the sustainable flux. The sustainable flux is defined as the long term flux that can be achieved with an acceptable level of cleaning and pre-treatment. Although several of the studies cited above reported influent values of dispersed oil that would be achievable with hydrocyclones as the only pre treatment, it was also reported that the required cleaning interval could be increased with lower influent concentrations. Since the net hydraulic loading could be higher for the pre-treatment than for the membrane plant it was assumed that a pre-treatment filter should be placed between the hydrocyclones and down stream treatment to minimise membrane fouling and the risk of clogging the membrane module. As discussed above, different module types would have different possibilities with respect to cleaning, and a compromise between high area – volume ratio and cleaning requirements would have to be found.

20
Besides the treated effluent (permeate), membrane filtration would produce a concentrate stream with increased concentration of dispersed oil and particles. The concentrate would require further treatment to remove solids and oil. This was assumed to be done in the same desanding and deoiling cyclones that would treat the waste stream from the fibre filters. The water could be recycled up stream of the fibre filter. To achieve < 2 ppm dispersed oil, the placement of the membrane filtration step could be either after pre-treatment or as the final step before discharge. Removal of dispersed oil would also remove some phenols and PAH and therefore reduce the loading on the treatment step for “soluble” compounds. Removal of dispersed oil down to less than 2 ppm would also minimise fouling problems in the treatment step for “soluble” compounds. It was therefore placed up stream of the dissolved components treatment. Membrane life time and stability of the membrane material (i. e. surface properties) under PW conditions will differ for different membrane materials. Both ceramic membranes and polymeric membranes were considered. The cost of ceramic membranes per square meter was typically higher than polymeric membranes. Also, the weight of the membrane would be higher and the area – volume ratio would probably be lower than for a polymeric membrane. However, a ceramic membrane gives the possibility for tougher, more efficient cleaning procedures (mechanical, chemical, higher temperature) and could be expected to have a longer service life. The higher membrane cost could therefore be offset by longer membrane life and a higher sustainable flux. Of these, the membrane life will probably be the dominant factor. Membrane filtration is a field with rapid development and there were a number of different module types, membrane materials, operation modes and process configurations that could be evaluated. After initial evaluation it was decided to perform the study with ceramic microfiltration membranes.
3.3.3 Removal of remaining dissolved compounds
The aim of the final treatment step was removal of hydrocarbons left in the produced water after removal of dispersed oil. The target would primarily be BTEX and lighter Phenols (C0 – C3), since heavier Phenols and aromatics (Naphtalenes, PAH) would partly be removed with the removal of dispersed oil. However, treatment technologies, which were effective also for the heavier Phenols and aromatics, and had potential for removal of heavy metals, would be an advantage.
3.3.3.1 Stripping
Air stripping was one option that would be effective especially for BTEX and lighter Phenols. Increasing the temperature would increase the efficiency for heavier compounds (API, 1995). Stripping was known technology in the oil/gas industry, although it was not used for treatment of the main flow of PW on off shore platforms (OSPAR, 2002). OGP (2002), listed steam stripping as a technology for BTEX removal but not one used or evaluated by the oil & gas industry for NPD or PAH removal. Steam stripping would require separation of hydrocarbons from condensed vapour and air stripping would require off gas treatment to avoid transferring the discharge from water to air. Energy requirements would be relatively high, especially for steam stripping. The very low assumed effluent standards would probably require a large (high) stripping column. Due to the extensive up stream treatment, organic fouling would probably not be a critical factor.

21
However, inorganic scaling (iron, calcium) could be a problem. Also, stripping would not be effective for heavy metals.
3.3.3.2 Oxidation
Chemical oxidation, using ozone and/or hydrogen peroxide was another alternative for removal of soluble organic compounds. An advantage of the process was straight forward operation. However, ozone generation requires high energy input and the process could produce toxic residues (API, 1995). Long contact times could also be required (Klasson et. al., 2002). Advanced oxidation using UV light and titanium dioxide as catalyst was another potential alternative. The process would be tested in another project at NTNU and a test unit would therefore be available for testing the concept with PW. A potential advantage was that the UV – TiO2 process does not generate waste streams. However, fouling of the UV lamps and/or catalyst could be a problem. These processes would not be effective for removal of heavy metals.
3.3.3.3 Membranes
Membrane processes utilising reverse osmosis (RO) membranes would remove organic compounds and would also remove heavy metals from the water. RO systems require high pressure and are commercially used for desalination of sea water. Although systems for energy saving have been developed, use of RO membranes would be energy intensive compared to a system using more open nanofiltration (NF) membranes. A NF-process will be less effective for removal of the compounds with lowest molecular weight than a RO-process (API, 1995). However, NF membranes reject divalent metal ions and sufficient removal of BTEX and light phenols could probably be achieved. Membrane fouling had been a major concern with NF and RO membrane filtration in previous evaluations (API, 1995; OGP 2002; Hayes and Arthur, 2004). Relatively low flux rates and life time of the membrane material were also disadvantages. The concentrate from the process would require further treatment to separate hydrocarbons from the water before recycling the water up stream of the pre-treatment stage. Recovery in an NF (or RO) process would have to be very high to avoid a comprehensive treatment scheme for the concentrate stream. Besides fouling, this would be a major challenge if NF (or RO) was selected for removal of soluble compounds. Electrodialysis (ED), a membrane based process where the driving force for separation is an electric field was also considered. ED had a high water recovery, low pressure requirement and was resistant to fouling compared to RO or NF. However, energy costs could be very high and the process would not be effective for removal of BTEX or naphthalene’s (Hayes and Arthur, 2004). A more interesting membrane process could be membrane distillation (MD). This is an evaporation/ condensation process where a hydrophobic membrane separates two liquid phases. The temperature on the feed/concentrate side of the membrane is higher than on the effluent/ permeate side of the membrane. The resulting difference in vapour pressure gives a driving force and causes transport of water across the membrane. The separation of water and hydrocarbons is based on the difference in boiling points. For PAH’s, phenols and most BTEX compounds the difference in boiling temperature would be sufficient. However, Benzene has a boiling temperature of 80oC and separation would probably be poor. Since benzene would often be the dominant BTEX compound, this was a drawback of MD. A flux of 10 LMH had been reported for treatment of oily water (bilge water) with MD after pre-treatment with UF (Gryta et. al., 2001). As for NF, the recovery in a MD process would have to be very high to avoid a comprehensive treatment scheme for the concentrate. Although MD was less prone to fouling than pressure driven membrane filtration processes, scaling could be a concern and limit the obtainable recovery or result in the need for scaling inhibitors.

22
3.3.3.4 Biological treatment
Biological treatment could be used to remove soluble organic compounds from the PW. A biological process can be aerobic, using oxygen as electron acceptor or a two stage anoxic – aerobic process using nitrate as electron acceptor in the first stage to reduce energy requirements for aeration. Biological treatment systems could be based on suspended growth or a biofilm growing on a carrier media. Biofilm systems are in general more compact than suspended growth processes. Large volume requirement would be a major disadvantage for biological treatment (API, 1995; OGP 2002; Hayes and Arthur, 2004). The required volume for a biological process is influenced by the choice of a suspended growth or biofilm system. However, even if very compact biofilm reactors have been developed, the very low effluent concentrations required to achieve the assumed effluent standards would imply low degradation rates resulting in a requirement for large volumes. Organic acids would also be an important factor because although they are easily biodegradable, they would dominate the oxygen and nutrient requirements. For the assumed case oxygen consumption and nutrient requirements would be approximately 270-630 mg O/l, 3-8 mg P/l and 15-35 mg N/l. A biological process would produce excess sludge (biomass). For the assumed case (PW flow 8000 m3/d), biological treatment would produce ~1600-3200 kg DS/day. Sludge handling off shore would be a disadvantage for a biological process option. However, the main contribution to the sludge production, oxygen consumption and nutrient requirement would from the degradation of organic acids. Removal of these compounds was not required according to the EIF model. Heavy metals can not be degraded biologically, but heavy metals may be adsorbed to the sludge. Although this may give some removal of heavy metals, it would be a disadvantage with respect to sludge disposal.
3.3.3.5 Extraction
Extraction processes could also be used for removal of dissolved compounds in PW. Macro porous polymer extraction (MPPE) utilises an extraction liquid immobilised in polymer beads. The process requires two parallel units where one line is regenerated with low pressure steam while the other is treating PW. Steam and gaseous hydrocarbons are condensed before gravity separation of hydrocarbons and water. The MPPE process had been tested off shore. Removal efficiencies of 98 % for PAH and NPD, and 99.4 % for BETEX where achieved on Åsgaard A in a test unit. Even higher removal efficiencies had been reported. However, the removal efficiency with MPPE is governed by the size of the process, and this would limit the achievable removal efficiency with MPPE on an offshore platform (Grini et. al. 2003). A MPPE unit for a flow of 300 m3/h would have a foot print of 42 m2 and a height of 10 m (Meijer, 2003). The MPPE media must be exchanged periodically due to loss of activity. The replacement interval would probably vary depending on PW quality and pre-treatment. A yearly replacement interval had been reported (OSPAR 2002). MPPE would not be effective for removal of heavy metals. CTour is an in-line extraction process using gas condensate taken from the scrubbers in the gas compression train. Condensate is injected upstream of the de-oiling hydrocyclones. The condensate acts as a solvent, extracting dissolved hydrocarbons and small oil droplets from the PW. The condensate and hydrocarbons form large, low density droplets that are removed by the downstream hydrocyclone. The process therefore enhances removal of dispersed oil in the hydrocyclones and removes dissolved hydrocarbons. However, the efficiency of the extraction process will depend on composition of the condensate. No removal of C0 – C3 phenols and increased concentrations of BTEX in PW down stream of the hydrocyclones in a CTour process

23
had been reported (Grini et. al., 2003). A limitation of the process was that sufficient condensate with required quality may not be available.
3.3.3.6 Adsorption
Adsorption processes can be based on adsorbents that are periodically regenerated or non-regenerative adsorbent that are replaced when the adsorption capacity is exhausted. To minimise waste handling, use of adsorbents that can be regenerated off shore would be an advantage provided that a cost effective regeneration method could be found. Activated carbon could be regenerated on-site using wet air oxidation and was well established in on shore municipal and industrial water treatment. However, regeneration of spent carbon was usually done off-site (Hayes and Arthur, 2004). Use of surface modified zeolites for BTEX removal with air sparging for regeneration had been reported (Rank et. al., 2002). The conclusion from these laboratory and field scale test was that the surface modified zeolite could successfully remove BTEX from PW and that the adsorption capacity could be regenerated by air sparging. The BTEX compounds broke through the zeolite column in order of increasing Kow and decreasing solubility in water. Activated carbon would not be effective for removal of heavy metals. Zeolites have a high cationic ion exchange capacity and should give removal of heavy metals. However, the surface modification used by Rank et.al. was to increase the affinity for hydrocarbons by exchanging the cations with a hydrophobic surfactant. The surface modification would therefore also have reduced the cationic ion exchange capacity.
3.3.3.7 Removal of dissolved compounds with in-line adsorption in TOP Water
With the exception of CTour, required process size was a key factor limiting the application of several of the alternatives described above, especially if very low effluent concentrations were to be achieved. Handling of the “waste” stream whether it was spent adsorption media, off gas that required treatment or the concentrate from a membrane process, was another common limitation. An in-line process utilising existing pipes would be an advantage with respect to fitting the process on an offshore platform. However, even if existing pipes could not be utilised, using pipes in stead of pressure vessels could be an advantage because it should be easier to find the space (run the pipe along the edge of the platform deck) and it would give a more plug flow process. In-line adsorption utilising a pipe reactor could be an attractive alternative. Such a process would require an adsorbent that could be injected in the PW flow, adsorb the target compounds, be extracted from the PW flow and regenerated continuously before being recycled to the injection point. There were therefore considerable challenges in developing such a process. Separation of the adsorbent from the PW at the end of the pipe reactor and after regeneration could be done by cyclones. One possibility could be to use MPPE beads and low pressure steam for regeneration. Erosion of the MPPE beads could be a problem, and the process would require a separation unit for condensed steam and hydrocarbons. Energy requirements for steam should also be considered. An alternative media could be granular activated carbon (GAC) or surface modified zeolites. Processes with moving media such as fluidised bed reactors are well known and erosion would probably be a smaller problem with GAC or a zeolite than with MPPE. Regeneration of a zeolite with air sparging had been reported in a system for BTEX removal (Rank et. al., 2002), but would create an off gas that would require treatment. Biological regeneration could be an attractive option. The concept of adsorption with a zeolite and biological regeneration had been tested for ammonia removal from municipal wastewater (Gisvold et. al., 2000). PW treatment in a biosorption system with GAC as biofilm carrier had been reported by Dalmacija et. al. (1996). In

24
this study GAC with an adsorption capacity of 425 g COD/g GAC was used, but the capacity was increased with a factor of 1.2 in one test and 4 in another test due to simultaneous biological degradation. BTX removal from ground water using a GAC in a biological fluidised bed reactor (FBR) had been reported by Xing and Hickey (1994). The average influent BTX concentration was 4.26 mg/l and reduced down to an average of 0.015 mg/l (> 99 % removal) in a GAC-FBR operated at an organic loading rate of 6.7 kg COD/m3*day. The hydraulic retention time in the GAC-FBR was 3 minutes. The tests showed that adsorption of BTX was about 3 times faster than the biological regeneration, making the biological part of the process the rate limiting step. Due to the organic acids in PW biological regeneration of a GAC or zeolite used for PW treatment would be dependant on achieving selective adsorption of the target compounds and little or no adsorption of organic acids. If this could be achieved, the organic loading of BTEX, phenols, naphtalenes and PAH on the biological regeneration process would be relatively low. The soluble compound in Case 2 (Table 4) would correspond to a soluble COD concentration of ~35 mg SCOD/l. With a PW flow of 8000 m3/d, the SCOD loading on an in-line adsorption process with biological regeneration would be 280 kg SCOD/d. Assuming a removal rate of 6 kg SCOD/m3*day would give a required reactor volume for the biological regeneration of 47 m3. Assuming the same volume in the adsorption part of the process would give a HRT of 8.5 minutes. These assumptions would have to be verified through the work in the project, where the effects of temperature and salinity on removal rates should be two of the factors studied. However, the rough calculations showed that such a process could be an interesting alternative. The sludge production from a biological regeneration process would be much lower than for biological treatment of the main PW flow. It was assume that the produced biological sludge could be discharged to sea without harmful environmental effects. This assumption could be evaluated further as part of the later work in the project. Biological regeneration will require oxygen and nutrients. To avoid stripping of volatile compounds, oxygenation could be done with membrane contactors giving bubble free oxygenation. Comparing the two process alternatives (Figure 6), the process with GAC or a surface modified zeolite and biological regeneration had potential advantages in fewer problems with erosion of the media, lower energy demand for oxygenation compared to steam regeneration and no waste production. It was therefore decided to study adsorption with biological regeneration of the adsorbent for removal of soluble compounds.
3.3.4 Summary of treatment scheme
In summary the proposed treatment concept consisted of the following steps: Deoiling hydrocyclones => FIBRA filter => Microfiltration membranes => in-line adsorption with biological regeneration. Waste from the FIBRA filter and concentrate stream from the MF-membranes would be treated in desanding and deoiling cyclones. Water treatment chemicals could be added to enhance separation. Excess sludge from the biological regeneration would be discharged to sea. A simplified process flow diagram is shown in Figure 7, where the parts of the PW treatment process that were included for study in TOP Water are marked by yellow circles.

25
Pre-treatmentMembrane Filtration
Biological regeneration
Inline adsorption of dissolved compounds
Figure 7. Simplified process flow diagram of proposed PW treatment concept.
4 INITIAL FAILURE MODE ANALYSIS (WP2) The treatment concept studied in TOP Water consisted of new or unproven technologies for offshore PW treatment. In order to analyse the treatment concept in more detail and verify the focus of the planned studies a preliminary failure mode analysis was performed following the principles of DNV RP-A203 for qualification of new technology (DNV, 2001). The purpose of the failure mode assessment was to further address the components in treatment concept that represented either challenges or uncertainties. The aim was to identify the main failure modes with underlying failure mechanisms. This task was conducted by DNV who were one of the project industry participants, and included a work shop where the different parts of the treatment concept were discussed to identify failure modes and failure mechanisms. The failure modes and failure mechanism were related to performance targets that were partially determined previously (i.e. final effluent standards) and partially defined as part of the failure mode analysis. The results have been reported previously (Lapique, 2006). Below the identified failure modes and failure mechanisms are presented, and a discussion of which failure modes and mechanism that were included in the further studies in TOP Water is given in the following sections. Table 7 gives an overview of the failure modes and mechanisms listed in the DNV report and if they are studied in TOP Water. ID-numbers refer to identification of process components in Appendix A of the DNV report.

26
Table 7. Overview of failure modes and mechanisms, and those studied in TOP Water.
ID Component Function Failure mode Failure mechanism or cause Studied in WP
1.1 FIBRA filter module
Removal of solids and dispersed oil
Fail to remove solids and/or oil
Bladder pressure too low on single bundle
WP 2
Bladder pressure too low on bunch of units
Not studied
Bladder failure (opened mode) Not studied
Fibre breakage or changed characteristics of fibres
Not studied
Clogging Bladder failure (closed mode) Not studied
Scaling Not studied
Oil sticking to the fibres, ineffective flushing
WP 2 & 3
2.12 Filtration module with ceramic membrane
Removal of dispersed oil
Fail to remove dispersed oil
Membrane breakage Not studied
Seal burst Not studied
Change in membrane/material properties due to scaling, permanent adsorption, chemical reactions
WP 4
Irreversible fouling due to adsorption or pore clogging, oil quality
WP 4
Pore clogging WP 4 Clogging of tubes Not
studied 3.8 In-line adsorption Capture of
targeted dissolved compounds
No adsorption of targeted compounds
Contaminated media (oil, salinity, scaling, Soluble Microbial Products)
Not studied
Competing compounds adsorption WP 5 Loss of media Not
studied Reduced adsorption kinetics WP 5 Ageing (physical and chemical) Not
studied 3.17 Fluidized bed
reactor Biological regeneration of the adsorbents
Loss of regeneration capacity
Bacteria eat other compounds than the targets
WP 5
Bacteria eat adsorbents Not studied
Reduced biological regeneration capacity due to varying incoming water quality (temperature, pH, salinity, heavy metals content)
WP 5
Failure of air supply (air has to be dissolved and not as bubbles to avoid stripping of volatile compounds)
Not studied
Failure of nutrient supply Not studied
Friction between media particles /size reduction
Not studied
Killing bio-mass Toxic chock WP 5

27
4.1 Characterisation of dispersed constituents in produced water
In the preliminary failure mode analysis the characterisation activities in TOP Water were not addressed separately and no specific failure modes and failure mechanisms were identified. However, in order to achieve the desired treatment efficiency it is necessary to have a basic understanding of the stabilisation/destabilisation mechanisms of dispersed constituents present in waste water. The dispersed components can both be oil and solid particles. Studies of these systems were performed in two PhDs and included:
Investigations of how crude oil composition will influence the quality of produced water in terms of o/w emulsion stability.
Investigations of adsorption properties and stabilisation mechanisms of suspended solids (model systems and real produced water systems).
Investigations of the ability of solids to contribute to the stabilisation of o/w emulsions.
4.2 Pre treatment with FIBRA filter
Two failure modes related to the FIBRA filter were identified:
1. Failure to remove solids 2. Clogging
Both removal of solids and dispersed oil were identified as interesting applications. The failure mode “Failure to remove solids” should therefore be understood as failure to remove solids and/or dispersed oil. The possible mechanisms for the two failure modes were identified as failures related to the bladder compressing the fibre bundle (low pressure or complete bladder failure in open or closed mode), fibre breakage and oil sticking to the fibres due to ineffective flushing. Some of these mechanisms were related to mechanical design of the modules or assembly of several modules in a bundle. Such failure mechanisms were not studied in TOP Water, but were communicated to the supplier of the FIBRA filter, Fibra Ltd. In TOP Water a study to assess the performance of the FIBRA for PW treatment has been performed in WP2. The main focus has been on FIBRA as a filter for removal of dispersed oil. However, use as for coalescer, removal of solids and effect of combination with a flocculant has also been studied. The aim was to assess the range of conditions where the FIBRA could give effective removal of dispersed oil and what bladder pressure that would be required. The results would therefore give information on operation conditions required to avoid the first of the two failure modes. The second failure mode, clogging, was studied by monitoring the effect of the filter flushing in experiments with different oil types. Samples of fibres from the fibre bundle used in the testing were also examined visually for deposits and properties of the fibre assessed by measurement of the contact angle and evaluation of fibre flexibility. Handling of waste streams (flush waster from the FIBRA filter and MF concentrate) was discussed in the preliminary failure mode analysis and included in the DNV report. However, a detailed study of that part of the process concept was not included in the tasks defined in TOP Water.

28
4.3 Membrane filtration
One failure mode was identified for membrane filtration:
1. Failure to remove dispersed oil The possible failure mechanisms were related to mechanical issues (membrane breakage, seal burst) and fouling. Membrane filtration has been studied by a PhD in WP4. The focus has been on fouling mechanisms for both reversible and irreversible fouling, and methods to manage fouling. Failure mechanisms caused by mechanical issues or design of full scale units were not included in the study.
4.4 In-line adsorption with biological regeneration
Failure modes related to the adsorption process, biological regeneration of the adsorbent, injection and extraction of adsorbent in the in-line adsorption reactor and the fluidised bed reactor (ejector and hydro cyclones) were identified in the preliminary failure mode analysis. This part of the treatment concept was the least developed regarding known technology or experience from other applications. The aim of the study performed in TOP Water was therefore limited to testing the feasibility of selective adsorption of target compounds followed by biological regeneration of the adsorbent. Issues related to design of the full scale process were not included. Three failure modes related to the adsorption process and biological regeneration were identified:
1. No adsorption of targeted compounds 2. Loss of regeneration capacity 3. Killing bio-mass
The possible mechanisms for the first failure mode were properties of the media (physical and chemical), fouling and adsorption properties. The mechanisms leading to the two other failure modes were related to the biological process it self (degradation of other compounds than target compounds, degradation of the media, effects of water quality, toxic shock) and mechanical failures (loss of nutrient supply, loss of air supply, mechanical wear of adsorption media). This part of the treatment concept has been studied by a PhD in WP5. The study included identification of adsorbents capable of selective adsorption on BTEX, and cyclic adsorption and biological regeneration in a time sequence. The aim was to simulate the changing conditions of a continuous process, and provide information on failure mechanisms related to the adsorption and biological processes. However, fouling, long term changes in the properties of the media or mechanical failures were not included.

29
5 CHARACTERISATION (WP3) The overall objective in WP3 was to obtain fundamental understanding of the underlying mechanisms and phenomena that govern the behaviour of the dispersed components in produced water streams. The focus has been on:
characterisation of solids and solid suspensions characterisation of o/w emulsions
The main results from these studies are summarised in the following.
5.1 Characterisation of solids and solid suspensions (Dudášová, 2008)
5.1.1 Surface properties and adsorption studied by the depletion method
Several model particles were chosen to represent particles typically present in produced water (Table 8). The particles were investigated in terms of change in surface properties upon asphaltene adsorption, as well as the effect these changes have on suspension stability. The motivation behind this work was to study how the behaviour of solids in suspension will change upon exposure to crude oils and the resulting adsorption of surface active components (here represented by asphaltenes).
Table 8. Selected model particles and their physical characteristics.
Particle Primary particle size (nm)
Aggregate size (m)
Particle shape Surface area (m²/g)
Wettability ()
Kaolin 100 – 4000 1,96 plate like or lamellar
20 ± 3 12 ± 2
Silica Aerosil 150
14 1,57 spherical 150 ± 15 20 ± 2
Silica Aerosil R140
12 - spherical 150 ± 25 107 ± 2
CaCO3 70 1,30 rhombic 20 ± 2 25 ± 2
BaSO4 80-450 1,11 tabular, prismatic
7 ± 1 9 ± 2
Fe3O4 20-30 1,64 spherical 45 ± 3 10 ± 2
FeS 2000 2,04 spherical 7 ± 1 16 ± 2
TiO2 21 1,17 spherical 50 ± 15 11 ± 2
Contact angle measurements and adsorption studies (using UV depletion detection) demonstrated that all the particles became more hydrophobic upon exposure to asphaltenes. The change in wettability is illustrated in Figure 8 for kaolin with and asphaltenes with different origin. Figure 9 shows the adsorption isotherms for kaolin and asphaltenes with different origin. Based on the

30
adsorption isotherms, the amount of adsorption can be determined, and the main findings from the analysis are summarised as follows:
The adsorbed amount depended more on particle type than asphaltene origin o The weakest adsorption was seen on hydrophobic silica, indicating that the
adsorption was due to polar interactions between surface and asphaltenes o It is not a requirement that the surface is a H-donor to allow for adsorption
(CaCO3) o There was no correlation between the contact angle of the particles and the amount
of asphaltenes adsorbed onto them
There were a weak correlation between the amount of asphaltene adsorbed and the amount of nitrogen in the asphaltenes
pure 5 7 11 16 30
Con
tact
ang
le [d
g.]
0
20
40
60
80
100
120
140
160
180
KAOLIN - Contact Angle water-solid-air
Figure 8. Effect of asphaltene coating (5 different asphaltenes) for kaolin.
Asphaltene coating

31
Asphaltene supernatant concentration (mg/ml)
0.0 0.2 0.4 0.6 0.8 1.0
Ad
sorb
ed
am
ou
nt
(mg
/m2)
0.0
0.5
1.0
1.5
2.0
2.5
3.0
51671130
Figure 9. Adsorption isotherms for kaolin with 5 different asphaltenes.
5.1.2 Adsorption studied by Quartz Crystal Microbalance
The adsorption of asphaltenes was also studied by a Quartz Crystal Microbalance (QCM) using silica, titanium, alumina, and iron oxide surfaces. The QCM technique is based on measuring changes in oscillation frequency of the crystal upon adsorption from solution, which can be correlated to the amount adsorbed at the crystal. Furthermore, the dissipation upon damping of the crystal oscillations gives information about the rigidity of the adsorbed layer. Figure 10 shows the shifts in frequency (blue lines) and dissipation (red and orange lines) for two different asphaltenes adsorbed onto a silica surface.
-220
-170
-120
-70
-20
30
0 20 40 60 80 100 120 140 160
Time (min)
Fre
qu
ency
(Hz)
-4
-2
0
2
4
6
8
10
Dis
sip
atio
n (
x10-6
)
2 30
frequency
dissipation
Figure 10. Frequency and dissipation shifts for two different asphaltenes (numbered 2 and 30) adsorbed onto a silica surface.
The difference in behaviour between the two asphaltenes was attributed to different solubility states of the asphaltenes upon adsorption. Asphaltene 30 is dissolved at a molecular level in the

32
solution, and adsorbed rigidly onto the surface as seen by a low shift in dissipation. This state is illustrated in Figure 11a. Asphaltene 2, on the other hand, have large frequency and dissipation shifts, indicating adsorption of flocculated asphaltenes. The result is a less rigid adsorption layer, as illustrated in Figure 11b.
surface (crystal)
compact layer asphaltene aggregates
a b
solvent
………….~~~~~~~~~~~~~~~~~~~~~~~~~~~~~~~~~~~~~~~
Figure 11. a) Adsorption layer when adsorption is carried out from solution of dissolved asphaltenes. b) Adsorption layer when adsorption is carried out from solution of aggregated asphaltenes.
Generally, the amounts of adsorption determined by QCM were not correlated to the amounts determined by the UV depletion method for the particles. Furthermore, there were no correlation between adsorbed amounts and wettability of the crystal surfaces.
5.1.3 Single particle suspensions
Having established the changes in surface properties of the solids upon exposure to asphaltenes, the next step was to study how these changes influenced the behaviour of the particles in suspensions. Three variables were investigated: Type of asphaltene coating, amount of particles and temperature. The suspension stabilities (all in 3.5 wt% NaCl solutions) were followed by Turbiscan, i.e. following the transmission of light through the suspensions over time. The transmission profiles for kaolin suspensions under different conditions are shown in Figure 12. High transmission corresponds to good separation (sedimentation and aggregation) of the suspensions and low transmission corresponds to poor separation. Over time, the transmission increases for all suspensions. Furthermore, three groups of profiles are seen, dependent on the experimental variables. Multivariate data analysis (see Appendix for more information) was used to extract information about which variables that were important with respect to the separation behaviour of the various suspensions. Figure 13 shows the relative importance of the experimental variables when only the first 15 minutes were considered (15 minutes where chosen because most of the differences between the profiles occurred within this time frame. Furthermore, this is a typical residence time in separators.). It is seen that asphaltene coating is the most important variable with respect to separation when the suspended particles are kaolin, TiO2, FeS and (hydrophilic) silica. The particle concentration is the most important for BaSO4 suspensions, while temperature is the most important for CaCO3 suspensions. When the entire time span (75 minutes) were considered, temperature was the most important variable with respect to suspensions stability for all particles except silica (data not shown here).

33
0
10
20
30
40
50
60
0 10 20 30 40 50 60 70
Time [min]
Tra
ns
mis
sio
n [
%]
50 ºC uncoated
50 ºC coated
25 ºC coated
Figure 12. Transmission profiles for kaolin suspensions followed for 75 minutes.
Kaolin CaCO3 TiO2 BaSO4 Fe3O4 FeS SiO2_i
Su
m S
q. S
ign.
Va
r -
a.u
. (9
5% c
onf
ide
nce
)
Temperature Coat*Conc. Coating Concentration Temp*Conc.
Figure 13. Relative importance of the experimental variables when suspension stability is monitored over 15 minutes.

34
Furthermore, it was shown that asphaltene coating increased the suspensions stability when suspended particles were kaolin, CaCO3, BaSO4, Fe3O4, TiO2. For the FeS suspensions, however, the suspension stability decreased upon asphaltene coating. It is suggested that the difference in behaviour can be attributed to how the asphaltenes orient on the surface of the particles. In the case of improved stability the asphaltenes are adsorbed head-on the particle surface and provide steric stabilization. When the stability is decreased, however, the asphaltenes are adsorbed flat-on the particle, causing inter-particle interactions that promote destabilization. This is, however, not experimentally shown.
5.1.4 Binary and ternary particle suspensions
The results discussed above, are all considering single-particle suspensions. The behaviour of binary and ternary particle mixture suspensions was also investigated. Figure 14 shows the transmission profiles for pure kaolin and silica suspensions, as well as binary kaolin-silica suspensions. A multivariate model was developed in order to use the transmission profiles to predict the composition of the suspensions. The idea behind this approach was to investigate the possibility of using transmission profiles of real produced water particles to predict the particle properties. In our model systems, the model for binary kaolin-silica mixtures predicted correct sample composition in 86 % of the investigated suspensions. In ternary kaolin-silica-FeS and kaolin-silica-Fe2O3 suspensions, correct prediction was obtained in 67 % of the investigated suspensions.
Figure 14. Transmission profiles for silica, kaolin and silica-kaolin suspensions.
5.1.5 Produced water particles
Procedures for characterising particles from real produced water were also developed. The particles were identified as iron-rich alumina silicates and the physical properties of original and
kaolin
Time [min]
0 20 40 60 80
Tra
nsm
issi
on [
%]
0
10
20
30
40
50
60
70
mix
silica

35
calcinated (heated to 700 C for 10 hours) produced water particles are given in Table 9. Comparing the suspension behaviour of the real produced water particles to corresponding model systems revealed that the produced water particles were more stable in suspension than the model solids. Furthermore, all particle suspensions were more stable in real produced water compared to brine (3.5 wt% NaCl). This was attributed to the presence of dissolved components in the produced water.
Table 9. Physical properties of original and calcinated produced water particles.
Original particles Calcinated particles
(10h, 700 ºC) Colour yellow-light orange brown-red Particle size distribution [μm]*
0.40 – 3.36 (average: 1.88)
0.6 – 2.20 (average: 1.39)
Contact angle [º]** 51 ± 7 11 ± 4 *measured in 3.5 wt% aq.NaCl after mixing ** water/solid/air interface; measured into the water phase
5.2 Characterisation of o/w emulsions
The motivation for this work was to investigate how physico-chemical properties of crude oils will affect the stability of o/w emulsions, and consequently affect the quality of produced water. Experiments were carried out on bench-scale as well as in a hydrocyclone set-up. 29 crude oils, characterised in terms of composition (SARA and TAN), density, viscosity, interfacial tension and elasticity (Table 10) were used in the studies. Furthermore, the properties of the o/w emulsions were studied with three different crude oil amounts: 30 wt%, 600 ppm and 50 ppm. The amounts were chosen to represent typical amounts in separators, downstream separators and downstream hydrocyclones, respectively.
5.2.1 30 wt% crude oil – lab scale experiments (Silset, 2008)
The stability of the o/w emulsions prepared from the 30 crude oils was investigated by Turbiscan, i.e. determination of transmission profiles similar to the solid suspensions as described above. In addition droplet sizes were determined by the Coulter Counter method. PCA analysis (see Appendix) was used to identify the most important variables influencing the stability of the emulsions. The results showed that separation of the large oil droplets is mainly dependent on density and viscosity of the crude oil.
5.2.2 600 ppm crude oil – lab scale experiments (Aarhoug, 2008)
An important factor in stability of o/w emulsions is the droplet size, the smaller the droplets the more difficult it is to separate the oil and water phases (i.e. poorer quality of the produced water). In order to investigate the effect of the crude oil properties (Table 10), droplet sizes were determined by the Coulter Counter method immediately after mixing and 75 minutes after mixing for emulsions (600 ppm oil). PCA analysis (see Appendix) was used to determine similarities and differences between the different size distributions, and thereby identify variables that are important for the resulting droplet size. Figure 15 shows the so-called score plot resulting from this analysis. The plot is interpreted in the way that the crude oils (represented by numbers) that

36
are close in the plot have similar drop size distribution, while crude oils far from each other have differences in the drop size distributions. Furthermore, PC1 (“x-axis”) represents the property in the size distributions that has the largest variation, in this case the droplet size. When going from left to right in the plot, the droplet size increases. For example the average droplet size for sample 11 is 1.80 m and 2.49 m for sample 17. Similarly, PC2 (“y-axis”) represents the property with the second largest variation, in this case the polydispersity of the size distributions. So when going from top to bottom in the plot, the polydispersity decreases, i.e. sample 22 has higher polydispersity than sample 13. Based on the similarity in drop size profiles, four groups (1-4) have been marked in the plot. Based on the properties of the crude oils (Table 10), the characteristic properties for each group can be identified, see Table 11. The main results are as follows:
o/w emulsions with small droplet size are characterised by high viscosity, high density and high resin and acid content.
o/w emulsions with low polydispersity are characterised with low aromat, resin and TAN content and high elasticity.
Table 10. Crude oil properties. Crude oil
Density (g/cm3)
Viscosity (mPa·s)
Saturates (wt%)
Aromats (wt%)
Resins (wt%)
Asphaltenes (wt%)
Interfacial tension (mN/m)
Elasticity Total acid number (mg KOH/g)
1 0.95 276 33.1 46.0 18.8 1.3 10.4 19.1 4.2 4 0.85 9 52.2 36.0 10.4 1.2 12.0 18.0 0.0 5 0.94 225 39.0 39.2 18.4 3.4 14.4 14.0 2.5 6 0.90 69 39.9 39.7 14.3 6.2 23.2 14.5 0.8 8 0.92 82 43.8 38.5 15.0 2.3 16.5 15.7 2.2 9 0.84 5 63.7 28.6 6.3 0.4 12.9 17.0 0.5
10 0.85 8 57.2 34.0 8.1 0.2 16.1 11.0 0.2 11 0.92 138 42.9 42.1 13.9 0.6 12.4 23.4 2.5 12 0.94 505 35.8 41.4 18.2 4.6 17.2 6.5 3.4 13 0.86 10 58.4 30.7 7.7 3.3 5.14 15.4 1.9 14 0.88 18 43.5 41.1 12.6 1.9 18.3 17.2 0.6 15 0.98 2 269 26.0 38.0 20.5 2.8 10.2 20.0 7.5 16 0.91 49 47.6 40.2 11.5 0.8 11.1 12.1 2.9 17 0.87 11 52.3 39.4 7.2 0.6 14.9 12.4 2.9 18 0.92 104 40.3 41.0 15.6 2.8 17.8 9.0 1.7 19 0.87 13 57.3 33.4 8.2 1.0 15.3 18.0 0.4 20 0.90 36 46.6 37.6 14.0 1.7 17.4 10.0 1.4 21 0.93 118 30.6 43.3 20.9 5.0 21.3 7.3 1.3 22 0.91 33 25.9 53.1 11.5 5.4 16.2 19.0 0.0 23 0.92 81 38.2 43.6 14.1 3.8 14.0 7.0 0.6 24 0.88 12 56.1 37.6 6.2 0.1 10.9 32.1 0.9 25 0.98 23 397 32.8 33.2 28.5 4.3 10.7 11.9 5.2 26 0.97 2 497 26.4 41.5 21.9 10.3 11.0 6.9 3.7 27 0.96 5 418 32.8 37.2 16.9 12.9 18.8 5.9 1.1 28 0.87 11 57.9 34.8 6.7 0.2 8.3 26.6 0.7 29 0.89 16 51.5 41.3 7.0 0.2 11.4 25.4 1.8

37
Figure 15. Score plot from PCA analysis of droplet size distributions in the emulsions immediately after mixing.
Table 11. Characteristic properties of the groups identified in Figure 15.
Properties Group 1 Group 2 Group 3 Group 4
Density (g/cm3) Intermediate High Low Low
Viscosity (mPas) Intermediate High Low Low
Saturates (wt%) Intermediate Intermediate High High
Aromats (wt%) High High Intermediate Low
Resins (wt%) Intermediate High Intermediate Low
Asphaltenes (wt%) High High Low Low
TAN (wt%) Intermediate High Intermediate Low
IFT (mN/m) High High Low Low
Elasticity Low Intermediate Intermediate High The changes in droplet size distributions over 75 minutes were also determined. Figure 16 shows the same score plot as shown in Figure 15, but in this case oils with high and low change in droplet size is marked. The red circles represent samples that have more than 10 % increase in average droplet size during 75 minutes, while the blue circles represent samples that have less than 2 % increase in average droplet size during 75 minutes. The samples with the largest change in droplet size are characterised by high viscosity and density and high amounts of resins and acid content. The samples with the smallest change in droplet size are characterised by low density and viscosity, high saturate content, low asphaltene, resin and acid content and high interfacial tension and elasticity.
1
2
3
4
1.80 m 2.49 m

38
Altogether, crude oils with high viscosity and density and high content of resin and acid tend to give o/w emulsions with the smallest droplets, but largest change in droplet size over time.
Figure 16. Score plot from PCA analysis of droplet size distributions in the emulsions immediately after mixing. Red circles represent o/w emulsions with higher than 10 % increase in droplet size during 75 minutes. Blue circles represent o/w emulsions with lower than 2 % increase in droplet size distribution during 75 minutes.
5.2.3 Stability measurements (Aarhoug 2008)
Stability measurements (using Turbiscan) were carried out at 4 different conditions:
600 ppm o/w, 25C 600 ppm o/w, 50C 50 ppm o/w, 25C 50 ppm o/w, 50C
The raw data and corresponding transmission and backscattering profiles give information abort creaming and flocculation/coalescence in the samples. PCA analysis was also carried out for these data. The results for 600 ppm o/w at 25C are shown in Figure 17. Three distinctly different behaviours were observed:
Black group: No/little creaming and flocculation/coalescence Green group: Flocculation/coalescence Blue group: Creaming and some flocculation/coalescence
The crude oil properties were linked to the three groups in the same manner as described in 5.2.2. Similar analyses were also carried out for the three other concentration and temperature conditions. The following main conclusion was drawn from the analyses:

39
The heavy crude oils in the data set have high amounts of aromatics, resins, asphaltenes
and acids and low amounts of saturates. High acid and resin content provide low interfacial tension. High aromatic and low saturate content provide improved solubility of asphaltenes. Diffusion of asphaltenes to the interface is then reduced, preventing formation of an elastic interface around the drops. This makes the oil drops more susceptible to coalescence and droplet growth.
The “intermediate” heavy crude oils in the data set generally have medium content of saturates, aromatics, resins and high values of asphaltenes and acids. The lower aromatic and resin content cause higher interfacial tension, while poorer solubility conditions for asphaltenes cause some elasticity of the o/w interface. Furthermore, in some of the 600 ppm o/w emulsions, no creaming is observed. Characteristic for these oils are a higher asphaltene content and lower aromatic and acid content than the 50 ppm emulsions. Somewhat higher interfacial elasticity can then be expected, and flocculation will be more dominant than coalescence. For the 50 ppm emulsions more coalescence is plausible (due to less asphaltenes), inducing faster creaming.
The light crude oils in the data set generally contain high amounts of saturates, medium amounts of aromatics and acids and low amounts of asphaltenes and resins. Even though the amounts of interfacially active compounds are smaller, diffusion of asphaltenes, resins and acids to the interface is rapid and highly elastic interfaces are formed. The rate of coalescence is consequently reduced.
Figure 17. Score plot for transmission and backscattering profiles for 600 ppm o/w emulsions at 25oC.
5.2.4 Lab-scale hydrocyclone experiments (Silset, 2008)
Six crude oils were selected for the hydrocyclone experiments. Their properties are summarised in Table 12. The motivation for these experiments was to investigate how well the bench-scale experiments correspond to scaled-up experiments. Figure 18 shows the hydrocyclone set-up, while the conditions during the experiments are given in Table 13. The hydrocyclone was not run at optimal conditions. Instead, the running parameters were kept constant in order to emphasise the effect of crude oil properties on the separation efficiency.

40
Table 12. Physico-chemical properties of the crude oils used in the hydrocyclone
experiments. Crude oil
Density (g/cm3)
Viscosity (mPa·s)
Saturates (wt%)
Aromats (wt%)
Resins (wt%)
Asphaltenes (wt%)
IFT (mN/m)
Elasticity TAN (mg KOH/g)
15 0.98 2 269 26.0 38.0 20.5 2.8 10.2 20.0 7.5 12 0.94 505 35.8 41.4 18.2 4.6 17.2 6.5 3.4 5 0.94 225 39.0 39.2 18.4 3.4 14.4 14.0 2.5
16 0.91 49 47.6 40.2 11.5 0.8 11.1 12.1 2.9 28 0.87 11 57.9 34.8 6.7 0.2 8.3 26.6 0.7 9 0.84 5 63.7 28.6 6.3 0.4 12.9 17.0 0.5
Figure 18. Hydrocyclone set-up.
Table 13. Experimental conditions in the hydrocyclone experiments.
Water Tap water + 3.5 wt% NaCl and 350 ppm crude oil Temperature 25C 2 Pressure drop 2 bar Water flow 1 m3/h Sampling 15 and 30 min from water inlet and water outlet Samples were taken at the water inlet and water outlet and analysed in terms of droplet size distributions (Jorin). The percentage removal of oil droplets was estimated for different size classes, Figure 19. The “negative removal” in the smallest size class (crude oils 12, 5, 16 and 28), indicates that smaller droplets are generated in the hydrocyclone. The removal efficiency improved for the larger the droplets in the emulsions. The overall oil removal is given in Table 14.

41
The best removal was seen for crude oil 15, which is the sample with highest density and viscosity (Table 12).
Table 14. Total oil removed by hydrocyclone.
Crude oil Total removal (%) 15 79 12 65 5 47 16 67 28 56 9 52
<10 [10-15] [15-20] [20-25] [25-30] >30
-60
-40
-20
0
20
40
60
80
100
Rem
ova
l (%
)
Diameter (m)
Crude oil 15 Crude oil 12 Crude oil 5 Crude oil 16 Crude oil 28 Crude oil 9
Figure 19. Removal of oil by the hydrocyclone in different size ranges.
PLS analysis (see Appendix) was used to identify properties tending to improve or oppose oil removal. Regression coefficients for this analysis are shown in Figure 20. From the figure it can be seen that high viscosity and high amounts of aromatics and acids tend to improve removal efficiency. This is in agreement with the bench-scale experiments, which showed that crude oils with these properties exhibited the largest droplet growth. Furthermore, it is seen that high levels of resin and asphaltene content and interfacial tension and elasticity reduce removal efficiency. These properties will reduce the rate of coalescence for the oil droplets (due to elastic interfaces). Consequently, it seems that coalescence is also an important factor for efficient oil removal in the hydrocyclone. The effect of oil density is only important for removal of the largest droplets, Figure 21. This means that the low density difference between oil and water reduce the removal efficiency only for the largest droplets, while for smaller droplets other mechanisms are more important.

42
Figure 20. Regression coefficients from PLS analysis showing the variables significant in terms of oil removal.
Figure 21. Regression coefficients for density for the different size classes.

43
6 PRE-TREATMENT WITH FIBRA (WP2)
6.1 Background for the FIBRA study
The FIBRA fibre filter consists of an ‘in-line’ fibre bundle, located in a cylinder and anchored at the inlet end. The influent flow containing suspended particulates, moves from the inlet end towards a predetermined downstream point where a flexible compression device (bladder) bears on the fibres in an inwardly radial direction, thereby constricting the flow. As a result particles are retained in the interstitial gaps between the compressed fibres as the flow proceeds. The gaps, which are predetermined by selection of the fibre size and by the degree of compression (bladder pressure), therefore define the performance characteristics of the filter (Griffiths, 2005). At the start of the TOP Water projects, available units had a limited capacity of 2.5 m3/hour. In order to use the FIBRA filter in large scale applications, a large number of units would have to be mounted in parallel. Units for higher flows (5 m3/hour) were being tested, and use of standard pneumatic valves for housing of the fibre bundles was an alternative to the housing with doughnut shaped bladder (Griffiths, 2005). A fibre bundle and the two housing types are shown in Figure 22.
Figure 22. Fibre bundle and housing with doughnut shaped bladder (left) and pneumatic valve housing (right).
The FIBRA filter was proposed to be used for pre-treatment stage in the process train before membrane filtration and further treatment. The purpose of the pre-treatment would be to minimise membrane fouling and protect the membrane unit. The FIBRA should therefore remove dispersed oil and solids. The effluent should probably have a lower concentration of dispersed oil than typically achieved with hydrocyclones. FIBRA had not been tested for produced water, and the aim of the tests was to evaluate removal of dispersed oil with a FIBRA filter and assess fouling of the filter. Although the TOP Water project studied a treatment scheme where the FIBRA was intended for pre-treatment before membrane filtration, assessment of FIBRA as a stand alone alternative to current processes/technologies for removal of dispersed oil was also of interest.

44
6.2 Discussion of results from the failure mode analysis
The FIBRA filter was evaluated in a technology assessment work shop where the industry partners in TOP water participated. The results have been reported by DNV in the report: Preliminary Failure Mode Analysis of a Novel Treatment Concept for Produced Water (Lapique, 2006). The main points from the sections covering the FIBRA filter are included below.
6.2.1 FIBRA filter module
In the preliminary failure mode analysis effluent criteria of 30 mg oil/L and 10 mg SS/L were defined for pre-treatment with FIBRA. Two major failure modes were identified:
Failure to remove solids Clogging.
In both cases failure mode mechanisms could be classified in two categories related either to fibres properties and integrity issues or compression control (bladder pressure).
6.2.1.1 Fibre properties and integrity
The fibre diameter combined with the materials mechanical and chemical properties would partially determine the filtration efficiency and the long-term properties were of special interest. Together with the bladder pressure, fibre diameter was reported to determine the particle size cut-off of the system. Any change in either fibre diameter (due to erosion and wear) or number of fibres (breakage due to embitterment, ageing and extensive wear) would potentially affect the filter efficiency and might compromise the performance of the down stream membrane filtration unit. Therefore characterising these properties over time was an important issue. The chemical properties or change of these properties and especially the surface properties would potentially affect the tendency of “stuff” to stick to the fibres leading thus to scaling or eventually clogging. The level of adhesion would determine the flushing efficiency as well as the performance of possible chemical fibre cleaning. Characterising these properties over time would bring valuable information regarding the suitability of the FIBRA filter to handle solids (mainly sand) and dispersed oil in produced water.
6.2.1.2 Bundle compression
In addition to fibre properties, bundle compression would determine the filter efficiency. Proper compression level had to be defined based on both the size (mean size or size distribution) of the solids to be removed and the fibre diameter and density (number of fibres per unit area). Inadequate compression could be caused by either bladder failure or wrong applied pressure. Bladder failure could be either bladder breakage or change in mechanical properties (e.g. stiffness or elasticity due chemical degradation). Characterising these properties over time would be important to assess the reliability of the pre-treatment unit.

45
6.2.2 Management of flush water and membrane concentrate
A de-sander and a de-oiler were proposed to handle the concentrates coming from the FIBRA and membrane filtration units. However, the de-sander and de-oiler were not the topic of dedicated activities in TOP Water. The use of cyclones to capture sand and oil was a well established technology but in the present application they would have to deal with concentrates with expected high concentration of oil and sand, well above the usual operation conditions. Information on the concentrates properties would be required to assess the suitability of using cyclones.
6.3 Experimental set-up with FIBRA in TOP Water
A FIBRA filter unit (DN 100) using a fibre bundle with 0.1 mm nylon fibres was tested in three periods during TOP Water. After discussion in the project steering committee it was decided that the main focus in the tests should be use of the FIBRA as a filter. However, use as a coalescer could be an option and some tests to investigate this were included in the final period. The operating conditions and type of test are given in Table 16 and discussed below. An illustration of the experimental set-up with the FIBRA connected to the mixing rig is shown in Figure 23. The experimental program consisted of experiments where influent concentration (Cinfl.), pressure drop during mixing of oil and water (dP) (dP influences the droplet size distribution (DSD)) and bladder pressure (Pbl) (Pbl influences the flow through the FIBRA filter (QFibra)) were varied approximately according to a Box Behnken design with three levels. Also, experiments with dosage of a flocculant (MRD208SW) were performed to evaluate if use of water treatment chemicals could enhance the performance. Solids (kaolin, median particle size 6.7 µm) were dosed in some experiments. The experiments have been performed with salt water (3.5 w % NaCl in tap water) and three types of oil (Table 15). Exxsol D 60 – a model oil with aliphatic hydrocarbons (no aromatic compounds), Total B – a relatively light crude oil and Seillean – a crude oil with higher density and viscosity than Total B.
Table 15. Characteristics of oil types used in tests with FIBRA. Oil type Density
(g/cm3) Viscosity (mPa·s)
Saturates (wt%)
Aromats (wt%)
Resins (wt%)
Asphaltenes (wt%)
IFT (mN/m)
Elasticity TAN (mg KOH/g)
Exxsol 0.79 1.31 0 0 0 0 41.0 - - 0 Total B 0.84 4.5 63.7 28.6 6.3 0.35 12.9 17 0.49 Seillean 0.94 505 35.8 41.3 18.2 4.6 17.2 6.5 3.4
The operating conditions of the FIBRA (bladder pressure, flow, filter run time, flushing time, etc.) were set according to information given by the supplier (Fibra Ltd.). One exception to this was that only water, no gas/air, was used during the flushing. This was a safety measure required by the design of the test rig. Samples from inlet and outlet (filtered water) were taken during a filter cycle and analysed for oil concentration by GC-analysis. Droplet size distributions in influent to and effluent from the FIBRA were measured on-line with a Jorin ViPA. The water samples were taken after 15 – 45 minutes when the ripening period of the filter cycle had ended and the effluent quality was stabilised. Also, fibre samples were collected from the bundle at intervals for study in a microscope and measurement of contact angle.

46
Table 16. Operating conditions and type of tests performed with FIBRA.
Period 1 2 3 Type of tests Dispersed oil removal
Effect of flocculant Dispersed oil removal Effect of flocculant
Dispersed oil removal Effect of flocculant Solids removal Use as coalescer
Salt concentration in water, (mg NaCl/L)
35 35 35
Oil type Exxsol D 60 Total B Seillean Influent oil in water concentration, (mg/L)
16 – 570 71 – 435 71 – 288
Influent flow to mixing rig, (m3/hour)
0.5 0.5 0.5
Influent pressure, (bars) 1 1 1 or 21 Recirculation flow in mixing rig, (m3/hour)
5 5 5
Pressure drop (dP) for oil mixing, (bars)
2, 8 and 14 2, 8 and 14 2, 8 and 14
Temperature, (oC) 22 – 282 22 – 282 22 – 282 Bladder pressure in FIBRA, (bars)
1.6, 2.6 and 3.4 1.6, 2.6 and 3.4 1.6, 2.6 and 3.4
Hydraulic loading rate, range covered, (m/hour)
2 – 43 2 – 33 3 – 35
Dosage of flocculant (MRD 208SW), (ppm)
3.9 – 9.6 3.2 – 5.9 1.9
1) Influent pressure was normally 1 bar. In some tests with the influent pressure was increased to 2 bars. This is commented below when relevant.
2) The temperature was dependant on dP for mixing of oil and water. With 2 and 8 bars the temperature in the system was maintained at room temperature by cooling the recirculation flow. With a dP of 14 bars during mixing, the temperature increased up to 28oC.
Test equipment
Jorin ViPAOIW-PSD
~
P1 P2
Q2
T1
Q3
Data logging
Pump 4
Pump 1
Pump 2
Pump 3
Q1
Q4 = Q1-Q3
F
I
B
R
A
Test equipment
Jorin ViPAOIW-PSD
~
P1 P2
Q2
T1
Q3
Data logging
Pump 4
Pump 1
Pump 2
Pump 3
Q1
Q4 = Q1-Q3
F
I
B
R
A
Figure 23. Experimental set-up with the FIBRA connected to the mixing rig.

47
The tests were performed in a closed loop with a separator (3 m3) acting as a reservoir and holding tank. Oil was dosed continuously at the start of a test to achieve the desired concentration. Depending on the efficiency of the separator and the oil dosage level, the dosage of oil was adjusted in the later stages of a test to obtain a stable concentration. The main water flow is indicated with heavier lines. The flush water flow from the FIBRA is indicated with broken heavy line. In test periods 2 and 3 the flush water was pre-treated in a separate settling tank (not shown in Figure 23) before recirculation to the main separator.
6.4 Results from tests with FIBRA
The results from the FIBRA tests were analysed by use of Partial Least Squares (PLS) regression. This is a multivariate method for analysis of data similar to PCA used in WP3, but PLS is used for making a regression model between variables (X) and a response (y). The advantage of using PLS compared to normal linear regression is that PLS can be used when some X-variables are co-linear and/or in cases where there is non-controlled or larger than intended variation in the X-variable data. Specifically, when the experimental designs for FIBRA were made, underlying assumptions were that the temperature would be constant and that the oil dosage could be exactly controlled to desired levels. In practice, the temperature increased in some of the tests and the dosage of crude oils was difficult to control exactly due to different viscosity between the oils. By using PLS for analysis of results such variability could be accounted for and comparisons could be made for equal conditions using the regression model.
6.4.1 Removal of dispersed oil
The initial PLS regression was performed on all samples taken from the filtration experiments. Characteristics of the different oils were included as well as operating conditions. Of the initial 26 main variables, 5 were found significant for removal efficiency of dispersed oil.
-1.0
-0.5
0
0.5
1.0
-0.8 -0.6 -0.4 -0.2 0 0.2 0.4 0.6 TOPW_Fibra_Data…, X-expl: 42%,33% Y-expl: 75%,4%
Saturates
IFT
Pbl
ChemDos
Qfibra
Qfib**2
%R
PC1
PC2 X-loading Weights and Y-loadings
Figure 24. Loading plot for PLS regression on removal efficiency (%R).

48
Figure 24 shows the loading plot with the two first principal components (PC1 and PC2) from the PLS regression with removal efficiency as y-variable. The most important main X-variables lie along PC1 and are flow (Qfibra), bladder pressure (Pbl) and dosage of flocculant (ChemDos). The response in removal efficiency to flow has curvature that is accounted for by the square effect of flow (Qfib**2). The relative importance of the variables and if they are positively or negatively correlated with removal efficiency can also bee seen from a plot of the regression coefficients (Figure 25).
-0.4
-0.2
0
0.2
0.4
Oil Saturates IFT Pbl ChemDos Qfibra Qfib**2 TOPW_Fibra_Data…, (Y-var, PC): (%R,2)
X-variables
Regression Coefficients
Figure 25. Plot of regression coefficients from PLS regression on removal efficiency (%R).
The difference between the oil types is accounted for in the PLS model by interfacial tension and percentage of saturates from the SARA analysis. This can be seen from the score plot (Figure 26) showing the different samples plotted against PC1 and PC2.
-2
-1
0
1
2
3
4
-5 -4 -3 -2 -1 0 1 2 3 TOPW_Fibra_Data…, X-expl: 42%,33% Y-expl: 75%,4%
ExxsolExxsol ExxsolExxsol
ExxsolExxsolExxsol
ExxsolExxsolExxsolExxsolExxsol
Exxsol
Exxsol
Exxsol
Exxsol
ExxsolExxsol
ExxsolExxsolExxsol
Exxsol
Exxsol
Exxsol
Exxsol
Exxsol
Total B
Total B
Total B
Total B
Total B
Total BTotal BTotal B
Total B
Total B
Total B
Total B
Total BTotal B
Total B
Total BTotal B
Seillean
Seillean
Seillean
SeilleanSeillean
SeilleanSeillean
SeilleanSeilleanSeillean
Seillean
Seillean
SeilleanSeilleanSeillean
Seillean
Seillean
SeilleanSeillean
Seillean
Seillean
Seillean
Seillean
Seillean
Seillean
SeilleanSeillean
Seillean
PC1
PC2 Scores
Figure 26. Score plot for PLS regression on removal efficiency (%R).

49
Interfacial tension (IFT) and percentage of saturates (Saturates) lie along PC2 (Figure 24) and as can be seen from the score plot (Figure 26), the separation between the samples from experiments with different oils is along the vertical axis in the figure which is PC2. The PLS model with 2 principal components accounted for 79 % of the variation in the y-variable (100 % would be a perfect fit). The average error in the model for prediction of removal efficiency was 11 %. The influent droplet size distribution was represented by the 10 %, 50 % and 90 % percentiles in the number and volume based distributions where 100 % was the total number of oil droplets and the total volume of oil droplets, respectively. Including these data in the X-variables used for PLS regression showed that the 90 % percentile of the volume distribution was a significant variable in the initial regression with all the original 26 variables included, i.e. the fraction of oil in large droplets had an effect on removal efficiency. However, this variable was not significant when the regression was repeated with only the initial significant variables and was not included in the final model. The same was the case for the percentage of aromates. The effluent concentrations with different influent OiW concentration (350 and 50 mg/L), different hydraulic loading rate (3.5 and 30 m/h) and polymer dosage (0 and 4 mg/L) calculated with use of the PLS regression model are shown in Figure 27. The results can be used for assessment of oil removal with the two influent concentrations defined previously (Case 1 and 2) and compare the effects of hydraulic loading rate (given by Pbl) and polymer dosage. The highest influent concentration (350 mg/l) and polymer dosage (4 mg/l) are outside the range covered in the experiments with Seillean, which increases the uncertainty for this oil type.
0
30
60
90
120
150
180
210
240
270
Exxsol Total B Seillean
Eff
luen
t co
ncen
trat
ion,
(m
g/l)
Cinf: 350 mg/L; vf: 3.5 m/h Cinf: 350 mg/L; vf: 30 m/h
Cinf: 350 mg/L; vf: 30 m/h; 4 mg Polymer/L Cinf: 50 mg/L; vf: 3.5 m/h
Cinf: 50 mg/L; vf: 30 m/h Cinf: 50 mg/l; vf: 30 m/h; 4 mg Polymer/L
Model calculation for comparison purposes
Figure 27. Model calculation of FIBRA effluent concentration with different influent OiW concentration, different hydraulic loading rate and polymer dosage for comparison and assessment of expected performance.

50
The results demonstrate that with high influent oil concentrations (effluent from production separator), a very low hydraulic loading rate would be required to achieve the selected effluent criteria. It is indicated that a flow rate of 3 – 4 m/hour would be needed to achieve 30 mg oil/L, and that achieving this will be dependant on oil type. However, the results also indicate that for lower influent concentrations (effluent from hydrocyclone), possibly combined with a flocculant, sufficient oil removal for pre-treatment could be achieved. It should be noted that these results are based on experiments with constructed produced water, and should therefore only be used to assess expected performance. Technology qualification tests with real produced water are required before one can conclude with respect to design flow rate.
6.4.2 Removal of particles
During the experiments with Seillean, particles (100 mg SS/L) were dosed in addition to oil in two experiments. The particles dosed were kaolin with a median particle size of 6.7 µm. Dosage of particles was after mixing of oil and water, using pump 4 in Figure 23. To avoid measurement of dissolved solids (salt) in the suspended solids (SS) analysis, the filters were washed with distilled water before drying.
0.0
30.0
60.0
90.0
120.0
150.0
180.0
210.0
240.0
270.0
OiWinf OiWefl SSinf SSefl
Eff
luen
t co
ncen
trat
ion,
(m
g/l)
Exp #1: Cinf: 260 mg oil/L, 76 mg SS/L, vf: 7.2 m/h
Exp #2: Cinf: 260 mg oil/L, 108 mg SS/L, vf: 2.2 m/h
Figure 28. Influent and effluent concentration of dispersed oil (OiW) and inorganic particles (SS) in experiments with different hydraulic loading rate and dosage of kaolin and Seillean.
Figure 28 shows the influent and effluent concentrations of oil and solids in two experiments where the flow rate was varied by increasing the influent pressure from 1 bar to 2 bar. The results show that both dispersed oil and particles were removed in the FIBRA, and indicate that removal of dispersed oil was more influenced by the flow than removal of particles. This was as expected based on results reported by Fibra Ltd. (Griffiths 2005). Although efficient particle removal was obtained in both experiments, the hydraulic flow rate was quite low even in experiment 1 and the

51
effluent concentrations for particles (18 and 16 mg SS/L in experiment 1 and 2, respectively) were higher than the selected effluent criteria of 10 mg SS/L.
6.4.3 Bladder pressure and flow rate
From the discussion above it is clear that flow rate had a pronounced effect on oil removal in the FIBRA. The flow was a result of the applied bladder pressure in the tests reported here. However, both flow and bladder pressure were found to be significant main variables in the PLS regression. Some additional tests were therefore performed were the flow was adjusted independently of the bladder pressure using a valve and increased influent pressure if required.
0 %
10 %
20 %
30 %
40 %
50 %
60 %
70 %
80 %
90 %
100 %
0 5 10 15 20 25 30 35
Hydraulic loading rate on FIBRA, (m/hour)
OiW
rem
oval
, (%
)
Bladder pressure 1.8 bar Bladder pressure 2.6 bar Bladder pressure 3.4 bar
Figure 29. OiW removal efficiency at different bladder pressures versus hydraulic loading rate (m3/m2/hour) in experiments with Seillean crude oil.
Figure 29 shows the removal efficiency for dispersed oil at different bladder pressures versus hydraulic loading rate (m3/m2/hour). The experiments were run only with Seillean crude oil, so there are no data on other oil types. However, the results indicate that there is no gain in applying a higher bladder pressure than 2.6 bars. If higher removal efficiency is required, this must be achieved by reducing the flow. The linear trend lines in the figure are only an indication of the general trend. As discussed above, the relationship between flow and removal efficiency is probably non-linear. Based on the fibre diameter (0.1 mm) one can estimate the pore size for different packing geometries of fibres. I.e. the light opening along fibres packed in a triangular geometry would be approximately the size required for a spherical oil droplet with a size of 18 µm (Figure 30). This is larger than most of the oil droplets measured in the influent (median of volume distribution for all samples: 11.8 µm). This indicates that adsorption to the fibres and possibly coalescence in the FIBRA is part of the removal mechanism. To evaluate this further, information on the porosity of a fibre bundle would be needed.

52
Df = 100 microm Df = 100 microm
Doil = 41 microm Doil = ~18 microm
Df
Doil
Figure 30. Approximate size of oil droplets that can travel along the channels in the FIBRA fibre bundle for different packing geometries.
6.4.4 Use of FIBRA as a coalescer
In the last period a limited test with three experiments was performed to investigate FIBRA as a coalescer. The experiments were run with Seillean crude oil and a pressure drop during mixing of 14 bars. The flows were higher for a given bladder pressure than previously due to increased influent pressure (2 bars). The experiments were run longer (sampling times at 46 – 135 minutes) than the filtration experiments (sampling times at 15 – 45 minutes) in order to achieve full breakthrough of oil in the FIBRA effluent. The droplet size distributions (DSD) in the influent and effluent were measured periodically. In some tests a shift towards larger droplet sizes from influent to effluent was observed for the smaller droplet sizes (< 50 percent percentile) indicating coalescence. However, the opposite effect was also observed in several cases and the results were therefore unclear. The removal efficiency for dispersed oil varied from -10 – 69% with the highest removal in the experiment with the highest bladder pressure. Although the experiments were run for over two hours it is possible that breakthrough of oil was not fully achieved. Further investigation including separation tests with a unit placed after the FIBRA would be required to resolve this issue.
6.4.5 Flushing in filtration experiments and characterisation of fibres
Clogging of the fibre bundle was one of the failure modes identified for FIBRA. Results related this have been obtained through the filtration experiments described above where the effect of the flushing was assessed by the ability to regenerate the flow through the filter during the initial part of the filter cycle. Samples of fibres were also taken from the fibre bundle after each test period for inspection and measurement of contact angle. The wettability of single fibres was measured prior to use, after being kept in contact with asphaltene solutions and after being used in the FIBRA filtration unit. The results are summarised in Table 17. The results indicated that the wettability of the fibres changed and the fibres became more hydrophobic. The wettability change was most likely due to sticking of oil components on the
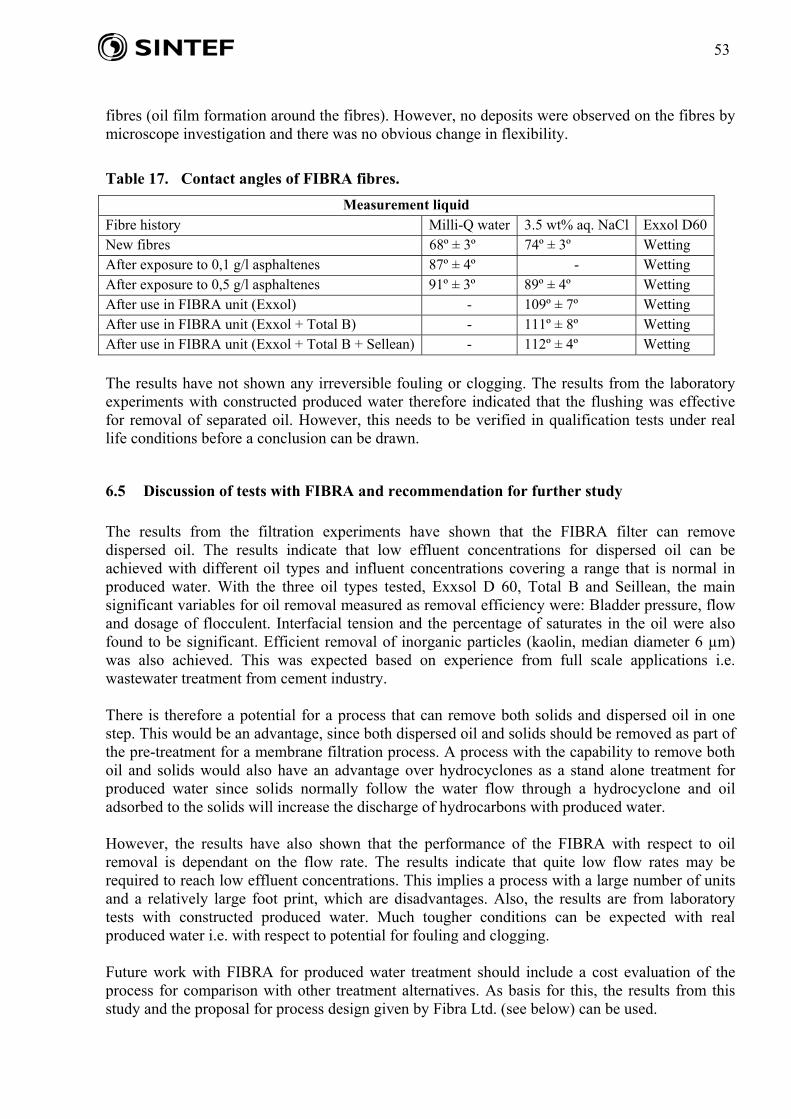
53
fibres (oil film formation around the fibres). However, no deposits were observed on the fibres by microscope investigation and there was no obvious change in flexibility.
Table 17. Contact angles of FIBRA fibres.
Measurement liquid Fibre history Milli-Q water 3.5 wt% aq. NaCl Exxol D60 New fibres 68º ± 3º 74º ± 3º Wetting After exposure to 0,1 g/l asphaltenes 87º ± 4º - Wetting After exposure to 0,5 g/l asphaltenes 91º ± 3º 89º ± 4º Wetting After use in FIBRA unit (Exxol) - 109º ± 7º Wetting After use in FIBRA unit (Exxol + Total B) - 111º ± 8º Wetting After use in FIBRA unit (Exxol + Total B + Sellean) - 112º ± 4º Wetting
The results have not shown any irreversible fouling or clogging. The results from the laboratory experiments with constructed produced water therefore indicated that the flushing was effective for removal of separated oil. However, this needs to be verified in qualification tests under real life conditions before a conclusion can be drawn.
6.5 Discussion of tests with FIBRA and recommendation for further study
The results from the filtration experiments have shown that the FIBRA filter can remove dispersed oil. The results indicate that low effluent concentrations for dispersed oil can be achieved with different oil types and influent concentrations covering a range that is normal in produced water. With the three oil types tested, Exxsol D 60, Total B and Seillean, the main significant variables for oil removal measured as removal efficiency were: Bladder pressure, flow and dosage of flocculent. Interfacial tension and the percentage of saturates in the oil were also found to be significant. Efficient removal of inorganic particles (kaolin, median diameter 6 µm) was also achieved. This was expected based on experience from full scale applications i.e. wastewater treatment from cement industry. There is therefore a potential for a process that can remove both solids and dispersed oil in one step. This would be an advantage, since both dispersed oil and solids should be removed as part of the pre-treatment for a membrane filtration process. A process with the capability to remove both oil and solids would also have an advantage over hydrocyclones as a stand alone treatment for produced water since solids normally follow the water flow through a hydrocyclone and oil adsorbed to the solids will increase the discharge of hydrocarbons with produced water. However, the results have also shown that the performance of the FIBRA with respect to oil removal is dependant on the flow rate. The results indicate that quite low flow rates may be required to reach low effluent concentrations. This implies a process with a large number of units and a relatively large foot print, which are disadvantages. Also, the results are from laboratory tests with constructed produced water. Much tougher conditions can be expected with real produced water i.e. with respect to potential for fouling and clogging. Future work with FIBRA for produced water treatment should include a cost evaluation of the process for comparison with other treatment alternatives. As basis for this, the results from this study and the proposal for process design given by Fibra Ltd. (see below) can be used.

54
Before the process can be used in full scale, tests on-site (off shore or on shore) with real produced water should be performed to qualify the technology. Such tests should verify the ability to remove dispersed oil and solids, and the efficiency of the flushing. The tests should also optimise the length of the filtration cycle and the flushing procedure to maximise the net water production. As basis for design of a test unit the results from this study can be used.
6.6 Proposal for flow sheet and layout for a FIBRA process on an off shore platform
During the TOP Water project many of the questions from the industry participants regarding FIBRA have been related to design issues. Such issues were not targeted in the research activities, but forwarded to Fibra Ltd. and discussed with their representatives. As part of the preparation for the technology assessment work shop in the TOP Water project (see section 9), Fibra Ltd. prepared a proposal for a possible layout and flow sheet for a FIBRA process (Fibra Ltd. 2008).
6.6.1 Design basis
The design basis with respect to flow, water quality, effluent specification, etc. was the same as used in the previous technology assessment (Lapique, 2006). The hydraulic loading rate was based on the results from the filtration experiments. The following information was given to Fibra Ltd.:
Produced water (PW) flow: 8000 m3/day Ambient temperature: -20 - +40oC. PW temperature: 50oC (+15 - + 80) Required up-time: 95 % Hydraulic load: 4 m/hour
The feed composition of the produced water would be either of the two cases defined in the previous study (Table 18). The values given were average/typical values. The values in brackets indicated expected range. For salinity a value of 35 g NaCl/l was assumed. Table 18. Produced water quality in FIBRA influent.

55
The objective of the treatment with FIBRA would be removal of dispersed oil and suspended solids. However, partial removal of other parameters was also expected because some are partly dissolved in the dispersed oil. The FIBRA process should meet the following criteria for dispersed oil, suspended solids and pH in the effluent when used for pre-treatment:
Dispersed oil: 30 ppm Suspended solids: 10 mg SS/l pH should be: ~7
Other information given to Fibra Ltd.:
The effluent from the FIBRA would be treated further in a membrane unit so the design should allow for a continuous effluent flow or include a buffer tank.
Flush water from the FIBRA would be treated for removal of dispersed oil and solids and thereafter re-cycled to the inlet of the main treatment process. The FRIBA should therefore be designed for PW flow (8000 m3/day) + recycle.
6.6.2 Proposal for process flow sheet and layout
The proposals for layout and flow sheet are given in Figure 31 and Figure 32, respectively. A design flow rate of 8 m/hour was chosen by Fibra Ltd. and justified by:
1. In their experience the results improved when going from laboratory scale to larger scale. 2. The use of larger diameter units (DN 150) that had shown improved performance
compared to the unit (DN 100) used in the filtration experiments in TOP Water. Fibra Ltd. therefore believed that even the chosen 8 m/hour was a conservative estimate that should be greatly improved with the latest designs and subsequent design work. The proposal showed a possible block layout (Figure 31) and flow sheet (Figure 32) of a Fibra system using an in-line configuration with 560 units stacked on 2 levels with 320 filters on level 1 and 240 filters on level 0 together with auxiliary equipment. The total foot print of the design was 10.8 m x 10.8 m on each level including space for auxiliary equipment and footpaths. Fibra Ltd. expected that detailed design would reduce the footprint. Of the 560, 520 would be in service at any one time. At any time 40 of the units would be out of service undergoing either flushing or CIP (cleaning in place) dependent on the stage of the operation cycle. Fibra Ltd. had therefore addressed the matter of clogging by having a large number of units offline at any time for flushing and CIP. In the flow sheet (Figure 32) a waste tank and waste treatment unit for treatment of flush water was indicated since this would be needed if a FIBRA process was to be used as a stand alone treatment. In the TOP Water treatment concept the flush water from the FIBRA was assumed to be treated together with the concentrate from the membrane filtration with a common buffer tank and waste treatment.

56
Figure 31. Possible layout for a FIBRA process on an offshore platform (Fibra Ltd. 2008).

57
Figure 32. Possible flow sheet for a FIBRA process on an offshore platform (Fibra Ltd. 2008).

58
7 TREATMENT CONCEPT FOR OIL EMULSIONS AND PARTICULATE REMOVAL (WP4)
The investigations and studies in WP4 have been conducted as a PhD study. A summary of results and findings (Silalahi, 2009) are given below.
7.1 Background for the studies in WP4
The focus of this study is on the treatment and removal of dispersed compound. The assumed effluent standard to meet in the study was set to oil concentrations of less than 5 ppm. Conventional separation methods such as gravity settling, dissolved gas flotation and hydrocyclones are widely used, often in combination with chemicals for coagulation and flocculation. The applicability, effectiveness, and costs of these technologies, however, are not well suited to target very low concentrations of oil in the treated PW (< 5 mg/l). These technologies also have difficulties or fail to treat fine oil emulsions droplets with size below 15µm. Based on assessment of available technology that could meet such a treatment target, membrane separation was found to probably be the best suited technology. In addition to efficient removal of oil emulsions and colloidal material, removal of some dissolved compounds is possible i.e. some naphthalenes, phenols and PAH (Faksness, 2004), and therefore also reduce the loading on the treatment step for “soluble” compounds. The overall objective in WP4 has been to investigate the potential and performance of membrane separation for treatment of oily waters such as PW. WP4 was therefore organized and structured to conduct the subtasks as outlined below:
Identify operating conditions and critical operating parameters (i.e. sustainable flux, degree of pre-treatment, flow rates, pressures etc.)
Elucidate the effect of produced water properties on physical performance (TMP, and sustainable flux) as well as hydrocarbon removal of microfiltration (membrane rejection)
Assess fouling mechanisms and major challenges with oily feed waters Propose and test fouling mitigation and fouling control strategies and techniques (i.e.
backwashing, back-pulsing, ultrasonic) Examine different chemical agents to clean the fouled membrane. Aspects i.e.
concentration, sequences, temperature of cleaning agents and TMP of membrane operations were investigated
The main results from these studies are summarized in the following.
7.2 Cross-flow microfiltration of analogue PW – effect of operating conditions
Initial studies we aimed at determining the optimal operating conditions for the ceramic membranes for given water qualities, i.e. performance as a function of type of oil, effect of variations in pH, salinity, surfactant concentration, particulate matter etc. The bench-scale test unit used in the study is illustrated in Figure 33. Three α-Al2O3 ceramic MF membranes nominal pore sizes of 0.1, 0.2 and 0.5 µm were mounted together in a tubular crossflow module. Each membrane has inside dimensions of 0.8 cm inner diameter, 1.1 cm outer diameter and 34 cm length. The effective membrane area was 85cm2. This experimental design enables direct

59
comparison of the performance of cleaning for difference membrane pore sizes. A peristaltic pump was connected to the permeate stream to give a constant permeate flow. Both retentate and permeate were circulated back to the feed tank. The permeate transmembrane pressure (TMP) for each membrane pore size during the filtration was monitored to observe the progression of the fouling process using a pressure transducer, temperature with temperature transducer and pH with pH meter. A data acquisition unit was connected to all transducers to record the data.
Figure 33. Schematic of bench-scale test unit, where three membranes are tested simultane-ously.
The oil emulsion feed was made using a crude oil with characteristics as shown in Table 19 and diluted with salt water. Different oil types (high and low viscosities) were selected to investigate the influence of oil properties. The dispersed oil was prepared by mixing oil and surfactant in a Ultraturrax homogenizer at a mixing rate of 2000 rpm for 10 minutes. The surfactant used was a non-ionic surfactant, SERDOX with concentration of 65, 250 and 450 ppm respectively. The surfactant concentrations were varied in order to produce different emulsion stability or droplet size. Further, the emulsion was continuously stirred and thermo regulated in the storage tank (Figure 33). The pH of solution was kept at 4±0.1, 6.2±0.1 and 9±0.1 respectively, adjusted using HCl 1N and NaOH 1N at temperature of 27 ±0.5oC or 40 ±0.5oC. The oil concentration was 50 and 350 ppm and salinity of 1.0 % or 3.5 %. Solid particles of kaolin were added at a concentration of 50 ppm with particle size distribution (psd) of 0.1 - 4µm. Scaling and corrosion inhibitor, concentration each of 10 ppm, was added to the solution to make the final composition of the produced water analogue.
Table 19. Oil characteristics for crude oil at 60oC.
Crude Oil Density
(gr/cm3)
Viscosity
(cP)
Saturates
(wt%)
Aromatic
(wt%)
Resins
(wt%)
Asph.
(wt%)
IFT
(mN/m)
TAN
(mg KOH/g)
Total B 0.84 4.5 63.69 28.63 6.29 0.35 12.92 0.49
Glitne 0.86 12.7 51.29 37.46 9.83 1.22 17.89 0.0
Seilean 0.94 505.0 35.76 41.35 18.18 4.58 17.20 3.36
A series of test were done to determine potential operating conditions. In particular a series of flux stepping test were performed to evaluate what kind of fluxes one could expect the system to operate under and subsequently the fouling rates one should expect. Based on a series of test were done with the three different membranes while change key operating conditions and feedwater characteristics.

60
The effect of pH was investigated. The effect on particle size distribution in the feed is shown in Figure 34. Coupling this with operating at different fluxes as conducted with an example of results obtained illustrated in Figure 35.
Figure 34. Effect of pH on particle size distribution of feedwater.
Figure 35. Example of effect of pH and flux on membrane filtration performance.
Similar tests were done looking at the effects of temperature, salinity, types of oil, varying surfactant concentrations, impact of particles (kaolin 0.1-4.0 µm), etc. For a complete summary of all tests done of the matrix reverence the PhD study which is the basis for this work package (Silalahi, 2009). An example of typical results observed is illustrated in Figure 36. Although varying in significance as far as fouling rates observed, a similar pattern was observed for most of the test combinations tried. The lowest fouling rates were generally measured for the membrane with smallest pore sizes. Fouling rates varied with feedwater properties (i.e. pH, salinity, viscosity) and the type of oil used in the analogue PW, where the oil emulsion size and size distribution was the main parameter affected by these properties. In general, the larger pore size membrane fouled more rapidly, where results indicated that internal membrane fouling and pore plugging probably are the dominant fouling mechanisms. For the smaller pore sizes, the 0.1 µm in particular, lower fouling rates were observed, indicating that the dominant fouling mechanism is probably an external phenomenon, i.e. particle deposition and cake formation. As such the fouling layer was more readily controlled and removed by the hydrodynamic operating conditions, i.e. crossflow velocities and membrane flux/transmembrane pressure values. As fouling is an inherent phenomenon in all membrane systems, the focus of the study was to try and gain a better understanding of the dominant fouling mechanisms and subsequently investigate strategies and techniques for fouling control and mitigation. Membrane cleaning was also

61
investigated as this is a necessary aspect for a sustainable operation of any membrane filtration process.
Figure 36. Example membrane performance for Total B oil and particles at different fluxes.
7.3 Ultrasonic time domain reflectometry for assessing membrane fouling
Assessment of membrane fouling is commonly extracted from in-direct conventional techniques where flux, pressure, concentration in feed, permeate and retentate are measured. Techniques i.e. Scanning electron microscopy (SEM), X-ray diffraction (XRD), and X-ray fluorescence (XRF) are a direct measurement used to analyze the foulant deposit, however, they are invasive and give less information about the dynamic development of fouling. Ultrasonic time-domain reflectometry (UTDR) is a non-destructive technique which has become the promising alternative for in situ monitoring of the growth of the fouling layer or compaction. In a recent study, broader pictures of membrane fouling during microfiltration of natural brown water was presented using UTDR. The UTDR technique was applied to obtain signals that correspond to the deposition and growth of the fouling layer. The ultrasonic frequency spectra were transformed into wavelets using “AGU-Vallen Wavelet” software that showed the change in signals between consecutive measurements, with a high resolution. The wavelet analysis was used to clarify the growth and the change in density of the fouling layer. The wavelets of differential signals made it possible to observe the growth of the fouling layer. The theory about wavelet transform from ultrasonic spectra has been reported previously. The main objective of this study is to investigate the potential of UTDR in assessing the main fouling mechanisms which occur during crossflow microfiltration of an oil emulsion. Advanced techniques in visualizing membrane fouling during MF of oil-emulsions using 2D and 3D forms were applied. Due to the test apparatus, it was not possible to use the ceramic membranes for this study. A membrane module made of polymethyl methacrylate (perspex) with inside length of 100 mm, width 20 mm, and 3 mm of channel height was used to give the effective membrane area of 0.0032m2. In a rectangular flat-bed test cell module, a Biodyne A (nylon) membrane sheet

62
(supplied by Pall Corp., Pensacola, FL) with a nominal pore size of 0.45 µm was mounted. A peristaltic pump was connected to the three way valve to feed the cell with clean water or oil emulsion at a constant flow. The transmembrane pressure was measured using a pressure transducer. A data acquisition unit was connected to the oscilloscope and pressure transducer to record the data. A schematic of the experimental setup is shown in Figure 37.
Figure 37. Schematic of experimental setup for UTDR tests.
The oil emulsion feed was made using crude oil with characteristics as shown in Table 19. The dispersed oil was prepared by mixing oil and surfactant with homogenizer at a mixing rate of 6000 rpm for 15 minutes. The surfactant used was Sodium Dodecyl Benzene Sulfonate (NaDBS) at concentration of 100 and 250 ppm. The pH was kept at 7 and adjusted using NaOH 1M. The oil concentration was 100ppm. A Zetasizer 4 was used to quantify the droplet size distribution and the oil characteristics, with oil drops being 0.1-1.5 µm and little larger than 1 µm. Flux decline over time (representing membrane fouling) for the two subset of oil emulsions is illustrated in Figure 38.
Figure 38. Flux development over time as a function of oil emulsions size in the feed solution.
Figure 39 shows the original ultrasound signal obtained from the two different ranges of particle size of oil. Each figure shows the changing amplitude recorded over certain arrival times. Fouling development in each figure can be shown by comparing 14 profiles of ultrasound signal shown with 14 different colours, which is derived from the actual time domain ultrasonic responses (or

63
waveforms). Each peak represents its own particular signal consisting of different membrane layers and the support layer underneath. The 0-s signal represents the signal which a clean membrane generates from the clean water feed which is introduced just before rapidly switching to the oil emulsion feed (requires 3 seconds). It was observed that there was a change in front of membrane peak where a small initial shifting towards the earlier arrival time for 10-s signal of particle size > 1µm and a shifting to a longer arrival time occurred for smaller particle sizes. These phenomena clearly distinguish the effect of particle size for the membrane fouling as early as the beginning. The particles which lie above the nominal pore size start to accumulate on the membrane surface and thus create a cake layer whereas the particles below the membrane nominal pore size start to adsorb inside the membrane pore which thus create internal fouling
Figure 39. Original signal OiWSDBS emulsion size >1 µm (left), emulsion size 0.1-1.5 µm (right).
Fouling development can be clearly visualized and quantified by applying 2D and 3D wavelets from the ultrasonic data. In Figure 39, the wavelets of ultrasonic spectra from 0 s to 60 min are visualized in 2D as a function of frequency and arrival time, and 3D as a function of time-frequency-magnitude. The 2D and 3D plots represent original and differential waveforms. The differential waveforms were obtained by subtracting the 0-s (clean membrane) waveform (reference waveform) from subsequent waveforms. The results are shown in Figure 40.

64
2D dan 3D Visualization of OiWSDBS particle size 0.1-1.5 µm
2D dan 3D Visualization of OiWSDBS particle size >1 µm
Figure 40. 2D and 3D visualization of fouling emulsion size 0.1-1.5 µm (top) >1 µm (bottom).
The study demonstrated that the UTDR technique can be used to show the effect of emulsion size on fouling mechanisms observe during membrane filtration of water containing oil emulsions. Distinguishing fouling by cake layer formation, adsorption and compaction is possible using the UTDR technique. The dominating fouling mechanisms observed for the larger emulsion size (>1mm) is predominantly cake layer formation or external fouling, followed by adsorption and a slight compaction of the membrane. For the smaller emulsions (0.1–1.5mm) adsorption and significant compaction followed by cake layer formation appears to be the main steps in the membrane fouling. Experimental results and data analysis show from the arrival time and amplitude data that oil adsorption occurs before compaction begins to take place. The compaction

65
process was observed from the shift in the arrival time of the membrane peak obtained by the UTDR analysis. 2 D visualization illustrates the progress of oil adsorption on to the membrane surface and pores while the3 D visualizes the compaction indicated by movement of the membrane location as seen by its specific arrival time or peak. Compaction was validated using an aluminium foil test. The UTDR analysis confirm and give a better insight to the fouling mechanisms observed based on the flux measurement data for the two types of feed solutions tested.
7.4 Fouling mitigation and control by back-pulsing
Fouling control by hydrodynamic techniques is not sufficient to maintain this sustainable long term operation and a combination with other fouling control techniques such as backwashing, relaxation may improve fouling. High frequency back-pulsing is a promising technique for fouling control. Back-pulsing is an in situ method of membrane cleaning to remove foulants from the membrane surface or pores. Back-pulsing is a cyclic process of forward filtration (Jf) followed by short reverse filtration (Jb) at high frequencies which can remove particle deposition that takes place within the first milliseconds. The mechanisms of flux enhancement using a back-pulsing technique are proposed to be a result from the diffusion of particles from the cake surface, erosion of the cake, decompression and subsequent washing away of the cake and a shock wave (due to the rapid valve closing) and knocking off part of the cake layer. Back-pulsing can be conducted using permeate or compressed air. There are several parameters associated with back-pulsing, i.e. back-pulse duration (tb) which is the amount of time operated under negative transmembrane pressure (ΔPb); and back-pulse interval defined as the duration of time between two consecutive pulses. Back-pulsing is a fouling mitigation and control technique that has been tried on crossflow membrane filtration systems. The bench-scale test apparatus was modified to enable direct comparison of the performance of back-pulsing strategy for the different membrane pore sizes for the same feed water. A peristaltic pump was connected to the permeate stream to give a constant permeate flow. The transmembrane pressure was monitored continuously using a pressure transducer, temperature with temperature transducer and pH with pH meter. A data acquisition unit was connected to all transducers to record the data. Permeate back-pulses were applied by connection with a pressurized tank through a three-way valve that opened and closed in a minimum of 0.05 seconds. A 20L pressurized tank was filled with deionised water for back-pulsing. An illustration of the membrane filtration setup is shown in Figure 41.
Figure 41. Schematic of bench-scale test unit, modified to do back-pulsing experiments.

66
Experiments were carried out for 2 hours with constant flux mode operation at crossflow velocities of 3 and 5 m/s. The retentate and a part of the permeate were circulated back to the feed tank to maintain a constant oil concentration, feed volume of 20L. The difference between the initial and final volumes of water in the pressurized reservoir is equal to the total permeate lost due to back-pulsing. The net permeate flux is calculated from the difference between the volume of permeate collected and the volume of permeate lost due to back-pulsing dividing by the operation time and the membrane surface area. The permeate transmembrane pressure (TMP) for each membrane pore size during the filtration was monitored to observe the progression of the fouling process. The fouled membrane was cleaned before each run using 3%-v Ultrasil 115 (base) and 1%-SurfactronCD50 (acid) for 1 hour at 80oC to produce a minimum of 80 % initial membrane permeability. The average initial membrane permeability for the 0.1µm, 0.2µm and 0.5µm membrane pore sizes was recovered between each run. The oil emulsion feed was made using a crude oil and diluted with salt water. The dispersed oil was prepared by mixing oil and surfactant in an Ultraturrax homogenizer at a mixing rate of 20000 rpm for 10 minutes. The surfactant used was a non-ionic surfactant, SERDOX, at concentration of 65 ppm. The stable emulsion was continuously stirred and thermo-regulated in the storage tank (Figure 41). The pH was kept at 6.2 at temperature of 27 ±0.5oC. The oil concentration was 50 ppm with a salinity of 1.0 %. Solid particles of kaolin were added at a concentration of 50 ppm. A scaling and corrosion inhibitor, concentration 10 ppm, was added to the solution to make the final composition of the produced water analogue. The performance of the filtration tests without back-pulsing are shown in Figure 42. During constant flow mode operation, fouling was assessed as a function of increasing TMP. It was observed that for membrane pore sizes of 0.1µm, 0.2µm and 0.5µm respectively, the flux decline is faster for 0.5µm, followed by 0.2µm and 0.1 µm membranes, and starts to stabilize after 20 minutes, 40 minutes and 100 minutes of operation time respectively.
0
500
1000
1500
2000
2500
3000
0 20 40 60 80 100 120
Operation time (minute)
Pe
rmea
bili
ty (
L/m
2 .hr.
ba
r)
0
0.1
0.2
0.3
0.4
0.5
0.6
0.7
0.8
0.9
1
No
rma
lize
d P
erm
ea
bili
ty
0.1µm_Permeability0.2µm_Permeability0.5µm_Permeability0.1µm_NormPermeability0.2µm_NormPermeability0.5µm_NormPermeability
0
5
10
15
20
25
30
35
40
0 20 40 60 80 100 120
Operation time (minute)
To
tal R
es
ista
nc
e (
10
13 1
/m)
0.1µm0.2µm0.5µm
Figure 42. Permeability without back-pulsing, calculated total resistances (right).
Investigation of back-pulse frequency effect was carried out at two different operational conditions. At 5m/s of crossflow velocity a selection of back-pulse frequencies of 0.1Hz, 0.2Hz and 0.4Hz were applied. At 3 m/s of membrane crossflow velocity frequencies of 0.1Hz, 0.2Hz, 0.4Hz and 1Hz were applied. The back-pulse duration used was 0.5s for both crossflow velocities whereas -0.15 bar reversed pressure was used for 3 m/s and -0.5 bar of reversed pressure for 5 m/s. Results are shown in Figure 43 and Figure 44 for the two conditions tested. The lower crossflow velocity and reverse pressure requires shorter back-pulse frequency than the higher crossflow velocity and reverse pressure for all membranes for sizes tested.

67
0
0.1
0.2
0.3
0.4
0.5
0.6
0.7
0.8
0.9
1
0 20 40 60 80 100 120
Operation time (minute)
No
rmal
ized
Per
mea
bil
ity
0.1µm_0.1Hz0.2s5ms0.1µm_0.2Hz0.2s5ms0.1µm_0.4Hz0.2s5ms0.1µm_NoPulse_3m/s
0
0.1
0.2
0.3
0.4
0.5
0.6
0.7
0.8
0.9
0 20 40 60 80 100 120
Operation time (minute)
No
rmal
ized
Per
mea
bil
ity
0.2µm_0.1Hz0.2s5ms
0.2µm_0.2Hz0.2s5ms
0.2µm_0.4Hz0.2s5ms
0.2µm_NoPulse_3m/s
0
0.1
0.2
0.3
0.4
0.5
0.6
0.7
0.8
0.9
0 20 40 60 80 100 120
Operation time (minute)
No
rmal
ized
Per
mea
bil
ity
0.5µm_0.1Hz0.2s5ms
0.5µm_0.2Hz0.2s5ms
0.5µm_0.4Hz0.2s5ms
0.5µm_NoPulse_3m/s
Figure 43. Back-pulse frequencies at 5 m/s for 0.1, 0.2, 0.5 µm respectively.
0
0.1
0.2
0.3
0.4
0.5
0.6
0.7
0.8
0.9
0 20 40 60 80 100 120
Operation time (minute)
No
rmal
ized
Per
mea
bil
ity
0.1µm_1Hz0.5s0.1µm_0.4Hz0.5s0.1µm_0.2Hz0.5s0.1µm_0.1Hz0.5s0.1µm_Nopulse
0
0.1
0.2
0.3
0.4
0.5
0.6
0.7
0.8
0.9
0 20 40 60 80 100 120
Operation time (minute)
No
rmal
ized
Per
mea
bil
ity
0.2µm_1Hz0.5s0.2µm_0.4Hz0.5s0.2µm_0.2Hz0.5s0.2µm_0.1Hz0.5s0.2µm_Nopulse
0
0.1
0.2
0.3
0.4
0.5
0.6
0.7
0.8
0.9
0 20 40 60 80 100 120
Operation time (minute)
No
rmal
ized
Per
mea
bil
ity
0.5µm1Hz0.5s0.5µm_0.4Hz0.5s0.5µm_0.2Hz0.5s0.5µm_0.1Hz0.5s0.5µm_NoPulse
Figure 44. Back-pulse frequencies at 3 m/s for 0.1, 0.2, 0.5 µm respectively.
The significance of back-pulse duration was investigated at the two crossflow velocities chosen. Results are shown in Figure 45 and Figure 46. The effect of the back-pulse duration shows a similar tendency as with the effect of back-pulse frequency. Results indicate that for the smaller membrane pore size needs less frequency and shorter duration than the more open membrane pore sizes. According to the result in the non-pulsing observation, the external fouling for the smaller membrane pore size is less pronounced than the bigger membrane pore size in the beginning of operation and therefore the shorter duration is needed for smaller membrane pore size during back-pulse operation.
0
0.1
0.2
0.3
0.4
0.5
0.6
0.7
0.8
0.9
1
0 20 40 60 80 100 120
Operation time (minute)
No
rmal
ized
Per
mea
bil
ity
0.1µm_0.2Hz0.05s5ms0.1µm_0.2Hz0.2s5ms0.1µm_0.2Hz0.5s5ms0.1µm_NoPulse_3m/s
0
0.1
0.2
0.3
0.4
0.5
0.6
0.7
0.8
0.9
0 20 40 60 80 100 120
Operation time (minute)
No
rmal
ized
Per
mea
bil
ity
0.2µm_0.2Hz0.05s5ms0.2µm_0.2Hz0.2s5ms0.2µm_0.2Hz0.5s5ms0.2µm_NoPulse_3m/s
0
0.1
0.2
0.3
0.4
0.5
0.6
0.7
0.8
0.9
0 20 40 60 80 100 120
Operation time (minute)
No
rmal
ized
Per
mea
bil
ity
0.5µm_0.2Hz0.05s5ms0.5µm_0.2Hz0.2s5ms0.5µm_0.2Hz0.5s5ms0.5µm_NoPulse_3m/s
Figure 45. Back-pulse duration at 5 m/s for 0.1, 0.2, 0.5 µm respectively.
0
0.1
0.2
0.3
0.4
0.5
0.6
0.7
0.8
0.9
0 20 40 60 80 100 120
Operation time (minute)
No
rmal
ized
Per
mea
bil
ity
0.1µm_0.2Hz1s0.1µm_0.2Hz0.5s0.1µm_0.2Hz0.2s0.1µm_NoPulse
0
0.1
0.2
0.3
0.4
0.5
0.6
0.7
0.8
0.9
0 20 40 60 80 100 120
Operation time (minute)
No
rmal
ized
Per
mea
bil
ity
0.2µm:0.2Hz1s
0.2µm_0.2Hz0.5s
0.2µm_0.2Hz0.2s
0.2µm_NoPulse
0
0.1
0.2
0.3
0.4
0.5
0.6
0.7
0.8
0.9
0 20 40 60 80 100 120
Operation time (minute)
No
rmal
ized
Per
mea
bil
ity
0.5µm_0.2Hz1s0.5µm_0.2Hz0.5s0.5µm_0.2Hz0.2s0.5µm_NoPulse
Figure 46. Back-pulse duration at 3 m/s for 0.1, 0.2, 0.5 µm respectively.
The back-pulse pressure could also have an effect on the fouling reduction and was therefore also investigated. Pulse amplitudes of -0.15, -0.25 and -0.5 bar were selected. Results are shown in Figure 47. For the 0.1µm membrane an increase of back-pulse amplitude above -0.25 bar does not

68
appear to improve the overall performance since there is a larger amount of flux lost for the higher reverse pressure. For the 0.2 and 0.5µm membranes an increase of back-pulse amplitude up to -0.5bar does increase the normalized permeability flux. These observations imply that there is an effect and also an optimum range of back-pulse amplitude for each membrane pore sizes that is required for the enhancement of permeate permeability
0
0.1
0.2
0.3
0.4
0.5
0.6
0.7
0.8
0.9
0 20 40 60 80 100 120
Operation time (minute)
No
rmal
ized
Per
mea
bil
ity
0.1µm_0.2Hz0.2s_0.15bar
0.1µm_0.2Hz0.2s0.25bar
0.1µm_0.2Hz0.2s0.5bar
0.1µm_NoPulse
0
0.1
0.2
0.3
0.4
0.5
0.6
0.7
0.8
0.9
0 20 40 60 80 100 120
Operation time (minute)
No
rmal
ized
Per
mea
bil
ity
0.2µm_0.2Hz0.2s_0.15bar
0.2µm_0.2Hz0.2s0.25bar
0.2µm_0.2Hz0.2s0.5bar
0.2µm_NoPulse
0
0.1
0.2
0.3
0.4
0.5
0.6
0.7
0.8
0.9
0 20 40 60 80 100 120
Operation time (minute)
No
rmal
ized
Per
mea
bil
ity
0.5µm_0.2Hz0.2s_0.15bar
0.5µm_0.2Hz0.2s0.25bar
0.5µm_0.2Hz0.2s0.5bar
0.5µm_NoPulse
Figure 47. Effect of back-pulse pressure 3 m/s for 0.1, 0.2, 0.5 µm respectively.
The influence of crossflow velocities of 3 m/s and 5 m/s on the effect of back-pulsing were investigated at a frequency of 0.2Hz and duration of 0.2s for membrane pore sizes of 0.1, 0.2 and 0.5µm respectively. The efficiency of rapid back-pulsing increases with the higher of crossflow velocities as shown in Figure 48. The effect of crossflow velocity decreases with the increasing of membrane pore sizes.
0
0.1
0.2
0.3
0.4
0.5
0.6
0.7
0.8
0.9
0 20 40 60 80 100 120
Operation time (minute)
No
rmal
ized
Per
mea
bil
ity
0.1µm_0.2Hz0.2s5ms
0.1µm_0.2Hz0.2s3ms
0.1µm_NoPulse_3m/s
0
0.1
0.2
0.3
0.4
0.5
0.6
0.7
0.8
0.9
0 20 40 60 80 100 120
Operation time (minute)
No
rmal
ized
Per
mea
bil
ity
0.2µm_0.2Hz0.2s5ms
0.2µm_0.2Hz0.2s3ms
0.2µm_NoPulse
0
0.1
0.2
0.3
0.4
0.5
0.6
0.7
0.8
0.9
0 20 40 60 80 100 120
Operation time (minute)
No
rmal
ized
Per
mea
bil
ity
0.5µm_0.2Hz0.2s5ms
0.5µm_0.2Hz0.2s3ms
0.5µm_NoPulse_3m/s
Figure 48. Effect of crossflow velocity on back-pulse 0.1, 0.2, 0.5 µm respectively.
The influence of kaolin particles on the process was investigated by comparing the performance with and without the particulate material. Figure 49 shows that when particulate material is present an improved filtration performance using the back-pulsing technique is observed. A similar response has been reported in other studies where a clay suspension and diatomaceous earth in oily wastewater was found to form a non-adhesive cake layer which was easily removed by reversal flow. The effect of the particles was explained in that the suspended solids enhance the permeability by acting as a dynamic membrane layer which prevents oil from fouling the membrane internally and also by adsorbing the rejected oil droplets and break up the continuous coalesced oil layer that otherwise may form on the membrane surface.
0
0.1
0.2
0.3
0.4
0.5
0.6
0.7
0.8
0.9
0 20 40 60 80 100 120
Operation time (minute)
Norm
aliz
ed P
erm
eability
0.1µm_0.2Hz0.2s5ms_SNC50
0.1µm_0.2Hz0.2s5ms_SNC0
0.1µm_NoPulse_3m/s_SNC50
0
0.1
0.2
0.3
0.4
0.5
0.6
0.7
0.8
0.9
0 20 40 60 80 100 120
Operation time (minute)
No
rmal
ized
Per
mea
bil
ity
0.2µm_0.2Hz0.2s5ms_SNC50
0.2µm_0.2Hz0.2s5ms_SNC0
0.2µm_NoPulse_3m/s_SNC50
0
0.1
0.2
0.3
0.4
0.5
0.6
0.7
0.8
0.9
0 20 40 60 80 100 120
Operation time (minute)
No
rmal
ized
Per
mea
bil
ity 0.5µm_0.2Hz0.2s5ms_SNC50
0.5µm_0.2Hz0.2s5ms_SNC00.5µm_NoPulse_3m/s_SNC50
Figure 49. Effect of crossflow velocity on back-pulse 0.1, 0.2, 0.5 µm respectively.

69
The final permeability after fouling with produced water in non-pulsing experiments shows that it is not significantly dependent on the membrane pore sizes even when the initial permeability is significantly different. Further, the resistance model is used to asses the fouling mechanism. It shows that external fouling followed by internal fouling is the fouling mechanism for all membrane pore size. Smaller membrane pore size (0.1µm) requires shorter frequency, longer duration and lower reversed membrane pressure than the bigger membrane pore size (0.2 µm and 0.5 µm) to obtain higher permeate permeability. This is consistent with the non-pulsing observation which shows that 0.1µm has a slower total resistance development. Increasing crossflow velocity improves the membrane performance better since the effect of shearing is more pronounced. The comparison between the produced water with and without solid particles shows that the one with particles gives higher permeate permeability. Further studies on other aspects i.e. oil concentration and oil types should be investigated.
7.5 Fouling mitigation and control by ultrasonic-crossflow microfiltration
Ultrasound (US) has been reported in literature to be a beneficial technique to both clean fouled membranes but also as potential method for reducing fouling. A strategy based on ultrasonic-crossflow filtration was therefore investigated as a non-invasive option for fouling control. The bench-scale test apparatus was modified by adding an ultrasonic unit where the membrane module was immersed in a water bath (66 x 31 x 10.2 cm3) of a sonicator (Honda Electronics Co, Ltd) as illustrated in Figure 50. The sonicator generated power of 300-600W output with frequency of 28, 45 and 100 kHz respectively by thirteen piezoelectric transducer with 3 cm of diameter.
Figure 50. Schematic of bench-scale test unit, modified to do ultrasonic-crossflow experiments.
The membrane was filtered with the analogue PW for 2 or 4 hours. In some experiments kaolin particles were added to investigate the effect of particulate matter. Experiments were carried out with a crossflow at 4.5 m/s and constant flux mode operation. The effect of flux was investigated on the 0.2µm membrane by stepping from 65, 130, 210 to 260 LMH. The effect of membrane pore size on the performance was tested with a selected flux of 260 LMH for the 0.1µm, 0.2µm

70
and 0.5µm respectively. Both retentate and permeate were circulated back to the feed tank to keep a constant concentration. The transmembrane pressure (TMP) for each membrane pore size during the filtration was monitored to observe the progression of the fouling rate. The ultrasonic experiments were carried out in 28, 45, 100 and mixed wave sonication in constant intensity of 300 and 600 W. In the mixed frequency, the US system produced 28, 45 and 100 kHz consecutively every 10 or 30s. Filtration experiments were carried out with and without US. Water bath temperature was maintained at 14oC by circulating cold water during US filtration. A peristaltic pump was connected to the permeate stream to give a constant permeate flow. The transmembrane pressure was monitored continuously using a pressure transducer, temperature with temperature transducer and pH with pH meter. A data acquisition unit was connected to all transducers to record the data. The following figures show the main results from the experimental matrix described above.
Figure 51. Effect of membrane pore size (0.1, 0.2, 0.5 µm respectively) with ultrasound.
Figure 52. Effect of membrane pore size (0.1, 0.2, 0.5 µm respectively) with ultrasound and particles.
The graphs in Figure 51 and Figure 52 illustrate the effect of US on the membrane performance with and without the additions of particles (i.e. kaolin). For the larger pore size (0.5 µm) there is a slight improvement in performance when US is applied. For the smaller pore sizes there is a clear benefit from operating with the US, though the choice of both intensity and wavelengths appear to have an impact as the result indicate. Results suggest that a mix of wavelengths has the better effect and that the duration of the respective wavelengths in the mix is of less importance. The less impact of US on the larger pore size supports the findings from using the pulsing technique that membrane fouling most probably is dominated by pore plugging and internal fouling. When the dominating fouling mechanism is a surface phenomenon (i.e. cake layer deposition and adhesion to the surface) the US appears to efficiently loosen this layer such that removal from the shear forces induced during crossflow manages to remove the foulants. In general, the ultrasonic-crossflow filtration improved the membrane performance by reducing the fouling rate, particularly for the smaller pore size membrane. However, the efficiency of the technique is dependent on the intensity and wavelengths chosen. Some impacts of the feedwater quality are also apparent but a full assessment of this needs further studies. One of the

71
disadvantages of applying a US energy source for fouling control is the effect this may have on the membrane material. Although one may assume that ceramic membranes have good mechanical and chemical resistance, experiments showed that if applied too intensely for a long period the membrane potentially can be disintegrated. Further studies are necessary to assess the impact of continuous/long-term application of US on the type of membrane chosen from a material integrity point of view. From the studies done n this project, however, US was found to be a beneficial technique when combined with periodic cleaning strategies or in combination with intensive membrane cleaning for recovery of membrane permeability.
7.6 Cleaning of fouled ceramic membranes
A major drawback in all membrane processes is the inherent fouling phenomena found in all membrane systems. During operation membrane fouling occurs, causing a progressive decrease of flux and potentially a loss of separation efficiency. Inevitably fouling reaches a certain point where extended cleaning is necessary to regain the original permeability of the membrane. Different cleaning protocols and strategies can be employed depending on the separation process and the type of membrane used. Chemically enhanced cleaning of fouled membranes will obviously produce a waste stream that needs to be managed. Regulations on the NCS have a strict code as far as types and quantities of chemicals that are used offshore, as such this also applies to those used for membrane cleaning. The use of biodegradable cleaning agents is an interesting option to comply with regulations, and to avoid the formation of secondary pollutant streams during off-shore operations. Optimal cleaning of a membrane will depend on the cleaning agent used and how it is applied. Choosing an agent and protocol will be a function of the membrane material, foulant characteristic and cleaning conditions i.e. concentration, temperature, pH, pressure, flow and time. In this study different types of cleaning agents and cleaning protocols/strategies were evaluated for efficient flux recovery of the α-Al2O3 tubular ceramic MF membranes. Three membranes with nominal pore sizes of 0.1, 0.2 and 0.5 µm, fouled by an analogue PW were tested. Two alkaline and two acidic biodegradable commercial products were evaluated; Ultrasil 115 and Derquim+ (alkaline solutions), Ultrasil 73 and SurfactronCD50 (acid solutions). The cleaning efficiency after membrane cleaning was determined by assessing flux recovery compared to the permeability of non-fouled membranes. The bench-scale filtration unit with three parallel tubular α-Al2O3 ceramic membranes with the respective nominal pore sizes was used in the study (Figure 33). The experimental setup enables direct comparison of the cleaning efficiency as a function of membrane pore size. A peristaltic pump was connected to the permeate stream to give a constant permeate flow. Both retentate and permeate were circulated back to the feed tank. A data acquisition unit was used for continuous measurement of the transmembrane pressure (TMP), temperature, and pH. The analogue feed was made using a crude oil with characteristics as shown in Table 19 and diluted with salt water. The dispersed oil was prepared by mixing oil and surfactant in an Ultraturrax homogenizer, mixing rate of 2000 rpm for 4 minutes. A non-ionic surfactant, SERDOX, at concentration of 200 ppm was chosen for this study. The feed was continuously stirred and thermo-regulated in the feed storage tank (Figure 1). The pH was kept at 4 and adjusted using HCl 1N at temperature of 25±1oC. The oil concentration was set at 350 ppm, with salinity of 3.5 %, and solid particles of kaolin added at a concentration of 50 ppm. Scaling and corrosion inhibitor, concentration 10 ppm, was added to the solution to make the final composition of the produced water analogue. The resulting oil droplet size distribution was measured by optical sensing and visual analyzes using a Jorin ViPA. The oil droplet characteristic was modelled to mimic produced water effluents from a hydrocyclone with oil drops < 15 µm.

72
The membranes were fouled with the analogue produced water for 2hr. Experiments were carried out with a crossflow velocity of 1 m/s. The constant fluxes for 0.1µm, 0.2µm and 0.5µm membranes were 80, 140 and 175 l/m2.hr (LMH) respectively. Different fluxes were applied to obtain comparable fouling rates (i.e. TMP development) for each membrane pore size. The TMP for each membrane pore size during the filtration was monitored to observe the progression of the fouling process to confirm that a comparable and reproducible fouling was generated (Figure 53).
0
0.05
0.1
0.15
0.2
0.25
0.3
0 20 40 60 80 100 120Operation time (minute)
TM
P (
Ba
r)
0.1µm
0.2µm
0.5µm
Figure 53. Fouling evolution of the three membranes in the test unit, expressed as change in TMP.
The cleaning procedure consisted of flushing with distilled water followed by the chemical sequence. The chemical cleaning was done using alkaline solution i.e. Ultrasil 115 (Henkel-Ecolab Ltd.) and acid solution i.e. and SurfactrondCD50 (Champion Tech). Ultrasil 115 is a mixture of KOH solution, SurfactronCD50 is a mixture of non-ionic surfactant and organic acid. The fouled membrane was cleaned using 3%-v of Ultrasil 115 and 0.5 %-v of SurfactronCD50 for 1 hour at 80oC at TMP of 0.25 bar to produce a minimum of 80 % initial membrane permeability. After chemical cleaning, the membranes were flushed with distilled water. An overview of the various combinations tested is summarized in Table 20.

73
Table 20. Formulated cleaning agent condition.
Cleaning No. Phase Solution pH Operating Condition (Temp, TMP)
1st 1%v-Ultrasil 115 12.2 80oC ;0.85 ± 0.1 bar 1
2nd 1%v-Ultrasil 73 2.65 80oC ;0.85 ± 0.1 bar
1st 1%v-Derquim+ 9.8 80oC ;0.85 ± 0.1 bar 2
2nd 1%v-Ultrasil 73 2.65 80oC ;0.85 ± 0.1 bar
1st 1%v-Ultrasil 73 2.65 80oC ;0.85 ± 0.1 bar 3
2nd 1%v-Derquim+ 9.8 80oC ;0.85 ± 0.1 bar
1st 1%v-Surfactron CD50 2.25 80oC ;0.85 ± 0.1 bar 4
2nd 1%v-Derquim+ 9.8 80oC ;0.85 ± 0.1 bar
1st 1%v-Surfactron CD50 2.25 60oC ;0.85 ± 0.1 bar 5
2nd 1%v-Derquim+ 9.8 60oC ;0.85 ± 0.1 bar
1st 1%v-Surfactron CD50 2.25 45oC ;0.85 ± 0.1 bar 6
2nd 1%v-Derquim+ 9.8 45oC ;0.85 ± 0.1 bar
1st 0.5%v-Surfactron CD50 2.85 45oC ;0.85 ± 0.1 bar 7
2nd 1%v-Derquim+ 9.8 80oC ;0.85 ± 0.1 bar
1st 0.25%v-Surfactron CD50 3.0 45oC ;0.85 ± 0.1 bar 8
2nd 1%v-Derquim+ 9.8 80oC ;0.85 ± 0.1 bar
1st 0.5%v-Derquim+ 9.25 80oC ;0.85 ± 0.1 bar 9
2nd 0.5%v-SurfactronCD50 2.85 45oC ;0.85 ± 0.1 bar
1st 2%v-Derquim+ 9.85 80oC ;0.85 ± 0.1 bar 10
2nd 0.5%v-SurfactronCD50 2.85 45oC ;0.85 ± 0.1 bar
1st 1%v-Surfactron CD50 2.25 80oC ;0.25± 0.1 bar 11
2nd 1%v-Ultrasil115 12.2 80oC ;0.25 ± 0.1 bar
Cleaning efficiency (Jr) was evaluated by comparing the clean-water flux of a cleaned membrane
(Jc) with the new membrane (Jw) under similar conditions and expressed as wcr JJJ / .The feed and permeate concentrations were measured for each membrane pore size to evaluate the effect of the cleaning agents to the membranes selectivity by using Gas Chromatography, model Agilent 6890 following the standard modification of ISO 9377-2.

74
7.6.1 Results of cleaning trials
Flushing with distilled water (Figure 54) gave a moderate flux recovery from 25 to 45 %, and cleaning efficiency decreasing with the increase of membrane pore size. This indicates that the solid particles in the analogue produced water potentially can penetrate the pores of the membrane with the larger pore size 0.5µm and cause pore plugging/blocking, whereas for the membrane with 0.1µm pore size, the solid particles mainly create a cake layer on the membrane surface. Further, the foulant deposited on the surface is not strongly bound to the membrane surface and thus the cleaning by inducing high shear forces during flushing is helpful.
Figure 54. Cleaning results by initial flushing of fouled Membrane.
The effectiveness of a single cleaning step for alkaline and acid solutions was investigated. The alkaline solutions and acid solutions are shown in Figure 55 for the different membrane pore sizes. Derquim+ has a higher flux recovery in comparison with Ultrasil 115, and SurfactronCD50 has a higher flux recovery in comparison with Ultrasil 73 for all membrane pore sizes. Although the pH of Ultrasil 115 is higher than Derquim+, the surfactant mixture in Derquim+ is more efficient since it has a stronger solubilisation effect on the oil on the membrane surface. The pH of Ultrasil 73 is lower than SurfactronCD50, however the cleaning efficiency is higher for SurfactronCD50. This might be due to the difference of the solution properties where SurfactronCD50 contains surfactant and organic and acid whereas the Ultrasil 73 is mainly EDTA solution. Therefore the effectiveness of SurfactronCD50 is stronger due to solubilisation of oil and inorganic foulants. Similar trend of cleaning efficiency has been reported using Ultrasil 75 (pH 1.5) and Ultrasil 70 (pH 2) for membranes fouled by oily wastewater. As slightly better results were obtained, Derquim+ and SurfactronCD50 were therefore used for further assessment of temperature and concentration effects. Both agents could not totally clean the membrane in a single step.

75
Figure 55. Cleaning effect of a single step with alkaline solutions (left), and acid solutions
(right). A comparison of all tested matrix of cleaning combinations are summarised in Table 21 and shown in Figure 56. Efficiency is given as fraction flux recovery. At high temperature (80oC, Cleaning 1-4), the total recovery for two steps cleaning is quite good except for the 0.5 µm pore size. This could possibly be due to pore plugging by colloidal material and the high TMP during cleaning which could compact the foulant into the membrane pores and thus give a lower flux recovery. The sensitivity of TMP during cleaning was tested by combining the low efficient cleaning agent acid/alkaline (SurfactronCD50-1%v/ultrasil 115-1%v) option. Reducing the TMP from 0.85± 0.1 bar to 0.25± 0.1 bar showed a significant effect and gave a higher total flux recovery. Table 21. Formulated cleaning agent condition.
0,0
0,2
0,4
0,6
0,8
1,0
1,2
1 2 3 4 11
Flux recovery
Cleaning number 0.1 µm 0.2 µm 0.5 µm
Figure 56. Cleaning at 80oC with different TMP. Assessment of biodegradable cleaning agents was carried out in this study. A direct single step cleaning procedure to fully restore the fouled membranes could not achieved by all the cleaning agents used. High temperature in combination with an alkaline and acid sequence gave a good cleaning efficiency, except for the 0.5 µm membrane pore size. Temperature affected the total cleaning efficiency, where higher temperatures gave higher flux recoveries. The operating mode during a cleaning cycle affects the overall outcome, i.e. reducing the cleaning TMP gave significant flux recovery, particularly for the membrane with the largest pore size. This study demonstrates that the cleaning efficiency of a fouled membrane is very much dependent on the choice of cleaning agents, the sequence in which they are used, and the procedure of the cleaning cycle (i.e. cleaning operating mode). Further studies are required for a comprehensive assessment and recommendation of cleaning protocols best suited for a specific type of membrane and application (i.e. type of foulants)
No of Cleaning
Test
Flux Recovery
0.1µm 0.2µm 0.5µm 1 0.98 0.99 0.85 2 0.98 0.97 0.84 3 0.99 0.90 0.60 4 0.98 0.98 0.90 5 0.93 0.99 0.81 6 0.91 0.91 0.81 7 0.91 0.93 0.69 8 0.82 0.84 0.63 9 0.87 0.77 0.53
10 0.89 0.87 0.71 11 1.03 1.06 1.05

76
8 TREATMENT CONCEPT FOR THE DISSOLVED CONSTITUENTS (WP5)
The investigations and studies in WP5 have been conducted as a PhD study. A summary of results and findings (Scurtu, 2009) are given below.
8.1 Background for the studies in WP5
The overall objective in WP5 has been to evaluate the feasibility of biological treatment of dissolved constituents in the wastewater streams from produced water, and investigate and develop optional reactor designs and enhanced biological treatment of target components in the water (i.e. BTEX, phenols, PAH, NPD) suitable for off-shore installation. WP5 was therefore organized in three subtasks as outlined below:
Identification of soluble target constituents: the objective of this subtask is to specify which components that should be targeted based on EIF and a feasibility study on application of biological treatment processes characterisation of solids and solid suspensions
Analysis of biodegradability of constituents: the objective of this subtask is to analyze the biodegradability of target substances, determine degradation rates and required operating conditions
Bioreactor designs and operation: propose a suitable reactor design and how this unit should be incorporated in the produced water treatment on an off-shore installation
Based on the literature review correlated with the challenges of the TOP Water project, an in-line sorption process coupled with biological regeneration of the sorption media was proposed for the treatment of dissolved compounds. The concept assumes that sorption media can be injected in the pipe transporting produced water, sorb the soluble harmful compounds, is extracted at the end of the pipe reactor and subsequently bio-regenerated continuously in a fluidized bed reactor (FBR), before being re-injected in the pipe for a new sorption cycle. The flow-scheme is illustrated in more detail in Figure 57.
Figure 57. Proposed treatment concept for the targeted dissolved constituents: sorption with bio-regeneration.

77
The focus of activities in this study has concentrated on the following issues:
Selective sorption of dissolved aromatic compounds, but not of organic acids, from produced water;
Influence of pH, acetic acid concentration, salinity and temperature on sorption process in batch experiments;
Sorption kinetics and sorption capacity for BTX and acetic acid in batch experiments; Designing and building a lab-scale experimental setup (FBR system) to evaluate the
feasibility of the proposed treatment concept; Sorption kinetics and sorption capacity for BTX in FBR tests; Development of a microbial culture able to feed on BTX as sole carbon source; Simultaneous sorption and biological regeneration in the FBR system; Off-line bio-regeneration of the spent sorbent in the FBR system; Loss of sorption capacity during long time FBR treatment processes alternating sorption
and bio-regeneration steps; Assessment of the feasibility of the proposed treatment concept.
The main results from these studies are summarized in the following.
8.2 Selective sorption of dissolved aromatic compounds – screening-tests
Screening tests were first conducted to determine which media was best suited for the treatment hypothesis and concept proposed in this study. Based on literature reviews and recommendations a set of three different types of media were chosen:
Activated carbons Natural zeolites Surfactant modified zeolites
Two commercial activated carbon products were tested; Cecarbon (Ceca) and Filtrasorb 400 (Chemviron Carbon), and three natural zeolites; ZS 500 RW (GSA Resources Inc.), WID (Zeoponix Inc.), Cabsorb SOS 820 (GSA Resources Inc.). In addition to these three surfactant modified zeolites were also tested; Bowman SMZ (Prof. Robert Bowman, New Mexico Tech), Zeoloc SMZ (Zeotech corporate), and ZeoSand SMZ (Zeo Inc.). An overview of the products are given in Table 22 with the respective acronym by which they are identified in the results and discussion.
Table 22. Overview of adsorbents with acronym.
No. Commercial name Acronym 1 Cecarbon AC 1 2 Filtrasorb 400 AC 2 3 ZS 500 RW NZ 1 4 WID NZ 2 5 Cabsorb SOS 820 NZ 3 6 Bowman SMZ SMZ 1 7 Zeoloc SMZ SMZ 2 8 ZeoSand SMZ SMZ 3
Screening tests were conducted with a solution of hydrocarbons representing a composition that is typically found in PW. All solutions were prepared with water purified with a Milli-Q system.

78
Initially, the screening tests were performed with fresh water, followed by saline water made by adding 35 g/l NaCl. Average concentrations of each component in PW are illustrated in Table 23. The screening tests were carried out with acetic acid and BTEX solutions.
Table 23. Average concentrations of each component in PW.
Compound Concentration (mg/l) 1 Benzene 4 2 Toluene 3.2 3 Ethylbenzene 0.2 4 Xylenes 1.2 5 Formic acid 1.2 6 Acetic acid 163 7 Propionic acid 18 8 Buthanoic acid 4 9 Valeric (pentatonic) acid 1.8
8.2.1 Comparing adsorption of acetic acid on chosen media
The first sorption-screening tests were done with acetic acid (160 mg/l), dissolved in purified water. Results of the tests are shown in Figure 58. From the initial results is apparent that activated carbon (AC 1) showed the highest adsorption of acetic acid, and therefore did not meet the requirements of the treatment process. The natural zeolites (NZ 1, NZ 2 and NZ 3) had the lowest affinities for acetic acid and therefore were the most suitable for the proposed treatment scheme.
Figure 58. Sorption tests of acetic acid; measured and calculate amount adsorbed on each media.
The effect of salinity on the sorption of acetic acid is illustrated in Figure 59. Although the amount adsorbed under saline water conditions were lower than in fresh water, the natural zeolites (NZ 1, NZ 2 and NZ 3) again showed a lower adsorption of acetic acid. The activated carbon (AC 1) adsorbed the highest amount of acid.

79
Figure 59. Effect of salinity on amount of acetic acid adsorbed on different media.
The adsorption of the chosen media with respect to BTEX was then tested. Solutions contained the average concentrations of each component of the BTEX group as indicated in Table 23. Tests were done using the saline water and the results from the tests are shown in Figure 60. Two of the media display a relatively good adsorption of BTEX, one of the natural zeolites (NZ 1) and one of the modified zeolites (SMZ 1). The activated carbon (AC 1) shows comparable performance, however, due to the very high adsorption of the acetic acid it is not an interesting option for the treatment concept being investigated.
Figure 60. Adsorbed of BTEX compounds on the different media.
8.2.2 Assessment of adsorption kinetics at low hydraulic retention times
Results of these screening-tests led to the conclusion that the natural zeolite NZ 1 was the most suitable sorbent for the requirements of the proposed treatment concept. Within the scope of the treatment concept an objective was to minimize the in-line sorption reactor and tests to assess the sorption kinetics were therefore conducted with the most promising media. A first approximation of the time available for the sorption process was estimated to 10 minutes taking into account challenges and limitations of offshore installations. Therefore the adsorption kinetics for the first 10 minutes was studied by measuring the amounts of acetic acid and BTEX sorbed by NZ 1 after

80
1, 3, 5, 7 and 10 minutes. Results of this test are illustrated in Figure 61. The two curves show similar adsorption kinetics for the acetic acid and BTEX, with around 0.035 mg/g adsorbed onto the NZ 1 after 10 minutes. The results obtained in the screening tests are comparable to results reported in literature.
Figure 61. Adsorption kinetics of acetic acid and BTEX on NZ 1 in saline water conditions.
From the initial screening-tests of the media investigated the following conclusions were drawn:
A small fraction of the surfactant (HDTMA) was released from the surface of surfactant-modified zeolites. This was a major impediment since this compound might be toxic to biological activity during regeneration process and can constitute a burden on the aquatic environment if discharged into the sea
Natural unmodified zeolites showed the lowest sorption of acetic acid in both fresh and saline water solutions, while activated carbons proved to be the most unselective by sorbing the highest amounts of acid
The sorption of acetic acids was lower in saline water due to the presence of chloride ions which compete with the dissociation products of acetic acid for the same sorption sites
At the normal pH values of produced water in the North Sea (6 -7.7), the organic acids are highly dissociated, the dominant species being the anions that cannot be sorbed normally to a high extent by natural unmodified zeolites, which have a negatively charged surface. However, they can be retained by the surfactant modified zeolites since these types of sorbents have a positively charged surface
Sorption kinetics of acetic acid and BTEX onto NZ 1 were similar. Results showed that the sorption process was very strong during the first 10 minutes, the amount of acetic acid and BTEX sorbed being around one third of the sorption capacity of NZ 1 for these compounds
Experimental work indicated that NZ 1 had the lowest affinity for acetic acid and the highest affinity for BTEX, among the tested media. Therefore, NZ 1 was considered the most suitable sorbent for the requirements of the treatment concept.
8.2.3 Assessment of media investigated in screening-tests
Experiments were designed to provide a comparison between the natural zeolite ZS 500 RW (NZ 1) and the organically modified clay Crudsorb. The solutions used contained 35 g/l NaCl, 5 mg/l benzene, 5 mg/l toluene and 5 mg/l p-xylene.

81
Sorption of the two different classes of compounds was studied at pH 3, 5 and 8. Results are shown in Figure 62.
Figure 62. Effect of pH on adsorption, natural zeolite and modified clay.
Results clearly show the influence of pH on the sorption of benzene, toluene and p-xylene in mixture with acetic acid. The organically modified clay (organoclay) sorbed around twice as much BTX compounds as the natural zeolite. In addition, the organoclay retained a lower amount of acetic acid compared to the natural zeolite at all pH values. It can also be observed that in the case of the natural zeolite, which has a hydrophilic surface, the retention increased in the order p-xylene < toluene < benzene, while in the case of the modified clay, which has a hydrophobic surface, the uptake increased in the inverse order: benzene < toluene < p-xylene. Results suggest that the removal of BTX components follows the general solubility principles, corresponding to an increasing octanol/water partition coefficient in the order benzene (1.64), toluene (2.25.) and xylene (2.76). Since the modified clay showed a better performance than the natural zeolite with regard to the BTX and acetic acid sorption during the first tests, subsequent experiments were only conducted with the modified clay to assess the effects of acetic acid concentration, salinity and temperature.
8.2.4 Effect of acetic acid concentration
Initial experiments showed that the amount of BTX sorbed by the modified clay decreased proportionally with the increase of acetic acid amount retained. Since the concentration of organic acids varies in produced water, its influence on the retention of the BTX compounds was studied by running experiments with 3 different initial acetic acid concentrations (0, 160 and 320 mg/l). The tests were done at pH 5, where approximately half of the acetic acid is in the form of acetate anion (dissociated), while the other fraction is in the molecular form (undissociated). The results are shown in Figure 63.

82
Figure 63. Effect of acetic acid concentration on adsorption with the modified clay.
It is apparent that the amount of acetic acid sorbed increased with increasing initial concentration of acid, with the amount of BTX sorbed decreasing proportionally with increasing concentration of acetic acid. This shows a sorption competition between the two different groups of substances.
8.2.5 Effect of salinity on adsorption
The salinity of produced water varies, ranging from zero in condensed water up to several times the salt concentration of seawater. The influence of salinity was assessed by carrying out experiments at three different concentrations (NaCl of 0, 35, 70 g/l) while keeping the other parameters constant (pH = 5, temperature = 25°C, acetic acid concentration = 160 mg/l). Results are shown in Figure 64.
Figure 64. Effect of salinity on adsorption of BTX and acetic acid with the modified clay.
The decrease of acetic acid sorption onto the organoclay when the ionic strength was increased is consistent with the results published in literature.

83
8.2.6 Effect of temperature on adsorption
Temperature of produced water varies between 3 and 80°C, depending on the field. In this study experiments were run at 20, 40 and 60°C, the other 3 parameters being kept constant (pH = 5, acetic acid concentration = 160 mg/l, NaCl concentration = 35). Results are shown in Figure 65.
Figure 65. Effect of temperature on adsorption of BTX and acetic acid with the modified clay.
The amounts of both BTX compounds and acetic acid sorbed on the organoclay decreased when the temperature was increased from 20 to 60°C. The increase of temperature negatively influenced the uptake capacity of sorbent due to desorption of molecules at the interface, i.e. increase of BTX and acetic acid solubilities in aqueous solutions. Similar temperature effects on organic acids sorption have been reported in literature.
8.2.7 Adsorption kinetics of the modified organoclay
The sorption kinetics of BTX onto the organoclay was investigated by measuring the concentrations of all compounds in the liquid phase after 1, 5, 10, 30, 60, 120, 240 and 1440 minutes. Experiments were run both without acetic acid, and with 160 mg/l acetic acid (pH 5, at which the acetic acid is half dissociated). Results are shown in Figure 66. Results presented show the ratio between the concentration of a compound in solution at a given time (C) and its initial concentration in the liquid phase (C0). The initial concentrations of dissolved compounds used in the sorption tests were 5 mg/l for each BTX and 160 mg/l for acetic acid. Like in the previous tests, p-xylene was the most strongly retained member of the BTX group, while benzene was the least sorbed.

84
Figure 66. Adsorption kinetics of BTX, without and with acetic acid.
The kinetic data were subsequently fitted to a pseudo-first-order and pseudo-second-order model describing the adsorption process. An assessment of the two models showed a better fit of the experimental data with the pseudo-second-order model, and this was therefore selected to predict the sorption kinetics of BTX and acetic acid on the organoclay.
8.2.8 Overall conclusions of screening-tests
The organoclay showed better sorption properties for BTX and lower affinity for acetic acid than the zeolite and was therefore chosen for subsequent tests to assess effects of varying operating conditions. Influence of pH, initial acetic acid concentration, salinity and temperature on the sorption properties of the organoclay was studied by varying the value of one of the four parameters and keeping constant the values of the other three. The following conclusions were drawn:
Uptake of BTX increased when less acetic acid was sorbed and vice-versa. Sorption competition between BTX compounds and acetic acid on the hydrophobic chains of the quaternary amine immobilized on the surface of the clay was observed
Sorption of acetic acid decreased proportionally with the increase of pH since the molecular form of the acid was better retained than the ionic form by the modified clay
Sorption onto the organoclay increased in the following order: benzene < toluene < p-xylene. Retention of BTX compounds by organoclay took place by a partition mechanism and increased with the decrease of solubility in aqueous solutions
Retention of BTX was enhanced when the concentration of NaCl was increased from 0 to 70 g/l which can be explained by the salt-out effect. On the other hand, uptake of acetic acid decreased when salinity was increased
Sorption of both BTX and acetic acid decreased with the increase of temperature since this influenced the solubilities of the solutes.

85
8.3 Selective sorption and biological regeneration in a fluidized bed reactor
The adopted treatment concept is based on selective sorption of BTX compounds onto an organoclay (Crudsorb) and biological regeneration of the spent media in a fluidized bed reactor (FBR). The experimental configuration and setup of this study is shown in Figure 67.
Figure 67. Experimental setup of selective sorption and biological regeneration in a fluidized bed reactor.
8.3.1 Screening-tests to determine BTX degraders
The study of BTX biodegradation was started by finding and selecting a good microbial inoculums able to achieve high degradation rates of the target compounds. Four different sources of microbial communities potentially capable of degrading BTX were chosen. A setup was installed to grow microbial cultures from these origins, which fed on BTX as sole carbon source. The origins of micro-organisms were as follows:
1. Natural sea water from Trondheim fjord, Norway; 2. Sludge from an ozonation – biofiltration system for biodegradation of natural organic
matter (NOM) and selected organic micropollutants; 3. Sludge from a conventional municipal wastewater treatment system; 4. A commercial blend of naturally occurring micro-organisms provided by Catalina
Biosolutions (USA based company). The degradation capacity of the different sources was tested by determining the growth of biomass achieved from each inoculum. Results demonstrated that the microbial culture prepared with the commercial blend of micro organisms (provided by Catalina Biosolutions) contained the highest concentration of bacteria (8.36 E+07), while the lowest concentrations were determined in

86
the blank samples and in those in which sludge from the ozonation-biofiltration plant was added as microbial source (Figure 68). Based on the results of the screening test, it was decided to continue this study using only the inoculum produced with the commercial microbial blend.
Figure 68. Biomass concentration for the four inoculum sources investigated.
Biodegradation rates were evaluated by conducting BOD tests on various conditions. Three different types of samples were prepared:
1. Microbial inoculum + synthetic sea water matrix (blanks); 2. Microbial inoculum + sodium acetate (2 mg/l) + synthetic sea water matrix. 3. Microbial inoculum + BTX (2.5 mg/l) + synthetic sea water matrix;
Dissolved oxygen (DO) concentrations were measured in the BOD bottles in the beginning of the test and after 7, 14 and 28 days respectively. The results measured for the three conditions defined above are summarized in Table 24.
Table 24. Dissolved oxygen concentration measured in BOD tests.
Days 0 7 14 28 1 Inoculum + synthetic matrix (blanks) 7.3 7.3 7.2 7.1 2 Inoculum + acetate + synthetic matrix 7.3 6.3 5.9 5.6 3 Inoculum + BTX + synthetic matrix 7.2 3.0 1.4 0.2
From the BOD analysis it is apparent that no degradation takes place in the blank sample set, while a good degradation of the BTX is achieved compared to the biodegradation of the acetate. The theoretical amounts of oxygen needed to biodegrade 1 mg of benzene, toluene or p-xylene are 3.077, 3.13 and 3.17 mg respectively, while 0.78 mg O2 is necessary to biodegrade 1 mg sodium acetate. The amounts of reference compound (sodium acetate) biodegraded after 7, 14 and 28 days were 64 %, 84 % and 96 % of the initial amount, respectively (Figure 69 A). Since sodium acetate was reasonably degraded within a short time span, it was concluded that the BOD test was successful. The calculated biodegradation of the BTX compounds was 55 %, 75 % and 89 % of the initial amount after 7, 14 and 28 days respectively (Figure 69 A). The BOD test does not give any detailed information about the biodegradation of each individual member of the BTX group. A second test was therefore conducted in which the BTX concentrations were determined by GC/MS at the same time intervals as in the BOD test performed (Figure 69 B). Results show biodegradation increased in the following order: p-xylene < benzene < toluene (i.e. toluene is easiest biodegradable member of the BTX family while p-xylene is the least biodegradable).

87
However, overall biodegradation calculated for total BTX was 59 %, 77 % and 93 % of the initial amount after 7, 14 and 28 days respectively (Figure 69 B). Results are comparable to that measured in the BOD test. The test demonstrates that the inoculum prepared from the commercial microbial blend was a viable source of BTX degraders that could be further used to inoculate the lab-scale fluidized bed reactor.
A) Measured by BOD tests B) BTX by GC/MS analysis
Figure 69. Biodegradation (%) of BTX and acetic acid; A) BOD test and B) GC/MS analysis.
8.3.2 Sorption study of BTX in the FBR without biodegradation
Two sets of experiments were planned in order to investigate whether bio-regeneration is a viable process for the recovery of the sorption capacity of the organoclay. The first set was to determine the process without biodegradation. Sorption is the only removal mechanism for organic compounds when no nutrients and oxygen are supplied into the system. In this case, breakthrough of organic pollutants occurs in the system after the sorption capacity of the organoclay is exhausted. The results are shown in Figure 70.
Figure 70. Sorption of BTX without biodegradation in the FBR.
The average benzene, toluene and p-xylene concentrations in the influent to the fluidized bed system were 6.3, 5.4 and 4.4 mg/l, respectively (total COD = 50.2 mg/l). The order of break-through based on the volume of water treated at which the component was first detected was as follows: benzene (11.25 l water or 58 bed volumes), toluene (13.5 l water or 70 bed volumes) and

88
p-xylene (22.5 l water or 115 bed volumes). These results suggested that the removal of BTX components followed the general solubility principles, corresponding to an increasing octanol/water partition coefficient in the order benzene (1.64), toluene (2.25.) and p-xylene (2.76). The observed sorption rates of the compounds were 0.34 mg benzene/g organoclay-h, 0.29 mg toluene/g organoclay-h and 0.24 mg p-xylene/g organoclay-h, which means 2.71 mg COD/g organoclay-h or 0.0650 kg COD/kg organoclay-day. Benzene was sorbed at a higher rate than toluene and p-xylene due to a higher concentration in the influent. The sorption capacities calculated based on the obtained results were: 0.43 mg benzene/g organoclay, 0.44 mg toluene/g organoclay and 0.60 mg p-xylene/g organoclay. These values are about 10 times higher than the sorption capacities previously measured in batch experiments. A possible explanation is the better contact between the solution and the organoclay in the fluidized bed reactor compared to the batch test configuration.
8.3.3 Simultaneous sorption and biodegradation of BTX in the FBR
Studies were conducted with the fluidized bed system designed to combine the effects of sorption and biodegradation. The aim of these experiments was to determine if this process configuration enhances the performance of the sorbent with respect to BTX removal. A culture of BTX degraders was established in the fluidized bed reactor by enriching the culture obtained from the commercial inoculum chosen in the screening tests. Once the bacteria cell concentration was around 1.0 E+8 cells/ml the experiments were started. A continuous feed of synthetic seawater containing BTX and nutrients (stoichiometric ratio of 100/5/1:COD/N/P). BTX concentration was less than 1 mg/l. Results are shown in Figure 71.
Figure 71. Simultaneous sorption and biodegradation of BTX in the FBR.
The breakthrough order based on the volume of water treated at which the compound was first detected was similar to that observed with sorption and no biodegradation (Figure 70). The breakthrough of all three BTX compounds were first detected in the effluent of the fluidized bed reactor after a larger volume of BTX solution was treated: benzene (33.75 l or 173 bed volumes), toluene (42.75 l or 219 bed volumes) and p-xylene (56.25 l or 288 bed volumes). Results show the superior performance of the simultaneous sorption-biodegradation process configuration compared with the system based only on sorption. The biological activity in the fluidized bed reactor delayed the breakthrough of BTX compounds but did not prevent it, probably due to an overloaded system with respect to its biological regeneration capacity. One hypothesis is that the

89
biofilm of microorganisms detected on the organoclay particles biodegraded the sorbed BTX compounds and in this way, the sorbent recovered to some extent its sorption properties. However, microorganisms not attached to the organoclay may have contributed to the biodegradation of the BTX compounds in the water phase, thereby reducing the concentrations the sorbent was exposed to. Although the simultaneous sorption and biodegradation does show a potential for a process design, an alternative option that may have more merit is designing the FBR reactor for an off-line regeneration of the sorbent while utilizing the sorption capacity in an in-line configuration. Experiments were subsequently run to investigate this option.
8.3.4 Off-line biological regeneration of the organoclay in the FBR
The FBR was operated in three different modes in order to achieve a rapid sorption of the BTX compounds, followed by an efficient bio-regeneration of the spent organoclay bed. All modes started with a 5 min dosage of a BTX containing solution followed by a 2 h sorption step, a bio-regeneration step of variable durations and a period of recirculation of the liquid in the system under oxygen deprivation. The FBR was operated in the following three operation modes:
6 h cycles (2 h sorption, 2 h bio-regeneration, 2 h recirculation without aeration) 8 h cycles (2 h sorption, 5 h bio-regeneration, 1 h recirculation without aeration) 6 h cycles (2 h sorption, 4 h bio-regeneration)
Long term experiments were also conducted to assess the efficiency of the bio-regeneration process over a longer period.
8.4 Overall conclusions from WP5
Selective sorption of BTX compounds from wastewater was demonstrated by using an organoclay. This sorbent showed good affinity for BTX compounds and at the same time retained only to a low extent acetic acid from wastewater. A sorption competition was observed between BTX compounds and acetic acid onto the organoclay. Sorption of acetic acid decreased proportionally with the increase of pH because the molecular form of acetic acid found in solution at low pH was better retained than the ionic form by the modified clay. Sorption of BTX was described as a partition mechanisms and it was observed to increase with the increasing octanol/water partition coefficient of a compound (benzene < toluene < p-xylene). BTX sorption increased with the increase of salinity from 0 to 70 g/l because of salt-out effect. Sorption of both BTX and acetic acid decreased with the increase of temperature since this influences solubilities of solutes.
Sorption capacities of organoclay particles, fluidized in the reactor, were about 10 times higher than in the case of batch experiments probably due to better contact between sorbent particles and liquid phase containing the dissolved compounds. Sorption capacities of organoclay bed for BTX measured during FBR sorption tests were: 0.43 mg benzene/g organoclay, 0.44 mg toluene/g organoclay and 0.60 mg p-xylene/g organoclay. These capacities are lower than those reported in the literature for other sorbents such as activated carbons. However, the organoclay was preferred for its higher selectivity for BTX compounds. Sorption kinetics tests showed that sorption process is much stronger in the first minutes than towards the point where sorption equilibrium is reached.

90
FBR experiments using only sorption and simultaneous sorption and biodegradation for
BTX removal showed that the use of an organoclay as biomass carrier in a FBR produces a system in which BTX removal capacity is enhanced compared to a process with only sorption and no biodegradation
High biodegradation rates were calculated for the experiment in which simultaneous sorption and biodegradation of BTX were investigated: 1.72 kg benzene/mP3P-day, 1.54 kg toluene/mP3P-day and 1.21 kg p-xylene/mP3P-day, which mean 13.94 kg COD/mP3P-day or 0.0591 kg COD/kg organoclay-day. However, breakthrough of all BTX components was observed in the system due to the high BTX concentrations in the solution pumped into the FBR, which overloaded the system.
Off-line biological regeneration of the organoclay is feasible in a FBR by alternating sorption and biological regeneration steps. Operating conditions depend on wastewater quality, therefore FBR operation must be tuned first to sorb the entire amount of BTX compounds from produced water and then completely biodegrade the previously sorbed compounds in order for the organoclay bed to recover its entire sorption capacity.
A FBR operation cycle of 8 h, with 2 h sorption without aeration after BTX and acetic acid dosage and 6 h biological regeneration with 5 h continuous aeration after nutrients dosage, was found to provide the best results. The biodegradation rates of BTX and acetic acid (50 mg/l in the feed solution) were 0.30 kg benzene/mP3P-day, 0.31 kg toluene/mP3P-day, 0.42 kg p-xylene/mP3P-day and 0.14 kg acetic acid/mP3P-day, which means 3.37 kg COD/mP3P-day (0.0143 kg COD/kg organoclay-day).
Long-time off-line bio-regeneration experiments indicated that the organoclay bed lost a part of its sorption capacity over time. Possible causes for this phenomenon could be: accumulation of organic compounds and minerals, particle attrition, desorption and biodegradation of the tailoring agent (dimethyl dihydrogenated ammonium chloride).

91
9 FINAL TECHNOLOGY ASSESSMENT (WP2) Towards the end of the project a technology assessment was performed as a continuation of the work reported in the DNV report No 2006-1044 (Lapique, 2006) where failure modes of the novel treatment concept for produced water were identified. The aim of this assessment was to document how the research done in the TOP Water project had helped to shed light on the different failure modes and mechanisms and thus reduced the uncertainty about the feasibility of the concept. To facilitate the discussion a workshop was held in Trondheim on November 5th 2008. The research in TOP Water addressed many of the failure modes and mechanisms identified in the workshop in 2006 (Table 7). At the workshop status with respect to results was presented and discussed. A summary of the discussion and the conclusions from the workshop are given below (Weitzenböck, 2008).
9.1 Discussion of achievements
9.1.1 Objectives
To be able to evaluate progress in the project and assess what has been achieved, it was necessary to go back to the original project proposal to recall the initial aims of the project. According to the original project proposal the major goals of the project were to:
Develop standardized protocols for characterization of produced water that can be used for Environmental Impact Factor (EIF) evaluation and selecting treatment solutions.
Develop methods for enhanced removal of dispersed oil and fines; target 5 ppm oil in treated water.
Develop methods for removal of selected dissolved/soluble components in produced water (i.e. BTEX (Benzene, Toluene, Ethyl-Benzene, and Xylene), C0-C3 phenols) based on biological treatment.
The above goals will be implemented by accomplishing the following scientific and technological objectives; from EIF studies evaluate and identify target substance to be removed from produced water, make an assessment of the capabilities and challenges of current treatment strategies. Undertake fundamental studies and laboratory / pilot plant tests with regard to applying state of the art analytical techniques to characterize the produced water to be treated, investigate treatment strategies and technologies for removal of suspended and dissolved constituents in the water. Early in the project it was decided to limit the application of the treatment for use top-side offshore. During the workshop on the 5th November 2008 it was discussed to also look at the aspect of competence building – what had been learned and what was known about the robustness of the processes and how they cope with variable conditions? Did the research in TOP Water add something unique to water treatment? Did one manage to overcome any of the show stoppers identified in the failure mode assessment from 2006? In particular membrane filter systems have a reputation in the offshore industry of not being reliable (“will they ever work?”). And finally would companies take this technology further?

92
9.2 Characterization of produced water
The results presented were not complete as the analysis of the experimental results was still ongoing. Once the analysis was complete one would be able to tell what characteristic of the crude oil and water affects droplet size and stability. Furthermore, one would be able to identify what is important for good emulsion stability and separation. It was also discussed how viscosity and density affected the droplet size distribution without a definite conclusion. It seemed that the Turbiscan analyzer is a good tool for emulsion stability measurement.
9.3 FIBRA filter module
The attraction of the FIBRA filter module was that it removes particles and oils. Owing to the fact that the removal mechanisms were different, there would different optimal flow rates for removal of solids and oils. Perhaps it would possible to use FIBRA for only one of the task, e.g. removal of particles? There were two principal properties affecting the performance of the FIBRA module: operational parameters & oil properties. The rate of removal is dependent on the flow rate and bladder pressure. In general flow rates were low, between 3-4 m/h. It was observed that the FIBRA system was big and complex compared with the other known alternatives and it was reckoned that the system would be too large for oil removal offshore. One proposal was to use FIBRA as a coalescer for oil and to remove particles. Perhaps it would be more reliable than other fibre coalescers? It was agreed to change the remaining test programme for the FIBRA filter module in order to investigate this hypothesis.
9.4 Filtration module with ceramic membrane
Scaling and biological and chemical fouling are the main issues for membranes used offshore. However, in TOP Water only fouling by oil was addressed in the research. Here it was mainly build-up of an oil layer or cake. It was pointed out that the cleaning procedure used in TOP Water were actually tougher than what is used to remove bio fouling. It was also noticed that ceramic membranes are not inert. Fouling was monitored by measuring trans-membrane pressure (TMP). TMP was monitored in order to assess whether there will be a change in properties of the membranes during repeated use and cleaning. There was no indication of any change in membrane properties during the experiments. One way to clean membranes is to use back pulsing. This can be done without disturbing normal operations. A conclusion emerging from the discussions was that one cannot take a blueprint from one membrane system and use it for another and expect it to work without problems. There is always a need for customisation. The discussion revealed a new failure mechanism: supercritical fluids. The main concern is that supercritical fluids can lead to increased pore plugging. An observation from the field seems to support this. Chevron has tested membranes from GE at three different locations. All membranes failed due to irrecoverable fouling.

93
9.5 In-line adsorption and fluidized bed reactor
For in-line adsorption two failure mechanisms were investigated (competing compounds adsorption and reduced sorption kinetics). While the results were quite good, the throughput of the in-line adsorption was not sufficient yet. Fluidized bed reactor: the researchers looked at three failure mechanisms, the results are not conclusive. However, for the last failure mechanism, toxic shock, the research seems to confirm that is quite unlikely. Produced water can be quite warm, up to 80oC. This was not considered in the project. But it is known that increasing the temperature will accelerate the biological processes, e.g. from 20oC to 30oC will roughly double the degradation rate. At the same time the temperatures offshore can be as low as minus 1oC. In such cases biological processes will not work.
9.6 Conclusions from the technology assessment workshop
Based on the assessment workshop, the following main conclusions can be drawn:
The project has contributed to a better understanding of how to characterize produced water, in particular droplet formation and emulsion stability.
Generally speaking the project has lead to an increased knowledge of FIBRA filters, ceramic membranes, biofouling and FBR.
The FIBRA filtration module can be used to remove particles and oil
It is not yet clear where FIBRA modules should be employed offshore – the main concern being the rather low flow rate and the large footprint. A potential application, the use of FIBRA as a coalescer will be investigated in the remaining test programme in the TOP Water project.
We achieved very good results for the ceramic membranes in the tests carried out in the project. It seems that fouling is under control. However, there are important cleaning scenarios that have not been investigated yet, namely scaling and supercritical fluids. Furthermore, it was noted that one cannot take a blueprint from one system to another and expect it to work.
In-line adsorption and fluidized bed reactor: there are still many unanswered questions regarding the design and use of such systems. The research in the project only found satisfactory answers to one of the failure mechanisms

94
10 CONCLUSIONS The PhD and MSc studies on characterisation have identified variables influencing the behaviour of solid suspensions and o/w emulsions:
Asphaltene adsorption changes the surface properties of solid particles. The amount of adsorbed asphaltens depend more on the particle type than the origin of the asphaltenes. Furthermore, asphaltene coating increase the suspensions stability for kaolin, CaCO3, BaSO4, Fe3O4, and TiO2, while it slightly reduce the stability for FeS. The difference in behaviour is suggested to be due to the orientation of the asphaltenes on the particle surface.
The heavy crude oils in the data set are characterised by small droplets, rapid droplet growth and low interfacial elasticity. The low interfacial elasticity makes the oil droplets more susceptible to coalescence. Oils with these properties showed the best removal efficiency in the hydrocyclone experiments.
The “intermediate” heavy oils in the data set contain medium amounts of saturates, aromatics and resins and high amounts of asphaltenes and acids. The emulsion behaviour were then determined by a balance between flocculation and coalescence in the system (dependent on composition)
The light crude oils in the data set contain high amounts of saturates, low amounts of asphaltenes and resins and medium amounts of aromatics and acids. These conditions facilitate rapid formation of an elastic o/w interface, reducing or preventing coalescence. Oils with these properties had the poorest removal efficiency in the hydrocyclone experiments.
The results from the study on pre-treatment have shown that the FIBRA filter can remove dispersed oil and indicate that low effluent concentrations for dispersed oil can be achieved with different oil types and influent concentrations covering a range that is normal in produced water. However, low effluent concentrations required a low hydraulic loading rate.
With the three oil types tested, Exxsol D 60, Total B and Seillean, the main significant variables for oil removal measured as removal efficiency were: Bladder pressure, flow and dosage of flocculent.
Interfacial tension and the percentage of saturates in the oil were also found to be significant.
Efficient removal of inorganic particles (kaolin, median diameter 6 µm) was also achieved.
The main concerns for use of FIBRA offshore are the rather low flow rate giving a large footprint and a process with a high number of modules.
The two PhD studies on removal of dispersed and dissolved compounds have lead to an increased knowledge of oil fouling of ceramic membranes and adsorption of BTX with biological regeneration of the adsorbent.
Backpulsing and ultrasonic-crossflow filtration both improved the membrane performance by reducing the fouling rate.

95
With backpulsing it was shown that external fouling followed by internal fouling was the fouling mechanism for all membrane pore size. Smaller membrane pore size (0.1µm) required shorter frequency, longer duration and lower reversed membrane pressure than the bigger membrane pore size (0.2 µm and 0.5 µm) to obtain higher permeate permeability.
With ultrasound, the efficiency of the technique was dependent on the intensity and wavelengths chosen.
It was demonstrated that the cleaning efficiency of a fouled membrane is very much dependent on the choice of cleaning agents, the sequence in which they are used, and the procedure of the cleaning cycle (i.e. cleaning operating mode).
Further studies are required for a comprehensive assessment and recommendation of cleaning protocols best suited for a specific type of membrane and application (i.e. type of foulants), and to include scaling and the effects of supercritical fluids.
Selective sorption of BTX compounds from wastewater was demonstrated by using an organoclay. This sorbent showed good affinity for BTX compounds and at the same time retained only to a low extent acetic acid from wastewater.
Biological regeneration of the organoclay was demonstrated in a FBR by alternating sorption and biological regeneration steps in a time sequence simulating off-line regeneration.
Long-time off-line bio-regeneration experiments indicated that the organoclay bed lost a part of its sorption capacity over time. Possible causes for this phenomenon could be: accumulation of organic compounds and minerals, particle attrition, desorption and biodegradation of the tailoring agent (dimethyl dihydrogenated ammonium chloride).
There are still many unanswered questions regarding the design and use of a system for adsorption and fluidized bed reactor.

96
11 LIST OF PUBLICATIONS WP3: 1. Quartz Crystal Microbalance Monitoring of Asphaltene Adsorption/Deposition. Dudášová, Dorota;
Silset, Anne; Sjoeblom, Johan. Journal of Dispersion Science and Technology (2008), 29(1), 139-146. 2. Study of asphaltenes adsorption onto different minerals and clays. Part 1: Experimental adsorption
with UV depletion method Dudášová, Dorota; Simon, Sebastien; Hemmingsen, Pal V.; Sjöblom, Johan. Colloids and Surfaces, A: Physicochemical and Engineering Aspects (2008), 317(1-3), 1-9.
3. Study of asphaltenes adsorption onto different minerals and clays. Part 2: Particle characterisation
and suspension stability. Dudášová, Dorota; Flåten, Geir Rune; Sjöblom, Johan; Øye, Gisle. Colloids and Surfaces, A: Physicochemical and Engineering Aspects (2009), 335(1-3), 62-72.
4. Model oilfield particle suspension stability studied by Turbiscan. Multivariate dataanalysis applied to
one-to-three particle systems. D. Dudášová, G.R.Flåten, J. Sjöblom and G. Øye Colloids and Surfaces. A: Physiochemical and Engineering Aspects. Submitted.
5. Characterisation of the produced water particles and effect of water characteristics on the water
quality/suspension stability. D. Dudášová, G.R.Flåten, G. Øye and J. Sjöblom Separation and Purification Technology. Submitted.
6. Influence of physio-chemical properties of crude oils on separation of o/w emulsions. A. Silset,
G.R.Flåten, G. Øye and J. Sjöblom. In preparation. 7. Influence of crude oil properties on drop size distributions in o/w emulsions. Gisle Øye, Kristin
Aarhoug, Geir Rune Flåten and Dorota Dudášová. In preparation. 8. Stability of dilute crude oil-in-water emulsions. Gisle Øye, Kristin Aarhoug, Geir Rune Flåten and
Dorota Dudášová. In preparation. 9. Influence of physio-chemical properties of crude oils on hydrocyclone separation of o/w emulsions.
Gisle Øye, Anne Silset, Geir Rune Flåten, Herman Helness, Esa Melin, and Johan Sjöblom. In preparation.
WP4: 10. Sumihar H.D. Silalahi, TorOve Leiknes, J. Ali and Ron Sanderson (2007): Ultrasonic Time Domain
Reflectometry for investigation of particle size effect in oil emulsion separation with crossflow microfiltration. In Proc. IMSTEC 07, The 6th International Membrane Science and Technology Conference, Sydney, 5-9 November 2007.
11. Sumihar H.D. Silalahi, TorOve Leiknes (2007): Cleaning Strategies in Ceramic Microfiltration
Membranes Fouled by Oil and Particulate matter in Produced Water. In Proc. IMSTEC 07, The 6th International Membrane Science and Technology Conference, Sydney, 5-9 November 2007.
12. Sumihar H.D. Silalahi, TorOve Leiknes (2008): Permeability enhancement in ceramic crossflow
microfiltration for treatment of produced water with high-frequency backpulse, Membrane Technology Conference 2008, January 27-30, 2008, Atlanta, USA.
13. Sumihar H.D. Silalahi, Ciprian T. Scurtu, TorOve Leiknes, Herman Helness (2008): Research
into new strategies in removing dispersed oil and dissolved compounds from produced water. 6th Produced Water Workshop, 23rd – 24th April 2008, Aberdeen, UK.

97
WP5: 14. Scurtu C., Leiknes T., Helness H. and Melin E. (2006). Research of a selective, bio-regenerable
adsorbent for the dissolved aromatic compounds in the wastewaters from offshore platform operation. Proceedings - 4th International Conference on Marine Waste Water Disposal and Marine Environment, Antalya Turkey, 6-10 November 2006.
15. Scurtu C., Leiknes T. and Helness H. (2007). Study of an organoclay for the sorption of dissolved
organic compounds in the wastewaters from offshore platform operation. Proceedings - 2nd IWA ASPIRE Conference, Perth, Australia, 28 October - 1 November 2007. Submitted to Water Science and Technology (March 2008); Accepted for publication.
16. Silalahi S., Scurtu C., Leiknes T. and Helness H. (2008). Research into new strategies in removing
dispersed oil and dissolved compounds from produced water. Proceedings - 6th Produced Water Workshop, Aberdeen, UK, 23-24 April 2008.
17. Scurtu C., Leiknes T. and Helness H. (2008). Biological regeneration of an organoclay in a fluidized
bed reactor for the treatment of wastewaters from offshore platform operation. Proceedings – 4th IWA Young Water Professional Conference, Berkeley, CA, USA, 16-18 July 2008.
18. Scurtu C., Leiknes T. and Helness H. (2008). Combination of organoclay sorption and biodegradation
in a fluidized bed reactor for the treatment of wastewaters from oil and gas industry. Proceedings – IWA Chemical Industries Conference, Beijing, China, 9-11 November 2008. Submitted to Water Science and Technology (December 2008).
Conference presentations – no proceedings: 1. Øye, G. (2006): Characterisation of particles in produced water. Invited lecture, Separation
Technology-oil/gas/water, Haugesund, 19-20 September 2006. 2. Dudášová, D. (2007): Study of asphaltenes adsorption onto different mineral clays, Poster
presentation, 18th International Oil field chemistry symposium, Geilo, Norway, 25-28 March 2007. 3. Scurtu C., Leiknes T. and Helness H. (2008). Combination of organoclay sorption and biodegradation
in a fluidized bed reactor for the treatment of wastewaters from oil and gas industry. Proceedings – 3PrdP Annual Produced Water Management Summit, Abu Dhabi, United Arab Emirates, 16-19 November 2008.
4. Øye, G. (2009): Characterisation of dispersed components related to produced water. Invited lecture,
Produced Water Management Conference, Stavanger, Norway, 21-22 January 2009. 5. Scurtu C., Leiknes T. and Helness H. (2009). Evaluation of organoclay sorption coupled with
biological regeneration for removal of BTX in produced water. Proceedings – Produced Water Management 2009, Stavanger, Norway, 21-22 January 2009.

98
12 REFERENCES American Petroleum Institute, (API). (1995): Proceedings: Workshop to Identify Promising Technologies for the Treatment of Produced Water Toxicity. Health and Environmental Sciences Departmental Report No. DR351. Parsons Engineering Science, Fairfax, Virginia. Aarhoug, K. (2008): Characterisation of oil in produced water, Master's thesis, June 2008. BenAim, R., Bucciali, B. and Cure, H. (2004): An innovative deep bed filter for the tertiary treatment of wastewater. IWA Separation conference, New-Orleans. Bilstad, T. and Espedal, E. (1996): Membrane separation of produced water. Wat. Sci. Tech. Vol. 34, No. 9, pp. 239-246. Dalmacija, B., Tamas, Z., Karlovic, E., Miskovic, D. (1996): Tertiary treatment of oil-field brine in a biosorption system with granulated activated carbon, Wat. Res. Vol. 30, No. 5, pp. 1065-1068. DET NORSKE VERITAS (2001) Qualification procedure for new technologies. Recommended practice, DNV-RP-A-203. Dudášová, D. (2008): PhD thesis: “Characterization of solid particle suspensions with organic coatings in oilfield produced water”, 2008. Epcon (2005): http://www.epcon-norge.no. Faksness, L. G., Grini, P. G. and Daling, P. S. (2004) Partitioning of semi-soluble organic compounds between the water phase and oil droplets in produced water. Marine Pollution Bulletin 48 (7-8), 731-742. Fibra Ltd. (2008): Personal communications from David Laughton and David Griffiths at Fibra Ltd. Gisvold, B., Ødegaard, H. and Føllesdal, M. (2000): Enhancing the removal of ammonia in nitrifying biofilters by the use of a zeolite containing expanded clay aggregate filtermedia. Wat. Sci. Tech. Vol 41 No 9 pp 107–114. Griffiths, D. (2005): Personal communication; http://www.fibrasolutions.com. Grini, P. G., Clausen, C. and Torvik, H. (2003): Field trials with extraction based produced water purification technologies. Produced water workshop, Mar. 26-27, 2003, Aberdeen, United Kingdom. Gryta, M, Karakulski, K. and A. W. Morawski, A. W. (2001): Purification of Oily Wastewater by Hybrid UF/MD, Wat .Res. Vol.35, No.15, 3665-3669. Hayes, T. and Arthur, D. (2004): Overview of emerging produced water treatment technologies. The 11th Annual International Petroleum Environmental Conference, Oct. 12-15, 2004, Albuquerque, USA.

99
Helness, H. (2005): Top side produced water treatment concepts – Focus of PhDs and basis for cost evaluation, SINTEF memo, 2005-09-15, 15 p. Helness, H (2006): TOP Water, WP 2. Cases for PW quality and flow, treatment targets, treatment concept and focus of PhDs on PW treatment. Revised version 2006-01-12. SINTEF report, 2006-01-12, 16 p. Klasson, K. T., Tsouris, C., Jones, S. A., Dinsmore, M. D., Walker, A. B., DePaoli, D. W., Yiacoumi, S., Vithayaveroj, V., Counce, R. M. and Robinson, S. M. (2002): Ozone treatment of soluble organics in produced water. Oak Ridge National Laboratory Report ORNL/TM-2002/5, USA , 85 p. Lapique, F. (2006): “PRELIMINARY FAILURE MODE ANALYSIS OF A NOVEL TREATMENT CONCEPT FOR PRODUCED WATER”. REPORT NO 2006-1044, REVISION NO 1, DNV. Lee, J. and Frankiewicz, T. (2005): Treatment of Produced Water with an Ultra-Filtration Membrane – a Field Trial. 14th Annual Produced Water Seminar, Jan. 19-21, 2005, Houston, USA. Lee, J.J., Jung, M.K., Im, J.H., BenAim, R., Kim, C.W., Hwang, M.H and Woo, H.J. (2005): Enhancing flexible fibre filter (3FM) performance using in-line coagulation, Proc. IWA International Conference on Particle Separation. Leiknes, T.O. (2005): Personal communication. Meijer, D. (2003): Field-proven removal of dissolved and dispersed organic hydrocarbons at commercial scale from offshore produced water with macroporous polymer extraction technology. Produced water workshop, Mar. 26-27, 2003, Dyce, Aberdeen. Melin, E. (2005a): Environmental impact factor (EIF) and produced water composition, SINTEF memo, 2005-05-18, 26 p. Melin, E. (2005b): Produced water treatment methods – an overview, SINTEF memo, 2005-05-13, 28 p. New Logic Research Inc. (2005): http://www.vsep.com. Olf (2004): Environmental reports for 2003, http://www.olf.no/miljo/miljorapporter/?22638. Olf (2005): Environmental reports for 2004, http://www.olf.no/miljo/miljorapporter/?27222. OGP (2002): Aromatics in produced water: occurrence, fate & effects, and treatment. International Association of Oil & Gas Producers, Report 1.20/324, 24 p. OGP (2005) Fate and effects of naturally occurring substances in produced water on the marine environment. International Association of Oil & Gas Producers Report no. 364, 42 p. OSPAR (2001) OSPAR Recommendation 2001/1 for the Management of Produced Water from Offshore Installations, June 2001.

100
OSPAR Commission (2002): Background document concerning techniques for the management of produced water from offshore installations. OSPAR Commission Report , 70 p. OSPAR (2004) Annual report on discharges, waste handling and air emissions from offshore oil and gas installations, in 2002. OSPAR Commission Report , 40 p. Ranck, J.M., Weeber, J. L., Guifang, T., Sullivan E., J. , Katz L. E. and Bowman, R. S. (2002) Removal of BTEX from Produced Waters using Surfactant-Modified Zeolite, Conference proceedings. Rye, H. (2005) Zero discharge for natural compounds in produced water. SINTEF report no. STF80MK F05190, 12 p. Scurtu, C.T. (2009): PhD thesis: “Treatment of produced water: targeting dissolved compounds to meet a zero harmful discharge in oil and gas production”, Draft 2009. SFT, NPD and Olf (2003) Zero discharges to sea from the petroleum activities - status and recommendations 2003. Report for SFT, OLF and OD, 41 p. Silalahi, S.H.D (2009): PhD thesis: “Treatment of produced water: targeting dissolved compounds to meet a zero harmful discharge in oil and gas production”, in preparation 2009. Silset, A. (2008): PhD thesis: “Emulsions (w/o and o/w) of heavy crude oils. Characterisation, stabilisation, destabilisation and produced water quality”, 2008. Thorsen Haugen, L. (2004): Produsert vann, Tekna seminar, Separation technology, Tønsberg 30th September (in Norwegian). Xing, J. and Hickey, R. (1994) Response in performance of the GAC-fluidized bed reactor process for BTX removal to perturbation in oxygen and nutrient supply. International Biodeterioration & Biodegradation, Vol 30, pp. 23-39. Weitzenböck, J. R. (2008): REVIEW OF FAILURE MODE ANALYSIS FOR A NOVEL TREATMENT CONCEPT FOR PRODUCED WATER”. REPORT NO 2008-1945, REVISION NO 0, DNV.

101
13 APPENDIX
13.1 Appendix: Multivariate analysis
This Appendix gives a brief introduction into the multivariate analysis methods that have been used in the work presented in this report. Multivariate data analysis is a useful tool for visualizing and extracting information from large data sets where more than one variable is analyzed simultaneously. The data are organized in data matrices where each row corresponds to a sample and each column corresponds to a variable. For the data analyzed in this paper, the measured transmission profiles at different times correspond to the variables. Principal Component Analysis (PCA) was used to visualize and extract the major trends in the data sets. Mathematically, PCA is an eigenvector type decomposition of the covariance matrix where successively orthogonal scores and loadings vectors are extracted according to the principle of maximal explained variance. The k component PCA decomposition of the m x n matrix X can be formulated as:
1 1 2 2 ...T T Tm n k k m nX t p t p t p E´ ´= + + + + (1)
where it are the k mx1 scores vectors, T
ip are the k 1xn loadings vectors and E is the m x n
residual matrix. A PCA transforms the data into a new orthogonal coordinate system of dimension k, where the first coordinate is called the first principal component (PC1); the second coordinate second principal component (PC2) and so on. The plot of score vectors against each other is called the score plot. The most common score plot is the score vector for PC1 versus the score vector for PC2, since these two often contain the major variance in the data. Analysis of variance (ANOVA) is a tool for breaking down a response’s and corresponding factors’ variance into several parts that can be compared to each other for significance testing. A typical application area is comparison of factors in an experimental design. The general approach is to calculate the sum of squares for each factor at the different levels and test for statistical significance. Significant factors are interpreted to have an influence on the response.


