A study into commercial & industrial (C&I) waste and recycling in Australia by industry division Department of Sustainability, Environment, Water, Population and Communities Page 1 Encycle Consulting Pty Ltd
Transcript
A study into commercial & industrial (C&I) waste and recycling in Australia by industry division
Department of Sustainability, Environment, Water, Population and Communities
Revised Dan A’Vard 25/01/13 Revised division summary tables and costing data
DisclaimerWhile steps have been taken to ensure the accuracy of this document, Encycle Consulting and Sustainable Resource Use cannot accept responsibility or be held liable to any person for any loss or damage arising out of or in connection with this information being accurate, incomplete or misleading.
2 Methodology..................................................................................................132.1 Data timeframes................................................................................................162.2 Data limitations..................................................................................................162.3 Qualitative interpretation limitations..................................................................172.4 Industry size by employment (EFTE) (phase 1)..................................................172.5 Waste generation by sector...............................................................................182.6 Waste diversion from landfill..............................................................................192.7 Material categories and types............................................................................202.8 Financial impacts on Australian business of waste and recycling.......................212.9 Greenhouse gas emission benefit of improved material efficiency....................23
3 C&I waste and recycling: overall findings......................................................273.1 Quantitative findings - summary........................................................................273.2 Key materials in the C&I waste stream..............................................................273.3 Key recyclable materials in the C&I waste stream.............................................30
3.3.1 Metals.............................................................................................................303.3.2 Glass...............................................................................................................303.3.3 Food organics.................................................................................................303.3.4 Packaging waste.............................................................................................303.3.5 Soft plastic packaging.....................................................................................313.3.6 Paper..............................................................................................................313.3.7 For some sites recycling one or two materials dominate the waste stream....31
3.4 Findings: C&I waste generation by jurisdiction...................................................313.5 Waste collection systems...................................................................................36
3.5.1 Local government C&I waste servicing...........................................................36
4 C&I waste stream assessment by industry division: findings.........................374.1 Summary: waste generation by industry division, sub-division..........................374.2 Waste diversion from landfill..............................................................................394.3 Organics generation by industry division...........................................................41
Page 3 Encycle Consulting Pty Ltd
4.4 MANUFACTURING – overview.............................................................................424.4.1 MANUFACTURING: opportunities for waste avoidance or recycling................59
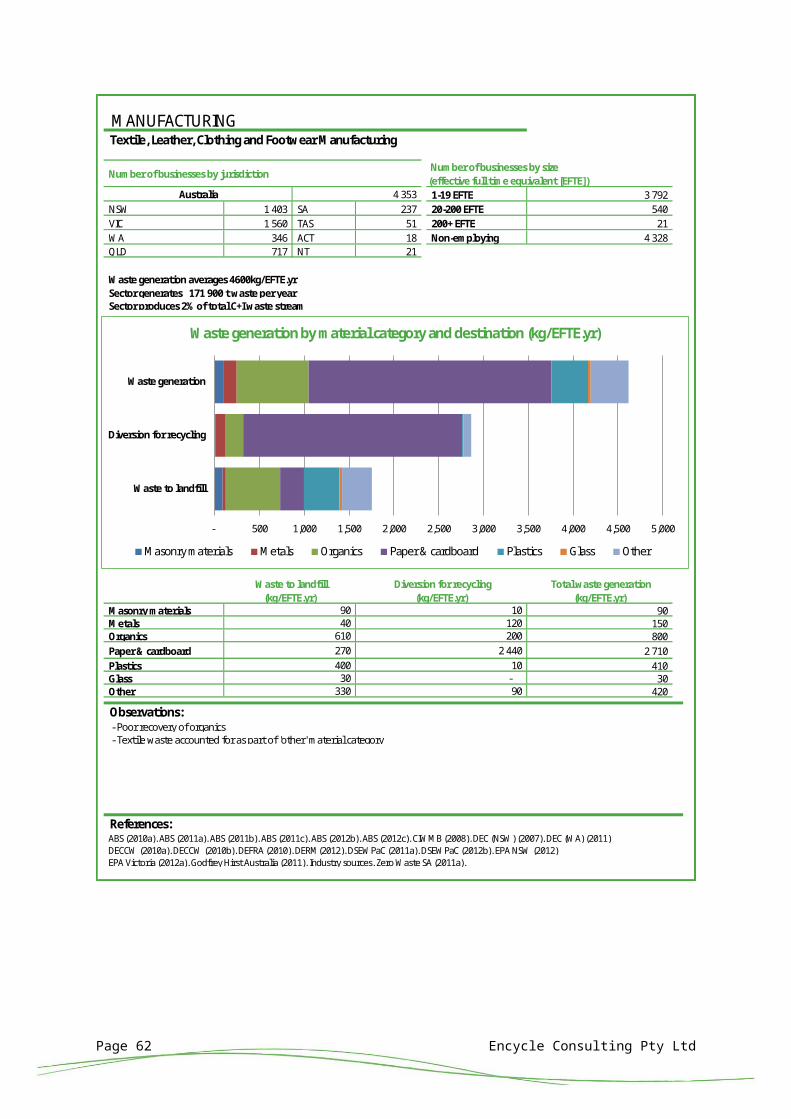
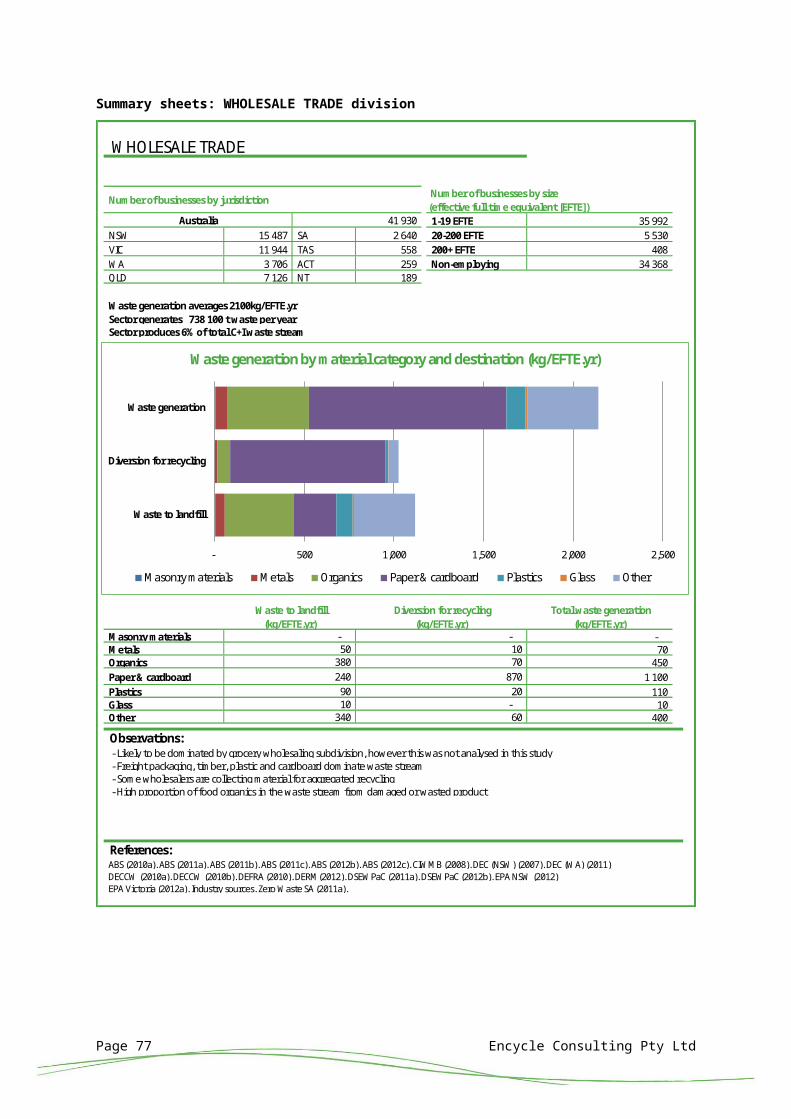
4.5 WHOLESALE TRADE............................................................................................604.5.1 Opportunities for waste avoidance or recycling..............................................62
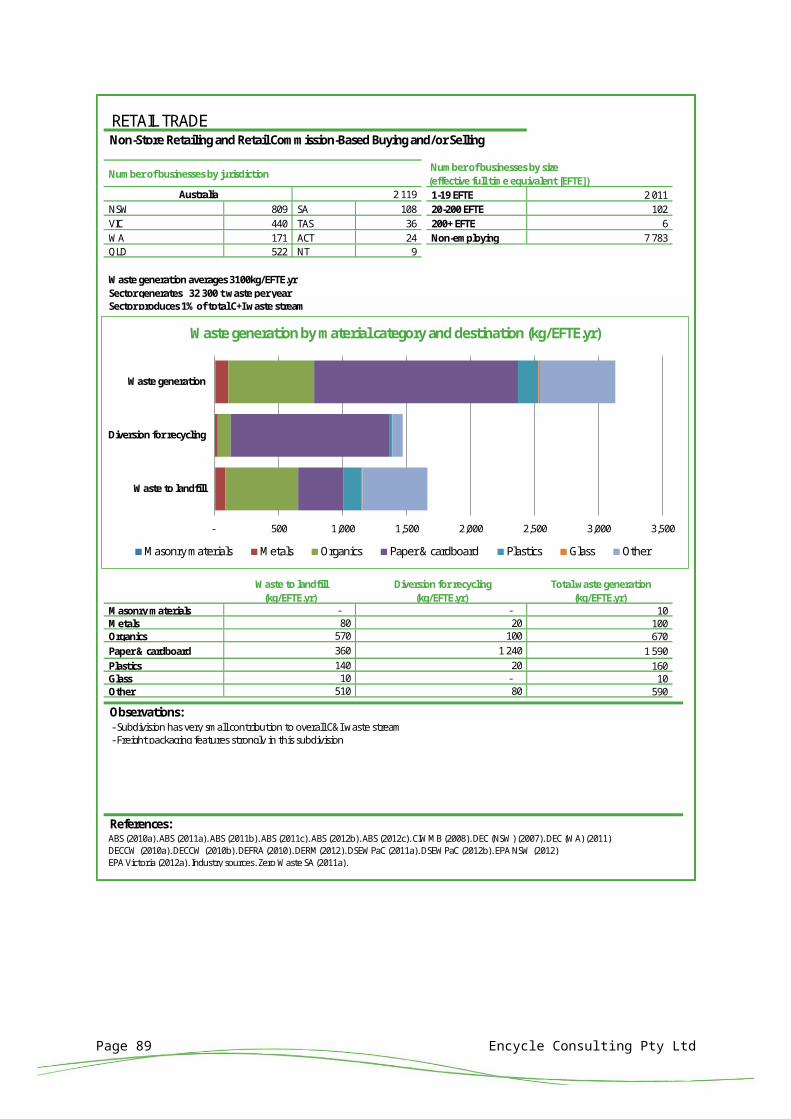
4.6 RETAIL TRADE....................................................................................................634.6.1 Opportunities for waste avoidance or recycling..............................................65
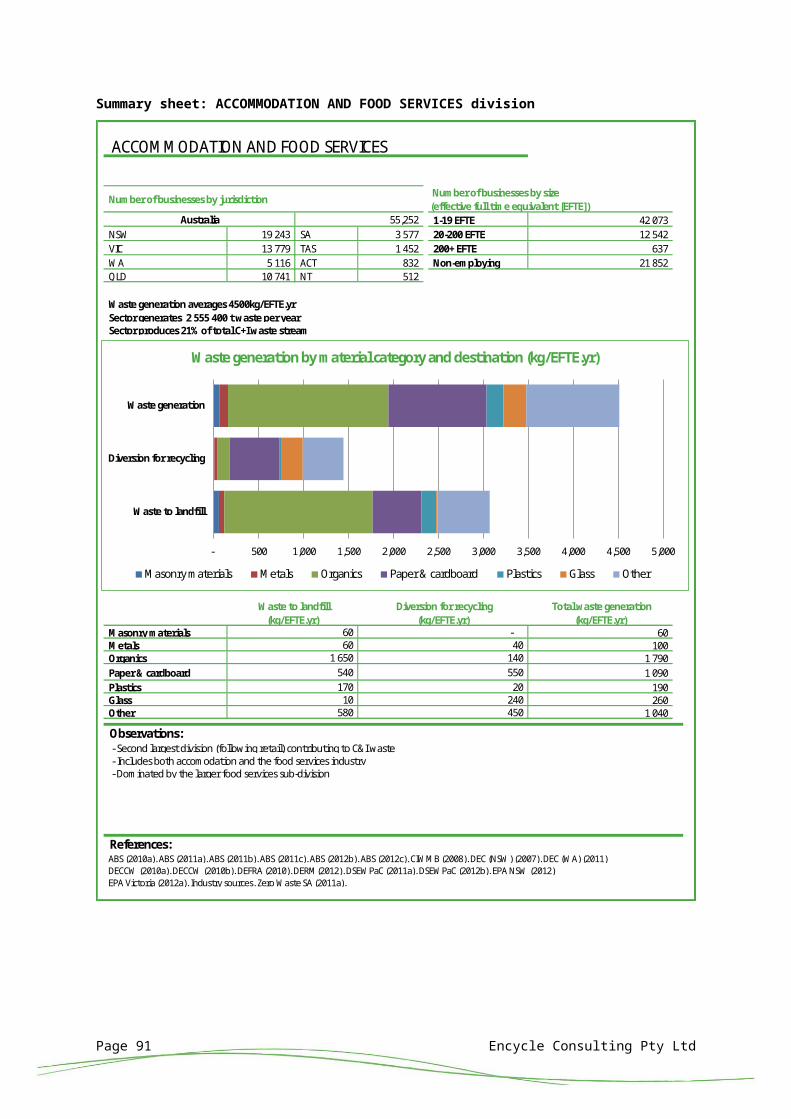
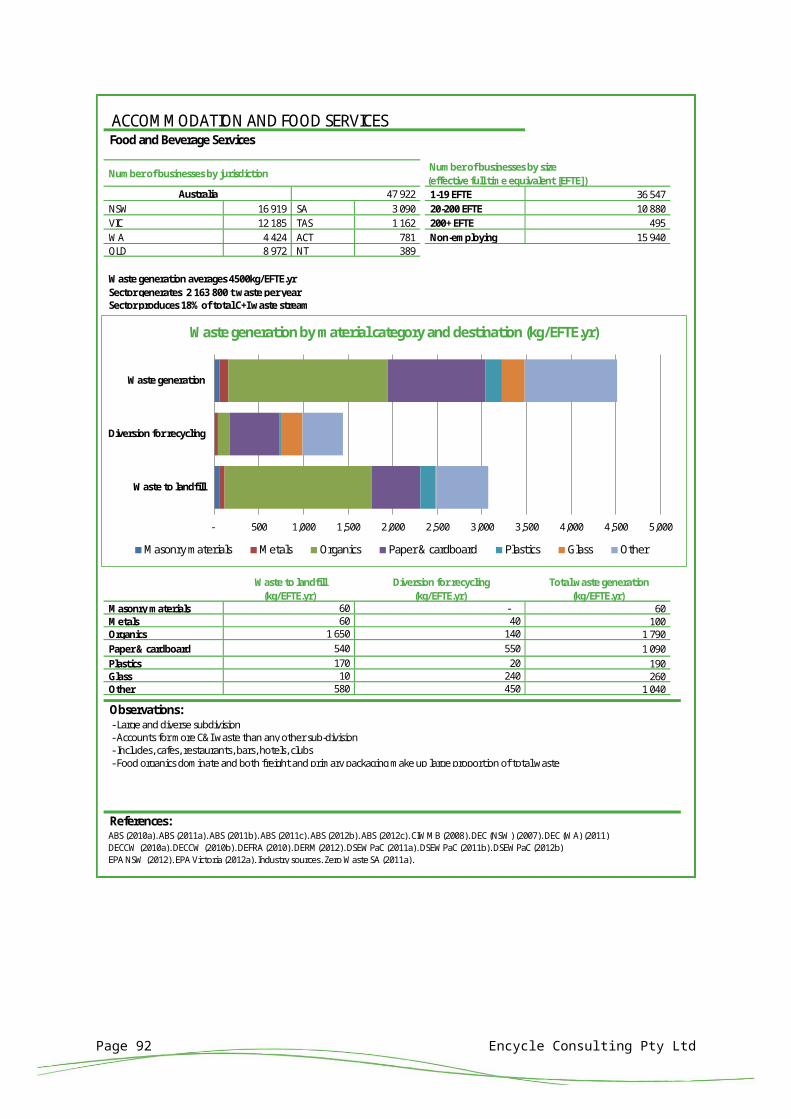
4.7 Food retailing (priority sub-division)...................................................................674.8 ACCOMMODATION AND FOOD SERVICES...........................................................734.9 Food and Beverage Services (priority sub-division)............................................764.10 TRANSPORT, POSTAL AND WAREHOUSING’........................................................794.11 FINANCIAL AND INSURANCE SERVICES...............................................................814.12 RENTAL, HIRING AND REAL ESTATE SERVICES...................................................834.13 PROFESSIONAL, SCIENTIFIC AND TECHNICAL SERVICES.....................................854.14 ADMINISTRATIVE AND SUPPORT SERVICES........................................................874.15 PUBLIC ADMINISTRATION AND SAFETY...............................................................894.16 EDUCATION AND TRAINING................................................................................914.17 HEALTH CARE AND SOCIAL ASSISTANCE............................................................934.18 ARTS AND RECREATION SERVICES.....................................................................95
5 Cost of waste to business and savings opportunities.....................................975.1 Summary of cost findings...................................................................................985.2 Summary of opportunities................................................................................105
6 C&I waste: barriers to material efficiency....................................................1066.1 Introduction......................................................................................................1066.2 Cost issues.......................................................................................................107
6.2.1 Perceptions about waste costs to business...................................................1076.2.2 Purchasing and product inventories..............................................................107
6.3 Corporate culture and process issues..............................................................1086.3.1 Core business and sustainability...................................................................1086.3.2 Business’ understanding of their waste stream............................................109
6.4 Waste collection method issues.......................................................................1096.4.1 Waste charging is usually bin-lift based........................................................1096.4.2 Perception of ability to change waste costs and services.............................1106.4.3 Recycling for small, medium and large businesses.......................................1116.4.4 Stable markets for recyclate.........................................................................1126.4.5 Availability of landfilling as an option for readily recyclable materials..........112
Page 4 Encycle Consulting Pty Ltd
6.5 Better practice waste and recycling.................................................................112
7 Opportunities for improved material efficiency............................................1147.1 Opportunities to manage waste streams better...............................................114
7.1.1 Policy drivers for material efficiency.............................................................1147.1.2 Business opportunities to improve material efficiency..................................1157.1.3 Waste avoidance..........................................................................................1157.1.4 Recycling/resource recovery.........................................................................1157.1.5 Opportunities for waste collection to drive material efficiency.....................116
7.2 Policy drivers for material efficiency................................................................1177.2.1 Markets for recycled materials......................................................................1177.2.2 Discouraging landfill.....................................................................................1177.2.3 Measurement and reporting of C&I waste by government............................118
7.3 Business opportunities for material efficiency..................................................1187.3.1 Measurement and reporting of C&I waste by business.................................1197.3.2 Waste stream assessments..........................................................................1207.3.3 Updating manufacturing processes..............................................................1217.3.4 Calculate the full cost of waste.....................................................................1217.3.5 Updating internal processes and staff engagement......................................1227.3.6 Take back arrangements with suppliers.......................................................1237.3.7 Swapping disposable for reusable packaging and products..........................1247.3.8 Recycling more of the ‘standard’ recyclables...............................................1247.3.9 Recycling ‘non-standard’ materials...............................................................1267.3.10 Food organics diversion from landfill.........................................................1267.3.11 Food “rescue”...........................................................................................128
7.4 Opportunities for improving waste collection to drive material efficiency........1287.4.1 Local government servicing of small businesses..........................................1287.4.2 Small business collaboration.........................................................................1307.4.3 Industrial symbiosis......................................................................................131
7.5 Summary of materials efficiency opportunities and recommendations............132
8 Greenhouse gas emission impacts of waste streams by industry division and material type...............................................................................................137
Glossary of terms and acronyms.......................................................................143
Appendix A: Examples of businesses in ANSZIC industry divisions....................152
Page 5 Encycle Consulting Pty Ltd
Appendix B: Industry employment profiles for each sub-division......................153
Appendix C: Decision flow chart for choosing datasets for analysis for this project.................................................................................................................... 156
Appendix D: Definition of C&I waste..................................................................157
List of tables Table 1: Industry divisions and sub-divisions from ABS (2006) to be studied for this
project................................................................................................................13Table 2: Material types and density.................................................................................19Table 3: Comparison of material categories and types....................................................20Table 4: Outline of available environmental benefits of recycling studies........................23Table 5: Summary the C&I waste/recycling streams by material (for industries
studied)..............................................................................................................28Table 6: Commercial and industrial waste by jurisdiction, 2008–09 data (DSEWPaC,
2012b)................................................................................................................32Table 7: Industry divisions and sub-divisions in each jurisdiction by EFTE.......................33Table 8: Landfill and recycling performance for each industry division studied
(targeted sub-divisions are highlighted in green)...............................................39Table 9: Landfill and recycling of organics for each industry division studied
(ordered by total organics generation)...............................................................41Table 10: Number of employees (EFTE) and number of businesses in the
MANUFACTURING division...................................................................................42Table 11: Quantities of waste and recycling from the MANUFACTURING division
(total per year and per EFTE)..............................................................................42Table 12: Number of employees in each business size bracket for the Food Retail
sub-division........................................................................................................67Table 13 : Quantities of waste and recycling per annum from the Food Retail sub-
division...............................................................................................................67Table 14: Waste and recycling from the food and beverage service sub-division............76Table 15: Industry division revenues(ABS, 2011a)...........................................................97Table 16: Estimated input cost1 values, by material type................................................98Table 17: Waste disposal and input costs summary.......................................................100Table 18: Estimated input cost summary, by material type...........................................104Table 19: Recycling or reuse of materials by businesses, by business size (ABS,
2010b)..............................................................................................................111Table 20: Summary of recommendations for greater material efficiency in the C&I
Table 21: Greenhouse gas impacts of landfilling and recycling materials (DECCW, 2010d)..............................................................................................................138
Table 22: Avoided greenhouse gas emissions through recycling – by industry division.............................................................................................................139
Table 23: Avoided greenhouse gas emissions through recycling – by material type......141Table 24: Summary figures for the EFTE by division......................................................153 List of figures Figure 1: Scope of LCA modelling – figure from DECCW (2010c)......................................25Figure 2: Method for calculating the net environmental impacts in the recycling
process – figure from DECCW (2010c)................................................................26Figure 3: Summary the C&I waste/recycling streams by material (for industries
studied)..............................................................................................................29Figure 4: Estimated waste generation for each ANZSIC division and sub-division
reviewed for this project.....................................................................................38Figure 5: Waste to landfill and recycling from each industry division...............................40Figure 6: Estimated cost of waste disposal to industry, by industry division ($
million).............................................................................................................101Figure 7: Estimated input cost of waste to industry, by industry division ($ million)......102Figure 8: Estimated combined disposal and input costs of waste to industry, by
industry division ($ million)...............................................................................103Figure 9: Estimated input cost summary, by material type ($ million)...........................105Figure 10: Recommended servicing profile for small, medium and large businesses.....129Figure 11: Avoided greenhouse gas emissions through recycling – by industry
division (million tonnes CO2-e)..........................................................................140Figure 12: Avoided greenhouse gas emissions through recycling – by material type
(million tonnes CO2-e).......................................................................................142Figure 13: Relative number of employees (EFTE) for each ANZSIC division and sub-
division under review for this project................................................................155
Page 7 Encycle Consulting Pty Ltd
AcknowledgementsEncycle Consulting and SRU would like to acknowledge the many waste generators and waste service providers who have very generously responded to information requests about their operations and waste management activities and issues.Encycle Consulting and SRU would also like to thank the following people for their support and assistance with this project:
Bruce Edgerton & Glenn Tomlinson ACT Government–Environment and Sustainable Development Directorate
David Skutenko, Duncan Cockburn & Sarah Coleman
Australian Bureau of Statistics
Tony Fioraso Crown PerthDavid Lee Department of Environment, Food and
Rural Affairs (UK)Kirsty Balmer & Tamara Miller Department of Environment and Heritage
Protection (QLD)Russell Dean, David Lawrence, Mike Phelan, James Pitman & Enterprise Connect division
Department of Industry, Innovation, Science, Research and Tertiary Education
Mark Jackson & Rebecca Fogg EPA NSWLeonardo Ribon & Juin Majumdar EPA VictoriaPeter Hosking Great Forests AustraliaAlan Venn-Brown Jones Lang LaSalleKatrena Stephenson & Ben Mooney Local Government Association TasmaniaRebecca Hughes Melbourne City CouncilEddie Spadek SITA EnvironmentalPam Paton & Matt Genever Sustainability VictoriaJohn Blumson ZWSA
Page 8 Encycle Consulting Pty Ltd
Executive summaryThe Department of Sustainability, Environment, Water, Population and Communities commissioned Encycle Consulting and Sustainable Resource Use (SRU) to undertake research as to contribute to the implementation of the National Waste Policy: Less waste, more resources (the National Waste Policy). This project conducts a meta-analysis of datasets from businesses, trade associations and state government agencies to provide information about waste and recycling profiles, by industry division and sub-division from across the commercial and industrial (C&I) sector in Australia (see Section 2 for the industry divisions and sub-divisions included in this study). This report provides information about each of the industry divisions and sub-divisions studied (by ANZSIC coding) in terms of the relative size of the industry, the contribution to the waste stream, materials recycled and opportunities for improvement. Waste generation per employee (as Equivalent Full Time Employee or EFTE) and also the costs of waste relative to GDP are calculated for each sub-division. Two priority sub-divisions are identified: RETAIL TRADE; Food Retail and ACCOMMODATION AND FOOD SERVICES; Food Servicing. These sub-divisions generated large quantities of waste and have a high proportion of waste generated per employee. Some of the key findings about the C&I waste and recycling profile are:
1. Food waste is the major component of the C&I general waste stream, much of this is produced from the Food retail and Food and Beverage Services sub-divisions. A combination of avoidance, rescue and a range of systems or technologies will be needed to address food waste
2. Standard common recyclables, particularly freight packaging are still not recycled to the best extent possible
3. Small and medium businesses account for a significant portion of the C&I waste to landfill stream even though historically they have tended not to be the target for C&I waste reduction programs.
A key deliverable for this project was to identify the costs of waste for Australian businesses. Broad costs for disposal and recycling were applied to the figures for materials disposed to landfill and recycled for each industry division. These estimated costs are high level and assume a consistency of pricing mechanisms. However, the findings are interesting such that:
1. The total cost of waste services to businesses in Australia is conservatively estimated as $2.2 billion per year for the included industry divisions (of which $1.4 billion is spent on waste to landfill)
2. The cost of material inputs that are ultimately destined for disposal is just over $26.5 billion per year (of which a proportion is avoidable).
Where businesses do not recycle or manage the flow of materials through their organisation efficiently, there were three key barriers to improved performance:
1. Cost issueso the cost of waste disposal is not considered flexible enough to drive
change and the indirect costs of waste are not well understood
2. Corporate culture and process issues
Page 9 Encycle Consulting Pty Ltd
o without strong leadership and commitment to environmental outcomes, corporate culture is often resistant to the changes needed to drive material efficiency
3. Waste collection method issues o there are challenges for businesses to recycle more due to a lack of drivers
from the waste industry to improve performanceSite visits to businesses and a series of interviews were undertaken as part of this project. The site visits and interviews were not sufficiently extensive to provide definitive findings, but do point to some opportunities for more research. Some common themes among businesses that have low waste generation and good recycling rates were identified:
the business considers waste avoidance and recycling to be part of their broader sustainability focus and that a strong emphasis on sustainability is fundamental to their success. This is irrespective of the industry type Notable examples are: Unilever, Interface, Toyota and Walmart
a champion with sufficient seniority to drive major change is in place the business is large and experienced enough to demand good data reporting and
continual improvement from the waste service provider data is used to monitor and evaluate performance continual improvement mechanisms are in place (e.g. ISO 14001 Environmental
Management Systems) waste generation and recycling rates are reported externally where businesses have ‘simple’ waste streams, tackling just one or two materials
can achieve good outcomes (e.g. glass and cardboard in small bars) for small to medium businesses, recycling services can be obtained at a cost-
neutral or cheaper service (not necessarily the main driver for large businesses but important for smaller ones where waste can be a more significant consideration in the bottom line).
A range of opportunities to improve material efficiency through waste avoidance and greater recycling from the C&I waste stream were identified as part of this project. The recommendations for driving material efficiency in business were given a ranking in terms of importance (based upon estimated relative impact upon the C&I waste stream) and suggested ease of implementation. The key recommendations identified by this study for business to become more material efficient include:
1. drive waste avoidance through better understanding of the full costs of waste to business
2. engage and empower staff to avoid waste and recycle more3. encourage supplier take-back for reuse or recycling4. advocate for recycling more materials, more often5. target food waste from the food retail and service industries6. remove barriers, extend recycling collections and encourage local collaboration
for recycling from small business and extending recycling collections to SME sites7. investigate opportunities for industrial symbiosis.
Page 10 Encycle Consulting Pty Ltd
1 IntroductionDepartment of Sustainability, Environment, Water, Population and Communities (DSEWPaC) commissioned Encycle Consulting and Sustainable Resource Use (SRU) to undertake this project to identify some ‘headline’ values about the opportunities to reduce business costs through improved materials efficiency. Guidance on the quantification of business costs relating to waste and interpretation of economic information was provided by Essential Economics.
1.1 Aim
The aim of this project was to quantify and describe the characteristics of the waste stream generated by commercial and industrial (C&I) sources across Australia for key industry divisions (where reliable data is available). The cost-saving opportunities for business from avoiding/minimising/recycling more of their waste are explored as part of this project. The project considers an estimation of the greenhouse impacts of C&I waste (in CO2-e) for each industry division, based upon the unique material profile of the waste stream. As explained in the Methodology in Section 2, this project focused on the main industry divisions according to Australian and New Zealand Standard Industrial Classification (ANZSIC) definitions but excluded primary production industries such as mining and agriculture where significant quantities of waste are disposed of on site. This project also excludes construction and demolition waste as this is traditionally treated as a separate waste generation stream and also because it would dwarf other industry divisions in the magnitude of waste produced.1.2 Background
C&I waste in Australia is an important waste stream with significant opportunities for reduced waste generation, improved recovery and recycling performance and reductions in flows of waste to landfill. The National Waste Report 2010, using 2006–07 data, estimated that the national recycling rate for commercial and industrial waste was 56%, with 6.5 million tonnes of C&I waste being sent to landfill. Australia does not have national-scale data or industry-level information appropriate to the magnitude and impact of this waste stream. With more meaningful information and data, Australia can identify the best tools and approaches for finding better practice solutions and improved outcomes, particularly in delivering effective engagement with business as to the economic and operational benefits of materials efficiency. There are many opportunities for environmental and economic gains through better management of the C&I waste stream.The challenges relating to understanding the C&I waste stream have historically hampered government efforts to target programs to encourage waste avoidance and recycling (sometimes collectively known as ‘materials efficiency’). By breaking the C&I wastes stream down into industry divisions and sub-divisions, clear trends emerge. Looking at the trends within industry divisions provides the opportunity for the C&I sector to be tackled according to similar industry divisions or common issues for particular waste streams.
Page 11 Encycle Consulting Pty Ltd
1.3 Project overview
Access to coherent datasets for the C&I waste stream in Australia, as in most developed nations, is much less readily available compared to other sectors (i.e. municipal waste or construction and demolition waste). Waste streams generated from commercial enterprises are diverse in composition, generation rate and recycling performance. The diversity of the waste stream makes it a challenge to understand or to find common threads by which to describe it. The range of industries feeding the commercial and Industrial (C&I) waste stream is diverse and large. It spans sectors as different as manufacturing, health care, retail and education facilities. Each industry sector has a unique profile of: turnover, geographic distribution and levels of staffing (as Equivalent Full Time Employee (EFTE)). Each industry sector also has its own waste generation rate and profile. This project draws upon existing data that is collated for meta-analysis. Waste and recycling data for the C&I sector have been taken from waste audits and other studies completed voluntarily by companies from across the range of industry divisions, to bring together a range of the latest and most detailed data available. The meta-analysis of company-level waste and recycling data provides information about each industry division and sub-division based upon recent data obtained directly from relevant businesses. A sub-sample of companies representing each of the industry divisions were interviewed and/or visited to establish an understanding of the ways that waste is managed on site and some of the waste-related issues facing business. This project has been able to build a much clearer picture of the overall profile of the C&I waste stream and to outline the waste generation story for each division and sub-division that is relevant to this project.
Page 12 Encycle Consulting Pty Ltd
2 MethodologyThe main aim of this project was to develop a picture of C&I waste in Australia in more detail than has previously been available using company-level data (provided by businesses) and detailed industry sub-division data (from trade associations and government agencies). The data gathered for this project has been obtained from across 32 industry divisions and sub-divisions from studies undertaken either by individual businesses, trade associations or government agencies. This is the first time that such a diverse set of ‘real’ data of Australian C&I waste has been drawn together. The findings are intended to provide a picture of the waste that is being generated, landfilled and recycled across this stream.The 32 Australian and New Zealand Standard Industrial Classification (ABS, 2006) industry divisions and sub-divisions included in this project are listed in Table 1. This project focused on the main industry divisions (according to ABS definitions), but excluded primary production industries such as mining and agriculture where significant quantities of waste are disposed of on site. This project also excludes construction and demotion waste as this are traditionally treated as an entirely separate waste generation sector and would dwarf the remaining divisions in magnitude of waste produced1. For the purposes of this project report, the use of the abbreviation “C&I” relates only to the actual industry divisions and sub-divisions studied (Table 1). A brief summary of the types of industries included in each division is provided in Appendix A.Table 1: Industry divisions and sub-divisions from ABS (2006) to be studied for this project
Division Sub-division to be addressedManufacturing Food product manufacturing
Beverage and tobacco product manufacturingTextile, leather, clothing and footwear manufacturingWood product manufacturingPulp, paper and converted paper product manufacturingPrinting (including the reproduction of recorded media)Petroleum and coal product manufacturingBasic chemical and chemical product manufacturingPolymer product and rubber product manufacturingNon-metallic mineral product manufacturingPrimary metal and metal product manufacturingFabricated metal product manufacturingTransport equipment manufacturing
1 A few very small industry divisions were excluded where it was felt that waste generation was too low to be significant.
Page 13 Encycle Consulting Pty Ltd
Division Sub-division to be addressedMachinery and equipment manufacturing
Manufacturing Furniture and other manufacturingWholesale trade2
Retail trade
Food retailingNon-store retailing and retail commission-based buying and/or sellingFuel retailingMotor vehicle and motor vehicle parts retailingOther store-based retailing
Accommodation and food servicesAccommodationFood and Beverage Services
Transport, postal and warehousingFinancial and insuranceRental, hiring and real estate services Professional, scientific and technical services3
Administrative and support services Public administrationEducation and trainingHealth care and social assistanceArts and recreation services
2 Includes fuel distribution centres, car distribution centres, agricultural product wholesalers3 Includes scientific laboratory research, legal and accounting services, veterinary services and market research and statistical services
Page 14 Encycle Consulting Pty Ltd
The project was conducted in two phases. Phase 1 is was to review the current Australian literature and studies on C&I waste to provide some initial insights to the ANZSIC industry divisions and sub-divisions and also to determine which two sub-divisions should be studied in more detail in Phase 2 of the project.The industry sub-divisions studied in greater detail are:
accommodation and food services - Food and Beverage Services retail trade - food retail.
Phase 2 of this project was to obtain a comprehensive set of data from industry via direct contact with businesses or by the cooperation of waste management consultants and of industry associations. Data was collated by industry sub-division to provide an updated, detailed view of waste generation and recycling performance across the C&I industries4.The methodology for the meta-analysis of C&I waste information included:Phase 1 – desktop review
1. characterisation of the C&I waste stream by ANZSIC grouping, using data from the Australian Bureau of Statistics
2. coordination to obtain existing studies relevant to this area with: State government agencies Industry bodies Other consultancies
3. collection of international data for comparison including UK, USA and Europe4. additional information such as market research reports (e.g. IBISWorld)5. analysis of the data sets to combine industry descriptions with waste generation
data to create a picture of waste generation and management for each industry sector both nationally and at a state level
6. identification of potential data sources from businesses considered ‘representative’ of their industry sector, including businesses from across each size range (small, medium and large enterprises)
7. development of interview forms and data recording formats 8. data collection, collation and analysis.
Phase 2 – industry data collection and analysis1. approaching relevant businesses to:
a. obtain recent, relevant data (where available)b. undertake site visits and interviews to assess attitudes to waste,
understanding of their waste stream and likelihood of changing current practices
2. obtaining a greater number (7 and 8 respectively) of business in the ACCOMMODATION AND FOOD SERVICES: Food and Beverage Services and the RETAIL TRADE: Food Retail sub-divisions; greater detail was obtained during analysis of these two sub-divisions
4 For this report, C&I refers to the industries studied as part of this project (see Methodology for a full list of industry divisions and sub-divisions)
Page 15 Encycle Consulting Pty Ltd
3. collating data and evaluating data reliability and relevance using a logical and transparent decision making framework as provided in Appendix C.
4. undertaking meta-analysis of all data to obtain a detailed dataset for C&I waste in Australia across the industry divisions and sub-divisions studied and material types
5. assessing the current stream of waste to landfill for each industry division and sub-division to estimate possible opportunities for waste avoidance or improved recycling
6. obtaining waste industry figures about costs of various waste streams for disposal and recycling
7. using cost data to estimate potential savings for each industry division and sub-division according to the opportunities previously identified
8. estimating environmental impacts of each industry division by applying relevant carbon dioxide equivalent (CO2-e) factors as generated from recent life cycle assessments for each jurisdiction.
2.1 Data timeframes
Data has been requested for the 2010–11 financial year where possible. Some data sets are for years prior to 2010–11 but are mostly no older than 2008–09, with a few very minor exceptions for composition data.
2.2 Data limitations
This study is a meta-analysis of existing data, generously provided by businesses, waste consultants and industry associations. The datasets used for this study describe C&I waste generation and destination. The original data will have been collected using various methodologies, different materials classifications and verified with different levels of rigour.A proportion of the information in this report is obtained from a small sub-sample of the businesses operating in Australia, and should be taken as a guide about relative proportions and types of waste that are generated to inform strategic decisions about where to focus effort and where to conduct further research.The way that data is collected varies in each state or territory and the definitions of C&I waste and even materials counted within a given stream can be different (e.g. whether public buildings or small-medium enterprises (SME) are included or not, or what types of paper constitute the ‘paper’ stream). The variation in methodologies for collecting data and for defining waste streams suggests that consideration of the origins of the data should be made when choosing to compare different states or territories.Drawing on diverse datasets can be fraught with valid concerns about the robustness of the data and of comparing information that has been obtained with varying methodologies. Such concerns about data limitations are reasonable and should be borne in mind when considering the data presented in this report. With one exception, none of the datasets used in this study had any associated uncertainty estimates, on either compositional splits or estimates of overall quantities to different end-of-life fates, so is not possible to provide quantitative uncertainty estimates against the compositional splits or quantitative material flow estimates provided in this report.
Page 16 Encycle Consulting Pty Ltd
Overall waste quantity estimates have been checked against known estimates of end-of-life material arisings with sources such as DSEWPaC (2012b), PACIA (2011) and APC (2012). In a small number of cases, discrepancies between overall estimates arose between the modelling undertaken for this study (aggregated up from the ANZSIC industry division/sub-division level) and these other sources. Where these discrepancies were sufficiently material (more than ±20%), estimated compositional splits at the division/sub-division levels were weighted evenly across all industry divisions to adjust end-of-life material flows to these known values.The datasets used for this study show material leaving businesses as either recycling or destined for landfill. Subsequent to collection there is now an increasing amount of sorting of the C&I landfill stream for the diversion of recyclables. This can occur at alternative waste treatment (AWT) facilities or ‘dirty’ material recovery facilities (MRF’s). There is also some sorting and recovery from open skips prior to consolidation for landfilling. There would also be some sorting at transfer stations of material that is self-hauled by businesses. All of this subsequent sorting and diversion is outside the split of recycling and landfill streams recorded at waste generating sites. Some work will be required in the future to ensure this growing level of subsequent sorting is measured and accounted for.Encycle Consulting and SRU have received the data presented here in good faith and have made every effort to validate the numbers, but was not involved in the collection of the original datasets. All data has been checked for validity, by comparing data sets to ensure that strongly variant numbers are not used.
2.3 Qualitative interpretation limitations
There are many findings discussed in this report about the perceived issues, barriers and drivers affecting business when it comes to making decisions to tackle waste. The authors have substantial experience of dealing with waste generators in Australia across various sectors and the findings from the interviews and site visits for this project have generally substantiated previous understanding of business practices regarding waste. The qualitative discussion is intended to provide a solid background to the reader and to suggest areas where further investigation is likely to be required. The findings are not based on substantial sampling or targeted research in the areas discussed, and is not intended to provide absolute answers to questions of business’ attitudes and actions regarding their waste management practices.
2.4 Industry size by employment (EFTE) (phase 1)
Australian Bureau of Statistics (ABS) data on industry employment and business size has been used to build an understanding of the relative size of each industry division and sub-division included in this project (as per Table 1). A key initial task was to identify the number of EFTEs in each of the relevant divisions using recently released ABS employment data for the year 2009. The ABS formula for these conversions was applied to convert this data into EFTE by division and sub-division. For some industries, EFTE is not necessarily the most appropriate indicator of waste generation rates), however, for this study EFTE has been applied across all industry divisions to provide comparability and uniformity of data throughout the report.
Page 17 Encycle Consulting Pty Ltd
2.5 Waste generation by sector
Phase 1 – desktop reviewWaste generation per EFTE relevant to each division was calculated using the industry waste profile datasets. For this report, findings of all currently available waste generation data for each industry division has be used. The waste data used for this report has been compared to a wide range of literature reviewed from different Australian jurisdictions and overseas, most notably, England and California. Over the course of this project, waste data has been derived in a more complete form than was previously available, by surveying waste generating companies and from other stakeholders such as waste and recycling collection contractors, industry associations and government agencies. The enhanced C&I waste data set derived through the project provides more robust and credible figures to more fully understand Australian C&I waste generation.Phase 2 – Industry data collectionBusinesses operating in each sub-division were identified for analysis and data gathering for Phase 2 of the project. A total of 80 businesses provided data directly relating to waste and recycling at their premises for this study. Of the businesses that provided waste data, 24 sites spread across all industry divisions have been visited to understand the barriers and opportunities for their waste stream.The site-specific datasets were supplemented by 94 studies from industry associations and state government agencies (81 from Australia and 13 from overseas; mainly USA and UK). The amalgamated data obtained from site visits, interviews and compiled audits from previous studies provided coverage of nearly 500 C&I businesses across Australia.Further to the quantification of waste generation in each industry division, some data on the material profile of this waste is analysed and provided. The report features a series of waste profiles for each of the relevant divisions and sub-divisions (Section 4).The full survey database from the UK Commercial and Industrial Waste Survey (DEFRA,2011) has been rebuilt to align it with the industry divisions and waste compositions used in this project. This database is a useful resource for comparative data to the primary data collection activities undertaken for this project.Of the 32 sub-divisions assessed for this study, 2 priority sub-divisions were identified:
ACCOMMODATION AND FOOD SERVICES: Food and Beverage Services (7 site-specific datasets obtained)
RETAIL TRADE: Food Retailing (8 site-specific datasets obtained)These priority sub-divisions were chosen based on preliminary waste flow modelling, as they were relatively significant across the following aspects:
total waste generation waste generation rates per EFTE per year high levels of recoverable material sent to landfill the overall waste profile and the ease of recyclability of the materials generated.
Page 18 Encycle Consulting Pty Ltd
2.6 Waste diversion from landfill
Data on the diversion of material from landfill, by waste stream, was drawn from previous audits conducted by individual businesses, sector based reports and by observing both the general waste and recycling streams during site visits. Wherever possible, data was presented as a proportion of the total waste stream by material by weight. Where data was available, but measured by volume, the weight was calculated using conversion factors established from previous C&I waste audits.
Paper & cardboardCardboard 130Office paper 150Other paper 150
PlasticsPlastic packaging 70Other plastics
GlassPackaging glass 400Other glass
OtherLeather & textiles 100Tyres & other rubber 200Unknown 200
Source: SRU (2011b)The current level of C&I diversion from landfill for recycling is extrapolated from the data sourced from industry site surveys in Australian jurisdictions. Where local data was patchy or unavailable, data from contemporary reports from other similarly developed nations have been used. Aggregated C&I recycling data have been used to outline the present situation across each sector. Where possible, the recycling by material has been related back to the relevant industry divisions. This has been a key focus of the surveying and consultation with industry stakeholders. Data from other studies (international) have been used to cross-check and verify the surveyed level of recycling activity.
Page 19 Encycle Consulting Pty Ltd
2.7 Material categories and types
The material categories and types used in this study are presented in Table 3. The typology (naming system) used is largely aligned with the material categories and types applied in the DSEWPaC (2012b) report.Table 3: Comparison of material categories and types
Food organics Food organicsGarden organics Garden organicsTimber TimberOther organics Other organics(excluded from this study) Biosolids
Paper & cardboard
Cardboard CardboardOffice paper Office paper
Other paperLiquid paperboard (LPB)Newsprint and magazines
Plastics
Plastic packagingPolyethylene terephthalateHigh density polyethylenePolyvinyl chlorideLow density polyethylenePolypropylenePolystyreneOther plastics
Other plastics
GlassPackaging glass
GlassOther glass
Other
Leather & textiles Leather & textilesTyres & other rubber Tyres & other rubberUnknown ‘Unknown’ not used(excluded from this study) Fly ash
Hazardous (excluded from this study)QuarantineContaminated soilIndustrial wasteAsbestos
The material categories used in this study are identical to the material categories used in DSEWPaC (2012b), except that hazardous wastes were excluded from consideration in
Page 20 Encycle Consulting Pty Ltd
this study. A number of material types are also more aggregated than in DSEWPaC (2012b), primarily in the masonry materials and plastics categories. This aggregation of material types was undertaken due to a lack of compositional data, at the industry division/sub-division level, for material types at this level of detail.
2.8 Financial impacts on Australian business of waste and recycling
A key task for this project was to calculate the cost of waste management to industry. The objective of the costing exercise is to highlight to industry and other stakeholders the economic costs to business associated with:
waste collection, disposal and recycling by industry division purchasing business inputs that are then converted to waste or recycled.
These financial impacts represent the cost side of what is often described in economic terms as ‘material efficiency’. Improving material efficiency means reducing a component of business costs, which largely shifts straight to the bottom line, disregarding any costs associated with enabling the avoidance of input costs.Detailed information on waste and recycling collection and disposal costs (in terms of $/tonne by stream and material type) has been obtained from waste collection contractors and other industry sources for all Australian jurisdictions. The costs for waste have then been applied to the quantities of waste and recycling generated by businesses in each industry division/sub-division to provide estimates of the waste and recycling disposal costs across each division.Approximate ‘input’ cost factors (in terms of $ per tonne) have been identified for each material type to allow estimates of the theoretical ‘avoidable’ costs of waste. By then applying a cost rate to each material (including the packaging) on a per tonne basis and applying this to material disposal levels, an estimate of the product wastage cost was made. The input cost factors are approximate, and the calculations of input costs in Section 5 provide an indication of the likely magnitude of the costs associated with the business inputs that are converted into wastes.The combination of product loss, packaging costs and waste collection and disposal costs has been quantified for each division/sub-division and by material type (by input cost only).The input cost estimates exclude costs to business associated with the handling and transformation of materials that are eventually disposed of as wastes. While potentially significant, these costs would be problematic to estimate and so the estimates provided in this report are probably fairly conservative. These excluded costs include energy and water related costs and also costs of staff time spent on handling the materials.As an example of the simple costing build-up, a café might purchase 10 tonnes per year of prepared food at an average cost of $10 per kilogram (kg). This purchase includes packaging at a rate of 5% (in both mass and embedded cost terms). Assuming that 25% of the total food inputs are disposed to landfill, and the cost of collection and disposal is $200 per tonne to landfill, and $100 per tonne to recycling (assuming a proportion of the food has a residual recovered value).The economic cost (excluding any business costs in handling goods and waste) are approximately:
product loss of 2.5 tonnes/year at $10.00 per kg (including packaging) = $25 000
Page 21 Encycle Consulting Pty Ltd
waste collection and disposal for 1.5 tonne of product (assuming 1 tonne is recycled) at $200 per tonne = $300
recycling collection for 1 tonne of product at $100 per tonne = $100 recycling collection for 0.125 tonne of packaging = $12.50 total economic cost of waste = $25 400 per year.
Obviously the collection costs will be higher than those estimated above, as the full year waste and recycling service costs will include charging for a weekly collection service, not a single pick-up once a year, as implied above.
1. Waste disposal costsWaste disposal and recycling service costs were built through from consultation with several waste contractors operating across Australia, other industry sources, and from prior work undertaken by Encycle and SRU. These costs were then applied across each ANZSIC industry division/sub-division.2. Input costsConservative input cost ranges were developed through numerous sources (see Table 18 in Section 5,) or were estimated by the project team where factors were unavailable. These input cost factors were then applied across each ANZSIC industry division/sub-division by material type.3. Calculate the costs of waste disposalCombining the waste and recycling service costs and the previously estimated waste flows for each industry division, the total disposal cost to business was calculated for disposing of business inputs and packaging to landfill or recycling. It should be noted that industry averages are applied to each industry division and sub-division for these calculations which could result in broad estimates where business type and size is very diverse within a division.4. Calculate up-front purchase cost of business inputs sent for disposalThe purchase costs were estimated for business inputs which are purchased, transformed into wastes and subsequently sent for disposal. The up-front costs to business associated with purchasing business inputs which are subsequently not used, or are under-utilised, is an important consideration in any analysis of the economic cost of material inefficiency.Businesses often do not have perfect knowledge of the actual quantity of business inputs that will be required. For businesses which sell perishable goods, and goods which are purchased on a convenience basis by customers (e.g. food retailing), a high rate of material efficiency, relative to other business sectors, may not be feasible. For this reason, a level of excessive purchase of inputs is unavoidable in many industries.5. Calculate total economic cost of waste and material inefficiency On the basis of the above analytical steps, the total economic cost of waste and material (in)efficiency to Australian business was estimated. This cost was compared against the size of each industry sector in the Australian economy, and allows a comparison between industry sectors to be made.
2.9 Greenhouse gas emission benefit of improved material efficiency
The methodology for undertaking the greenhouse gas benefit assessment of material efficiency for each industry has focused on the greenhouse house gas impact (in
Page 22 Encycle Consulting Pty Ltd
terms of kg carbon dioxide equivalent (kg CO2-e)) associated with the recovery, or disposal to landfill, of each material type on a ‘whole of life cycle’ basis. Emissions benefits have been determined both overall (for each material type) and by industry division or sub-division. There were four state level studies considered for use in this study that have evaluated the ‘benefits of recycling’ (in terms of avoided CO2-e) by material types. These studies had differing levels of relevance to C&I waste materials, across both packaging and non-packaging materials. Three of these studies (excluding the Zero Waste SA study) are based on full Life Cycle Assessment (LCA) based studies undertaken (largely) in accordance with the international standard ISO 14040 (2006). The studies and coverage are outlined in Table 4.
Table 4: Outline of available environmental benefits of recycling studies
Reference Description
Environmental benefits study of recycling (DECCW, 2010d)
This DECCW study is based on NSW specific LCA modelling for C&I materials. Data on the greenhouse gas impacts of both recycling and landfill are separately provided from which the net benefits of recycling are calculated.Data on both packaging and non-packaging waste materials has also been determined.This study was peer reviewed and done in accordance with the international LCA standard ISO 14040 (2006).
Life Cycle Impact Data for Resource Recovery for Commercial and Industrial and Construction and Demolition Waste in Victoria (RMIT University, 2005)
This RMIT University study (commissioned by EcoRecycle Victoria) is based on Victorian specific LCA modelling for C&I materials. Data on the greenhouse gas impacts of both recycling and landfill are separately provided from which the net benefits of recycling are calculated.Data on both packaging and non-packaging waste materials has also been determined.This study was not peer reviewed, however it appears to have otherwise been done in accordance with the international LCA standard ISO 14040 (2006).
SA Recycling Activity Report(Zero Waste SA, 2011)
This ZWSA study is primarily based on a synthesis the DECCW NSW (2010d) and RMIT University (2005) studies. SA specific LCA modelling for C&I materials has not been undertaken. Data on the greenhouse gas impacts of recycling and landfill are provided in terms of the net benefits of recycling only.Comprehensive data on both packaging and non-packaging waste materials has also been determined.This study was not peer reviewed, and did not involve any new LCA modelling.
This DEC WA study is based on WA specific LCA modelling for packaging materials recovered from kerbside. Data on the greenhouse gas impacts of recycling and landfill are provided in terms of the net benefits of recycling only.The report will be of some, but limited, usefulness in determining the environmental impacts of C&I waste.This study was peer reviewed and done in accordance with the international LCA standard ISO 14040 (2006).
Page 23 Encycle Consulting Pty Ltd
Following an assessment of the available LCA data for the purposes of this study, the NSW greenhouse gas impact data was deemed most appropriate and was applied nationally (DECCW, 2010c). While an approximation for other jurisdictions, the NSW study provides the most up-to-date and suitably detailed LCA modelling that is available. The Victorian study is fairly equivalent in rigour; however it is in need of updating and does not provide the same level of detail as the published NSW data. The data from DECCW (2010d) has been compiled into a dataset split by both industry ANZSIC division and sub-division levels, and by material type. This data has then been used to determine the greenhouse gas impacts against the baseline of 100% of C&I waste disposal to landfill of the following two scenarios:
current C&I waste materials diversion to recycling 100% of C&I waste materials are diverted to recycling.
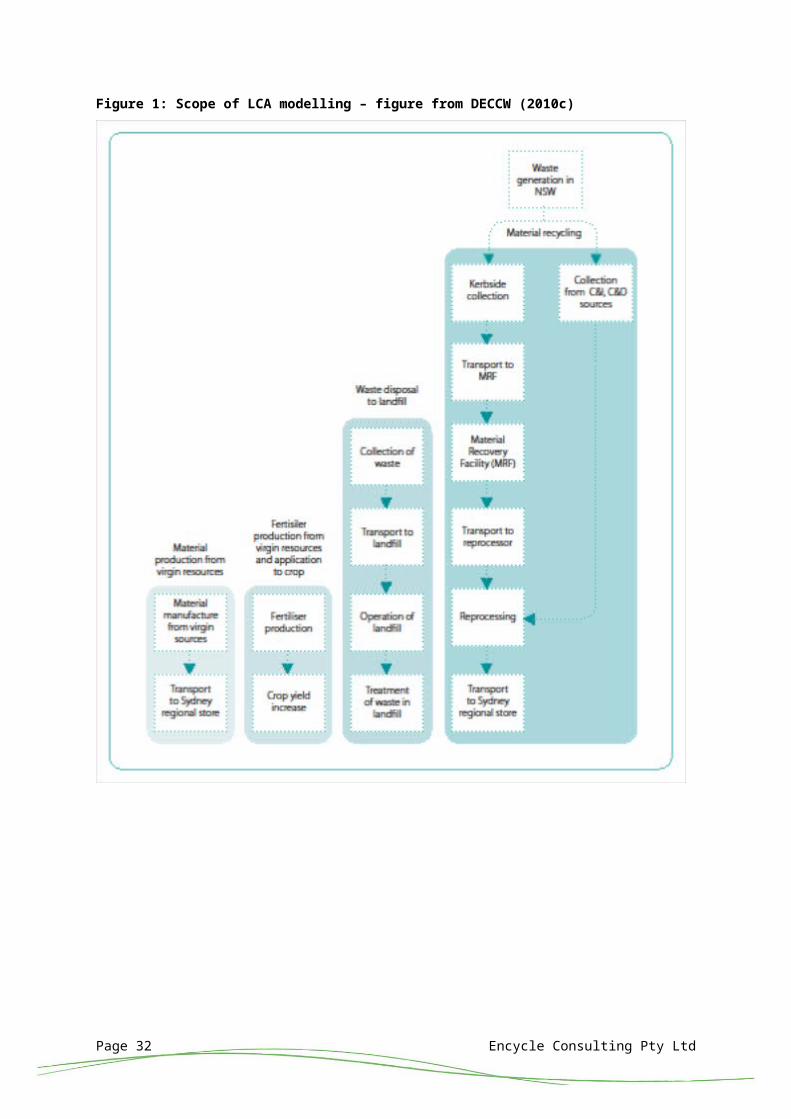
The difference between these two scenarios provides an estimate of the greenhouse gas emission benefit that could be achieved, relative to the current status quo, if all C&I waste materials were diverted to recycling rather than sent to landfill.The approach taken to calculating the net environmental impact of recycling in DECCW (2010c) is outlined in Figure 1 and Figure 2.
Page 24 Encycle Consulting Pty Ltd
Figure 1: Scope of LCA modelling – figure from DECCW (2010c)
Page 25 Encycle Consulting Pty Ltd
Figure 2: Method for calculating the net environmental impacts in the recycling process – figure from DECCW (2010c)
The greenhouse gas emissions savings associated with recycling as discussed here are based on comprehensive life cycle modelling (Figures 1 & 2). Where there are benefits (of avoided CO2-e emissions) from recycling, they are derived from:
avoided emissions from energy consumption at the extraction and early processing stages of manufacturing products from virgin materials
avoided direct emissions of methane from landfill (for biodegradable materials)The net benefits of recycling from these two areas of the supply chain are mostly accounted for under Scope 1 of the National Greenhouse and Energy Reporting System (NGERS) at the point of energy production (for extraction and processing) or methane production (at landfills). Under the Carbon Price, the greenhouse gas benefits of recycling are realised at specific points in the supply chain and are generally not directly associated with collection or reprocessing of recyclable materials. That said, the greater energy efficiency of producing many products from recycled feedstock may become more attractive to business as the price on carbon impacts upon energy costs. It would have been interesting to determine the potential for avoided greenhouse gas emissions, relating to avoided material consumption (rather than its diversion to recycling), however this was not possible using the data available in any of the ‘benefits of recycling’ related studies. Both the landfill and recycling values generally exclude any life cycle aspects that are the same (and thus cancel out) for both the landfill and recycling pathways, e.g. product manufacturing and use inputs. The values also exclude any life cycle impacts that are not ‘recoverable’ through closed loop (or equivalent) recycling. For example, the greenhouse gas emissions associated with cement manufacture cannot be avoided in a following life cycle by the recycling of concrete. Concrete is generally recycled as a crushed aggregate, and cannot be recycled to produce a recovered (functional) cement powder.
Page 26 Encycle Consulting Pty Ltd
3 C&I waste and recycling: overall findings
3.1 Quantitative findings - summary
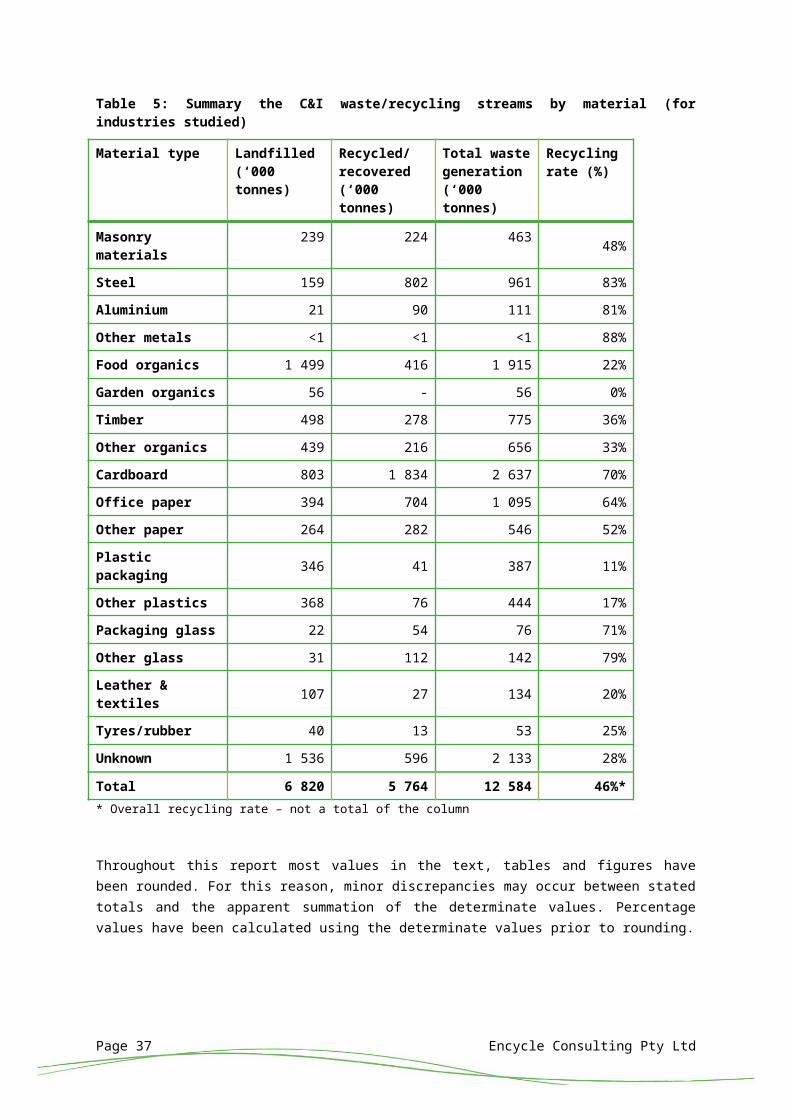
This section provides an overview of the C&I waste stream based upon the data analysed for this study provided by individual companies, government and trade associations. In particular, this section looks at the key materials that are found in the C&I waste stream and provides an overview of the current levels of recycling activity across small, medium and large companies within each division. Section 4 discusses the detail of the information and data analysed for this study by industry division and sub-division.Across Australia, the total C&I waste stream covered by this study accounts for about 12.5 million tonnes of waste generation per year as shown in Table 5 and Figure 3. Almost 7 million tonnes of C&I waste is sent to landfill and more than 5.7 million tonnes is recovered. The estimated recycling rate for C&I waste is about 46% across the country.The 12.5 million tonnes of C&I waste covered in this study does not include primary producers such as mining or agriculture which will contribute a significant quantity of material to the waste stream, but a high proportion is likely to be dealt with (landfilling and/or burning) on site. Quantification of the material excluded from this study is difficult, as only patchy data exists for either mining or the agricultural sector.
3.2 Key materials in the C&I waste stream
From the data gathered for this study, it is possible to identify the key materials in the C&I waste stream and their major sources. Table 5 and Figure 3 show the summary of all materials to landfill and recycling across all divisions and sub-divisions included in this study. From Figure 3 it is interesting to note that there is a significant contribution of food organics to the C&I waste stream. Food organics make up a high proportion of waste from the accommodation and food services division. Food waste is a significant contaminant of C&I paper, cardboard and plastic, currently impacting on their recycling (at least to high-value uses). The key materials currently recovered from the waste stream include: paper/cardboard, metals, glass and to a lesser extent, timber and plastics. Note that recycling is measured by weight, and less dense materials such as plastics may be recovered in significant volumes but this does not represent a high tonnage. In handling a range of compositional data sets there is often a component titled ‘other’ or ‘other paper’, ‘other glass’, ‘other plastics’. Where possible these are reallocated to the material splits that are widely used. In some cases this is not possible or would lead to distorted results so these quantities have been included under ‘unknown’.It is worth noting there remains a high amount of cardboard and office paper in the general waste stream despite these materials being readily recyclable.
Page 27 Encycle Consulting Pty Ltd
Table 5: Summary the C&I waste/recycling streams by material (for industries studied)
Tyres/rubber 40 13 53 25%Unknown 1 536 596 2 133 28%Total 6 820 5 764 12 584 46%** Overall recycling rate – not a total of the column
Throughout this report most values in the text, tables and figures have been rounded. For this reason, minor discrepancies may occur between stated totals and the apparent summation of the determinate values. Percentage values have been calculated using the determinate values prior to rounding.
Page 28 Encycle Consulting Pty Ltd
Figure 3: Summary the C&I waste/recycling streams by material (for industries studied)
0
200
400
600
800
1000
1200
1400
1600
1800
2000
'000
tonn
es p
er y
ear
LandfillRecycling
Page 29 Encycle Consulting Pty Ltd
3.3 Key recyclable materials in the C&I waste stream
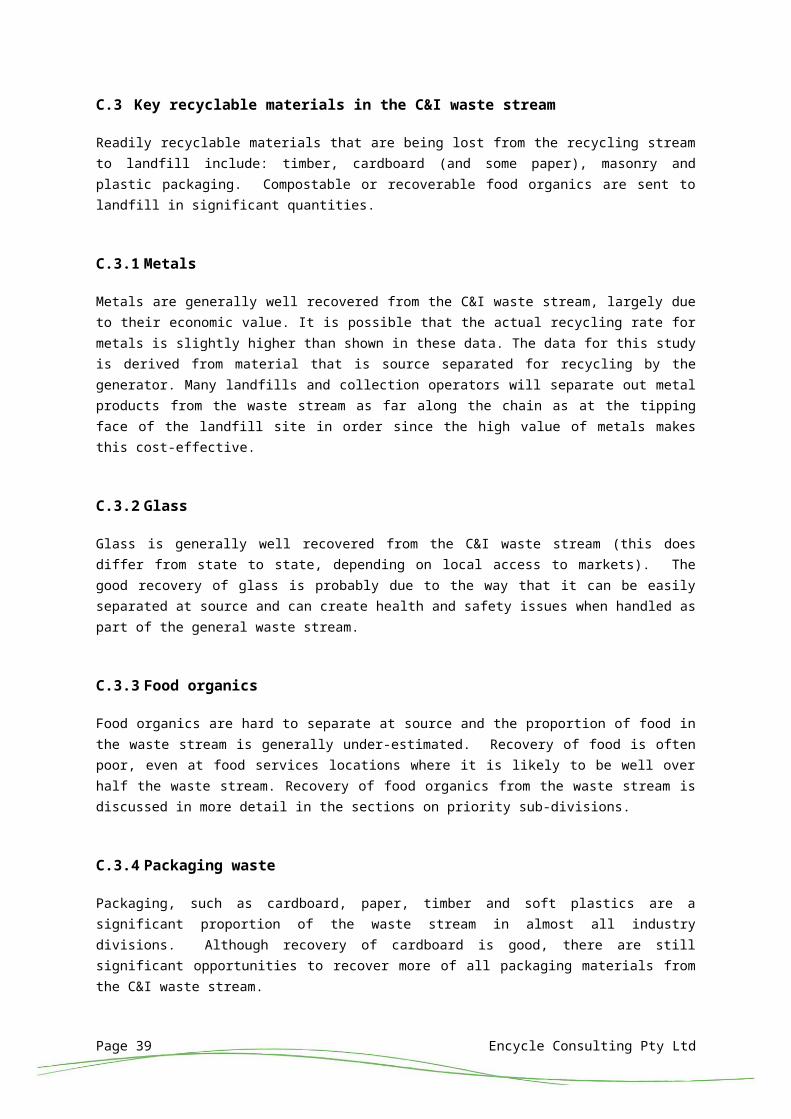
Readily recyclable materials that are being lost from the recycling stream to landfill include: timber, cardboard (and some paper), masonry and plastic packaging. Compostable or recoverable food organics are sent to landfill in significant quantities.
3.3.1 Metals
Metals are generally well recovered from the C&I waste stream, largely due to their economic value. It is possible that the actual recycling rate for metals is slightly higher than shown in these data. The data for this study is derived from material that is source separated for recycling by the generator. Many landfills and collection operators will separate out metal products from the waste stream as far along the chain as at the tipping face of the landfill site in order since the high value of metals makes this cost-effective.
3.3.2 Glass
Glass is generally well recovered from the C&I waste stream (this does differ from state to state, depending on local access to markets). The good recovery of glass is probably due to the way that it can be easily separated at source and can create health and safety issues when handled as part of the general waste stream.
3.3.3 Food organics
Food organics are hard to separate at source and the proportion of food in the waste stream is generally under-estimated. Recovery of food is often poor, even at food services locations where it is likely to be well over half the waste stream. Recovery of food organics from the waste stream is discussed in more detail in the sections on priority sub-divisions.
3.3.4 Packaging waste
Packaging, such as cardboard, paper, timber and soft plastics are a significant proportion of the waste stream in almost all industry divisions. Although recovery of cardboard is good, there are still significant opportunities to recover more of all packaging materials from the C&I waste stream.While the composition profile of the waste stream is different in each industry sub-division there are some materials that are present in a significant amount in nearly all industry divisions. These are cardboard and paper and, to a lesser extent, timber packaging. The presence of tertiary packaging is obviously higher in divisions like wholesaling but is also a feature of all other divisions. Tertiary packaging is largely cardboard but also includes timber packaging such as pallets, skids and crates.
Page 30 Encycle Consulting Pty Ltd
3.3.5 Soft plastic packaging
Packaging materials include plastic film used to shrink wrap materials stacked on pallets and protective clear plastic bags within cardboard boxes. Soft plastics are low in density and can be very bulky and difficult to transport cost-effectively.It is worth noting that the recycling rate for plastics packaging is relatively low, with almost a million tonnes of this material going to waste. Much of this will be flexible freight packaging which is a key feature of the waste stream across many industry divisions.
3.3.6 Paper
Paper is a material that is common to all divisions, usually from office environments. Paper is produced in high quantities in divisions related to education, health and professional services.There is a high proportion of ‘other paper’ in the C&I recycling stream. A significant proportion of ‘other paper’ in the recycling stream appears to be derived from the retail trade divisions, of which a significant amount comes from Food based retailing and Other store based retailing. Although the data does not provide sufficient detail to explain the high quantities of ‘other paper’ in the recycling stream fully, it is likely that this material has a high proportion of cardboard and mixed paper (including office paper).
3.3.7 For some sites recycling one or two materials dominate the waste stream
Analysis of waste streams can show that one or two materials can dominate a waste stream for a site, particularly for specialised small and medium businesses. Bakeries have mostly bread and florists mostly flowers in their waste stream. Across the WHOLESALE TRADE division, cardboard and flexible plastic freight packaging accounts for well over half of total waste. For particular retailers or manufacturers, industry-specific materials or products can dominate the waste stream. Many small businesses are aware of dominant materials in their waste stream but may be unaware of the opportunities available to recycle more and avoid disposal costs. The lack of service may be an issue related to the small volumes of recyclable material produced (making a collection service economically unfeasible). For food waste, services are generally not offered to small businesses as contamination is difficult to manage and small volumes can make it difficult for waste collection companies to provide an effective service.If a recycling system for the dominant materials in some waste streams can be introduced, it is possible to get very high rates of diversion from landfill with little effort.
3.4 Findings: C&I waste generation by jurisdiction
Each jurisdiction has a different profile for the types of C&I waste produced, due to the different types of industries present. Table 6 shows the total quantities of waste landfilled and recycled for each jurisdiction (DSEWPaC, 2012b). Across each state or territory, there are notable differences in the type of industry present.
Page 31 Encycle Consulting Pty Ltd
There are notable differences between the levels of C&I recycling from the in different parts of Australia. Each city in Australia has differing levels of recycling infrastructure which impacts upon the cost and ease of recycling for local businesses. The size of the local industry will affect ability to recycle. SMEs (small-medium enterprises) often report that recyclers will not collect material from their premises as the volumes are too small to make the provision of a service viable.
Table 6: Commercial and industrial waste by jurisdiction, 2008–09 data (DSEWPaC, 2012b)
Total 12 540 000 5 720 000 6 820 000 54%Note: C&I and C&D waste quantities are provided as combined totals in DSEWPaC (2012b) for the ACT, Northern Territory and Tasmania, and so are not provided in the table above.
Table 7 shows the industry divisions present in each jurisdiction on a per EFTE basis to demonstrate the influence of each industry on the state waste profile. The waste stream and recycling performance of each industry division and sub-division considered for this project is discussed in Section 4.
Page 32 Encycle Consulting Pty Ltd
Table 7: Industry divisions and sub-divisions in each jurisdiction by EFTEACT NSW NT Qld SA Tas Vic WA Total
700Note: There is no ABS data available that provides specific data splitting employment by jurisdiction, by size, by sub-division. We therefore use average national figures on a pro rata basis and this can understate the numbers for small divisions or small states.
Page 35 Encycle Consulting Pty Ltd
3.5 Waste collection systems
There is a range of collection systems for waste and recycling from C&I sites. These can include wheelie bin-based collections for businesses with restricted access for front load vehicles which are required for collection of skips and bins larger than standard wheeled bins (240 L to 1100 L bins). By tonnage, a majority of waste is collected in front load trucks from waste skips that range in size from 1.5 m3 to 4.5 m3. This was verified following site visits to a cross section of industry and interviews with waste collectors. For larger commercial or industrial sites, large open top bins or static compactors may be used. Open top skip bins are occasionally used for high volume recyclables but most commonly for mixed bulk wastes. Static compactors are used for either mixed general waste or for high volume recyclables such as cardboard. Large skip bins and compactors are only found on relatively large sites as they require an area with high roof height (over 6 m) and wide space in front of the compactor to allow the collection vehicle to manoeuvre and load the bin.While most C&I waste is collected by waste collection contractors, some companies do self-haul their waste directly utilising their own vehicles and staff. Self-haulage of waste mostly occurs where the site uses vehicles for their operations that can also carry bins, skips or bales.
3.5.1 Local government C&I waste servicing
In many municipalities across Australia local government has extended its contracted collections of recycling and general waste to commercial sites (mostly SMEs but not exclusively, for example City of Perth provide services to major clients in the central business district). Generally this has been by providing all ratepayers and community organisations with a service equivalent to that provided to households. Charges for waste collection are generally included as part of the rates paid by the SME. Inclusion of waste charges to rates for small business can often mean that these charges are not refundable if a waste collection service is not received. Businesses have no incentive to recycle any materials that are not included in the local government service since this would involve paying additional fees for the service (on top of waste fees included in local government rates).Some local governments feel that provision of a waste collection service to C&I sites is onerous and problematic. In some jurisdictions there are legislative impediments to servicing or charging businesses for recycling services. In some there is also a concern about competition policy. However, other local governments recognise that waste servicing can be the source of substantial income. Keen to protect their current service arrangements, some waste companies are hostile to local government servicing.The extent of waste and recycling collection provision to business by local government varies across jurisdictions. Adelaide has a near universal provision of service. Melbourne metropolitan councils provide in excess of one hundred thousand sites with a collection. Perth is patchy owing to the high number of different local governments in the metropolitan area. The extent of waste servicing to business is not well-understood at a national level.
Page 36 Encycle Consulting Pty Ltd
4 C&I waste stream assessment by industry division: findings
This section discusses each of the industry divisions and sub-divisions and their significance to the C&I sector in terms of employment (number of EFTE) and in terms of quantity and type of waste generated. Waste generation is discussed in terms of total generation for each sub-division and also the waste generation rates per EFTE for each sub-division. Standardising waste generation by number of employees (as EFTE) is used as a means of assessing the ‘waste intensity’ of each industry division. Waste generation per EFTE per year provides a means of comparing industry divisions and assessing how the waste stream will be impacted by growth in that industry.Recycling or recovery rates and opportunities for improved recovery of materials are discussed for each industry sub-division.The industry summaries in this section of the report are listed in ANZSIC code order (ABS,2006).
4.1 Summary: waste generation by industry division, sub-division
Waste generation rates for each industry division and sub-division are presented in this section. The data used in this section is a meta-analysis of waste data from Australian businesses in each industry division (analysis is described in more detail in the methodology in Section 2). ABS data have been used to describe each division and sub-division; particularly the EFTE data.Figure 4 shows waste generation for each division. The total waste generation from the C&I sector calculated for this study is very close to the current projections of C&I waste from classification at a disposal or diversion point and reported in Waste and Recycling in Australia (DSEWPaC, 2012b) and also agrees closely with the desktop literature review undertaken in Phase 1 of this project. The 2011 Waste and Recycling in Australia report calculated a C&I waste generation of 13 million tonne exclusive of most waste in divisions such as agriculture and mining that are also not part of the scope of this project. It may have included the Electricity, gas, water and waste services division that was also excluded from this project.Figure 4 shows significant variation in waste generation levels per year between the industry divisions and sub-divisions. The average waste generation per employee across all industry sectors studied is 1.7 tonne/ EFTE per annum. The estimate for office based employees in the professional services division is lower than this at 0.3 tonne/ EFTE while the food retail sub-division and manufacturing division is estimated to produce waste at more than 3 tonne/ EFTE and 4.6 tonne/ EFTE respectively.
Page 37 Encycle Consulting Pty Ltd
Figure 4: Estimated waste generation for each ANZSIC division and sub-division reviewed for this project
17.2%
12.5%
6.8%
6.3%
5.9%
4.5%
4.5%
3.6%
3.5%
3.3%
3.1%
2.9%
2.3%
2.3%
1.9%
1.9%
1.8%
1.8%
1.8%
1.6%
1.6%
1.4%
1.3%
1.3%
1.2%
1.0%
0.7%
0.7%
0.6%
0.4%
0.3%
Food and Beverage Services
Other Store-Based Retailing
Food Retailing
Food Product Manufacturing
WHOLESALE TRADE
ARTS AND RECREATION SERVICES
HEALTH CARE AND SOCIAL ASSISTANCE
Machinery and Equipment Manufacturing
Primary Metal and Metal Product Manufacturing
Transport Equipment Manufacturing
Accommodation
TRANSPORT POSTAL AND WAREHOUSING
Motor Vehicle and Motor Vehicle Parts Retailing
RENTAL, HIRING AND REAL ESTATE SERVICES
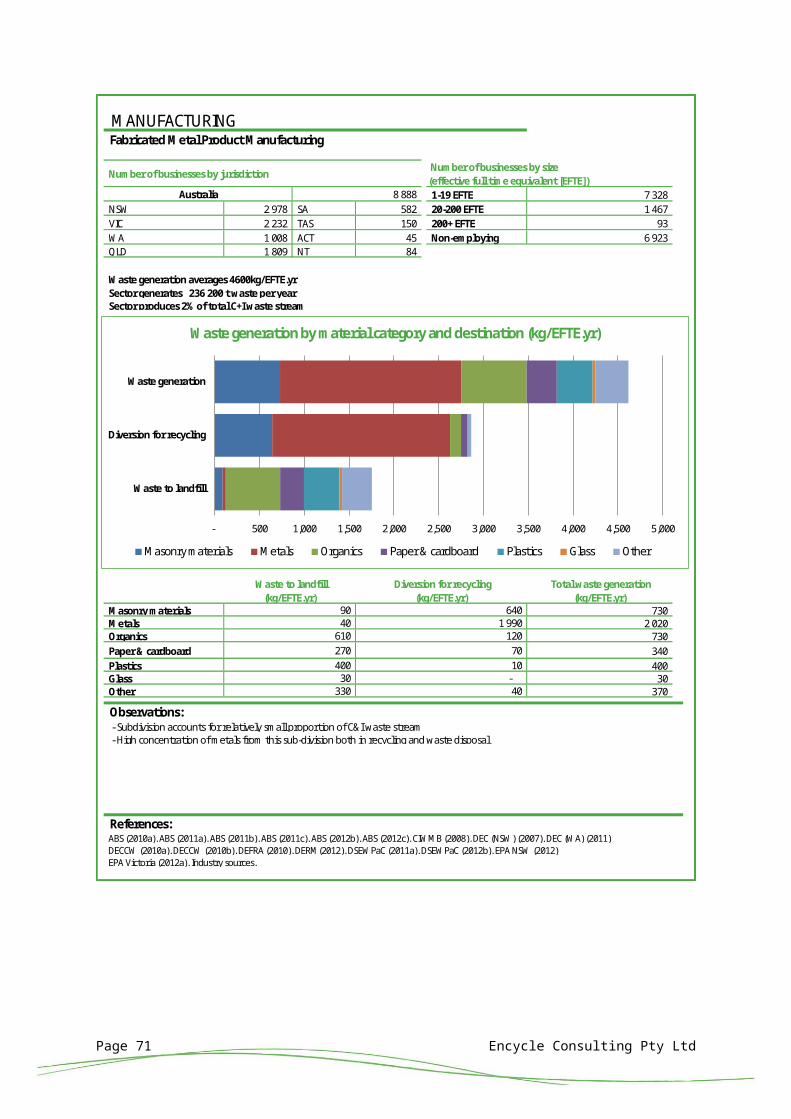
Fabricated Metal Product Manufacturing
EDUCATION AND TRAINING
PROFESSIONAL, SCIENTIFIC AND TECHNICAL SERVICES
PUBLIC ADMINISTRATION AND SAFETY
Printing (including the Reproduction of Recorded Media)
Furniture and Other Manufacturing
Basic Chemical and Chemical Product Manufacturing
Textile, Leather, Clothing and Footwear Manufacturing
Wood Product Manufacturing
Non-Metallic Mineral Product Manufacturing
Polymer Product and Rubber Product Manufacturing
Beverage and Tobacco Product Manufacturing
Pulp, Paper and Converted Paper Product Manufacturing
Of the total C&I waste generated (as studied for this project), average recycling is around 46%. As discussed in Section 3, a significant proportion of C&I recycling is made up of: paper/cardboard, metals, glass and to some extent, plastics and timber.Table 8 and Figure 5 show the breakdown of waste and recycling by sub-division. Across all divisions, recycling rates can be as high as 86% (TRANSPORT POSTAL AND WAREHOUSING) but conversely, as low at 9% (RENTAL, HIRING AND REAL ESTATE SERVICES). Office-based industries attain a recycling rate up to 57% (but sometimes much lower), largely due to paper recovery. There is likely to be additional opportunities for improving recovery in these office-based divisions (e.g. PUBLIC ADMINISTRATION AND SAFETY, FINANCIAL AND INSURANCE SERVICES, RENTAL, HIRING AND REAL ESTATE SERVICES).The high waste generation divisions are: RETAIL TRADE and ACCOMMODATION AND FOOD SERVICES which together account for about half of all C&I waste considered for this study. The MANUFACTURING division produces a significant amount of waste overall and has good recycling across a very diverse range of sub-divisions. Table 8: Landfill and recycling performance for each industry division studied (targeted sub-divisions are highlighted in green)Industry division Total
(tonnes)Landfille
d (tonnes)
Recycled/
recovered
(tonnes)
Recycling rate
(%)
MANUFACTURING 3 858 200 1 466 300 2 391 900 62%ACCOMMODATION AND FOOD SERVICES: Food and Beverage Services
2 163 800 1 472 300 691 500 32%
RETAIL TRADE: Excl. Food Retailing
1 975 200 1 048 200 927 100 47%
RETAIL TRADE: Food Retailing 860 600 456 700 403 900 47%WHOLESALE TRADE 738 100 384 800 353 300 48%ARTS AND RECREATION SERVICES 571 100 422 400 148 700 26%HEALTH CARE AND SOCIAL ASSISTANCE
564 700 443 600 121 100 21%
ACCOMMODATION AND FOOD SERVICES: Excl. Food Service
391 500 266 400 125 100 32%
TRANSPORT POSTAL AND WAREHOUSING
369 900 50 300 319 600 86%
RENTAL, HIRING AND REAL ESTATE SERVICES
287 100 262 300 24 800 9%
EDUCATION AND TRAINING 233 500 177 400 56 100 24%PROFESSIONAL, SCIENTIFIC AND TECHNICAL SERVICES
223 900 157 300 66 600 30%
PUBLIC ADMINISTRATION AND SAFETY
221 900 158 400 63 500 29%
FINANCIAL AND INSURANCE SERVICES
70 200 30 300 39 900 57%
ADMINISTRATIVE AND SUPPORT 54 500 23 600 30 900 57%
Page 39 Encycle Consulting Pty Ltd
Industry division Total (tonnes)
Landfilled
(tonnes)
Recycled/
recovered
(tonnes)
Recycling rate
(%)
SERVICES
Total 12 584 200
6 820 300
5 764 000
46%*
*Average recycling rate, not the total for the column
Page 40 Encycle Consulting Pty Ltd
Figure 5: Waste to landfill and recycling from each industry division
MANUFACTURING
ACCOMMODATION AND FOOD SERVICES - Food and Beverage Services
RETAIL TRADE - Excl food retailing
RETAIL TRADE - Food Retailing
WHOLESALE TRADE
ARTS AND RECREATION SERVICES
HEALTH CARE AND SOCIAL ASSISTANCE
ACCOMMODATION AND FOOD SERVICES - Excl food service
TRANSPORT POSTAL AND WAREHOUSING
RENTAL, HIRING AND REAL ESTATE SERVICES
EDUCATION AND TRAINING
PROFESSIONAL, SCIENTIFIC AND TECHNICAL SERVICES
PUBLIC ADMINISTRATION AND SAFETY
FINANCIAL AND INSURANCE SERVICES
0 1 000 000 2 000 000
Diversion to recycling Waste to landfill
tonnes per year
Page 41 Encycle Consulting Pty Ltd
4.3 Organics generation by industry division
In Section 3, the breakdown of the materials in the C&I waste stream showed a very significant proportion of organic material being generated as waste. Organic material in the C&I waste stream is not currently diverted from landfill in significant quantities, despite the potential value of organic material for soil amendments and as an energy source. In landfill, organic material is responsible for undesirable outcomes including methane generation (a greenhouse gas) and liquid leachate production (a potential pollutant requiring careful management). Total organics generation, by industry division, is provided in Table 9. This data includes four material types; food organics, garden organics, timber and other organics.Table 9: Landfill and recycling of organics for each industry division studied (ordered by total organics generation)
Industry division Disposed to landfill
(tonnes)
Diverted to
recycling (tonnes)
Total generation (tonnes)
Division contributio
n to generation
(%)
Division landfill diversion rate
(%)MANUFACTURING 507 000 615 000 1 122 000 33% 55%ACCOMMODATION AND FOOD SERVICES 935 000 77 000 1 012 000 30% 7.6%RETAIL TRADE 572 000 92 000 664 000 20% 14%WHOLESALE TRADE 131 000 24 000 155 000 4.6% 16%HEALTH CARE AND SOCIAL ASSISTANCE 104 000 23 000 127 000 3.7% 18%RENTAL, HIRING AND REAL ESTATE SERVICES
95 000 2 000 97 000 2.9% 2.1%
ARTS AND RECREATION SERVICES
76 000 11 000 87 000 2.6% 13%
TRANSPORT POSTAL AND WAREHOUSING 7 000 56 000 63 000 1.9% 89%EDUCATION AND TRAINING 38 000 0 38 000 1.1% 0%PROFESSIONAL, SCIENTIFIC AND TECHNICAL SERVICES
11 000 3 000 14 000 0.4% 21%
PUBLIC ADMINISTRATION AND SAFETY
11 000 3 000 14 000 0.4% 21%
FINANCIAL AND INSURANCE SERVICES 2 000 2 000 4 000 0.1% 50%ADMINISTRATIVE AND SUPPORT SERVICES
2 000 2 000 4 000 0.1% 50%
Total 2 491 000 910 000 3 401 000 100% 27%**Average for the C&I sector, not a total of the columnThe high rate of diversion of waste from landfill for TRANSPORT POSTAL AND WAREHOUSING is dominated by timber recovery (packaging). It is likely that organics recovered from EDUCATION AND TRAINING are accounted for in the Unknown category.It is interesting that recovery of organics from the MANUFACTURING division is relatively good, which is likely to relate to the production of ‘clean’ (uncontaminated) organics waste streams which can be relatively easily collected for composting or other recovery.
Page 42 Encycle Consulting Pty Ltd
4.4 MANUFACTURING – overview
MANUFACTURING is probably the most diverse division studied for this project in terms of the types of waste generated and the general waste profiles of the industry sub-divisions. Each of the sub-divisions has been assessed separately for this report. Relevant data and descriptions of each sub-division are given in the summary sheets in this section. MANUFACTURING in Australia is characterised by a relatively even split between small, medium and large businesses by number of people employed. There are many small MANUFACTURING business in Australia (over 42 000) and just over 700 large businesses.Table 10: Number of employees (EFTE) and number of businesses in the MANUFACTURING division
Business size (EFTE) 0–19 20–199
200+ Total
Employees (EFTE) (ABS data, 2011)
252 225
264 489
318 784
835 495
Number of businesses (ABS data, 2011)
42 215 10 066 721 53 000
Table 11: Quantities of waste and recycling from the MANUFACTURING division (total per year and per EFTE)
Waste to landfill (kg/EFTE.yr)
Waste to landfill (t/yr)
Recycling (kg/EFTE.yr)
Recycling (t/yr)
Total (waste generation) (kg/EFTE.yr)
Total (waste generation) (t/yr)
1 800 1 466 300 2 800 2 391 900 4 600 3 858 200
When taken as a division, MANUFACTURING makes a significant contribution to the C&I waste stream (32% or 3.9 million tonnes per year). On a per EFTE basis, the MANUFACTURING division has a for a relatively high waste generation rate. Across all MANUFACTURING sectors, waste generation averages at about 4.6 tonnes per EFTE per year.Data from a large number of MANUFACTURING sites shows that there are already high levels of waste diversion for recycling in most MANUFACTURING sub-divisions. Some anecdotal evidence from site visits and interviews undertaken during this project has identified that there are potential ‘quick wins’ in terms of waste avoidance and increased recycling for the MANUFACTURING sector which relate to:
a) particular process wastes (specific to each manufacturing sector)b) tertiary packagingc) over-purchase of feedstock.
There is a tendency to assume that manufacturers’ waste stream is full of product residues but supplier sourced packaging in the form of pallets, drums, boxes and bags are also present and often generic across the whole division. Some sub-divisions do
Page 43 Encycle Consulting Pty Ltd
generate large quantities of prescribed/scheduled/listed wastes and these are beyond the scope of this study.Summary sheets: MANUFACTURING division
MANUFACTURING
1-19 EFTE 42 215 NSW 16 792 SA 3 784 20-200 EFTE 10 066 VIC 15 285 TAS 1 051 200+ EFTE 721 WA 5 376 ACT 354 Non-employing 38 831 QLD 10 072 NT 279
Waste generation averages 4600kg/EFTE.yrSector generates 3 858 100 t waste per yearSector produces 31% of total C+I waste stream
Masonry materials 340 Metals 960 Organics 1 340 Paper & cardboard 940 Plastics 440 Glass 40 Other 560
- High waste intensity per employee - Relatively high recycling rate - Diverse division across many subdivisions - Significant timber, plastics and cardboard composition from packaging waste - Strong food organics provfile mainly from Food Product and Beverage & Tobacco Product MANUFACTURING
ABS (2010a). ABS (2011a). ABS (2011b). ABS (2011c). ABS (2012b). ABS (2012c). CIWMB (2008). DEC (NSW) (2007). DEC (WA) (2011)DECCW (2010a). DECCW (2010b). DEFRA (2010). DERM(2012). DSEWPaC (2011a). DSEWPaC (2012b). EPA NSW (2012)EPA Victoria (2012a). Industry sources. Zero Waste SA (2011a).
Number of businesses by jurisdiction Number of businesses by size(effective full time equivalent [EFTE])
Waste generation by material category and destination (kg/EFTE.yr)
Masonry materials Metals Organics Paper & cardboard Plastics Glass Other
Page 44 Encycle Consulting Pty Ltd
MANUFACTURING Food Product Manufacturing
1-19 EFTE 4 930 NSW 2 156 SA 624 20-200 EFTE 2 191 VIC 2 173 TAS 199 200+ EFTE 160 WA 621 ACT 60 Non-employing 2 984 QLD 1 412 NT 33
Waste generation averages 4600kg/EFTE.yrSector generates 795 700 t waste per yearSector produces 7% of total C+I waste stream
Masonry materials 100 Metals 100 Organics 2 920 Paper & cardboard 530 Plastics 420 Glass 40 Other 520
- Very strong food organics profile - Very high waste generation and good recycling rate - Large number of small businesses in this subdivision - Also strong packaging profile
Waste generation by material category and destination (kg/EFTE.yr)
Masonry materials Metals Organics Paper & cardboard Plastics Glass Other
Page 45 Encycle Consulting Pty Ltd
MANUFACTURING Beverage and Tobacco Product Manufacturing
1-19 EFTE 823 NSW 259 SA 273 20-200 EFTE 250 VIC 234 TAS 39 200+ EFTE 27 WA 183 ACT 12 Non-employing 1 259 QLD 94 NT 6
Waste generation averages 4600kg/EFTE.yrSector generates 124 400 t waste per yearSector produces 1% of total C+I waste stream
Masonry materials 100 Metals 100 Organics 2 920 Paper & cardboard 530 Plastics 420 Glass 40 Other 520
- Very strong food organics profile - Very high waste generation and good recycling rate - Large number of small businesses in this subdivision - Subdivision accounts for small proportion of C&I waste stream - Also strong packaging profile
ABS (2010a). ABS (2011a). ABS (2011b). ABS (2011c). ABS (2012b). ABS (2012c). CIWMB (2008). DEC (NSW) (2007). DEC (WA) (2011)DECCW (2010a). DECCW (2010b). DEFRA (2010). DERM(2012). DSEWPaC (2011a). DSEWPaC (2012b). EPA NSW (2012)EPA Victoria (2012a). Foster's Group (2011). Industry sources. Zero Waste SA (2011a).
Observations:
References:
400 30 30 10
330 180
610 2 310 270 270
40 60
Waste to landfill (kg/EFTE.yr)
Diversion for recycling (kg/EFTE.yr)
Total waste generation (kg/EFTE.yr)
90 10
Number of businesses by jurisdiction Number of businesses by size(effective full time equivalent [EFTE])
Waste generation by material category and destination (kg/EFTE.yr)
Masonry materials Metals Organics Paper & cardboard Plastics Glass Other
Page 47 Encycle Consulting Pty Ltd
MANUFACTURING Wood Product Manufacturing
1-19 EFTE 2 998 NSW 1 292 SA 219 20-200 EFTE 712 VIC 968 TAS 150 200+ EFTE 30 WA 270 ACT 33 Non-employing 2 583 QLD 784 NT 24
Waste generation averages 4600kg/EFTE.yrSector generates 164 300 t waste per yearSector produces 2% of total C+I waste stream
Masonry materials 90 Metals 150 Organics 800 Paper & cardboard 2 710 Plastics 410 Glass 30 Other 420
- High proportion of small businesses in this subdivision - High waste generation and good recycling rate - Organic waste stream dominated by timber (not recycled) - High proportion of plastics to landfill, not clear what this material is - Significant proportion of packaging waste
ABS (2010a). ABS (2011a). ABS (2011b). ABS (2011c). ABS (2012b). ABS (2012c). CIWMB (2008). DEC (NSW) (2007). DEC (WA) (2011)DECCW (2010a). DECCW (2010b). DEFRA (2010). DERM(2012). DSEWPaC (2011a). DSEWPaC (2012b). EPA NSW (2012)EPA Victoria (2012a). Industry sources. Zero Waste SA (2011a).
Observations:
References:
400 10 30 -
330 90
610 200 270 2 440
40 120
Waste to landfill (kg/EFTE.yr)
Diversion for recycling (kg/EFTE.yr)
Total waste generation (kg/EFTE.yr)
90 10
Number of businesses by jurisdiction Number of businesses by size(effective full time equivalent [EFTE])
Waste generation by material category and destination (kg/EFTE.yr)
Masonry materials Metals Organics Paper & cardboard Plastics Glass Other
Page 48 Encycle Consulting Pty Ltd
MANUFACTURING Pulp, Paper and Converted Paper Product Manufacturing
1-19 EFTE 330 NSW 198 SA 30 20-200 EFTE 132 VIC 177 TAS 3 200+ EFTE 18 WA 30 ACT - Non-employing 384 QLD 42 NT -
Waste generation averages 4600kg/EFTE.yrSector generates 88 900 t waste per yearSector produces 1% of total C+I waste stream
Masonry materials 90 Metals 150 Organics 800 Paper & cardboard 2 710 Plastics 410 Glass 30 Other 420
- Subdivision accounts for very small proportion of C&I waste stream - High waste generation and good recycling rate - Organic waste stream dominated by timber (not recycled) - High proportion of plastics to landfill, not clear what this material is - Significant proportion of packaging waste
ABS (2010a). ABS (2011a). ABS (2011b). ABS (2011c). ABS (2012b). ABS (2012c). Australian Paper (2011). CIWMB (2008). DEC (NSW) (2007)DEC (WA) (2011). DECCW (2010a). DECCW (2010b). DEFRA (2010). DERM(2012). DSEWPaC (2011a). DSEWPaC (2012b)EPA NSW (2012). EPA Victoria (2012a). Industry sources. Zero Waste SA (2011a).
Observations:
References:
400 10 30 -
330 90
610 200 270 2 440
40 120
Waste to landfill (kg/EFTE.yr)
Diversion for recycling (kg/EFTE.yr)
Total waste generation (kg/EFTE.yr)
90 10
Number of businesses by jurisdiction Number of businesses by size(effective full time equivalent [EFTE])
Waste generation by material category and destination (kg/EFTE.yr)
Masonry materials Metals Organics Paper & cardboard Plastics Glass Other
Page 49 Encycle Consulting Pty Ltd
MANUFACTURING Printing (including the Reproduction of Recorded Media)
1-19 EFTE 3 717 NSW 1 523 SA 259 20-200 EFTE 619 VIC 1 336 TAS 48 200+ EFTE 33 WA 357 ACT 60 Non-employing 2 968 QLD 765 NT 21
Waste generation averages 4600kg/EFTE.yrSector generates 221 000 t waste per yearSector produces 2% of total C+I waste stream
Masonry materials 90 Metals 150 Organics 800 Paper & cardboard 2 710 Plastics 410 Glass 30 Other 420
- Subdivision accounts for very small proportion of C&I waste stream - High waste generation and good recycling rate - Organic waste stream dominated by timber (not recycled) - High proportion of plastics to landfill, not clear what this material is - Significant proportion of packaging waste
ABS (2010a). ABS (2011a). ABS (2011b). ABS (2011c). ABS (2012b). ABS (2012c). CIWMB (2008). DEC (NSW) (2007). DEC (WA) (2011)DECCW (2010a). DECCW (2010b). DEFRA (2010). DERM(2012). DSEWPaC (2011a). DSEWPaC (2012b). EPA NSW (2012)EPA Victoria (2012a). Industry sources. Zero Waste SA (2011a).
Observations:
References:
400 10 30 -
330 90
610 200 270 2 440
40 120
Waste to landfill (kg/EFTE.yr)
Diversion for recycling (kg/EFTE.yr)
Total waste generation (kg/EFTE.yr)
90 10
Number of businesses by jurisdiction Number of businesses by size(effective full time equivalent [EFTE])
Waste generation by material category and destination (kg/EFTE.yr)
Masonry materials Metals Organics Paper & cardboard Plastics Glass Other
Page 50 Encycle Consulting Pty Ltd
MANUFACTURING Petroleum and Coal Product Manufacturing
1-19 EFTE 150 NSW 45 SA - 20-200 EFTE 33 VIC 63 TAS 3 200+ EFTE 12 WA 45 ACT - Non-employing 180 QLD 39 NT -
Waste generation averages 4600kg/EFTE.yrSector generates 43 100 t waste per yearSector produces 1% of total C+I waste stream
Masonry materials 1 000 Metals 410 Organics 800 Paper & cardboard 820 Plastics 520 Glass 80 Other 1 010
- Subdivision accounts for very small proportion of C&I waste stream - High waste generation and good recycling rate - Organic waste stream dominated by timber (not recycled) - High proportion of plastics to landfill, not clear what this material is - Significant proportion of packaging waste
ABS (2010a). ABS (2011a). ABS (2011b). ABS (2011c). ABS (2012b). ABS (2012c). CIWMB (2008). DEC (NSW) (2007). DEC (WA) (2011)DECCW (2010a). DECCW (2010b). DEFRA (2010). DERM(2012). DSEWPaC (2011a). DSEWPaC (2012b). EPA NSW (2012)EPA Victoria (2012a). Industry sources. Zero Waste SA (2011a).
Observations:
References:
400 130 30 50
330 670
610 190 270 550
40 370
Waste to landfill (kg/EFTE.yr)
Diversion for recycling (kg/EFTE.yr)
Total waste generation (kg/EFTE.yr)
90 910
Number of businesses by jurisdiction Number of businesses by size(effective full time equivalent [EFTE])
Waste generation by material category and destination (kg/EFTE.yr)
Masonry materials Metals Organics Paper & cardboard Plastics Glass Other
Page 51 Encycle Consulting Pty Ltd
MANUFACTURING Basic Chemical and Chemical Product Manufacturing
1-19 EFTE 1 017 NSW 438 SA 87 20-200 EFTE 300 VIC 399 TAS 12 200+ EFTE 54 WA 165 ACT 9 Non-employing 1 038 QLD 258 NT 3
Waste generation averages 4600kg/EFTE.yrSector generates 199 400 t waste per yearSector produces 2% of total C+I waste stream
Masonry materials 1 000 Metals 410 Organics 800 Paper & cardboard 820 Plastics 520 Glass 80 Other 1 010
- Subdivision accounts for very small proportion of C&I waste stream - High waste generation and good recycling rate - Organic waste stream dominated by timber (not recycled) - High proportion of plastics to landfill, not clear what this material is - Significant proportion of packaging waste
ABS (2010a). ABS (2011a). ABS (2011b). ABS (2011c). ABS (2012b). ABS (2012c). CIWMB (2008). DEC (NSW) (2007). DEC (WA) (2011)DECCW (2010a). DECCW (2010b). DEFRA (2010). DERM(2012). DSEWPaC (2011a). DSEWPaC (2012b). EPA NSW (2012)EPA Victoria (2012a). Industry sources. Zero Waste SA (2011a).
Observations:
References:
400 130 30 50
330 670
610 190 270 550
40 370
Waste to landfill (kg/EFTE.yr)
Diversion for recycling (kg/EFTE.yr)
Total waste generation (kg/EFTE.yr)
90 910
Number of businesses by jurisdiction Number of businesses by size(effective full time equivalent [EFTE])
Waste generation by material category and destination (kg/EFTE.yr)
Masonry materials Metals Organics Paper & cardboard Plastics Glass Other
Page 52 Encycle Consulting Pty Ltd
MANUFACTURING Polymer Product and Rubber Product Manufacturing
1-19 EFTE 1 651 NSW 678 SA 186 20-200 EFTE 643 VIC 797 TAS 27 200+ EFTE 48 WA 246 ACT 6 Non-employing 1 050 QLD 396 NT 6
Waste generation averages 4600kg/EFTE.yrSector generates 149 900 t waste per yearSector produces 2% of total C+I waste stream
Masonry materials 1 000 Metals 410 Organics 800 Paper & cardboard 820 Plastics 520 Glass 80 Other 1 010
- Subdivision accounts for very small proportion of C&I waste stream - High waste generation and good recycling rate - Organic waste stream dominated by timber (not recycled) - Significant proportion of packaging waste
ABS (2010a). ABS (2011a). ABS (2011b). ABS (2011c). ABS (2012b). ABS (2012c). CIWMB (2008). DEC (NSW) (2007). DEC (WA) (2011)DECCW (2010a). DECCW (2010b). DEFRA (2010). DERM(2012). DSEWPaC (2011a). DSEWPaC (2012b). EPA NSW (2012)EPA Victoria (2012a). Industry sources. Zero Waste SA (2011a).
Observations:
References:
400 130 30 50
330 670
610 190 270 550
40 370
Waste to landfill (kg/EFTE.yr)
Diversion for recycling (kg/EFTE.yr)
Total waste generation (kg/EFTE.yr)
90 910
Number of businesses by jurisdiction Number of businesses by size(effective full time equivalent [EFTE])
Waste generation by material category and destination (kg/EFTE.yr)
Masonry materials Metals Organics Paper & cardboard Plastics Glass Other
Page 53 Encycle Consulting Pty Ltd
MANUFACTURING Non-Metallic Mineral Product Manufacturing
1-19 EFTE 1 758 NSW 660 SA 153 20-200 EFTE 378 VIC 648 TAS 48 200+ EFTE 39 WA 222 ACT 21 Non-employing 1 632 QLD 414 NT 9
Waste generation averages 4600kg/EFTE.yrSector generates 158 000 t waste per yearSector produces 2% of total C+I waste stream
Masonry materials 1 000 Metals 410 Organics 800 Paper & cardboard 820 Plastics 520 Glass 80 Other 1 010
- Subdivision accounts for relatively small proportion of C&I waste stream - Organic waste stream dominated by timber (not recycled) - High proportion of plastics to landfill, not clear what this material is - Significant proportion of packaging waste - Recycling stream dominated by Masonry materials
ABS (2010a). ABS (2011a). ABS (2011b). ABS (2011c). ABS (2012b). ABS (2012c). CIWMB (2008). CSR (2011). DEC (NSW) (2007)DEC (WA) (2011). DECCW (2010a). DECCW (2010b). DEFRA (2010). DERM(2012). DSEWPaC (2011a). DSEWPaC (2012b)EPA NSW (2012). EPA Victoria (2012a). Industry sources. Zero Waste SA (2011a).
Observations:
References:
400 130 30 50
330 670
610 190 270 550
40 370
Waste to landfill (kg/EFTE.yr)
Diversion for recycling (kg/EFTE.yr)
Total waste generation (kg/EFTE.yr)
90 910
Number of businesses by jurisdiction Number of businesses by size(effective full time equivalent [EFTE])
Waste generation by material category and destination (kg/EFTE.yr)
Masonry materials Metals Organics Paper & cardboard Plastics Glass Other
Page 54 Encycle Consulting Pty Ltd
MANUFACTURING Primary Metal and Metal Product Manufacturing
1-19 EFTE 1 197 NSW 534 SA 93 20-200 EFTE 369 VIC 447 TAS 36 200+ EFTE 30 WA 198 ACT 3 Non-employing 1 020 QLD 270 NT 12
Waste generation averages 4600kg/EFTE.yrSector generates 439 700 t waste per yearSector produces 4% of total C+I waste stream
Masonry materials 730 Metals 2 020 Organics 730 Paper & cardboard 340 Plastics 400 Glass 30 Other 370
- Subdivision accounts for relatively small proportion of C&I waste stream - High concentration of metals from this sub-division, particularly in recycling
ABS (2010a). ABS (2011a). ABS (2011b). ABS (2011c). ABS (2012b). ABS (2012c). ALCOA (2010). Arrium (2011). CIWMB (2008)DEC (NSW) (2007). DEC (WA) (2011). DECCW (2010a). DECCW (2010b). DEFRA (2010). DERM(2012). DSEWPaC (2011a)DSEWPaC (2012b). EPA NSW (2012). EPA Victoria (2012a). Industry sources. Zero Waste SA (2011a).
Observations:
References:
400 10 30 -
330 40
610 120 270 70
40 1 990
Waste to landfill (kg/EFTE.yr)
Diversion for recycling (kg/EFTE.yr)
Total waste generation (kg/EFTE.yr)
90 640
Number of businesses by jurisdiction Number of businesses by size(effective full time equivalent [EFTE])
Waste generation by material category and destination (kg/EFTE.yr)
Masonry materials Metals Organics Paper & cardboard Plastics Glass Other
Page 55 Encycle Consulting Pty Ltd
MANUFACTURING Fabricated Metal Product Manufacturing
1-19 EFTE 7 328 NSW 2 978 SA 582 20-200 EFTE 1 467 VIC 2 232 TAS 150 200+ EFTE 93 WA 1 008 ACT 45 Non-employing 6 923 QLD 1 809 NT 84
Waste generation averages 4600kg/EFTE.yrSector generates 236 200 t waste per yearSector produces 2% of total C+I waste stream
Masonry materials 730 Metals 2 020 Organics 730 Paper & cardboard 340 Plastics 400 Glass 30 Other 370
- Subdivision accounts for relatively small proportion of C&I waste stream - High concentration of metals from this sub-division both in recycling and waste disposal
ABS (2010a). ABS (2011a). ABS (2011b). ABS (2011c). ABS (2012b). ABS (2012c). CIWMB (2008). DEC (NSW) (2007). DEC (WA) (2011)DECCW (2010a). DECCW (2010b). DEFRA (2010). DERM(2012). DSEWPaC (2011a). DSEWPaC (2012b). EPA NSW (2012)EPA Victoria (2012a). Industry sources.
Observations:
References:
400 10 30 -
330 40
610 120 270 70
40 1 990
Waste to landfill (kg/EFTE.yr)
Diversion for recycling (kg/EFTE.yr)
Total waste generation (kg/EFTE.yr)
90 640
Number of businesses by jurisdiction Number of businesses by size(effective full time equivalent [EFTE])
Waste generation by material category and destination (kg/EFTE.yr)
Masonry materials Metals Organics Paper & cardboard Plastics Glass Other
Page 56 Encycle Consulting Pty Ltd
MANUFACTURING Transport Equipment Manufacturing
1-19 EFTE 3 092 NSW 942 SA 276 20-200 EFTE 577 VIC 933 TAS 81 200+ EFTE 63 WA 444 ACT 6 Non-employing 3 410 QLD 1 011 NT 36
Waste generation averages 4600kg/EFTE.yrSector generates 410 700 t waste per yearSector produces 4% of total C+I waste stream
Masonry materials 100 Metals 1 800 Organics 980 Paper & cardboard 680 Plastics 470 Glass 40 Other 560
- Includes motor vehicle manufacturing sub-division, highly concentrated with three major manufacturers - Metals dominate both waste and recycling streams in this subdivision. - Good recovery of metals for this subdivision
ABS (2010a). ABS (2011a). ABS (2011b). ABS (2011c). ABS (2012b). ABS (2012c). CIWMB (2008). DEC (NSW) (2007). DEC (WA) (2011)DECCW (2010a). DECCW (2010b). DEFRA (2010). DERM(2012). DSEWPaC (2011a). DSEWPaC (2012b). EPA NSW (2012)EPA Victoria (2012a). Holden Ltd (2010). Industry sources. Zero Waste SA (2011a).
Observations:
References:
400 80 30 10
330 220
610 370 270 410
40 1 770
Waste to landfill (kg/EFTE.yr)
Diversion for recycling (kg/EFTE.yr)
Total waste generation (kg/EFTE.yr)
90 10
Number of businesses by jurisdiction Number of businesses by size(effective full time equivalent [EFTE])
Waste generation by material category and destination (kg/EFTE.yr)
Masonry materials Metals Organics Paper & cardboard Plastics Glass Other
Page 57 Encycle Consulting Pty Ltd
MANUFACTURING Machinery and Equipment Manufacturing
1-19 EFTE 5 552 NSW 2 254 SA 504 20-200 EFTE 1 249 VIC 2 024 TAS 138 200+ EFTE 75 WA 735 ACT 45 Non-employing 4 534 QLD 1 161 NT 15
Waste generation averages 4600kg/EFTE.yrSector generates 454 900 t waste per yearSector produces 4% of total C+I waste stream
Masonry materials 100 Metals 1 800 Organics 980 Paper & cardboard 680 Plastics 470 Glass 40 Other 560
- Includes appliance manufacturing - Metals dominate both waste and recycling streams in this subdivision, however recovery is less than 50% - Good recovery of metals for this subdivision
ABS (2010a). ABS (2011a). ABS (2011b). ABS (2011c). ABS (2012b). ABS (2012c). CIWMB (2008). DEC (NSW) (2007). DEC (WA) (2011)DECCW (2010a). DECCW (2010b). DEFRA (2010). DERM(2012). DSEWPaC (2011a). DSEWPaC (2012b). EPA NSW (2012)EPA Victoria (2012a). Industry sources. Zero Waste SA (2011a).
Observations:
References:
400 80 30 10
330 220
610 370 270 410
40 1 770
Waste to landfill (kg/EFTE.yr)
Diversion for recycling (kg/EFTE.yr)
Total waste generation (kg/EFTE.yr)
90 10
Number of businesses by jurisdiction Number of businesses by size(effective full time equivalent [EFTE])
Waste generation by material category and destination (kg/EFTE.yr)
Masonry materials Metals Organics Paper & cardboard Plastics Glass Other
Page 59 Encycle Consulting Pty Ltd
4.4.1 MANUFACTURING: opportunities for waste avoidance or recycling
Across all MANUFACTURING sub-divisions, the key recyclable/re-usable materials that are being sent to landfill include:
timber (mostly packaging) plastics (process off-cuts and packaging) food organics (staff canteens etc. and processing waste from food product
manufacturing ) paper and cardboard (packaging and office waste).
It is likely that much of the waste listed above could be avoided from being generated in the first place through:
supplier take-back (particularly packaging, but also unused products) better processing (and pre-consumer reprocessing) efficiency greater material efficiency in office systems (e.g. printing, filing etc.) more refined ordering of stock/ feedstock to suit requirements.
Waste avoidance opportunities in the MANUFACTURING division are likely to be very sub-division-specific. Identifying ways to reduce waste may require a fairly detailed inspection of a) the waste stream (e.g. comparing to industry benchmarks or noting temporal variation; and b) the balance of materials ‘purchased’ (including indirect purchase of packaging) versus outputs. For many companies, initial visual inspections of bins can identify some of the main contributors to ‘unnecessary’ waste. While materials such as organics, plastics, paper and cardboard are all being recycled from the MANUFACTURING division, there are opportunities to recycle more of these standard recyclables.
Page 60 Encycle Consulting Pty Ltd
4.5 WHOLESALE TRADE
WHOLESALE TRADE accounts for just 6% of the C&I waste stream and less than 5% of the total employment (per EFTE) of the C&I sector being studied here. While the WHOLESALE TRADE division is not highly significant in terms of total size or waste generation, site results show that significant quantities of readily recyclable material are being sent to landfill from this industry division. Findings indicate that the WHOLESALE TRADE industry is currently recycling about 48% of total waste generated. Packaging materials (particularly cardboard) contribute over 25% of this division’s waste stream and thus there is still potential to increase the rate of diversion from landfill within this industry.Some wholesalers are introducing schemes where they collect material from retailers after deliveries have been made in order to aggregate recycling collection. This is often at the request of retail customers and may not be provided to all of the wholesaler's customers. Not all wholesalers collate recyclables from their customers. Where it does occur it is a valuable product stewardship initiative. The major dairies are using the return of crates to also offer the return of HDPE milk bottles for recycling. This aggregation of recyclables may be a good case study for other supplier return services. One of the challenges for increasing recycling in the C&I sector is establish this type of supply chain partnering more widely. The aggregation of material such as packaging (cardboard or plastic film) back to a smaller number of sites dramatically improves the collection efficiency for recycling. When applied to sites in regional areas, supply chain collation of materials offers the ability for the material to reach recycling facilities in cities where opportunities are greater and freighting costs have been largely eliminated.There is the potential for increased ‘food rescue’ from wholesalers. Food rescue is the recovery of edible food products that would otherwise have been wasted and the redistribution of these foods to low-income families. A specific effort to link food rescue operators with wholesalers could be important. Recovered edible food could include surplus returned from retail in a timely fashion or material that may be wasted due to breakdowns in supply chain efficiency and correct ordering procedures. Currently, collection of unused food from the many thousands of retail sites is not very practical but there is strong potential for waste avoidance through collation of unused food to wholesalers.
Page 61 Encycle Consulting Pty Ltd
Summary sheets: WHOLESALE TRADE division
WHOLESALE TRADE
1-19 EFTE 35 992 NSW 15 487 SA 2 640 20-200 EFTE 5 530 VIC 11 944 TAS 558 200+ EFTE 408 WA 3 706 ACT 259 Non-employing 34 368 QLD 7 126 NT 189
Waste generation averages 2100kg/EFTE.yrSector generates 738 100 t waste per yearSector produces 6% of total C+I waste stream
Masonry materials - Metals 70 Organics 450 Paper & cardboard 1 100 Plastics 110 Glass 10 Other 400
- Likely to be dominated by grocery wholesaling subdivision, however this was not analysed in this study - Freight packaging, timber, plastic and cardboard dominate waste stream - Some wholesalers are collecting material for aggregated recycling - High proportion of food organics in the waste stream from damaged or wasted product
ABS (2010a). ABS (2011a). ABS (2011b). ABS (2011c). ABS (2012b). ABS (2012c). CIWMB (2008). DEC (NSW) (2007). DEC (WA) (2011)DECCW (2010a). DECCW (2010b). DEFRA (2010). DERM(2012). DSEWPaC (2011a). DSEWPaC (2012b). EPA NSW (2012)EPA Victoria (2012a). Industry sources. Zero Waste SA (2011a).
Observations:
References:
90 20 10 -
340 60
380 70 240 870
50 10
Waste to landfill (kg/EFTE.yr)
Diversion for recycling (kg/EFTE.yr)
Total waste generation (kg/EFTE.yr)
- -
Number of businesses by jurisdiction Number of businesses by size(effective full time equivalent [EFTE])
Australia 41 930
Waste to landfill
Diversion for recycling
Waste generation
- 500 1,000 1,500 2,000 2,500
Waste generation by material category and destination (kg/EFTE.yr)
Masonry materials Metals Organics Paper & cardboard Plastics Glass Other
Page 62 Encycle Consulting Pty Ltd
4.5.1 Opportunities for waste avoidance or recycling
Within the WHOLESALE TRADE division, the key recyclable/re-usable materials that are being sent to landfill include:
plastic, timber, cardboard/paper (mostly packaging) food organics (both from staff canteens etc. and from food product warehousing ) paper and cardboard (office waste) steel (possibly discarded products and broken equipment/vehicle parts) tyres—particularly from SMEs (possibly from vehicles transporting and managing
warehoused goods).Of the material currently going to landfill, a significant proportion is avoidable waste, particularly:
packaging waste (can be returned to supplier or reused) office paper (changing processes that affect printing habits and requirements).
Page 63 Encycle Consulting Pty Ltd
4.6 RETAIL TRADE
As an industry division, RETAIL TRADE accounts for the second greatest volume of waste produced following MANUFACTURING (over 2.8 million tonnes per year or 23% of the industries studied). Within this division, the Food Retailing and Other Store-Based Retailing sub-divisions account for the majority of this waste generation (7% of total and 13% of total respectively).The RETAIL TRADE division is a very high employer across Australia and the waste generation rate per EFTE is relatively high at about 3.1 tonnes per EFTE per year. The Food Retailing sub-division is characterised by a mixture of supermarkets and specialty food stores which will require further specific investigation to fully understand and identify the key areas of poor performance and high opportunity for improved material efficiency.Across all sub-divisions within RETAIL TRADE, a significant proportion of the waste appears to be either freight packaging or organic material.Within RETAIL TRADE, the sub-divisions have moderate recycling rates (approximately 47%). The low recycling rate within the Food Retailing sub-division is likely to relate to the high proportion of organic material produced. Food organics are not always simple to source separate for recycling (mostly as composting). Food retailing has a high proportion of small to medium businesses which increases the challenge to achieve good recycling rates.There are some substantial gains being made in waste avoidance in the supermarket sector through the heavy discounting of perishables as they approach the ‘use by date’ expiry. This has resulted in lower volumes of food waste to either ‘food rescue’ or landfill disposal. Generally this is a welcome development which also has a strong social benefit in assisting some low income households to access discounted food through their shopping discretion. There is however the potential for this food nearing expiry to become spoilt and waste within the home much sooner. Some work done with low income households would suggest this adverse outcome that will need to be managed (Fareshare, 2012).Misunderstandings about ‘best before’ and ‘use-by’ labelling can account for some food waste in the home. In UK, there are various campaigns to educate consumers about ‘best before’ labelling as it can mislead to consumers that food should not be eaten after a certain date when in fact it would still be safe to eat (‘best before’ is about quality, ‘use by’ is about safety). The issue of sale or return of unsold product is significant in the RETAIL TRADE division. Where not managed well this can lead to poor ordering and inventory control and generation of waste at supplier level. There are extreme instances where goods are ordered to fill shelving without any prospect of sale.While the Food Retail sub-division is given priority status in this report, it should also be noted that the Other Store-based Retail sub-division is also large and diverse. Other Store-based Retail encompasses such retail outlets as hardware, pharmacy, clothing, footwear, sporting goods, outdoor equipment, electrical, furniture and nurseries. These businesses are large employers and the waste stream includes both a lot of tertiary packaging and wastes specific to each store type. The Other Store-based Retail sub-division is worthy of greater attention for waste minimisation.
Page 64 Encycle Consulting Pty Ltd
Page 65 Encycle Consulting Pty Ltd
Summary sheet: RETAIL TRADE division
RETAIL TRADE
1-19 EFTE 70 771 NSW 26 866 SA 5 841 20-200 EFTE 10 428 VIC 20 743 TAS 1 917 200+ EFTE 501 WA 8 192 ACT 1 025 Non-employing 57 910 QLD 16 335 NT 775
Waste generation averages 3100kg/EFTE.yrSector generates 2 835 800 t waste per yearSector produces 23% of total C+I waste stream
Masonry materials 10 Metals 80 Organics 730 Paper & cardboard 1 490 Plastics 130 Glass 10 Other 690
- High component of waste is freight packaging and organics in this division - Fairly high waste generation per employee - Good recovery of paper and cardboard, largely from packaging
ABS (2010a). ABS (2011a). ABS (2011b). ABS (2011c). ABS (2012b). ABS (2012c). CIWMB (2008). DEC (NSW) (2007). DEC (WA) (2011)DECCW (2010a). DECCW (2010b). DEFRA (2010). DERM(2012). DSEWPaC (2011a). DSEWPaC (2011b). DSEWPaC (2012b)EPA NSW (2012). EPA Victoria (2012a). Industry sources. Zero Waste SA (2011a).
Number of businesses by jurisdiction Number of businesses by size(effective full time equivalent [EFTE])
Australia 81,700
60 20
Waste to landfill (kg/EFTE.yr)
Diversion for recycling (kg/EFTE.yr)
Total waste generation (kg/EFTE.yr)
- -
630 100 250 1 240
600 80
110 20 10 -
Observations:
References:
Waste to landfill
Diversion for recycling
Waste generation
- 500 1,000 1,500 2,000 2,500 3,000 3,500
Waste generation by material category and destination (kg/EFTE.yr)
Masonry materials Metals Organics Paper & cardboard Plastics Glass Other
Page 66 Encycle Consulting Pty Ltd
4.6.1 Opportunities for waste avoidance or recycling
Within the RETAIL TRADE division, the key recyclable/re-usable materials that are being sent to landfill include:
food organics (significantly higher than other wastes) cardboard, timber, plastic packaging paper (office waste) textiles (particularly store-based retailing – likely to be unsold product).
It is likely that much of the waste listed above could be avoided from being generated in the first place through:
more refined ordering of stock to suit requirements finding alternative mechanisms for disposing of unused stock (e.g. charities) supplier take-back (particularly packaging, but also unsold stock).
1-19 EFTE 14 146 NSW 5 623 SA 1 220 20-200 EFTE 2 706 VIC 4 579 TAS 387 200+ EFTE 90 WA 1 703 ACT 210 Non-employing 9 267 QLD 3 046 NT 174
Waste generation averages 3100kg/EFTE.yrSector generates 860 500 t waste per yearSector produces 7% of total C+I waste stream
Masonry materials - Metals 30 Organics 870 Paper & cardboard 1 240 Plastics 80 Glass 10 Other 910
- Food Retailing subdivision contributes a very large proportion of all C&I waste - Subdivision dominated by food organic waste - Subdivision contains supermarkets, grocery stores and specialty food retailing
ABS (2010a). ABS (2011a). ABS (2011b). ABS (2011c). ABS (2012b). ABS (2012c). CIWMB (2008). DEC (NSW) (2007). DEC (WA) (2011)DECCW (2010a). DECCW (2010b). DEFRA (2010). DERM(2012). DSEWPaC (2011a). DSEWPaC (2011b). DSEWPaC (2012b)EPA NSW (2012). EPA Victoria (2012a). Industry sources. Zero Waste SA (2011a).
Observations:
References:
770 100 - 1 240
10 20
50 20 - -
830 80
Waste to landfill (kg/EFTE.yr)
Diversion for recycling (kg/EFTE.yr)
Total waste generation (kg/EFTE.yr)
- -
Number of businesses by jurisdiction Number of businesses by size(effective full time equivalent [EFTE])
Australia 16 942
Waste to landfill
Diversion for recycling
Waste generation
- 500 1,000 1,500 2,000 2,500 3,000 3,500
Waste generation by material category and destination (kg/EFTE.yr)
Masonry materials Metals Organics Paper & cardboard Plastics Glass Other
Page 68 Encycle Consulting Pty Ltd
4.7 Food retailing (priority sub-division)
The Food Retailing sub-division alone produces approximately 460 000 tonnes of waste to landfill per year and also sends over 400 000 additional tonnes of material for recycling each year. This sub-division is made up of supermarkets, grocery stores and specialist food retailers such as bakeries, delicatessens, liquor stores, butchers etc. The distribution of food retail as an employer is characterised by either large supermarkets/franchises or small businesses (Table 12).Table 12: Number of employees in each business size bracket for the Food Retail sub-division
The Food Retail waste stream is dominated by food waste, of which very little is currently recycled or recovered (see Table 13). Current recovery of food from the C&I waste stream is mostly from: food manufacture, large commercial kitchens or from locations where waste enters an Alternative Waste Treatment plant (this is not very common for C&I waste, as AWT is mostly applied as a municipal waste solution). The ‘unknown’ waste type for Food Retail is a very large component (almost 50%) of the landfill waste stream which is likely to be a mixture of all material types, particularly contaminated paper and cardboard, flexible plastics, further food organics and broken crockery and cutlery.
Table 13 : Quantities of waste and recycling per annum from the Food Retail sub-division
AvoidanceThe large supermarkets make considerable efforts to reduce their store stock losses through handling practices and systems for stock control. Supermarkets also regularly apply a discount to encourage sales prior to the product reaching end of life. One food rescue agency said the volume of food they were receiving from the store had dropped to 40% of the levels of less than a year ago.Small food retailers appeared to have a wide range of food waste, depending upon the degree to which their produce was perishable (e.g. bakers produce more food waste than delicatessens owing to the short shelf-life of their produce).Recycling and recoveryThere are several options for unused food waste:
1. “food rescue” organisations that redistribute edible food to low-income families2. off-site composting (or other organics recovery mechanism)3. on-site composting (or vermiculture/other solution). 4. on-site technologies such as dehydration-sterilisation (e.g. GaiaRecycle, EcoVim).
The key to recovery of food waste is separating it from the rest of the waste stream. For many retailers, certain food products (particularly unpackaged, fresh produce) can be separated relatively easily. Barriers to separation of food waste include:
staff training required off-site services may not be readily available locally (particularly for small
businesses) many organics recovery systems do not tolerate any contamination and failure
will discourage businesses from continuing with the system.
Page 70 Encycle Consulting Pty Ltd
Summary sheets: RETAIL TRADE: other retail sub-divisions
RETAIL TRADE Motor Vehicle and Motor Vehicle Parts Retailing
1-19 EFTE 5 568 NSW 2 044 SA 573 20-200 EFTE 1 100 VIC 1 547 TAS 150 200+ EFTE 67 WA 747 ACT 99 Non-employing 4 035 QLD 1 476 NT 99
Waste generation averages 3100kg/EFTE.yrSector generates 287 400 t waste per yearSector produces 3% of total C+I waste stream
Masonry materials 10 Metals 100 Organics 670 Paper & cardboard 1 590 Plastics 160 Glass 10 Other 590
- Subdivision contributes small proportion of C&I waste stream - There is a lack of reliable waste composition data for this sub-division. - Average compositions for the division applied here; only broad interpretations are possible - Moderate waste generation levels
ABS (2010a). ABS (2011a). ABS (2011b). ABS (2011c). ABS (2012b). ABS (2012c). CIWMB (2008). DEC (NSW) (2007). DEC (WA) (2011)DECCW (2010a). DECCW (2010b). DEFRA (2010). DERM(2012). DSEWPaC (2011a). DSEWPaC (2012b). EPA NSW (2012)EPA Victoria (2012a). Industry sources. Zero Waste SA (2011a).
Observations:
References:
140 20 10 -
510 80
570 100 360 1 240
80 20
Waste to landfill (kg/EFTE.yr)
Diversion for recycling (kg/EFTE.yr)
Total waste generation (kg/EFTE.yr)
- -
Number of businesses by jurisdiction Number of businesses by size(effective full time equivalent [EFTE])
Australia 6 735
Waste to landfill
Diversion for recycling
Waste generation
- 500 1,000 1,500 2,000 2,500 3,000 3,500
Waste generation by material category and destination (kg/EFTE.yr)
Masonry materials Metals Organics Paper & cardboard Plastics Glass Other
Page 71 Encycle Consulting Pty Ltd
RETAIL TRADE Fuel Retailing
1-19 EFTE 2 426 NSW 1 035 SA 201 20-200 EFTE 441 VIC 596 TAS 129 200+ EFTE 9 WA 252 ACT 15 Non-employing 1 008 QLD 609 NT 39
Waste generation averages 3100kg/EFTE.yrSector generates 86 600 t waste per yearSector produces 1% of total C+I waste stream
Masonry materials 10 Metals 100 Organics 670 Paper & cardboard 1 590 Plastics 160 Glass 10 Other 590
- Subdivision contributes small proportion of C&I waste stream - There is a lack of reliable waste composition data for this sub-division. - Average compositions for the division applied here; only broad interpretations are possible - Moderate waste generation levels
ABS (2010a). ABS (2011a). ABS (2011b). ABS (2011c). ABS (2012b). ABS (2012c). CIWMB (2008). DEC (NSW) (2007). DEC (WA) (2011)DECCW (2010a). DECCW (2010b). DEFRA (2010). DERM(2012). DSEWPaC (2011a). DSEWPaC (2012b). EPA NSW (2012)EPA Victoria (2012a). Industry sources. Zero Waste SA (2011a).
Observations:
References:
140 20 10 -
510 80
570 100 360 1 240
80 20
Waste to landfill (kg/EFTE.yr)
Diversion for recycling (kg/EFTE.yr)
Total waste generation (kg/EFTE.yr)
- -
Number of businesses by jurisdiction Number of businesses by size(effective full time equivalent [EFTE])
Australia 2 876
Waste to landfill
Diversion for recycling
Waste generation
- 500 1,000 1,500 2,000 2,500 3,000 3,500
Waste generation by material category and destination (kg/EFTE.yr)
Masonry materials Metals Organics Paper & cardboard Plastics Glass Other
Page 72 Encycle Consulting Pty Ltd
RETAIL TRADE Other Store-Based Retailing
1-19 EFTE 46 620 NSW 17 355 SA 3 739 20-200 EFTE 6 079 VIC 13 581 TAS 1 215 200+ EFTE 329 WA 5 319 ACT 677 Non-employing 35 817 QLD 10 682 NT 454
Waste generation averages 3100kg/EFTE.yrSector generates 1 568 900 t waste per yearSector produces 13% of total C+I waste stream
Masonry materials 10 Metals 100 Organics 670 Paper & cardboard 1 590 Plastics 160 Glass 10 Other 590
- Very large subdivision in employment and business numbers, contributing a significant portion of C&I waste - Includes diverse range of retail outlets covering electrical, hardware, clothing, furniture and pharmaceutical - Organics and packaging make up majority of waste stream
ABS (2010a). ABS (2011a). ABS (2011b). ABS (2011c). ABS (2012b). ABS (2012c). CIWMB (2008). DEC (NSW) (2007). DEC (WA) (2011)DECCW (2010a). DECCW (2010b). DEFRA (2010). DERM(2012). DSEWPaC (2011a). DSEWPaC (2012b). EPA NSW (2012)EPA Victoria (2012a). Industry sources. Zero Waste SA (2011a).
Observations:
References:
140 20 10 -
510 80
570 100 360 1 240
80 20
Waste to landfill (kg/EFTE.yr)
Diversion for recycling (kg/EFTE.yr)
Total waste generation (kg/EFTE.yr)
- -
Number of businesses by jurisdiction Number of businesses by size(effective full time equivalent [EFTE])
Australia 53 028
Waste to landfill
Diversion for recycling
Waste generation
- 500 1,000 1,500 2,000 2,500 3,000 3,500
Waste generation by material category and destination (kg/EFTE.yr)
Masonry materials Metals Organics Paper & cardboard Plastics Glass Other
Page 73 Encycle Consulting Pty Ltd
RETAIL TRADE Non-Store Retailing and Retail Commission-Based Buying and/or Selling
1-19 EFTE 2 011 NSW 809 SA 108 20-200 EFTE 102 VIC 440 TAS 36 200+ EFTE 6 WA 171 ACT 24 Non-employing 7 783 QLD 522 NT 9
Waste generation averages 3100kg/EFTE.yrSector generates 32 300 t waste per yearSector produces 1% of total C+I waste stream
Masonry materials 10 Metals 100 Organics 670 Paper & cardboard 1 590 Plastics 160 Glass 10 Other 590
- Subdivision has very small contribution to overall C&I waste stream - Freight packaging features strongly in this subdivision
ABS (2010a). ABS (2011a). ABS (2011b). ABS (2011c). ABS (2012b). ABS (2012c). CIWMB (2008). DEC (NSW) (2007). DEC (WA) (2011)DECCW (2010a). DECCW (2010b). DEFRA (2010). DERM(2012). DSEWPaC (2011a). DSEWPaC (2012b). EPA NSW (2012)EPA Victoria (2012a). Industry sources. Zero Waste SA (2011a).
Observations:
References:
140 20 10 -
510 80
570 100 360 1 240
80 20
Waste to landfill (kg/EFTE.yr)
Diversion for recycling (kg/EFTE.yr)
Total waste generation (kg/EFTE.yr)
- -
Number of businesses by jurisdiction Number of businesses by size(effective full time equivalent [EFTE])
Australia 2 119
Waste to landfill
Diversion for recycling
Waste generation
- 500 1,000 1,500 2,000 2,500 3,000 3,500
Waste generation by material category and destination (kg/EFTE.yr)
Masonry materials Metals Organics Paper & cardboard Plastics Glass Other
Page 74 Encycle Consulting Pty Ltd
4.8 ACCOMMODATION AND FOOD SERVICES
The ACCOMMODATION AND FOOD SERVICES division accounts for only slightly less total waste generation than the RETAIL TRADE division (nearly 2.6 million tonnes per year or 21 % of all industries under analysis).The Food and Beverage Services sub-division is the largest of all sub-divisions analysed and alone accounts for 18 % of the total waste generated by the industries being analysed for this project (2.2 million tonnes per year).On a per EFTE basis, the ACCOMMODATION AND FOOD SERVICE division has a particularly high rate of waste generation (on average about 4.5 tonnes per EFTE per year).The ACCOMMODATION AND FOOD SERVICES division waste stream is dominated by organic material and has a high proportion of packaging material.Packaging material including timber, plastics, cardboard and paper can be readily recycled. As discussed for the Food Retail sub-division, there are many opportunities for the recovery of food waste but barriers exist that are currently inhibiting effective source segregation and recovery of organic material from this division.The ACCOMMODATION AND FOOD SERVICES division is characterised by a high number of staff responsible for waste and often a high staff turnover which increases the challenges of staff training, effective communication and instilling a positive recycling culture.There is in the region of 150,000 tonne of glass per year generated from the ACCOMMODATION AND FOOD SERVICES division; a high proportion of this is container glass. Glass recycling rates for this division are very high (around 90%) which is likely to be due to the ease of separation at source. Nearly all restaurants and bars have separate glass bins. Glass is an ‘iconic’ recyclable that easily recognised and separated at source. Most commercial operators prefer to keep glass out of the general waste stream where it can cause health and safety issues due to breakage and being heavy to move, particularly where general waste is collected in bags.
Page 75 Encycle Consulting Pty Ltd
Summary sheet: ACCOMMODATION AND FOOD SERVICES division
ACCOMMODATION AND FOOD SERVICES
1-19 EFTE 42 073 NSW 19 243 SA 3 577 20-200 EFTE 12 542 VIC 13 779 TAS 1 452 200+ EFTE 637 WA 5 116 ACT 832 Non-employing 21 852 QLD 10 741 NT 512
Waste generation averages 4500kg/EFTE.yrSector generates 2 555 400 t waste per yearSector produces 21% of total C+I waste stream
Masonry materials 60 Metals 100 Organics 1 790 Paper & cardboard 1 090 Plastics 190 Glass 260 Other 1 040
- Second largest division (following retail) contributing to C&I waste - Includes both accomodation and the food services industry - Dominated by the larger food services sub-division
ABS (2010a). ABS (2011a). ABS (2011b). ABS (2011c). ABS (2012b). ABS (2012c). CIWMB (2008). DEC (NSW) (2007). DEC (WA) (2011)DECCW (2010a). DECCW (2010b). DEFRA (2010). DERM(2012). DSEWPaC (2011a). DSEWPaC (2012b). EPA NSW (2012)EPA Victoria (2012a). Industry sources. Zero Waste SA (2011a).
Number of businesses by jurisdiction Number of businesses by size(effective full time equivalent [EFTE])
Waste generation by material category and destination (kg/EFTE.yr)
Masonry materials Metals Organics Paper & cardboard Plastics Glass Other
Page 76 Encycle Consulting Pty Ltd
ACCOMMODATION AND FOOD SERVICES Food and Beverage Services
1-19 EFTE 36 547 NSW 16 919 SA 3 090 20-200 EFTE 10 880 VIC 12 185 TAS 1 162 200+ EFTE 495 WA 4 424 ACT 781 Non-employing 15 940 QLD 8 972 NT 389
Waste generation averages 4500kg/EFTE.yrSector generates 2 163 800 t waste per yearSector produces 18% of total C+I waste stream
Masonry materials 60 Metals 100 Organics 1 790 Paper & cardboard 1 090 Plastics 190 Glass 260 Other 1 040
- Large and diverse subdivision - Accounts for more C&I waste than any other sub-division - Includes, cafes, restaurants, bars, hotels, clubs - Food organics dominate and both freight and primary packaging make up large proportion of total waste
ABS (2010a). ABS (2011a). ABS (2011b). ABS (2011c). ABS (2012b). ABS (2012c). CIWMB (2008). DEC (NSW) (2007). DEC (WA) (2011)DECCW (2010a). DECCW (2010b). DEFRA (2010). DERM(2012). DSEWPaC (2011a). DSEWPaC (2011b). DSEWPaC (2012b)EPA NSW (2012). EPA Victoria (2012a). Industry sources. Zero Waste SA (2011a).
Observations:
References:
170 20 10 240
580 450
1 650 140 540 550
60 40
Waste to landfill (kg/EFTE.yr)
Diversion for recycling (kg/EFTE.yr)
Total waste generation (kg/EFTE.yr)
60 -
Number of businesses by jurisdiction Number of businesses by size(effective full time equivalent [EFTE])
Waste generation by material category and destination (kg/EFTE.yr)
Masonry materials Metals Organics Paper & cardboard Plastics Glass Other
4.9 Food and Beverage Services (priority sub-division)
The Food and Beverage Services sub-division is heavily skewed towards small and medium sized businesses. Employing around 480 000 EFTE, this sector is among the major sub-divisions in employment terms.
Page 77 Encycle Consulting Pty Ltd
Table 14: Waste and recycling from the food and beverage service sub-division
Waste to landfill (kg/EFTE.yr)
Waste to landfill (t/yr)
Recycling (kg/EFTE.yr)
Recycling (t/yr)
Total (waste generation) (kg/EFTE.yr)
Total (waste generation) (t/yr)
3 100 1 472 300 1 400 691 500 4 500 2 163 800
There is significant diversity in this sector between cafes, restaurants, take-away outlets and caterers. The waste generation from each of these industry types differs markedly. Site visits and the data provided from businesses in this sub-division demonstrated that catering and restaurants appear to have higher waste generation rates than cafes or take-away outlets. Cafes generally undertake less cooking and food preparation on site than other outlets and can manage inventories better as a result. During the site visits, cafes often claimed that they can ensure almost no loss of product to waste. Restaurants have both high food preparation waste and post-consumer waste. Most restaurants reported that over half the general waste stream was food organics. There is a high degree of variability in food preparation waste between different restaurant styles. One high-end Japanese restaurant reported extremely low food preparation waste as they used off-cuts to make stocks and soups. Take-away outlets have a high level of cooking and preparation prior to ordering. This can lead to higher waste levels in unsold product. Conversely, where product is taken off site there is lower post-consumer waste. The catering industry by its nature, experiences a level of unpredictability of demand and in-built client expectation of excess.
Waste avoidanceWithin this diverse sub-division, the best opportunities for waste avoidance are likely to be:
supplier take-back or reusable packaging better inventory control and reduction of unsold product waste.
Recycling and recoveryGlass (bottles) and paper (packaging) are already recovered in significant quantities from the Food and Beverage Services sub-division, although more recovery is possible (See summary sheet: Food and Beverage Services).Textiles form part of the waste stream from food and beverage outlets, it is not always clear what this material might be, it is possible that this waste stream includes staff uniforms, table cloths, dish cloths etc. many of which can be recycled, but markets are not always strong and routes to re-processors can be more complex than for the standard dry recyclables.
Opportunities for greater recovery and recycling from the Food and Beverage Services sub-division are likely to come from:
food organics (composting and food rescue of edible products)
Page 78 Encycle Consulting Pty Ltd
tertiary packaging (including cardboard and polystyrene boxes) food and beverage containers.
Recovery of food organics from the Food and Beverages service industries is not necessarily straightforward; it will require specific systems to be put in place, ongoing staff training (including kitchen staff, cleaners and possibly other ‘back-of-house’ staff), clear and consistent communication programs and robust data capture. Removing food organics from the waste stream is more advanced in some Australian jurisdictions than others but is generally not common practice, particularly among small to medium businesses. Establishing a food organics separate collection will require close coordination between the waste collection company and the waste generator. During site visits for this study, it seemed that often the implementation of food waste collection systems was driven by the client (waste generator) rather than being sold as a service by the waste collection company.Food waste collection systems often focus on collecting food preparation waste (pre-consumer) as this is often generated in a way that is easier to collect. In some businesses, post-consumer waste was often contaminated with disposable items (plastic straws, sauce sachets) or contained meat bones or other items not accepted by their service.During site visits and interviews, businesses serving food and beverages were asked about the drivers for implementing food waste collection services. It was interesting that very few businesses implemented food waste collection services in order to save money (although the fact that it often resulted in reduced waste charges assisted with smooth implementation). Common drivers for establishing food waste collection systems included:
health and safety (separating out the waste stream likely to be heavy odorous, and potentially leak)
space saving (food could be stored separately enabling other general waste to be collected less frequently
business positioning as a leader in good environmental practices.
Page 79 Encycle Consulting Pty Ltd
ACCOMMODATION AND FOOD SERVICES Accommodation
1-19 EFTE 5 526 NSW 2 324 SA 487 20-200 EFTE 1 662 VIC 1 594 TAS 290 200+ EFTE 142 WA 692 ACT 51 Non-employing 5 912 QLD 1 769 NT 123
Waste generation averages 4500kg/EFTE.yrSector generates 391 600 t waste per yearSector produces 4% of total C+I waste stream
Masonry materials 60 Metals 100 Organics 1 790 Paper & cardboard 1 090 Plastics 190 Glass 260 Other 1 040
- Organics are a large component of waste stream, largely from links between Accommodation and Food Service
ABS (2010a). ABS (2011a). ABS (2011b). ABS (2011c). ABS (2012b). ABS (2012c). CIWMB (2008). DEC (NSW) (2007). DEC (WA) (2011)DECCW (2010a). DECCW (2010b). DEFRA (2010). DERM(2012). DSEWPaC (2011a). DSEWPaC (2012b). EPA NSW (2012)EPA Victoria (2012a). Industry sources.
Observations:
References:
170 20 10 240
580 450
1 650 140 540 550
60 40
Waste to landfill (kg/EFTE.yr)
Diversion for recycling (kg/EFTE.yr)
Total waste generation (kg/EFTE.yr)
60 -
Number of businesses by jurisdiction Number of businesses by size(effective full time equivalent [EFTE])
Waste generation by material category and destination (kg/EFTE.yr)
Masonry materials Metals Organics Paper & cardboard Plastics Glass Other
Page 80 Encycle Consulting Pty Ltd
4.10TRANSPORT, POSTAL AND WAREHOUSING’
The TRANSPORT, POSTAL AND WAREHOUSING division has a moderate waste generation profile of 0.7 tonnes per EFTE. This division is medium in size compared to other divisions used for this study (accounting for 3% of total C&I waste generation). The division’s waste profile includes a high proportion of readily recyclable freight packaging materials such as cardboard, timber pallets and plastic film. The recycling rate from this division is already fairly high as material streams are generally clean and easy to separate at source. Warehousing can have a somewhat inconsistent waste flow unlike other industries such as MANUFACTURING and RETAIL TRADE (which have a relatively consistent waste flow). Flow of waste from warehousing can be influenced by shipments in and out and decisions to intermittently designate large volumes of product/materials to waste. There can be a large amount of unpacking from suppliers and repacking for distribution to customers/consumers within this sector. Some sites undertake a high degree of reuse of this packaging and most are strong recyclers of freight packaging. One waste than can be a significant contributor to landfill from the TRANSPORT, POSTAL AND WAREHOUSING industry is timber packaging (pallets and packaging of large goods). In the summary sheet data, timber is grouped together in the ‘organics’ category. While there are some good systems for reuse of standard pallets, a lot of product is now shipped and transported nationally and internationally using non-standard pallets or skids. There are few reuse options for these and when they are disbursed to customers the options for recycling are less practical.
Page 81 Encycle Consulting Pty Ltd
Summary sheet: TRANSPORT, POSTAL AND WAREHOUSING division
TRANSPORT POSTAL AND WAREHOUSING
1-19 EFTE 38 302 NSW 14 307 SA 2 286 20-200 EFTE 3 200 VIC 10 982 TAS 834 200+ EFTE 288 WA 3 780 ACT 285 Non-employing 91 475 QLD 9 049 NT 261
Waste generation averages 700kg/EFTE.yrSector generates 369 800 t waste per yearSector produces 3% of total C+I waste stream
Masonry materials - Metals 100 Organics 120 Paper & cardboard 260 Plastics 50 Glass 10 Other 180
- Significant division in both size and waste intensity per EFTE - Freight packaging dominates both waste and recycling streams including (timber, paper, cardboard & plastics)
ABS (2010a). ABS (2011a). ABS (2011b). ABS (2011c). ABS (2012b). ABS (2012c). CIWMB (2008). DEC (NSW) (2007). DEC (WA) (2011)DECCW (2010a). DECCW (2010b). DEFRA (2010). DERM(2012). DSEWPaC (2011a). DSEWPaC (2012b). EPA NSW (2012)EPA Victoria (2012a). Industry sources. Zero Waste SA (2011a).
Observations:
References:
10 40 - 10
50 130
10 110 20 230
- 100
Waste to landfill (kg/EFTE.yr)
Diversion for recycling (kg/EFTE.yr)
Total waste generation (kg/EFTE.yr)
- -
Number of businesses by jurisdiction Number of businesses by size(effective full time equivalent [EFTE])
Australia 41 790
Waste to landfill
Diversion for recycling
Waste generation
- 100 200 300 400 500 600 700 800
Waste generation by material category and destination (kg/EFTE.yr)
Masonry materials Metals Organics Paper & cardboard Plastics Glass Other
Page 82 Encycle Consulting Pty Ltd
4.11FINANCIAL AND INSURANCE SERVICES
FINANCIAL AND INSURANCE SERVICES sector is a relatively small, office-based industry division with lower waste generation than other divisions. The waste profile for this division is dominated by paper and cardboard. Recycling systems for paper are now increasingly entrenched in this division. An inventory of large corporates would identify any significant omissions to office based recycling. Less comprehensive for this sector is a focus on office paper avoidance. Rather than relying on technology change to result in less paper use, a program to equip businesses to raise awareness and achieve behaviour change could be considered.The opportunities for achieving waste avoidance from paper are high since simple system changes can achieve significant results. As an example there is a widespread view that the Australian Taxation Office (ATO) requires businesses to keep transaction documentation in a hard copy when this is not a requirement and leads to many electronic invoices, receipts etc. being printed unnecessarily.Many organisations interviewed indicated that their internal systems relied on printed forms and filing systems. A surprising proportion of office-based businesses did not have their printers set to automatically print double sided. In organisations where the IT director was enthusiastic about waste avoidance, simple printer setting changes had been made which saved both on printing costs but also paper and toner purchasing. In more advanced organisations, electronic password confirmation and filing systems replaced forms that previously required a hard copy with a signature.
Page 83 Encycle Consulting Pty Ltd
Summary sheet: FINANCIAL AND INSURANCE SERVICES division C&I waste
FINANCIAL AND INSURANCE SERVICES
1-19 EFTE 34 063 NSW 13 311 SA 2 054 20-200 EFTE 1 938 VIC 8 884 TAS 483 200+ EFTE 403 WA 4 759 ACT 442 Non-employing 113 237 QLD 6 332 NT 139
Waste generation averages 200kg/EFTE.yrSector generates 70 200 t waste per yearSector produces 1% of total C+I waste stream
Masonry materials - Metals - Organics 10 Paper & cardboard 140 Plastics 10 Glass - Other 20
- Office based division contributing a small proportion of C&I waste stream - Low and uniform waste generation and profile - Organics stream likely to be sourced from staff kitchens and lunch rooms - Paper recovery programs well entrenched but not universal
ABS (2010a). ABS (2011a). ABS (2011b). ABS (2011c). ABS (2012b). ABS (2012c). CIWMB (2008). DEC (NSW) (2007). DEC (WA) (2011)DECCW (2010a). DECCW (2010b). DEFRA (2010). DERM(2012). DSEWPaC (2011a). DSEWPaC (2012b). EPA NSW (2012)EPA Victoria (2012a). Industry sources. Zero Waste SA (2011a).
Observations:
References:
10 - - -
20 -
10 10 50 90
- -
Waste to landfill (kg/EFTE.yr)
Diversion for recycling (kg/EFTE.yr)
Total waste generation (kg/EFTE.yr)
- -
Number of businesses by jurisdiction Number of businesses by size(effective full time equivalent [EFTE])
Australia 36 404
Waste to landfill
Diversion for recycling
Waste generation
- 20 40 60 80 100 120 140 160 180 200
Waste generation by material category and destination (kg/EFTE.yr)
Masonry materials Metals Organics Paper & cardboard Plastics Glass Other
Page 84 Encycle Consulting Pty Ltd
4.12RENTAL, HIRING AND REAL ESTATE SERVICES
RENTAL, HIRING AND REAL ESTATE SERVICES is a relatively small, office-based division with relatively low waste generation (300 kg per EFTE). The waste profile for RENTAL, HIRING AND REAL ESTATE is dominated by masonry materials and timber. This is likely a spill over of construction and demolition waste from property managers, body corporates and other similar businesses. The recycling stream is dominated by paper and cardboard. Recycling systems for paper are now increasingly entrenched in this division, however the majority of masonry materials and timber are sent to landfill.The consumption of paper in office sectors is a key issue. A focus on paper usage and avoidance could be extended to this sector. See commentary under FINANCIAL AND INSURANCE SERVICES.
Page 85 Encycle Consulting Pty Ltd
Summary sheet: RENTAL, HIRING AND REAL ESTATE SERVICES division C&I waste
RENTAL, HIRING AND REAL ESTATE SERVICES
1-19 EFTE 28 895 NSW 11 013 SA 1 816 20-200 EFTE 3 276 VIC 6 735 TAS 516 200+ EFTE 138 WA 3 356 ACT 435 Non-employing 185 158 QLD 8 206 NT 226
Waste generation averages 1600kg/EFTE.yrSector generates 287 200 t waste per yearSector produces 3% of total C+I waste stream
Masonry materials 510 Metals 50 Organics 550 Paper & cardboard 180 Plastics 90 Glass 20 Other 230
- Office based division contributing a small proportion of C&I waste stream - Low and uniform waste generation and profile - Paper recovery programs well entrenched but not universal - Organics stream likely to be sourced from staff kitchens and lunch rooms
ABS (2010a). ABS (2011a). ABS (2011b). ABS (2011c). ABS (2012b). ABS (2012c). CIWMB (2008). DEC (NSW) (2007). DEC (WA) (2011)DECCW (2010a). DECCW (2010b). DEFRA (2010). DERM(2012). DSEWPaC (2011a). DSEWPaC (2012b). EPA NSW (2012)EPA Victoria (2012a). Industry sources. Zero Waste SA (2011a).
Observations:
References:
90 - 10 10
210 20
540 10 90 90
40 10
Waste to landfill (kg/EFTE.yr)
Diversion for recycling (kg/EFTE.yr)
Total waste generation (kg/EFTE.yr)
500 10
Number of businesses by jurisdiction Number of businesses by size(effective full time equivalent [EFTE])
Australia 32 309
Waste to landfill
Diversion for recycling
Waste generation
- 200 400 600 800 1,000 1,200 1,400 1,600 1,800
Waste generation by material category and destination (kg/EFTE.yr)
Masonry materials Metals Organics Paper & cardboard Plastics Glass Other
Page 86 Encycle Consulting Pty Ltd
4.13PROFESSIONAL, SCIENTIFIC AND TECHNICAL SERVICES
A relatively small office based division with relatively low waste generation and a waste profile dominated by paper and cardboard. Recycling systems for paper are now increasingly entrenched in this division.The consumption of paper in office sectors is a key issue and any focus on paper usage and avoidance could be extended to this sector. See also commentary under FINANCIAL AND INSURANCE SERVICES.
Page 87 Encycle Consulting Pty Ltd
Summary sheet: PROFESSIONAL, SCIENTIFIC AND TECHNICAL SERVICES division C&I waste
PROFESSIONAL, SCIENTIFIC AND TECHNICAL SERVICES
1-19 EFTE 100 803 NSW 40 658 SA 5 409 20-200 EFTE 6 753 VIC 28 156 TAS 1 409 200+ EFTE 456 WA 10 606 ACT 2 453 Non-employing 123 448 QLD 18 792 NT 514
Waste generation averages 300kg/EFTE.yrSector generates 223 900 t waste per yearSector produces 2% of total C+I waste stream
Masonry materials - Metals - Organics 20 Paper & cardboard 200 Plastics 30 Glass - Other 40
- Office based division contributing a small proportion of C&I waste stream - Low and uniform waste generation and profile - Paper recovery programs well entrenched but not universal - Organics stream likely to be sourced from staff kitchens and lunch rooms
ABS (2010a). ABS (2011a). ABS (2011b). ABS (2011c). ABS (2012b). ABS (2012c). CIWMB (2008). DEC (NSW) (2007). DEC (WA) (2011)DECCW (2010a). DECCW (2010b). DEFRA (2010). DERM(2012). DSEWPaC (2011a). DSEWPaC (2012b). EPA NSW (2012)EPA Victoria (2012a). Industry sources. Zero Waste SA (2011a).
Observations:
References:
20 - - -
40 -
20 - 120 80
- -
Waste to landfill (kg/EFTE.yr)
Diversion for recycling (kg/EFTE.yr)
Total waste generation (kg/EFTE.yr)
- -
Number of businesses by jurisdiction Number of businesses by size(effective full time equivalent [EFTE])
Australia 108 012
Waste to landfill
Diversion for recycling
Waste generation
- 50 100 150 200 250 300 350
Waste generation by material category and destination (kg/EFTE.yr)
Masonry materials Metals Organics Paper & cardboard Plastics Glass Other
Page 88 Encycle Consulting Pty Ltd
4.14ADMINISTRATIVE AND SUPPORT SERVICES
A relatively small office based division with low waste generation and a waste profile dominated by paper and cardboard. Recycling systems for paper are now increasingly entrenched in this division.The consumption of paper in office sectors is a key issue and any focus on paper usage and avoidance could be extended to this sector. See also commentary under FINANCIAL AND INSURANCE SERVICES.
Page 89 Encycle Consulting Pty Ltd
Summary sheet: ADMINISTRATIVE AND SUPPORT SERVICES division C&I waste
ADMINISTRATIVE AND SUPPORT SERVICES
1-19 EFTE 29 866 NSW 13 506 SA 1 944 20-200 EFTE 5 237 VIC 8 622 TAS 509 200+ EFTE 909 WA 3 550 ACT 567 Non-employing 40 550 QLD 7 056 NT 258
Waste generation averages 200kg/EFTE.yrSector generates 54 500 t waste per yearSector produces 1% of total C+I waste stream
Masonry materials - Metals - Organics 10 Paper & cardboard 130 Plastics 10 Glass - Other 20
- Office based division contributing a small proportion of C&I waste stream - Low and uniform waste generation and profile - Paper recovery programs well entrenched but not universal - Good quality data was available for the study as many previous audits on this division - Organics stream likely to be sourced from staff kitchens and lunch rooms
ABS (2010a). ABS (2011a). ABS (2011b). ABS (2011c). ABS (2012b). ABS (2012c). CIWMB (2008). DEC (NSW) (2007). DEC (WA) (2011)DECCW (2010a). DECCW (2010b). DEFRA (2010). DERM(2012). DSEWPaC (2011a). DSEWPaC (2012b). EPA NSW (2012)EPA Victoria (2012a). Industry sources. Zero Waste SA (2011a).
Observations:
References:
10 - - -
20 -
10 10 40 90
- -
Waste to landfill (kg/EFTE.yr)
Diversion for recycling (kg/EFTE.yr)
Total waste generation (kg/EFTE.yr)
- -
Number of businesses by jurisdiction Number of businesses by size(effective full time equivalent [EFTE])
Australia 36 012
Waste to landfill
Diversion for recycling
Waste generation
- 20 40 60 80 100 120 140 160 180 200
Waste generation by material category and destination (kg/EFTE.yr)
Masonry materials Metals Organics Paper & cardboard Plastics Glass Other
Page 90 Encycle Consulting Pty Ltd
4.15PUBLIC ADMINISTRATION AND SAFETY
A relatively small office based division with lower waste generation and a waste profile dominated by paper and cardboard. Recycling systems for paper are now increasingly entrenched in this division.The consumption of paper in office sectors is a key issue. (See commentary under FINANCIAL AND INSURANCE SERVICES).
Page 91 Encycle Consulting Pty Ltd
Summary sheet: PUBLIC ADMINISTRATION AND SAFETY division C&I waste
PUBLIC ADMINISTRATION AND SAFETY
1-19 EFTE 3 201 NSW 1 760 SA 243 20-200 EFTE 813 VIC 856 TAS 96 200+ EFTE 93 WA 399 ACT 57 Non-employing 3 943 QLD 639 NT 57
Waste generation averages 300kg/EFTE.yrSector generates 222 000 t waste per yearSector produces 2% of total C+I waste stream
Masonry materials - Metals 10 Organics 20 Paper & cardboard 230 Plastics 30 Glass - Other 50
- Office based division contributing a small proportion of C&I waste stream - Mainly office based - Low and uniform waste generation and profile - Paper recovery programs well entrenched but not universal - Organics stream likely to be sourced from staff kitchens and lunch rooms
ABS (2010a). ABS (2011a). ABS (2011b). ABS (2011c). ABS (2012b). ABS (2012c). CIWMB (2008). DEC (NSW) (2007). DEC (WA) (2011)DECCW (2010a). DECCW (2010b). DEFRA (2010). DERM(2012). DSEWPaC (2011a). DSEWPaC (2012b). EPA NSW (2012)EPA Victoria (2012a). Industry sources. Zero Waste SA (2011a).
Observations:
References:
30 - - -
50 -
20 10 140 90
10 -
Waste to landfill (kg/EFTE.yr)
Diversion for recycling (kg/EFTE.yr)
Total waste generation (kg/EFTE.yr)
- -
Number of businesses by jurisdiction Number of businesses by size(effective full time equivalent [EFTE])
Australia 4 107
Waste to landfill
Diversion for recycling
Waste generation
- 50 100 150 200 250 300 350 400
Waste generation by material category and destination (kg/EFTE.yr)
Masonry materials Metals Organics Paper & cardboard Plastics Glass Other
Page 92 Encycle Consulting Pty Ltd
4.16EDUCATION AND TRAINING
This is a large division with relatively low waste generation and a waste profile dominated by paper and cardboard. Recycling systems for paper and some other materials are sometimes present in this division. Generation from this division is approximately 2% of C&I waste at a rate of approximately 300 kg per employee. This is a very broad division including kindergartens, schools, universities and vocational training. A large proportion of this waste will be generated by students on campus as they will significantly outnumber staff.Governments at federal (tertiary education), state (primary and secondary education), and local (kindergartens) level have some control over facilities in this sector. In some areas state-wide contracts are negotiated for waste services. There is therefore a strong potential for government to require waste minimisation practices in this division. A more uniform and regular reporting in this sector would also be more achievable. As an example, in the UK all tertiary education institutions report on waste generation and rates of diversion from landfill each year (as well as issues such as integration of sustainability into the curriculum). As a result a report on waste performance is published that provides benchmarks and acts as a key motivation for increased performance across all tertiary education institutions.
Page 93 Encycle Consulting Pty Ltd
Summary sheet: EDUCATION AND TRAINING division C&I waste
EDUCATION AND TRAINING
1-19 EFTE 9 237 NSW 4 376 SA 545 20-200 EFTE 1 701 VIC 2 760 TAS 144 200+ EFTE 228 WA 984 ACT 201 Non-employing 12 386 QLD 2 090 NT 66
Waste generation averages 300kg/EFTE.yrSector generates 233 500 t waste per yearSector produces 2% of total C+I waste stream
Masonry materials 20 Metals 10 Organics 50 Paper & cardboard 130 Plastics 40 Glass 10 Other 80
- Paper recovery programs well entrenched but not universal - Relatively low employment but significant waste generation from student populations - Some diversity in waste stream from different subdivisions - Includes schools, vocational training & universities
ABS (2010a). ABS (2011a). ABS (2011b). ABS (2011c). ABS (2012b). ABS (2012c). ABS (2012e). CIWMB (2008). DEC (NSW) (2007)DEC (WA) (2011). DECCW (2010a). DECCW (2010b). DEEWR(2012). DEFRA (2010). DERM(2012). DSEWPaC (2011a)DSEWPaC (2012b). EPA NSW (2012). EPA Victoria (2012a). Industry sources. NCVER (2012a). NCVER (2012b)Sustainable Campus Group (2011a). SRU (2011). EPA Victoria (2012a). Industry sources
Observations:
References:
30 10 - -
80 -
50 - 60 70
10 -
Waste to landfill (kg/EFTE.yr)
Diversion for recycling (kg/EFTE.yr)
Total waste generation (kg/EFTE.yr)
20 -
Number of businesses by jurisdiction Number of businesses by size(effective full time equivalent [EFTE])
Australia 11 166
Waste to landfill
Diversion for recycling
Waste generation
- 50 100 150 200 250 300 350
Waste generation by material category and destination (kg/EFTE.yr)
Masonry materials Metals Organics Paper & cardboard Plastics Glass Other
Page 94 Encycle Consulting Pty Ltd
4.17HEALTH CARE AND SOCIAL ASSISTANCE
The health care sector is a large division (over 1 million EFTE) with relatively low waste generation at 600 kg per EFTE and a diverse waste profile. The health care division would require some further investigation to fully understand and identify the key areas of poor performance and high opportunity for improved material efficiency. A detailed profile of waste in hospitals, residential care, specialist health care services, general practice medical services and veterinary services is needed to identify the level of waste generation and landfill diversion within this sector. Some of the waste disposed from health care facilities is potentially recyclable or even reusable but safety concerns result in disposal (e.g. metal sharps). Waste associated with health care can potentially be hazardous (e.g. radioactive, cytotoxic or disease contaminated) which is mostly hard to avoid or recycle. There are now programs for recovery of waste being instituted by some health care equipment providers at major hospitals. An example is the sterilisation covers for medical equipment which are recovered and recycled by the providers. This level of product stewardship commitment should be encouraged and may offer a model for broader application in this sector and others. Recycling systems for paper are now increasingly entrenched in this division.There is on-site destruction of clinical wastes at many hospitals across Australia (incineration). It is likely that a small amount of other waste will incorrectly enter the incineration stream and therefore the waste generated at these sites is likely to be under-reported by a small degree.The measurement of waste generation is complex in this sector and waste per hospital bed per day (“bed/days”) is probably a better benchmarking tool than EFTE in the hospital sub division. The report has used EFTE as a standardising factor for all divisions to allow comparisons to be made.
Page 95 Encycle Consulting Pty Ltd
Summary sheet: HEALTH CARE AND SOCIAL ASSISTANCE division C&I waste
HEALTH CARE AND SOCIAL ASSISTANCE
1-19 EFTE 42 378 NSW 17 048 SA 3 173 20-200 EFTE 4 236 VIC 11 297 TAS 942 200+ EFTE 458 WA 4 100 ACT 807 Non-employing 45 316 QLD 9 444 NT 255
Waste generation averages 600kg/EFTE.yrSector generates 564 700 t waste per yearSector produces 5% of total C+I waste stream
Masonry materials - Metals 30 Organics 130 Paper & cardboard 220 Plastics 50 Glass - Other 120
- Significant and diverse division in both size and contribution to C&I waste stream - Division covers hospitals, allied health and residential care subdivisions - Waste stream diverse due to broad range of division - Commercial kitchens produce large amounts of organic waste - Some degree of on site waste destruction (incineration) at large sites
ABS (2010a). ABS (2011a). ABS (2011b). ABS (2011c). ABS (2012b). ABS (2012c). CIWMB (2008). DEC (NSW) (2007). DEC (WA) (2011)DECCW (2010a). DECCW (2010b). DEFRA (2010). DERM(2012). DSEWPaC (2011a). DSEWPaC (2012b). EPA NSW (2012)EPA Victoria (2012a). Industry sources.
Observations:
References:
40 - - -
110 10
100 20 160 70
20 10
Waste to landfill (kg/EFTE.yr)
Diversion for recycling (kg/EFTE.yr)
Total waste generation (kg/EFTE.yr)
- -
Number of businesses by jurisdiction Number of businesses by size(effective full time equivalent [EFTE])
Australia 47 072
Waste to landfill
Diversion for recycling
Waste generation
- 100 200 300 400 500 600
Waste generation by material category and destination (kg/EFTE.yr)
Masonry materials Metals Organics Paper & cardboard Plastics Glass Other
Page 96 Encycle Consulting Pty Ltd
4.18ARTS AND RECREATION SERVICES
This is a significant and diverse division covering a range of venues with a waste material profile that is highly recyclable. This division includes: museums; sporting and recreational facilities; gambling sites; creative and performing arts activities; and arts, recreational and heritage sites. While much attention has been focussed on sporting venues, less focus has be devoted to other sites within this division which could offer strong waste minimisation potential. As observed in the education sector, government often has a high degree of direct or indirect control of the sites in the ARTS AND RECREATION SERVICES division. Overall the division accounts for 5% of total C&I waste. The profile of the waste is likely to be dominated by visitor-associated waste generated at most of these sites (food and beverage associated wastes including packaging and food).
Page 97 Encycle Consulting Pty Ltd
Summary sheet: ARTS AND RECREATION SERVICES division C&I waste
ARTS AND RECREATION SERVICES
1-19 EFTE 7 789 NSW 3 248 SA 529 20-200 EFTE 1 365 VIC 2 489 TAS 147 200+ EFTE 105 WA 738 ACT 129 Non-employing 18 234 QLD 1 871 NT 108
Waste generation averages 3400kg/EFTE.yrSector generates 571 100 t waste per yearSector produces 5% of total C+I waste stream
Masonry materials 220 Metals 100 Organics 510 Paper & cardboard 1 630 Plastics 200 Glass 40 Other 690
- Division includes sporting and cultural venues with high organics and primary packaging profile - Relatively small division in terms of employment - High waste generation per EFTE due to large number of attendees to venues
ABS (2010a). ABS (2011a). ABS (2011b). ABS (2011c). ABS (2012b). ABS (2012c). CIWMB (2008). DEC (NSW) (2007). DEC (WA) (2011)DECCW (2010a). DECCW (2010b). DEFRA (2010). DERM(2012). DSEWPaC (2011a). DSEWPaC (2012b). EPA NSW (2012)EPA Victoria (2012a). Industry sources.
Observations:
References:
180 20 10 30
590 100
450 60 1 080 540
30 70
Waste to landfill (kg/EFTE.yr)
Diversion for recycling (kg/EFTE.yr)
Total waste generation (kg/EFTE.yr)
160 60
Number of businesses by jurisdiction Number of businesses by size(effective full time equivalent [EFTE])
Australia 9 259
Waste to landfill
Diversion for recycling
Waste generation
- 500 1,000 1,500 2,000 2,500 3,000 3,500 4,000
Waste generation by material category and destination (kg/EFTE.yr)
Masonry materials Metals Organics Paper & cardboard Plastics Glass Other
Page 98 Encycle Consulting Pty Ltd
5 Cost of waste to business and savings opportunitiesAs outlined in more detail in the report methodology section (Section 2.8), the objective of this costing exercise is to highlight to industry and other stakeholders the economic costs to business associated with:
the costs of waste collection, disposal and recycling by industry division the cost of purchasing business inputs that are then converted to waste or
recycled.These financial impacts represent the cost side of what is often described in economic terms as ‘material efficiency’. Improving material efficiency means reducing a component of business costs, which largely shifts straight to the bottom line, disregarding any costs associated with enabling the avoidance of the input costs.To provide some context to the costings presented in this section of the report, Table 15 summarises C&I industry division revenues for the 2009–10 financial year, with the industry divisions are ordered by ANZSIC code.Table 15: Industry division revenues (ABS, 2011a)
Industry division(Industry divisions ordered by ANZSIC code)
Revenue($ million) %
MANUFACTURING $390 000 21%WHOLESALE TRADE $411 000 22%RETAIL TRADE $358 000 19%ACCOMMODATION AND FOOD SERVICES $73 000 3.9%TRANSPORT POSTAL AND WAREHOUSING $132 000 7.1%FINANCIAL AND INSURANCE SERVICES1 N/A N/ARENTAL, HIRING AND REAL ESTATE SERVICES $97 000 5.3%PROFESSIONAL, SCIENTIFIC AND TECHNICAL SERVICES $180 000 9.7%ADMINISTRATIVE AND SUPPORT SERVICES $65 000 3.5%PUBLIC ADMINISTRATION AND SAFETY $6 000 0.3%EDUCATION AND TRAINING $27 000 1.5%HEALTH CARE AND SOCIAL ASSISTANCE $82 000 4.4%ARTS AND RECREATION SERVICES $30 000 1.6%Total $1 851 000 100%1. Data not available for the FINANCIAL AND INSURANCE SERVICES division.
The ‘input costs’ estimates used in this study are provided in Table 16 below. These are synthesised from a range of sources, and are conservative approximations for the value of each material when purchased as business inputs.
Page 99 Encycle Consulting Pty Ltd
Table 16: Estimated input cost1 values, by material type
Material type Input costs ($/tonne)Masonry materials $300Steel $1 400Aluminium $3 000Non-ferrous metals (ex. Al) $6 000Food organics $5 500Garden organics $200Timber $2 500Other organics $200Cardboard $1 000Office paper $2 250Other paper $1 000Plastic packaging $1 900Other plastics $1 900Packaging glass $1 650Other glass $650Leather & textiles $6 000Tyres & other rubber $10 000Unknown $550Sources: ABS (2012d), Bricks Australia (2012), Glass Bottles Direct (2012), IndustryEdge (2008), MetalPrices.com (2012), alibaba.com (2012), plastemart.com (2012), SRU and Encycle estimates (2012).1. Input cost values do not include landfill or recycling disposal costs.
5.1 Summary of cost findings
C&I waste disposal costs, both to landfill and to recycling, are provided in Table 17 and Figure 6. It is estimated that the MANUFACTURING division spends the most on waste and recycling services, followed by the RETAIL TRADE division and ACCOMMODATION AND FOOD SERVICES. The total cost of waste services is conservatively estimated as $2.2 billion per year for the included industry divisions.The industry ranking for input costs is fairly similar to that for disposal and recycling costs. The MANUFACTURING division spends in the order of $7.9 billion purchasing the inputs which are subsequently disposed to landfill or recycling, followed by ACCOMMODATION AND FOOD SERVICES ($6.1 billion) and RETAIL TRADE (approximately $5.1 billion). The total cost of material inputs that are subsequently disposed of as waste is estimated as a little over $26.5 billion per year. These estimates exclude any costs associated with other types of resource consumption associated with transforming these inputs into wastes, which include energy and water related costs.It is important to note that the costs provided in this report are approximate estimates only, particularly the input costs. In addition, while a proportion of the input costs will be avoidable, a significant proportion of them will not be. Further work will be required to
Page 100 Encycle Consulting Pty Ltd
identify the avoidable fraction of the input costs. It is acknowledged that a certain level of purchase and wastage is an inevitable result of doing business. The costings do however illustrate the magnitude of expenditure on waste services and inputs, and in particular the much greater financial benefits that could be available to companies through waste avoidance and minimisation, rather than focussing only on end-of-pipe improvements in waste management.
Page 101 Encycle Consulting Pty Ltd
Table 17: Waste disposal and input costs summary
Industry division Disposal costs ($ million) Input costs ($ million)Landfill Recycling Disposal total Landfill Recycling Inputs total
MANUFACTURING $300 $320 $620 $3 360 $4 550 $7 910 WHOLESALE TRADE $80 $50 $130 $780 $480 $1 260 RETAIL TRADE $310 $180 $480 $3 330 $1 810 $5 140 ACCOMMODATION AND FOOD SERVICES $360 $110 $470 $5 100 $980 $6 080 TRANSPORT POSTAL AND WAREHOUSING $10 $40 $50 $70 $470 $540 FINANCIAL AND INSURANCE SERVICES $10 $10 $10 $60 $90 $140 RENTAL, HIRING AND REAL ESTATE SERVICES $50 - $60 $420 $40 $460 PROF, SCIENTIFIC AND TECH SERVICES $30 $10 $40 $290 $140 $430 ADMINISTRATIVE AND SUPPORT SERVICES - - $10 $40 $70 $110 PUBLIC ADMINISTRATION AND SAFETY $30 $10 $40 $290 $140 $430 EDUCATION AND TRAINING $40 $10 $40 $250 $100 $350 HEALTH CARE AND SOCIAL ASSISTANCE $90 $20 $110 $600 $150 $750 ARTS AND RECREATION SERVICES $90 $20 $110 $590 $180 $770 Total $1 400 $780 $2 170 $15 180 $9 200 $24 370
Page 102 Encycle Consulting Pty Ltd
Figure 6: Estimated cost of waste disposal to industry, by industry division ($ million)
MANUFACTURING
WHOLESALE TRADE
RETAIL TRADE
ACCOMMODATION AND FOOD SERVICES
TRANSPORT POSTAL AND WAREHOUSING
FINANCIAL AND INSURANCE SERVICES
RENTAL, HIRING AND REAL ESTATE SERVICES
PROFESSIONAL, SCIENTIFIC AND TECHNICAL SERVICES
ADMINISTRATIVE AND SUPPORT SERVICES
PUBLIC ADMINISTRATION AND SAFETY
EDUCATION AND TRAINING
HEALTH CARE AND SOCIAL ASSISTANCE
ARTS AND RECREATION SERVICES
- $ 500 000 000 $1 000 000 000 Waste to landfill Waste to recycling
Page 103 Encycle Consulting Pty Ltd
Figure 7: Estimated input cost of waste to industry, by industry division ($ million)
MANUFACTURING
WHOLESALE TRADE
RETAIL TRADE
ACCOMMODATION AND FOOD SERVICES
TRANSPORT POSTAL AND WAREHOUSING
FINANCIAL AND INSURANCE SERVICES
RENTAL, HIRING AND REAL ESTATE SERVICES
PROFESSIONAL, SCIENTIFIC AND TECHNICAL SERVICES
ADMINISTRATIVE AND SUPPORT SERVICES
PUBLIC ADMINISTRATION AND SAFETY
EDUCATION AND TRAINING
HEALTH CARE AND SOCIAL ASSISTANCE
ARTS AND RECREATION SERVICES
Waste to landfill Waste to recycling
Page 104 Encycle Consulting Pty Ltd
Figure 8: Estimated combined disposal and input costs of waste to industry, by industry division ($ million)
MANUFACTURING
WHOLESALE TRADE
RETAIL TRADE
ACCOMMODATION AND FOOD SERVICES
TRANSPORT POSTAL AND WAREHOUSING
FINANCIAL AND INSURANCE SERVICES
RENTAL, HIRING AND REAL ESTATE SERVICES
PROFESSIONAL, SCIENTIFIC AND TECHNICAL SERVICES
ADMINISTRATIVE AND SUPPORT SERVICES
PUBLIC ADMINISTRATION AND SAFETY
EDUCATION AND TRAINING
HEALTH CARE AND SOCIAL ASSISTANCE
ARTS AND RECREATION SERVICES
Waste to landfill Waste to recycling
Page 105 Encycle Consulting Pty Ltd
Table 18: Estimated input cost summary, by material type
Sources: ABS (2012d), Bricks Australia (2012), Glass Bottles Direct (2012), IndustryEdge (2008), MetalPrices.com (2012), alibaba.com (2012), plastemart.com (2012).
Page 106 Encycle Consulting Pty Ltd
Figure 9: Estimated input cost summary, by material type ($ million)
Masonry materials
Steel
AluminiumNon-ferrous metals (ex.
Al)Food organics
Garden organics
Timber
Other organics
Cardboard
Office paper
Other paper
Plastic packaging
Other plastics
Packaging glass
Other glass
Leather & textiles
Tyres & other rubber
Unknown
- $ 3 000 $ 6 000 $ 9 000 $ 12 000
Waste to landfill Waste to recycling
5.2 Summary of opportunities
The material input costs associated with C&I wastes, disposed to both to landfill and to recycling, are provided in Table 18 and Figure 9. Food waste is by far the dominant input cost, with most of this going to landfill. While a significant majority of this food waste is probably unavoidable, even small percentage improvements in reducing unnecessary food wastage have obvious financial benefits.
Page 107 Encycle Consulting Pty Ltd
6 C&I waste: barriers to material efficiency
6.1 Introduction
During this project, site visits and interviews were conducted with a broad range of relevant companies to understand the barriers to waste avoidance and recycling and gauge the level of internal commitment to managing waste effectively.Several findings were identified during this project about the way that waste is perceived and managed, which generally concurred with experience from other projects undertaken by Encycle and SRU for Australian businesses. The following section discusses the drivers and opportunities for waste avoidance and recycling. In this report, ‘material efficiency’ is used as a proxy for waste avoidance and recycling but includes measures such as reuse and other recovery methods to avoid disposal to landfill and excessive waste generation.This report provides an opening discussion relating to the findings about the C&I waste stream from existing data and some site visits and interviews (See Section 2.5 for the extent of the research). Further investigation into the barriers and opportunities for C&I waste management is required.
Barriers to waste avoidance and recyclingWhere businesses do not recycle or manage the flow of materials through their organisation efficiently, there were three key areas for the barriers to improved performance:
1. cost issueso relatively low ranking of waste as a cost issue (relative to other business
costs) o perception that recycling is more expensiveo perception that waste disposal is a fixed costo perception that recycling will take up staff timeo cost of lost product through inefficiency is not always appreciated
2. corporate culture and process issueso business understanding of their waste stream is often incompleteo lack of ownership of waste management as an issue o lack of a ‘champion’ with sufficient seniority to implement changeo perceived difficulty of engaging staff to be less wasteful or recycle more o corporate culture may be resistant to change or does not consider
environmental performance to impact upon core businesso disconnect between the point of waste generation and either payment for
waste or the observation of the quantity of waste going to landfillo changes to internal processes and systems may be needed to avoid
wasteful practices (e.g. software and staff training to implement paperless invoicing)
3. waste collection method issues o waste collection companies do not drive recycling or avoidanceo challenges for small businesses to recycleo ready availability of landfill as a disposal option for recyclables
Page 108 Encycle Consulting Pty Ltd
6.2 Cost issues
6.2.1 Perceptions about waste costs to business
Waste collection and disposal costs are generally a relatively small proportion of the overall running costs of a business. Many organisations pay little attention to the pricing method and overall cost of their waste collections. Generally, waste is viewed as a fixed cost that cannot be reduced. Perceptions of the cost of recycling relative to general waste varied across different states. In many states where disposal is relatively inexpensive, recycling was generally perceived to be more expensive even when this was not the case. Effective recycling often requires some communication and training for staff to ensure that the systems are used effectively. This is perceived to take staff time away from their paid role that is will not necessarily be recouped by any saving from reduced waste costs.Even when systems for recycling are established, some industries are concerned that staff will spend longer depositing a given item in the correct bin which will cause a reduction in productivity.Although it is currently only a small proportion, some businesses are starting to acknowledge that staff loyalty is impacted by the corporate culture on environmental issues such as recycling.
6.2.2 Purchasing and product inventories
Many of the businesses interviewed acknowledged that the cost of sending product purchased to waste is a much bigger cost to their business than waste disposal charges. There is a range of practices across each industry sector in managing product loss. As an example there are cafes that claim no loss in product due to careful ordering and inventory control. There are others who have sale or return arrangements in place to transfer waste to suppliers. These arrangements can have a negative effect on overall waste by relieving the sales outlet from any commitment to match supply and demand. As an example a FUEL RETAIL outlet had a store setup with too many shelves. Rather than look empty, the store manager over ordered potato chips and flavoured milk knowing the product would not be sold but would return to supplier at no cost to the retailer. There are some products that have a higher level of product loss than most. Perishable food is the obvious high loss product grouping and higher loss levels are factored in for products such as bread, meat, fruit and vegetables and cut flowers. Internal practices influenced by food safety and freshness reputations can also impact product losses. A major fast food chain prides itself on not keeping any prepared food beyond a short time. This commitment needs to go hand in hand with well managed cooking and serving to ensure a large volume of food is not consigned to waste without reaching the consumer. Some parts of the food services sector are traditionally more wasteful than others. Corporate catering operates on a model that regularly generates wastage of 25-50%, a level unlikely to be seen in a small food services business such as a café.Several cafes acknowledged that their loss levels for milk at 20% were much higher than for other products at 5%. Once a quantity of milk is heated the residue is often discarded
Page 109 Encycle Consulting Pty Ltd
and an estimate of exact quantities is difficult to achieve. There is no apparent portion control for milk in cafes as there is for other products.In many MANUFACTURING businesses, the loss of product to disposal is considered so much as an unavoidable function of their operations that it is not even seen as waste. As an example, a motor vehicle retailer mentioned only when pressed that surplus spare parts are disposed of annually by a collection outside their regular service and is therefore not viewed as waste.There is a growing recognition that managing stock inventories efficiently is a key to reduced product write offs. In these cases the issue is seen as stock control rather than waste management.
6.3 Corporate culture and process issues
6.3.1 Core business and sustainability
The group of businesses interviewed for this study was relatively small and further research is needed in to identify any relationship between corporate culture and attitudes to recycling. However, from this project it was noted that businesses with a general lack of awareness about the importance of sustainability and without any monitoring of environmental performance tended to have inefficient waste and recycling systems.Businesses from all industry divisions and of any size with a ‘long term’ approach to their business and a view that financial sustainability was clearly linked to environmental and social sustainability tended to have an appreciation of the importance of recycling. While the fundamental appreciation of sustainability is needed at the highest levels of the business in order to drive good practice, many businesses still struggled with a lack of practical experience in handling waste data and demanding good service from the waste collection companies.Some of the personnel interviewed described their frustration at being blocked by their manager from making changes to systems or undertaking waste related project, while personally having an appreciation for the potential economic and efficiency gains from having well organised waste management systems.Commonly, various personnel within an organisation felt that there were potential improvements that could be made to their operations to avoid waste and recycle more but that there was no single person in a position to be responsible for the necessary changes.Some personnel interviewed during site visits did not consider the waste generation from their site to be a problem and some saw the waste generated as necessary to doing the job effectively and unavoidable. The lack of awareness and concern may be in part due to a lack of connection between the staff producing the waste and the actual end point of disposal (i.e. the material just ‘goes away’ and is not their problem).Many site staff across all industries felt that changes required to recycle more or to avoid waste would be overly difficult or cumbersome (e.g. implementing new software or upgrading equipment). It was common to hear people reflect that other personnel either above or below them in the hierarchy did not care about waste. It was interesting to reflect that many of the people interviewed did think that excessive waste was worth tackling from a business perspective (at all levels of seniority), but were at a loss as to how to do this. Senior staff tended to think that the education and training required to
Page 110 Encycle Consulting Pty Ltd
implement improved systems would be excessive. Operational staff felt that senior staff were not interested in improvements to material efficiency unless there was a direct impact upon profitability.
6.3.2 Business’ understanding of their waste stream
Many of businesses interviewed reported to understand their waste stream reasonably well. In general, facilities managers or building managers have a good understanding of the types of waste produced by the site, the ways in which waste was collected (i.e. bin systems and other equipment) and specific areas where waste caused ongoing issues (e.g. odour, stockpiling of wastes that were difficult to manage, issues with equipment breakdowns etc.). Building managers, and more often senior management, were often surprised by audit results, recycling rate calculations and costs of waste for each waste stream. Site managers often made comments on site visits such as ‘that shouldn’t be in there’ or ‘I hadn’t realised how much of that we wasted’.When asked about their waste stream, most large businesses did not know how much they spent on waste disposal and recycling or what their overall recycling performance was. Very few businesses compared ongoing performance by recycling rate or normalised waste generation. Many businesses knew how much they were charged per month by each contractor for waste but very few monitored costs to check for changes in charges or looked at ‘per tonne’ costs to check that pricing remained consistent. At some level, invoices for waste are paid and there may be accounting processes to monitor costs of wastes, although some businesses did not include ad hoc ordering of skips for clear-outs in their charges or did not aggregate charges where there were multiple waste collection companies.Some businesses collected waste and recycling data on a regular basis although many did not use it to monitor longer term variability, consistency of fees or to troubleshoot problems.
6.4 Waste collection method issues
6.4.1 Waste charging is usually bin-lift based
Waste collections from C&I generators are usually charged per bin pick-up (lift) based on the size of bin. Additional charges may relate to hire of bins and site-specific requirements (i.e. a penalty charge will often apply to poorly organised sites where bin-lifts take a long time or are difficult.Bin lift charges apply irrespective of the quantity of material in the bin, which can result in higher rates of charging for a given quantity of waste removed. In many cases, businesses have bin capacity in excess of what they utilise regularly. Some of the excessive capacity issue is likely to be over-servicing by waste collection companies while often it is due to the need to cope with seasonal points of high waste generation. The waste collection industry is not currently set up for a weight based set of tariffs for bins. Not all waste collection vehicles will have appropriate scales fitted to their entire fleet of trucks (to weigh the waste at point of bin lift). Waste companies base their charges not only upon disposal costs but also the cost of sending out a particular type of truck to a site. It would be more complex to recover this cost if weight based charges
Page 111 Encycle Consulting Pty Ltd
applied. It is likely that waste collection companies prefer the status quo of charging by bin lift as this provides good profit on light loads and half empty bins. Businesses are generally charged for the number of bins they have on site, irrespective of the quantity of waste actually collected. The bin-lift charging model acts to remove some of the price-based incentive to reduce waste to landfill.
6.4.2 Perception of ability to change waste costs and services
Site visits and interviews with waste generators showed that most businesses consider waste to be a fixed cost that cannot be improved upon. Many businesses believe that recycling costs more than waste disposal. In fact waste disposal costs can often be reduced by:
recycling more material ensuring that the collection methods are appropriate and cost effective.
Waste generators may be able to recycle more material by assessing their waste to landfill, identifying recyclable materials and implementing systems to segregate and handle the recyclable material in collaboration with a waste collection company.Collection methods for waste and recyclables may be streamlined for businesses by using fewer bins, removing recyclables from the general waste stream or by investing in equipment such as balers to obtain better rates for recyclable material removed from the site.Many waste collection companies request that they are the sole service provider to the waste generators site. The result of sole service provision can be that if a waste collection company does provide a service to recycle all of the possible materials from a site, no other waste collection companies are able to collect the material for recycling.Although some subcontracting of services can occur, particularly for single-recycling stream operators, waste collection companies are unlikely to collaborate to provide a full suite of possible recycling services to a site. Collaboration does occur, but generally when there is a contractual requirement by the waste generator. Unfortunately, waste collection companies have no strong driver to improve upon effectiveness of service or the amount of material recycled by clients, unless the contract is contested by a competitor or the client is highly demanding. The generators of C&I waste generally have no direct exposure to the disposal of their waste and are often totally unaware of their recycling options. Many businesses have no connection with a recycler and are not well equipped to facilitate a collection arrangement. This is particularly the case for smaller businesses that lack time and expertise in waste management and are unlikely to see it as a priority for their business. Waste collection contractors are not always active in selling recycling services to replace waste disposal. Improving recycling collections is not generally a performance indicator for waste generator staff. The Business Recycling website (www.businessrecycling.com.au) performs a valuable function in equipping businesses with recycling information in some jurisdictions.
6.4.3 Recycling for small, medium and large businesses
Broadly speaking, larger businesses are likely to have better recycling performance than small or medium businesses. Many recycling collection companies find it is not cost effective to provide a service to premises that are small, remote and produce low volumes of material.An ABS survey identified that larger businesses are much more likely to have recycling collections. The number of businesses which claim collections is outlined in Table 19.
Table 19: Recycling or reuse of materials by businesses, by business size (ABS,2010b)
Employment size (persons)
Introduced prior to1 July 2008
Introduced in 2008–09
0–19 16.3% 5.6%20–199 33.7% 11.7%200 or more 48.2% 14.4%Total 17.2% 5.9%
Data from a major survey (1500 businesses) conducted for Melbourne City Council (Sweeney Research, 2011) showed that large businesses are more likely to have a recycling service. Within the Melbourne CBD an estimated 61 per cent of small-to-medium businesses and 94 per cent of large businesses had at least one type of recycling bin. While both these values are higher than the ABS data shown above, the higher level of recycling in larger businesses remains the same.Small businesses often lack either a champion who will drive the introduction and maintenance of a recycling system or a staff member with responsibility for recycling being part of the job description.Recycling collection companies understandably prioritise their sales activity to larger sites. Large waste generating sites will probably be approached by a number of service providers for both general waste and recycling services. Large businesses are generally offered more competitive pricing per cubic metre of waste generated due to economies of scale and the desire for waste collection companies to win contracts with large businesses. Small and medium businesses can be unlikely to be offered recycling collection services. Economies of scale will tend to work against small sites and they may pay a premium over larger sites with higher waste quantities, if they are able to obtain a service at all. The cost models for waste collection companies will consider the costs to fuel a vehicle, pay a driver and cover other overheads such as insurance, based upon collecting a minimum volume of material from a site. Below a certain collection quantity, the cost of the service is not sufficient to build in any profit for the waste collection company. For small to medium waste generators, the mechanisms to support the optimisation of recycling at their site are limited. For example, there are relatively few opportunities for small to medium businesses to aggregate collection volumes between co-located businesses.
Page 113 Encycle Consulting Pty Ltd
6.4.4 Stable markets for recyclate
While it is appreciated that markets for recyclate are not the concern of the C&I sector, the market failures for recyclables cause some of the barriers to recycling relating to the costs of recycling compared to landfill.Waste collection companies act as responsible businesses but currently do not have economic incentives to encourage customers to recycle more. Markets for many recyclate materials are often at the mercy of the vagaries international markets. Local demand for recycled materials is currently low, so markets for recycled products are still ‘boutique’ which translates as unstable and uncompetitive compared to mass-produced products from virgin materials (until the availability of virgin materials becomes substantially challenging causing them to be prohibitively expensive).Stable and efficient markets (particularly Australian markets) for recyclate can assist with providing the basis for the recycling supply chain work effectively. Once better economies of scale for recyclates are achieved, recycled content products are likely to be cost effective and economically sustainable.
6.4.5 Availability of landfilling as an option for readily recyclable materials
Currently there are very few restrictions on the disposal to landfill based on recyclability. Disposal restrictions are widespread and widely accepted and observed for wastes based on hazard. In Europe one of the primary tools for achieving waste diversion for recycling is the use of restrictions on recyclables to landfill. This approach is being taken up in some Australian jurisdictions, notably South Australia. Restrictions on disposal of materials addresses the practice of some businesses choosing to dump large quantities of cardboard and other materials in their bins and skips or directly to landfill. During surveying of businesses for this project those responding were asked if they supported the introduction of such restrictions. The response was overwhelmingly favourable amongst waste generators as it was viewed as a way to make recycling more cost-competitive.
6.5 Better practice waste and recycling
The barriers to waste avoidance and improved recycling are summarised at the start of this Section. Where the barriers identified in this section were largely broken down, good waste avoidance and recycling practices were observed. Positive change for material efficiency appears likely to take place when:
the business considers waste avoidance and recycling to be part of their broader sustainability focus and that a strong emphasis on sustainability is fundamental to their success. This is irrespective of the industry type. Notable examples are: Unilever, Interface, Toyota and Walmart
a champion with sufficient seniority to drive major change is in place the business is large and experienced enough to demand good data reporting and
continual improvement from the waste service provider data is used to monitor and evaluate performance
Page 114 Encycle Consulting Pty Ltd
continual improvement mechanisms are in place (e.g. ISO 14001 Environmental Management Systems)
waste generation and recycling rates are reported externally where businesses have ‘simple’ waste streams, tackling just one or two materials
can achieve good outcomes (e.g. glass and cardboard in small bars) for small to medium businesses, recycling services can be obtained at a cost-
neutral or cheaper service (not necessarily the main driver for large businesses but important for smaller ones where waste can be a more significant consideration in the bottom line)
The opportunities for improved material efficiency (through waste avoidance and recycling) across the C&I sector are discussed in Section 7.
Page 115 Encycle Consulting Pty Ltd
7 Opportunities for improved material efficiencyThe data presented in this report for waste materials generated by the C&I sector highlights some initial conclusions about the opportunities for improving waste management outcomes and reducing costs to business. A relatively small number of businesses were interviewed for this project and this was not designed to provide a coherent sub-sample of all Australian businesses. The findings presented in Sections 3, 4 and 5 are useful indicators of where more research is required.The findings presented in Section 4 indicate that across all industry divisions waste to landfill is mostly composed of:
unused feedstock (particularly MANUFACTURING sub-divisions) unsold product (particularly RETAIL TRADE) ‘wastage’ from incorrect processing/other work errors e.g. manufacturing process
errors leading to unsalable product, unnecessary printing, etc. inefficient or out-dated (wasteful) procedures e.g. heavy reliance on printed
filing/invoicing used packaging broken or out-dated equipment single use or ‘disposable’ items e.g. office stationary, plastic cups, health care
items.
7.1 Opportunities to manage waste streams better
Section 6 outlines the key barriers to good waste management for business which are grouped as:
cost issues corporate culture and process issues waste collection method issues.
7.1.1 Policy drivers for material efficiency
There are clearly changes that can be driven at a government level to send clear signals to the waste industry and their customers that landfill is a least preferred option such as:
supporting the markets for recycled products making disposal to landfill difficult through legislation and/or price signals.
In order to create good policy, the Commonwealth Government needs to have relevant and meaningful data for each of the jurisdictions. Data is currently collected at the jurisdiction level, in different formats and sometimes using different definitions for waste streams or disposal routes. Current national data is difficult to compare across jurisdictions and lacks detail in some key areas, most notably the C&I sector.
7.1.2 Business opportunities to improve material efficiency
Businesses need to be made more aware of the opportunities and benefits of good waste management systems. As discussed in Section 6, businesses seldom have a good
Page 116 Encycle Consulting Pty Ltd
understanding of their waste stream and are not necessarily engaged in greater avoidance and better recycling of waste. For C&I waste to be reduced and recycled, it needs to:
be recognised by business leaders as having an impact upon their business be measured and managed within each business have consistent price signals from the market so that the waste management
option reflects its environmental impact.
Fundamentally, waste avoidance and recycling need to be driven by government through economic drivers and other policy tools to provide businesses with the framework for improved performance.
7.1.3 Waste avoidance
Waste avoidance is the “hidden win” for many companies. There is a broad general appreciation of the potential savings from avoiding waste (including reduced purchase of the product and reduced staff time in handling and distributing the product). However, it is often difficult to quantify the true impacts of waste avoidance and hence it is not often driven within businesses to the highest degree possible.There are many opportunities for waste avoidance for businesses. Although the exact mechanisms for waste avoidance are often specific to each business, some common ideas are provided here although there will be many others that will broadly apply. The areas of the waste stream that are likely to represent opportunities for avoidance include:
updating (manufacturing) processes to be more efficient and accurate updating internal processes and staff engagement e.g. electronic filing, electronic
invoicing, HR forms refining ordering processes to produce less waste placing increasing pressure on suppliers to provide reusable packaging or to
remove and recycle packaging replacing disposable items with reusable ones engaging staff and creating a culture of correct disposal and waste avoidance
driven by senior management.
7.1.4 Recycling/resource recovery
Many businesses have the ability to produce relatively clean waste streams that can be separated for recycling relatively easily (compared to say, municipal waste). Common C&I single material streams collected for recycling include:
cardboard packaging office paper soft plastic film packaging container glass (from licensed premises) glass, plastic and aluminium drinks containers (from public places, institutions
and food service locations) timber pallets metals (often high recycling rate as strong economic driver).
Page 117 Encycle Consulting Pty Ltd
Opportunities for greater recycling are: measurement and evaluation of recycling performance and generation rates
within businesses (to identify inefficiencies and opportunities) implementing continual improvement mechanisms switching to ordering of recyclable materials for disposable products collection of waste streams that are not currently ‘standard’ to recycle (or
recover) e.g. food waste and textiles local collaboration between small businesses to collate recyclables using specific points in the supply chain to collate materials for recycling (e.g.
warehousing) identifying opportunities for industrial symbiosis i.e. trading a by-product or waste
with neighbouring industries that would require the material as a feedstockBusinesses are unlikely to be able to (or want to) tackle all of the areas for potential waste avoidance and greater recycling at once. The most successful approach for businesses is to implement a continual improvement process though an environmental management system (EMS). Many businesses establish environmental committees to drive continual improvement, with at least one member of the senior management team championing the process. Success in achieving long-term environmental benefits through better waste management is nearly always underpinned by feedback loop which is broadly:
The ISO 14000 EMS standards calls this cycle the “plan, do, check, act” model (see www.iso.org).
7.1.5 Opportunities for waste collection to drive material efficiency
Waste collection methods are described in Section 3 and discussed in more detail in Section 5.The methods of collection and the responses of waste management companies to the often unstable and complex markets for recyclable materials can create problems. Waste management companies are often somewhat conflicted in terms of needing to remain efficient and profitable as a business while trying to encourage customers to ‘do the right thing’ to meet market expectations of environmental responsibility.
7.2 Policy drivers for material efficiency
7.2.1 Markets for recycled materials
Recycling operates as part of a supply chain from waste generator, through collection, reprocessing (often more than one stage) to returning to the manufacturing processes as feedstock.Looking at the waste material profile for many industry divisions, the dominant materials generated are often those that are both technically recyclable and also possess good market prospects for the sale of recyclate. Paper and cardboard and metals all currently have good market opportunities.
The supply chain picture for recycling of plastics, glass and timber varies across the jurisdictions. Timber generally has local markets for feedstock while plastics and glass can be more prone to compete on international markets and market demand for recyclate can fluctuate and be unstable. Where markets are inconsistent or poor for recyclate, the economic drivers for recover it will be weak i.e. it is not necessarily much cheaper for the waste generator to recycle the material than to dispose of it to landfill.Australian markets for some recyclate materials are poor, in part due to perceptions about lack of quality or being otherwise inappropriate as a feedstock. Low demand for recycled content products or recyclate as feedstock will reduce the value and acceptance of recyclate in the market place. Weak markets for recyclate can prove to be a significant barrier to creating stable recyclate supply chains that are economically effective. Stable and strong markets for recycled materials are needed to support effective recycling throughout the supply chain.Recommendation 1: develop local markets for recycled productsAn investigation into relevant policy tools to drive local markets for recycled content products is needed to stabilise demand and recyclate commodity price. Investigating and supporting local markets for recyclate will require:
addressing legislative and perception barriers to using recycled content products
producing ‘AS’ standards that include recycled materials
researching innovative uses for recycled materials to replace virgin feedstock
introducing specification of recycled content products into government purchasing policies.
7.2.2 Discouraging landfill
Section 6.4 discusses the issue of the ease of disposing of recyclable materials to landfill. Price signals through landfill levies are quite blunt instruments applied at the jurisdiction level. Landfill levies can be contentious and are only one tool for discouraging landfill. Another policy tool for avoiding disposal of waste to landfill is to impose restrictions on the types of material accepted by landfills. Targeting landfill acceptance criteria will only work where there are alternative markets for the material. Landfill restrictions can be effective where recycling industries are struggling to obtain feedstock.
Recommendation 2: explore policy tools to restrict landfilling of recyclablesIt remains easy for waste generators and collection service providers to dispose of readily recyclable materials to landfill. Governments should explore the introduction of restrictions on the landfilling of recyclables. There is significant experience internationally in restricting landfilling of specific materials or products.
7.2.3 Measurement and reporting of C&I waste by government
For many years local and state government has tracked and reported on household waste generation and recovery. In the construction and demolition sector there is a high level of understanding and data reporting which is possible due to the relatively small number of companies operating in this area and also due to the definition of this sector as a separate waste stream.
Page 119 Encycle Consulting Pty Ltd
Some state agencies are now more actively seeking a better framework for measuring and reporting on C&I waste outcomes. Beyond the findings of this project, NSW generates good data from its Bin Trim program and Victoria has now embarked on a project to measure C&I waste more consistently. Some existing mandatory reporting programs currently seek some waste information but this is not reported or widely available within government. The Victorian EREP (Environment and Resource Efficiency Plans) program is an example. At the sub-division level it is be important to monitor waste and recycling activity and obtain a better understanding in order to prioritise government program and funding efforts. Obtaining good data from the C&I sector is challenging may require legislative changes. The National Waste Policy implementation process already recognises the importance of improved waste data collection Recommendation 3: improve measurement and reporting of C&I waste and recycling Develop a coordinated effort in measuring and reporting of C&I waste outcomes including consideration of mandatory reporting where appropriate. Models for better data collection may be identified through work underway under the National Waste Policy implementation process.
7.3 Business opportunities for material efficiency
Businesses that were performing well in terms of low waste generation rates and good recycling systems had the internal commitment from senior management and recognised that good waste management was an opportunity to improve business efficiency and support the company profile as a market leader. In particular, where businesses recycle well and are committed to improving waste management, the key drivers that were cited were:
improving their image as a market leader in sustainability practices improving health and safety of the workplace reducing staff, tenant or customer complaints about odour or unsightliness improving staff engagement and staff loyalty overarching commitments to sustainability or corporate social responsibility reducing costs.
It is interesting that generally businesses interviewed during this project did not list cost as a key driver for improving their waste stream although it was generally clear that the long term business case for material efficiency was needed to enable change to happen. Some businesses accepted that not all recycling options were necessarily cheaper than landfill (e.g. fluorescent tubes), but saw recycling as part of their corporate social responsibility agenda and to add value to the business in terms of the profile and values of their ‘brand’.
7.3.1 Measurement and reporting of C&I waste by business
Without ongoing monitoring and evaluation, C&I waste and recycling performance will not improve significantly. Governments require better data to develop good policies. More importantly, businesses should be encouraged to manage their own monitoring and evaluation systems. Waste is notoriously difficult to measure and analyse (compared to say energy or water use which can be obtained from invoices).
Page 120 Encycle Consulting Pty Ltd
Currently, it is generally only the industry market leaders that have good systems for continual improvement of waste performance. In the best practice examples, businesses monitor, evaluate, report regularly, set clear targets and conduct regular reviews as part of a continual improvement process.Many businesses receive some information from their waste collection company and may even collect waste data in-house. However, waste invoices do not always report data in a format that is readily interpreted and different service providers will report in different units (bin-lifts, total volumes, and total tonnages) probably over different timeframes. Inaccessible datasets mean that recycling performance is often not evaluated or reported.Data is collected by waste collection companies in a variety of formats, resulting in a range of accuracies. Waste collection companies measure waste collection quantities by:
number of bin lifts; applying average bin weights and assuming 100% full bins weight, using scales on the vehicle lift arm estimating the percentage of material contributed by each customer to the full
vehicle at the weighbridge. The method of measurement used by the waste collection company has a significant impact upon the reported quantity of waste collected. Many waste collection companies count the number of bin lifts as this is more relevant as a charging mechanism. However, the number of bin lifts is a highly inaccurate measure of actual weight of waste collected.Weighing equipment fitted directly to the vehicle and often relaying data directly to an on-board computer can be an accurate mechanism for measuring waste disposal. Internationally, specific ‘pay as you throw’ systems used for municipal waste, can use accurate vehicle scales to record the waste presented for collection by each household. Weighing systems on the vehicles are often used in conjunction with radio frequency identification (RFID) ‘chips’ in the bin. Accurate waste measurement is achievable with vehicle weighing equipment. However, the accuracy of vehicle scales can vary depending upon the equipment and the care taken in calibrating the system. Since measurement of waste quantities by waste collection companies is used primarily for invoicing purposes, there is not necessarily a strong driver for them to collect or provide accurate data to the customer.Recommendation 4: improve measurement and reporting of C&I waste and recycling within each businessProvide guidance to industry to assist with requiring data to be provided from their collection companies in a meaningful format.
Assistance is also required with waste management planning, target setting and understanding waste performance measures e.g. percentage recycling rates or waste generation per EFTE.
7.3.2 Waste stream assessments
Many businesses believe that they need to undertake ‘waste audits’ (compositional analyses of the waste stream) in order to understand their waste stream and develop a waste management plan. Compositional audits are often excessively detailed and
Page 121 Encycle Consulting Pty Ltd
expensive to conduct. Ultimately, few businesses actually undertake physical sort waste audits (particularly small businesses). Businesses which believe they require a physical sort waste audit but cannot justify the expenditure required will often fail to continue to improve waste management and possibly focus on another aspect of their sustainability program. Companies wishing to improve current waste management practices are likely to need information such as:
expenditure on waste overall quantities of waste and recycling generated identification of opportunities for greater recycling at their site.
Much of the information listed above could mostly be obtained from a desktop review of invoices or dockets and a brief visual assessment of their waste bins. In addition to waste and cost data, general information that would assist businesses to improve upon current waste management practices includes:
staff knowledge and attitudes to waste management bin store management effectiveness operational barriers to better waste management information on avoidance opportunities links to recycling service providers health and safety risks relevant to their site.
In fact, a physical sort waste audit is often not the best means of obtaining the data and information required by a business to meaningfully understand and plan for improvement. Waste audits (compositional analyses) provide detail about the waste stream composition but only for a snapshot in time and often to a level of detail that is not necessarily required. Physical waste audits are generally labour intensive, require special weighing equipment, carry health and safety risks (e.g. risk of needle-stick injuries), are complex to plan and consequently are quite expensive to do.A waste assessment may be sufficient to understand a business’ waste stream. A waste assessment would involve a desktop investigation of generation using invoices, a site visit, visual assessments of waste, interviews with staff, and liaison with the waste collection company. The broad waste assessment approach can provide relevant and useful information about the way that waste is currently managed and where opportunities for improvement might lie.
Recommendation 5: support simplified waste assessments for business as a means to continual improvementEncourage companies to assess their waste costs and quantities. A ‘demystifying’ of waste data and encouragement to use physical waste audits (compositional analysis) only in specific situations is required.
Waste collection companies are a critical source of waste data for business but need to provide data in a meaningful format. Data can be provided in a meaningful format if businesses are encouraged to request specific datasets from their waste collection company
State and local government could distribute a simplified waste assessment template and advice on measures for avoidance and recycling opportunities. Alternatively government may wish to retain agents who can assist businesses with waste assessments and introduction of waste avoidance measures in a low cost manner.
Page 122 Encycle Consulting Pty Ltd
7.3.3 Updating manufacturing processes
Many manufacturers are conscious of not wasting materials and ensuring that their processes are efficient. That said, it is likely that there are significant opportunities for reducing waste generation in manufacturing processes. There are many case studies (e.g. projects run through the Australian Packaging Covenant) which have demonstrated that opportunities to reduce manufacturing materials waste still exist.Undertaking simple mass flows combines with audits (even visual) provides opportunities to identify where purchase of materials can be reduced and potentially where off-cuts can be recycled back into the process.Cost of waste disposal is often not significant enough to drive consideration of this research and government intervention may be needed to assist.Good practice is to identify key waste streams and set targets for waste avoidance, then establish a plan for implementation e.g. Unilever targeting zero waste in UK manufacturing plants (www.unilever.com), Interface’s ‘Mission Zero’ strategy (www.interfaceflor.com.au).
Recommendation 6: manage processes better to avoid wasteEstablish programs that will assist businesses, particularly manufacturing industries to reduce processing wastes through understanding the flow of materials through their organisation better.
7.3.4 Calculate the full cost of waste
In Section 5, there is a discussion about the full costs of waste to business, including the costs of feedstock materials that are ultimately destined for landfill. Many businesses recognise that there are costs associated with unnecessary generation of waste but are unaware of the magnitude of these costs. Carpet tile manufacturer Interface has been targeting a Zero Waste ideal since 1994 and to date has achieved cumulative savings of over US$107 million5.More research is needed to look at the other costs of poor waste management to business such as health and safety incidents, staff time inefficiency, impact upon corporate culture and reduced staff loyalty and unnecessary storage and handling of materials.
Recommendation 7: drive waste avoidance through better understanding of full costsFocus C&I programs on avoidance of waste through better ordering, inventory control and internal systems and processes that may have inherently wasteful outcomes.
Engage with relevant staff within businesses to enable them to understand the full cost of waste taking account of input costs.
7.3.5 Updating internal processes and staff engagement
In most industry divisions, waste avoidance (or lack of) appeared to be a function of business systems and procedures staff culture and behaviour (habits).
As an example, paper wastage is discussed here as all industries produce paper waste to some extent (particularly in the office environment). Often C&I waste is assumed to be dominated by wastes arising from manufacturing processes. While this is certainly a major fraction of the waste stream, other wastes such as freight packaging and office paper wastes are also showing up as significant.The consumption of paper in office-based industries is a key issue. The increasing use of electronic means of communication should be expected to result in reduced office paper usage if implemented well. However, many organisations including government agencies still rely on paper-based systems and this can often mean printing e-mails for filing. To date, there has been very little information gathered on trends in office paper use. Some large office-based organisations in the FINANCIAL AND INSURANCE SERVICES industry are starting to address wasteful habits (e.g. switching printers to automatic double-sided printing) although this is still not standard and many businesses still generate significant quantities of paper. The increasing level of recycling of this material has sometimes masked the importance of avoiding the waste of paper. As the cost of office paper is generally between $1 500 and $2 000 tonne, this is probably an area for specific analysis and attention.Avoiding paper waste is likely to be possible though various opportunities, including:
switching printers to default to double sided printing implement electronic procedures where paper-based ones currently exist e.g.
invoicing, HR forms, filing, provision of letters/statements to customers engaging staff in the development of a printing policy including type of printing
and defining the necessity of printing.
Recommendation 8: engage and empower staff to avoid waste and recycleActively engage with waste generating site operators to ensure they understand the range of recycling opportunities available and how to avail themselves of these.
Businesses need to actively engage with and empower all staff to understand their role in minimising waste generation and recycling as much as possible.
Changing systems and processes is part of the solution but without awareness and behaviour change, company’s recycling and waste avoidance goals will only ever be partly achieved.
7.3.6 Take back arrangements with suppliers
There is some existing practice of returning product or packaging back to the supplier. This can be practiced in informal arrangements for packaging. Cardboard, timber and soft plastics in the C&I waste stream are often from single-use freight packaging and
Page 124 Encycle Consulting Pty Ltd
have many opportunities for better recycling through supply-chain collation (e.g. at wholesalers). A few industries can take advantage of take-back services for unsold product although it is not clear whether this material is sent for recycling or not as this is a competitive tool in the market place to encourage outlets to stock a particular product.Some suppliers offer a take back service for end of life product where there is an economic and/or environmental driver to recycling their product e.g. computers and carpet tiles.The benefit of take-back arrangements is that it aggregates materials in higher volumes at fewer sites. This is crucial for cost efficient collections. As an example, a wholesaler may supply 100 cafes with crates of milk. They are calling at each site daily and arrangements are made for empty bottles to be returned in crates. Instead of requiring a collection vehicle to call at each retail site and then subsequent sorting, a supplier has a uniform material that can be baled efficiently on site. Take back arrangements not only work for recycling but can also involve reuse. A pharmacy chain for instance, could collect and reuse cardboard boxes in a cycle with its supply outlets. When faced with large disposal charges on drums, many manufacturers are insisting that their supplier takes back their packaging. This return to supplier activity sits alongside resurgence in the use of reusable crates and other freight packaging. The crates now widely used by supermarkets for fresh produce are now being used by other produce outlets. The supermarkets are now extending their application to other lines such as soft drink. Retail outlets are finding the back loading of reusable packaging more convenient than dealing with handling single use freight packaging onsite. Some large logistics companies are interested in expanding their reverse logistics activity to enable efficient recovery of product for reuse and recycling. There is now increased interest in whether the return to supplier trend for packaging can extend to product waste. An example is the widespread interest from cafes in a method to deal with coffee grounds. It is not practical for each coffee retail outlet to deal with spent coffee grounds but a return to supplier arrangement could consolidate a volume of grounds where a food waste processing outlet can be utilised. By contrast it would be impractical to introduce an organics collection for coffee grounds across the many small café outlets.In the Food and Beverage Services sector, milk bottles are now more regularly returned through supplier collection and this aggregates the HDPE material in a handful of sites rather than the many retail outlets. Retailers wanting to find an opportunity for recovery of coffee grounds are now considering a similar supplier return route as the most efficient form of collection and aggregation to commercially viable volumes.Recommendation 9: encourage supplier take-back for reuse or recyclingEncourage and expand supplier take-back systems. Initially, supplier take-back improvements could focus on the potential for larger scale adoption of reusable freight packaging utilising crates, stillages and drums. Large businesses often have the power to drive significant change from their suppliers and can be encouraged to drive better supplier take-back and recycling /reuse practices.
Further investigation is required into potential opportunities for supplier return routes for the aggregation of recyclables and that this should be linked to both packaging and product wastes.
Page 125 Encycle Consulting Pty Ltd
7.3.7 Swapping disposable for reusable packaging and products
There is a degree of reliance upon disposable items, particularly relating to packaging or within divisions selling food products.Opportunities for avoidance of waste can be generated from replacing disposable items with reusable ones (e.g. water cups and reusable packaging6). Many disposable items are currently made from materials that are not always easy to recycle (e.g. polystyrene cups). Where waste cannot be avoided altogether through introducing a reuse option, the disposable item can be replaced one made from materials that are recycled more easily (e.g. cups made from PET or PP plastic). Recyclable plastics are generally those that have a higher value compared to other plastic types. Inherently, more recyclable products are more expensive to purchase than less recyclable ones.Recommendation 10: businesses to move to recyclable or reusable rather than ‘disposable’Assist businesses to avoid waste from their organisation through reducing their reliance upon disposable items using case studies and guidelines.
7.3.8 Recycling more of the ‘standard’ recyclables
The C&I waste stream, while diverse in nature, tends to generate significant quantities of single material streams. These wastes can be readily recycled as the material streams can be relatively clean and easy to separate at source. Economies of scale can often arise where a smaller number of sites generate a larger and more uniform waste profile for some materials (e.g. cardboard or timber packaging) than exists for households. The sites for C&I waste generation are generally fixed (i.e. not temporary) which should be an advantage over other sectors such as construction and demolition waste management. Recycling standard material generated from core business operations is relatively straightforward. Within the C&I waste data, there appeared to be two sets of material generated from sites across all industrial divisions. The waste streams are dominated by the relatively consistent quantities of material generated from conducting core business. Nearly all business experiences some seasonal variation relating to demand for their services. Seasonality did not generally cause major concerns for the recyclers or waste management companies, particularly where the trends were predictable and could be managed. Seasonality of C&I waste data are not generally any greater than the proportional variations seen in the municipal waste stream. A second waste stream generated from industry related to ad hoc event such as clear outs, changes in production processes or removal of out of date stock. Some businesses found that the communication between the relevant parts of the business was not always sufficient to organise for ad hoc waste material to be recycled, even if the material was readily recyclable. In some instances skip bins were ordered from within departments rather than through the facilities management team or the communication about a forthcoming need came too late to arrange for the best management system to be applied. For example, mixing garden centre waste clear-outs together contaminates potentially recyclable items such as plant pots, timber, paper or other recyclables with soil and organic waste.
6 Examples of reusable packaging options can be seen at reusables.org
Page 126 Encycle Consulting Pty Ltd
Despite relative ease of removing single material streams, the results in Section 4 of this report show that significant quantities of ‘standard’ recyclables are still lost to landfill.Across all states and territories, the cost of sending material for recycling relative to the cost of landfill varies but is often either similar or much cheaper. Those recyclables that trade on global markets are subject to varying commodity values as supply and demand change (e.g. cardboard, paper, plastics and metals). The value of commodities such as cardboard can generally mean that cost-neutral services or rebates are routinely available. When commodity values fall, rebates may not be available in the short to medium term which will result in the waste generator reverting to sending the material to landfill as this becomes the lowest cost option.Materials which are commonly recycled but still appear to be lost to landfill in large quantities include:
Cardboard, soft plastic and timber packaging Large companies can place pressure on suppliers to find reduced, reusable or more recyclable packaging options and implement take-back systems.Small businesses need to investigate recycling options and become better informed about the ways to recycle more and probably save money at the same time. For instance, many small businesses do not recycle materials such as cardboard, even though if they produce reasonable volumes, they may well be able to receive a cost-neutral service or even a rebate for the material.
Copy paper and drinks containersAll businesses generate paper and drinks container waste which are often easy to recycle and in most parts of Australia paper and commingled recycling collections are available to deal with these materials.
Recommendation 11: advocate for recycling more materials, more oftenApply sufficient programs and funding strategically to C&I waste avoidance and recycling to ensure the ‘low hanging fruit’ in this sector are dealt with.
7.3.9 Recycling ‘non-standard’ materials
C&I waste is often the source of large quantities of specific waste streams that can be recycled but are not being separated from general waste due to poorly established mechanisms for recycling and lack of knowledge about recycling opportunities. It is not always in the interest of waste collection companies to educate their customers about other disposal routes since they may lose the business for that material. Large businesses are in a position to drive better recycling and exploration of new routes to recycle. It is generally only those businesses who consider themselves market leaders for their sustainability practices who will make the effort to establish new recycling systems. Some materials that are only recycled on an ad hoc basis currently include:
food organics textiles and leather
Page 127 Encycle Consulting Pty Ltd
plastics.
Opportunities for recycling ‘non-standard’ materials include Collaboration between small businesses (discussed in Section 7.4.2) Education about local recycling opportunities Industrial symbiosis— turning waste streams into feedstock (discussed in Section
7.4.3)
7.3.10 Food organics diversion from landfill
Organic material can be separated from the waste stream for composting or other treatment from Food Manufacturing, Food Retail and Food and Beverage Service industries where it is a high proportion of the waste stream. Unlike the diversion from landfill of metals, paper and cardboard, food waste is a harder material to divert for recycling. Part of the reason for this is there is not adequate infrastructure to process all of the material potentially available for processing. The material value can be very low in many areas of Australia and difficulties in on-site handling, storage and in collection also add to the challenge for effective processing of food organics. Many food service sites are aware of food waste generation but either do not know where to recycle or are unable to recycle this waste fraction.Food waste in the Food Retail and Food and Beverage Service sub-divisions accounts for over half of the general waste stream. There is a significant volume of organic material that can be recovered from the C&I waste stream by focusing on these divisions.The Food Manufacturing sub-division is likely to produce relatively uncontaminated food waste streams and recovery is already generally good.There are several options for removal of food waste which include:
1. “food rescue” organisations that redistribute edible food to low-income households (see more discussion in sub-section below)
2. off-site composting (or other organics recovery mechanism). This is often considered to be more difficult for smaller businesses than larger ones but ‘boutique’ composting services can be available for small organisations (e.g. Organic Waste Solutions in WA)Large sites are starting look investigate technologies such as vacuum pipes to remove food organics directly from the kitchen to a storage tanker which minimises handling, removes putrescible material from the general waste and provides an easy recovery solution (waste is suctioned into a tanker in the same way as grease trap waste is)
3. on-site composting (or vermiculture/other solution). Many businesses indicated that they did not have the time, staff or expertise to compost on site although there are a ad hoc few instances of this happening (e.g. both worm farms and Biobin composters are used on-site at Adelaide Convention Centre)
4. on-site technologies such as dehydration-sterilisation (e.g. GaiaRecycle, EcoVim). These technologies significantly reduce the volume of material and produce a sterile product. This is often popular in remote locations or large sites where transporting bins filled with food waste around the site can be a problem
Page 128 Encycle Consulting Pty Ltd
Discussions with businesses considering or having already implemented these technologies showed that neither environmental credentials, nor costs of disposal were the key drivers for these systems. Food waste is often removed from the general waste stream for dehydration-sterilisation in order to: reduce manual handling of heavy, smelly bins (health and safety risks, staff time and
limiting visual impact of bins on their site – particularly restaurants) cut down on space in the bin store (material is treated close to kitchen) reduce vermin and other health risks from storage and handling of food waste.Environmental considerations and cost savings appear to be mostly considered as an additional bonus to implementation of these systems.There are a wide range of markets for compost and soil amendment products across the country, depending upon local industry and the quality of local soils. The benefits of quality compost are not always well understood in the market place and competition from other products impact upon the feasibility of production.Recommendation 12: target food waste from the food retail and service industriesDevelop guidance material for businesses in Food Retail and Food and Beverage Services sub-divisions to develop and implement strategies for separating food waste from their general waste stream for either on-site or off-site treatment.
Further research is needed to identify best practice mechanisms for removing food waste from the general C&I waste stream.
Further research is needed to understand the reprocessing capacity of organic material in the major cities and the options for increasing capacity or sending C&I food organics to municipal reprocessing facilities.
7.3.11 Food “rescue”
Diverting surplus food back for human consumption has grown strongly in most capital cities in recent years. Organisations such as Fareshare, Oz Harvest, Food Rescue and Second Bite are expanding their rescue of food to the limits of their capacity to place the food with charities. Despite this effort, food rescue currently only diverts a small proportion of food waste from manufacturing and an even smaller amount from retail businesses. Despite willingness by both parties, less than a quarter of supermarket stores are involved in any food rescue.Good Samaritan legislation has been introduced in some jurisdictions which give legal protection to charities who handle second hand goods. It is needed to offset the barrier (whether real or perceived) of the legality of disposing of food for human consumption and associated potential health and safety issues. One emerging issue is that the outlets for rescued food may become fully supplied. At this time there may need to be other outlets developed beyond supplying food only to welfare agencies. This could include sales to low income households.Recommendation 13: support food waste avoidance programs through food ‘rescue’Give food waste avoidance programs priority and facilitate food rescue.
Page 129 Encycle Consulting Pty Ltd
7.4 Opportunities for improving waste collection to drive material efficiency
7.4.1 Local government servicing of small businesses
Local government servicing can offer a cost effective way to expand C&I recycling. However, effective recycling from C&I by local government will only work well if the service includes a suitable mechanism for recycling. Many local governments offer exactly the same service to industry as they do to householders (e.g. 240 L wheelie bins for waste and recycling) which is not necessarily suitable for C&I waste; for instance, C&I waste often contains significant quantities of cardboard.Servicing of small businesses by local government is currently very much at the discretion of the local government. Local governments provide municipal waste services to their local community; they are not in the ‘business’ of waste management and do not try to compete with private waste service providers. There is an opportunity to boost recovery of recyclable material in a cost-effective manner by extending local government kerbside services to ratepayer small businesses and community organisations.Figure 10 provides useful information on local government combination of servicing for small, medium and large sites including the appropriate local government role.
Page 130 Encycle Consulting Pty Ltd
Figure 10: Recommended servicing profile for small, medium and large businesses
Page 131 Encycle Consulting Pty Ltd
7.4.2 Small business collaboration
Small businesses can sometimes find that they do not generate sufficient consistent volumes of a recyclable material to make it feasible for waste collection companies to offer a separate recycling collection service.A recycling service for a common material (e.g. cardboard) may be feasible, if several small businesses collected the material at a common location and used one service provider.Some small businesses (particularly at industrial estates) have trialled collaboration with other local businesses to collect greater, more economically viable quantities of materials. An area needs to be identified that is accessible to all businesses where bins can be stored. One business will generally need to take ownership of the system, which mainly means receiving the invoices and arranging to recoup costs from the other businesses. There are a few barriers which need to be addresses for the collaboration system to work well:
The ‘lead’ business (who organises billing) will need to be prepared to take on the responsibility and admin of the service.
Other cooperating businesses need to be reliable in paying for their share of the service.
The recycling streams collected would need to be common to all sites involved (cardboard is often a common material generated irrespective of business type).
The recycling streams would need to be generated in similar quantities or businesses would need to be able to agree a fair system of sharing the costs.
The location of the collection bins needs to be readily accessible to all businesses and to the collection vehicle.
The location of the collection bins needs to be in a locked yard or otherwise inaccessible to passers-by. Several recyclers reported problems with vandalism of collection areas (e.g. fires).
Collaboration of small businesses may be coordinated via the relevant local government. Some small businesses are working to co-collect various waste streams such as: food, cardboard, commingled recyclables by using common areas. There can be issues with use of common areas relating to local government legislation about the area not being designated as a licensed transfer station.Recommendation 14: remove barriers and encourage local collaboration for recyclingAssist SME recycling through an active program of facilitation to build more comprehensive recycling systems at SME sites. Examples might include guidelines for establishing ‘mini transfer stations’ at common areas for SMEs and extending recycling collections to SME sites.
Local government will need to be engaged to assist with establishing ‘mini-transfer stations’ and to ensure that local regulations are not a barrier to successful recycling collaboration.
Page 132 Encycle Consulting Pty Ltd
7.4.3 Industrial symbiosis
Industrial businesses can often produce large quantities of a relatively clean waste stream. Programs overseas (e.g. UK, Europe, USA) and to some extent within Australia have identified that significant cost savings and landfill reduction can be achieved if complementary businesses can be identified who could use a ‘waste stream’ as their feedstock.Disincentives to undertake industrial symbiosis include:
the potentially high transport costs where there are long distances between complementary businesses
concerns about the confidentiality of commercially sensitive information and concerns about reliability of feedstock supply.
In Australia, there are currently no established large-scale intermediaries to facilitate the process of finding suitable market partners for waste re-use. In Western Australia, the Kwinana Industrial Area through collaboration with Curtin University and using the Kwinana Industries Council as a forum for bringing potential partners together7. The National Industrial Symbiosis Programme (NISP) in UK coordinates between geographically adjacent companies to identify potential trades in ‘waste’ to provide feedstock for other businesses. Some case studies of projects completed by NISP show that solutions may be innovative and identify different materials to substitute other virgin products. One NISP case study is about a project to use shredded tyres as fill material. Innovative industrial symbiosis projects rely upon the ability to use recyclate to meet the standard appropriate to the end use.Recommendation 15: investigate industrial symbiosisApply policy tools and programs strategically to support and drive innovative use of waste streams as potential feedstock for other business processes.
In many cases, industrial symbiosis programmes are responsible for leveraging funding from industry to invest in technology and infrastructure.
7.5 Summary of materials efficiency opportunities and recommendations
Improving material efficiency (though waste avoidance and greater recycling) from the C&I sector requires organisations to each take the lead to implement internal system changes and actively manage their waste streams (from point of production through to end disposal or recycler). For C&I waste to be reduced and recycled by businesses, it needs to:
be recognised by business leaders as having an impact upon their business be measured and managed within each business have consistent price signals from the market so that the waste management
option reflects its environmental impact.World leading businesses have begun to implement their own solutions to waste generation and disposal, but for the majority of the C&I sector to implement change, governments (Federal and State) need to demonstrate clear policy direction and act directly to:
support the markets for recycled products make disposal to landfill difficult through legislation and/or price signals.
In order to create good policy, the Commonwealth Government needs to have relevant and meaningful data for each of the jurisdictions. Robust data for C&I waste is difficult to obtain but not impossible and improvements in data collection are critical to underpin decisions and actions on waste policy at a national level.In particular, the three barrier areas that need to be tackled are:
cost issues corporate culture and process issues waste collection and disposal issues.
Table 20 provides a summary of the 15 recommendations listed in this section. The recommendations have been given a general ranking for relative importance (in terms of potential impact upon the C&I waste stream) and ease of implementation for the organisation responsible.
Page 134 Encycle Consulting Pty Ltd
Table 20: Summary of recommendations for greater material efficiency in the C&I sector
Recommendation and discussion Importance Ease
Policy drivers for material efficiency
Recommendation 1: develop local markets for recycled products Medium Difficult
An investigation into relevant policy tools to drive local markets for recycled content products is needed to stabilise demand and recyclate commodity price. Investigating and supporting local markets for recyclate will require:
addressing legislative and perception barriers to using recycled content products
producing ‘AS’ standards that include recycled materials
researching innovative uses for recycled materials to replace virgin feedstock
introducing specification of recycled content products into government purchasing policies.
Recommendation 2: explore policy tools to restrict landfilling of recyclables
Medium Difficult
It remains easy for waste generators and collection service providers to dispose of readily recyclable materials to landfill. Governments should explore the introduction of restrictions on the landfilling of recyclables. There is significant experience internationally in restricting landfilling of specific materials or products.
Recommendation 3: improve measurement and reporting of C&I waste and recycling
Medium Medium
Develop a coordinated effort in measuring and reporting of C&I waste outcomes including consideration of mandatory reporting where appropriate. Models for better data collection may be identified through work underway under the National Waste Policy implementation process.
Page 135 Encycle Consulting Pty Ltd
Recommendation and discussion Importance Ease
Business opportunities for material efficiency
Recommendation 4: improve measurement and reporting of C&I waste and recycling within each business
Medium Medium
Provide guidance to industry to assist with requiring data to be provided from their collection companies in a meaningful format.
Assistance is also required with waste management planning, target setting and understanding waste performance measures e.g. percentage recycling rates or waste generation per EFTE.
Waste collection companies are a critical source of waste data for business but need to provide data in a meaningful format. Data can be provided in a meaningful format if businesses are encouraged to request specific datasets from their waste collection company.
Recommendation 5: support simplified waste assessments for business as a means to continual improvement
Medium Easy
Encourage companies to assess their waste costs and quantities. A ‘demystifying’ of waste data and encouragement to use physical waste audits (compositional analysis) only in specific situations is required.
State and local government could distribute a simplified waste assessment template and advice on measures for avoidance and recycling opportunities. Alternatively government may wish to retain agents who can assist businesses with waste assessments and introduction of waste avoidance measures in a low cost manner.
Recommendation 6: manage processes better to avoid waste
Medium Medium
Establish programs that will assist businesses, particularly manufacturing industries to reduce processing wastes through understanding the flow of materials through their organisation better.
Recommendation 7: drive waste avoidance through better understanding of full costs
High Medium
Page 136 Encycle Consulting Pty Ltd
Recommendation and discussion Importance Ease
Focus C&I programs on avoidance of waste through better ordering, inventory control and internal systems and processes that may have inherently wasteful outcomes.
Engage with relevant staff within businesses to enable them to understand the full cost of waste taking account of input costs.
Recommendation 8: engage and empower staff to avoid waste and recycle
High Medium
Actively engage with waste generating site operators to ensure they understand the range of recycling opportunities available and how to avail themselves of these.
Businesses need to actively engage with, and empower all staff to understand their role in minimising waste generation and recycling as much as possible.
Changing systems and processes is part of the solution but without awareness and behaviour change, company’s recycling and waste avoidance goals will only ever be partly achieved.
Recommendation 9: encourage supplier take-back for reuse or recycling
High Medium
Encourage and expand supplier take-back systems. Initially, supplier take-back improvements could focus on the potential for larger scale adoption of reusable freight packaging utilising crates, stillages and drums. Large businesses often have the power to drive significant change from their suppliers and can be encouraged to drive better supplier take-back and recycling /reuse practices.
Further investigation is required into potential opportunities for supplier return routes for the aggregation of recyclables and that this should be linked to both packaging and product wastes.
Recommendation 10: businesses to move to recyclable or reusable rather than ‘disposable’
Low Easy
Assist businesses to avoid waste from their organisation through reducing their reliance upon disposable items using case studies and guidelines.
Recommendation 11: advocate for recycling more materials, more often
High Medium
Apply sufficient programs and funding strategically to C&I waste avoidance and recycling to ensure the ‘low hanging fruit’ in this sector are dealt with.
Page 137 Encycle Consulting Pty Ltd
Recommendation and discussion Importance Ease
Recommendation 12: target food waste from the food retail and service industries
High Medium
Develop guidance material for businesses in Food Retail and Food and Beverage Services sub-divisions to develop and implement strategies for separating food waste from their general waste stream for either on-site or off-site treatment.
Further research is needed to identify best practice mechanisms for removing food waste from the general C&I waste stream.
Further research is needed to understand the reprocessing capacity of organic material in the major cities and the options for increasing capacity or sending C&I food organics to municipal reprocessing facilities.
Recommendation 13: support food waste avoidance programs through food ‘rescue’
Medium Easy
Give food waste avoidance programs priority and facilitate food rescue.
Opportunities to improve waste collection for material efficiency
Recommendation 14: remove barriers and encourage local collaboration for recycling
High Medium
Assist SME recycling through an active program of facilitation to build more comprehensive recycling systems at SME sites. Examples might include guidelines for establishing ‘mini transfer stations’ at common areas for SMEs and extending recycling services to SME sites.
Local government may need to be involved to assist with establishing ‘mini-transfer stations’ and to ensure that local regulations are not a barrier to successful recycling collaboration.
Recommendation 15: investigate industrial symbiosis High Medium
Apply policy tools and programs strategically to support and drive innovative use of waste streams as potential feedstock for other business processes.
Page 138 Encycle Consulting Pty Ltd
8 Greenhouse gas emission impacts of waste streams by industry division and material type
This section is intended to provide background information that will assist with decision-making and communicating the relative significance of recycling to climate change (compared with other activities). The discussion of greenhouse gas emissions in this section is not intended to replace the consideration of the full environmental impacts of waste generation and disposal to landfill. The United Nations Environment Programme provides a considerable weight of discussion about Sustainable Consumption and Production for the interested reader.Waste disposal to landfill increases greenhouse gas emissions in two main ways:
1. Where materials are not recycled, emissions associated with the extraction and processing of virgin materials to replace the lost materials.
2. The generation of methane from biological decomposition in landfills.Organic waste materials such as food, paper, cardboard and timber decompose when placed in a landfill. The process of decay will quickly use up oxygen from the site as it is covered and largely air-tight and the process become anaerobic. Anaerobic decomposition of organic matter produces methane which has a global warming potential of 25 times that of carbon dioxide (Forster, et al., 2007, p. 212) over a 100 year time horizon.When materials are recycled to create new products, the initial steps in the material supply chain are avoided, including extraction of minerals or growth of trees or plants (for production of timber, paper, cardboard and textiles) and initial processing of the feedstock for manufacturing of a product.Different materials have different production processes and supply chains which result in a range of greenhouse gas profiles. With some exceptions, it is usually the case that significantly more greenhouse gas emissions result from using virgin materials, than from collecting, transporting and recycling recovered materials.This section discusses an analysis of the greenhouse impacts of the waste streams produced by each industry division (considered this report) and also by available recyclables in the waste stream for each material.As outlined in the greenhouse gas emissions methodology section (Section 2.9), data from DECCW (2010d) has been used to determine the greenhouse gas impacts, against the baseline of 100% of C&I waste disposal to landfill, of the following two scenarios:
current C&I waste materials diversion to recycling 100% of C&I waste materials are diverted into recycling.
Calculating the difference between the two scenarios outlined above provides an estimate of the net greenhouse gas emission benefit that could be achieved, relative to the current status quo, if all C&I waste materials were diverted to recycling destinations.Table 21 provides a summary of the greenhouse gas emission factors used in this report. The net impact of recycling values are those actually used in calculations, with the landfill impact and recycling impact values provided for reference.
Page 139 Encycle Consulting Pty Ltd
Table 21: Greenhouse gas impacts of landfilling and recycling materials (DECCW, 2010d)
Material type DECCW (2010d) equivalent
material type
Landfill(primary material
production, collection and
landfilling impacts)
Recycling(collection, sorting and
reprocessing impacts)
Net impact of recycling
t CO2-e / tonne t CO2-e / tonne t CO2-e / tonne
Masonry materials Masonry average 0.027 0.007 -0.020
Other Weighted average2 1.09 0.29 -0.801. DECCW (2010d) glass packaging values from kerbside sources, not C&I sources.2. Mass weighted national average.
The estimates, by industry division, of greenhouse gas emissions that are avoided through recycling in the C&I sector, are provided in Table 22 and Figure 11. The emissions avoided through current levels of recycling are 5 million tonnes (Mt) CO2-e per year, with potential avoidance of 10.1 Mt CO2-e per year if all C&I waste is diverted to recovery.The retail trade, manufacturing and accommodation and food services industry divisions represent 68% of the available opportunity for the avoidance of greenhouse gas emissions, through increased diversion to recycling.
Page 140 Encycle Consulting Pty Ltd
Table 22: Avoided greenhouse gas emissions through recycling – by industry division
Industry division(ordered by ANZSIC codes)
Avoided GHG emissions
from recycling – current
Avoided GHG emissions
from recycling – 100%
diversion
Potential gain
t CO2-e t CO2-e t CO2-eManufacturing 2 566 000 3 962 000 1 396 000 Wholesale trade 241 000 535 000 294 000 Retail trade 906 000 2 010 000 1 104 000 Accommodation and food services 556 000 1 487 000 931 000 Transport postal and warehousing 338 000 381 000 43 000 Financial and insurance services 26 000 52 000 26 000 Rental, hiring and real estate services 19 000 212 000 193 000 Professional, scientific and tech. Services
43 000 176 000 133 000
Administrative and support services 20 000 40 000 20 000 Public administration and safety 41 000 175 000 134 000 Education and training 52 000 215 000 163 000 Health care and social assistance 100 000 437 000 337 000 Arts and recreation services 113 000 401 000 288 000
Totals 5 020 000 10 080 000 5 060 000
Page 141 Encycle Consulting Pty Ltd
Figure 11: Avoided greenhouse gas emissions through recycling – by industry division (million tonnes CO2-e)
Avoided GHG emissions from recycling - 100% diversionAvoided GHG emissions from recycling - current
Mt CO2-e per year
Page 142 Encycle Consulting Pty Ltd
The estimates, by material type, of greenhouse gas emissions that are avoided through recycling in the C&I sector are provided in Table 23 and Figure 12. Negative figures indicate a net greenhouse gas emission benefit (i.e. fewer emissions from recycling than producing virgin products). Timber, plastics (both packaging plastics and other plastics), cardboard and paper, and food organics represent 68% of the available opportunity for the avoidance of greenhouse gas emissions, through increased diversion to recycling. All these materials are potentially recyclable with current reprocessing systems.Even though recycling rates are already fairly high for cardboard and aluminium, these materials still offer a significant opportunity for the avoidance of greenhouse gas emissions, through increased diversion to recycling.
Table 23: Avoided greenhouse gas emissions through recycling – by material type
Avoided GHG emissions from recycling - 100% diversionAvoided GHG emissions from recycling - current
Mt CO2-e per year
Page 144 Encycle Consulting Pty Ltd
Glossary of terms and acronymsABS Australian Bureau of StatisticsABS / SAN Acrylonitrile Butadiene Styrene and Styrene Acrylonitrile (PIC 7)ANZSIC Australian New Zealand Standard Industrial ClassificationAWT Alternative Waste Treatment. Treatment of mixed waste to recover recyclables
and organics for energy recovery and recycling.Baler A machine that compacts material and allows it to be tied or otherwise secured
into bales that can be transported. Balers are often used in commercial buildings for cardboard, but can also be used for other recycling streams such as soft plastics and polystyrene.
Bed Beds refer to available treatment places which may or may not be physical beds.Bed/day A hotel and healthcare industry standard measure of occupancy per bed per day
over a given timeframe. For example, if a hotel or hospital which has 10 people staying each day for a full week, this would be: 10 people x 7 nights = 70 bed-days for the week.
C&D waste Construction and Demolition waste: Materials generated during construction or demolition of buildings, often containing significant quantities of sand, bricks, concrete, steel, plastic pipes, plasterboard, timber and also packaging materials.
C&I waste (Sustainability Victoria definition) Commercial and industrial (C&I) waste: Comprises solid waste generated by the business sector as well as solid waste created by state and federal government entities, schools and tertiary institutions. Unless otherwise noted, C&I waste does not include waste from the construction and demolition (C&D) sector.
CBD Central business districtCO2-e Carbon dioxide equivalent. Greenhouse gases with the equivalent climatic impact
of 1 unit (often measured in tonnes) of carbon dioxide.Commingled recycling
Common recyclables, mostly packaging; such as glass, plastics, aluminium, steel, liquid paper board (milk cartons). Commingled recycling may include paper but often, and particularly in offices, paper and cardboard are collected separately.
Composting The biological process that turns organic material into a useful soil additive. This process diverts organic material from landfill and so prevents the production of methane (a powerful greenhouse gas).
Dirty MRF A material recovery facility that sorts recyclables from mixed waste. Usually used for sorting dry C&I / C&D waste.
Dry recyclables
Collective name for common recyclables, excluding organic material. Generally, dry recyclables includes: glass, metals, paper, plastics and cardboard.
EFTE Equivalent Full-time Employee. A comparable measure of staffing levels across industry sectors
EFTS Equivalent Full-time Student. A comparable measure of student levels across education sectors
EPA Environment Protection AuthorityEPS Expanded Polystyrene (PIC 6)Food waste Organic waste material that includes, out of date food from retail, over-purchased
food, pre-consumer preparation scraps and post-consumer plate scrapings from restaurants.
Page 145 Encycle Consulting Pty Ltd
General Waste
Material that is intended for disposal to landfill (or in some States, incineration), normally what remains after the recyclables have been collected separately.
HDPE High Density Polyethylene (PIC 2)L/LLDPE Both Low Density Polyethylene and Linear Low Density Polyethylene (PIC 4)LDPE Low Density Polyethylene (PIC 4)LLDPE Linear Low Density Polyethylene (PIC 4)Material efficiency
Being efficient with materials and resources used for an activity, particularly applied to costs of materials and disposal of materials as waste. Materials efficiency includes, minimising the generation of waste and reducing the quantity of waste sent to landfill
MRF Materials Recovery Facility. Mechanical sorting facility, generally used for commingled recyclables.
Municipal waste
Household wastes plus material from public place collection
Organic waste
Separated food and/or ‘green’ material (e.g. grass clippings or vegetation prunings).
Packaging Material used for the containment, protection, marketing or handling of product. Includes primary, secondary and tertiary/freight packaging in both consumer and industrial packaging applications
Pay as you throw
Charging for waste disposal based upon the quantity of material collected in order to provide an incentive to produce less waste and recycle more. Pay as you throw mechanisms include: weighing bins at the kerbside, providing a choice bin sizes with different associated charges or requiring the purchase of specific bags.
PET Polyethylene Terepthalate (PIC 1)PP Polypropylene (PIC 5)PS Polystyrene (PIC 6)PU or PUR Polyurethane (PIC 7)PVC Polyvinyl Chloride (PIC 3)Recyclable Material that can be collected separately from the general waste and sent for
recycling. The precise definition will vary, depending upon location (i.e. systems exist for the recycling of some materials in some areas and not in others).
Recycling Where a material or product undergoes a form of processing to produce a feedstock suitable for the manufacture of new products.
Recovery (of waste)
The combination of waste recycled, composted and waste sent for energy recovery
Reuse The transfer of a product to another user, with no major dismantling or processing required. The term “reuse” can also be applied in circumstances where an otherwise disposable item is replaced by a more durable item hence avoiding the creation of waste (e.g. using a ceramic coffee mug in place of disposable cups).
SME Small to medium enterprisesSoft plastics Flexible plastics, currently not accepted for recycling at most MRFs in AustraliaTertiary packaging
BibliographyABS, 2006. Australian and New Zealand Standard Industrial Classification, Canberra: Australian Bureau of Statistics and Statistics New Zealand.ABS, 2009. Environmental Issues: Waste Management and Transport Use, Mar 2009 (additional datacube): Excel spreadsheet, cat. no. 4602.0.55.002, Canberra: Australian Bureau of Statistics.ABS, 2010a. Economic Activity Survey. Canberra: Australian Bureau of Statistics.ABS, 2010b. Energy, Water and Environment Management, 2008-09, Excel spreadsheet, cat. no. 4660.0, Table 6, Canberra: Australian Bureau of Statistics.ABS, 2011a. Australian industry financial data, datacube, Excel spreadsheet, cat. no. 8155.0, Canberra: Australian Bureau of Statistics.ABS, 2011b. Australian National Accounts: Input-Output Tables - Electronic Publication Final. 'Table 20 Employment by Industry', data cube: Excel spreadsheet, cat no. 5209.0.55.001. Canberra: Australian Bureau of Statistics.ABS, 2011c. Economic Activity Survey. Canberra: Australian Bureau of Statistics.ABS, 2011d. Waste Management Services, Australia, 2009-10, Excel Spreadsheet, cat. no. 8698.0. Canberra: Australian Bureau of Statistics.ABS, 2012a. Completing the picture: environmental accounting in practice, cat. no. 4628.0.55.001. Canberra: Australian Bureau of Statistics.ABS, 2012b. Counts of Australian businesses, including entries and exits, June 2007 to June 2011, datacube, Excel spreadsheet, cat. no. 8165.0, Canberra: Australian Bureau of Statistics.ABS, 2012c. Discussion paper: Towards a Waste Account, Australia - Drivers and Approaches. Canberra: Australian Bureau of Statistics.ABS, 2012d. Australian Bureau of Statistics - Export Price Index. [Online] Available at: http://www.abs.gov.au/AUSSTATS/[email protected]/DSSbyCollectionid/3C9F36C87831D6FFCA256ED20079659B?opendocument [Accessed 28 11 2012].ABS, 2012e. NSSC Table 43a Full Time Equivalent Students, Canberra: Australian Bureau of Statistics.ABS, 2012f. Labour force, Australia, Detailed, Quarterly, time series spreadsheet, cat. no. 6291.0.55.003, Canberra: Australian Bureau of Statistics.ACT NOWaste, 2010. ACT Landfill Audits - Combined Final Audit Report. Canberra: ACT NOWaste.AIHW, 2011. Australia's Hospitals 2009-10 at a glance, Canberra: Australian Institute of Health and Welfare.ALCOA, 2010. Alcoa of Australia Sustainability Report, Perth: ALCOA.alibaba.com, 2012. Timber Price-Timber Price Manufacturers, Suppliers and Exporters on Alibaba.com. [Online] Available at: http://www.alibaba.com/products/F0/timber_price.html[Accessed 28 11 2012].
Page 147 Encycle Consulting Pty Ltd
APC, 2012. 2011 Covenant Performance Data, Gordon: Australian Packaging Covenant Council.Arrium, 2011. OneSteel Sustainability Report, Sydney: Arrium Ltd.Austin Health, 2011. Austin Health Sustainability Report, Melbourne: Austin Health.Australian Paper, 2011. Australian Paper Sustainability Report, Melbourne: Australian Paper.Boral Ltd, 2009. Boral Limited Sustainability Paper 2009, Sydney: Boral Ltd.Bricks Australia, 2012. Bricks Australia - Paving, Laying, Clay Bricks and Match Up Service - Melbourne. [Online] Available at: http://www.melbournebrick.com.au/bricks.html[Accessed 28 11 2012].City of Melbourne, 2012. Commercial Garbage Waste Audit - Degraves St and Centre Place, Melbourne, Melbourne: City of Melbourne.CIWMB, 2006a. Targeted Statewide Waste Characterization Study: Detailed Characterization of Commercial Self-Haul and Drop-Box Waste. Sacramento: California EPA Integrated Waste Management Board.CIWMB, 2006b. Targeted Statewide Waste Characterization Study: Waste Disposal and Diversion Findings for Selected Industry Groups. Sacramento: California EPA Integrated Waste Management Board.CIWMB, 2008. California 2008 Statewide Waste Characterization Study. Sacramento: California EPA Integrated Waste Management Board.Commonwealth of Australia, 2011. Product Stewardship Act 2011, No. 76, 2011. Canberra: Australian Government Publishing Service.CSR , 2011. CSR Sustainability Report, Sydney: CSR Ltd.DE&T, 2006. 2006 Waste Audit and Analysis - Treasury Buildings Precinct, Melbourne: Department of Education and Training Victoria.DEC NSW, 2003. Disposal-based Commercial and Industrial Waste Characterisation Survey - Sydney Metropolitan Area - May to July 2003, Sydney: Department of Environment and Conservation (NSW).DEC NSW, 2007. Disposal based audits of the C&I and C&D waste streams, Sydney: Department of Environment Conservation (NSW).DEC WA, 2008. Environmental Benefits of Recycling - Calculator Explanatory Notes, Perth: Department of Environment and Conservation WA. Report prepared by Hyder Consulting.DEC WA, 2011. Recycling Activity in Western Australia, Melbourne: Department of Environment and Conservation (WA).DECCW, 2010a. Disposal based survey of the commercial and industrial waste stream in Sydney, Sydney: Department of Environment, Climate Change and Water NSW.DECCW, 2010b. Disposal based survey of the commercial and industrial waste stream in Sydney (summary report), Sydney: Department of Environment, Climate Change and Water NSW.
Page 148 Encycle Consulting Pty Ltd
DECCW, 2010c. Environmental benefits of recycling, Sydney South: Department of Environment, Climate Change and Water NSW.DECCW, 2010d. Environmental benefits study of recycling - Appendices 1-7, Sydney South: Department of Environment, Climate Change and Water NSW.DECCW, 2010e. Waste avoidance and resource recovery strategy progress report, Sydney: Department of Environment, Climate Change and Water NSW.DECCW, 2011. Commercial and Industrial Waste in the Lower Hunter Region, Sydney: Department of Environment, Climate Change and Water NSW.DEEWR, 2012. Higher Education Statistics, Canberra: Department of Education, Employment and Workplace Relations.DEFRA, 2008. Delivering Data for Monitoring Waste Strategy 2007. London: Department for Environment, Food and Rural Affairs (UK).DEFRA, 2010. Survey of Commercial and Industrial Waste Arisings - Report Tables: Excel spreadsheet. London: Department for Environment, Food and Rural Affairs (UK).DEFRA, 2011. Commercial and Industrial Waste Survey 2009 Final Report. London: Department for Environment, Food and Rural Affairs (UK).DEH, 2006. Waste and Recycling in Australia, Melbourne: Department of Environment and Heritage.DERM, 2012. QLD industry waste data, Brisbane: Department of Environment and Resource Management.DEWHA, 2009a. National Waste Data System Requirements Study, Canberra: Department of Environment, Water, Heritage and the Arts.DEWHA, 2009b. Waste and Recycling in Australia. Canberra: Department of Environment, Water, Heritage and the Arts.DIISRTE, 2012. Students: Selected Higher Education Statistics, Canberra: Department of Industry, Innovation, Science, Research and Tertiary Education.DSEWPaC, 2010. Landfill ban investigation, Canberra: Department of Sustainability, Environment, Water, Population and Communities – Report prepared by Hyder Consulting.DSEWPaC, 2011a. Australian waste classifications - roles in decision making, Canberra: Department of Sustainability, Environment, Water, Population and Communities – Report prepared by Hyder Consulting.DSEWPaC, 2011b. National Food Waste Assessment, Canberra: Department of Sustainability, Environment, Water, Population and Communities – Report prepared by the Institute for Sustainable Futures (UTS).DSEWPaC, 2011c. Waste Classifications in Australia, Canberra: Department of Sustainability, Environment, Water, Population and Communities Communities – Report prepared by Hyder Consulting.DSEWPaC, 2012a. Liquid Waste Assessment, Canberra: Department of Sustainability, Environment, Water, Population and Communities – Report prepared by Hyder Consulting.
Page 149 Encycle Consulting Pty Ltd
DSEWPaC, 2012b. Waste and Recycling in Australia 2011, Canberra: Department of Sustainability, Environment, Water, Population and Communities. Report prepared by Hyder Consulting.EcoRecycle Victoria, 2002. Solid Industrial Waste Plan Data Report. Melbourne: EcoRecycle Victoria.EcoRecycle Victoria, 2003. Towards Zero Waste - a solid industrial waste management plan for Victoria. Melbourne: EcoRecycle Victoria.EcoRecycle Victoria, 2004. SME Delivery Mechanisms. Melbourne: EcoRecycle Victoria.EcoRecycle Victoria, 2005. Life cycle impact data for resource recovery from commercial & industrial and construction & demolition waste in Victoria. Melbourne: EcoRecycle Victoria.EEA, 2003. Assessment of information related to waste and material flows: A catalogue of methods and tools, Copenhagen: European Environment Agency.EEA, 2010. The European environment - state and outlook, Copenhagen: European Environment Agency.Environment Agency, 2010. North West of England Commercial and Industrial Waste Survey 2009, London: Environment Agency.EPA NSW, 2012. BinTrim data, Sydney: EPA NSW.EPA Victoria, 2011. EREP registered sites - sites registered in the Environment & Resource Efficiency Plans program, Melbourne: EPA Victorla.EPA Victoria, 2012a. EREP registered sites, Melbourne: Victorian Government.EPA Victoria, 2012b. Helping deliver savings for business and the environment, Melbourne: Victorian Government.EPHC, 2010. National Waste Report, 2010, Adelaide: Environment Protection and Heritage Council.European Parliament and the Council of the Europeran Union, 2002. Regulation (EC) No 2150/2002 of the European Parliament and of the Council, Luxembourg: Office Journal of the European Communities.Fareshare, 2012. Foodwaste reduction [Interview] (October 2012).Forster, P. et al., 2007. Changes in Atmospheric Constituents and in Radiative Forcing. In: Climate Change 2007: The Physical Science Basis. Contribution of Working Group I to the Fourth Assessment Report of the Intergovernmental Panel on Climate Change, Cambridge: Cambridge University Press.Foster's Group, 2011. Foster's Business and Sustainability Review, Melbourne: Foster's Group Ltd.Glass Bottles Direct, 2012. Glass Bottles, Jars and Packaging. [Online] Available at: http://www.glassbottles.biz/ [Accessed 28 11 2012].Godfrey Hirst Australia, 2011. Godfrey Hirst Modular Environmentally Sustainable Practices, Geelong: Godfrey Hirst Carpets.Goodman Fielder, 2010. Goodman Fielder NPC Annual Report, Sydney: Goodman Fielder.
Page 150 Encycle Consulting Pty Ltd
Goodman Fielder, 2011. Goodman Fielder 2011 Sustainability Report, Sysney: Goodman Fielder.Holden Ltd, 2010. Holden Business Report, Melbourne: Holden Ltd.Hyder, 2007a. 485 Bourke St Melbourne Energy and Waste Audit, Melbourne: Hyder Consulting.Hyder, 2007b. MBC Environmental Audit and Analysis 2007, Melbourne: Hyder Consulting.IndustryEdge, 2008. Pulp and paper strategic review, Hobart: Industry Edge.Johnson, B. & Clark, S., 2011. Food waste avoidance - SME social research. Melbourne: Ipsos.Linacre, S., 2002. Environment Protection Mining and Manufacturing Industries, Australia, 2000–2001. cat. no. 4603.0, Canberra: Australian Bureau of Statistics.Lion Dairy and Drink, 2011. Lion Sustainability Report, Sydney: Lion Dairy and Drink.MetalPrices.com, 2012. Current Primary and Scrap Metal Prices. [Online] Available at: http://www.metalprices.com/ [Accessed 28 11 2012].NAB, 2011. Environment Dig Deeper Paper, Melbourne: National Australia Bank.NCVER, 2012a. Australian vocational education and training statistics - students and courses, Adelaide: National Centre for Vocational Educational Research.NCVER, 2012b. Students and Courses 2011, Canberra: National Council for Vocational Education Research.Nestle, 2011a. Australian Packaging Covenant Action Plan 2011–2015, Sydney: Nestle Australia Limited.Nestle, 2011b. Our Environmental Footprint, Sydney: Nestle Australia Ltd.OEH, 2011. Quality declaration - waste avoidance and resource recovery strategy - recycling rates, Sydney: Office of Environment and Heritage.ONS, 2011. Mid-1971 to Mid-2010 Population Estimates: United Kingdom; estimated resident population for constituent countries and regions in England, London: Office for National Statistics.PACIA, 2011. 2011 National Plastics Recycling Survey - July 2010 to June 2011 survey period, Melbourne: Plastics and Chemicals Industries Association.plastemart.com, 2012. Polymer prices, Plastic Raw Material Price Lists, Indian and International. [Online] Available at: http://www.plastemart.com/International-Polymer-Prices.asp [Accessed 28 11 2012].RMIT University, 2005. Life Cycle Impact Data for Resource Recovery for Commercial and Industrial and Construction and Demolition Waste in Victoria, Melbourne: RMIT University and the Centre for Design. Report prepared for EcoRecycle Victoria.Royal Botanic Gardens Melbourne, 2011. Annual Report 2010–11, Melbourne: Royal Botanic Gardens Board Victoria.SRU, 2011a. PACIA 2011 National Plastics Recycling Survey, Melbourne: Plastics and Chemicals Industry Association.
Page 151 Encycle Consulting Pty Ltd
SRU, 2011b. Waste Data, Verification and Process - Deakin University, Melbourne: Deakin University.Sustainable Campus Group, 2011a. Australian Tertiary Education Sector Summary Sustainability Report, Melbourne: Monash Sustainability Institute.Sustainable Campus Group, 2011b. Australian Tertiary Education Sector Sustainability Report 2011, Melbourne: Monash Sustainability Institute.SV, 2012. Victorian Recycling Industries Survey 2009-10. Melbourne: Sustainability Victoria.Taylor, J. & Warnken, M., 2008. Wood recovery and recycling: A source book for Australia, Melbourne: Forest & Wood Products Australia Ltd.TEC, 2007. State of Waste Series: Queensland. Sydney: Total Environment Centre Inc.Telstra, 2012. Sustainability Report 2012, Melbourne: Telstra Ltd.Trewin, D. & Pink, B., 2006. Australian and New Zealand Standard Industrial Classification (ANZSIC). cat. no. 1292.0, Canberra: Australian Bureau of Statistics.Unilever Food Solutions, 2011. Work Smart: Wise Up On Waste, London: Unilever.United Nations, 2012. Revision of the System of Environmental-Economic Accounting (SEEA): SEEA Central Framework, New York: United Nations Statistics Division.Zero Waste SA, 2004. Landfill Survey June 2004. Adelaide: Government of South Australia.Zero Waste SA, 2007. Disposal Based Survey October/November 2007. Adelaide: Government of South Australia.Zero Waste SA, 2008. Assessment of potential for improving collections systems for the commercial and industrial sector. Adelaide: Government of South Australia.Zero Waste SA, 2011. SA Recycling Activity Report 2009-10, Adelaide: Zero Waste SA. Report prepared by Rawtec Pty Ltd.
Page 152 Encycle Consulting Pty Ltd
Appendix A: Examples of businesses in ANSZIC industry divisions
Division (from ASIC categories)
Examples of business types within the division
Manufacturing
Manufacturers of: food products, beverage and tobacco products, textile, leather, clothing and footwear, wood products, pulp, paper and converted paper products, printing, petroleum and coal products, chemical and chemical products, Polymer products, non-metallic mineral products, metal and metal products, machinery and equipment and furniture.
Wholesale trade Fuel distribution centres, car distribution centres, agricultural product wholesalers
Retail trade Retail stores for: food (e.g. supermarkets, delicatessens, health food, bakers, butchers, etc.). Non-store retailers, fuel retailing, motor vehicle parts retailing
Accommodation and food services
Hotels, hostels, bed & breakfast, restaurants, cafes, take-away food services, pubs, taverns and clubs
Transport, postal and warehousing
Road, rail and water transport and the associated support services. Courier and logistics services. Warehousing and storage services
Financial and insurance Banking, insurance, superannuation funds, auxiliary investment services
Rental, hiring and real estate services
Rental and hiring of vehicles, farm animals, other products. Property operators and real estate services
Professional, scientific and technical services
Scientific laboratory research, legal and accounting services, veterinary services and market research and statistical services
Administrative and support services
Employment services, travel agents, building cleaning services, pest control and gardening services
Public administration Government administration including Central, State and Local government. Justice and government representation
Education and training Pre-school, school and tertiary education. Adult, community and other education and associated support services
Health care and social assistance
Hospitals, medical and other health care services, residential care, social assistance services, childcare services
Arts and recreation services Museums, parks and gardens, art galleries, sports and recreation facilities, horse and dog racing activities, creative and performing arts activities, gambling activities
Page 153 Encycle Consulting Pty Ltd
Appendix B: Industry employment profiles for each sub-division
The graph shown in Figure 13 compares the relevant sub-divisions by number of ETFEs as an indicator of relative size of each industry in Australia. From the data shown in Figure 3, it is notable that 75% of employment falls in the top 8 sub-divisions and of that, 49.1% of employment falls in the top 4 sub-divisions. The top employer in Australia is HEALTH CARE AND SOCIAL ASSISTANCE (1.2 million EFTEs) which is broadly consistent with other similar developed nations.Table 24: Summary figures for the EFTE by division.
Industry division EFTE EFTE for businesses 1–19 employees
EFTE for businesses 20–200 employees
EFTE for businesses 200+ employees
HEALTH CARE AND SOCIAL ASSISTANCE 1 006 830 363 720 295 200 347 910
RENTAL, HIRING AND REAL ESTATE SERVICES 178 320 105 660 38 320 34 340
ARTS AND RECREATION SERVICES 169 080 110 380 40 610 18 090
ACCOMMODATION AND FOOD SERVICE – Excl Food and Beverage Services
86 750 45 820 23 010 17 920
Employment (EFTE) across all ANZSIC Divisions
9 496 380 4 112 900 2 352 880 3 030 600
Page 154 Encycle Consulting Pty Ltd
(including those excluded from this study)
When looking at the broad industry divisions, it can be seen that two divisions produce nearly 50% of the waste generated within the C&I waste stream: ACCOMMODATION AND FOOD SERVICES and RETAIL TRADE.It is worth noting that RETAIL TRADE is split into 5 sub-divisions and together, these sub-divisions together total nearly 1.2 million employees which makes RETAIL TRADE almost as significant as HEALTH CARE AND SOCIAL ASSISTANCE as an employer. The sub-divisions within RETAIL TRADE are (in order of employment significance): Other Store-Based Retailing, Food Retailing, Motor Vehicles, Fuel Retailing and Non-Store Retailing.MANUFACTURING is split into 15 sub-divisions, but in total, these only represent 8.2 % of employment across all industry divisions (just over 0.8 million EFTEs).
Page 155 Encycle Consulting Pty Ltd
Figure 13: Relative number of employees (EFTE) for each ANZSIC division and sub-division under review for this project
Page 156 Encycle Consulting Pty Ltd
Appendix C: Decision flow chart for choosing datasets for analysis for this project
Page 157 Encycle Consulting Pty Ltd
Appendix D: Definition of C&I waste
The National Waste Report 2010 provides the following definition of C&I waste:Commercial and industrial (C&I) waste: waste that is produced by institutions and businesses; includes waste from schools, restaurants, offices, retail and wholesale businesses, and industries including manufacturing.
Included in the definition of C&I waste for this project: Inert and organic wastes without hazard collected from commercial and industrial
premises or self-hauled by generators* Includes public venues and prefabricated building construction
*note that this project excludes certain industry divisions (see Methodology for more information)
Excluded in the definition of C&I waste for this project: On site disposal Liquid wastes Disposal to sewer Agricultural and mining wastes Building wastes Bio solids Hazardous wastes Fly ash and slags SME waste collected under a municipal contract
Page 158 Encycle Consulting Pty Ltd
Appendix E: Excluded ANZSIC divisions
Sector (from ASIC categories)
Rationale for exclusion
A Agriculture Predominantly onsite disposal and largely excluded from C&I waste data.
B Mining Predominantly onsite disposal and largely excluded from C&I waste data.
D Electricity Not site based in structure or significant.E Construction Classified under C&DJ Communication Not site based in structure or significant.P Cultural Not widely attributed to C&I and
insignificantQ Personal services Not widely attributed to C&I and