94
NCVER Report 2 Overview of apprenticeship and traineeship institutional structures

NCVER Report 2
Overview of apprenticeship and traineeship institutional structures

© Commonwealth Government, 2011
ISBN PDF 978-0-642-78009-6
ISBN RTF 978-0-642-78010-2
This work has been produced by the National Centre for Vocational Education Research (NCVER) on
behalf of the Australian Government and state and territory governments with funding provided through
the Australian Department of Education, Employment and Workplace Relations. Apart from any use
permitted under the CopyrightAct 1968, no part of this publication may be reproduced by any process
without written permission of the Commonwealth.
The views and opinions expressed in this document are those of the author(s) and do not necessarily
reflect the views of the Australian Government, state and territory governments or NCVER.
Some preliminary data has been used in this publication and is subject to further checking once final data
is released in forthcoming NCVER publications. Should errors arise NCVER will update and replace this
version.
For best results print in colour.
NCVER ref: DMS# 99766
January 2011

ContentsTables and figures 5
Overview 7
Occupational training and the role of apprenticeships and traineeships
Introduction 10Occupational training in context 10Forms of occupational training 10Qualification numbers and levels 11The role of informal and unaccredited learning 14The fit between occupational training and subsequent employment 15The validity of the ‘sites’ of training 17Concluding comments 18
References 19Appendix 20
International comparisonsIntroduction 28
Selection of countries for comparison 29Discussion 30
Country apprenticeship systems 32United Kingdom 32Germany 33Denmark 35Switzerland 36Singapore 37United States of America 38Peoples Republic of China 39Sweden 40India 41Algeria 43
References 45Appendices 47
The efficiency of the apprenticeship and traineeship systemIntroduction 58Completion rates 59
Factors behind non-completion 64The cost of non-completion 68
Accelerated completion 72Rates of accelerated completion 72Procedures for signing off accelerated completions 75Approaches used to accelerate completion 76
NCVER Report 2 final Page 3

Summary 77
Conclusion 78References 79Appendices 80
Completions by duration, by state and occupation 82
NCVER Report 2 final Page 4

Tables and figuresOccupational training and the role of apprenticeships and traineeships
Table 1 Proportion of apprentices and trainees by occupational group (ANZSCO) 2009 12
Table 2 Proportions of apprentices and trainees and not apprentices and trainees by qualification level 2009 12
Table 3 Students by occupation, major course qualification level and apprenticeship status, 2009 (%) 13
Table 4 Persons by occupation of employment (ANZSCO) by level of highest non school qualification, 2006 14
Table 5 Matches between intended and destination occupations for apprentices and trainees who have completed their training and are employed, by selected ANZSCO, 2007 16
Table A1 Students by occupation, major course qualification level and apprenticeship status, 2009 21
Table A2 Persons by occupation of employment (ANZSCO) by level of highest non-school qualification, 2006 24
International comparisons Table A1 United Kingdom apprenticeship commencements by sector
framework, level and sex, 2003–04 and 2008–09 47
The efficiency of the apprenticeship and traineeship system Table 1 Completion rates in trades by occupation and year
commenced, 2004–05 (%t) 60Table 2 Completion rates in non-trades by occupation and year
commenced, 2004–07 61Table 3 Cross-sectional completion and attrition ratesby selected
occupation for contracts commencing in December quarter, 2007–09 62
Table 4 Commencement and recommencement data, by major occupational group, 2009 63
Table 5 ‘Recommencement’ adjustment factor, contract and individual completion rates, trade occupations, commenced in 2005 64
Table 6 Reason for non-completion of an apprenticeship or traineeship 65
Table 7 Completion rate statistics, by state 65Table 8 Completion rates by trade and size of employer 67Table 9 Completion rates by various characteristics 68Table 10 Annual earnings for an 18-year-old, working full-time, with
Year 12 70Table 11 Net present value calculations for an 18-year-old apprentice
or trainee, with Year 12, working full-time 71Table 12 Apprentice and trainee completions in trade occupations,
certificate III and above, by duration of training, 12 months ending 30 June 2009 (%)—by jurisdiction and national 74
Table 13 Apprentice and trainee completions in trade occupations, certificate III and above, by duration of training, 12 months ending 30 June 2009 (%)—Australia 75
NCVER Report 2 final Page 5

Table A1 Cross-sectional completion and attrition rates by selected occupation3 for contracts commencing in December quarter 2007–09 80
Table A2 Expired contracts, by occupation, 2009 (%) 81Table A3 Apprentice and trainee completions in trade occupations,
certificate III and above, by duration of training, 12 months ending 30 June 2007–09 (%)—New South Wales 82
Table A4 Apprentice and trainee completions in trade occupations, certificate III and above, by duration of training, 12 months ending 30 June 2007–09 (%)—Victoria 83
Table A5 Apprentice and trainee completions in trade occupations, certificate III and above, by duration of training, 12 months ending 30 June 2007–09 (%)—Queensland 84
Table A6 Apprentice and trainee completions in trade occupations, certificate III and above, by duration of training, 12 months ending 30 June 2007–09 (%)—South Australia 85
Table A7 Apprentice and trainee completions in trade occupations, certificate III and above, by duration of training, 12 months ending 30 June 2007–09 (%)—Western Australia 86
Table A8 Apprentice and trainee completions in trade occupations, certificate III and above, by duration of training, 12 months ending 30 June 2007–09 (%)—Tasmania 87
Table A9 Apprentice and trainee completions in trade occupations, certificate III and above, by duration of training, 12 months ending 30 June 2007–09 (%)—Northern Territory 88
Table A10 Apprentice and trainee completions in trade occupations, certificate III and above, by duration of training, 12 months ending 30 June 2007–09 (%)—Australian Capital Territory
89
Figure 1 Apprentice and trainee completions in trade occupations by duration of training, certificate III or above, 1999–2009 (%)
73Figure 2 Cross-sectional completion rates for apprentices, December
quarter, 2007 and 2008 73
NCVER Report 2 final Page 6

OverviewThis report focuses on apprenticeships and traineeships from a whole-of-system perspective. It is intended to situate the system within the overall skilling of the Australian workforce and in an international context. The report also looks at the efficiency of the apprenticeship system in terms of the relationship between inputs and outputs. Since the outputs are qualified workers, this boils down examining various aspects of completion rates.
The report is structured around three papers. The first focuses on occupational training and the role that apprenticeships and traineeships play in that, the second provides a comparison of apprenticeship systems in a selection of other countries, and the final paper takes up the efficiency angle.
In the first paper we look at the apprenticeship and traineeship model and other models of occupational training used in Australia, particularly those undertaken solely within institutional settings or on the job. This includes both structured but non-formal learning and informal learning. The paper then outlines the qualification profiles of VET students, according to whether they are an apprentice or trainee, or not. We then look at comparable data drawn from the 2006 census. We note that, overall, apprentices and trainees make up only about 20% of publicly funded student numbers. This paper also considers the role of apprenticeships and traineeships in providing pathways to specific occupations; whether there are alternative pathways into work in that occupation; and examines a range of other issues which underpin or potentially affect the nature and quality of occupational training.
The point to emerge is that the apprenticeship and traineeship model plays an important, but not dominant, role in the provision of occupational training.
The second paper outlines the apprenticeship models in operation in a number of other countries. To do this we use a broader definition of apprenticeship than that which applies in contemporary Australia. The section considers a range of other factors relevant in making comparisons, for example, institutional structures, notional duration and financing and governance arrangements. While an economic perspective underpins this section, cultural, social and philosophic perspectives cannot be ignored when considering the institutional structures for apprenticeships and traineeships in other countries.
The paper identifies those aspects of other country’s apprenticeship systems that may have relevance to the Australian system. However, relatively few countries make apprenticeships and traineeships available to adults and existing workers in the way that Australia does.
We chose nine country systems for comparison with Australia’s apprenticeship arrangements. They are the United Kingdom, Germany, Denmark, Switzerland, Singapore, the United States, China, Sweden (a country that has rejected apprenticeships), India, and Algeria. We chose the United Kingdom because its system of indentured training was adopted by the Australian colonies and provided the basis for the development of Australia’s apprenticeship and traineeship system. Australia’s contemporary system most closely resembles that in the United Kingdom. Internationally, however, this model, in which formal and on-the-job training proceed in tandem, is very much the exception.
The major point to emerge is that there is no one way or best way to structure occupational training. The apprenticeship model is one of three characteristic models, the two others being institution-based training and the ‘train and place’ system, in which institutional training is followed by a period of work experience.
NCVER Report 2 final Page 7

The final paper explores some elements of efficiency. In particular, it focuses on completion rates and the factors that impact upon them. Contract completion rates have been reported by NCVER for some time, but the paper also contains new estimates of individual completion rates by looking at the extent to which apprentices change employers (that is, recommence). In the trades, we find that the contract completion rates do seriously underestimate the rate of individual completion (a finding that will be no doubt welcomed by industry). The work on factors impacting on completion contains some new work on the extent to which size of employer impacts on completion in the trades. The authors find that size matters, and this raises issues about which employers should be allowed to have apprentices. This finding links with the conventional wisdom about having a good training plan and an employer who cares about the wellbeing of the apprentice or trainee. We also look at the role of group training arrangements (they tend to do better than private employers, but not government employers) and ‘culture’, which we measure by the concentration of blue collar workers in an area.
The paper also looks at non-completion and its implications for various stakeholders, and makes some heroic calculations on the cost of non-completion.
Finally, it looks at accelerated completions. The motivation for this is pretty obvious, with a presumption that getting apprentices and trainees through their training more quickly would improve the efficiency of the system. The paper finds that accelerated completion has been part of the system for many years but does not seem to have increased in recent years despite the push from governments. It also looks at the philosophy behind accelerated completion and reports on research which suggests that accelerated completion is not necessarily cheap. Therefore, from an efficiency point of view, accelerated completion may make the system more responsive but not more efficient. Also it should be borne in mind that the underlying concept of sharing costs between employers and apprentices is based on a fixed term, and breaking this down may well change the arithmetic and make it less attractive for employers to take on apprentices.
NCVER Report 2 final Page 8

Occupational training and the role of apprenticeships and traineeships
Hugh Guthrie
NCVER Report 2 final Page 9

IntroductionOccupational training in contextIn this paper we look at the apprenticeship and traineeship model and other models of occupational training used in Australia, particularly those undertaken solely within institutional settings or on the job. It also considers the role of apprenticeships and traineeships in providing pathways to specific occupations, and whether there are alternative pathways into work in that occupation.
Broadly, an occupation is a group of similar jobs or fields of interest that require specific training or expertise. Occupational training contributes to gaining the knowledge, skills and expertise needed by an individual to perform effectively in a particular occupation.
The role of apprenticeships and traineeships in occupational training must be kept in perspective. It is important but certainly not dominant. In the public VET system, about 20% of the students are apprentices and trainees.
NCVER surveys indicate that employers of VET-level employees place greatest value on experience and learning on the job, whereas formal qualifications provide underpinning knowledge and skills and may also have a gatekeeper role (for example, in licensed and regulated occupations). Additionally, in trade occupations, notwithstanding licensing requirements, unqualified individuals can and are employed (for example, motor mechanics). By contrast, there are many occupations where apprenticeships and traineeships are available but alternative and equally effective pathways are available (for example, in retailing, hospitality and commercial cooking).
We will now consider the forms of occupational training and then go on to consider the range of issues which affect or underpin the nature and quality of occupational training. This will be followed by some concluding comments.
Forms of occupational trainingAustralia uses a variety of approaches to occupational training. These include training that is:
Formal (leading to a recognised AQF award), non-formal (learning that does not usually lead to the attainment of a formal qualification or award, for example, in-house professional development programs conducted in the workplace) or informal (that is, learning resulting from daily activities related to work, family or leisure that is not organised or structured)
full or part-time
institution or workplace-based
for a fixed period, or variable in duration
for those already employed in that or a related occupation, or seeking to become so.
Apprenticeships and traineeships represent only one of a number of major modes of occupational training and skills formation in Australia. These modes comprise:
structured, formal learning programs that occur wholly within an institutional setting, with any practical or applied learning occurring in simulations, practice firms, project work or problem-
NCVER Report 2 final Page 10

based learning. A variant of this model involves monitored workplace experience or placement during the program
structured formal learning in an institutional setting, followed by employment-based learning in paid employment, which is required before the individual is acknowledged to be fully trained. Many professional occupations utilise this mode of skills formation. It is also the model used for apprenticeships in many countries (Knight 2010)
a combination of formal training, usually off the job in an institutional setting or workplace training centre, and concurrent supervised experiential learning in a workplace, including paid employment. This category includes apprenticeships, traineeships and the now uncommon ‘cadetships’. Such an approach is also used in ongoing training in a range of professions, such as medical specialists
informal or non-formal learning, which can be structured or unstructured, that occurs wholly in the workplace, usually overseen by an experienced supervisor or a training manager. Alternatively, relevant non-formal, but often structured, training may also be provided by industry associations, professional bodies, suppliers and others.
Skills formation in the traditional trades and a small but increasing number of occupations at the AQF diploma and advanced diploma levels use the employment-based apprenticeship model almost exclusively. Some occupational training, including apprenticeships and traineeships, also takes place in schools.
Occupational training and immigration issues are also linked. Some occupations are supplemented by immigrants whose qualifications are assessed as meeting Australian standards. For example, VETASSESS conducts trade skills assessments under the General Skilled Migration Program (GSM) for people with trade skills intending to migrate to Australia from a range of countries. This might enable applicants to access a 457 (Business – Long Stay) visa.
In addition, a 442 Occupational Trainee visa is available for sponsored people from outside Australia who want to improve their occupational skills through training with an Australian organisation or government agency. This allows people to complete workplace-based training in Australia on a temporary basis. The nominated person must have prior and recent experience in the identified occupation to which the proposed occupational training relates. A number of the occupations covered under this process require VET-level training, including those traditionally undertaken through apprentice and traineeships, and including licensed trades.
There are a number of other points that need to be made about the form and nature of occupational training. These points are that:
The level of training and the numbers having qualifications change with occupational level.
Informal and structured but unaccredited learning accounts for much of the occupational training that occurs.
There is often not a close fit between occupation training and subsequent employment, except in the traditional trades and some professions.
The balance between institutional and workplace training needs to be appropriate, as does the balance between on- and off-the-job training. Essentially, it is about the perceived validity of the ‘where’ and ‘how’ the occupational training took place.
Qualification numbers and levelsIn this section we look at the qualification profiles of VET students, according to whether they are an apprentice or trainee, or not. We then look at comparable data drawn from the 2006 census.
NCVER Report 2 final Page 11
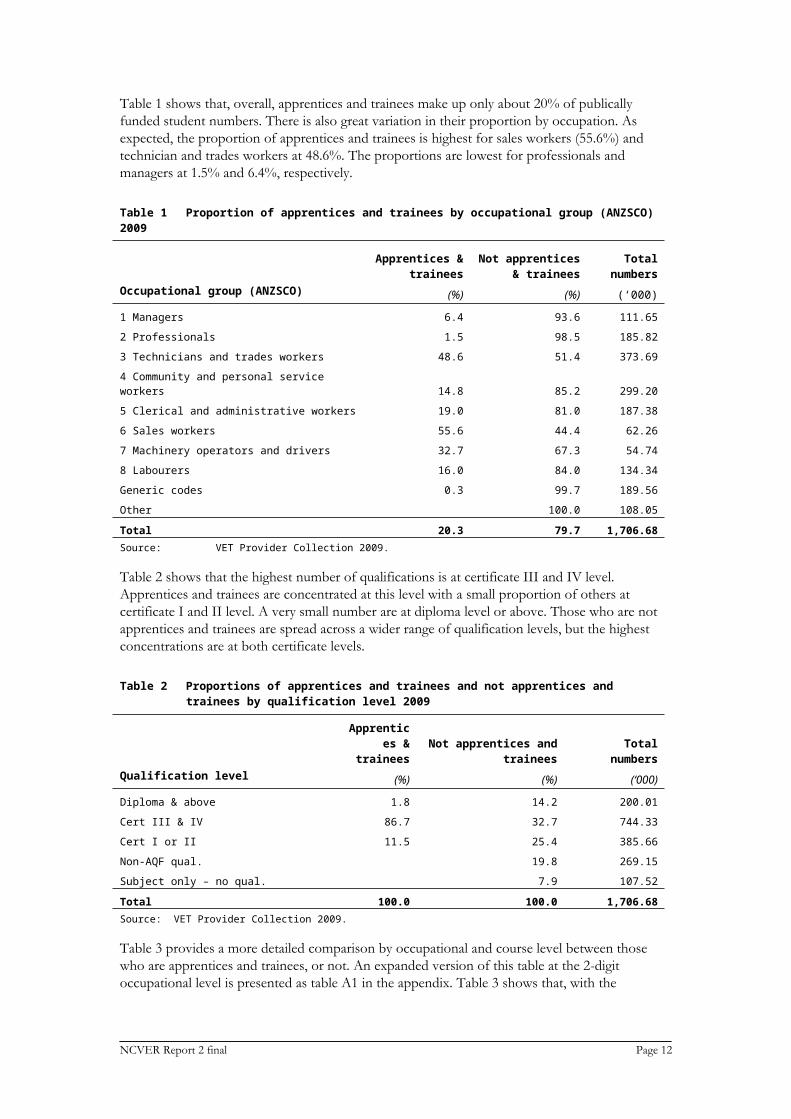
Table 1 shows that, overall, apprentices and trainees make up only about 20% of publically funded student numbers. There is also great variation in their proportion by occupation. As expected, the proportion of apprentices and trainees is highest for sales workers (55.6%) and technician and trades workers at 48.6%. The proportions are lowest for professionals and managers at 1.5% and 6.4%, respectively.
Table 1 Proportion of apprentices and trainees by occupational group (ANZSCO) 2009
Occupational group (ANZSCO)
Apprentices & trainees
(%)
Not apprentices & trainees
(%)
Total numbers
(‘000)
1 Managers 6.4 93.6 111.65
2 Professionals 1.5 98.5 185.82
3 Technicians and trades workers 48.6 51.4 373.69
4 Community and personal service workers 14.8 85.2 299.20
5 Clerical and administrative workers 19.0 81.0 187.38
6 Sales workers 55.6 44.4 62.26
7 Machinery operators and drivers 32.7 67.3 54.74
8 Labourers 16.0 84.0 134.34
Generic codes 0.3 99.7 189.56
Other 100.0 108.05
Total 20.3 79.7 1,706.68Source: VET Provider Collection 2009.
Table 2 shows that the highest number of qualifications is at certificate III and IV level. Apprentices and trainees are concentrated at this level with a small proportion of others at certificate I and II level. A very small number are at diploma level or above. Those who are not apprentices and trainees are spread across a wider range of qualification levels, but the highest concentrations are at both certificate levels.
Table 2 Proportions of apprentices and trainees and not apprentices and trainees by qualification level 2009
Qualification level
Apprentices & trainees
(%)
Not apprentices and trainees
(%)Total numbers
(‘000)
Diploma & above 1.8 14.2 200.01
Cert III & IV 86.7 32.7 744.33
Cert I or II 11.5 25.4 385.66
Non-AQF qual. 19.8 269.15
Subject only – no qual. 7.9 107.52
Total 100.0 100.0 1,706.68Source: VET Provider Collection 2009.
Table 3 provides a more detailed comparison by occupational and course level between those who are apprentices and trainees, or not. An expanded version of this table at the 2-digit occupational level is presented as table A1 in the appendix. Table 3 shows that, with the exception of managers and professional trainees, the apprenticeships and traineeships are mostly at the certificate II or III level. Diplomas are a rarity among apprenticeship and traineeships.
NCVER Report 2 final Page 12

Table 3 Students by occupation, major course qualification level and apprenticeship status, 2009 (%)
Apprentice or trainee VET students Not apprentice or trainee VET student
Students enrolled in the public VET system
Diploma &
above
Cert. III &
IVCert. I & II
Total (‘000)
Diploma &
above
Cert.III &
IV
Cert.
I & II
Non-AQF /
subject only
Total (‘000)
1 Managers 62.2 37.7 0.0 7.10 66.5 15.6 0.4 17.5 104.55
2 Professionals 13.1 86.4 0.5 2.72 29.3 39.4 12.0 19.3 183.10
3 Technicians and trades workers 0.5 99.1 0.3 181.54 16.8 52.7 8.8 21.7 192.15
4 Community and personal service workers 0.9 91.1 8.0 44.32 9.5 49.9 30.3 10.2 254.88
5 Clerical and administrative workers 0.2 91.6 8.2 35.58 7.2 47.7 39.0 6.0 151.80
6 Sales workers 0.0 49.1 50.9 34.61 5.2 38.7 43.0 13.2 27.66
7 Machinery operators and drivers 91.2 8.8 17.91 0.0 44.6 42.0 13.4 36.83
8 Labourers 37.5 62.5 21.49 0.0 7.6 75.9 16.4 112.85
Total 1.8 86.7 11.5 345.8 14.2 32.7 25.4 27.71,360.
9
Source: VET Provider Collection 2009.
Table 4, based on 2006 census data, shows that, overall, about 65% of people in Australia had no post-school qualification. Even in the trades there is a substantial proportion without a qualification. What this implies is that on-the-job experience is a very important element of occupational skilling.
Table 4 also shows that particular qualification levels characterise occupational groups. For example, and as expected, bachelor degrees and postgraduate awards characterise the professional group, while certificate level courses characterise the technicians and trades workers. Other occupational groups, community and personal service workers and clerical workers are characterised by a wider range of qualification levels. Managers, too, have a broad range of qualifications, but just over 40% have no post-school qualifications at all.
NCVER Report 2 final Page 13
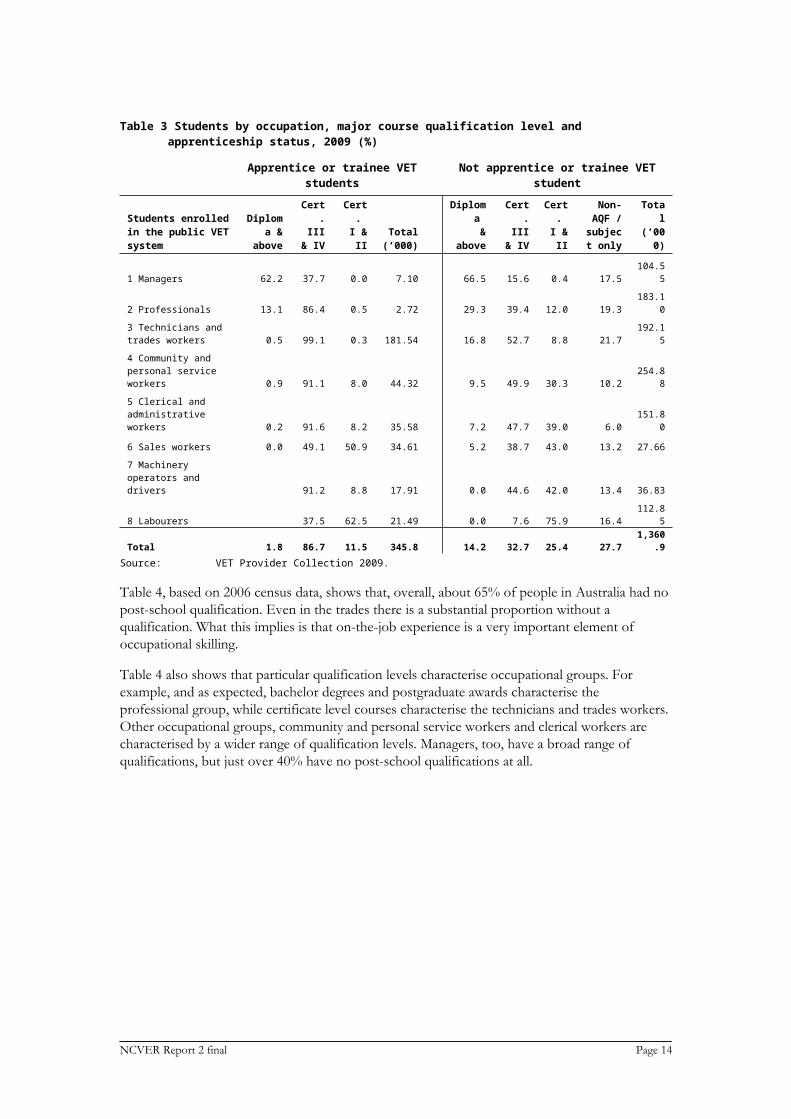
Table 4 Persons by occupation of employment (ANZSCO) by level of highest non school qualification, 2006
Occupation 06 (ANZSCO) (OCC06P)
Post-graduate
degree level
Graduate diploma &
graduate certificate
level
Bachelor degree
level
Advanced diploma
& diploma
levelCertificate
levelNo
qualification
Total number (‘000) (a)
Not stated 1.5 0.5 7.1 4.6 17.4 68.9 74.91
Inadequately described 4.1 1.4 14.3 9.1 21.9 49.3 90.68
ANZSCO 1 Managers – total 6.1 2.7 18.8 11.4 20.4 40.6 1,202.27
ANZSCO 2 Professionals – total 12.2 6.9 49.3 13.3 7.0 11.3 1,806.01
ANZSCO 3 Technicians & trades workers – total 0.6 0.4 4.3 6.5 56.8 31.4 1,309.26
ANZSCO 4 Community & personal service workers – total 1.0 1.1 9.8 15.1 26.7 46.2 801.90
ANZSCO 5 Clerical & administrative workers – total 2.0 1.3 12.1 11.2 18.5 55.0 1,365.80
ANZSCO 6 Sales workers – total 0.9 0.4 7.0 6.8 15.6 69.3 896.20
ANZSCO 7 Machinery operators & drivers – total 0.5 0.2 2.8 3.2 23.6 69.8 604.62
ANZSCO 8 Labourers – total 0.5 0.2 3.4 3.6 18.0 74.3 952.53
Grand total 4.0 2.2 17.2 9.5 22.8 44.3 8,889.23Not applicable (not employed) 0.8 0.4 4.0 3.4 7.7 83.7 10,751.11
Total 2.3 1.3 10.4 6.4 15.0 64.7 19,855.29Source: VET Provider Collection 2009.
Table A2 in the appendix to this paper presents the data in table 4 at the two-digit code level.
The role of informal and unaccredited learningLearning is not confined to that which goes on in institutional settings and leads to a qualification. Learning, such as that in apprenticeships and traineeships, may be formal. However, learning may also be non-formal, while also being structured but not accredited. A final form is informal learning, resulting from daily work-related, family or leisure activities (Halliday-Wynes & Beddie 2009).In fact, informal learning is probably the most diverse and ubiquitous form of occupational training. Most (75%) workplace learning is informal, with little of that activity being recorded in official statistics of vocational training (Conner 2002; Richardson 2004). Informal learning is an important element in workforce development and something to be factored into broader polices concerning work-related training.
For some, learning informally may be a more efficient use of time and resources, especially in small and medium-sized businesses. Here, such training dominates. According to Dawe and Nguyen (2007), while small businesses are usually committed to training, they often lack the time and funds to undertake more formal approaches.Informal and non-formal learning may also be more attractive alternatives to formal learning for some individuals, as this latter form of training may conjure up negative personal memories and experiences. Thus, people with minimal school education, poor literacy and numeracy skills, and low self-esteem often lack confidence in their ability to learn in formal settings and, consequently, the best way for them to learn—initially at least—may be through less formal learning approaches (Halliday-Wynes & Beddie 2009).However, informal learning may not pay the same dividends as either formalised occupational or structured but non-formal workplace training (Masterman-Smith & Pocock 2008). One key to increasing its dividend is to improve processes for recognising prior learning (RPL) or current competencies—however acquired—within formal training. According to Harris, Simons and
NCVER Report 2 final Page 14

Maher (2009), RPL is under-used, and Smith and Clayton (2009) show that this stems from the confusion about how to engage with the process of revealing learning gained through work and life. Smith and Clayton (2009) suggest that ‘guided reflection … significantly improves learner confidence’. They also argue that the complexity of the current system means that RPL is not meeting the requirements of employers and remains a relatively hidden option.NCVER’s employer use and views survey (NCVER 2009) also points to the importance and extensive use of unaccredited learning by employers. This survey shows that 52.7% of employers use unaccredited training to train their employees, compared with 49.0% in 2007. The survey also shows that:
95.3% are satisfied with unaccredited training as a way of meeting their skill needs.
44.2% use private training providers as their main provider of unaccredited training. Of these, 96.3% were satisfied with the quality of the training delivered.
the main reasons employers give for using unaccredited training are that it provides the required skills for their job (49.1%), meets and maintains professional or industry standards (29.5%) and improves the quality of goods and services (16.6%).
33.1% expect to increase their use of unaccredited training over the next three years, compared with 41.3% in 2007 (NCVER 2009).
Richardson (2004) suggests that what is happening informally in the workplace is very important for determining the future quantity, quality and character of the skills of the workplace. Her paper points out that the opportunities workers have for the development of skills are affected greatly by the sorts of jobs and learning provided by their employers. Her work also shows that some industries provide much greater scope for learning than do others. She suggests changes in industry structure will therefore affect the total level of skills development. Firms which choose high-skill, high-wage approaches to profitability will generate more opportunities for skills development than do firms which choose the low-skill, low-wage path. Furthermore, economic analysis is clear that the more competitive the labour market, the less the incentive for firms to provide high levels of (especially general) training for their workers (Richardson 2004).
The fit between occupational training and subsequent employmentKarmel, Mlotkowski and Awodeyi (2008) used the NCVER’s Student Outcomes Survey to compare what VET graduates study and the jobs they get. Our particular interest is in the fit for apprenticeships and traineeships.
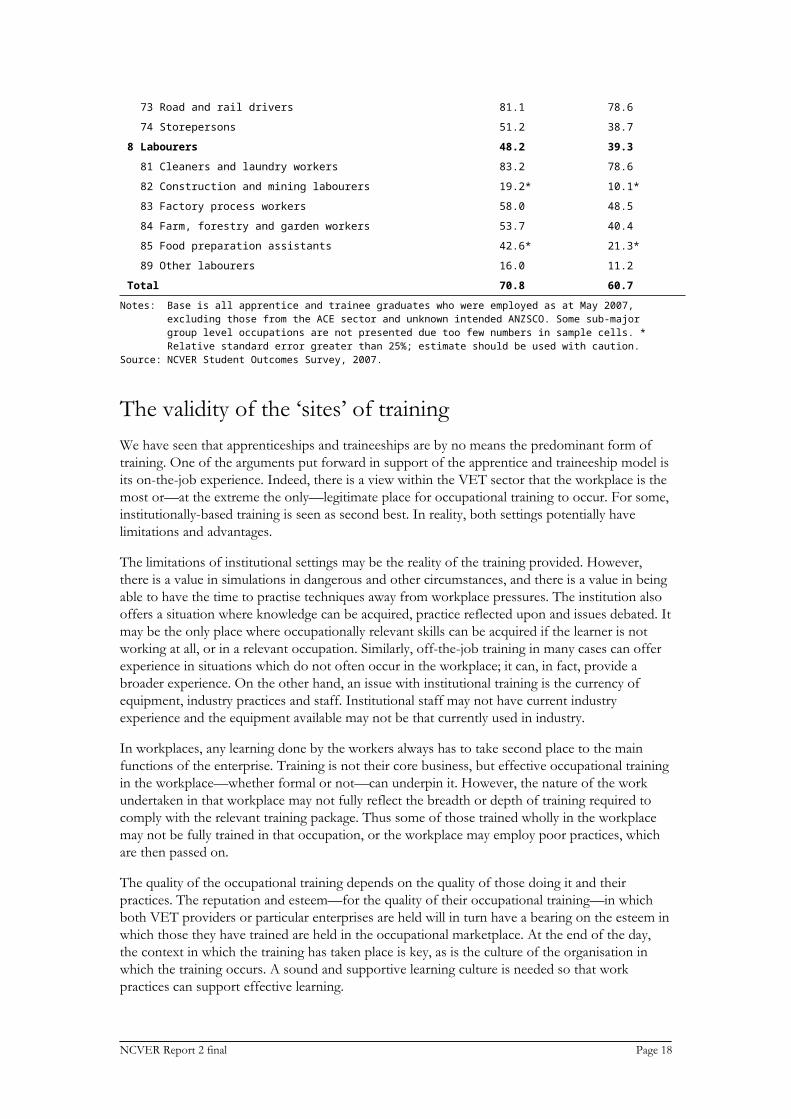
An expectation of the apprentice and traineeship system is that it is prepares individuals for occupational employment: it is not usually thought of as providing general education and training which would be useful in a wide range of occupations. However, as table 5 shows, we find a high match in only a minority of occupations, mostly—but not totally—in the trades. More specifically, the match between intended and destination occupations is near or over 80% in automotive and engineering, construction, electrotechnology, food trades, other technician and trades workers, carers and aides, road and rail drivers and cleaners and laundry workers. Of the remainder, a handful of occupations have matches in the 50% and 60% ranges (skilled animal and horticultural workers, protective services workers, numerical clerks and sales representatives and agents), while most of the rest have matches under—or well under—50% (table 5). Clearly the apprenticeship model has gone well beyond its traditional role of providing occupation-specific training.
NCVER Report 2 final Page 15

Table 5 Matches between intended and destination occupations for apprentices and trainees who have completed their training and are employed, by selected ANZSCO, 2007
Intended occupation of training activityMatch at
major groupMatch at
sub-major group% %
1 Managers 11.7 11.712 Farmers and farm managers 14.5* 14.5*
13 Specialist managers 8.8* 8.8*
2 Professionals 22.6* 21.9*
3 Technicians and trades workers 88.6 84.631 Engineering, ICT and science technicians 58.3 48.6
32 Automotive and engineering trades workers 92.1 87.0
33 Construction trades workers 90.1 87.7
34 Electrotechnology and telecommunications trades workers 94.7 89.5
35 Food trades workers 92.7 91.2
36 Skilled animal and horticultural workers 63.4 61.6
39 Other technicians and trades workers 86.6 82.1
4 Community and personal service workers 69.3 62.041 Health and welfare support workers 66.1 28.4*
42 Carers and aides 86.9 81.5
43 Hospitality workers 46.5 41.3
44 Protective service workers 73.8 68.2
45 Sports and personal service workers 39.7 35.0
5 Clerical and administrative workers 68.1 32.151 Office managers and program administrators 50.7 10.5*
53 General clerical workers 71.2 31.4
54 Inquiry clerks and receptionists 62.2 47.3
55 Numerical clerks 82.6 53.1
59 Other clerical and administrative workers 55.1 27.6
6 Sales workers 53.4 49.061 Sales representatives and agents 76.2 68.1
62 Sales assistants and salespersons 51.9 47.7
7 Machinery operators and drivers 57.6 47.071 Machine and stationary plant operators 49.6 33.4
72 Mobile plant operators 34.1 24.6*
73 Road and rail drivers 81.1 78.6
74 Storepersons 51.2 38.7
8 Labourers 48.2 39.381 Cleaners and laundry workers 83.2 78.6
82 Construction and mining labourers 19.2* 10.1*
83 Factory process workers 58.0 48.5
84 Farm, forestry and garden workers 53.7 40.4
85 Food preparation assistants 42.6* 21.3*
89 Other labourers 16.0 11.2
Total 70.8 60.7Notes: Base is all apprentice and trainee graduates who were employed as at May 2007, excluding those from the ACE
sector and unknown intended ANZSCO. Some sub-major group level occupations are not presented due too few numbers in sample cells. * Relative standard error greater than 25%; estimate should be used with caution.
Source: NCVER Student Outcomes Survey, 2007.
NCVER Report 2 final Page 16

The validity of the ‘sites’ of trainingWe have seen that apprenticeships and traineeships are by no means the predominant form of training. One of the arguments put forward in support of the apprentice and traineeship model is its on-the-job experience. Indeed, there is a view within the VET sector that the workplace is the most or—at the extreme the only—legitimate place for occupational training to occur. For some, institutionally-based training is seen as second best. In reality, both settings potentially have limitations and advantages.
The limitations of institutional settings may be the reality of the training provided. However, there is a value in simulations in dangerous and other circumstances, and there is a value in being able to have the time to practise techniques away from workplace pressures. The institution also offers a situation where knowledge can be acquired, practice reflected upon and issues debated. It may be the only place where occupationally relevant skills can be acquired if the learner is not working at all, or in a relevant occupation. Similarly, off-the-job training in many cases can offer experience in situations which do not often occur in the workplace; it can, in fact, provide a broader experience. On the other hand, an issue with institutional training is the currency of equipment, industry practices and staff. Institutional staff may not have current industry experience and the equipment available may not be that currently used in industry.
In workplaces, any learning done by the workers always has to take second place to the main functions of the enterprise. Training is not their core business, but effective occupational training in the workplace—whether formal or not—can underpin it. However, the nature of the work undertaken in that workplace may not fully reflect the breadth or depth of training required to comply with the relevant training package. Thus some of those trained wholly in the workplace may not be fully trained in that occupation, or the workplace may employ poor practices, which are then passed on.
The quality of the occupational training depends on the quality of those doing it and their practices. The reputation and esteem—for the quality of their occupational training—in which both VET providers or particular enterprises are held will in turn have a bearing on the esteem in which those they have trained are held in the occupational marketplace. At the end of the day, the context in which the training has taken place is key, as is the culture of the organisation in which the training occurs. A sound and supportive learning culture is needed so that work practices can support effective learning.
Obtaining a broad and full occupational training may require institutional and workplace training, job rotation, or working for a variety of placements, which is possible if they are employed by a group training company. In addition, what workers and their employers want from occupational training may not always be the same, and the nature of the training provided should be determined by the question: ‘Who pays?’, or—more often—‘What are the relative contributions of those involved, whether governments, employers or individuals?’
A final issue of particular relevance to apprenticeships and traineeships are the quality and synergies between the training provided off the job and support and training provided on the job. A good practice guide (Smith et al. 2009a) and its underpinning report (Smith et al. 2009b) show that, increasingly, institutional trainers are being embedded in enterprises to provide occupational training in a formal partnership, but even where this does not occur the quality of the relationship between the institution and the enterprise is critical to the quality of occupational training. The quality of workplace trainer training and VET teacher training are also important. Working with and advising enterprises on occupational training matters is now recognised as a specialised role in VET institutional staff.
NCVER Report 2 final Page 17
Concluding commentsThis paper raises a number of key points:
A variety of occupational training models exist in Australia, and apprentice and traineeships are only one of these. In fact, informal and non-formal training are probably the major forms of occupational training, although their value is not well recognised.
A relatively high proportion of people in Australia have no formal post-school qualification. This does not necessarily mean that they are unskilled.
Many apprenticeships and traineeships are not providing training that is closely linked to occupations. That is, apart from the traditional trades and a couple of other occupations, most apprentice and traineeship graduates move to other occupations.
While training in the workplace has many advantages, institutional training also has some too—especially in terms of breadth of experience. Of course, the apprentice and traineeship model typically includes an off-the-job component and so one could argue that it has the best of both worlds.
NCVER Report 2 final Page 18

ReferencesConner, M 2002, ‘Informal learning: ageless learner, 1997–2007’, viewed 16 August 2010,
<http://agelesslearner.com/intros/informal.html>. Dawe, S & Nguyen, N 2007, Education and training that meets the needs of small business: a systematic review of
research, NCVER, Adelaide.Halliday-Wynes, S & Beddie, F 2009, Informal learning: at a glance, NCVER, Adelaide.Harris, R, Simons, M & Maher, K 2009, Directions in European VET policy and practice: lessons for Australia,
NCVER, Adelaide.Karmel, T, Mlotkowski, P & Awodeyi, T 2008, Is VET vocational? The relevance of training to the occupations of
vocational education and training graduates, NCVER, Adelaide.Knight, B 2010, International comparisons, NCVER, Adelaide.Masterman-Smith, H & Pocock, B 2008, Living low paid: the dark side of prosperous Australia, Allen & Unwin,
Sydney.NCVER (National Centre for Vocational Education Research) 2009, Australian vocational education and
training statistics: employers’ use and views of the VET system 2009, NCVER, Adelaide.Richardson, S 2004, Employers’ contribution to training, NCVER, Adelaide. Smith, L & Clayton, B 2009, Recognising non-formal and informal learning: participant insights and perspectives,
NCVER, Adelaide.Smith, E, Comyn, P, Brennan Kemmis, R & Smith, A 2009a, High-quality traineeships: identifying what works –
good practice guide, NCVER, Adelaide.——2009b, High-quality traineeships: identifying what works, NCVER, Adelaide.
NCVER Report 2 final Page 19
Appendix
Table A1 Students by occupation, major course qualification level and apprenticeship status, 2009
Table A2 Persons by occupation of employment (ANZSCO) by level of highest non-school qualification, 2006
NCVER Report 2 final Page 20

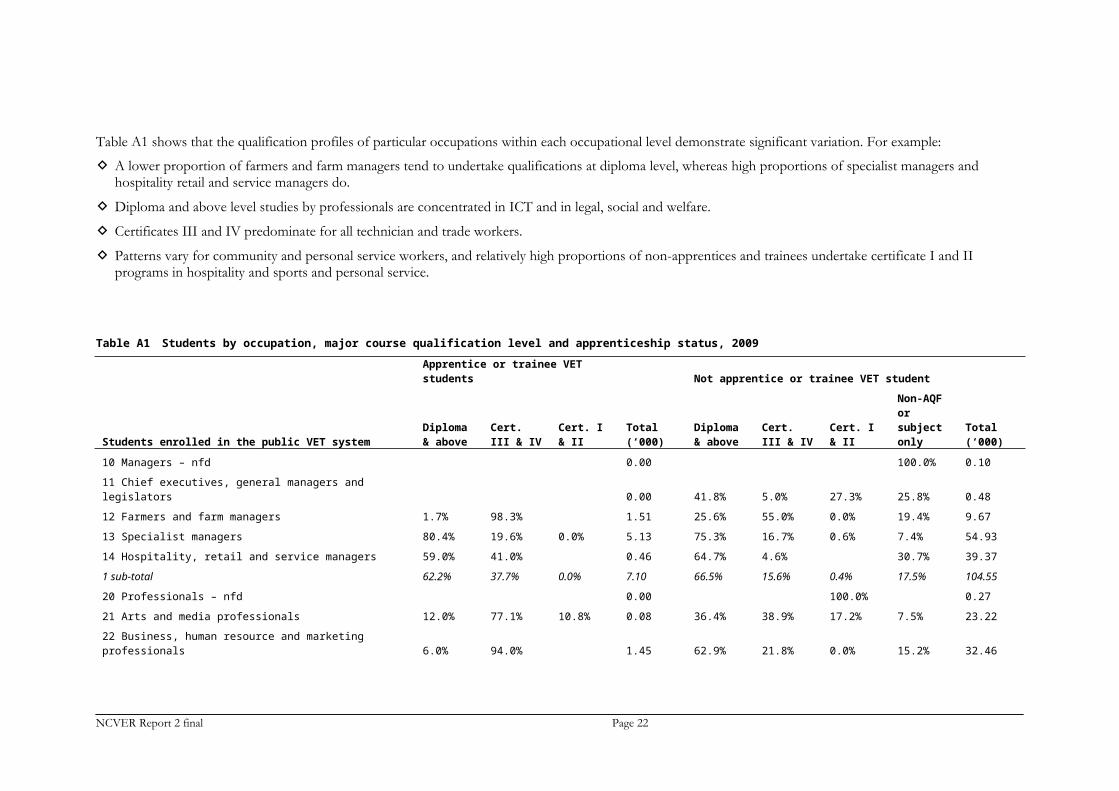
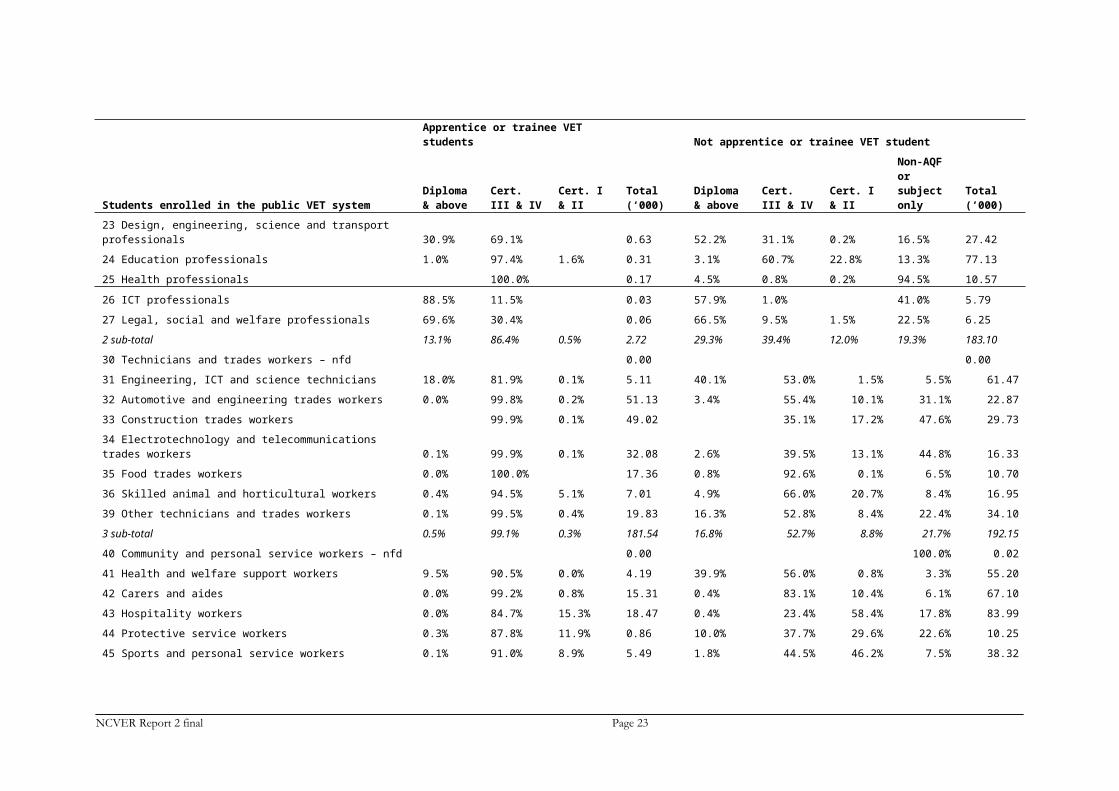
Table A1 shows that the qualification profiles of particular occupations within each occupational level demonstrate significant variation. For example:
A lower proportion of farmers and farm managers tend to undertake qualifications at diploma level, whereas high proportions of specialist managers and hospitality retail and service managers do.
Diploma and above level studies by professionals are concentrated in ICT and in legal, social and welfare.
Certificates III and IV predominate for all technician and trade workers.
Patterns vary for community and personal service workers, and relatively high proportions of non-apprentices and trainees undertake certificate I and II programs in hospitality and sports and personal service.
Table A1 Students by occupation, major course qualification level and apprenticeship status, 2009
Apprentice or trainee VET students Not apprentice or trainee VET student
Students enrolled in the public VET systemDiploma & above
Cert. III & IV Cert. I & II
Total (‘000)
Diploma & above
Cert. III & IV Cert. I & II
Non-AQF or subject only
Total (‘000)
10 Managers – nfd 0.00 100.0% 0.10
11 Chief executives, general managers and legislators 0.00 41.8% 5.0% 27.3% 25.8% 0.48
12 Farmers and farm managers 1.7% 98.3% 1.51 25.6% 55.0% 0.0% 19.4% 9.67
13 Specialist managers 80.4% 19.6% 0.0% 5.13 75.3% 16.7% 0.6% 7.4% 54.93
14 Hospitality, retail and service managers 59.0% 41.0% 0.46 64.7% 4.6% 30.7% 39.37
1 sub-total 62.2% 37.7% 0.0% 7.10 66.5% 15.6% 0.4% 17.5% 104.55
20 Professionals – nfd 0.00 100.0% 0.27
21 Arts and media professionals 12.0% 77.1% 10.8% 0.08 36.4% 38.9% 17.2% 7.5% 23.22
22 Business, human resource and marketing professionals 6.0% 94.0% 1.45 62.9% 21.8% 0.0% 15.2% 32.46
23 Design, engineering, science and transport professionals 30.9% 69.1% 0.63 52.2% 31.1% 0.2% 16.5% 27.42
24 Education professionals 1.0% 97.4% 1.6% 0.31 3.1% 60.7% 22.8% 13.3% 77.13
25 Health professionals 100.0% 0.17 4.5% 0.8% 0.2% 94.5% 10.57
NCVER Report 2 final Page 21
Apprentice or trainee VET students Not apprentice or trainee VET student
Students enrolled in the public VET systemDiploma & above
Cert. III & IV Cert. I & II
Total (‘000)
Diploma & above
Cert. III & IV Cert. I & II
Non-AQF or subject only
Total (‘000)
26 ICT professionals 88.5% 11.5% 0.03 57.9% 1.0% 41.0% 5.79
27 Legal, social and welfare professionals 69.6% 30.4% 0.06 66.5% 9.5% 1.5% 22.5% 6.25
2 sub-total 13.1% 86.4% 0.5% 2.72 29.3% 39.4% 12.0% 19.3% 183.10
30 Technicians and trades workers – nfd 0.00 0.00
31 Engineering, ICT and science technicians 18.0% 81.9% 0.1% 5.11 40.1% 53.0% 1.5% 5.5% 61.47
32 Automotive and engineering trades workers 0.0% 99.8% 0.2% 51.13 3.4% 55.4% 10.1% 31.1% 22.87
33 Construction trades workers 99.9% 0.1% 49.02 35.1% 17.2% 47.6% 29.73
34 Electrotechnology and telecommunications trades workers 0.1% 99.9% 0.1% 32.08 2.6% 39.5% 13.1% 44.8% 16.33
35 Food trades workers 0.0% 100.0% 17.36 0.8% 92.6% 0.1% 6.5% 10.70
36 Skilled animal and horticultural workers 0.4% 94.5% 5.1% 7.01 4.9% 66.0% 20.7% 8.4% 16.95
39 Other technicians and trades workers 0.1% 99.5% 0.4% 19.83 16.3% 52.8% 8.4% 22.4% 34.10
3 sub-total 0.5% 99.1% 0.3% 181.54 16.8% 52.7% 8.8% 21.7% 192.15
40 Community and personal service workers – nfd 0.00 100.0% 0.02
41 Health and welfare support workers 9.5% 90.5% 0.0% 4.19 39.9% 56.0% 0.8% 3.3% 55.20
42 Carers and aides 0.0% 99.2% 0.8% 15.31 0.4% 83.1% 10.4% 6.1% 67.10
43 Hospitality workers 0.0% 84.7% 15.3% 18.47 0.4% 23.4% 58.4% 17.8% 83.99
44 Protective service workers 0.3% 87.8% 11.9% 0.86 10.0% 37.7% 29.6% 22.6% 10.25
45 Sports and personal service workers 0.1% 91.0% 8.9% 5.49 1.8% 44.5% 46.2% 7.5% 38.32
4 sub-total 0.9% 91.1% 8.0% 44.32 9.5% 49.9% 30.3% 10.2% 254.88
50 Clerical and administrative workers – nfd 0.00 100.0% 0.13
51 Office managers and program administrators 1.0% 99.0% 7.07 28.4% 66.5% 3.1% 1.9% 28.38
52 Personal assistants and secretaries 100.0% 0.00 43.5% 0.2% 56.3% 0.42
53 General clerical workers 84.4% 15.6% 15.39 29.5% 66.1% 4.4% 74.56
54 Inquiry clerks and receptionists 95.8% 4.2% 8.37 0.5% 49.1% 46.8% 3.5% 10.94
NCVER Report 2 final Page 22
Apprentice or trainee VET students Not apprentice or trainee VET student
Students enrolled in the public VET systemDiploma & above
Cert. III & IV Cert. I & II
Total (‘000)
Diploma & above
Cert. III & IV Cert. I & II
Non-AQF or subject only
Total (‘000)
55 Numerical clerks 98.2% 1.8% 2.77 0.2% 88.3% 2.5% 9.1% 23.77
56 Clerical and office support workers 0.00 70.1% 29.9% 1.33
59 Other clerical and administrative workers 0.2% 93.4% 6.4% 1.97 20.7% 42.6% 20.2% 16.5% 12.28
5 sub-total 0.2% 91.6% 8.2% 35.58 7.2% 47.7% 39.0% 6.0% 151.80
60 Sales Workers – nfd 0.00 0.00
61 Sales representatives and agents 0.3% 99.7% 1.57 10.7% 67.7% 21.6% 9.82
62 Sales assistants and salespersons 46.4% 53.6% 32.85 21.9% 70.9% 7.2% 16.73
63 Sales support workers 96.6% 3.4% 0.18 34.3% 34.5% 2.4% 28.9% 1.10
6 sub-total 0.0% 49.1% 50.9% 34.61 5.2% 38.7% 43.0% 13.2% 27.66
70 Machinery operators and drivers – nfd 0.00 100.0% 0.01
71 Machine and stationary plant operators 83.4% 16.6% 4.06 0.1% 55.7% 36.4% 7.8% 10.74
72 Mobile plant operators 99.9% 0.1% 2.24 40.1% 4.4% 55.5% 5.12
73 Road and rail drivers 97.1% 2.9% 5.78 62.6% 27.5% 9.9% 9.84
74 Storepersons 87.3% 12.7% 5.82 20.1% 77.3% 2.5% 11.13
7 sub-total 91.2% 8.8% 17.91 0.0% 44.6% 42.0% 13.4% 36.83
80 Labourers – nfd 100.0% 0.00 100.0% 0.04
81 Cleaners and laundry workers 87.8% 12.2% 3.77 10.1% 89.9% 0.0% 4.68
82 Construction and mining labourers 32.1% 67.9% 1.83 0.0% 8.8% 60.5% 30.6% 25.50
83 Factory process workers 29.4% 70.6% 9.68 4.7% 91.3% 4.0% 21.55
84 Farm, forestry and garden workers 15.0% 85.0% 3.17 0.1% 9.9% 74.6% 15.3% 27.75
85 Food preparation assistants 100.0% 0.33 73.8% 26.2% 16.65
89 Other labourers 30.7% 69.3% 2.70 12.8% 79.9% 7.4% 16.69
8 sub-total 37.5% 62.5% 21.49 0.0% 7.6% 75.9% 16.4% 112.85
Generic codes 0.4% 93.0% 6.7% 0.54 0.9% 10.2% 30.2% 58.7% 189.02
NCVER Report 2 final Page 23

Apprentice or trainee VET students Not apprentice or trainee VET student
Students enrolled in the public VET systemDiploma & above
Cert. III & IV Cert. I & II
Total (‘000)
Diploma & above
Cert. III & IV Cert. I & II
Non-AQF or subject only
Total (‘000)
Other 100.0% 108.05
Total 1.8% 86.7% 11.5% 345.80 14.2% 32.7% 25.4% 27.7% 1,360.88
Source: VET Provider Collection 2009.
Table A2 shows that the distribution of qualifications of the more specific occupations varies within the broader occupational groups in table 4 in the body of the paper, sometimes considerably. For example, amongst professionals, those in arts and media tend to be lower-qualified. This may reflect relative differences in the value of qualifications between subgroups within broader occupational groups. On the other hand, amongst technical and trades workers, those in engineering, ICT and science tend to be more highly qualified than others in the broader group. In some cases this may be because they are undertaking work for which they are over-trained.
Table A2 Persons by occupation of employment (ANZSCO) by level of highest non-school qualification, 2006
Occupation 06 (ANZSCO) (OCC06P)Postgraduate degree level
Graduate diploma & graduate certificate level
Bachelor degree level
Advanced diploma & diploma level
Certificate level
No qualification
Total number (‘000) (a)
Not stated 1.5% 0.5% 7.1% 4.6% 17.4% 68.9% 74.91Inadequately described 4.1% 1.4% 14.3% 9.1% 21.9% 49.3% 90.6810 Managers – nfd 7.6% 2.5% 20.2% 12.2% 21.4% 36.0% 49.3611 Chief executives, general managers & legislators 12.6% 3.7% 26.0% 12.3% 17.8% 27.5% 86.4612 Farmers & farm managers 0.8% 0.7% 6.6% 7.8% 17.8% 66.3% 176.8613 Specialist managers 9.6% 4.3% 26.8% 13.0% 20.4% 25.9% 515.6614 Hospitality, retail & service managers 1.8% 1.2% 11.5% 10.6% 22.3% 52.7% 373.93ANZSCO 1 Total sub-total 6.1% 2.7% 18.8% 11.4% 20.4% 40.6% 1,202.2720 Professionals – nfd 31.1% 5.3% 37.1% 7.6% 6.0% 12.9% 24.2021 Arts & media professionals 6.2% 3.9% 33.5% 12.6% 10.6% 33.3% 68.7522 Business, human resource & marketing professionals 9.5% 4.8% 42.2% 13.7% 9.9% 19.9% 445.5223 Design, engineering, science & transport professionals 14.4% 2.9% 48.6% 14.7% 9.8% 9.6% 245.9124 Education professionals 14.2% 12.8% 52.1% 13.6% 2.9% 4.4% 399.66
NCVER Report 2 final Page 24

Occupation 06 (ANZSCO) (OCC06P)Postgraduate degree level
Graduate diploma & graduate certificate level
Bachelor degree level
Advanced diploma & diploma level
Certificate level
No qualification
Total number (‘000) (a)
25 Health professionals 9.7% 7.1% 59.2% 14.6% 5.6% 3.8% 347.5926 ICT professionals 11.3% 3.8% 46.3% 12.5% 8.5% 17.6% 145.1327 Legal, social & welfare professionals 18.2% 8.1% 54.9% 8.1% 4.1% 6.6% 129.24ANZSCO 2 Total sub-total 12.2% 6.9% 49.3% 13.3% 7.0% 11.3% 1,806.0130 Technicians & trades workers – nfd 0.9% 0.4% 6.2% 9.3% 51.6% 31.5% 17.8631 Engineering, ICT & science technicians 2.6% 1.5% 17.2% 20.9% 32.6% 25.3% 170.5432 Automotive & engineering trades workers 0.1% 0.1% 1.1% 2.6% 71.9% 24.3% 298.0933 Construction trades workers 0.1% 0.1% 1.0% 1.8% 62.3% 34.7% 274.1034 Electrotechnology & telecommunications trades workers 0.4% 0.2% 2.9% 6.6% 65.5% 24.4% 163.9135 Food trades workers 0.5% 0.1% 3.5% 4.7% 46.0% 45.2% 129.0836 Skilled animal & horticultural workers 0.4% 0.4% 4.8% 7.7% 37.0% 49.7% 86.9239 Other technicians & trades workers 0.4% 0.4% 4.1% 7.0% 55.7% 32.4% 168.77ANZSCO 3 Total sub-total 0.6% 0.4% 4.3% 6.5% 56.8% 31.4% 1,309.2640 Community & personal service workers – nfd 4.3% 2.7% 18.1% 13.3% 24.6% 37.1% 0.8141 Health & welfare support workers 2.1% 2.8% 18.6% 28.3% 31.0% 17.2% 87.9342 Carers & aides 0.7% 0.9% 7.3% 13.4% 33.6% 44.1% 302.0943 Hospitality workers 0.7% 0.2% 7.3% 7.0% 14.6% 70.2% 182.4444 Protective service workers 1.3% 1.8% 10.0% 18.5% 27.1% 41.2% 117.3245 Sports & personal service workers 1.4% 1.3% 13.1% 19.1% 25.2% 40.0% 111.30ANZSCO 4 Total sub-total 1.0% 1.1% 9.8% 15.1% 26.7% 46.2% 801.9050 Clerical & administrative workers – nfd 4.0% 2.1% 19.0% 12.1% 16.9% 45.8% 4.2051 Office managers & program administrators 4.7% 2.9% 18.8% 13.9% 19.6% 40.3% 188.1052 Personal assistants & secretaries 0.7% 1.0% 8.0% 13.8% 18.4% 58.0% 138.5853 General clerical workers 1.4% 1.1% 10.3% 9.8% 17.9% 59.6% 260.0054 Inquiry clerks & receptionists 1.1% 0.7% 9.2% 9.7% 20.2% 59.0% 202.8655 Numerical clerks 2.1% 1.0% 13.3% 11.8% 16.0% 55.9% 292.7556 Clerical & office support workers 1.2% 1.0% 8.6% 7.2% 18.6% 63.3% 92.8259 Other clerical & administrative workers 2.0% 1.6% 13.8% 10.9% 20.1% 51.7% 186.50ANZSCO 5 Total sub-total 2.0% 1.3% 12.1% 11.2% 18.5% 55.0% 1,365.8060 Sales workers – nfd 2.2% 0.4% 10.5% 8.3% 16.5% 62.1% 2.7061 Sales representatives & agents 1.6% 1.0% 12.3% 13.2% 25.0% 46.9% 170.4862 Sales assistants & salespersons 0.7% 0.3% 5.6% 5.3% 14.0% 74.1% 583.4763 Sales support workers 1.0% 0.3% 6.0% 5.5% 11.1% 76.1% 139.56ANZSCO 6 Total sub-total 0.9% 0.4% 7.0% 6.8% 15.6% 69.3% 896.20
NCVER Report 2 final Page 25

Occupation 06 (ANZSCO) (OCC06P)Postgraduate degree level
Graduate diploma & graduate certificate level
Bachelor degree level
Advanced diploma & diploma level
Certificate level
No qualification
Total number (‘000) (a)
70 Machinery operators & drivers – nfd 0.1% 0.1% 1.5% 2.6% 31.4% 64.4% 10.2871 Machine & stationary plant operators 0.3% 0.2% 3.1% 3.5% 26.6% 66.4% 164.9972 Mobile plant operators 0.1% 0.1% 1.1% 2.0% 22.7% 74.0% 94.1473 Road & rail drivers 0.7% 0.2% 3.1% 3.2% 23.6% 69.1% 238.3574 Storepersons 0.5% 0.2% 3.5% 4.0% 18.3% 73.5% 96.85ANZSCO 7 Total sub-total 0.5% 0.2% 2.8% 3.2% 23.6% 69.8% 604.6280 Labourers – nfd 0.2% 0.1% 1.7% 2.3% 17.1% 78.5% 22.4881 Cleaners & laundry workers 0.7% 0.2% 4.1% 4.1% 14.2% 76.7% 215.0982 Construction & mining labourers 0.1% 0.1% 1.6% 2.3% 28.4% 67.4% 119.3183 Factory process workers 0.5% 0.2% 3.8% 3.4% 16.1% 75.9% 207.2984 Farm, forestry & garden workers 0.3% 0.2% 3.2% 4.0% 21.6% 70.7% 96.0985 Food preparation assistants 0.7% 0.2% 3.7% 3.3% 10.0% 82.2% 116.0389 Other labourers 0.5% 0.3% 3.5% 4.2% 21.2% 70.4% 176.25ANZSCO 8 Total 0.5% 0.2% 3.4% 3.6% 18.0% 74.3% 952.53Grand Total 4.0% 2.2% 17.2% 9.5% 22.8% 44.3% 8,889.23Not applicable (not employed) 0.8% 0.4% 4.0% 3.4% 7.7% 83.7% 10,751.11
Total 2.3% 1.3% 10.4% 6.4% 15.0% 64.7%19,855.2
9
NCVER Report 2 final Page 26

International comparisons
Brian Knight
NCVER Report 2 final Page 27

IntroductionIn this paper we examine some of the key features of the apprenticeship systems in a selection of other countries, including the United Kingdom, from which the Australian system originates.
Apprenticeships and traineeships are notoriously difficult to define consistently (Ryan 1998, p.289). For the purposes of the present paper it is necessary to use a broader definition than that which applies in contemporary Australia. In the broader view, an apprenticeship or traineeship is defined by:
an employment-based training arrangement involving an employer, an employee or prospective employee, and an education or training provider
an occupational training program that consists of a combination of on-the-job training and formal learning (usually undertaken off-the-job)
a set of regulatory arrangements or a legal contract (originally an ‘indenture’) that specifies the rights and obligations of the three parties—the individual, the employer and the training provider.
The additional feature that defines apprenticeships and traineeships in Australia is that the apprentice or trainee is an employee from the start, and the on-the-job and the formal or off-the-job components of the training program proceed concurrently; this is not the case in many countries.
Other aspects of apprenticeship and traineeship systems that need to be scrutinised critically include:
whether the system is primarily intended to provide initial education and training for young people or training opportunities for people of all ages
where the scope is people of all ages, whether a ‘one size fits all’ approach is adopted
the balance of general education and training, formal vocational training, and on-the-job training, in the overall training program
articulation arrangements and pathways involving other sectors of the education and training system
the relative importance of apprenticeships and traineeships in skill-formation systems
the nature and extent of government funding, relative to funding from other sources, particularly employers and individuals
the economic, social and cultural environments in which the system operates, and the extent to which these are reflected in government policies and practices.
While an economic perspective underpins this report, cultural, social and philosophic perspectives cannot be ignored when considering the institutional structures for apprenticeships and traineeships.
NCVER Report 2 final Page 28

Selection of countries for comparisonNCVER has chosen nine country apprenticeship systems for comparison with Australia’s arrangements. They are the United Kingdom, Germany, Denmark, Switzerland, Singapore, the United States, China, Sweden (a country that has rejected apprenticeships), India, and Algeria.
The United Kingdom has been chosen because its system of indentured training was adopted by the Australian colonies and provided the basis for the development of Australia’s apprenticeship and traineeship system. Australia’s contemporary system most closely resembles that in the United Kingdom.
Germany is included because it is closely associated with the apprenticeship model known as the ‘dual system’, so named because learning occurs in both a workplace and vocational schools. The German dual system is perhaps more closely studied than any other, in part because it covers a very wide range of occupations and has provided Germany with skilled workers in periods of strong economic growth in the last half-century.
The dual system or variants of it is also found in Austria, Switzerland, the Netherlands and Denmark. For the comparisons, NCVER has included Denmark because of the role of the ‘social partners’—employers, unions and government (representing the community)—and the country’s strong cultural commitment to the education and training of young people.
Switzerland is included for a number of reasons. The apprenticeship system is very large and delivers very high levels of skill to an exporting economy that depends upon science, technology and knowledge-intensive industries. Perhaps because of this, Switzerland has the smallest higher education system in the OECD. Also, it has effective pathways from apprenticeships into higher education.
In Singapore, rapid economic growth has created an ongoing need for skilled workers in trade and technician occupations. In contrast to Australia, a clear distinction is made between initial and continuing education and training. Also, apprenticeships mostly begin with two years of institutional training before the employment-based training is undertaken.
The world’s largest economy, the United States, makes relatively limited use of apprenticeships for skills formation. The great majority of entry-level training consists of institutional learning followed by employment, and most continuing VET is delivered by private providers or as company in-house programs with relatively little public funding or regulation. Also, the funding and governance arrangements are highly decentralised.
NCVER’s other four country examples may seem odd but have been chosen because they have features which are in contrast to Australia’s apprenticeship and traineeship arrangements.
Sweden provides an example of a country that has dispensed with apprenticeships almost completely (on equity grounds), and other mechanisms have replaced them, such as institution-based training, mandatory structured workplace learning for school students, and company training programs for employees. Sweden’s training system may have its problems (Kuczera et al. 2008) but scrapping apprenticeships did not cause the country’s skill-formation system to collapse either.
The world’s two most populous countries, China and India, both have rapidly growing economies that generate a major need for skilled workers in trade and related occupations. Both have apprenticeships but they are structurally different. India’s model appears to offer more options than China’s institution-based approach but the limited evidence available suggests that China’s apprenticeship system does a better job of meeting skill needs, and on a large scale.
NCVER Report 2 final Page 29

The final country discussed is Algeria. It is included because it provides an example of a nation that has implemented a levy-based system for financing apprenticeship training that appears to have leveraged a significant increase in apprenticeship numbers. Such a levy would not be popular in Australia.
Each of these country systems is described in more detail later in this paper. The major themes to emerge from the comparison with the Australian system are presented in the discussion below.
DiscussionMost countries have much stronger linkages between their general education and apprenticeship systems than is found in Australia. The link is also quite weak in the UK and US where a young person can leave school to undertake an employment-based apprenticeship or traineeship. In many other countries the importance placed on general education would not allow this to occur. The apprenticeship system in countries such as Germany, Denmark, Switzerland and Singapore is as much a continuation of schooling as the beginning of entry-level training. A recent OECD report has also commented positively on Switzerland for the extension of this integration to the final assessments of the general education, formal vocational and work-based components of apprenticeship programs (Hoeckel & Schwartz 2010, pp.41–3).
The range of occupations that fall within the scope of apprenticeships and traineeships varies considerably but there is little to indicate whether this mode of training works better in some occupations or industries than others. In countries such as Germany, India and Australia the scope is quite broad, whereas in the US and China it is relatively narrow. In some countries, such as France, apprenticeships mostly occur in trade and technician occupations. There are also apparent anomalies; for example, in Germany the banks actively participate in the apprenticeship system but this is not the case in Australia.
The supply of training places provided by employers is an issue, particularly for countries such as Australia and the UK that use the ‘place and train’ model almost exclusively. Countries such as China and Singapore that use the ‘train and place’ model—the institutional pathway—are better placed to maintain training numbers during periods of economic downturn. In Germany and Denmark, there is a long-standing tradition of employer commitment to dual-system training which ameliorates the training places problem. Sweden’s response to the training places supply issue—to abandon apprenticeships almost completely—is perhaps the most extreme but is understandable in the context of that country’s social and education priorities.
The example of Sweden also raises the question of whether a regulated apprenticeship system for training in trades and skilled occupations is needed at all. There is no evidence that abandoning apprenticeships exacerbated skills shortages in apprenticeship occupations (CEDEFOP 2008b). The US meets its skill needs mostly through a combination of institutional and company training with relatively little reliance on employment-based apprenticeships. Support for an approach such as that adopted by Sweden is also provided by the arrangements for training professionals and para-professionals found internationally: most begin with a substantial amount of institution-based learning, which can include general education as well as specific vocational content.
In Australia, assessment and certification of apprentice and trainee achievement is undertaken by registered training organisations under the provisions of the Australian Quality Training Framework (AQTF). In some countries (for example, Germany, France) this function is undertaken or controlled by agencies which are independent of the provider and the governance structures reflect this. Whether one approach is better than the other is unclear; the country guidelines issued by Australian Education International for immigration purposes provide examples of both approaches where the standards achieved are considered acceptable to Australia.
NCVER Report 2 final Page 30

Internationally, initial VET is more tightly regulated than continuing VET, and apprenticeships and traineeships are strongly regulated in most countries. Those with strong central governments, such as France, or strong federal systems, such as Germany, have high levels of regulation and quality control. The United States has the most market-driven system for vocational education and training, including apprenticeships, and is also the least regulated; the same does not apply to their schooling sectors, and indirect mechanisms also operate in VET.
Australia is the only country that pays government incentives and subsidies on a large scale to the employers of apprentices and trainees to offset wage costs. Some countries do have much more limited incentives, based on an assessment of need (for example, some continuing education and training programs in Singapore), or to create training opportunities for people who are disadvantaged or have a disability, or in response to economic circumstances such as the recent global financial crisis. Until the early 1990s Denmark did pay some subsidies but they have been phased out and the research evidence points to their patchy effectiveness (CEDEFOP 2008a).
Among countries there is considerable variation in the systemic and institutional arrangements that produce skilled workers. A few like Australia have the UK-derived ‘place and train’ apprenticeship model, a larger number use the Germanic ‘dual system’ or variants of it, a majority mainly use the ‘train and place’ model (the institutional pathway), there are numerous approaches in operation in the US, and Sweden has dispensed with apprenticeships. Despite this, developed countries meet most of their needs for skilled workers in trades and related occupations irrespective of the apprenticeship model that they use, and they experience skill shortages in buoyant economic times and oversupplies during economic downturns; there is no single correct answer.
In recent decades Australia has developed an apprenticeship and traineeship system based on much higher levels of government funding for employers, but there is little evidence that this leads to better labour market outcomes than is found elsewhere.
NCVER Report 2 final Page 31

Country apprenticeship systemsUnited KingdomThe system of indentured apprenticeship for training in the crafts and trades was well established in the United Kingdom by the 14th century and has endured. It is the foundation of Australia’s apprenticeship system (Report 1). Note that the discussion of the United Kingdom here refers to England, Northern Ireland and Wales but excludes Scotland, which has remained largely independent in matters of education and training and has developed its own qualifications framework. Also, the discussion does not take account of changes flowing from the change of government earlier in 2010 or the large-scale cuts to public spending in the new government’s first (emergency) budget.
The United Kingdom most closely resembles Australia in its industry involvement. Two points of difference are worth noting. First, in Australia individual employers are more directly engaged in the VET system than in the United Kingdom because of the provision for enterprise registered training organisations, of over ten years standing in Australia compared with two years in the United Kingdom. Enterprise registered training organisations s are able to provide formal training to apprentices and trainees, and some of Australia’s most prominent enterprises—Qantas, for example—use this approach. Second, some of the functions currently performed in Australia by the Department of Education, Employment, Training and Workplace Relations, Skills Australia or state training authorities are performed in the United Kingdom by sector skills councils.
The UK system of training is much less regulated than the German dual system. Employer investment in training in the UK is through a ‘laissez-faire’ system of training, where few regulations are imposed on employer training activities and employers may train according to their business needs (Smith & Billett 2004). In terms of apprenticeships and traineeships, the United Kingdom has a weak connection between industry and further education delivery, with the majority of trainees in the main building trades studying while unemployed. This weak connection with industry can result in trainees experiencing difficulties obtaining work experience and employment upon completion of their training (Clarke & Herrmann 2004).
As in Australia, the range of occupations and industries in the UK that utilise the apprenticeship model has expanded (table A1 in appendix), and there are many other apparently similar developments, such as increased industry involvement in determining the occupations that are covered by apprenticeships and traineeships and the required competency standards. Although reforms in the 1990s were addressing very similar economic goals, Billett (1997) argues that there are notable differences in policy responses and their implementation in the two countries. In Australia, New Apprenticeships (1998) and later developments such as the AQTF have sought to constrain state and local variation and to assure quality, whereas UK Modern Apprenticeships (1994) promoted adaptability and relied more on employer or industry commitment than regulation for the integrity of the results.
In recent years the United Kingdom has been especially concerned about complexity, including the structure and governance of its apprenticeship system, apparently with due cause. Complexity is a feature of the system that not only confronts learners (and prospective learners) but also employers and training providers, both of whom can find themselves enmeshed in complex regulatory arrangements, particularly in accounting for use of public funds.
NCVER Report 2 final Page 32
A particular problem in the United Kingdom has been the lack of stability in the bodies and agencies that administer the system and the programs and mechanisms put in place to deliver training. The system is recognisably sufficiently complex to government authorities that they are attempting to find ways of reducing its visible complexity to clients—referred to as ‘hiding the wiring’—although there is no apparent attempt to find ways of minimising complexity as a principle in the design of delivery mechanisms and regulatory arrangements. Australia, too, is caught up in some complex regulatory arrangements—state differences in licensing requirements for some trades, for example—although not to the same apparent degree as in the United Kingdom.
In its recent country comparisons report to Skills Australia (Cully et al. 2009), NCVER identified a number of lessons that might be drawn from the exercise. These lessons apply as much to the apprenticeship and traineeship system as to the broader VET system:
Compared with the two countries whose historical development is most similar—the United Kingdom and Canada—Australia’s VET system does a better job of integrating and co-opting industry parties as partners. Much of the institutional apparatus in Australia has acquired legitimacy over time—industry advisory arrangements, the boards of state training authorities, enterprise registered training organisations.
In contrast to many OECD countries, Australia lacks a clear rationale for the purpose of government funding of VET, including the incentives paid to employers of apprentices and trainees. Other countries seem much more clear eyed about their strategic intent, typically focusing their attention on entry-level training and largely leaving continuing training to employers and industry to determine for themselves (albeit, within many European countries, in a framework of compulsory training levies).
GermanyGermany has a federal system of government, with 16 states (Länder) and a national government. The states are responsible for VET; however, VET is driven at a national level and organised in partnership between federal and state governments (Sung et al. 2006). Germany is closely associated with the apprenticeship model known as the ‘dual system’, so named because learning occurs in both a workplace and in vocational schools. However, it is not the only country to use this model, which is also found in Austria, the Germanic cantons of Switzerland, the Netherlands and Denmark.
In the dual system, practical training occurs principally in a workplace (cf Australia, where much of the practical training is delivered at a TAFE institute or registered training organisation) and this is complemented by the underpinning knowledge, generic skills and theory that are delivered in schools. Responsibility for the operation of the dual system is agreed between employers and the federal and state governments. Germany’s education and training system is among the most studied because it is regarded as a factor that contributed to the success of German industry in the second half of the 20th century.
In Germany, responsibility for the operation of the dual system is shared and is agreed between employers, trade unions and the federal and state governments. The federal government is responsible for some aspects of the regulation and monitoring of the in-company part of the dual system, but not for ongoing or further in-company training, with the states being responsible for the part that occurs in the vocational schools, and enterprises being responsible for the in-firm delivery.
The social partners—employers’ associations and trade unions—have decision-making powers and responsibilities. Skill formation is highly regulated and the content of training is strongly influenced by employer needs. Social partners are closely involved in the development of regulations and guidelines for VET and work collaboratively with the various levels of
NCVER Report 2 final Page 33

government in policy development and management of the VET system. The major institutions include national and state government departments, and a range of decision-making and advisory bodies at state and regional level. Competent bodies at a regional level are responsible for quality assurance of providers, for program delivery, and for assessment and certification.
Industry parties form an intrinsic part of the German dual system. The tripartite nature of decision-making bodies ensures that industry parties are consulted and have decision-making powers in VET. While industry parties are deeply embedded in the German VET system, some authors believe that the dual system is under stress. It is also expensive and can be ‘severely tested’ by changing economic conditions (Sung et al. p.104). The heavy regulation and consultative processes associated with developing new qualifications also potentially limit the German training system’s ability to respond quickly to changing skill needs. Keating (2008) argues that Germany is faced with the challenge of maintaining its training culture, but also introducing greater flexibility, market responsiveness and innovation into the VET system.
German apprenticeship training is a highly standardised and regulated system, where apprentices combine paid work with training. Apprentices work on-the-job on production activities with other experienced and skilled workers who teach them the basic skills they need until they can work independently. Apprentices gain their theoretical knowledge and general education through part-time attendance in a vocational school (Misko 2006). Training is divided between employer-provided training and training received in vocational training schools. It should be noted that the curriculum of the vocational schools bears little resemblance to the curriculum of apprentices in Australia when they attend TAFE. There is nothing in the way of practical work, all of which is delivered by the firm or by inter-firm agencies, and it will include subjects such as sport, civics or business studies, in addition to more conventionally defined trade theory. Firms and vocational schools are jointly recognised as places of learning and vocational training is the responsibility of both the private and public sectors (Clarke & Herrmann 2004).
Employers provide the bulk of the funding for the German dual system through payments made by firms employing apprentices to the chambers of commerce and the craft chambers (Smith & Billett 2004). The chambers also have responsibility for setting apprentices’ final examinations (Misko 2006). While the government role focuses on initial training, continuing VET is largely left to employers
A number of commentators have provided critical commentary on the UK and German VET systems, both of which give industry a significant role in policy development and management. While industry parties are embedded deeply in the German vocational education and training system, Sung et al. (2006) consider the German dual system to be under stress. However, the German training system is an example of how employers’ commitment to training can be secured through regulation and consensus; however, the system is expensive and can be ‘severely tested’ by changing economic conditions (Sung et al. 2006, p.104).
Many of the institutional arrangements surrounding apprenticeships in Germany function effectively because of the deep embedding and social and political acceptance of employers and unions as ‘social partners’. To attempt to replicate one particular aspect of German arrangements in Australia would most likely fail because of the absence of the buttress provided by the social partners, which operate in Germany at local, regional, sectoral and national level—and are interdependent. For example, in Germany it is local chambers of commerce and industry and chambers of crafts who certify the technical aptitude of trainers and who conduct examinations and assessments.
NCVER Report 2 final Page 34

DenmarkDenmark’s VET system includes apprenticeships as an entry-level training option. The apprenticeship system has many of the features of the dual system found in Germany, the Netherlands and other northern European countries. It covers a wide range of occupations, extending well beyond the traditional trades. The Danish VET system is based on three main principles:
the dual training principle—periods in school alternating with periods of training in an enterprise—which ensures that the trainees acquire theoretical, practical, general and personal skills which are in demand by the labour market
the principle of social partner involvement, whereby the social partners take part directly in the overall decision-making and daily running of the VET system
the principle of lifelong learning—the system is highly flexible, offering learners the possibility of taking part of a qualification now and returning to the VET system at a later time to add to their VET qualifications in order to access further and higher education.
In contrast to its near neighbour Sweden, which has dispensed with the apprenticeship model of training, Denmark has continued to reform and strengthen its apprenticeship system (National Education Authority 2008).
The governance arrangements for the apprenticeship system involve Denmark’s three levels of government. The national government and central administration based in Copenhagen sets broad policies and directions, establishes standards and provides funding. For administrative and local management purposes the country is divided into five regions (counties) and 98 municipalities.
Industry is deeply embedded in VET through legislation and cultural tradition. Training is regulated by joint government, union and employer committees. Employer commitment to training is based on government funding and on consensus among the social partners at the firm level on the importance of training. Employers are involved in providing training and most Danish collective agreements between employers and unions include provisions for training (Smith & Billett 2004). The ‘social partners’ are heavily involved in the design, delivery and assessment of training, and they can also have considerable influence on providers if the latter are under-performing or not meeting their clients’ needs (Cully et al. 2009).
Initial and continuing VET have been integrated in order to ensure coherence between different qualifications and competence levels. Since 1991, Denmark has operated a unified VET system, including apprenticeships, with single institutions providing initial and continuing VET, and partial qualifications have been introduced. Also, responsibility for education and training has been increasingly devolved and decentralised. The social partners are actively involved in all aspects of VET provision and can have considerable influence on providers. There is a strong tradition of free education and training in Denmark, and funding for VET is provided by the national government under the ‘taximeter’ system (see below). However, management and quality assurance are undertaken at the municipal level.
The system for managing and financing initial VET in Denmark following major reforms in 1989 warrants attention (National Education Authority 2008, pp.42–3). The government’s reforms introduced new overall steering mechanisms in the VET system: instead of fixed national rules and curricula, the vocational colleges are now required to operate within a devolved system of management by objectives. The regulations and guidelines on VET became framework regulations, and the colleges are required to develop local education plans and adapt them to the needs of local industry and the local labour market. The overall aim is to make the VET system more responsive to changes in the labour market and the needs of clients.
NCVER Report 2 final Page 35

The new system changed the status of the vocational colleges. They became independent public organisations (cf TAFE institutes in Victoria), and instead of a fixed budget their finances are now based on a combination of fixed grants and ‘taximeter’ rates—a variable rate—based on trainee intake and completion rates. The intention was to make the colleges more market-oriented, more competitive and more professional in their overall management. Granting the providers greater budgetary control and greater autonomy to allow them to adapt VET provision to local needs and demands increased the need for quality assurance arrangements that ensure national consistency in VET provision and the maintenance of national standards.
The 1989 reforms significantly changed the entire institutional and administrative arrangements for VET provision and public funding. Related reforms introduced at the same time introduced the pedagogical principles of interdisciplinary and holistic teaching. Further reforms in 2000 sought to move the vocational college approach to teaching and learning provision from a class-based to a student-centred model.
SwitzerlandCommentators such as Richard Sweet (pers. comm.) suggest that Switzerland, like Denmark, has a very effective apprenticeship system for providing entry-level training to young people in a high-technology economy. Switzerland is a relatively small country (population 7.8 million) and like Australia, is a federation (it has 26 cantons, some quite small). Per capita income is one of the highest in the world and the country is very dependent on a highly skilled and educated workforce for its prosperity.
The aspects of the Swiss apprenticeship system that are instructive are:
The country uses the Germanic dual system, and governance arrangements are similar to Denmark’s (the national government sets broad policy and directions, but most administration and regulation occurs at canton level).
The apprenticeship system covers a wide range of occupations, is relatively very large and has been able to stay large for a long period, which indicates its attraction to young people and employers.
It delivers very high levels of skill to an exporting economy that depends upon science, technology and knowledge-intensive industries, and in relative terms Switzerland is able to have the smallest higher education system in the OECD.
The apprenticeship system in Switzerland has very effective pathways into higher education and this helps to give it great prestige. It is not in practice a dead-end for low academic achievers.
The system is extremely well governed and coordinated at both national and cantonal levels. Rauner’s analysis (2009) of apprenticeship system governance in the three German-speaking countries, along with Denmark, demonstrates this point.
The funding arrangements for apprenticeships in Switzerland—a mix of government and employer contributions—allows the employer to achieve a positive return within the duration of a training contract (Scharnhorst 2009).
NCVER Report 2 final Page 36

SingaporeSingapore relies heavily on an educated and skilled workforce and uses the apprenticeship model to provide entry-level training in trade occupations to young people. In its VET system, Singapore maintains a clear separation between initial and continuing education and training. Initial education and training—which is designed to continue general education and schooling—is delivered by polytechnics and the Institute of Technical Education (ITE). Continuing education and training (CET) is delivered by approved training organisations, employers and unregistered providers. Apprenticeships in Singapore are part of initial education and training but it is CET which is closer to the overall VET system in Australia.
In less than 50 years Singapore has experienced a transformation from a low-wage, low value-added trading and manufacturing economy to a high-technology manufacturing and services economy. Average GDP per capita is now comparable with Australia’s. Sustained growth has also created a considerable demand for skilled (as well as unskilled) workers in the construction sector. Government education and training policy focused initially on the school and higher education sectors, followed by initial education and training for young people (including apprenticeships), and in the last decade on the continuing education and training sector. Despite the considerable public investment in education and training, Singapore continues to depend on foreign professional and skilled workers. (Continued upskilling of the local population has also made Singapore heavily dependent on foreign unskilled workers.)Singapore uses two basic models of vocational education and training:
‘train and place’, whereby the individual undertakes institutional training and then moves into employment. In contrast to Australia but in keeping with most other countries, Singapore uses this model for apprenticeships, and the institutional training is funded by government;
‘place and train’, whereby the individual simultaneously studies part-time with a continuing education and training provider and works or trains with an employer. Government funding may also apply, based on an assessment of the needs of the employee or the employer, and these programs have much in common with traineeships in Australia.
The Singapore Government provides funding for initial education and training, including apprenticeships, through the Ministry of Education. Government funding for continuing education and training programs is provided on a needs basis, and is managed by the Workforce Development Agency within the Ministry of Manpower.
The recent appearance of a traineeship equivalent in Singapore is due in part to the development of a formal continuing education and training sector, which is relatively new, and has been supported by several major initiatives. In 2003 the Workforce Development Agency was established as a statutory board under the Ministry of Manpower. Since then workforce skills qualifications have been developed, which specify standards for competencies and qualifications for a wide range of industries and occupations. (These qualifications also include the Advanced Certificate in Training and Assessment, modelled on the Australian equivalent.) From 2008, Singapore’s Skills Program for Upgrading and Resilience has provided significant government funding to assist people who are unemployed or under threat of retrenchment to upgrade their skills or train for a new occupation or industry. This assistance is available at all levels, including for professionals, managers, executives and technicians. Most programs involve a workforce skills qualification, and many ‘place and train’ programs are at higher qualification levels, equivalent to diplomas and advanced diplomas in Australia.
The features of Singapore’s apprenticeship system that distinguish it from Australia’s are:
Apprenticeships are part of the entry-level training arrangements and use the ‘train and place’ model rather than concurrent formal and on-the-job training.
NCVER Report 2 final Page 37

Apprenticeships are integrated with the young person’s general education and are managed by the Ministry of Education.
Government funding applies to the formal part of the apprenticeship (usually the first two years) but not to the on-the-job training.
Continuing education and training ‘place and train’ programs that are equivalent to Australian traineeships are found in Singapore but government funding is only applicable where there is an assessed need.
Employers in Singapore pay a training levy that is held in a training fund and can be accessed on a needs basis. A majority of the funding for continuing education and training programs is drawn from this fund.
United States The world’s largest economy, the US, makes relatively limited use of apprenticeships for skills formation. Apprenticeships are mainly viewed as an entry-level training option for young people, who account for the great majority of the take-up. However, the great majority of entry-level training consists of institutional learning followed by employment, and most continuing VET is delivered by private providers or as company in-house programs, with relatively little public funding or regulation.
Although there were about 28 000 apprenticeship programs available across the country, in the financial year 2007 there were just 212 000 commencements, in contrast to 271 500 in Australia. In-training numbers show a similar stark contrast: 468 000 in the financial year 2007 in the US and 414 900 at 30 June 2007 in Australia. Completions in the US also appear to be much lower than in Australia, with just 35 300 graduating from the US apprenticeship system in the financial year 2007.
The Office of Apprenticeships within the US Department of Labor describes the operation of the system as follows:
Apprenticeship programs are operated by both the public and private sectors. Apprenticeship sponsors, who are employers, employer associations and labor-management organizations, register programs with federal and state government agencies. Sponsors provide on-the-job learning and academic instruction to apprentices according to their industry standards and licensing requirements.
(United States Department of Labor website)
Although the Australian and US apprenticeship systems have some similarities, closer scrutiny of how they are funded and operate indicates fundamental differences in a number of key areas. Many of these differences relate to the governance and architecture of the overall VET system in the US and do not apply only to apprenticeships (Cully et al. 2009). US governance arrangements for VET are highly decentralised, influenced by the country’s large area and population and also the form of the US federation. Administratively, states are sub-divided into counties (over 100 in some states, run by county councils) and cities (run by city councils). As a result, many apprenticeship programs are only available in some states or counties, and some occupations are only apprenticeable in some jurisdictions.
The US Department of Education has a broad policy-making role and provides some funds for special VET programs, but beyond this, management and funding for the provision of VET (and education generally) is devolved to the county level or even lower, with considerable variation among the states. Public institutions, such as the community or state junior colleges and the state technical schools or colleges, are mainly funded by the states (from income and sales-tax receipts) and by counties (from property taxes).
The architecture and regulatory arrangements for education, including initial VET, are very much at the state, county or city level, or may even be based around a regional grouping that has been
NCVER Report 2 final Page 38

established for this purpose. There are no overarching frameworks such as Australia’s AQF or AQTF, although the non-government American Council on Education publishes detailed standards for many occupations, and many institutions give credit for learning completed at another institution. Professional associations, which are mostly non-government, are often involved in setting occupational standards, assessing competence and providing certificates for the occupations that they cover, including apprenticeships.
Federal government investment in the US apprenticeship system is very low, at $US21 million annually. The Department of Labor estimates that this yields a dividend of $US100 for every $US1 spent on the apprenticeship program because of the income taxes that apprentices pay on their wages. Apprenticeship sponsors pay most of costs, although the total contribution made by the states, counties and city councils is unknown and varies by jurisdiction in accordance with governance arrangements.Although the US governance arrangements and cultural context for apprenticeships are very different from Australia’s, there are several features of the US apprenticeship system that are instructive:
The operation of the system gives employers, employer and industry associations, labour companies and professional associations considerable flexibility in the structure and content of apprenticeship programs.
Sponsors can negotiate with providers to establish delivery arrangements, pathways and joint programs that suit the needs of employers and employees.
In contrast to Australia, the amount of public funding applied to training apprentices is relatively small, and applies mainly to the formal (off-the-job) component of the training program. Employer incentives are generally not paid except in special circumstances, reducing the drain on the public purse.
Continuing education and training, including the training of existing workers, is seen as the responsibility of individuals, employers or industry. The public sector plays a relatively limited role, except in jurisdictions where external regulatory or quality assurance provisions apply (Cully et al. 2009 and references).
Whether these aspects of the US apprenticeship system are seen as strengths or weaknesses will inevitably be a matter of debate.
Peoples Republic of ChinaApprenticeships in China use the ‘train and place’ model and have increased considerably in relative importance because of the need to train much larger numbers of young people in trade and related occupations, particularly in areas such as construction, engineering, electrotechnology and telecommunications. About two decades ago the country embarked on a process of modernisation and industrialisation, and introduced relaxed regulatory arrangements to facilitate trade with the rest of the world. China is now the world’s second largest and fastest growing economy.
Apprenticeships in China are designed to provide entry-level training for young people, while ensuring that general education is not neglected. Although delivery is funded and managed by provincial governments, the curriculum for apprenticeship programs is centrally determined and controlled, by the vocational education and training directorate within the Ministry of Education in Beijing. There is considerable input from other directorates within the Ministry of Education, and an unknown level of input from employers and industry. Note that most large employers in China are state-owned enterprises.
An apprenticeship in China starts with a period of institutional training, usually two years, at a school or polytechnic, followed by a similar period of employment-based training. As part of its
NCVER Report 2 final Page 39

modernisation program, the government of China is investing heavily in infrastructure and facilities to support the training of larger numbers of apprentices. The facilities in some of China’s larger centres are on a scale that dwarfs Australia’s largest TAFE institutes. Some of China’s large state-owned enterprises, such as the national electricity corporation, have their own schools that provide apprenticeship training.
As in many countries, parents in China have a strong preference for higher education for their child (most have only one). Apprenticeship training and employment in a trade is viewed as a second-rank option, or even as less preferable than establishing a small business. State control of wages may be exacerbating this problem.
SwedenSweden (2008 population 9.2 million) provides an unusual example of apprenticeship directions in industrialised nations. Until the early 1970s Sweden operated a ‘dual system’ of training similar to that found in Germanic countries. However, since reforms in the early 1970s the apprenticeship model of training has been little used, largely on equity grounds. The argument is that the supply paid (apprentice) jobs are limited and this confers an unjustified advantage on those young people who are able to obtain an apprenticeship.
Despite this major change, employers are still involved in the delivery of entry-level training through mandatory work placements and Sweden’s structured workplace learning (SWL) program, which requires employer participation (Leney et al. 2007). The national government that took office in 2006 indicated its intention to increase the emphasis on VET by creating academic, vocational and apprenticeship sub-divisions in upper secondary education, but apprenticeships continue to be absent from Sweden’s training landscape.
The apprenticeship policy shift in Sweden must be seen in the broader cultural, educational and governance context.
As in other Scandinavian countries, there is a clearly articulated philosophical underpinning to the provision of education and training. National government policy deliberately takes an integrated view of general and vocational education, in both the higher education and the three-year post-compulsory schooling sectors. Sweden has sought to reduce the distinction between practical and theoretical studies; at the same time, all courses have a vocational orientation.
Education and training in Sweden is mostly funded and delivered by the government, with very few private institutions. Learning programs are generally structured and sequential and lead to qualifications that are recognised throughout the country. However, in order to meet a specific need, higher education institutions can also provide short courses that do not lead to a full qualification. In upper secondary schooling there are 14 vocational program areas and students spend at least 15% of their three-year course in a workplace. The work placements are provided by employers.
After more than two decades of central economic planning and government control of many areas, changes that began in the 1970s have meant that Sweden is now a highly decentralised country. Administratively, the country is divided into 24 counties and 284 municipalities (the largest county, Stockholm, includes the capital city and has 1.95 million inhabitants). There is a long tradition of municipal autonomy and independence, supported by municipal taxation powers. In education and training, legislation passed in 1991 resulted in a system, in which the national government, through the Ministry of Education and Research particularly, sets the broad policy, goals and curriculum, and monitors performance. A large number of national and local (that is, municipal or county) agencies have control over delivery and management of institutions and these operate independently of the ministry (CEDEFOP 2008b).
NCVER Report 2 final Page 40

Recent comparative studies show that industry parties are embedded in the governance of national VET systems to quite varying degrees: from decision-making powers at all levels (Germany, Finland), to involvement in an advisory capacity (Australia, United Kingdom), to a more limited involvement across multiple layers of government (Canada, US). Sweden is an exception among northern European countries because employers have considerable involvement in VET at the local level but practically no involvement at the national level and this limits their capacity to convey information about skill needs to government or how these can be addressed (Hoeckel & Schwartz 2010, pp.19–22).
The level of industry involvement in Sweden is somewhat different from other European countries because it is almost completely at the local level and relatively narrow in its scope. Industry and employers have very little involvement in developing national education and training policy or the content of education and training programs, which are almost entirely in the hands of the Ministry of Education (even the Ministry of Labour has very little involvement).
Sweden’s employers organise training for their own employees and also provide work placements for young people undertaking initial VET programs as part of their schooling. A variety of factors apparently sit behind this provision of work placements, including a strong sense of community obligation among employers, the fact that Sweden no longer has an apprenticeship system, and the possibility that the work placements will help employers identify potential future employees.
Although it does not have apprenticeships or traineeships, Sweden has developed a variety of other training arrangements to meet the skill needs of a modern, advanced economy. It demonstrates that alternative models are feasible.
IndiaIndia provides an example of a country where the structure and governance of the apprenticeship and traineeship system has major shortcomings. Although India was under British rule for over two centuries, its apprenticeship system has diverged considerably from the British model. Despite this, there is clear evidence that the apprenticeship and traineeship system is not meeting the needs of the economy, particularly in periods of rapid growth. The text that follows is drawn largely from Knight and Guthrie (2008) and does not take account of more recent changes.
India’s Apprenticeship Training Scheme was established by legislation in 1961, with amendments in 1973 and 1986 to include additional categories of apprentices. The scheme is broader in scope than Australia’s apprenticeship and traineeship system because it includes options at higher skill levels, and the funding arrangements in some categories are different. The apprenticeship training scheme is also linked to the Craftsmen Training Scheme, and successful graduates from craftsmen programs can gain credit in relevant apprenticeship programs (Directorate General of Employment and Training 2007, p.2). Unlike apprenticeships, which are mostly employment-based, the Craftsmen Training Scheme is institution-based.
Owing to the poverty and disadvantage which many in India experience and the size of the informal economy, both the Apprenticeship and Craftsmen Training Schemes have access and equity objectives as well as skill formation. For example, there are upper age limits for males but not for females, and many of the programs are at relatively low levels and may start in the early years of secondary schooling.
India has four categories of apprentices, which have only loose alignment with Australia’s apprenticeships and traineeships:
trade apprentices—many of these programs are similar to Australia’s apprenticeships in traditional trades, but the duration is set and varies considerably across occupations, from six months to four years. The level of the training also varies
NCVER Report 2 final Page 41

graduate apprentices—Australia’s apprenticeships and traineeships only incidentally cover graduates, whereas some in India require a degree as a prerequisite, such as the Advanced Attendant Operator (Process)
technician apprentices—these cover a wide range of fields of education in engineering and technology. With a few exceptions (for example, jute technology) most would have roughly equivalent Australian traineeships
technical (vocational) apprentices—these also cover a wide range of fields of education, in areas such as health, agriculture, child care, finance and business. Many would have roughly equivalent Australian traineeships.
Apprentices are paid a stipend, which is specified in government regulations and revised every two years based on the consumer price index (Directorate General of Employment and Training 2007, p.3). The arrangements vary with the category of apprenticeship:
For trade apprentices, the stipend is paid by the employer and increases over the period of the training program (in 2008 the monthly rates were Rs 1090 in 1st year, Rs 1240 in 2nd year, Rs 1440 in 3rd year and Rs 1620 in 4th year). As in Australia, the increase over the duration of the apprenticeship reflects the relatively low productivity of apprentices in their first couple of years of training.
For graduate, technician and technician (vocational) apprentices the stipend is shared equally between the employer and the Government of India. In 2008 it was Rs 2600 per month for graduate apprentices, Rs 1850 for technician apprentices and Rs 1440 for technician (vocational) apprentices.
Several other aspects of India’s Apprenticeship Training System must be noted:
Educational prerequisites apply to each apprenticeship, such as successful completion of Year 8 of schooling, Year 10, Year 12 or a degree. (India’s school system is very similar to Australia’s, ten years plus two years of upper secondary.)
Apprenticeships are time-based, with the duration specified at six months, one year, 18 months, two years, three years or four years.
The assessment of apprentices at the end of their training is undertaken using the All India Trade Test, administered by the National Council for Vocational Training. This very traditional approach to assessment of vocational skills is motivated in part by the need to ensure the integrity of the results.
The number of apprenticeship places available in each occupation and region is officially set. The Directorate General of Employment and Training 2007 report suggests 261 236 ‘seats’ for trade apprentices, with 187 339 utilised. The role that employer needs play in setting the number of places is unclear, as government policy in India is often determined unilaterally.
These arrangements are in contrast to those that operate in Australia, where educational prerequisites are not set, competency-based rather than time-based progression is promoted as a national priority, and assessment of competency is undertaken by registered training organisations according to the standards set down in the Australian Quality Training Framework. Also, governance arrangements at national and state levels provide employers with a range of opportunities to provide input, including the need for government-funded places in specific apprenticeships and traineeships.
There are several recurring themes in the critical commentary on India’s education and training systems (World Bank 2008; OECD 2007), including the Apprenticeship and Craftsmen Training Schemes:
The country has an oversupply of higher education graduates, many of whom work in occupations where their skills are underutilised.
NCVER Report 2 final Page 42

Economic progress is being held back because the vocational education and training system produces insufficient numbers of workers in technician, trade and skilled occupations.
The teaching workforce available to provide training in technician, trade and skilled occupations is inadequate and includes many graduates who have inappropriate qualifications or experience.
Employers are generally very dissatisfied with the country’s training arrangements and have had only limited success in persuading the national and provincial governments to implement reforms. Many large firms resort to doing their own training but the qualifications have no official recognition.
AlgeriaA recent study (Sweet 2008) has identified Algeria as a country that has implemented an apparently effective system for stimulating and financing apprenticeship training:
A combination of a rational system of training wages, well-targeted public subsidies and an apprenticeship tax that penalises non-trainers has given Algeria a coherent system for financing apprenticeship training. It provides appropriate incentives for participation both to young people and employers.
The government uses a two-pronged strategy for promoting apprenticeships among young people and employers:
It supports a wage structure that encourages employers to employ and train young people, with wages paid by the state during the first six to 12 months. (This covers the employer’s cost during the initial, low-productivity period of the apprenticeship.) The state also meets the cost of national social security charges throughout the whole of the apprenticeship. Apprentices receive 15% of the national minimum wage in their first half-year, 30% in the second, followed by monthly stepwise increases to 80% over the remainder of the program. This system is intended to give apprentices an expectation of steadily increasing earnings if they stick with the training program.
Employers, including small businesses, also have a legal obligation to employ apprentices or pay an apprenticeship tax if they do not. The tax is now set at 1% of payroll (previously it was 0.5%) and receipts are paid into a special fund to support apprenticeship. Very small firms (one to five employees) must have at least one apprentice or pay the tax, and this rises to at least 3% for firms with 1000 or more employees. Note that a training levy would not be popular in Australia, as was seen during the period of the ‘training guarantee’ in the 1980s.
Sweet concluded that:These arrangements provide more effective incentives to encourage employer participation than general purpose vocational training taxes that apply to all firms, whether or not they train, and that do not differentiate between the training of young people and the continuing training of existing employees.
In the period that these arrangements have been in operation there has been a steady increase in the number of apprentices, from 85 283 in 1990 to 204 000 in 2006. The rate of growth increased further after 2003, when the government raised the apprenticeship tax from 0.5% to 1% of a firm’s wage bill. If the labour inputs provided by apprentices have little or no value firms will always save money by paying the tax. The fact that apprenticeship numbers have increased suggests that employers derive more productive value from apprentices than the cost of the tax.
Overall, Algeria’s mix of an apprenticeship tax, government payment of wages in the first six to 12 months, and the productive value of apprentices appear to have operated as a stimulus for employers to train young people via apprenticeships. It should be noted that the economics of Algeria’s arrangements would not apply to adult apprentices because of higher adult wages.
NCVER Report 2 final Page 43
NCVER Report 2 final Page 44

ReferencesBillett, S 1997, 'Factors in vocational education policy development: Modern Apprenticeships, a case
study', Australian Vocational Education Review, vol.4, no.2, pp.51–60.CEDEFOP 2008a, Country report: thematic overviews: Denmark, CEDEFOP website, viewed December 2008,
<http://www.trainingvillage.gr/etv/Information_resources/NationalVet/Thematic/criteria_reply.asp>.
——2008b, Country report: thematic overviews: Sweden, CEDEFOP website, viewed December 2008, <http://www.trainingvillage.gr/etv/Information resources/NationalVet/Thematic/criteria_reply.asp>.
Clarke, L & Herrmann, G 2004, ‘The institutionalisation of skill in Britain and Germany: examples from the construction sector’, in The skills that matter, eds C Warhurst, I Grugulis & E Keep, Critical perspectives on work and organisations series, Palgrave Macmillan, New York, NY, pp.128–47.
Cully, M, Knight, B, Loveder, P, Mazzachi, R, Priest, S & Halliday-Wynes, S 2009, Governance and architecture of Australia’s VET sector: country comparisons report prepared for Skills Australia, NCVER Adelaide.
Directorate General of Employment and Training (DGET) 2007, Apprenticeship Training Scheme, Ministry of Labour and Employment (MLE), New Delhi.
Hoeckel, K & Schwartz, R 2010, ‘Learning for jobs’, OECD Reviews of Vocational Education and Training: Germany, OECD, Paris.
Keating, J 2008, Matching supply and demand for skills: international perspectives, NCVER, Adelaide Knight, B & Guthrie, H 2008, ‘Aligning India’s labour market and skills needs with Australia’s VET
strengths’, NCVER consultancy report for DEEWR (unpublished).Kuczera, M, Field, S, Hoffman, N & Wolter, S 2008, ‘Learning for jobs’, OECD Reviews of Vocational
Education and Training: Sweden, OECD, Paris.Leney T., May T., Hayward G. and Wilde S. 2007, International comparisons in further education, UK: Dept for
Education and Skills (DfES), viewed October 2008, http://www.dcsf.gov.uk/research/data/uploadfiles/RR832.pdf
Misko, J 2006, Vocational education and training in Australia, the United Kingdom and Germany, NCVER, Adelaide.
National Education Authority 2008, The Danish vocational education and training system, 2nd edn, Danish Ministry of Education, Copenhagen.
Organisation for Economic Cooperation and Development (OECD), Economic Survey of India 2007, OECD, Paris.
Osborne M. and Bell D. 2004, Research on Appraoches to Public Funding and Development of Tertiary Education within Selected OECD Nations, Scottish Executive Social Research, Edinburgh pp.125-134 and p.160
Rauner, F 2009, ‘Differences in the organisation of apprenticeship in Europe: findings of a comparative evaluation study’ in Innovative apprenticeships promoting successful school-to-work transitions, conference proceedings edited by F Rauner, E Smith, U Hauschildt & H Zelloth, p.233, viewed 22 November 2010, <http://www.innovative-apprenticeship.net/>.
Ryan, P 1998, ‘Is apprenticeship better? A review of the economic evidence’, Journal of Vocational Education and Training, vol.50, no.2.
Scharnhorst, U 2009, ‘Innovative apprenticeships: promoting successful school to work transitions: the example of Switzerland’ in Innovative apprenticeships promoting successful school-to-work transitions, conference proceedings edited by F Rauner, E Smith, U Hauschildt & H Zelloth, p.15, viewed 22 November 2010, <http://www.innovative-apprenticeship.net/>.
Smith A. and Billett S. 2004, Mechanisms for increasing employer contributions to training: an international comparison, NCVER, Adelaide, viewed October 2005, http://www.ncver.edu.au/publications/1489.html
Sung J., Raddon A. and Ashton D. 2006, Skills abroad: a comparative assessment of international policy approaches to skills leading to the development of policy recommendations for the UK, Research report 16, Centre for Labour Market Studies, Leicester, viewed October 2008 at, https://lra.le.ac.uk/bitstream/2381/530/1/SungRaddonAshtonSectoralSkills%5b2%5d.pdf
Sweet R. 2008, Work-based Learning Programmes for Young People in the Mediterranean Region: A Comparative Analysis, unpublished
World Bank 2008, Skill Development in India: the vocational education and training system, viewed 22 November 2010, <http://www-wds.worldbank.org> .
United States Department of Labor website, viewed 26 August 2010, <http://www.doleta.gov/OA/statistics.cfm>.
NCVER Report 2 final Page 45
NCVER Report 2 final Page 46

AppendicesTable A1 United Kingdom apprenticeship commencements by sector framework, level and sex, 2003–04 and 2008–09
Year 2003/04 2008/09
Apprenticeship level Level 2 Level 3 (advanced) All apprenticeships Level 2 Level 3 (advanced) All apprenticeships
Sex
Sector framework category (SFC)Male
%Femal
e %Sub-total
Male %
Female %
Sub-total
Male %
Female %
Total (‘000)
Male %
Female %
Sub-total
Male %
Female %
Sub-total
Male %
Female %
Total (‘000)
Accountancy 18.4% 28.9% 44.7% 21.1% 34.2% 55.3% 36.8% 60.5% 3.8 13.5% 32.7% 48.1% 17.3% 34.6% 51.9% 32.7% 67.3% 5,2
Active Leisure & Learning 50.0% 30.0% 80.0% 12.0% 8.0% 20.0% 62.0% 38.0% 5.0 45.5% 23.4% 68.8% 19.5% 11.7% 31.2% 64.9% 36.4% 7,7
Advice & Guidance - - - - - - - - - - 25.0% 25.0% 25.0% 50.0% 75.0% 25.0% 75.0% 0.4
Advising on Financial Products - - - - - - - - - - - - 100.0% 33.3% 100.0% 100.0% 33.3% 0.3
Agricultural Crops & Livestock 66.7% - 66.7% 16.7% - 16.7% 83.3% 16.7% 0.6 75.0% - 100.0% 25.0% - 25.0% 100.0% - 0.4
Amenity Horticulture 88.9% - 88.9% 11.1% - 11.1% 100.0% - 0.9 91.7% - 91.7% 8.3% - 8.3% 100.0% 8.3% 1,2
Animal Care 16.7% 66.7% 83.3% - - - 16.7% 66.7% 0.6 20.0% 60.0% 100.0% - 20.0% 20.0% 20.0% 80.0% 0.5
Animal Technology - - - - - - - - - - - - - - - - - -
Apparel - - - - - - - - - - - - - - - - - -
Arboriculture - - - - - - - - - - - - - - - - - -
Arts & Entertainment, Cultural Heritage, Information & Library Services - - - - - - - - - - - - - - - - - -
Automotive Industry 40.7% 0.8% 41.5% 56.9% 0.8% 57.7% 98.4% 1.6% 12.3 - - - - - - - - -
NCVER Report 2 final Page 47
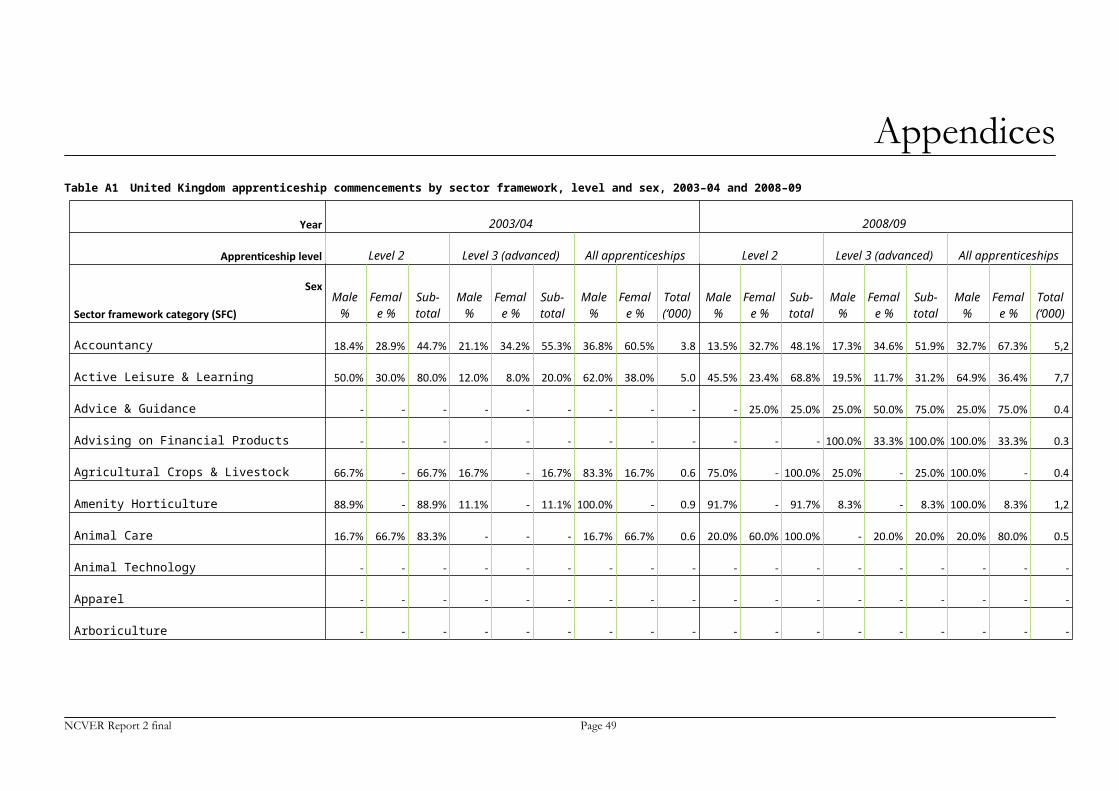
Year 2003/04 2008/09
Apprenticeship level Level 2 Level 3 (advanced) All apprenticeships Level 2 Level 3 (advanced) All apprenticeships
Sex
Sector framework category (SFC)Male
%Femal
e %Sub-total
Male %
Female %
Sub-total
Male %
Female %
Total (‘000)
Male %
Female %
Sub-total
Male %
Female %
Sub-total
Male %
Female %
Total (‘000)
Aviation 50.0% 50.0% 100.0% - - - 50.0% 50.0% 0.2 62.5% 37.5% 100.0% - - - 62.5% 37.5% 0.8
Bakery - - 100.0% - - - 100.0% - 0.1 - - - - - - - - -
Barbering - - - - - - - - - 25.0% 50.0% 75.0% - - - 25.0% 50.0% 0.4
Beauty Therapy - 50.0% 50.0% - 100.0% 100.0% - 100.0% 0.2 - 75.0% 75.0% - 25.0% 25.0% - 100.0% 1,2
Broadcast, Film, Video & Interactive Media Industry - - - - - - - - - - - - - - - - - -
Building products Occupations - - - - - - - - - - - - - - - - - -
Building Services Engineering Technicians - - - 100.0% - 100.0% 100.0% - 0.1 - - - 100.0% - 100.0% 100.0% - 0.1
Business Administration 19.3% 61.9% 81.2% 3.3% 14.9% 18.8% 22.7% 77.3% 18.1 14.4% 53.4% 67.8% 4.8% 27.4% 32.2% 19.2% 80.8% 20,8
Cabin Crew - - - - - - - - - - - - - - - - - -
Carry & Deliver Goods - - - - - - - - 0.1 100.0% - 100.0% - - - 100.0% - 0.9
Ceramics - - - - - - - - - - - - - - - - - -
Children’s Care Learning & Development 1.7% 62.7% 64.4% 0.8% 34.7% 35.6% 2.5% 97.5% 11.8 1.7% 56.4% 58.1% 1.2% 40.7% 41.9% 2.9% 97.1% 17,2
Cleaning & Support Service Industry - - - - - - - - - 50.0% 50.0% 100.0% - - - 50.0% 50.0% 0.2
Coatings Development Plan - - - - - - - - - - - - - - - - - -
Coca Cola - - - - - - - - - - - - - - - - - -
Communications Technologies (Telecoms) 26.7% 6.7% 33.3% 60.0% 6.7% 73.3% 86.7% 13.3% 1.5 50.0% - 50.0% 50.0% - 50.0% 100.0% - 0.2
NCVER Report 2 final Page 48

Year 2003/04 2008/09
Apprenticeship level Level 2 Level 3 (advanced) All apprenticeships Level 2 Level 3 (advanced) All apprenticeships
Sex
Sector framework category (SFC)Male
%Femal
e %Sub-total
Male %
Female %
Sub-total
Male %
Female %
Total (‘000)
Male %
Female %
Sub-total
Male %
Female %
Sub-total
Male %
Female %
Total (‘000)
Community Justice - - - - - 100.0% - - 0.1 - - - - - - - - -
Construction 85.3% 0.7% 86.0% 14.0% - 14.0% 99.3% 0.7% 15.0 73.8% 1.2% 75.6% 24.4% 0.6% 24.4% 98.2% 1.8% 16,8
Contact Centres 30.0% 60.0% 90.0% 10.0% 10.0% 20.0% 30.0% 70.0% 1.0 35.7% 50.0% 85.7% 7.1% 7.1% 14.3% 42.9% 57.1% 1,4
Creative Apprenticeship - - - - - - - - - - - 100.0% - - - - 100.0% 0.1
Cultural Heritage - - - - - - - - - - - - - - - - - -
Customer Service 24.3% 51.3% 75.7% 6.6% 17.8% 24.3% 30.9% 69.1% 15.2 25.8% 53.3% 79.1% 5.3% 15.6% 20.9% 31.1% 68.9% 22,5
Dental Nursing - - - - - - - - - - - - - 100.0% 100.0% - 100.0% 1,5
Design - - - - - - - - - - - - - - - - - -
Driving Goods Vehicles 76.9% 7.7% 84.6% 15.4% - 15.4% 92.3% 7.7% 1.3 66.7% 5.6% 75.0% 22.2% 2.8% 25.0% 91.7% 8.3% 3,6
Electrical & Electronic Servicing 100.0% - 100.0% 100.0% - 100.0% 100.0% - 0.1 - - - - - - - - -
Electricity Industry - - - 100.0% - 100.0% 100.0% - 0.2 - - - 100.0% - 100.0% 100.0% - 0.2
Electrotechnical 22.0% - 22.0% 76.3% - 76.3% 98.3% 1.7% 5.9 - - - 98.3% 1.7% 100.0% 98.3% 1.7% 5,8
Emergency Fire Service Operations - - - 100.0% - 100.0% 100.0% - 0.1 - - - 100.0% - 100.0% 100.0% - 0.1
Engineering 45.1% 3.0% 48.1% 50.4% 1.5% 51.9% 95.5% 4.5% 13.3 45.8% 1.3% 47.1% 51.0% 2.0% 52.9% 96.7% 2.6% 15,3
Engineering Construction - - - 100.0% - 100.0% 100.0% - 0.2 - - - 100.0% - 100.0% 100.0% - 0.4
Engineering Technology - - - - - - - - - - - - - - - - - -
NCVER Report 2 final Page 49

Year 2003/04 2008/09
Apprenticeship level Level 2 Level 3 (advanced) All apprenticeships Level 2 Level 3 (advanced) All apprenticeships
Sex
Sector framework category (SFC)Male
%Femal
e %Sub-total
Male %
Female %
Sub-total
Male %
Female %
Total (‘000)
Male %
Female %
Sub-total
Male %
Female %
Sub-total
Male %
Female %
Total (‘000)
Environmental Conservation - - - - - - - - - - - - - - - - - -
Equine Industry 14.3% 57.1% 71.4% 7.1% 14.3% 21.4% 28.6% 71.4% 1.4 23.1% 61.5% 84.6% - 15.4% 23.1% 23.1% 76.9% 1,3
Events - - - - - - - - - - - - - - - - - -
Extractive & Mineral Processing Occupations - - - - - - - - - - - - - - - - - -
Farriery - - - - - - - - - - - - 100.0% - 100.0% 100.0% - 0.1
Fashion & Textiles - - - - - - - - - - - - - - - - - -
Fencing - - - - - - - - - - - - - - - - - -
Fitted Interiors - - - - - - - - - - - - - - - - - -
Floristry - 100.0% 100.0% - - - - 100.0% 0.2 - 100.0% 100.0% - - - - 100.0% 0.1
Food & Drink Manufacturing Operations 66.7% 33.3% 100.0% - - - 66.7% 33.3% 0.3 - - - - - - - - -
Food Manufacture - - - - - - - - - 75.0% 25.0% 100.0% - - - 75.0% 25.0% 0.4
Football Sporting Excellence - - - - - - - - - - - - - - - - - -
Footwear & Leather - - - - - - - - - - - - - - - - - -
Furniture Industry 80.0% - 100.0% 20.0% - 20.0% 100.0% - 0.5 66.7% - 66.7% 33.3% - 33.3% 100.0% - 0.3
Game & Wildlife Management - - - - - - - - - 100.0% - 100.0% - - - 100.0% - 0.1
Games Testing - - - - - - - - - - - - - - - - - -
NCVER Report 2 final Page 50
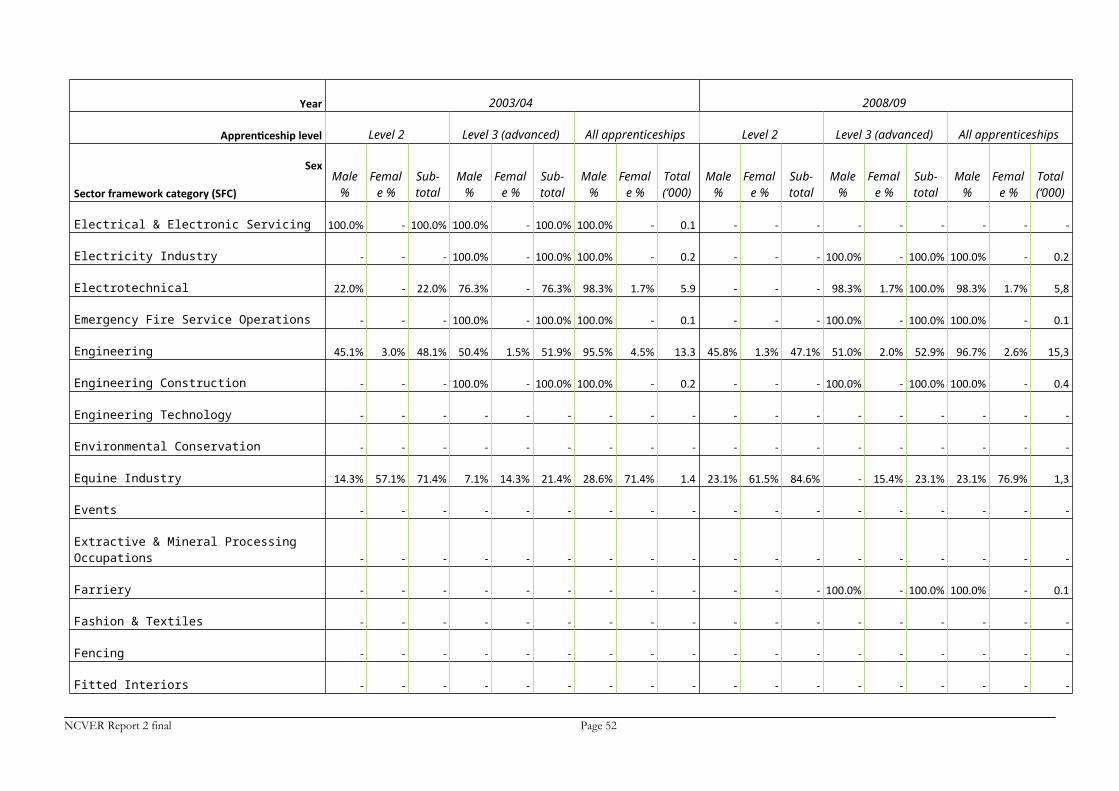
Year 2003/04 2008/09
Apprenticeship level Level 2 Level 3 (advanced) All apprenticeships Level 2 Level 3 (advanced) All apprenticeships
Sex
Sector framework category (SFC)Male
%Femal
e %Sub-total
Male %
Female %
Sub-total
Male %
Female %
Total (‘000)
Male %
Female %
Sub-total
Male %
Female %
Sub-total
Male %
Female %
Total (‘000)
Gas Industry - - - 83.3% - 83.3% 100.0% - 0.6 42.9% - 42.9% 57.1% - 57.1% 100.0% - 0.7
Gas Network Operations - - - - - - - - - - - - - - - - - -
Glass Industry 85.7% - 85.7% - - - 100.0% - 0.7 75.0% - 75.0% 25.0% - 25.0% 100.0% - 0.4
Hairdressing 8.1% 78.9% 87.0% 0.6% 12.4% 13.0% 8.7% 91.3% 16.1 7.4% 69.1% 76.5% 1.9% 21.6% 22.8% 9.3% 90.1% 16,2
Health & Social Care 8.5% 63.2% 71.7% 3.8% 24.5% 28.3% 12.3% 88.7% 10.6 8.9% 50.4% 59.3% 4.9% 35.8% 40.7% 13.8% 86.2% 12,3
Heating, Ventilation, Air Conditioning & Refrigeration 40.0% - 40.0% 60.0% - 60.0% 100.0% - 1.0 71.4% - 71.4% 28.6% - 28.6% 100.0% - 1,4
Highways Maintenance - - - - - - - - - - - - - - - - - -
Horticulture - - - - - - - - - - - - - - - - - -
Hospitality & Catering 37.4% 41.2% 78.2% 10.9% 10.5% 21.4% 48.3% 51.7% 23.8 36.3% 43.5% 80.4% 9.5% 10.7% 19.6% 45.8% 54.2% 16,8
Housing - - - - - - - - - - - - - - - - - -
Industrial Applications 83.3% 8.3% 100.0% - - - 83.3% 8.3% 1.2 91.7% 8.3% 100.0% - - - 91.7% 8.3% 1,2
Industrial Building Systems - - - - - - - - - - - - - - - - - -
Information & Library Services - - - - - - - - - - - - - - - - - -
Installing Cabling Systems - - - - - - - - - - - - - - - - - -
Insurance 25.0% 25.0% 50.0% 25.0% 25.0% 50.0% 25.0% 75.0% 0.4 - - - - - - - - -
International Trade & Services - - 100.0% - - - - - 0.1 - - - - - - - - -
NCVER Report 2 final Page 51

Year 2003/04 2008/09
Apprenticeship level Level 2 Level 3 (advanced) All apprenticeships Level 2 Level 3 (advanced) All apprenticeships
Sex
Sector framework category (SFC)Male
%Femal
e %Sub-total
Male %
Female %
Sub-total
Male %
Female %
Total (‘000)
Male %
Female %
Sub-total
Male %
Female %
Sub-total
Male %
Female %
Total (‘000)
IT & TELECOMS ProfAL - - - - - - - - - 24.4% 2.2% 26.7% 66.7% 6.7% 73.3% 91.1% 8.9% 4,5
IT Profal - - - - - - - - - - - - 100.0% - 100.0% 100.0% - 0.1
IT Services & Development 69.0% 14.3% 83.3% 16.7% 2.4% 19.0% 83.3% 16.7% 4.2 - - - - - - - - -
IT User - - - - - - - - - 60.0% 32.5% 92.5% 5.0% 2.5% 7.5% 65.0% 35.0% 4,0
Laboratory Technicians (Generic) - - - - - - - - - - - - - - - - - -
Land-based Service Engineering 66.7% - 66.7% 33.3% - 33.3% 100.0% - 0.3 66.7% - 66.7% 33.3% - 33.3% 100.0% - 0.3
Learning & Development (Direct Training & Support) - - - - - - - - - - - - 100.0% 100.0% 100.0% 100.0% 100.0% 0.1
Logistics Operations Management - - - - - - - - - - - - - - - - - -
Mail Services - - - - - - - - - 100.0% - 100.0% - - - 100.0% - 0.1
Management - - 11.1% 33.3% 66.7% 88.9% 33.3% 66.7% 0.9 23.2% 36.4% 59.6% 15.2% 25.3% 40.4% 38.4% 61.6% 9,9
Man-Made Fibres - - - - - - - - - - - - - - - - - -
Marine Industry 50.0% - 50.0% 50.0% - 50.0% 100.0% - 0.2 50.0% - 50.0% 50.0% - 50.0% 100.0% - 0.2
Marketing & Communications - - - - - - - - - - - - - - - - - -
Meat & Poultry Processing 66.7% - 100.0% - - - 66.7% - 0.3 - - - - - - - - -
MES Plumbing 67.4% - 67.4% 32.6% - 32.6% 100.0% - 4.6 60.8% 2.0% 62.7% 35.3% 2.0% 37.3% 98.0% 2.0% 5,1
Metals Industry - - 100.0% - - 100.0% 100.0% - 0.1 - - - - - - - - -
NCVER Report 2 final Page 52
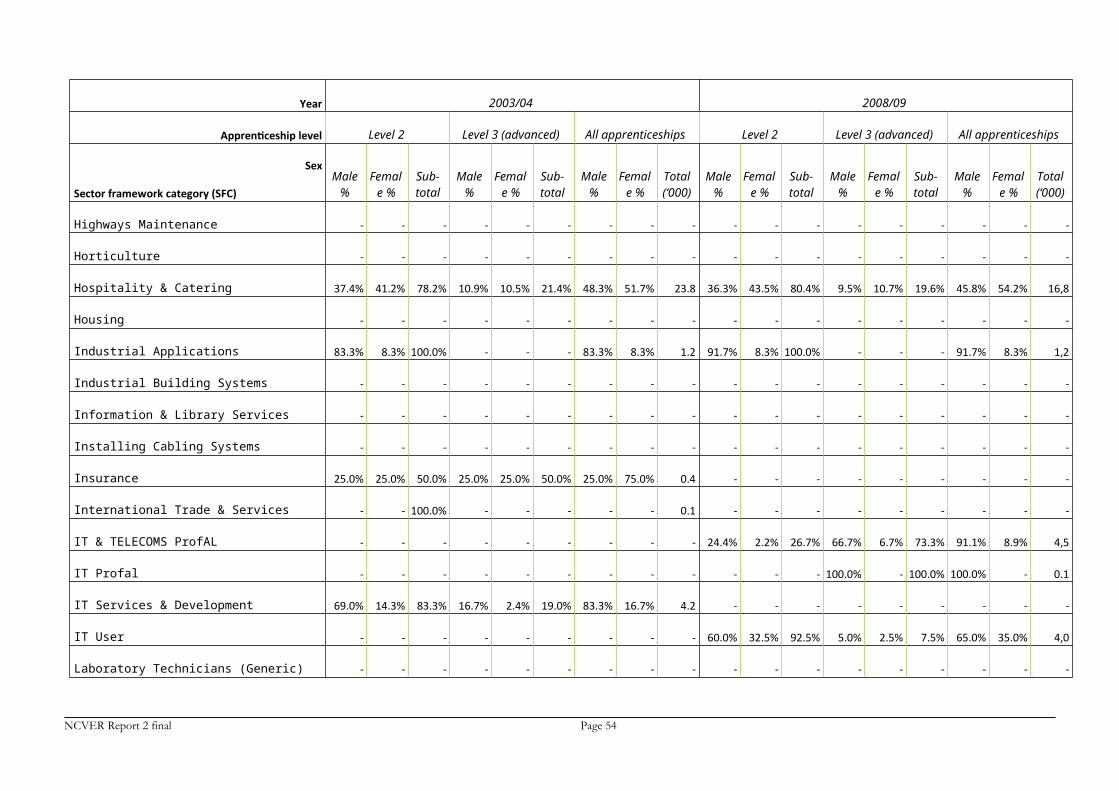
Year 2003/04 2008/09
Apprenticeship level Level 2 Level 3 (advanced) All apprenticeships Level 2 Level 3 (advanced) All apprenticeships
Sex
Sector framework category (SFC)Male
%Femal
e %Sub-total
Male %
Female %
Sub-total
Male %
Female %
Total (‘000)
Male %
Female %
Sub-total
Male %
Female %
Sub-total
Male %
Female %
Total (‘000)
Music Practitioner - - - - - - - - - - - - 100.0% - 100.0% 100.0% - 0.1
Nail Services - - - - - - - - - - - - - - - - - -
Newspaper Industry - - - - - - - - - - - - - - - - - -
Occupational Health & Safety Practice - - - - - - - - - - - - - - - - - -
Oil & Gas Extraction - - - - - - - - - - - - - - - - - -
Operating Department Practice - - - - - - - - - - - - - - - - - -
Optical - - - - - - - - - - 50.0% 100.0% - - 50.0% 50.0% 100.0% 0.2
Optical Advisor - 100.0% 100.0% - - - - 100.0% 0.1 - - - - - - - - -
Payroll - - - - - - - - - - - - - - - - - 0.1
Personnel - - - - - - - - - - - - - - - - - -
Pharmacy Technicians - - - - - - - - - - 33.3% 33.3% - 66.7% 66.7% - 100.0% 0.3
Photo Imaging - - - - - - - - - - - - - - - - - -
Photo Imaging for Staff Photographers - - - - - - - - - - - - - - - - - -
Physiological Measurement Technicians (AMA only) - - - - - - - - - - - - - - - - - -
Polymer Processing & Signmaking - - - - - - - - - - - - - - - - - -
Ports Industry - - - - - - - - - - - - - - - - - -
NCVER Report 2 final Page 53
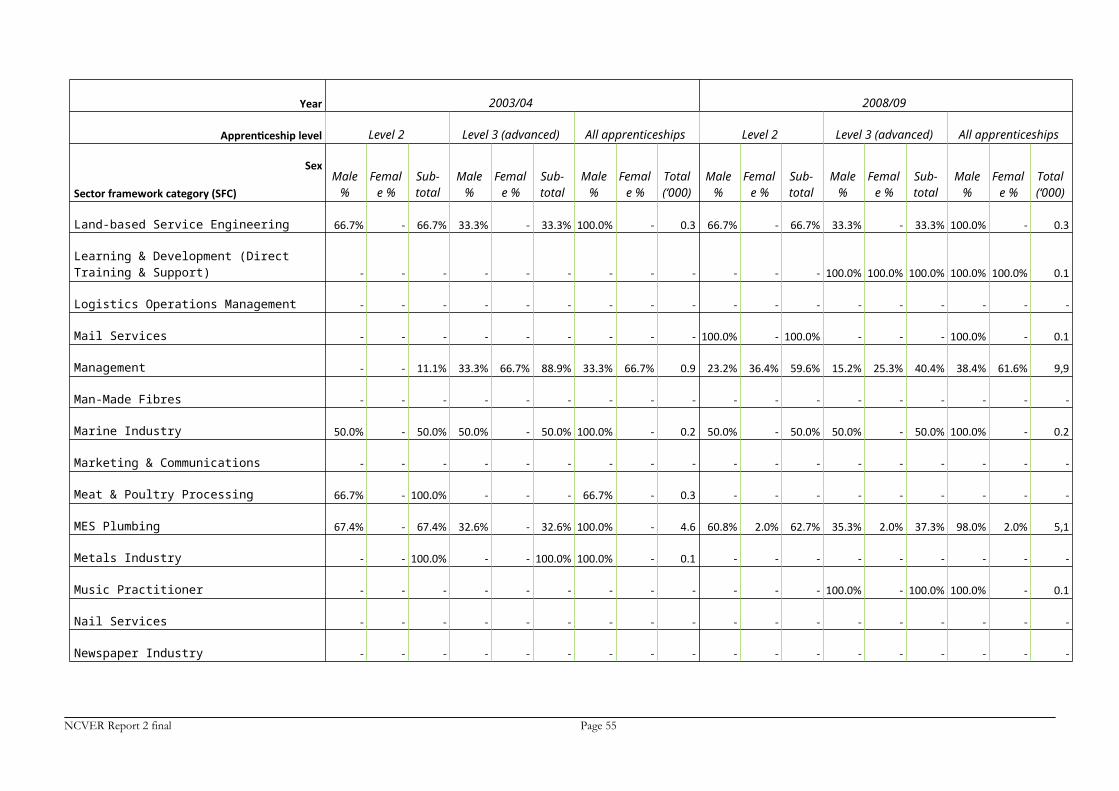
Year 2003/04 2008/09
Apprenticeship level Level 2 Level 3 (advanced) All apprenticeships Level 2 Level 3 (advanced) All apprenticeships
Sex
Sector framework category (SFC)Male
%Femal
e %Sub-total
Male %
Female %
Sub-total
Male %
Female %
Total (‘000)
Male %
Female %
Sub-total
Male %
Female %
Sub-total
Male %
Female %
Total (‘000)
Print & Printed Packaging 25.0% - 25.0% 75.0% - 75.0% 100.0% - 0.4 33.3% - 33.3% 66.7% - 66.7% 66.7% - 0.3
Process Technology - - - - - 100.0% 100.0% - 0.1 - - - 50.0% - 100.0% 100.0% - 0.2
Procurement - - - - - - - - - - - - - - - - - -
Production Horticulture - - - - - - - - - - - - - - - - - -
Property Services 33.3% 33.3% 33.3% 33.3% 33.3% 66.7% 66.7% 66.7% 0.3 - 33.3% 33.3% 33.3% 33.3% 66.7% 33.3% 66.7% 0.3
Providing Financial Services (Banks & Building Societies) - - - - - - - - - - - - - - - - - -
Providing Security Services - - - - - - - - - - - - - - - - - -
Public Services - - - - - - - - - 94.4% 5.6% 100.0% - - - 94.4% 5.6% 1,8
Purchasing & Supply - - - - - - - - - - - - - - - - - -
Rail Transport Engineering - - - 100.0% - 100.0% 100.0% - 0.1 100.0% - 100.0% - - - 100.0% - 0.9
Rail Transport Operations - - - - - - - - - 100.0% - 100.0% - - - 100.0% - 0.1
Retail 28.7% 60.7% 88.5% 4.1% 7.4% 10.7% 32.8% 67.2% 12.2 27.5% 55.0% 82.6% 6.4% 11.9% 17.4% 33.9% 66.1% 10,9
Retail Financial Services - - - - - - - - - 20.0% 30.0% 50.0% 20.0% 30.0% 50.0% 40.0% 60.0% 1,0
Road Passenger Transport - Bus & Coach - - - - - - - - - 100.0% - 100.0% - - - 100.0% - 0.1
Roadside Assistance & Recovery - - - - - - - - - 100.0% - 100.0% - - - 100.0% - 0.1
Saddlery - - - - - - - - - - - - - - - - - -
NCVER Report 2 final Page 54

Year 2003/04 2008/09
Apprenticeship level Level 2 Level 3 (advanced) All apprenticeships Level 2 Level 3 (advanced) All apprenticeships
Sex
Sector framework category (SFC)Male
%Femal
e %Sub-total
Male %
Female %
Sub-total
Male %
Female %
Total (‘000)
Male %
Female %
Sub-total
Male %
Female %
Sub-total
Male %
Female %
Total (‘000)
Sales & Telesales - 100.0% 100.0% - - - - 100.0% 0.1 51.9% 37.0% 88.9% 7.4% 3.7% 11.1% 59.3% 40.7% 2,7
Sea Fishing - - - - - - - - - - - - - - - - - -
Security Industry 80.0% - 80.0% 20.0% - 20.0% 80.0% - 0.5 75.0% - 87.5% 12.5% - 12.5% 87.5% - 0.8
Security Systems - - - - - - - - - 100.0% - 100.0% - - - 100.0% - 0.1
Set Crafts - - - - - - - - - - - - - - - - - -
Signmaking - - - - - - - - - - - - - - - - - -
Spa Therapy - - - - - - - - - - - - - - - - - -
Specialized Process Operations (Nuclear) - - - - - - - - - - - - - - - - - -
Sporting Excellence - - - - - - - - - - - - 87.5% 12.5% 100.0% 87.5% 12.5% 1,6
Storage & Warehousing - - - - - - - - - 80.0% 20.0% 80.0% 20.0% - 20.0% 100.0% 20.0% 0.5
Support Services in Healthcare - - - - - - - - - - 100.0% 100.0% - - - - 100.0% 0.2
Teaching Assistants - - - - - - - - - - 20.0% 30.0% - 70.0% 80.0% 10.0% 100.0% 1,0
Textiles 90.9% 9.1% 100.0% - - - 90.9% 9.1% 1.1 - - - - - - - - -
Traffic Office - - - - - - - - - - - 100.0% - - - - - 0.1
Transport Engineering & Maintenance 50.0% - 50.0% 50.0% - 50.0% 50.0% - 0.2 50.0% - 50.0% 50.0% - 50.0% 100.0% - 0.2
Travel & Tourism Services Leisure & Business - 13.3% 13.3% 13.3% 80.0% 86.7% 13.3% 93.3% 1.5 8.3% 58.3% 66.7% - 33.3% 33.3% 8.3% 91.7% 1,2
NCVER Report 2 final Page 55
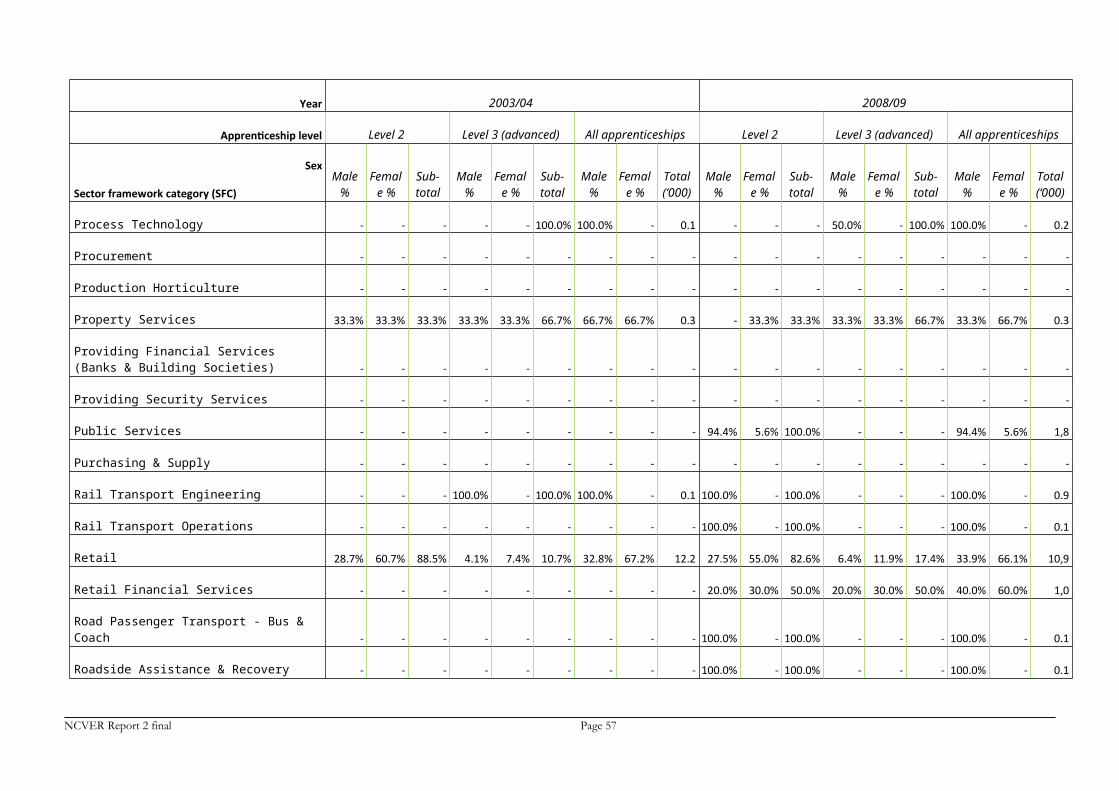
Year 2003/04 2008/09
Apprenticeship level Level 2 Level 3 (advanced) All apprenticeships Level 2 Level 3 (advanced) All apprenticeships
Sex
Sector framework category (SFC)Male
%Femal
e %Sub-total
Male %
Female %
Sub-total
Male %
Female %
Total (‘000)
Male %
Female %
Sub-total
Male %
Female %
Sub-total
Male %
Female %
Total (‘000)
Trees & Timber - - - - - - - - - 100.0% - 100.0% - - - 100.0% - 0.1
TV Production - - - - - - - - - - - - - - - - - -
Vehicle Body & Paint Operations - - - - - - - - - 66.7% - 66.7% 33.3% - 33.3% 100.0% - 1,2
Vehicle Fitting - - - - - - - - - 100.0% - 100.0% - - - 100.0% - 0.5
Vehicle Maintenance & Repair - - - - - - - - - 61.8% 1.1% 62.9% 36.0% - 37.1% 97.8% 2.2% 8,9
Vehicle Parts Operations - - - - - - - - - 60.0% - 60.0% 20.0% - 20.0% 80.0% - 0.5
Vehicle Sales - - - - - - - - - 100.0% - 100.0% - - - 100.0% - 0.1
Veterinary Nursing - - - - - - - - - - 55.6% 55.6% - 44.4% 44.4% - 100.0% 0.9
Warehousing & Storage - - - - - - - - - 91.7% 8.3% 100.0% - - - 91.7% 8.3% 1,2
Water Industry - - - - - - - - - 50.0% - 50.0% 50.0% - 50.0% 100.0% - 0.2
Wholesale, Distribution, Warehousing & Storage 87.5% 12.5% 93.8% 6.3% - 6.3% 87.5% 12.5% 1.6 100.0% - 100.0% - - - 100.0% - 0.2
Youth Work - - - - - - - - - - - 100.0% - - - - - 0.1
Other - - - - - - - - - - - - - - - - - -
Grand Total 34.1% 36.4% 70.6% 17.7% 11.8% 29.4% 51.8% 48.1% 193.6 32.6% 33.5% 66.1% 17.7% 16.2% 33.9% 50.3% 49.7% 239.9Notes: “-” indicates figures fewer than 50 and may be zero. Owing to rounding to the nearest 100 in the source tables, some
row percentages do not add to 100%.Source: <http://www.thedataservice.org.uk/statistics/sfrmar10/>, table S6.1, viewed 31 August 2010.
NCVER Report 2 final Page 56

The efficiency of the apprenticeship and traineeship system
Brian Knight, Tom Karmel and Hugh Guthrie
DATA CAVEAT
For best results print in colour.
Data in tables 5, 8, 9, 10 and 11 are subject todata checking in forthcoming publications.
Should errors arise NCVER willupdate and replace this version.
NCVER Report 2 final Page 57

IntroductionThe whole concept of the apprenticeship system is embodied in a contract of training. Its purpose, notionally, is the training of skilled workers and therefore the obvious measure of efficiency is the completion rate. While it is acknowledged that qualifications are not the be all and end all (see Keep 2009), and that traineeships were originally constructed as a labour market program, completion rates must be a key indicator of the efficiency of the system.
The paper brings together what we know about completion rates—their magnitude (and variability) and the factors that affect them, and the reasons for non-completion. While many of the factors associated with poor completion are well known—particular occupations, background characteristics, inadequate training plans and lack of pastoral care—we present some new analysis on the role of the employer and culture on trade completions. In terms of employer characteristics we look at the size of the employer and whether a group training organisation and whether private or government. By culture we are alluding to social factors that are conductive to training. The aim is to see whether ‘blue collar’ regions have a better environment for trade training. We also discuss the cost of non-completion and make a rather heroic attempt to estimate its magnitude.
We complete the paper by examining a second aspect of efficiency—the time taken to complete the contract of training. We specifically examine ‘accelerated’ apprenticeships, by which we mean an apprenticeship that is completed ahead of the standard duration.
NCVER Report 2 final Page 58

Completion ratesBefore presenting some data on completion rates we need to define what we mean by completion: an apprentice or trainee is considered to have completed the requirements of their training agreement when they have completed both the specified qualification; that is, the formal or off-the-job component—and the on-the-job training component. Successful completion of the training agreement is determined by the state training authority, or the registered training organisation in some jurisdictions, in consultation with the employer for the on-the-job component.
Some points regarding completion should be noted in relation to apprentices and trainees:
Training package developers endeavour to include all the requirements for trade occupations in the training package qualification requirements. However, in some licensed trades a person who has completed their apprenticeship may have to complete an additional assessment before they are licensed to work in that trade. Also, some employers, such as Defence, conduct reassessments to confirm registered training organisation standards.
In occupations that require certification of current competency, individuals who have completed their apprenticeship or traineeship may need to have a periodic reassessment of their skills to continue in that job. Examples include plant and machinery operators and pressure-vessel welders.
It is possible for an apprentice or trainee to complete the qualification that forms part of their training agreement without completing the on-the-job component. The extent to which this occurs is unknown, but there are examples of qualifications that will have value in their own right, for example, in the information technology and business studies areas.
Many individuals can—and do—work very successfully in occupations covered by apprenticeships or traineeships without any formal qualifications. Notable examples in the trades include unqualified motor mechanics and unqualified cooks or chefs.
Having defined completion, it would seem like a simple matter to calculate a completion rate as the proportion of training agreements that are completed once sufficient time has elapsed to allow the training contract requirements to be met and data to be reported. In practice there are a number of difficulties with this approach.
The first difficulty is that of time lags. For traditional apprenticeships it is necessary to allow at least four years before most of the data for full-time training agreement completions become available, and at least eight years for part-time training agreements. Lags in reporting completions exacerbate the problem. NCVER has addressed the time-lag issue by developing estimation procedures that allow completion rates to be reported earlier.
The second difficulty is that the way in which an apprenticeship or traineeship completion rate is calculated can affect the result. Because the apprenticeship system offers considerable flexibility to apprentices and their employers the simple approach based solely on training agreement will understate the completion rate that pertains to an individual if there has been a change in circumstances resulting in a new training agreement, for example:
a change of employer, including transfer from employment by a group training organisation to a specific employer. Since it is a legal contract, a new training agreement is required
a change from one state to another. This need not involve a change of employer but a new training agreement is needed because they are made under state law.
A further problem is that the NCVER data contain ‘expired’ contracts—those which go past the notional date of completion without a result being recorded.
NCVER Report 2 final Page 59

With the exception of the Australian Capital Territory and the Northern Territory, states initiate the completion process by contacting the employer, usually in writing, a short time before the expected completion date. Evidence that the contract requirements have been met is required before the completion is accepted and reported. Early completions are generally initiated by the employer or the apprentice, and sometimes the registered training organisation. As with full-term completion, evidence that the contract requirements have been met must be submitted before the state training authority accepts and records the completion. Some states, South Australia, for example, have publicised the early completion option and this has resulted in additional completions in some years.
Two exceptions to these arrangements are noted. In the ACT, responsibility for determining that training contract requirements have been met is delegated to the registered training organisation; under outsourcing arrangements in the NT, the Australian Apprenticeship Centre (AAC) is responsible for determining and reporting completions.
To account for the timing lags inevitable in these arrangements, NCVER weights recent completions in order to estimate the number of completions occurring in a particular quarter.
We first present estimates of completion rates for apprentices (table 1) and trainees (table 2). These are based on contracts of training following cohorts through time, and are calculated by matching completions to the date of commencement. The longer duration of trade apprenticeships means that the latest data are for apprentices commencing in 2004 and 2005, while for trainees we can present data up to 2007 commencements.
NCVER (2010c) has produced some experimental estimates exploiting the most recent data, based on a life-table methodology. These are presented in table 3.
Table 1 Completion rates in trades by occupation and year commenced, 2004–05 (%)
Year commenced & outcomeOccupation (ANZSCO) group
2004 contract completion
2005 contract completion
Engineering, ICT & science technicians 57.7 60.8
Automotive & engineering trades 51.9 51.3
Construction trades 44.9 45.3
Electrotechnology & telecommunications trades 56.7 53.6
Food trades workers 28.0 27.7
Skilled animal & horticultural workers 49.1 48.3
Other technicians & trade workers 41.9 41.3
Hairdressers 37.5 36.5
Printing trades workers 57.4 54.1
Textile, clothing & footwear trades workers 46.0 46.5
Wood trades workers 45.7 45.3
Miscellaneous technicians & trades workers 48.4 52.2
All trade occupations 45.8 45.6Notes: Completion rates are for training agreements, not individuals.Source: NCVER (2010b, table 10).
NCVER Report 2 final Page 60

Table 2 Completion rates in non-trades by occupation and year commenced, 2004 to 2007
Year commenced & outcomeOccupation (ANZSCO) group
2004 contract completion
2005 contract completion
2006 contract completion
2007 contract completion
Managers 48.0% 50.8% 50.5% 44.9%
Professionals 59.8% 55.9% 58.9% 52.8%
Community & personal service workers 54.7% 55.3% 54.7% 53.4%
Clerical & administrative workers 56.2% 56.5% 55.6% 53.8%
Sales workers 43.2% 43.6% 43.6% 44.8%
Machinery operators & drivers 57.0% 56.1% 55.9% 55.2%
Labourers 47.7% 48.5% 49.5% 49.7%
All non-trade occupations 51.8% 52.1% 52.0% 51.3%Notes: Completion rates are for training agreements, not individuals.Source: NCVER (2010b, table 10).
As can be seen there is considerable variation in the trades, with the food trades having the lowest rates and engineering, ICT and science technicians and electrotechnology and telecommunications trades having the highest. Completion rates for non-trade apprenticeships and traineeships also vary by occupation group, but to a lesser extent than in trades.
In at least two of the groups with above-average completion rates—community and personal service workers, and machinery operators and drivers—there are a significant number of occupations that require a specific qualification to work in the area. These occupations include aged care workers, child-care workers, and drivers and operators of specialist equipment such as forklifts. In effect, completing the requirements of the training agreement becomes a passport to the occupation and will operate as a motivator.
By contrast, there is no general requirement for a qualification in occupation groups such as sales workers and labourers, and the below-average completion rates most likely reflect the turnover inherent in these occupations.
NCVER Report 2 final Page 61

Table 3 Cross-sectional completion and attrition rates1,2 by selected occupation3 for contracts commencing in December quarter 2007–09
Occupation (ANZSCO) group3 Completion and attrition rates (%) by commencing cohort1,2
Completion rates Attrition rates2007 2008 2009 2007 2008 2009
Managers 59.9 51.8 62.0 33.6 38.8 29.8Professionals * 76.0 77.3 * 22.2 19.3Technicians and trades workers 43.3 44.7 44.5 52.3 51.7 52.531 Engineering, ICT and science technicians 62.1 64.0 67.5 34.4 30.6 26.432 Automotive and engineering 46.6 48.5 47.1 50.0 49.1 51.033 Construction trades workers 44.2 43.6 42.2 52.0 52.5 54.834 Electrotechnology and telecommunications trades workers 54.6 55.4 52.5 40.5 40.3 44.335 Food trades workers 25.2 26.9 29.1 70.9 68.8 67.136 Skilled animal and horticultural workers 49.1 48.9 52.6 44.0 45.3 41.739 Other technicians and trades workers 41.7 43.1 44.1 54.8 54.4 53.7
391 Hairdressers 38.1 37.2 34.2 59.6 61.3 64.9392 Printing trades workers 52.6 62.8 52.2 32.9 32.1 39.9394 Wood trades workers 38.0 37.9 39.6 59.0 59.4 57.5399 Miscellaneous 60.9 64.3 69.4 35.5 31.7 25.0
Community and personal service workers 58.8 57.1 59.8 37.9 38.9 34.541 Health and welfare support workers 69.6 71.8 59.9 25.5 24.5 29.842 Carers and aides 65.9 64.5 67.4 31.7 32.1 29.343 Hospitality workers 49.1 50.8 51.7 47.6 45.0 41.645 Sports and personal service workers 57.3 56.8 66.7 40.6 40.5 30.3Clerical and administrative workers 57.5 61.1 64.0 36.3 32.8 27.851 Office managers and program administrators 58.7 61.1 64.8 30.7 27.2 21.353 General clerical workers 61.1 63.4 66.3 37.3 35.2 31.754 Inquiry clerks and receptionists 47.9 51.9 54.7 47.3 43.9 40.555 Numerical clerks 51.5 61.8 66.4 38.9 32.1 27.459 Other clerical and administrative workers 62.0 61.8 60.1 31.9 29.6 28.2Sales workers 46.0 51.0 55.8 46.9 42.7 37.061 Sales representatives and agents 39.7 51.7 65.3 46.2 43.5 28.162 Sales assistants and salespersons 46.3 50.8 55.4 47.0 42.5 37.5Machinery operators and drivers 60.6 62.8 62.3 35.7 33.3 28.271 Machine and stationary plant operators 62.6 65.8 67.4 33.8 31.5 21.572 Mobile plant operators 60.5 62.9 58.8 36.4 35.6 33.873 Road and rail drivers 56.6 61.3 54.2 39.7 33.9 35.174 Storepersons 62.4 59.7 68.0 33.3 34.3 25.5Labourers 51.0 52.0 55.0 44.8 45.5 42.081 Cleaners and laundry workers 62.4 63.9 71.3 31.8 33.6 25.482 Construction and mining labourers 47.8 50.8 51.1 48.2 46.5 46.383 Factory process workers 45.0 48.1 46.0 50.6 49.4 51.084 Farm, forestry and garden workers 56.8 54.8 66.7 41.0 43.0 31.685 Food preparation assistants 37.3 20.7 28.0 57.2 76.2 70.189 Other labourers 51.0 52.1 48.9 46.2 45.2 47.7Total 50.8 53.2 56.2 43.5 42.1 38.8
Note: * Estimate not shown due to there being too few commencements to derive a reliable estimate.Source: NCVER 2010c (for notes on tables, see p.7).
The rates are quite similar to the longitudinal rates presented in tables 1 and 2. Table 3 also has estimates of the attrition rate (that is, the rate at which apprentices and trainees have dropped out). The difference between 100% and the sum of the completion and attrition rates gives a direct estimate of the extent of expired contracts for which we have no result. Overall, the table indicates that around 5% of contracts expire. Based on a somewhat dated survey, Ball and John (2005) claim we can assume that about half of these are actually completions, suggesting that we are understating the completion rate by around 2.5 percentage points. For the trades the proportion of expired contracts is around 3%, with the implication that the understatement of trade completion rates is lower at 1.5 % points (appendix table A2).
The rates we have presented are for a relatively short span of years—the methodology has only recently been developed by NCVER. However, earlier work by Ball and John (2005) and Karmel and Virk (2007)
NCVER Report 2 final Page 62

point to significant declines in trade completion rates. Ball and John estimated the 1995 commencing trade cohort to have a contract completion rate of 65%, falling to 45% a decade later. Karmel and Virk estimated that the completion rate fell from 64% for data in the period 1998–2002 to 57% in 2002–05.
While it is easy to come to the value judgment that the completion rates are rather low, it should be noted that they are considerably higher than the course completion rates in the broader publicly funded vocational education and training sector. Karmel and Mark (2010) estimated an overall course completion rate of 27%, with the rate being 35% for full-time students below the age of 25 years. In Canada, where commencement numbers are smaller than in Australia, completion rates for apprenticeships in the trades have been estimated at around 50%, a few percentage points higher than in Australia, but this is based on data from less than half the provinces (Desjardins 2010, table 2). For the UK, studies generally show lower overall completion rates.
The above estimates are based on contracts of training and we noted earlier issues with completion rates based on them. As we have seen, the number of expired contracts is not such a problem. However, the extent to which apprentices and trainees swap employers is of more interest. Karmel (forthcoming) has looked at the distribution of recommencements—apprentices moving to a new employer—and used this to estimate a completion rate based on an individual commencing an occupation. He finds that the number of such occurrences is of little substance in non-trade occupations but is of substance in the trades. The distribution of recommencements is presented in table 4.
Table 4 Commencement and recommencement data, by major occupational group, 2009
ANZSCO Jan-Mar 2009
Apr-Jun 2009
Jul-Sep 2009
Oct-Dec 2009
Managers Recommencements 104 73 114 60
Commencements 1,676 1,524 1,785 1,355
Professionals Recommencements 6 14 94 23
Commencements 2,410 1,909 2,022 1,258
Technicians and trades workers
Recommencements 5,363 4,284 5,136 3,766
Commencements 28,230 13,338 13,637 16,344
Community and personal service workers
Recommencements 500 474 468 320
Commencements 12,779 10,671 10,435 9,447
Clerical and administrative workers
Recommencements 318 260 243 199
Commencements 14,986 14,049 14,674 12,645
Sales workers Recommencements 156 157 166 111
Commencements 10,524 9,700 10,629 9,372
Machinery operators and drivers
Recommencements 130 139 107 200
Commencements 5,697 6,349 6,405 6,487
Labourers Recommencements 262 224 239 160
Commencements 5,887 5,153 5,434 4,632Source: NCVER Apprentice and Trainee Collection (unpublished data).
We see that the recommencements are only significant among the trades and technicians group, and this is the group for which Karmel estimates individual completion rates (table 5).
NCVER Report 2 final Page 63

Table 5 ‘Recommencement’ adjustment factor, contract and individual completion rates, trade occupations, commenced in 2005
Adjustment factor
Contract completion rate (%)
Individual completion rate (%)
31 Engineering, ICT and science technicians 1.04 60.8 63.2
32 Automotive and engineering trades workers 1.18 51.3 60.6
33 Construction trades workers 1.29 45.3 58.3
34 Electrotechnology and telecommunications trades workers 1.20 53.6 64.2
35 Food trades workers 1.42 27.7 39.2
36 Skilled animal and horticultural workers 1.09 48.3 52.6
39 Other technicians and trades workers 1.27 41.3 52.3
391 Hairdressers 1.45 36.5 52.8
392 Printing trades workers 1.08 54.1 58.3
393 Textile, clothing and footwear trades workers 1.07 46.5 49.7
394 Wood trades workers 1.20 45.3 54.4
399 Miscellaneous technicians and trades workers 1.05 52.2 55.0
3 Technicians and trades workers 1.24 45.6 56.6 Source: Karmel (forthcoming).
We see that the individual completion rates are on average around a quarter higher than the contract completion rates, with considerable variation by trade. The largest adjustments are for hairdressing and the food trades, both of which have extremely low contract completion rates. Clearly, there is considerable employer churn going on these occupations. The adjustment is smallest for engineering, ICT and science technicians, which in fact has the highest contract completion rate. However, when calculated for individuals, it loses this position to the electrotechnology and telecommunications trades.
The spread of completion rates is much narrower when calculated for individuals rather than contracts of training. At the contract level they range from 27.7% (food trades) to 60.8% (engineering, ICT and science technicians), while at the individual level the range is from 39.2% (food trades) to electrotechnology and telecommunications trades (64.2%).
Factors behind non-completionVarious studies have emphasised different aspects of what lies behind non-completion: occupational peculiarities, individual characteristics, practices at the jurisdictional level, aspects of delivery, and wages. At a statistical level we have already seen the variation by occupation.
In terms of individual characteristics, Ball (2004) found:
For age, those in the 20 to 24 age group are least likely to complete (p = 0.40) and those 45 years and over are most likely (p = 0.54). Also those who commence at age 17 years or less are more likely to complete than those who are 18 or 19 years at commencement (p = 0.48 and p = 0.44 respectively).
Females are more likely to complete than males, although the difference is not great (p = 0.47 and p = 0.45 respectively).
The probability of completion increases consistently with highest school level completed, from p = 0.38 for those with Year 9 or lower to p = 0.50 for those who completed Year 12.
Non-Indigenous apprentices and trainees are much more likely to complete than Indigenous Australians (p = 0.46 and p = 0.30 respectively).
NCVER Report 2 final Page 64

Apprentices and trainees without a reported disability are more likely to complete than those reporting a disability (p = 0.46 and p = 0.42 respectively).
Apprentices and trainees in rural regions are more likely to complete than those in metropolitan regions other than in capital cities (p = 0.51 and p = 0.46), with those in the capital cities least likely (p = 0.42). A likely explanation for this is that capital cities offer more alternative employment opportunities than rural or other metropolitan regions.
A different perspective is obtained by looking at the reasons that non-completers give for giving up their apprenticeship or traineeship (table 6).
Table 6 Reason for non-completion of an apprenticeship or traineeship
Non-completersIn a trade
occupationIn a non-trade occupation
Main reason for non-completion2008 2010 2008 2010
Doing something different/better 23.3 20.2 36.5 41.2
Poor working conditions/did not like boss 19.3 13.3 7.0 5.5
Didn’t like the type of work/industry, or transferred to other apprenticeship/ traineeship 16.8 13.7 8.2 8.7
Did not like the type of work 10.2 8.3 5.0 5.4
Not happy with the job prospects in the industry 3.6* 4.2 1.5* 1.5
Changed to another apprenticeship/ traineeship 3.1* 1.1* 1.7* 1.9
Wasn’t happy with training or study 8.2 5.1 7.9 3.8
Lost job or made redundant 8.9 26.8 7.8 15.2
Personal reasons 10.0 15.7 16.2 18.8
Training agreement cancelled or discontinued 3.2* 3.8 6.4 5.3
Other reasons 10.2 1.5* 10.1 1.5
Total 100.0 100.0 100.0 100.0Source: NCVER (2010a, table 5).
The importance of administrative practices is also clear. The following table is taken from some work done for the National Training Statistics Committee a couple of years ago and shows the considerable variation in completion rates by jurisdiction.
Table 7 Contract completion rates for tradespersons and related workers (ASCO major group 4), for the cohort commencing 2001 by state/territory
Measure NSW Vic. Qld SA WA Tas. NT (a) ACT Aust.
Contract completion rate for trades, 2001 cohort (%) 44.2 42.2 51.4 60.0 62.3 56.8 39.2 34.8 47.4
Sources: NCVER (2008, supporting tables).
NCVER’s investigation into what lies behind these differences showed that they are a consequence of substantive factors, and not an artefact of differences in policy and reporting practices. The key finding from extensive consultations held at that time was that there are a range of local factors that appear to explain the state variations in traditional apprenticeship completion rates. Completion rates are much higher in some jurisdictions, suggesting there is scope for improvement in the states that are at or below the national rate
Many stakeholders believe that the most important factor that promotes traditional apprenticeship completion are support and pastoral care arrangements, particularly in the first two years of the training
NCVER Report 2 final Page 65

contract when the great majority of attrition occurs. This can be provided by employers, by state training authority field staff, by Australian Apprenticeship Centres (many AACs provide more support and counselling for apprentices than is required under their contracts with DEEWR), by family or community and by group training organisations if the apprentice is a GTO employee. Tasmania appears to have a culture that strongly supports traditional apprenticeships and this is reflected in the support provided collectively by the various parties, that is, field officers, Australian Apprenticeship Centres, employers or group training organisations and the community generally.
The number of field staff varies among the states. In some jurisdictions it is evident that field staff work in very close cooperation with Australian Apprenticeship Centres and group training organisations and this reinforces the effectiveness of support and pastoral care arrangements. NT has a unique arrangement, as most state training authority apprenticeship services have been outsourced to the Australian Apprenticeship Centres under a tripartite agreement, resulting in highly integrated service provision.
Queensland is the only state which has significant state incentives, including payments for apprenticeships in regional areas and for selected trades, payments to offset RPL costs and cash payments to young people for early completion. However, these payments have changed over time and their impact on completion rates would be extremely difficult to quantify. It is possible that Queensland’s additional incentives, when combined with the monitoring and pastoral care responsibilities of a relatively large number of field officers and a state training authority policy that discourages contract cancellation, do contribute to the above-average completion rates for this state, but information to test this hypothesis was not available.
In isolation, a policy that discourages cancellations does not appear to have a major impact on completion rates but, when combined with other factors such as intervention strategies, pastoral care and support, it appears to have positive benefits. Most states accept a contract cancellation if both the apprentice and employer have agreed, although some foster close relationships with employers, apprentices and registered training organisations and look for early-warning signs. State training authorities, Australian Apprenticeship Centres and group training organisations all confirm that early intervention strategies frequently succeed in avoiding a breakdown in the training contract.
Few states accept single-party cancellations without some intervention, although the resources that are available for this do vary considerably. The states that have relatively large numbers of field officers available, Queensland and Western Australia, for example, have above-average completion rates and their approach to cancellation is often interventionist rather than passive acceptance. In Tasmania, although resources are limited, the strong culture that supports traditional apprenticeships also results in employers, registered training organisations, Australian Apprenticeship Centres and the state training authority working hard to salvage training contracts that appear to be breaking down.
From the consultations it is clear that the nature of the working relationship between the Australian Apprenticeship Centres and the state training authority varies. In some states the state training authority prefers Australian Apprenticeship Centres to do no more than required under their contract, whereas others promote a more active and cooperative working relationship with Australian Apprenticeship Centres and value any additional support that they provide.
There is some uncertainty about the impact of group training organisations on completion rates. Group training organisations and Australian Apprenticeship Centres clearly believe that GTO apprentices in the traditional trades have completion rates that are very much higher than for non-GTO apprentices. The reasons advanced are careful pre-selection before commencement and much higher levels of monitoring and support than other apprentices receive. However, this view is not confirmed by NCVER data, which now show that group training organisation completion rates are below those of private and government employers. Group training organisations have suggested that many GTO apprentices transfer permanently to a non-GTO employer during their training contract and are not being counted as GTO apprentice completions. The importance of group training organisations is taken up below when we report the results of some work undertaken for this paper.
NCVER Report 2 final Page 66

Other studies have emphasised the importance of quality training plans which, completed between the registered training organisation, employer and apprentice, outline details of the training to be undertaken and set out how the registered training organisation (RTO) will ensure the apprentice/trainee will receive quality training. Bowman, Stanwick and Blyth (2005) suggest that some studies found that there was a lack of training plans but that the mandatory development of a plan at the induction phase would serve to help clarify what the apprentice/trainee can expect from the apprenticeship/traineeship. However, Cully and Curtain (2001) found that, while 60% of trainees had a training plan, 62% reported an absence of discussion to monitor progress. Harris (2001) found structured training to be a factor in the retention of apprentices/trainees. These and other studies imply that the adequacy and structure of training is linked to the completion of training. In addition, Smith et al. (2009) suggest that ‘poor forward planning’ is a key factor inhibiting quality features such as the engagement of the registered training organisation with the trainee, the enterprise and other intermediaries. Mazzachi (2010) points out that there is increasing emphasis on the need for the training plan to be a readily available and a current working document. Training plans are also seen as playing a role as an early warning device for non-completion.
Employers no doubt have an important role in providing pastoral care to apprentices and trainees. Ben Bardon (private communication) has argued that the overall low completion rates mask considerable variation. His idea is that there are ‘tier 1’ employers and ‘tier 1’ apprentices and that the completion rate is actually very high when the former takes on the latter. Earlier work has shown the importance of previous education, for example, on completion rates, suggesting that the quality of apprenticeships is a factor. Karmel and Roberts (forthcoming) attempt to quantify the importance of the employers for completion rates in the trades. Their approach was to characterise employers by the number of apprentices, with the idea being that it is the large employers of apprentices who make up Bardon’s tier 1. As well as controlling for the standard background characteristics of apprentices, they introduce two novel variables. The first is an attempt to capture cultural factors to see if some regions are particularly conducive to the trades. To do so, they include a regional variable, which is the proportion of the local workforce in the trades. The second variable is employer type, split into group training organisations, private employers and government employers. The data are based apprentices in training in 2007, matched over two quarters in order to estimate transitions and hence completion rates. This is a non-standard dataset, in which individual apprentices were assigned to individual employers, and the completion rates were eliminated through Markov chains.
Table 8 suggests that size of employer is an important fact in determining completion rates, but more so in some trades than others. For example, completion rates among electrotechnology apprentices increases by almost 20 percentage points for an employer with over 100 apprentices by comparison with an employer with only one. By contrast, employer size does not make much difference for completion rates of construction apprentices.
Table 8 Completion rates by trade and size of employer
Number of apprentices
1 2–10 11–25 26–50 5–100 100 +
Eng./ICT/science 0.585 0.645 0.675 0.721 0.694 0.684
Automotive 0.491 0.509 0.563 0.605 0.61 0.599
Construction 0.509 0.517 0.543 0.525 0.517 0.493
Electrotechnology 0.542 0.569 0.64 0.698 0.722 0.736
Food technicians 0.288 0.299 0.357 0.402 - 0.344
Animal/horticultural 0.532 0.568 0.638 0.653 - 0.646
Other trades 0.446 0.456 0.55 0.584 0.577 0.546Note: Cells in red are possibly underestimated due to lack of data. Dark red signifies at most 3% underestimated; light red at most 1%. Missing values are due to lack of data.Source: Karmel and Roberts (forthcoming).
NCVER Report 2 final Page 67

Karmel and Roberts also find that cultural factors do have some impact. Apprentices coming from regions with a high proportion of trades workers (that is, the highest quartile) have completion rates around four percentage points higher than those from the lowest quartile (table 9). The type of employer also makes a difference, with government employers having very high completion rates (around 30 percentage points higher) than private employers and group training organisations doing a little better than private employers. However, as noted earlier, the interpretation of the last finding is problematic because some non-completions among group training organisations occur when a private employer takes over the apprenticeships.
Table 9 Completion rates by various characteristics
Trades workers ratio lowest quartile 0.484
middle two quartiles 0.503
highest quartile 0.525
Employer type private 0.493
group training 0.522
government 0.803
Source: Karmel and Roberts (forthcoming).
Finally, there is a popular view that wages impact on completion rates and that low training wages in particular are one of the reasons for low completion rates. Karmel and Mlotkowski (2010 a, b & c, forthcoming) test the significance on completion rates of the training wage (relative to the wage on offer in alternative employment) and the premium associated with completion. Based on data from NCVER’s 2008 and 2010 Apprentice and Destination Surveys, they find:
For the trades it is the premium associated with becoming a tradesperson that matters not the training wage.
For males in non-trade occupations both the premium associated with completion and training wage matter.
For females in non-trade occupations, the training wage does have some impact on completion rates.
In their second paper, they also find that other job opportunities matter (and hence completion rates during a downturn are likely to be higher than during boom times.
The cost of non-completionWe complete our survey on completion rates with an attempt to estimate the cost of non-completion.
Individuals undertake an apprenticeship or traineeship of their own free will. Similarly, individuals who choose to leave an apprenticeship or traineeship do so of their own free will—relatively few apprenticeships or traineeships are ended by the employer. Therefore one could argue that the majority of those who drop out do so because they find the alternative more appealing. From an economic rationalist point of view the utility attached to the alternative is greater than the utility associated with completion. Surely, for these individuals the cost of non-completion is zero? However, one might argue that the reasons for dropping out are idiosyncratic and the individuals suffer from a lack of information on the true value of completion vis-a-vis the alternative. Thus if individuals had more information, or better workplaces, or more convenient travel arrangements, then fewer would drop out, and this would be a good thing. Such considerations would suggest that indeed there is a cost to dropping out.
If we accept this, then it makes sense to quantify this cost. The approach we take is to think of the apprenticeship or traineeship as a mechanism to acquire skills, with the idea that an individual who has greater skills will benefit from higher future earnings. However, we know that an apprenticeship or
NCVER Report 2 final Page 68

traineeship typically receives a training wage; that is, a wage less than that available in alternative employment, and therefore foregoes current income. Typically, the alternative wage is rather less than that received if the person completes the apprenticeship or traineeship. Our approach is therefore to calculate the value of future earnings at various points over the potential life of an apprenticeship or traineeship.
The data we use for these calculations come from the apprentice and trainee destination survey, which obtained data on earnings at the end of the individual’s period of training and at completion of training (for those who completed) and in alternative employment (for those who did not). Karmel and Mlotkowski (2010c) modelled these data to obtain predictions for each individual of three wages: a training wage, a wage in alternative employment and a wage on completion. We use their model to undertake our calculations.
Before we can undertake the calculations, there are a number of other assumptions we need to make. First, we have to decide how long individuals will work for. Arbitrarily, we assume that apprenticeships and traineeships begin at 18 years, and the individuals work until they are 60. We also assume that they are undertaking a certificate II or III (there are a small number of higher-level apprenticeships or traineeships incorporating a diploma), that they are a new entrant (not an existing worker) and are in the private sector. Second, we don’t have any information from the survey about the likely career profile of the individual. We can obtain the relationship between experience and earnings within occupations but our problem is that we don’t know the occupations to which those who drop out go. Thus we make the simplifying assumption that the return from experience is at the same rate for both those who complete and those who drop out. The rate we use is based on an earnings equation estimated by Richardson (2004). We convert Richardson’s estimate to a percentage, so that an individual’s wage increases by about a third in real terms over their working life. Finally, we need to agree on a discount rate in order to calculate the net present value. Richardson used both 6% and 10%. We choose the former, which is very near the current long-term bond rate.
These calculations must be treated as indicative only. The calculations are primarily driven by the wedge between what an individual earns on completion of the apprenticeship or traineeship and what the individual is likely to earn in alternative employment. These estimates are provided in table 10.
NCVER Report 2 final Page 69

Table 10 Annual earnings for an 18-year-old, working full-time, with Year 12
Earning on completion
Earnings in alternative Difference
Difference as % of completion earnings
(‘000) (‘000) (‘000) (%)
31 Engineering, ICT and science technicians 36.0 37.1 -1.1 -3.2
32 Automotive and engineering 48.8 37.1 11.7 23.9
33 Construction trades workers 52.2 37.1 15.0 28.8
34 Electrotechnology and telecommunications trades workers 57.0 37.1 19.9 34.9
35 Food trades workers 37.9 37.1 0.8 2.2
391 Hairdressers 29.4 29.5 -0.1 -0.3
Males
1+2 Managers and professionals 39.1 29.0 10.2 26.0
4 Community and personal service workers 30.8 29.0 1.8 5.9
5 Clerical and administrative workers 36.6 29.0 7.6 20.9
6 Sales workers 28.1 29.0 -0.8 -2.9
7 Machinery operators and drivers 35.8 29.0 6.8 19.1
8 Labourers 35.8 29.0 6.8 19.1
Females
1+2 Managers and professionals 27.7 19.5 8.3 29.8
4 Community and personal service workers 28.1 22.0 6.1 21.6
5 Clerical and administrative workers 30.5 25.0 5.5 18.1
6 Sales workers 23.9 27.2 -3.3 -13.9
7 Machinery operators and drivers 26.1 21.3 4.8 18.4
8 Labourers 25.3 36.3 -11.0 -43.4Source: Derived from Karmel and Mlotkowski (2010c, forthcoming).
It can be seen that it is worthwhile completing most, but not all apprenticeships and traineeships. In the trades there are healthy premia to completion except in the food trades and hairdressing. In non-trade occupations there are premia for most occupations, the exception being sales and labourers (for women). It’s also worth noting the occupations with the highest earnings on completion of an apprenticeship or traineeship are electrotechnology, construction and automotive and engineering.
We now present the net present value calculations. For those who complete, we assume an apprenticeship of four years (the trades) and a traineeship of two years in the other occupations. For those who drop out, we assume that they withdraw after one of the apprenticeship or traineeship. The precise point at which individuals drop out will affect the net present value calculations but not by a great deal. The calculations are dominated by earnings after the apprenticeship or traineeship.
NCVER Report 2 final Page 70

Table 11 Net present value (NPV) calculations for an 18-year-old apprentice or trainee, with Year 12, working full-time
Occupation
NPV of completion
NPV of dropping out after one year
Cost of non-completion
Cost as % of completion NPV
31 Engineering, ICT and science technicians 740.1 809.3 -69.3 -9.4
32 Automotive and engineering 978.3 811.9 166.4 17.0
33 Construction trades workers 1035.0 811.1 223.9 21.6
34 Electrotechnology and telecommunications trades workers 1126.3 811.9 314.4 27.9
35 Food trades workers 775.8 810.3 -34.5 -4.4
391 Hairdressers 603.6 644.3 -40.8 -6.8
Males
1+2 Managers and professionals 712.3 549.6 162.7 22.8
4 Community and personal service workers 564.4 547.0 17.3 3.1
5 Clerical and administrative workers 667.5 549.0 118.5 17.8
6 Sales workers 523.7 549.0 -25.3 -4.8
7 Machinery operators and drivers 660.8 552.6 108.2 16.4
8 Labourers 653.5 548.7 104.8 16.0
Females
1+2 Managers and professionals 514.5 375.4 139.1 27.0
4 Community and personal service workers 521.0 422.2 98.9 19.0
5 Clerical and administrative workers 561.0 475.1 85.9 15.3
6 Sales workers 449.6 516.8 -67.2 -14.9
7 Machinery operators and drivers 487.1 409.2 77.9 16.0
8 Labourers 473.6 682.2 -208.6 -44.1Source: Calculations based on Karmel and Mlotkowski (2010c, forthcoming).
The interesting point about these calculations is that not all the net present values are positive, from which we conclude there is no cost in not completing. On the other hand, where the premium for completion is substantial, we find that the cost of non-completion translates to rather large sums. For example, in net present value terms, an electrotechnology apprentice dropping out after one year is foregoing over $300,000.
NCVER Report 2 final Page 71

Accelerated completionWhile the completion rate is the primary indicator of efficiency, there has been considerable interest in the time taken for completion. If completion times can be reduced, then the apprenticeship and traineeship system can be more responsive to changes in the demand for the skilled trades. Other advantages of accelerated completion are to reduce the opportunity costs for apprentices, and assisting experienced but not formally qualified people to gain formal qualifications, or attracting more mature workers with other valuable life experiences, training and qualifications into an occupation.
At various times, government policy has given particular emphasis to accelerated progression and completion. Examples include the promotion of RPL and credit transfer by the Australian National Training Authority (ANTA) in the 1990s, the inclusion of accelerated progression as an option in the New Apprenticeship arrangements implemented by ministers in 1998, and the push from the Council of Australian Governments (COAG) in 2007 as part of its response to skills shortages in traditional trades in the Australian economy. While all jurisdictions embrace the principles of competency-based and accelerated completions, the pace and approach to their implementation have varied between them. Common approaches are to shorten nominal durations in consultation with industry and to redesign programs with a significant increase in the off-the-job component of training occurring up front.
Not all parties welcome initiatives promoting accelerated progression. Many argue that a minimum amount of time is needed for an apprentice or trainee to achieve the intended learning outcomes. Employers and qualified tradespeople, particularly in traditional trades areas, often retain a preference for the time-served system because that is how they were trained. Employers also do not have a strong incentive to sign an apprentice off early as it results in wage increases and a decreased time to recoup the costs of training. Others suggest that early completion decreases the ‘roundedness’ of the training experience and perhaps increases the occupational health and safety and other risks of early completers who are not fully competent. Some training providers are concerned about the potential for more attrition and the extra administrative and resource burden that they believe comes with this more flexible and intensive approach. Many employers are concerned that accelerated completion will increase the risk of losing a valued employee when they finish their contract. Some apprentices have expressed concern about the extra pressure of study and assessment that comes with accelerated models.
We consider the extent to which accelerated completion actually occurs, the approaches and models of accelerated completion and the issues faced in implementation.
Rates of accelerated completionAll states and territories have a nominal duration ranging from three to four years for apprenticeships. For traineeships the duration is typically one to two years.
Figure 1 shows clearly that, in trades occupations there has been an increasing proportion of completions in three years or under since 1999, although the proportions seem to have stabilised since 2005.
NCVER Report 2 final Page 72

Figure 1 Apprentice and trainee completions in trade occupations by duration of training, certificate III or above, 1999–2009 (%)
The image of Figure 1 has been removed and replaced with a description of the image to ensure that the information is available to people with various information accessibility needs. The image is included in the PDF version of this publication.
A bar chart listing the completions of Certificate III or above trade occupation completions by duration of training from 1999-2009 is shown. The bar chart indicates that there is an increase in the number of completions with a duration of between one and two years, and two and three years, and a decrease in those that take over three years to complete.Source: NCVER (2010b, figure 4, p.19) .
While these data contain a handful of shorter-duration traineeships (mostly among engineering, ICT and science technicians), it is clear that many apprentices do complete their apprenticeship faster than the nominal three or four years. However, the proportion completing in fewer than three years has remained relatively steady over the last five or six years, despite COAG’s push to promote accelerated apprenticeships. In fact, many employers make sure that their apprentices serve out their full four years, as can be seen from the spike at 16 quarters in the pattern of completions shown in figure 2.
Figure 2 Cross-sectional completion rates for apprentices, December quarter, 2007 and 2008
The image of Figure 2 has been removed and replaced with a description of the image to ensure that the information is available to people with various information accessibility needs. The image is included in the PDF version of this publication.
This line graph shows the cumulative proportion of apprentice completion rates by duration for the 2007 and 2008 December quarter. It indicates that apprentices and trainees often serve out the full 4 years of their apprenticeship.Source: Karmel and Misko (2009).
NCVER Report 2 final Page 73

Using the most current data, table 12 shows that, overall, about 28% of trade apprentices and trainees who completed their qualifications do so in two years or fewer. At the end of three years nearly 45% have completed. By the end of 3.5 years this proportion has reached nearly 58% and by the end of four years 95% have completed.
Table 12 Apprentice and trainee completions in trade occupations, Certificate III and above, by duration of training, 12 months ending 30 June 2009 (%)—by jurisdiction and national
ANZSCO (occupation) group State/territory
Up to 2 years %
Up to 3 years%
3–3.5 years%
3.5–4 years%
Over 4 years% Total
3 Total – Technicians and trades workers
New South Wales 31.4 44.9 53.3 98.6 100.0 11883
Victoria 28.3 47.1 56.8 95.8 100.0 10134
Queensland 29.5 46.9 66.5 92.2 100.0 11914
South Australia 22.1 37.4 48.4 93.6 100.0 2737
Western Australia 13.8 33.9 50.4 90.0 100.0 5585
Tasmania 27.4 43.8 53.0 92.5 100.0 1280
Northern Territory 39.7 56.6 71.6 89.3 100.0 373
Australian Capital Territory 53.9 71.8 82.0 94.9 100.0 763
AUSTRALIA 27.7 44.6 57.6 94.6 100.0 44669Source: NCVER, National Apprentice and Trainee Collection, June 2010 estimates (derived data).
There is considerable variation in the extent of early completion by state (table 12). The two territories have the highest rate of early completion. Among the states, we see that New South Wales, Queensland and Victoria have much higher rates of completions in the trades—fewer than two or three years—than do South Australia and Western Australia. It would appear that state policies and practices do matter.
NCVER Report 2 final Page 74

Table 13 clearly demonstrates that different occupational groups are also characterised by different proportions of completion in different timeframes. Nationally, traditional trades such as automotive and engineering trades, printing, electrotechnology, construction trades and wood trades typically have between about 40% and just under 60% completion at the end of 3.5 years. For hairdressers and food trade workers, on the other hand, the proportion of completions is in excess of 70% at an equivalent period. It is even higher for skilled animal and horticulture workers. Engineering, ICT and science technicians have in excess of 90% of completers completing by the end of three years.
Table 13 Apprentice and trainee completions in trade occupations, certificate III and above, by duration of training, 12 months ending 30 June 2009 (%)—Australia
ANZSCO (occupation) group
Up to 2 years %
Up to 3 years%
3 - 3.5 years%
3.5 - 4 years%
Over 4 years% Total
3 Total – Technicians and trades workers 27.7 44.6 57.6 94.6 100.0 44669
31 Engineering, ICT and science technicians 83.1 92.3 94.4 98.7 100.0 1942
32 Automotive and engineering trades workers 18.3 33.7 48.2 94.6 100.0 12796
33 Construction trades workers 20.9 39.9 57.8 95.4 100.0 11345
34 Electrotechnology and telecommunications trades workers 16.6 24.6 34.9 88.1 100.0 7010
35 Food trades workers 43.8 70.6 81.1 96.6 100.0 3894
36 Skilled animal and horticultural workers 49.4 74.5 80.5 99.0 100.0 1696
39 Other technicians and trades workers 39.3 59.5 70.1 96.6 100.0 5986
391 Hairdressers 36.2 64.2 75.2 97.1 100.0 3190
392 Printing trades workers 14.9 28.5 39.3 96.7 100.0 369
393 Textile, clothing and footwear trades workers 53.6 73.2 83.9 99.1 100.0 112
394 Wood trades workers 17.8 31.5 47.0 94.3 100.0 1065
399 Miscellaneous technicians and trades workers 71.5 79.0 84.3 96.8 100.0 1250
Source: NCVER, National Apprentice and Trainee Collection, June 2010 estimate.
It is likely that there are at least two factors operating here. The first is the nominal duration of the underlying qualifications in some occupations, notably, engineering, ICT and science technicians, are much shorter than the norm of three or four years. Second, it is also clear that some trades have adopted more flexible approaches to accelerated completion than others. This is probably due, at least in part, to the persistence of traditional views of trade training and durations in certain occupations and an openness to new thinking in others. This is demonstrated by differential proportions of completions in a particular occupation by jurisdiction (see appendix tables A3–A10).
Procedures for signing off accelerated completionsA range of jurisdictions, occupations and providers have flirted with approaches which might accelerate completions, and documentation on their websites as well as personal insights reveals how they are approaching this issue.
While all jurisdictions have policies and procedures to enable early completion to occur, there is a variety of practice. There may also be a distinction between issuing a qualification (usually provider-initiated) and completing the contract. For example, in South Australia, registered training organisations may issue the
NCVER Report 2 final Page 75

qualification without involving the employer in the assessment process, as this is not required by the AQTF, and is usually not required by training packages. Nevertheless, the employer’s verification of the trainee/apprentice’s competency is required for the completion of the training contract. Similarly, in New South Wales employers and apprentices/trainees may apply to State Training Services for completion of the training contract prior to the expected completion date if the registered training organisation has issued the formal qualification and the employer considers the apprentice or trainee competent to industry standard. To confirm successful completion, the employer signs the completion letter and attaches a copy of the qualification issued to their apprentice/trainee by the registered training organisation.
Other jurisdictions, particularly Tasmania, Western Australia and Queensland, have a different approach to competency-based completion processes. In these cases, completion of a training contract occurs when the registered training organisation, employer and apprentice agree that all the requirements of the training contract have been met. The registered training organisation then issues the qualification. The training contract ceases on the issuance of the qualification. Likewise the Victorians place the onus on the employer and the apprentice to instigate an early completion and that the requirements of the apprentice’s training plan have been met. The registered training organisation then satisfies itself that the qualification has been attained and arranges for all the parties to sign a completion agreement which, in turn, is used to notify Skills Victoria of contract completion. Policies in Tasmania, Queensland, Western Australia, and to a lesser extent, the Northern Territory, require that the employer be involved in the assessment of competencies during the traineeship/apprenticeship. In these jurisdictions, the registered training organisation cannot issue the AQF qualification without the employer’s and trainee/apprentice’s verification of the trainee/apprentice’s on-job competence. The registered training organisation is then responsible for advising the regulator of the completion of the training contract within a specified time from the completion date
The two territories use exceptions to these general arrangements of employer and trainee initiation. In the Australian Capital Territory responsibility for determining that training contract requirements have been met is delegated to the registered training organisation. In the Northern Territory, under outsourcing arrangements the Australian Apprenticeship Centre is responsible for determining and reporting completions.
Approaches used to accelerate completionAccelerated completion has attracted very little research interest so far. The only research of substance appears to be by Callan (2008), who draws on apprentice, employer and teaching staff perspectives. Callan documents deliberate attempts to adopt processes that will materially shorten apprenticeships. He proposes an ‘ideal model’ with a number of key features:
Laying the groundwork: this ensures that all parties, and particularly employers, understand clearly what is involved in introducing accelerated completions, what each of their roles will be and how they will work with others. However, a change approach that is seen as more incremental than transformational and wholesale may be more likely to be successful. It is also important to involve employers in program design. Furthermore, the right people need to be involved. This includes employers, providers and their staff and, most importantly, the participants. As accelerated progression can be challenging for learners, it may be more difficult for those who lack maturity, have learning difficulties or lack sufficient levels of personal support.
Providing intensive up-front training: intensive up-front training gives apprentices and employers the option of undertaking a significant amount of the formal training component of the qualification at the beginning of an apprenticeship. Such an approach might also incorporate prevocational programs and should involve appropriate RPL being granted. It also provides participants with immediately useable vocational skills and knowledge so that they are more job-ready. Nested certificate II and III awards can also be useful as a way of allowing students with different levels of talent and motivation to exit
NCVER Report 2 final Page 76

with an industry qualification (see Guthrie 2010). Callan also suggests that it provides many industries with what they need—skilled but less highly qualified workers who are willing to undertake repetitive service that those fully qualified apprentices find to be an under-utilisation of their knowledge and skills.
Incorporating key elements and support in the program design: these key elements include developing and maintaining appropriate partnerships between training organisations and employers. This requires more flexible approaches to work and learning including: using online and other flexible learning approaches, technologies and assessment techniques, both
on and off the job appropriate support by trained workplace mentors as well as provider and field officer visits to
monitor progress against individual training plans. Such monitoring may need to be quite intensive adopting competency- rather than time-based wage progression for apprentices.
Callan notes that there are additional financial costs to operating accelerated apprenticeships as well as increased pressures upon apprentices, employers and trainers, all of which need to be managed well.
SummaryTo summarise:
The level of accelerated completion is significant but varies with jurisdiction and by industry area.
There is little evidence that rates of accelerated completion have changed much, despite the push from COAG in 2007.
There is a variety of arrangements nationally for accelerated completions, particularly how they are initiated and by whom. While all jurisdictions are working towards implementing competency-based completions, they are doing so at different rates and through different approaches. Shortening the formal duration appears to be the most effective strategy.
Callan’s work (2008) on approaches to accelerated completions suggests that intensive up-front training incorporating nested awards is a key feature.
To successfully implement accelerated completions requires effective cooperation between enterprises and training institutions. It also needs higher levels of administrative support. The approach may not suit some types of learners, particularly those who are younger, or who have learning difficulties and other personal issues. It is not a cheap option.
A couple of final observations. First, leaving the sign-off to employers is likely to militate against early sign-off because of the differences in wages of apprentices and qualified workers. In the same vein, moves to shorten apprenticeships will change the balance of costs and benefits for employers. Thus they may have the unintended consequence of employers offering fewer apprenticeships. Finally, the obvious radical solution is to dispense with the contract of training and replace it with shorter-duration institutional programs. This approach is characteristic of the training approaches in a range of other countries, and is an obvious strategy in hairdressing and the food trades where institutional programs are available and apprentice drop-out rates are high.
NCVER Report 2 final Page 77

ConclusionIn this paper we have tackled the efficiency of the apprenticeship and traineeship system, as captured by completion rates and the time it takes to complete an apprenticeship. (Time taken is not such an issue for traineeships because they are generally shorter.)
In relation to completion rates we find that they vary considerably by occupation, personal characteristics, and characteristics of employers and administrative arrangements of the jurisdictions. The level of pastoral support matters, as do wages (both training wages and the wages on completion). While the overall rates are mediocre (around 50%), such rates are relatively high by comparison with the overall course completion rates in vocational education and training and consistent with international experience. Moreover, the cost of non-completion is very high in some occupations but not so in others.
However, the great variation in completion rates and the associated cost of non-completion do raise issues about the model. Specifically, we can question whether the model is appropriate in all the current occupations covered, and also whether the design of the system needs to take into better account the characteristics of individuals and employers. Should the bar be set higher before we allow an employer to take on an apprentice? While such a move may well improve completion rates, it would result in the exclusion of many apprentices from the system.
Similarly, accelerated completion may be a positive indicator of a responsive apprenticeship system, and substantial numbers of apprentices do complete well ahead of the notional three to four years, although no great increase has been observed in recent years, despite governments’ push in this direction. However, we need to be aware that accelerated completion can put pressure on apprentices and training providers and also change the economics of offering an apprenticeship from the point of view of the employer.
NCVER Report 2 final Page 78

ReferencesABS (Australian Bureau of Statistics) 2006, Australian and New Zealand Standard Classification of Occupations (ANZSCO),
1st edition, ABS cat.no.1220.0, ABS Canberra.Ball, K & John, D 2005, Apprentice and trainee completion rates, NCVER, Adelaide.Bowman, K, Stanwick, J & Blythe, A 2005, Factors pertaining to quality outcomes of shorter duration apprenticeships and
traineeships, NCVER, Adelaide.Callan, V 2008, Accelerated apprenticeships: apprentice, employer and teaching staff perceptions, NCVER,
Adelaide.Cully, M & Curtain, R 2001, Reasons for New Apprentices’ non-completions, NCVER, Adelaide.Desjardins, L 2010, Completion and discontinuation rates of registered apprentices: does program duration matter?, Statistics
Canada, Ottawa, viewed 1 September 2010, <http://www.statcan.gc.ca/pub/81-004-x/2010002/article/11253-eng.htm>.
Guthrie, H 2010, Pre-vocational programs, NCVER, Adelaide,Harris, R, Simons, M, Bridge, K, Bone, J, Symons, H, Clayton, B, Pope, B, Cummins, G & Blom, K 2001, Factors
that contribute to retention and completion rates for apprentices and trainees, NCVER, Adelaide.Karmel, T (forthcoming) Apprentices moving employers (tentative title reference table 5), NCVER, AdelaideKarmel, T & Mark, K 2010, The likelihood of completing a VET qualification: a model-based approach, NCVER, Adelaide. Karmel, T & Misko, J 2009 Apprenticeships and traineeships in the downturn, NCVER, AdelaideKarmel, T & Mlotkowski, P 2010a, Estimating apprentice and trainee completion and attrition rates using a ‘life tables’ approach,
NCVER, Adelaide.——2010b, How reasons for not completing apprenticeships and traineeships change with duration, NCVER, Adelaide.——2010c, The impact of wages on the probability of completing an apprenticeship or traineeship, NCVER, Adelaide.——forthcoming, The impact of wages on the probability of completing an apprenticeship or traineeship revisited, NCVER,
Adelaide.Karmel, T & Roberts, D (forthcoming) Social capital and completion rates, NCVER, Adelaide.Karmel, T & Virk, G 2007, What is happening to traditional apprentice completions?, NCVER, Adelaide.Keep, E 2009, ‘Labour market structures and trends, the future of work and its implications for initial E&T’,
Beyond Current Horizons, UK, viewed September 2010, <http://www.beyondcurrenthorizons.org.uk/labour-market-structures-and-trends-the-future-of-work-and-the-implications-for-initial-et/>.
Mazzachi, R 2010, unpublished report 3 for Apprentice and Trainee review panelNCVER (National Centre for Vocational Education Research) 2002, Outcomes and completions of New Apprenticeships:
At a glance, NCVER, Adelaide.——2008, Australian vocational education and training statistics: apprentices and trainees, 2006 and 2007—Annuals, NCVER
Adelaide.——2010a, Australian vocational education and training statistics: apprentice and trainee destinations, NCVER, Adelaide. ——2010b, Australian vocational education and training statistics: apprentices and trainees, 2009—annual, NCVER Adelaide. ——2010c, Experimental completion and attrition rates for latest commencing apprentices and trainees, NCVER, Adelaide.Richardson, S 2004, Employers’ contribution to training, NCVER, Adelaide.Skills Australia 2010, Australian workforce futures: a national workforce development strategy, Skills Australia, Sydney. Smith, E, Comyn, P, Brennan Kemmis, R & Smith, A 2009, High quality traineeships: Identifying what works - Good practice
guide, NCVER, Adelaide
NCVER Report 2 final Page 79

Appendices
Table A1 Cross-sectional completion and attrition rates1,2 by selected occupation3 for contracts commencing in December quarter 2007–09
Occupation (ANZSCO) group3 Completion and attrition rates (%) by commencing cohort1,2
Completion rates Attrition rates2007 2008 2009 2007 2008 2009
Managers 59.9 51.8 62.0 33.6 38.8 29.8Professionals * 76.0 77.3 * 22.2 19.3Technicians and trades workers 43.3 44.7 44.5 52.3 51.7 52.531 Engineering, ICT and science technicians 62.1 64.0 67.5 34.4 30.6 26.432 Automotive and engineering 46.6 48.5 47.1 50.0 49.1 51.033 Construction trades workers 44.2 43.6 42.2 52.0 52.5 54.834 Electrotechnology and telecommunications trades workers 54.6 55.4 52.5 40.5 40.3 44.335 Food trades workers 25.2 26.9 29.1 70.9 68.8 67.136 Skilled animal and horticultural workers 49.1 48.9 52.6 44.0 45.3 41.739 Other technicians and trades workers 41.7 43.1 44.1 54.8 54.4 53.7
391 Hairdressers 38.1 37.2 34.2 59.6 61.3 64.9392 Printing trades workers 52.6 62.8 52.2 32.9 32.1 39.9394 Wood trades workers 38.0 37.9 39.6 59.0 59.4 57.5399 Miscellaneous 60.9 64.3 69.4 35.5 31.7 25.0
Community and personal service workers 58.8 57.1 59.8 37.9 38.9 34.541 Health and welfare support workers 69.6 71.8 59.9 25.5 24.5 29.842 Carers and aides 65.9 64.5 67.4 31.7 32.1 29.343 Hospitality workers 49.1 50.8 51.7 47.6 45.0 41.645 Sports and personal service workers 57.3 56.8 66.7 40.6 40.5 30.3Clerical and administrative workers 57.5 61.1 64.0 36.3 32.8 27.851 Office managers and program administrators 58.7 61.1 64.8 30.7 27.2 21.353 General clerical workers 61.1 63.4 66.3 37.3 35.2 31.754 Inquiry clerks and receptionists 47.9 51.9 54.7 47.3 43.9 40.555 Numerical clerks 51.5 61.8 66.4 38.9 32.1 27.459 Other clerical and administrative workers 62.0 61.8 60.1 31.9 29.6 28.2Sales workers 46.0 51.0 55.8 46.9 42.7 37.061 Sales representatives and agents 39.7 51.7 65.3 46.2 43.5 28.162 Sales assistants and salespersons 46.3 50.8 55.4 47.0 42.5 37.5Machinery operators and drivers 60.6 62.8 62.3 35.7 33.3 28.271 Machine and stationary plant operators 62.6 65.8 67.4 33.8 31.5 21.572 Mobile plant operators 60.5 62.9 58.8 36.4 35.6 33.873 Road and rail drivers 56.6 61.3 54.2 39.7 33.9 35.174 Storepersons 62.4 59.7 68.0 33.3 34.3 25.5Labourers 51.0 52.0 55.0 44.8 45.5 42.081 Cleaners and laundry workers 62.4 63.9 71.3 31.8 33.6 25.482 Construction and mining labourers 47.8 50.8 51.1 48.2 46.5 46.383 Factory process workers 45.0 48.1 46.0 50.6 49.4 51.084 Farm, forestry and garden workers 56.8 54.8 66.7 41.0 43.0 31.685 Food preparation assistants 37.3 20.7 28.0 57.2 76.2 70.189 Other labourers 51.0 52.1 48.9 46.2 45.2 47.7Total 50.8 53.2 56.2 43.5 42.1 38.8
* Estimate not shown due to there being too few commencements to derive a reliable estimate.Source: NCVER (2010c).
NCVER Report 2 final Page 80
Table A2 Expired contracts, by occupation, 2009 (%)
2009 2009 2009
Managers 62 29.8 8.2
Professionals 77.3 19.3 3.4
Technicians and trades workers 44.5 52.5 3
31 Engineering, ICT and science technicians 67.5 26.4 6.1
32 Automotive and engineering 47.1 51 1.9
33 Construction trades workers 42.2 54.8 3
34 Electrotechnology and telecommunications trades workers 52.5 44.3 3.2
35 Food trades workers 29.1 67.1 3.8
36 Skilled animal and horticultural workers 52.6 41.7 5.7
39 Other technicians and trades workers 44.1 53.7 2.2
391 Hairdressers 34.2 64.9 0.9
392 Printing trades workers 52.2 39.9 7.9
394 Wood trades workers 39.6 57.5 2.9
399 Miscellaneous 69.4 25 5.6
Community and personal service workers 59.8 34.5 5.7
41 Health and welfare support workers 59.9 29.8 10.3
42 Carers and aides 67.4 29.3 3.3
43 Hospitality workers 51.7 41.6 6.7
45 Sports and personal service workers 66.7 30.3 3
Clerical and administrative workers 64 27.8 8.2
51 Office managers and program administrators 64.8 21.3 13.9
53 General clerical workers 66.3 31.7 2
54 Inquiry clerks and receptionists 54.7 40.5 4.8
55 Numerical clerks 66.4 27.4 6.2
59 Other clerical and administrative workers 60.1 28.2 11.7
Sales workers 55.8 37 7.2
61 Sales representatives and agents 65.3 28.1 6.6
62 Sales assistants and salespersons 55.4 37.5 7.1
Machinery operators and drivers 62.3 28.2 9.5
71 Machine and stationary plant operators 67.4 21.5 11.1
72 Mobile plant operators 58.8 33.8 7.4
73 Road and rail drivers 54.2 35.1 10.7
74 Storepersons 68 25.5 6.5
Labourers 55 42 3
81 Cleaners and laundry workers 71.3 25.4 3.3
82 Construction and mining labourers 51.1 46.3 2.6
83 Factory process workers 46 51 3
84 Farm, forestry and garden workers 66.7 31.6 1.7
85 Food preparation assistants 28 70.1 1.9
89 Other labourers 48.9 47.7 3.4
Total 56.2 38.8 5
Source: NCVER (2010c).
NCVER Report 2 final Page 81

Completions by duration, by state and occupation
Table A3 Apprentice and trainee completions in trade occupations, certificate III and above, by duration of training, 12 months ending 30 June 2007–09 (%)—New South Wales
ANZSCO (occupation) group
Year(12 months
ending 30 June)
Up to 1 year %
1–1.5 years
%
1.5–2 years
%2–2.5
years %2.5–3
years %3–3.5
years %3.5–4 years
%Over 4
years % Total3 Total – Technicians and trades workers 2007 14.2 20.5 31.8 38.0 47.4 54.6 98.8 100.0 10410
2008 12.3 19.7 29.0 34.4 43.3 51.6 98.7 100.0 107812009 11.8 21.4 31.4 37.1 44.9 53.3 98.6 100.0 11883
31 Engineering, ICT and science technicians 2007 28.3 33.0 70.3 88.1 89.3 90.4 99.8 100.0 488
2008 19.4 50.0 73.8 82.7 84.4 87.4 100.0 100.0 2942009 14.8 51.8 75.3 80.3 88.6 91.1 99.4 100.0 542
32 Automotive and engineering trades workers 2007 7.6 12.7 19.2 24.0 36.4 43.6 98.5 100.0 2814
2008 7.7 12.5 17.9 22.5 34.0 42.5 99.0 100.0 29902009 9.0 14.3 20.7 25.0 33.5 42.3 98.8 100.0 3282
33 Construction trades workers 2007 9.4 15.0 24.8 31.3 40.6 50.4 98.6 100.0 26072008 9.6 16.6 23.5 29.2 37.4 46.7 98.1 100.0 28312009 9.6 16.5 24.9 31.4 39.7 49.8 98.6 100.0 2792
34 Electrotechnology and telecommunications trades workers 2007 11.7 17.4 22.4 27.0 36.0 41.6 98.7 100.0 1460
2008 10.2 14.8 21.5 25.5 30.6 39.0 97.9 100.0 16532009 7.1 13.4 21.9 26.8 31.4 40.0 97.1 100.0 2006
35 Food trades workers 2007 15.5 27.1 44.7 52.7 62.0 69.6 98.5 100.0 10562008 18.1 26.7 46.4 54.3 63.9 72.2 98.6 100.0 10582009 17.7 28.9 45.6 52.3 62.5 70.9 98.6 100.0 1074
36 Skilled animal and horticultural workers 2007 50.5 55.9 64.0 67.5 72.0 75.2 99.7 100.0 628
2008 27.5 39.9 54.5 57.4 66.5 71.9 100.0 100.0 5492009 17.9 39.0 45.9 51.8 60.5 65.2 99.5 100.0 569
39 Other technicians and trades workers 2007 16.7 24.5 42.5 48.9 57.5 65.4 99.4 100.0 1357
2008 18.3 27.7 40.0 46.7 56.7 64.7 99.5 100.0 14062009 20.0 33.1 46.8 54.4 61.8 69.7 99.6 100.0 1618
391 Hairdressers 2007 20.4 29.8 42.4 50.6 59.6 69.9 99.6 100.0 8202008 19.7 31.0 41.8 50.6 59.8 68.9 99.6 100.0 9312009 18.3 30.5 39.6 50.3 59.7 69.4 99.5 100.0 939
392 Printing trades workers 2007 1.9 6.6 12.3 14.2 29.2 33.0 99.1 100.0 1062008 12.3 14.2 15.1 16.0 31.1 39.6 99.1 100.0 1062009 12.1 15.5 19.8 21.6 30.2 34.5 100.0 100.0 116
393 Textile, clothing and footwear trades workers 2007 3.3 13.3 70.0 70.0 80.0 80.0 100.0 100.0 30
2008 0.0 8.0 52.0 52.0 76.0 76.0 100.0 100.0 252009 4.0 8.0 76.0 80.0 88.0 88.0 100.0 100.0 25
394 Wood trades workers 2007 6.9 13.7 22.1 27.5 37.4 43.5 98.5 100.0 1312008 8.1 12.2 20.3 23.6 42.3 46.3 99.2 100.0 1232009 11.5 18.0 23.7 31.7 41.7 51.1 99.3 100.0 139
399 Miscellaneous technicians and trades workers 2007 17.4 21.9 61.5 65.2 69.3 73.7 99.3 100.0 270
2008 23.5 31.2 54.3 57.0 61.5 67.9 99.5 100.0 2212009 30.1 51.1 77.7 79.9 81.2 86.0 100.0 100.0 399
Source: NCVER, National Apprentice and Trainee Collection, June 2010 estimates.
NCVER Report 2 final Page 82

Table A4 Apprentice and trainee completions in trade occupations, certificate III and above, by duration of training, 12 months ending 30 June 2007–09 (%)—Victoria
ANZSCO (occupation) group
Year(12 months
ending 30 June)
Up to 1 year %
1–1.5 years
%
1.5–2 years
%2–2.5
years %2.5–3
years %3–3.5
years %3.5–4 years
%Over 4
years % Total3 Total – Technicians and trades workers 2007 10.9 18.1 29.4 36.6 51.2 61.0 96.4 100.0 9090
2008 11.8 19.5 27.0 34.0 47.1 56.4 96.2 100.0 93052009 12.8 20.7 28.3 35.5 47.1 56.8 95.8 100.0 10134
31 Engineering, ICT and science technicians 2007 35.4 61.6 76.5 81.8 89.7 92.4 98.7 100.0 302
2008 26.2 61.4 72.7 76.9 85.9 89.0 96.3 100.0 3552009 38.0 63.9 77.5 81.0 86.1 90.2 95.9 100.0 316
32 Automotive and engineering trades workers 2007 6.2 11.3 28.3 34.0 43.0 52.3 96.1 100.0 2567
2008 6.3 11.1 17.9 24.5 32.8 42.1 96.1 100.0 23062009 6.9 12.5 18.3 24.9 33.6 43.8 95.6 100.0 2500
33 Construction trades workers 2007 8.9 15.2 24.0 31.1 42.6 57.1 97.3 100.0 27252008 12.0 18.2 24.0 30.6 40.9 54.7 96.6 100.0 29902009 10.8 17.1 23.6 30.6 41.0 55.3 96.2 100.0 3142
34 Electrotechnology and telecommunications trades workers 2007 7.6 11.4 15.6 19.6 24.2 27.8 89.4 100.0 1049
2008 8.8 11.9 16.8 21.2 23.9 28.2 91.2 100.0 12892009 6.9 11.1 15.6 19.3 21.4 26.3 91.8 100.0 1483
35 Food trades workers 2007 22.1 35.4 45.3 53.2 77.9 86.2 97.9 100.0 8482008 23.5 36.3 47.8 56.9 82.3 90.0 98.5 100.0 8002009 25.2 37.0 49.7 59.3 82.8 90.5 98.1 100.0 841
36 Skilled animal and horticultural workers 2007 17.2 26.3 39.8 51.1 88.0 98.6 99.4 100.0 483
2008 12.8 22.1 32.9 44.7 73.6 84.3 97.5 100.0 4472009 21.2 30.7 40.3 51.9 70.6 79.6 98.2 100.0 514
39 Other technicians and trades workers 2007 11.6 18.5 29.1 40.7 69.4 77.4 98.3 100.0 1116
2008 13.0 23.3 34.3 43.7 72.1 77.7 99.0 100.0 11182009 18.5 31.2 42.6 52.4 74.7 80.5 97.5 100.0 1338
391 Hairdressers 2007 15.5 23.3 31.5 47.7 92.7 98.3 99.3 100.0 6002008 16.9 27.3 35.6 49.2 94.5 99.0 99.5 100.0 5982009 16.1 26.2 36.0 51.3 92.9 97.9 99.3 100.0 608
392 Printing trades workers 2007 1.9 2.9 5.7 9.5 25.7 35.2 98.1 100.0 1052008 3.2 6.5 9.7 9.7 17.2 22.6 97.8 100.0 932009 8.6 13.3 17.1 21.0 24.8 35.2 96.2 100.0 105
393 Textile, clothing and footwear trades workers 2007 6.3 6.3 12.5 18.8 43.8 50.0 100.0 100.0 16
2008 7.1 7.1 32.1 42.9 96.4 96.4 100.0 100.0 282009 6.3 9.4 65.6 75.0 81.3 90.6 100.0 100.0 32
394 Wood trades workers 2007 7.2 12.0 18.9 23.7 31.3 45.0 96.0 100.0 2492008 7.1 15.4 22.5 28.8 34.6 45.8 97.5 100.0 2402009 10.9 15.4 23.1 27.5 37.7 46.2 95.5 100.0 247
399 Miscellaneous technicians and trades workers 2007 10.3 21.9 55.5 65.8 73.3 80.1 97.9 100.0 146
2008 13.8 32.7 62.3 66.0 72.3 74.8 100.0 100.0 1592009 32.1 58.7 73.7 79.5 83.8 87.3 95.7 100.0 346
Source: NCVER, National Apprentice and Trainee Collection, June 2010 estimates.
NCVER Report 2 final Page 83
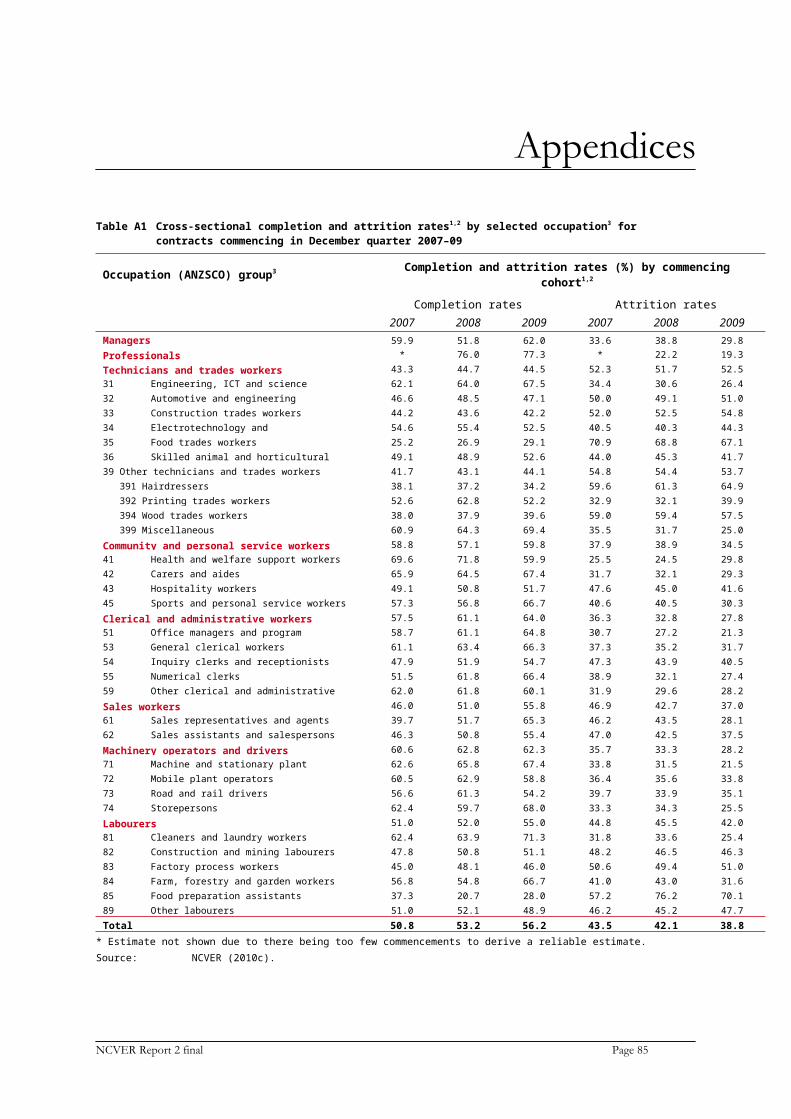
Table A5 Apprentice and trainee completions in trade occupations, certificate III and above, by duration of training, 12 months ending 30 June 2007–09 (%)—Queensland
ANZSCO (occupation) group
Year(12 months
ending 30 June)
Up to 1 year %
1–1.5 years
%
1.5–2 years
%2–2.5
years %2.5–3
years %3–3.5
years %3.5–4 years
%Over 4
years % Total3 Total – Technicians and trades workers 2007 12.9 21.8 29.8 37.2 46.6 59.2 89.4 100.0 8863
2008 12.0 20.0 28.6 35.7 44.6 61.5 90.7 100.0 111662009 11.6 20.6 29.5 36.9 46.9 66.5 92.2 100.0 11914
31 Engineering, ICT and science technicians 2007 36.3 68.0 88.0 92.2 95.9 97.1 99.2 100.0 485
2008 36.4 62.6 87.0 91.7 95.1 96.5 99.0 100.0 4922009 34.1 57.6 81.9 89.6 94.2 96.2 98.9 100.0 469
32 Automotive and engineering trades workers 2007 9.2 15.7 21.6 29.4 39.6 53.8 90.3 100.0 2733
2008 7.4 12.6 19.7 27.0 37.3 57.4 91.1 100.0 34172009 8.7 14.9 21.9 29.5 40.8 64.1 93.2 100.0 3641
33 Construction trades workers 2007 7.0 11.9 18.1 24.8 33.7 51.0 87.9 100.0 22492008 7.0 12.6 18.8 25.5 33.3 57.1 91.1 100.0 29602009 8.1 15.5 21.7 27.8 39.1 67.3 92.1 100.0 2989
34 Electrotechnology and telecommunications trades workers 2007 8.0 12.6 17.3 22.6 27.2 35.2 78.8 100.0 994
2008 6.6 11.5 16.3 20.4 24.7 37.2 82.1 100.0 13862009 6.2 11.9 16.7 21.1 24.7 40.8 83.5 100.0 1864
35 Food trades workers 2007 19.5 32.3 42.4 55.1 71.7 83.6 96.2 100.0 8972008 19.9 33.2 43.3 54.3 72.2 85.1 95.5 100.0 9292009 23.0 36.8 48.3 60.8 78.0 89.6 96.4 100.0 1065
36 Skilled animal and horticultural workers 2007 25.5 50.2 78.0 87.8 96.1 98.4 99.2 100.0 255
2008 18.3 42.7 82.7 90.8 96.9 99.3 100.0 100.0 2952009 15.7 34.5 66.2 86.4 94.8 97.9 99.3 100.0 287
39 Other technicians and trades workers 2007 18.8 29.2 37.3 43.7 53.0 64.7 88.2 100.0 1250
2008 21.8 31.5 39.5 47.4 56.4 67.8 89.6 100.0 16872009 16.2 29.0 41.3 48.5 57.7 70.4 93.8 100.0 1599
391 Hairdressers 2007 21.4 32.5 43.1 51.9 64.3 76.7 93.2 100.0 6222008 26.1 36.1 45.4 55.7 67.8 80.5 94.8 100.0 7902009 20.8 32.9 46.1 56.8 67.9 80.0 96.1 100.0 841
392 Printing trades workers 2007 3.6 9.1 12.7 16.4 21.8 34.5 74.5 100.0 552008 1.2 1.2 13.4 19.5 24.4 34.1 72.0 100.0 822009 0.0 5.1 7.7 16.7 21.8 38.5 93.6 100.0 78
393 Textile, clothing and footwear trades workers 2007 25.6 35.9 41.0 46.2 56.4 66.7 84.6 100.0 39
2008 17.2 31.0 41.4 48.3 51.7 62.1 89.7 100.0 292009 19.4 25.8 38.7 38.7 58.1 77.4 96.8 100.0 31
394 Wood trades workers 2007 3.3 6.9 12.4 15.6 25.5 40.7 85.8 100.0 2752008 4.4 7.7 11.0 16.9 24.0 38.7 85.6 100.0 3622009 7.4 13.7 17.4 19.7 25.9 44.2 88.3 100.0 351
399 Miscellaneous technicians and trades workers 2007 31.3 48.3 54.4 59.1 61.4 67.6 82.2 100.0 259
2008 33.0 49.1 57.5 63.2 69.1 75.7 86.8 100.0 4242009 17.4 42.3 65.1 68.5 75.5 81.9 93.6 100.0 298
Source: NCVER, National Apprentice and Trainee Collection, June 2010 estimates.
NCVER Report 2 final Page 84

Table A6 Apprentice and trainee completions in trade occupations, certificate III and above, by duration of training, 12 months ending 30 June 2007–09 (%)—South Australia
ANZSCO (occupation) group
Year(12 months
ending 30 June)
Up to 1 year %
1–1.5 years
%
1.5–2 years
%2–2.5
years %2.5–3
years %3–3.5
years %3.5–4 years
%Over 4
years % Total3 Total – Technicians and trades workers 2007 7.3 12.3 19.8 24.6 36.8 48.8 96.3 100.0 2648
2008 7.8 12.2 20.4 26.4 38.0 50.1 95.1 100.0 29602009 9.9 14.6 22.1 26.9 37.4 48.4 93.6 100.0 2737
31 Engineering, ICT and science technicians 2007 66.3 77.1 90.4 92.8 96.4 97.6 98.8 100.0 83
2008 64.3 73.2 85.7 85.7 96.4 96.4 100.0 100.0 562009 53.1 68.8 96.3 96.9 98.1 98.8 100.0 100.0 160
32 Automotive and engineering trades workers 2007 3.9 6.9 10.2 13.3 22.8 37.1 96.2 100.0 797
2008 3.8 6.5 11.0 14.9 27.4 42.0 94.7 100.0 8712009 4.7 7.3 11.3 14.3 25.6 38.1 91.5 100.0 763
33 Construction trades workers 2007 4.9 8.0 11.4 15.4 24.1 39.5 97.0 100.0 5262008 7.1 10.3 13.1 16.6 24.8 40.1 94.7 100.0 6092009 6.4 9.7 13.7 18.2 27.7 39.4 95.9 100.0 611
34 Electrotechnology and telecommunications trades workers 2007 2.5 7.2 14.9 18.5 25.3 29.8 91.7 100.0 363
2008 6.2 8.0 11.1 14.9 18.9 26.0 89.1 100.0 4502009 5.1 8.9 12.6 15.7 19.8 28.1 87.0 100.0 470
35 Food trades workers 2007 10.8 19.3 28.9 34.5 55.0 66.7 95.6 100.0 2492008 7.1 12.8 30.9 37.6 53.5 68.1 98.2 100.0 2822009 8.5 13.0 23.5 31.6 51.4 64.8 93.5 100.0 247
36 Skilled animal and horticultural workers 2007 4.6 9.9 44.4 60.9 94.0 95.4 96.7 100.0 151
2008 15.2 30.4 56.0 75.9 93.2 99.0 99.5 100.0 1912009 17.5 27.0 54.8 74.6 94.4 98.4 100.0 100.0 126
39 Other technicians and trades workers 2007 7.9 15.9 23.8 29.9 44.7 60.1 99.0 100.0 479
2008 8.4 14.2 27.3 36.5 53.5 63.9 97.8 100.0 5012009 12.2 18.6 26.4 32.2 45.3 61.1 97.8 100.0 360
391 Hairdressers 2007 13.2 21.9 28.9 34.6 44.7 60.1 98.7 100.0 2282008 14.4 24.7 35.4 42.8 52.7 64.2 97.1 100.0 2432009 16.8 23.8 33.7 40.1 51.5 64.4 97.5 100.0 202
392 Printing trades workers 2007 0.0 1.4 7.2 18.8 42.0 55.1 98.6 100.0 692008 0.0 3.1 10.9 26.6 53.1 73.4 98.4 100.0 642009 5.3 7.9 13.2 18.4 44.7 68.4 100.0 100.0 38
393 Textile, clothing and footwear trades workers 2007 3.8 46.2 84.6 84.6 92.3 92.3 100.0 100.0 26
2008 2.6 2.6 69.2 92.3 92.3 92.3 100.0 100.0 392009 0.0 25.0 25.0 25.0 50.0 62.5 100.0 100.0 8
394 Wood trades workers 2007 3.0 7.5 11.9 16.4 38.1 56.7 99.3 100.0 1342008 2.9 4.4 8.0 13.9 45.3 53.3 98.5 100.0 1372009 5.4 10.8 16.1 21.5 34.4 54.8 97.8 100.0 93
399 Miscellaneous technicians and trades workers 2007 13.6 13.6 22.7 31.8 36.4 59.1 100.0 100.0 22
2008 11.1 11.1 33.3 38.9 44.4 44.4 94.4 100.0 182009 15.8 21.1 26.3 31.6 31.6 42.1 94.7 100.0 19
Source: NCVER, National Apprentice and Trainee Collection, June 2010 estimates.
NCVER Report 2 final Page 85

Table A7 Apprentice and trainee completions in trade occupations, certificate III and above, by duration of training, 12 months ending 30 June 2007–09 (%)—Western Australia
ANZSCO (occupation) group
Year(12 months
ending 30 June)
Up to 1 year %
1–1.5 years
%
1.5 –2 years
%2–2.5
years %2.5–3
years %3–3.5
years %3.5–4 years
%Over 4
years % Total3 Total – Technicians and trades workers 2007 5.5 8.6 12.6 16.4 27.7 44.1 90.1 100.0 3745
2008 5.7 8.7 13.0 17.5 30.2 47.4 90.3 100.0 45922009 6.6 9.5 13.8 18.3 33.9 50.4 90.0 100.0 5585
31 Engineering, ICT and science technicians 2007 28.9 66.7 77.8 84.4 86.7 88.9 97.8 100.0 45
2008 37.5 72.1 86.5 88.5 89.4 90.4 97.1 100.0 1042009 51.1 73.4 90.8 92.4 95.1 95.7 98.4 100.0 184
32 Automotive and engineering trades workers 2007 2.6 5.3 9.4 12.9 21.9 34.9 90.6 100.0 1421
2008 2.5 4.2 8.1 12.3 20.9 38.5 90.6 100.0 17532009 2.8 5.0 8.0 12.1 21.7 36.9 90.1 100.0 1970
33 Construction trades workers 2007 1.5 1.8 3.6 8.1 29.8 57.0 94.6 100.0 7262008 1.6 3.1 5.9 11.1 36.7 59.3 93.7 100.0 9452009 1.9 2.6 6.4 11.5 42.4 65.8 94.2 100.0 1298
34 Electrotechnology and telecommunications trades workers 2007 10.1 12.1 15.0 17.0 22.7 35.6 84.6 100.0 494
2008 6.4 7.8 10.3 12.7 19.0 31.4 84.8 100.0 6122009 2.7 4.6 7.6 9.3 14.2 26.4 76.2 100.0 829
35 Food trades workers 2007 6.6 9.8 13.2 20.4 32.8 55.5 86.2 100.0 3482008 6.4 10.8 14.9 22.7 42.8 61.0 87.0 100.0 3622009 14.0 16.9 22.7 31.2 58.7 76.3 92.8 100.0 414
36 Skilled animal and horticultural workers 2007 31.5 50.4 58.3 63.0 70.1 75.6 95.3 100.0 127
2008 25.2 37.0 50.4 61.3 68.9 76.5 97.5 100.0 1192009 33.3 50.0 62.3 72.8 83.3 89.5 98.2 100.0 114
39 Other Technicians and trades workers 2007 5.7 8.0 14.2 17.1 27.1 40.6 88.5 100.0 584
2008 10.5 13.1 18.9 22.4 32.4 49.4 89.2 100.0 6972009 9.9 12.9 17.3 22.9 36.6 54.4 93.0 100.0 776
391 Hairdressers 2007 3.7 4.3 6.2 7.1 13.3 30.0 85.4 100.0 3232008 4.1 5.7 7.3 9.8 20.7 44.0 87.8 100.0 3862009 4.5 6.8 8.5 15.1 32.1 51.7 90.1 100.0 424
392 Printing trades workers 2007 0.0 0.0 0.0 9.1 27.3 45.5 90.9 100.0 112008 0.0 0.0 0.0 11.1 22.2 33.3 88.9 100.0 92009 0.0 0.0 0.0 0.0 22.7 31.8 95.5 100.0 22
393 Textile, clothing and footwear trades workers 2007 13.3 20.0 46.7 80.0 100.0 100.0 100.0 100.0 15
2008 0.0 10.0 83.3 93.3 100.0 100.0 100.0 100.0 302009 0.0 0.0 50.0 75.0 83.3 91.7 100.0 100.0 12
394 Wood trades workers 2007 1.2 1.9 4.3 8.1 25.5 37.9 90.1 100.0 1612008 1.9 1.9 3.1 5.0 18.0 32.3 86.3 100.0 1612009 0.0 1.1 3.7 9.0 20.1 41.8 96.8 100.0 189
399 Miscellaneous technicians and trades workers 2007 23.0 36.5 66.2 68.9 75.7 79.7 95.9 100.0 74
2008 48.6 56.8 66.7 73.0 76.6 80.2 95.5 100.0 1112009 45.0 53.5 65.9 68.2 73.6 82.2 96.1 100.0 129
Source: NCVER, National Apprentice and Trainee Collection, June 2010 estimates.
NCVER Report 2 final Page 86

Table A8 Apprentice and trainee completions in trade occupations, certificate III and above, by duration of training, 12 months ending 30 June 2007–09 (%)—Tasmania
ANZSCO (occupation) group
Year(12 months
ending 30 June)
Up to 1 year %
1–1.5 years
%
1.5–2 years
%2–2.5
years %2.5–3
years %3–3.5
years %3.5–4 years
%Over 4
years % Total3 Total – Technicians and trades workers 2007 11.3 17.5 29.0 35.1 44.0 52.8 92.3 100.0 1056
2008 11.5 16.7 24.8 30.9 40.0 48.7 91.7 100.0 12992009 12.2 19.9 27.4 35.3 43.8 53.0 92.5 100.0 1280
31 Engineering, ICT and science technicians 2007 59.6 71.3 93.6 95.7 97.9 98.9 100.0 100.0 94
2008 57.9 78.9 94.7 96.1 96.1 98.7 98.7 100.0 762009 61.8 79.4 94.1 98.5 98.5 98.5 98.5 100.0 68
32 Automotive and engineering trades workers 2007 3.8 5.5 11.3 14.3 24.9 37.9 92.2 100.0 293
2008 6.7 9.6 14.0 19.4 30.6 40.7 92.5 100.0 3862009 7.9 13.6 17.4 21.7 34.4 45.8 96.9 100.0 419
33 Construction trades workers 2007 2.7 5.4 13.2 19.5 28.0 38.9 93.4 100.0 2572008 5.7 8.2 13.4 18.2 25.9 36.6 95.7 100.0 3522009 5.3 8.3 13.6 21.9 30.9 42.3 95.1 100.0 265
34 Electrotechnology and telecommunications trades workers 2007 10.2 17.6 20.4 22.2 22.2 27.8 75.0 100.0 108
2008 9.5 10.8 13.5 16.2 18.9 22.3 73.6 100.0 1482009 7.0 8.9 9.6 16.6 18.5 20.4 66.9 100.0 157
35 Food trades workers 2007 12.0 26.9 47.2 59.3 68.5 75.0 90.7 100.0 1082008 17.9 25.2 41.1 54.3 62.3 70.9 87.4 100.0 1512009 17.8 35.7 49.7 58.0 66.2 75.2 91.1 100.0 157
36 Skilled animal and horticultural workers 2007 1.6 17.7 46.8 69.4 90.3 96.8 96.8 100.0 62
2008 11.1 30.6 75.0 88.9 94.4 97.2 100.0 100.0 362009 11.8 29.4 49.0 92.2 96.1 96.1 98.0 100.0 51
39 Other technicians and trades workers 2007 14.9 21.6 36.6 43.3 55.2 61.9 98.5 100.0 134
2008 9.3 17.3 26.7 34.0 54.0 64.7 96.7 100.0 1502009 13.5 22.7 36.8 44.2 52.8 66.9 98.8 100.0 163
391 Hairdressers 2007 12.0 17.3 25.3 34.7 42.7 50.7 98.7 100.0 752008 9.4 20.0 25.9 32.9 52.9 65.9 98.8 100.0 852009 14.0 16.1 25.8 35.5 45.2 62.4 97.8 100.0 93
392 Printing trades workers 2007 0.0 0.0 0.0 0.0 25.0 25.0 75.0 100.0 42008 6.3 12.5 12.5 18.8 62.5 62.5 87.5 100.0 162009 28.6 28.6 42.9 42.9 57.1 57.1 100.0 100.0 7
393 Textile, clothing and footwear trades workers 2007 0.0 40.0 40.0 60.0 60.0 60.0 100.0 100.0 5
2008 0.0 0.0 16.7 50.0 50.0 50.0 100.0 100.0 62009 0.0 0.0 0.0 25.0 50.0 75.0 100.0 100.0 4
394 Wood trades workers 2007 0.0 6.3 18.8 18.8 37.5 56.3 100.0 100.0 162008 6.9 13.8 20.7 27.6 34.5 51.7 93.1 100.0 292009 15.8 21.1 21.1 26.3 31.6 52.6 100.0 100.0 19
399 Miscellaneous technicians and trades workers 2007 32.4 38.2 73.5 76.5 94.1 94.1 100.0 100.0 34
2008 21.4 21.4 64.3 64.3 92.9 92.9 100.0 100.0 142009 10.0 40.0 72.5 75.0 80.0 85.0 100.0 100.0 40
Source: NCVER, National Apprentice and Trainee Collection, June 2010 estimates.
NCVER Report 2 final Page 87

Table A9 Apprentice and trainee completions in trade occupations, certificate III and above, by duration of training, 12 months ending 30 June 2007–09 (%)—Northern Territory
ANZSCO (occupation) group
Year(12 months
ending 30 June)
Up to 1 year %
1–1.5 years
%
1.5–2 years
%2–2.5
years %2.5–3
years %3–3.5
years %3.5–4 years
%Over 4
years % Total3 Total – Technicians and trades workers 2007 14.4 24.4 33.8 41.1 50.5 67.2 83.9 100.0 299
2008 19.2 31.3 42.7 51.4 65.6 76.8 88.9 100.0 3232009 18.5 29.5 39.7 46.9 56.6 71.6 89.3 100.0 373
31 Engineering, ICT and science technicians 2007 87.5 87.5 100.0 100.0 100.0 100.0 100.0 100.0 8
2008 52.4 85.7 90.5 100.0 100.0 100.0 100.0 100.0 212009 66.7 83.3 91.7 100.0 100.0 100.0 100.0 100.0 12
32 Automotive and engineering trades workers 2007 6.8 13.6 22.3 30.1 40.8 52.4 80.6 100.0 103
2008 12.8 20.8 32.8 40.0 56.0 69.6 85.6 100.0 1252009 18.0 29.7 41.4 46.1 53.1 66.4 86.7 100.0 128
33 Construction trades workers 2007 6.1 18.2 27.3 42.4 51.5 60.6 78.8 100.0 332008 25.5 35.3 45.1 54.9 74.5 82.4 96.1 100.0 512009 22.4 34.3 47.8 55.2 71.6 85.1 92.5 100.0 67
34 Electrotechnology and telecommunications trades workers 2007 12.9 20.4 30.1 35.5 45.2 68.8 80.6 100.0 93
2008 13.2 26.4 37.7 45.3 58.5 67.9 79.2 100.0 532009 8.9 15.8 21.8 28.7 38.6 62.4 85.1 100.0 101
35 Food trades workers 2007 28.0 40.0 60.0 68.0 68.0 92.0 100.0 100.0 252008 20.0 33.3 50.0 66.7 80.0 80.0 86.7 100.0 302009 24.1 37.9 55.2 58.6 69.0 79.3 96.6 100.0 29
36 Skilled animal and horticultural workers 2007 33.3 100.0 100.0 100.0 100.0 100.0 100.0 100.0 3
2008 0.0 25.0 50.0 75.0 75.0 75.0 100.0 100.0 42009 100.0 100.0 100.0 100.0 100.0 100.0 100.0 100.0 1
39 Other technicians and trades workers 2007 20.6 41.2 44.1 50.0 64.7 85.3 91.2 100.0 34
2008 23.1 35.9 46.2 51.3 64.1 89.7 97.4 100.0 392009 17.1 31.4 37.1 57.1 65.7 74.3 94.3 100.0 35
391 Hairdressers 2007 18.8 43.8 50.0 56.3 68.8 87.5 93.8 100.0 162008 29.2 45.8 58.3 66.7 83.3 100.0 100.0 100.0 242009 29.4 47.1 52.9 70.6 82.4 82.4 100.0 100.0 17
392 Printing trades workers 2007 0.0 0.0 0.0 25.0 50.0 75.0 100.0 100.0 42008 0.0 0.0 0.0 0.0 0.0 100.0 100.0 100.0 12009 0.0 0.0 0.0 0.0 33.3 33.3 33.3 100.0 3
393 Textile, clothing and footwear trades workers 2007 0.0 100.0 100.0 100.0 100.0 100.0 100.0 100.0 1
2008 0.0 50.0 50.0 50.0 50.0 50.0 100.0 100.0 22009 - - - - - - - - 0
394 Wood trades workers 2007 0.0 16.7 16.7 16.7 33.3 83.3 83.3 100.0 62008 0.0 0.0 0.0 0.0 0.0 60.0 100.0 100.0 52009 8.3 8.3 16.7 50.0 50.0 66.7 100.0 100.0 12
399 Miscellaneous technicians and trades workers 2007 57.1 71.4 71.4 71.4 85.7 85.7 85.7 100.0 7
2008 28.6 28.6 42.9 42.9 57.1 85.7 85.7 100.0 72009 0.0 66.7 66.7 66.7 66.7 100.0 100.0 100.0 3
Source: NCVER, National Apprentice and Trainee Collection, June 2010 estimates.
NCVER Report 2 final Page 88

Table A10 Apprentice and trainee completions in trade occupations, certificate III and above, by duration of training, 12 months ending 30 June 2007–09 (%)—Australian Capital Territory
ANZSCO (occupation) group
Year(12 months
ending 30 June)
Up to 1 year %
1–1.5 years
%
1.5–2 years
%2–2.5
years %2.5–3
years %3–3.5
years %3.5–4 years
%Over 4
years % Total3 Total – Technicians and trades workers 2007 24.7 32.4 40.0 44.7 60.0 74.1 95.8 100.0 590
2008 24.2 33.3 41.4 48.4 61.0 72.5 94.1 100.0 7082009 30.0 39.2 53.9 60.3 71.8 82.0 94.9 100.0 763
31 Engineering, ICT and science technicians 2007 77.3 93.9 95.5 95.5 95.5 98.5 100.0 100.0 66
2008 67.0 89.0 94.5 97.8 98.9 100.0 100.0 100.0 912009 59.2 65.4 94.8 98.4 98.4 99.5 100.0 100.0 191
32 Automotive and engineering trades workers 2007 21.9 28.9 35.1 37.7 50.0 65.8 99.1 100.0 114
2008 19.6 30.8 39.3 43.0 54.2 64.5 96.3 100.0 1072009 16.1 29.0 36.6 45.2 51.6 62.4 92.5 100.0 93
33 Construction trades workers 2007 9.3 11.6 22.1 29.1 61.0 80.2 98.8 100.0 1722008 8.2 14.4 21.0 26.2 54.4 70.8 96.9 100.0 1952009 12.2 19.3 29.8 37.6 64.1 84.5 96.7 100.0 181
34 Electrotechnology and telecommunications trades workers 2007 16.4 22.4 28.4 34.3 38.8 49.3 74.6 100.0 67
2008 15.9 25.7 31.9 43.4 49.6 60.2 77.9 100.0 1132009 12.0 18.0 26.0 32.0 38.0 48.0 75.0 100.0 100
35 Food trades workers 2007 24.3 40.5 50.0 56.8 64.9 79.7 95.9 100.0 742008 28.6 34.5 50.0 61.9 70.2 81.0 97.6 100.0 842009 28.4 44.8 56.7 65.7 83.6 94.0 98.5 100.0 67
36 Skilled animal and horticultural workers 2007 0.0 0.0 7.7 7.7 23.1 53.8 92.3 100.0 13
2008 9.7 12.9 19.4 25.8 25.8 38.7 93.5 100.0 312009 11.8 26.5 41.2 44.1 61.8 82.4 100.0 100.0 34
39 Other technicians and trades workers 2007 29.8 36.9 45.2 50.0 61.9 71.4 98.8 100.0 84
2008 32.2 36.8 46.0 55.2 63.2 77.0 96.6 100.0 872009 45.4 56.7 66.0 73.2 83.5 88.7 100.0 100.0 97
391 Hairdressers 2007 37.1 43.5 51.6 56.5 69.4 74.2 100.0 100.0 622008 43.1 48.3 55.2 62.1 74.1 86.2 98.3 100.0 582009 39.4 53.0 59.1 69.7 84.8 89.4 100.0 100.0 66
392 Printing trades workers 2007 33.3 33.3 33.3 33.3 33.3 33.3 83.3 100.0 62008 0.0 0.0 8.3 41.7 41.7 58.3 100.0 100.0 122009 - - - - - - - - 0
393 Textile, clothing and footwear trades workers 2007 0.0 0.0 0.0 100.0 100.0 100.0 100.0 100.0 1
2008 - - - - - - - - 02009 - - - - - - - - 0
394 Wood trades workers 2007 0.0 13.3 26.7 26.7 40.0 73.3 100.0 100.0 152008 20.0 26.7 46.7 46.7 46.7 60.0 93.3 100.0 152009 26.7 40.0 73.3 73.3 73.3 86.7 100.0 100.0 15
399 Miscellaneous technicians and trades workers 2007 - - - - - - - - 0
2008 0.0 0.0 0.0 0.0 0.0 50.0 50.0 100.0 22009 87.5 87.5 87.5 87.5 87.5 87.5 100.0 100.0 16
Source: NCVER, National Apprentice and Trainee Collection, June 2010 estimates.
NCVER Report 2 final Page 89


