Taboos, agriculture and poverty David Stifel a , Marcel Fafchamps b , and Bart Minten c Although cultural practices often have important consequences for welfare and economic performance, they are seldom studied by economists. To fill this gap we study the impact of taboos on agriculture and poverty. Madagascar is a good case study for this purpose given the prevalence of taboos in everyday life and the variation in cultural practices across the country. We analyze the effect of days during which it is taboo to work (fady days) on agriculture and welfare. Using data from a national household survey, we find that 18% of agricultural households have two or more fady days per week and that an extra fady day decreases per capita consumption level by 4% and rice productivity by 5% controlling for human, ethnic and physical characteristics. We also find that smaller households and those with less education employ less labor due to fadyinduced constraints. Given that fady days are but one example of taboo from a larger set, taboos are likely a major hurdle to increasing agricultural productivity and to reducing poverty. Current Draft: 28 June 2007 a Lafayette College b Oxford University c International Food Policy Research Institute (IFPRI), Delhi
Transcript
Taboos, agriculture and poverty
David Stifel a , Marcel Fafchamps b , and Bart Minten c
Although cultural practices often have important consequences for welfare and economic performance, they are seldom studied by economists. To fill this gap we study the impact of taboos on agriculture and poverty. Madagascar is a good case study for this purpose given the prevalence of taboos in everyday life and the variation in cultural practices across the country. We analyze the effect of days during which it is taboo to work (fady days) on agriculture and welfare. Using data from a national household survey, we find that 18% of agricultural households have two or more fady days per week and that an extra fady day decreases per capita consumption level by 4% and rice productivity by 5% controlling for human, ethnic and physical characteristics. We also find that smaller households and those with less education employ less labor due to fadyinduced constraints. Given that fady days are but one example of taboo from a larger set, taboos are likely a major hurdle to increasing agricultural productivity and to reducing poverty.
Current Draft: 28 June 2007
a Lafayette College b Oxford University c International Food Policy Research Institute (IFPRI), Delhi
Taboos, agriculture and poverty “Wednesday is an evil day. If one starts working in the rice fields on a Wednesday, there will be no harvest. On the other hand, Wednesday is a good day for burials… Thursday is dangerous. It might cause death in the village and it is fady to have burials on this day… Saturday is children’s day. It is an unfortunate day for big and important work… The morning is good on Sunday but the afternoon is evil and dangerous. It is therefore fady to work on Sunday, especially in the afternoon.”
(Ruud, 1960, pp. 3235)
1. Introduction
Habits, customs and norms have had important consequences on economic behavior,
welfare and wellbeing throughout world history (Landes, 1998; Diamond, 1998; Putnam
et al., 1993; Kay, 2004). 1 For example, Siobhan (2003) examines the link between culture
and labor markets. Based on crosscountry evidence, he finds that cultural norms
influence unemployment and the wage structure in economies in his sample. Platteau
(1994) argues that the cultural endowment of a society determines its economic growth
trajectory. While the link between culture and economic behavior and outcomes has
received little attention in economics, it has played a prominent role in the anthropology
and sociology literature. Although anthropologists and sociologists usually find large
effects on people’s behavior and wellbeing, they often fail to illustrate results at a large
statistical representative scale due to lack of adequate tools and/or data. 2
1 For examples, Landes (1998) shows that much of the increase in life expectancy in the 20 th century has come from clean water, expeditious waste removal and improvements in personal cleanliness. Before the knowledge of germ theory, the great killer was gastrointestinal diseases, transmitted from waste to hands to food. Groups that then washed their hands before eating, due to their religion, such as Jews and Muslims, had significantly lower disease and death rates. 2 To get at the effect of norms and network effects, economists have studied the impact of ethnicity on economic performance, often finding no effect when other explanatory variables, especially education and location, are taken into consideration (Fafchamps, 2000; Van de Walle and Gunewardena, 2001; Collier and Garg, 1999). Others have addressed the effects of racial background on wellbeing and economic performance (Herrnstein and Murray, 1994; Bodenhorn, 1999; Darity et al., 1995). While some of this research may be controversial, other explanations for differences in economic performance or wellbeing are generally accepted, such as education, geography, environment and the like (Bloom and Sachs, 1998; Gallup and Sachs, 1998).
2
Only recently have economists started looking at explanations and effects of specific
beliefs, superstition and taboos. Fudenberg and Levine (2006) and Bénabou and Tirole
(2007) develop theoretical models to explain the persistence of superstition and taboos
while Do and Phung (2006) look empirically at the effect of superstition on family
planning in Vietnam. In this paper, we analyze empirically the effect of taboos on
agriculture and welfare in Madagascar using a recent comprehensive nationally
representative household survey. Madagascar is a good place to study this linkage as it is
characterized by multiple taboos (called fady 3 ), often associated with eating habits and
burial practices.
We study the effect of a particular work taboo whereby individuals are not allowed to
work on specific days (called fady days). Using data from the 2004 national household
survey, we find that 18% of the population of agricultural households has two or more
fady days per week and that an extra fady day decreases the per capita consumption level
by 4% and rice productivity by at least 5%, controlling for human and physical
characteristics. 4 We also test for the presence of heterogeneous effects across households.
We find that households with a higher land per manpower ratio are more likely to be
constrained by local work taboos. We similarly find that educated household are less
likely to abide by – and be constrained by – work taboos.
The structure of the paper is as follows. In section 2, we discuss the meaning and
importance of taboos in Madagascar. After describing the data in section 3, we map out
the conceptual framework and the strategies employed to test the relationship between
fady days and household welfare and agricultural production in section 4. In doing so,
we discuss the market failures that are consistent with the observed outcomes. In section
5, we present the results of these tests. We finish with some concluding remarks.
3 The Malagasy word fady is of Indonesian origin (Ruud, 1960): in the Maanjab language (Borneo), the corresponding word is padi (taboo); in the ngaddju language (Borneo), it is plai. The Polynesian word taboo has been taken over internationally. 4 The effect of timing on economic performance has also been studied in developed countries. For example, Thaler (1987a, 1987b) shows the impact of weekends, holidays, turn of the month and intraday effects on stock performance. Chamberlain et al. (1991) look at the effect of the thirteenth of the month on investment behavior.
3
2. Taboos in Madagascar
Madagascar is a country off the African coast that was settled relatively late. The earliest
known traces of human communities date only from 800 A.D. (Wright and Raokotarisoa,
2003). The modern Malagasy people have a complex ancestry, with ancestors mainly
drawn from Indonesia and eastern Africa. While all Malagasy speak one common
language, around twenty ethnic groups are still distinguished (Ramamonjisoa, 2002). The
groups are identified by common traditions and group identity.
The importance of taboos cannot be understated in Madagascar (Gennep, 1904; Verin,
1990; Bloch, 1971; Ottino, 1986; Brown, 1999; Profita, 1978). This is well worded by
Ruud (1960), an anthropologist who spent twenty years in Madagascar and the author of
a seminal work on taboos: “…A European who lives in the country, mixes with the
Natives, and speaks their language every day, will soon discover that the taboos are
omnipresent. If he clashes with them, he will find himself up against a wall of difficulties.
If he is ignorant of these compact and massive rules, he will meet with many unpleasant
experiences…” (Ruud, 1960, p. 1). A taboo or fady can be translated as a prohibition,
referring to what one is not allowed to do, objects which one must not come into contact,
words which must not be uttered and places which must be avoided (Ruud, 1960). The
transgressor becomes taboo himself to his environment and his fellows.
Fady are generally observed for two reasons. First, they are a means through which
individuals display respect for their ancestors and for their elders (Brown, 1999). Taboos
link individuals to their ancestors and living relatives. Sharing the same taboos allows
people to identify with their clans and/or ethnic groups (Lambek, 1992). By not
observing ancestral fady, or by observing them only selectively, individuals bring
dishonor to their ancestors and can find themselves socially alienated from their
community (Ruud, 1960). It is possible to draw inference regarding the social
relationships that a person values most highly through fady observance. By passing down
lineage and societal norms to their children in the form of taboos, elders use their
authority to naturalize the existing order (Brown, 1999).
4
Second, fady are often adhered to out of fear. People believe that violating their fady
invites misfortune in the form of illness, crop failure, or even death. In her case study in
the Northeast of Madagascar, Brown (1999) found that most of the villagers who did not
admit to violating or abandoning a fady, said that there was one simple reason for their
adherence – fear for leprosy. Almost everyone in her study region was convinced that this
illness is the outcome of eating a particular fady food.
Ruud (1960) gives a comprehensive overview of the fady that existed in the 1960s. They
include fady related to hospitality, habits regarding eating plants and animals, behavior
towards elders, burial and childrearing practices, agricultural activities, etc. Most of
them are still largely observed today and are believed to have an important influence on
the behavior of Malagasy people today. For example, fady may be an important element
affecting deforestation. Under local customs of indigenous populations all over the South,
forests are treated with respect and fear as they are the place where sacred forces and
spirits live (WWF, 2000; Fenn et al., 1999; Moizo, 1997). But this does not affects
migrants who are less bound by social and customary fady of their place of residence and
thus, as argued by Faroux (1999), are more destructive of forests than the local
population and more than they would be themselves towards forest resources in their
natal villages. The effect of fady can in some cases be quite dramatic. For example, in
areas around Mananjara in the Southeast of the country, it is fady to accept twins in the
household as they are associated with bad luck. Twins are therefore abandoned
immediately after birth. 5
In this paper, we will specifically address the influence of the observance of fady days on
agriculture and welfare. Fady days are among the many taboos in Madagascar
determined by the vintana (destiny) system, which is pervasive over the island. In
general, the vintana system requires that sowing and harvesting, marriage and burial, and
various kinds of important work must take place, or not take place, on certain days of the
week. Any given day may be lucky or unlucky. As illustrated in the quote at the
5 Luckily, a local NGO was formed to find suitable families/hosts for these abandoned children.
5
beginning of the paper, every day and every month has its vintana character. For many
Malagasy it is impossible – even unthinkable – to oppose the vintana power as it is
almighty (Ruud, 1960).
According to the cosmologic conception of Malagasy society, a month has 28 days and
starts with the new moon and ends with the wane of the moon. A month is generally
divided in four weeks. Not only do months, weeks and days have definite destinies that
must be observed, hours of the day can also have importance. By studying the vintana,
people know what is good or bad, and what is useful or harmful. They frequently take
this into account in their everyday activities. These practices are still widely observed
today, especially in rural areas where most of the poor live (Brown, 1999; Bloch, 1971;
Verin, 1990).
Solondraibe (1988) studied the origins of fady days in the Southern Highlands. He found
that they are mostly related to two reasons. First, the ombiasa (traditional priests) impose
specific days that people are not allowed to work, as part of their vintana. These days are
part of the general taboos for larger communities, called fadibe. Second, some days are
made fady by specific families or groups after some dramatic event happened and the
family believes that by starting a fady day, it will avoid having these events repeat
themselves. For example, Solondraibe (1988) mentions that death by lightning may be
regarded as a sign that the family should not work on that particular day anymore.
Based on anthropological literature, there seems to exist a strong link between ethnicity
and the observance of fady days. 6 For example, Jarosz (1994) illustrates the case for the
Sihanaka ethnic group in the eastern part of Madagascar. This ethnic group is prohibited
to work on day 1, 4, and 7 of a 12day cycle. The prohibition extends to seasonal and
permanently hired workers. De Bourdiec (1974) found that the Sakalava ethnic group is
not allowed to work on the land on Tuesday and Thursday. On top of this, they are not
allowed to work on Fridays due to their religion, which leaves them only four working
6 The link between ethnicity and different types of taboos has also been found in other countries. Their effects have especially been studied on health care (e.g. Addai, 1999), education (e.g. Chimombo, 2005) and nutrition (Shatenstein, 1998; Aunger, 1992).
6
days in the week. Solondraibe (1988) studied fady days within the Betsileo tribe. He
found that the number of fady days within this tribe varies significantly. Brown (1999)
observed fady days with the Betsimaraka ethnic group in the East of the country. In
contrast with other researchers, she states that her studied population show some
flexibility and treat fady days with pragmatism: “Many people, once they marry, begin to
work on those days that used to be fady for them because, in combining their fady days
with those of the spouse, they simply do not have enough time to get all their work done”
(Brown, 1999, p. 259). Brown (1999) further shows that husband and wives respond to
separate authorities. Similarly, neighbors might have separate taboo days, dictated by
separate ancestral rules and passed down through separate elders.
3. Data
Our main source of information to study the link between fady days and agricultural
productivity and welfare is the 2004 Enquête Prioritaire Auprès des Ménages (EPM), a
nationally representative integrated household survey of 5,454 households. The data
were collected during the months of September 2003 and January and February 2004.
The sample was selected through a multistage sampling technique in which strata are
defined by faritany (province) and milieu (rural centers, secondary urban centers, and
primary urban centers), and primary sampling units (PSU) are communes. Each of the
communes was selected systematically with probability proportional to size (PPS). In the
analysis sampling weights, defined as the inverse probability of selection, are used to
obtain accurate population estimates.
The comprehensive household questionnaire includes sections on education, health,
employment, housing, agriculture, nonagricultural enterprises, and household
expenditures and assets. The agriculture section is particularly detailed for a nationally
representative survey as it contains plot and croplevel information. For a measure of
household wellbeing, in this analysis we use the estimated householdlevel consumption
aggregate constructed by the Institut National de la Statistique (INSTAT). Because the
main variable of interest in this study is the number of fady days, we limit our analysis to
7
households that answered that question. Since the question was asked in the agricultural
section of the survey, we focus on farming households only, 3,454 households in total.
4. Conceptual Framework
Just over 21% of households in our sample reported that, due to fady, household members
were not permitted to work one day per week. Some 18% reported two or more fady
days a week. At first glance, this might seem not extraordinarily high, as most employed
people in developed countries typically take two days off each week. It is important to
keep in mind, however, that the activities considered here are agricultural in nature and
consequently are characterized by high seasonal demand for labor. The fadyday
constraint on household supply of labor is not likely binding during the slack periods of
the agricultural calendar. But during the peak months (i.e. field preparation, planting,
transplanting, and harvest), the inability to fully tap into the supply of family and hired
labor is likely to have negative agricultural productivity and welfare consequences. The
evidence indeed suggests that across households the average rice yields fall and
poverty rates rise with the number of fady days (see Table 1). For example, average
rice yields for households with two fady days are 11% lower than for those with one fady
day, and the poverty rate is 6% higher.
[Table 1 here]
While illustrative, the relationship depicted in Table 1 could be deceiving, i.e., driven by
a third factor that is correlated with both fady days and welfare/productivity. To allow
for this possibility, we adopt two complementary strategies to test the effects of fady days
on household welfare in Madagascar.
The first part of our analysis focuses on the average effect of fady days. We estimate
reducedform models of the determinants of household consumption and agricultural
production. We regress the dependent variable on the reported number of fady days and a
8
vector of household regressors. Because fady days could be correlated with unobserved
household characteristics that are correlated with household consumption or income, we
also estimate a separate model in which the household reported number of fady days is
replaced by the village average. 7 The village average of fady days also captures how the
overall villagelevel labor market constraints affect households. The idea is that the more
fady days there are at the village level, the more the supply of labor is restricted, affecting
both farm and nonfarm production of surveyed households As noted previously, the
seasonal character of demand for labor among agricultural households leads to
productivity consequences from labor constraints. 8 The question becomes, if a household
cannot employ its own labor, can it rely on hired labor? Indeed, if there were no village
wide labor market constraints, then farmers observing fady days would hire labor until
the value of the marginal product of labor is equal to the local wage (or shadow wage). 9
In order to identify the average effect of fady days, we have to assume either that
householdreported fady days are exogenous or that village fixed effects can be ignored –
in which case we can use the average number of fady days in the village for identification
purposes. Neither approach is entirely satisfactory. In particular, we are concerned that
respect for fady days may vary across villages in a way that is systematically correlated
with work and income. This could arise for instance if villages that are more backward
and isolated are also poorer and more respectful of taboos.
To allow for this possibility, the second part of our analysis introduces village fixed
effects. This means that the average effect of taboos cannot be identified. But we still test
the negative effect of fady days by focusing on heterogeneous effects (Angrist and
Krueger, 2001). The idea is that work taboos affect households differently. Agricultural
households that have a lot of manpower relative to their land are less likely to be
constrained by work taboos than those will a lot of land relative to their manpower.
7 The household’s reported fady days are omitted from the village average. 8 For example, as Cogneau and Robilliard (2000) write “hiring [labor] is particularly important at the time of rice transplanting in irrigated rice fields. On each field, this operation must be carried out quickly, ideally in a day, so that the seedlings grow at the same pace and appropriate water control can be assured. Typically, ricegrower households call upon paid work or mutual aid during this period.” 9 Even if a farmer is not permitted to hire workers on his own fady days, he can potentially do so on other days to make up for lost work.
9
Whether taboos are constraining can thus be investigated by testing whether households
with a high labor to land ratio are less affected by village norms regarding fady days than
households with a low land labor ratio. We also suspect that more educated heads of
household are less likely to believe in taboos and superstition. Hence they are more likely
to ignore them and hence less likely to be constrained by fady days.
To test for heterogeneous effects of fady days, we estimate a reducedform model of
demand for family labor. In the presence of fadyinduced constraints on the supply of
village labor (i.e. availability of hired labor), family labor remains the primary source of
labor for use by farming households. Consequently, households of different sizes and
with differing degrees of respect for fady are expected to be effected differently by
common village norms in terms of their use of family labor. For example, households
with more land and less household labor will be more constrained in the use of this
family labor due to fady restrictions than households with excess family labor (i.e. with
less land and more household labor).
Because the information available in the data is limited to an indicator of whether family
labor was used on the plot, we estimate a logit model of demand for family labor.
Further, to control for village effects, we estimate a village fixedeffects logit. Naturally,
this implies that we cannot estimate the effect of average number of fady days observed
in the village. Nonetheless, as just noted, the average treatment effect is difficult to
interpret given the likelihood of village norms. We therefore concentrate on interactions
as a way of testing for heterogeneous treatment effects.
This test is best illustrated with the following simplified equation for a reduced form plot
specific household demand for family labor (FL),
FL = β0 + β1( T L ) + β2( T L * fady ) + β3(E) + β4(E* fady ) + β5(x) + ε ,
10
where T L , the ratio of household labor (adult equivalents) per are of land, represents the
availability of family labor; fady is the village average number of fady days; E is an
indicator of household educational attainment; and x represents other explanatory
variables. This illustrates how interactions village fady days are used to test for two types
of heterogeneous treatment effects.
First, we test if fady norms affect different size households (relative to land holdings)
differently by using the interaction between the village average fady days and the number
of adult equivalent household members per are of cultivable land ( T L * fady ). Again, the
idea is that in an environment characterized by imperfect labor markets, large households
have excess labor, and the fady constraint is less likely to be binding for them. A positive
coefficient for the interaction (β2>0) thus implies that fady norms are constraining for
small households. 10
Second, the interaction between the village average fady days and household education
(E* fady ) is included as a way of testing how differential degrees of respect for fady
affect demand for household labor differently. As such a dummy variable for at least one
member of the household with a secondary or postsecondary level of education (E) is
used as a proxy for respect for fady, and a positive coefficient (β4>0) for the interaction
would imply that those with less education (more respect for fady) are more constrained
by the number of fady days than those with more education. With more fady days
observed, households with less education would then be less able to employ family labor
than those with more education.
5. Results
5.1. Determinants of fady days
10 Note that we expect β1 < 0, as a lower labor/land ratio increases the marginal product of labor.
11
Before turning to econometric estimates of the determinants of welfare and productivity
and the average effects of fady days, we estimate the determinants of the number fady
days observed by households.
The results of OLS regression models (Table 2) 11 show that ethnic characteristics are
important in explaining the number of fady days. In a first regression, we relate the
number of fady days with ethnic groups, characteristics of the household head, the
number of household members, and religion. The default ethnic group is the biggest, the
Merina. Twelve out of the 19 ethnic groups in the data show a significant different
number of fady days than the Merina. They all have more fady days except for the last
ethnic group, composed of Chinese and Comoron immigrants, who have significantly
fewer. As expected, these latter groups are little affected by local customs. The largest
coefficients, with about one fady day more than the Merina, are for the Antakarana, the
Betsimisaraka, the Sihanaka and the Tsimihety ethnic groups.
[Table 2 here]
In addition to higher levels of education being associated with fewer fady days, Christian
households have fewer fady days than those following traditional religious traditions.
Male headed households are more likely to adhere to fady days than femaleheaded
households. Household size and the age of the head of the household do not have a
significant effect.
In models 2 through 4, two additional explanatory variables are included. In model 2 we
find a positive and highly significant effect of the (nonself) average number of fady days
observed in the village. The rationale for including this variable is that social pressures
appear to influence individual household observance of traditional fady. In Model 3, we
introduce an indicator of whether a household migrated to the village within the past five
years. As expected, migrant households are less bound by local customary fady (Faroux,
1999), and observe fewer fady days than nonmigrant households. Both of these
11 Descriptive statistics appear in Appendix Table A1.
12
variables, village average fady days and migrant household, have independent effects
(Model 4).
5.2. Average Treatment Effects
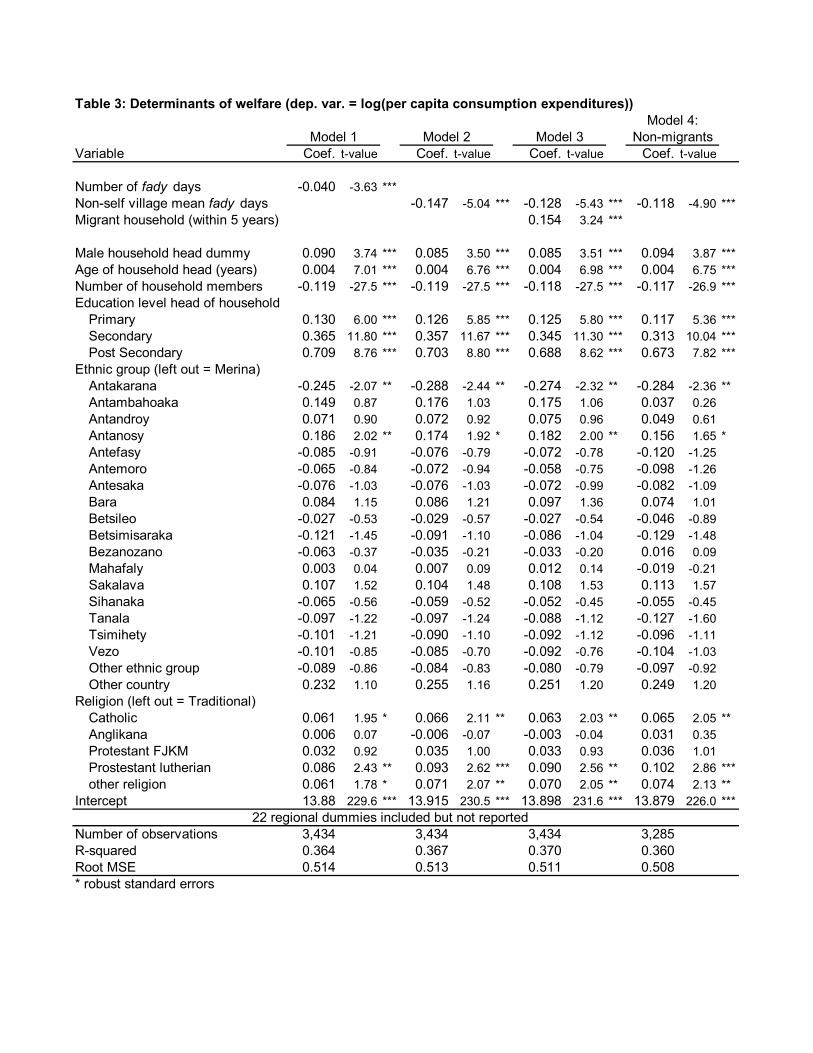
Turning to the average effect of fady day beliefs on household welfare, we begin by
estimating standard OLS models (Table 3) in which the dependent variable is the log of
per capita household consumption – the measure of household “expenditures” commonly
used to calculate poverty. In addition to the standard explanatory variables (household
demographics, education, ethnicity, religion and region dummies), we include the number
of fady days reported by the household in Model 1. According to these estimates an extra
fady day decreases household consumption by an average of 4%.
[Table 3 here]
As noted in section 4, however, a concern with this specification is that household fady
days are endogenous in that they may be correlated with some unobserved characteristics
of the household that are also correlated with household consumption. Thus in model 2,
we estimate the same model but instead of using the household fady beliefs, we use the
village average number of fady days as a proxy for household beliefs, and/or as a measure
of village labor market constraints that affect the household. The number of village fady
days has an even larger impact on household welfare (one extra fady day results in a 15%
decrease in household consumption on average). Admittedly, the village mean may not
be an entirely valid instrument as households do have the choice to migrate. In other
words, since the village could be a choice variable, the village mean is not exogenous.
To address this concern, we reestimate Model 2 twice – once including a dummy for
migrant households (Model 3), and once on the sample of nonmigrant households
(Model 4). The effect of village fady days remains significant in both of these models,
though the magnitude of the impact falls to roughly a 12% decrease in household
consumption for one extra fady day.
13
The remaining results are as expected and as documented in previous poverty analysis in
Madagascar (e.g. Razafindravonona et al., 2001). As such we do not comment on them
here, though it is interesting to note that almost none of the ethnic variables is significant,
indicating that most of the variation in poverty between ethnic groups is explained by the
factors mentioned above, as well as by variation in location.
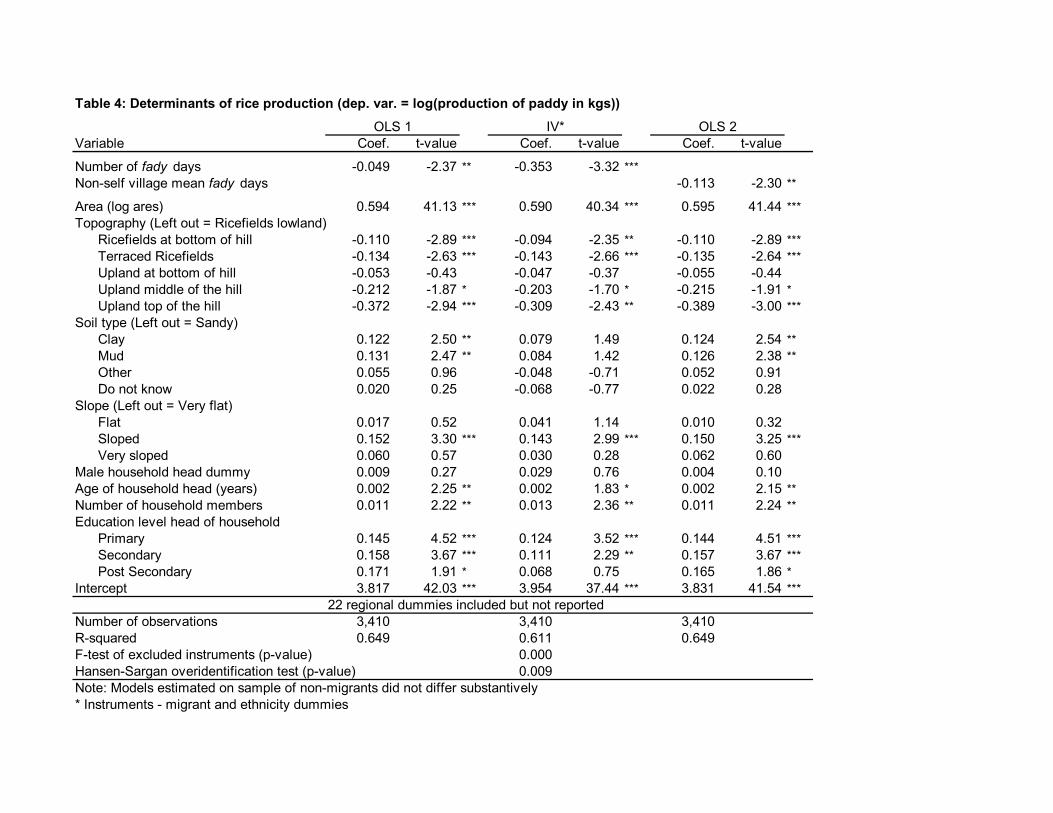
We turn to the effect of fady day beliefs on agricultural production, since this is an
important mechanisms through which fady day beliefs affect household welfare. Table 4
presents reducedform estimates of the determinants of rice production. 12 We focus just
on rice production (log of the kilograms of paddy produced per plot) as this is the
predominant crop grown in Madagascar, and as it allows for easier comparison across
plots. In addition to our variables of interest (fady days), other determinants include land
quality and characteristics, household demographics (to capture the quantity of household
labor that can be supplied in the absence of fadyday constraints), and education levels (to
capture the quality of labor inputs). 13 The effects of these variables in all of the models
(Table 4) are consistent with previous estimates for Madagascar (Stifel and Minten,
2004), and we do not discuss them here.
[Table 4 here]
Three specifications were estimated for this production model. In the first, a standard
OLS model, the household fady day variable is negative and statistically significant. We
find that an extra household fady day results in a 5% decrease in rice production, ceteris
paribus. The second and third specifications are motivated by the likelihood that
householdreported fady day are not exogenous (i.e. they are likely to be correlated with
some unobserved characteristic of the household that also affects household rice
production). In the second, we use an instrumental variable (IV) approach, in which a
migrant dummy and ethnicity variables serve as instruments. As seen in Model 3 of
12 While the plotlevel data used in this analysis are very detailed for a nationally representative household survey, they do not include information on quantities of labor and nonlabor inputs. As such, structural estimates of production functions are not possible. 13 Descriptive statistics appear in Appendix Table A2.
14
Table 2, these instruments are strongly correlated with the number of observed fady days.
Further, the pvalue for the Ftests of joint significance of the excluded instruments is
0.009, indicating that we can have confidence in the exclusion restriction. The estimates
of the effect of fady days in this IV model are significant and substantively larger than in
the OLS model. The estimated 35% decrease in rice production with an extra fady day is
larger than the effects observed in the cross tabulation in Table 1, and may be the result
of weak instruments (StockYogo, 2004).
In the third specification, we use the village average number of fady days as an
explanatory variable instead of household fady day belief to address not only the
endogeneity concerns, but also to test the functioning of village labor markets. As noted
section 4, the seasonal character of demand for labor among agricultural households leads
to productivity consequences from labor constraints. The question becomes, if a
household cannot employ its own labor, can it rely on hired labor. That we find an 11%
decline in production for a oneday increase in village fady days suggests labor market
failures at the village level.
5.3. Heterogeneous Treatment Effects
To test for heterogeneous effects of fady days, we estimate a model of demand for family
labor as outlined in section 4. Again, because the information available in the data is
limited to an indicator of whether family labor was used on each plot, and to control for
unobserved village heterogeneity, we estimate a reducedform village fixedeffects logit
model (Table 5).
[Table 5 here]
15
The positive and significant marginal effects estimates for the two interactions in Table 5
provide evidence that smaller households and those with less education employ less
family labor due to fadyinduced constraints. 14
Two points of clarification are needed to understand these estimates fully. First, the
interaction marginal effects that appear in the table are calculated as the average of the
partial 15 changes in the probability family labor use due to a oneday increase in fady
days (holding household size/education constant). We use the term partial because it the
effect of fady on family labor use only through the interaction effect. 16 For the household
sizefady interaction, this means that we evaluate the change in the probability for each
observation setting the household size per are of land equal to one, and then take the
average of the changes over the entire sample. Second, because these are partial changes
in the probabilities, the appropriate way to interpret them is to compare the marginal
effects for the constrained households (e.g. the ones with few adults per are of land)
relative to unconstrained households. The difference in marginal effects is a measure of
the effect of the constraint on labor use.
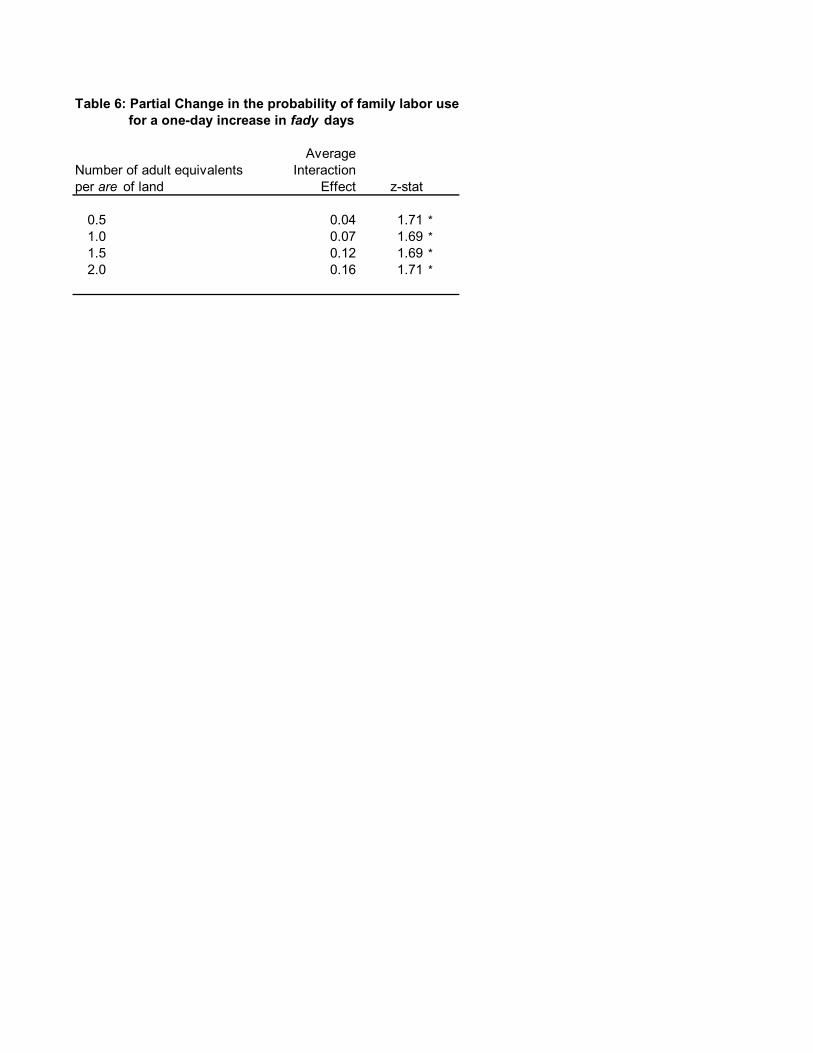
Regarding the household size relative to land holdings, it makes little sense to consider
households with no adults. As such, we estimate the interaction marginal effects for
various household sizes and present them in Table 6. Thus the 0.07 marginal effect for a
household with one adult per are of land can be compared to the 0.04 for a household
with one adult for two are of land (or 0.5 adults per are of land). This tells us that the
14 Note that we also include an interaction between village fady days and the household’s migrant status. As illustrated in Table 5, this interaction was not significantly different from zero. 15 That is we take the average of the following probabilities evaluated for each observation,
F( β x′ ) (1 F( β x′ )) xL/T βL/T * fady , where xL/T is the number of adults per are of land (set to one), and βL/T*fady is the estimated coefficient for the interaction. Ignoring the education interaction for simplicity, note that the change in the probability of family labor use for a one day increase in village fady observance is
F( β x′ ) (1 F( β x′ )) (βfady + xL/T βL/T*fady). The difference between the interaction marginal effect and the total change in the probability of family labor use is the direct effect of fady day observance (F( β x′ ) (1 F( β x′ )) (βfady)). This cannot be estimated because we estimate a fixed effects logit model (i.e. βfady is differenced out). Thus the marginal effects reported in Table 5 for the interaction terms are partial changes in the probabilities. 16 Note further that this is different from Ai and Norton (2003), who interpret the interaction in a logit model as a doubledifference.
16
household with more land and/or fewer adults (0.5 adults per are) is 3 percent less likely
to use family labor for rice production than the household with less land and/or more
adults (1 adult per are) as a result of one additional fady day. Similarly, a household with
one adult per are of land is 9 percent less likely to use family labor than a household with
two adults per are of land for a one day increase in fady days (0.16 – 0.07).
Based on these estimates, households with more land per adult member are affected more
by the local fady norms because they are more labor constrained. This effect of fady days
is progressively redistributive within villages as the more prosperous (based on more land
holdings) are more negatively influenced by fadyinduced labor constraints. Although
this leads to lower intravillage inequality, it does so at the expense of growth by merely
pulling everyone to the bottom.
The opposite conclusion, however, follows from the interaction effect for educated
households. Since constrained household do not have higher levels of education, the
marginal effect that appears in Table 5 illustrates the difference in the effect of fady
norms between the constrained and unconstrained households. In other words, those
households without secondary or postsecondary levels of education are 9 percent less
likely to use family labor as a result of a oneday increase in fady observance than
educated households. Those households with low levels of education (i.e. those who are
more likely to respect fady norms), are more negatively affected by fady norms than those
with higher levels of education who are also less likely to respect fady norms.
6. Conclusions
Although cultural practices and customs often have important consequences for welfare
and economic performance, they are seldom studied by economists. To fill this gap, we
study the impact of taboos on poverty and agriculture in Madagascar. Madagascar
provides a good case study because of the prevalence of taboos in the everyday life and
the variation in cultural practices across the country. We analyze the effects of days
17
during which it is taboo to work (fady days) on agriculture and welfare. Using data from
a nationally representative household survey, we find that 18% of agricultural households
two or more fady days per week and that an extra fady day decreases per capita household
consumption levels by 4 percent and rice productivity by 5 percent. We also find that
smaller households and those with less education employ less labor due to fadyinduced
constraints. While it is difficult to know the origins of most fady, and thus how to get rid
of the more detrimental ones, our results indicate that better educated households adhere
significantly less to some of these taboos. The low overall education level in Madagascar,
especially so in rural areas, is thus a likely major contributing factor to the persistence of
these taboos.
Although, we estimate the effect of one particular taboo (fady days), taboos are
widespread in rural areas and affect agricultural practices throughout Madagascar.
Freudenberger (1999), for example, illustrates how the required slaughtering of cows for
funerals, can lead to a vicious circle of deepening poverty in the case of quickly
succeeding deaths of family members. She also shows that this happens despite villagers
reporting a lack of manure as the main constraint on rice productivity in her study area.
In some other areas, it has been found that it is taboo to transport manure, generally
perceived as a major constraint to improved agricultural productivity in Africa (Barrett,
Place and Aboud, 2002). Solondraibe (1988) shows widespread taboos to cultivate even
fertile land in specific areas. Moser and Barrett (2003) further find economically and
statistically social conformity effects, i.e. Malagasy smallholders choose their cultivation
practices in part to conform to local behavioral norms, even if it means sacrificing gains
in expected rice output. Finally, Barrett (2005) illustrates how the adoption of improved
rice technologies is hindered because it departs with the “way of the ancestors” and
although highland farmers say they can not afford inorganic fertilizers, they routinely pay
extraordinary sums to exhume and reshroud dead ancestors every 35 years, a ceremony
known as famandihana.
Our findings suggest that the particular taboo studied here, the number of fady days
observed by farming households, affects household welfare and agricultural productivity
18
because it results in a failure of the village labor markets, and this is particularly the case
in the presence of other market failures. While an extra household fady day results in a
5% decrease in household rice production, the effect of an extra fady day on average in
the village is more than twice as large, which is consistent with a decrease in the overall
supply of labor in the village.
We thus conclude that because these taboos and other customs affect the flexibility of
input markets, they can be a major contributor to poverty and low agricultural
productivity. This appears to be the case in our Madagascar example. It is therefore
necessary for development economists to pay more attention to findings in other
disciplines, such as sociology and anthropology, and understand their implications for the
functioning of various markets. Not taking these into account will lead to omitted
variable bias in the quantitative analysis of determining factors of economic performance.
References
Adai, I., Ethnicity and contraceptive use in SubSaharan Africa: The case of Ghana, Journal of Biosocial Science, 1999, 31:105120.
Ai, Chunrong, and Edward Norton. 2003. “Interaction Term in Logit and Probit Models.” Economic Letters, 80: 123129.
Akerlof, G.A., Discriminatory, statusbased wages among traditionoriented, stochastically trading coconut producers, Journal of Political Economy, 1985, 93(2), pp. 265276
Angrist, Joshua, and Alan Krueger. 2001. “Instrumental Variables and the Search for Identification: From Supply and Demand to Natural Experiments.” Journal of Economic Perspectives, 15(4): 6985.
Arrow, K. Bowler, S., Durlauf, S., Meritocracy and economic inequality, Princeton University Press, 2000
Aunger, R. (1992), The nutritional consequences of rejecting food in the Ituri forest of Zaire, Human Ecology, 20(3): 263291
Barrett, C.B., The social economics of poverty, Routledge, New York, 2005
Barrett, C.B., F. Place, and A.A. Aboud, editors (2002), Natural Resources Management
19
in African Agriculture: Understanding and Improving Current Practices. Wallingford, UK: CAB International.
Bénabou, R., Tirole, J. (2007), Identity, Dignity and Taboos: Beliefs as Assets, IZA Discussion Paper no. 2583
Bloom, D.E., Sachs, J.D., Geography, demography and economic growth in Africa, Brookings papers on economic activity, 1998, no. 2, pp. 207273
Bodenhorn, H., A troublesome caste: Height and nutrition of Antebellum Virginia’s rural free blacks, Journal of Economic History, Vol. 59, No. 4, 1999, pp. 972996
Bloch, M., Placing the dead: Tombs, ancestral villages and kinship organizations in Madagascar, New York Seminar Press, 1971
Brown, M., Authority relations and trust: Social cohesion on the Eastern Maosala Peninsula, Madagascar, Ph.D. thesis, Washington University, St. Louis, 1999
Chamberlain, T.W., Chueng, C.S., Kwan, C.C.Y. (1991), The Friday the Thirteenth Effect: Myth or Reality, Quarterly Journal of Business and Economics, 30(2), pp. 111 117
Chimombo, J.P.G. (2005), Issues in basic education in developing countries: An exploration of policy options for improved delivery, Journal of International Cooperation in Education, 18(1): 129152
Collier, P., Garg, A., On kin groups and wages in the Ghanaian labor market, Oxford Bulletin of Economics and Statistics, Vol. 61, No. 2, May 1999, pp. 133151
Conley, T., Udry, C., Social learning through networks: The adoption of new agricultural technologies in Ghana, American Journal of Agricultural Economics, Vol. 83, No. 3, August 2001, pp. 668673
Cornell, B., Welch, I., Culture, information and screening discrimination, Journal of Political Economy, 1996, 104(3), pp. 542571
Cutler, D.M., Glaeser, E.L., Are ghettos good or bad?, Quarterly Journal of Economics, Vol. 112, No. 3, August 1997, pp. 827872
Darity, W., Guilkey, D., Wilfrey, W., Ethnicity, race and earnings, Economic Letters, Vol. 47, No. 34, March 1995, pp. 401408
Diamond, J., Guns, germs and steel: the fate of human societies, W.W.Norton & Company, New York, 1998
20
Do, Q., Phung, T.D. (2006), Superstition, Family Planning and Human Development, World Bank Policy Research Working Paper 4001
Fafchamps, M., Ethnicity and credit in African manufacturing, Journal of Development Economics, Vol. 61, No. 1, February 2000, pp. 205235
Fauroux, E. (2001), Dynamiques migratoires, tensions foncières, et déforestation dans l’ouest malgache, in Razanaka S., M. Grouzis, P. Milleville, B. Moizo et C. Aubry (eds), Sociétés paysannes, transitions agraires et dynamiques écologiques dans le SudOuest de Madagascar, actes de l’atelier CNRE – IRD, Antananarivo, 810 November 1999, pp. 91 106
Fenn, M., M. Robinson, D. Whyner, and K. Bernard (1999), Les tendances actuelles de la migration des peuples et son impact dans la région écologique des forêts épineuses à Madagascar, WWF, mimeo
Freudenberger, K. (1999), Livelihoods without Livestock: A Study of Communities and Households in the Village of Andalandranovao, Madagascar: LDI.
Fudenberg, D., Levine, D.K. (2006), Superstition and Rational Learning, American Economic Review, 96(3): 630651
Gallop, J.L., Sachs, J.D., Geography and economic growth, in B. Pleskovic and J.E. Stiglitz, eds., Proceedings of the Annual World Bank Conference on Development Economics, Washington DC, World Bank, 1998
Herrnstein, Richard, and Charles Murray. 1994. The Bell Curve: Intelligence and Class Structure in American Life. Free Press, New York.
Jarosz, L.A., Taboo and timework experience in Madagascar, Geographical Review, Vol. 84, Issue 4, October 1994, pp. 439450
Kay, J., Culture and prosperity: The truth about markets – Why some nations are rich but most remain poor, HarpinsCollins Publishers, New York, 2004
La Ferrera, E., Kin groups and reciprocity: A model of credit transactions in Ghana, American Economic Review, Vol. 39, No. 5, December 2003, pp. 17301751
Lambek, M., Taboo as a cultural practice among Malagasy speakers, Man, 1992, 27(2), pp. 245266
Landes, D.S., The wealth and poverty of nations: Why some are so rich and some so poor, W.W. Norton & Company, New York, 1998
Le Bourdiec, F., Hommes et paysages du riz à Madagascar, 1974, FTM, Antananarivo
21
Lokshin, M., Umapathi, N., Paternostro, S., Robustness of Subjective Welfare Analysis in a Poor Developing Country: Madagascar 2001, World Bank research paper, 2003
Moser, C. and C.B. Barrett (2003), “The Disappointing Adoption Dynamics of a Yield increasing, Low External Input Technology: the Case of SRI in Madagascar,” Agricultural Systems 76(3): 10851100.
Moizo, B. (1997), Des esprits, des tombeaux, du miel et des bœufs : Perception et utilisation de la forêt en pays Bara Imamono, in Milieux et sociétés dans le SudOuest de Madagascar, Collecion Iles et Archipels no 23, pp. 4366
Ottino, P., L’étrangère intime : essaie d’anthropologie de la civilisation de l’ancien Madagascar, Editions des Archives Contemporaines, 1986
Platteau, J. (1994), Behind the market stage where real societies exist – Part II : The role of moral norms, Journal of Development Studies, 30(3): 753817
Profita, P., La societé malgache et ses valeurs ancestrales, Eveche d’Ambatondrazaka, 1978
Putnam, R.D., Leonardi, R., Nanetti, R.Y. (1993), Making Democracy Work: Civic Institutions in Modern Italy, Journal of Development Studies, Princeton University Press, Princeton.
Rakotomahefa, P., Razakamanantsoa, M., Romani, M., Madagascar poverty profile 2001 : Technical report, 2002, INSTAT, Antananarivo, Madagascar
Ramamonjisoa, J., Les relations entre ethnies à Madagascar : Une problématique souvent mal posée, Afrique contemporaine, Trimestriel no. 202203, AvrilSeptembre 2002, pp. 5574
Ruud, J., Taboo: A study of Malagasy customs and beliefs, Oslo University Press, 1960
Siobhan, A., Culture and the labor market, Elgar, Northampton, Mass., 2003
Shatenstein, B. (1998), Influence of diet, health behavior and their outcome in select ethnocultural and religious groups, Nutrition, 14(2):223230
Solondraibe, T., Croyances religieuses et populaires traditionelles et agriculture: Le cas des ‘tany fady’ et ‘andro fady’ dans le betsileo, Recherche pour le Développement, No 5 (1), 1988, pp. 3562
Stifel, D., Minten, B., Isolation, welfare and agricultural productivity, working paper CFNPP, Cornell University, 2003
22
Thaler, R., Seasonal movements in security prices II: Weekend, holiday, turn of the month and intraday effects, Journal of Economic Perspectives, Vol. 1, No.2, Fall 1987, pp. 169177
Thaler, R., The January effect, Journal of Economic Perspectives, Vol. 1, No. 1, Summer 1987, pp. 197201
Van Gennep, A., Tabou et totémisme à Madagascar, Ernest Leroux, Paris, 1904
Van de Walle, D., Gunewardena, D., Sources of ethnic inequality, Journal of Development Economics, vol. 65, no. 1, June 2001, pp. 177207
Verin, P., Madagascar, Karthala, Paris, 1990
Wright, H.T., Rakotoarisao, J.A., The rise of Malagasy societies: New developments in the archaeology of Madagascar, in Goodman, S., Benstead, S., eds., The natural history of Madagascar, The University of Chicago Press, 2003, pp. 112119
23
Appendix: Descriptive statistics
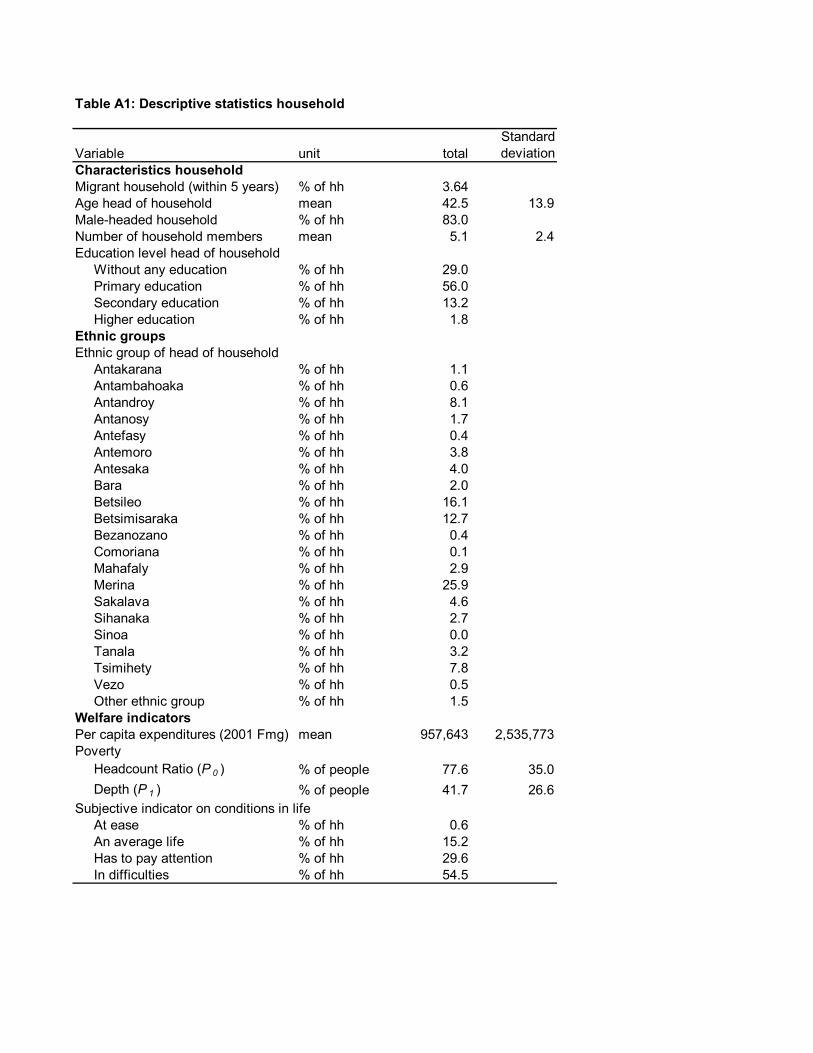
Table A1 shows some of the basic socioeconomic descriptive statistics of the households
that we study. The age of the average household is 43 years. 18% of the households are
headed by females and the size of the household is 5 members. Education levels are low
as 29% of the heads of households did not receive any education. About 17% of
household heads went on to pursue secondary or higher education. The survey allowed
for 22 ethnic groups, the most important of which are the Betsileo and Merina, mostly
resident in the highlands, and the Betsimaraka located mostly on the east coast.
Together, they account for 55% of our sample.
[Table A1 here]
Poverty is high by any measure. The headcount ratio of poverty (P0) is estimated to be
77.6% of individuals in our sample, which comparable to estimates from other national
household surveys that have been held in the last decade. The depth of poverty (P1) is
estimated at 28%. The average annual per capita expenditures are estimated at almost 1
million Fmg in 2001 currency (about 150$ annually or 0.41$ per day). These high
objective poverty measurement consistent with subjective measures in the data. About
54% of the households state that they have difficulties while 29% state that they must to
pay attention. 17
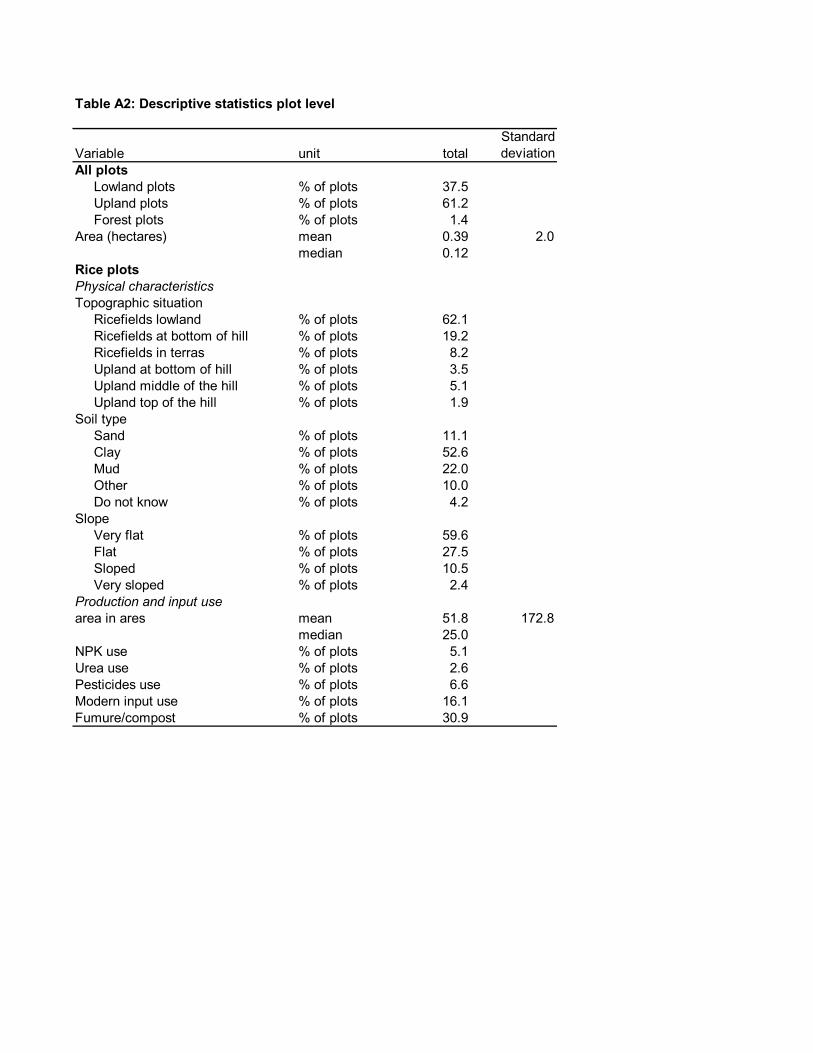
Agriculture is a main source of income for households in Madagascar. Further, rice is the
primary staple crop, accounting for almost 50% of all calorie consumption in the country
(Faostat, 2000). The data used in this analysis include detailed information about
agricultural inputs and production, providing us with important information about
people’s livelihoods. As illustrated in Table A2, just over 37% of the reported plots in
the sample were lowland plots where mostly only rice is grown. The average plot size is
17 By comparing actual expenditures of the household with selfreported welfare levels in the case of Madagascar, Lokshin et al. (2003) show that this type of subjective assessment are a good alternative indication of the welfare level of households in the absence of expenditure measurements.
24
small: the mean is 38 ares and the median is 12 ares. To facilitate comparison over plots,
we focus only on rice crops in this paper. Physical characteristics of rice plots are
reported in Table A2. The low rice yields seen in Table 1 are often due to the low
adoption of improved agricultural technologies. It is estimated that only 16% of the rice
plots receive some type of modern inputs (defined as chemical fertilizer, pesticides or
herbicides). Manure and compost was used on 31% of the plots.
[Table A2 here]
Table 1: Number of weekly fady days
Number of fady days Number of Percent of Poverty Rice per week observations Households Rate Yields*
Number of fady days 0.040 3.63 *** Nonself village mean fady days 0.147 5.04 *** 0.128 5.43 *** 0.118 4.90 *** Migrant household (within 5 years) 0.154 3.24 ***
Male household head dummy 0.090 3.74 *** 0.085 3.50 *** 0.085 3.51 *** 0.094 3.87 *** Age of household head (years) 0.004 7.01 *** 0.004 6.76 *** 0.004 6.98 *** 0.004 6.75 *** Number of household members 0.119 27.5 *** 0.119 27.5 *** 0.118 27.5 *** 0.117 26.9 *** Education level head of household Primary 0.130 6.00 *** 0.126 5.85 *** 0.125 5.80 *** 0.117 5.36 *** Secondary 0.365 11.80 *** 0.357 11.67 *** 0.345 11.30 *** 0.313 10.04 *** Post Secondary 0.709 8.76 *** 0.703 8.80 *** 0.688 8.62 *** 0.673 7.82 ***
Number of fady days 0.049 2.37 ** 0.353 3.32 *** Nonself village mean fady days 0.113 2.30 **
Area (log ares) 0.594 41.13 *** 0.590 40.34 *** 0.595 41.44 *** Topography (Left out = Ricefields lowland)
Ricefields at bottom of hill 0.110 2.89 *** 0.094 2.35 ** 0.110 2.89 *** Terraced Ricefields 0.134 2.63 *** 0.143 2.66 *** 0.135 2.64 *** Upland at bottom of hill 0.053 0.43 0.047 0.37 0.055 0.44 Upland middle of the hill 0.212 1.87 * 0.203 1.70 * 0.215 1.91 * Upland top of the hill 0.372 2.94 *** 0.309 2.43 ** 0.389 3.00 ***
Soil type (Left out = Sandy) Clay 0.122 2.50 ** 0.079 1.49 0.124 2.54 ** Mud 0.131 2.47 ** 0.084 1.42 0.126 2.38 ** Other 0.055 0.96 0.048 0.71 0.052 0.91 Do not know 0.020 0.25 0.068 0.77 0.022 0.28
Male household head dummy 0.009 0.27 0.029 0.76 0.004 0.10 Age of household head (years) 0.002 2.25 ** 0.002 1.83 * 0.002 2.15 ** Number of household members 0.011 2.22 ** 0.013 2.36 ** 0.011 2.24 ** Education level head of household
Intercept 3.817 42.03 *** 3.954 37.44 *** 3.831 41.54 *** 22 regional dummies included but not reported
Number of observations 3,410 3,410 3,410 Rsquared 0.649 0.611 0.649 Ftest of excluded instruments (pvalue) 0.000 HansenSargan overidentification test (pvalue) 0.009 Note: Models estimated on sample of nonmigrants did not differ substantively * Instruments migrant and ethnicity dummies
OLS 1 OLS 2 IV*
Table 5: Determinants of Family Labor Use on Rice Fields Village Fixed Effects Logit
Marginal Variable Effect † z stat
Interaction HH size per are of land * village fady days 0.07 1.69 * Interaction HH member w/ at least secondary educ * village fady days 0.09 1.80 * Interaction Migrant household * village fady days 0.06 0.97
HH size (adult equiv) per are of land 0.04 1.39 HH member w/ at least secondary education (dummy) 0.08 2.15 ** Migrant household (dummy) 0.08 1.72 *
Area (log ares) 0.07 5.89 *** Topography (Left out = Ricefields lowland)
Ricefields at bottom of hill 0.04 1.29 Terraced Ricefields 0.06 1.34 Upland at bottom of hill 0.01 0.10 Upland middle of the hill 0.10 1.54 Upland top of the hill 0.14 1.60
Soil type (Left out = Sandy) Clay 0.04 0.98 Mud 0.03 0.64 Other 0.18 4.27 *** Do not know 0.00 0.07
Slope (Left out = Very flat) Flat 0.18 4.56 *** Sloped 0.09 1.58 Very sloped 0.26 2.84 ***
Male household head dummy 0.00 0.12 Age of household head (years) 0.001 1.49 Number of household members (adult equivalents) 0.02 3.23 ***
Number of observations 2,578 LR (chi2(22)) 138.3 † Marginal effects for interaction terms are with respect to a change in fady days
Table 6: Partial Change in the probability of family labor use for a oneday increase in fady days
Average Number of adult equivalents Interaction per are of land Effect zstat
Characteristics household Migrant household (within 5 years) % of hh 3.64 Age head of household mean 42.5 13.9 Maleheaded household % of hh 83.0 Number of household members mean 5.1 2.4 Education level head of household
Without any education % of hh 29.0 Primary education % of hh 56.0 Secondary education % of hh 13.2 Higher education % of hh 1.8
Ethnic groups Ethnic group of head of household
Antakarana % of hh 1.1 Antambahoaka % of hh 0.6 Antandroy % of hh 8.1 Antanosy % of hh 1.7 Antefasy % of hh 0.4 Antemoro % of hh 3.8 Antesaka % of hh 4.0 Bara % of hh 2.0 Betsileo % of hh 16.1 Betsimisaraka % of hh 12.7 Bezanozano % of hh 0.4 Comoriana % of hh 0.1 Mahafaly % of hh 2.9 Merina % of hh 25.9 Sakalava % of hh 4.6 Sihanaka % of hh 2.7 Sinoa % of hh 0.0 Tanala % of hh 3.2 Tsimihety % of hh 7.8 Vezo % of hh 0.5 Other ethnic group % of hh 1.5
Welfare indicators Per capita expenditures (2001 Fmg) mean 957,643 2,535,773 Poverty
Headcount Ratio (P 0 ) % of people 77.6 35.0 Depth (P 1 ) % of people 41.7 26.6
Subjective indicator on conditions in life At ease % of hh 0.6 An average life % of hh 15.2 Has to pay attention % of hh 29.6 In difficulties % of hh 54.5
Table A2: Descriptive statistics plot level
Variable unit total Standard deviation
All plots Lowland plots % of plots 37.5 Upland plots % of plots 61.2 Forest plots % of plots 1.4
Ricefields lowland % of plots 62.1 Ricefields at bottom of hill % of plots 19.2 Ricefields in terras % of plots 8.2 Upland at bottom of hill % of plots 3.5 Upland middle of the hill % of plots 5.1 Upland top of the hill % of plots 1.9
Soil type Sand % of plots 11.1 Clay % of plots 52.6 Mud % of plots 22.0 Other % of plots 10.0 Do not know % of plots 4.2
Slope Very flat % of plots 59.6 Flat % of plots 27.5 Sloped % of plots 10.5 Very sloped % of plots 2.4
Production and input use area in ares mean 51.8 172.8
median 25.0 NPK use % of plots 5.1 Urea use % of plots 2.6 Pesticides use % of plots 6.6 Modern input use % of plots 16.1 Fumure/compost % of plots 30.9