Abstract— Simulative analysis in competitive sports can provide prospective insights, which can help improve the performance ofplayers in future matches. However, adequately simulating the complex competition process and effectively explaining the simulationresult to domain experts are typically challenging. This work presents a design study to address these challenges in table tennis.We propose a well-established hybrid second-order Markov chain model to characterize and simulate the competition process intable tennis. Compared with existing methods, our approach is the first to support the effective simulation of tactics, which representhigh-level competition strategies in table tennis. Furthermore, we introduce a visual analytics system called Tac-Simur based on theproposed model for simulative visual analytics. Tac-Simur enables users to easily navigate different players and their tactics based ontheir respective performance in matches to identify the player and the tactics of interest for further analysis. Then, users can utilize thesystem to interactively explore diverse simulation tasks and visually explain the simulation results. The effectiveness and usefulness ofthis work are demonstrated by two case studies, in which domain experts utilize Tac-Simur to find interesting and valuable insights. Thedomain experts also provide positive feedback on the usability of Tac-Simur. Our work can be extended to other similar sports such astennis and badminton.
Index Terms—Simulative Visual Analytics, Table Tennis, Design Study
1 INTRODUCTION
Simulative analysis plays an important role in competitive sports. Forexample, it has been used in basketball [31] and tennis [35] to provideprospective insights for coaches to improve the performance of playersin future matches. In table tennis, simulative analysis also helps ob-tain valuable insights into the tactical behaviors of players [24, 38, 44].However, prior studies mostly used complicated mathematical mod-els for simulative analysis without adopting any visual or interactivemeans. According to our experts, they experience difficulties in ex-ploring model spaces and determining meaningful patterns. Similarly,coaches and players face challenges in understanding the analysis re-sults. Thus, simulative analysis has seldom been accepted or adoptedby professional teams in table tennis. In this work, we take a visualapproach in contrast to the aforementioned simulative analyses andconduct a design study in the simulative visual analytics of table tennis.
Simulative analysis in table tennis can obtain the outcomes of futurematches [24, 38, 44], which is similar to predictive analysis. However,in addition to the outcomes, simulative analysis also focuses on theadequate modeling of each step within the simulated process [8] whilepredictive analysis only attaches importance to the accuracy of thepredicted results [17]. Therefore, we cannot directly apply the existingmethods of predictive visual analytics to the simulative visual analyticsof table tennis. In sports visualizations, iTTVis [40] is a representativevisual analytics system for investigating table tennis data. However,iTTVis is used to investigate the correlation of statistics in a table tennismatch without any prospective insights into future matches, which isdifferent from a simulative visual analytics system. Therefore, a newly-designed visual analytics system for the simulative analysis of tabletennis is highly demanded by our domain experts.
We worked closely with our domain experts, who are data analystsworking for one of the top national table tennis teams around the world,to develop such a visual analytics system. During the collaboration,we encountered two major challenges. The first challenge is to con-struct an effective model for the tactic-based simulation of table tennis.
• J. Wang, K. Zhao, D. Deng, A. Cao, X. Xie and Y.Wu are with the State KeyLab of CAD&CG, Zhejiang University. E-mail: {wangjiachen, zhaokejian,dengdazhen, caoanqi, xxie, ycwu}@zju.edu.cn. Y. Wu is the correspondingauthor.
• Z. Zhou and H.Zhang are with the Department of Sport Science, ZhejiangUniversity. E-mail: { zheng.zhou, zhang hui}@zju.edu.cn
Manuscript received xx xxx. 201x; accepted xx xxx. 201x. Date of Publicationxx xxx. 201x; date of current version xx xxx. 201x. For information onobtaining reprints of this article, please send e-mail to: [email protected] Object Identifier: xx.xxxx/TVCG.201x.xxxxxxx
Existing studies mostly use a first-order Markov chain model for simu-lation [24, 38, 44], which cannot simulate the effects of tactics. In tabletennis, a tactic represents three consecutive strokes (the action of hittingthe ball once is defined as a stroke) according to the experts. There-fore, the effect of a tactic reflects upon the correlation among threeconsecutive strokes. However, the first-order model can only cover thecorrelation between two adjacent strokes given the Markov property,leading to ineffective simulation of matches. The second challenge isto provide effective exploration and explanation for simulative analysis.Experts need to conduct diverse simulation tasks to explore possibleoptimization strategies for future matches. However, a large numberof strokes and tactics can easily overwhelm experts during exploration.Moreover, according to the experts, they require the simulated matchprocess to interpret the results but they are often confused with theprocess depicted by complicated mathematical models. The transi-tion from an abstract model to practical competition data is necessary.Therefore, providing friendly interactions for strategy exploration andeffective visualizations for result explanation is highly challenging.
We propose a hybrid second-order Markov chain model to solvethe first challenge. We extend the classical technique (i.e., three-phasemethod [39]) for tactical analysis in table tennis and integrate it into asecond-order Markov chain model [5]. The new model can involve theeffects of tactics in the simulation process and obtain a more accurateresult compared with the first-order Markov chain model. As for thesecond challenge, we design Tac-Simur, a visualization system fortactic-based simulative analysis. The system contains three components:a navigation component, an exploration component, and an explanationcomponent. The navigation component enables experts to browse thematches of multiple players and locate the players and tactics of interest.Experts can then explore the simulation process and evaluate the effectsand feasibility of simulations in the exploration component. Lastly,experts can explain the simulation result in the explanation componentthrough the effective visualization of the simulation model.
Contributions of this work are as follows:• We characterize the problem domain of the simulative visual
analytics of table tennis into three aspects, namely, navigation,exploration, and explanation.
• We introduce a well-established model to adequately simulatethe table tennis matches on the basis of tactics.
• We develop a visual analytics system to help facilitate the sim-ulative visual analytics of table tennis.
2 RELATED WORK
In this section, we introduce prior studies that are closely related to ourwork, including tactical analysis of table tennis, prospective analysis insports, visual analytics in sports, and predictive visual analytics.
2.1 Tactical Analysis of Table TennisTactics are one of the focal points in table tennis analysis, and thenumber of studies in this field has increased in recent years [8]. Tamakiet al. proposed a time-saving method to explore scoring rates in tabletennis games based on shot numbers [30]. Zhang et al. also pro-posed a representative data mining method based on the classical three-phase method [39] to assess the technique effectiveness of table tennisgames [45, 47]. Pradas et al. presented a temporal analysis approachto evaluate different temporal structures of table tennis games [27].Lanzoni et al. analyzed the technical and tactical differences of tabletennis players in three categories [13]. These studies primarily used thestatistics of key indicators to evaluate player performance in matches.Moreover, techniques such as data mining and artificial neural networksalso have been widely applied to tactical analysis for identifying as-sociation characteristics in table tennis strokes [46]. However, thesemethods cannot provide prospective insights for experts. Hence, bothZhang [44] and Pfeiffer et al. [24] proposed a first-order Markov chainmodel for tactical analysis based on simulation of table tennis games.Wenninger and Lames further improved the model with a numericalderivation method, which aimed to identify the effect of different tac-tical behaviors on the scoring rate [38]. However, this model cannotsimulate the effects of tactics, which motivates us to develop a newmodel to integrate the tactic into the simulation.
2.2 Prospective Analysis in SportsRecently, the interest in prospective analysis of competitive sportshas increased significantly [1]. For example, Vracar et al. integratedthe Markov process with multinomial logistic regression to predictpoints in basketball matches [31]. In addition, several methods, suchas the network-based prediction model [6], the computational random-walk model [9], and many other models [3, 18, 21], predict the futureoutcomes of different sports. However, these methods primarily focusedon the outcome of matches and disregard the complexity of the innerprocess of matches. Wei et al. developed a series of methods [33–35]to simulate tennis matches and reveal patterns within the match process.However, these models cannot be applied to table tennis due to distinctdata structures and match rules. Apart from tennis, the Markov chainmodel that simulates table tennis matches is also a significant methodproposed by Zhang [44], Pfeiffer et al. [24], and Wenninger and Lames[38]. This model inspires our work through its simulation of the state-transition feature in table tennis matches. However, this approach failsto effectively model tactics due to the Markov property. Therefore, wepropose a new simulation model based on this model.
2.3 Visual Analytics in SportsVisual analytics in sports has elicited considerable research attentionand the number of related works is increasing rapidly [23]. In bas-ketball, Cervone et al. proposed POINTWISE to predict points usingplayer-tracking data in NBA games [2]. Meanwhile, other studiesof basketball such as Courtvision [10], GameFlow [4], MatchOrches-tra [32], and BKVis [16] focused on shot distributions, events, andperformance indicators, respectively. In soccer, SoccerStories providedan innovative visualization interface for exploring soccer games withflexible interactions [22]. ForVizor used a tailored Sankey diagram torepresent changes in team formations in soccer games [41]. In baseball,StatCast Dashboard [11], Baseball4D [7], and Baseball Timeline [20]were representative works for the visual analytics of baseball trackingdata. Furthermore, there were also a large number of significant studiesabout other sports events, like rugby [14], ice hockey [25], fencing [48]and tennis [26]. In particular, iTTVis supported the visual analytics oftable tennis data [40]. It provided visualizations from diverse aspectssuch as box scores and strokes attributes. However, these approachescannot support simulative analysis, thereby motivating us to develop avisualization system to help users explore and explain the simulation.
2.4 Predictive Visual AnalyticsWe also refer to the works of predictive visual analytics given thesimilarity between prediction and simulation. Lu et. al conducted asurvey regarding the state-of-the-art in predictive visual analytics [17].However, we cannot directly apply the existing works to simulativevisual analytics because simulative analysis focuses on the adequate
process simulation and the precise result prediction whereas predictiveanalysis only focuses on the latter one. A complete review of predictivevisual analytics is beyond the scope of this work. More details aboutpredictive visual analytics can be found in the recent survey [17].
3 BACKGROUND AND SYSTEM OVERVIEW
In this section, we firstly introduce definitions of terminologies usedin the domain and the data used in this work. Then we analyze therequirements for simulative analysis of table tennis.
3.1 Background
Table tennis is a highly confrontational sport wherein two opposingsides hit a ball back and forth on the table with a net until one sidemisses the ball and the other scores a point. The structure of a match isillustrated in Fig. 2 black. A formal match is typically a best-of-sevenseries and involves four to seven games. Each game contains tens ofrallies. The winner of each game is generally the one who first winseleven rallies. Each rally contains strokes hit by two players.
A stroke is an action wherein a player hits the ball once with his/herracket. It is the basic observation unit during data collection [24]. Weuse three technical attributes shown in table 1 to describe a stroke,namely, stroke placement, stroke technique, and stroke position.
A rally is the composition of all strokes given by two players toscore one point. It is the basic unit for judging one point. Therefore, itis the basic unit of analysis during match simulation, and the simulationof a rally can be regarded as the simulation of a match [24].
A tactic is composed of any three consecutive strokes in a rally.As Zhang and Zhou [47] indicate, the attribute of the current strokelargely depends on the former two strokes from a player himself/herselfand his/her opponents. Specifically, the first stroke of a player is theinducement of a tactic. If a tactic is successful, then his/her opponentwould hit back the first stroke with the second stroke expected ofhim/her, and then the player would hit back with the third stroke he/sheprepared in advance with a high scoring rate. That is, if a tactic works,the player are more like to seize the initiative and win the rally.
A tactical adjustment is a strategy to change the usage of tacticsfor a player. Experts typically conduct a tactical adjustment by chang-ing the technical attributes (Table. 1) of strokes. For example, theywill increase the proportion of using reverse (a stroke technique) inserve rounds to determine whether such an adjustment can increase thewinning rate. Experts will also concurrently change multiple strokeattributes during simulation.
3.2 Data Description
The data is manually collected from match videos by professionaltable tennis players. Both the technical attributes of strokes and thecontextual data such as the maker of a stroke, the order of all strokes,and the score information are included during collection. The primarystroke attributes used for analysis are presented in Table. 1 as follows.
Table 1. The stroke attributes
Stroke placement Position of the ball on the table tennis ta-ble after it is hit (i.e., short forehand, shortmiddle, short backhand, half-long forehand,half-long middle, half-long backhand, longforehand, long middle, and long backhand).
Stroke technique Technique used to hit the ball (i.e., pendu-lum, reverse, tomahawk, topspin, quick at-tack, smash, flick, twist, push, short, slide,block, and lob).
Stroke position Position of the player when he/she is hittingthe ball (i.e., forehand, backhand, backhandturn, and pivot).
Stroke player Player hitting the ball.Score A/B Winner of the rally a stroke belongs to.Match ID / Stroke ID Index of the match / stroke.
3.3 Requirement AnalysisWe worked with two domain experts, namely, a professor and hisPh.D. candidate from the Department of Physical Education. Bothwere former professional table tennis players and have worked for oneof the top national table tennis teams in the world for more than 5years. Besides, one of our co-authors who majors in computationalsports science worked as a Liaison [29] during the cooperation. At first,we identified the problem domain with a simple pilot system. Then,we developed the simulation model through trial and error based onthe problem domain. Finally, we iteratively designed and developedthe visual analytics system according to the experts’ feedback andsuggestions. The detailed milestones are as follows.♦ Characterizing the problem domain. We held weekly meetings
with the domain experts to identify the problem domain of thesimulative analysis of table tennis. To facilitate this process, wedeveloped a pilot system to help identify the limitations of existingmethods and collect the requirements. After two-month explorationand iteration, we finalized the problem domain.
♦ Developing the simulation model. We tried various simulationmodels and it turned out that the simulation process of the Markovchain model is more comprehensible than deep learning models.Therefore, we constructed our model based on the second-orderMarkov chain model and the typical theories of table tennis.
♦ Designing interactive visualizations. When the model was ready,we started the visual design of the system according to the require-ments and the model. We designed the initial system at first anditerated the design with experts during weekly meetings.
♦ Developing the analytic system. We developed a prototype basedon the design and deployed it on the web for the experts to use. Dur-ing this period, the interactions and visualizations were frequentlyrevised in accordance with the experts’ feedback. The system wasiteratively refined through considerable revisions.We summarized the requirements from the experts into three aspects,
namely, navigation, exploration, and explanation.Navigation can help experts have an overall idea about the players theyare going to analyze, facilitating the analysis process.R1 What are the matches and the results of each player? When experts
select the data to be analyzed, they will firstly choose a playerthey are interested in and review the result of the matches he/sheparticipated in. Usually, they tend to analyze the close matches orthe ones revealing the characteristics of the player.
R2 What is the playing style of a player? What is the key tactic in thematches? The playing style of a player is intrinsically indicatedby the type of tactics he/she used most, and the type of tacticshe/she scored most. This information can provide navigation andreference for analysts while applying adjustments. For example, ifa player is poor at a frequently-used tactic A, then the experts willexpect to improve this tactic by adjusting its strokes. Moreover,the information is also necessary to explain the simulation results.
Exploration can help experts integrate empirical domain knowledgeinto the tactical adjustments and enhance the adjustment feasibility.R3 What kind of strokes is worth adjusting most? A player could have
lots of strokes that can be adjusted. However, instead of adjustingeach stroke to examine the result, experts would like to find a set ofkey strokes that may be important for improving the performance.This can help them significantly reduce the time for searchingappropriate adjustment strategies.
R4 What is the effect of an adjustment strategy? What is the feasibilityof an adjustment strategy? To evaluate an adjustment strategy,experts need to know the effect and feasibility of the adjustmentstrategy. Specifically, the effect means the increment/decrementimposed to final winning rates and the feasibility characterizes thedifficulty of utilizing an adjustment strategy in real scenarios.
Explanation can help experts understand the simulated match process,interpret the results of adjustments, and communicate the findings toplayers to improve the performance.R5 How does a tactical adjustment influence the strokes and tactics?
Experts need to know the reasons for the positive or negativeeffect of a particular adjustment. Generally, the reasons lie in theinfluence of the adjustment to the latter strokes. For example, thepositive effect of increasing the usage of quick attack, an offensive
stroke technique at the second stroke is because this adjustmentcan further raise the usage of other offensive techniques at latterstrokes, which can easily enhance the winning rate of the player.
R6 How to conduct a tactical adjustment in practice? Once an adjust-ment strategy is discovered, experts will expect to figure out howto conduct it in real scenarios so that they can communicate it tothe players. Specifically, experts need to examine the relationshipbetween the adjusted stroke and the former strokes to provide apractical solution for players (e.g., to increase the usage of quickattack at the third stroke, you need to use pendulum to serve).
Fig. 1. The overview of the system. The system consists of threecomponents, i.e., the data processing component, the model component,and the visualization component.
3.4 System OverviewTac-Simur is a web application with three components: the data process-ing component, the model component, and the visualization component(Fig. 1). The data processing component is responsible for extractingthe required attribute data from the raw database and providing datainterfaces for modeling and visualization. The model component ini-tializes the hybrid Markov chain model for each player with the datafrom the data processing component. The visualization component isthe interface for simulative visual analytics. This component consistsof three parts, namely, navigation, exploration, and explanation. Thenavigation part helps users locate a dataset and tactics of interest for fur-ther analysis. The exploration part supports flexible adjustments to thematches. Once an adjustment is conducted, the model component willreceive it and send the simulation results back to the exploration partfor visual comparison and evaluation. The explanation part providesa straightforward presentation of the simulation process for reasoningand validating the results generated in the exploration part. The dataprocessing component is implemented via MongoDB and Express.js.The model component is implemented via Python. The visualizationcomponent is implemented via Vue.js.
4 MODEL FOR SIMULATION
In this section, we firstly define the simulation task in table tennisand briefly introduce the Markov chain model. Thereafter, a well-established hybrid second-order Markov chain model is presented toaddress the limitations.
A
...
R12
R11
R14
R13
S1,16
...
receive stalemate1
...
serve1 2 3
stalemate24
G1
M
player1player2
G2
R11,S
G11,p1
G11,p2
R11,R R1
1,ST1 R11,ST2
S1,11 S1,1
2 S1,13 S1,1
4 S1,15}
}
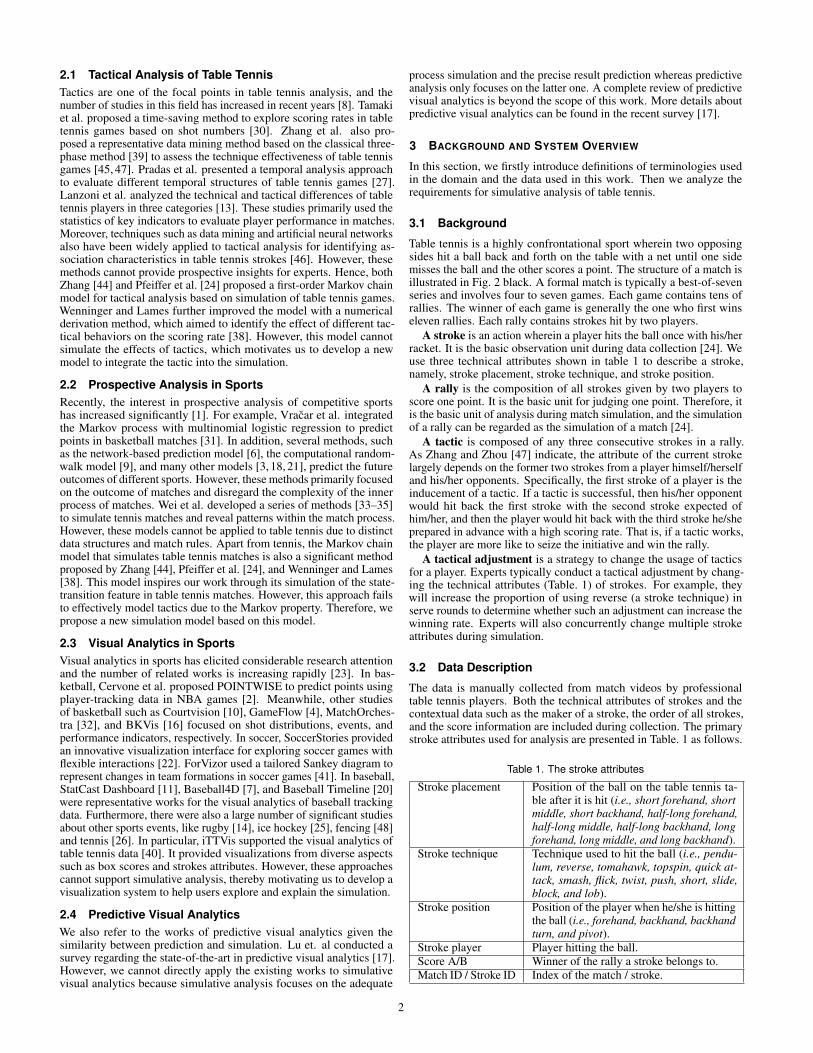
Fig. 2. The example of the structure of a match. M refers to ”Match”, Gi
refers to ”Game”, Rij refers to ”Rally”, and Si, j
k refers to ”Stroke”. The redparts are newly added compared with the old model. (A) illustrates thedivision of the four phases.
4.1 Task Definition and Model OverviewAs shown in (Fig. 2 black), a table tennis match is a set of games M ={G1,G2, . . . ,GnM} (for simplicity, we use the notation n∗ to indicate theamount of the elements in ∗) and a game consists of a number of ralliesGi = {Ri
1,Ri2, . . . ,R
inGi}. For each rally, it can further be quantified as
a stroke sequence Rij = {S
i, j1 ,Si, j
2 , . . . ,Si, jnRi
j,Pi
j}, where Si, jk is the kth
stroke and Pij is the result of Ri
j (Player 1 wins or loses). Si, jk ,Pi
j ∈ S, adiscrete state space characterized by the combination of attributes inTable 1. Therefore, the simulation of a table tennis match intrinsicallyinvolves simulating the stroke sequences (rallies). Specifically, giventhe first stroke, Si, j
1 , a simulation model should obtain the remainingstrokes including the winner Pi
j by assigning the states from S to them.The original model [24] for simulation of matches stems from Martin
Lames’ Markov chain model [12]. However, when applied to thesimulation task, it has two limitations:
Tactic modeling is inadequate. The first-order Markov chainmodel treats each rally within a game as a first-order Markov pro-cess, in which the Sk is only determined by Sk−1 and a static transitionmatrix T (Fig. 3(C) blue). It cannot simulate the table tennis matchesprecisely because a tactic is defined by the states of three consecutivestrokes (i.e., Tk = (Sk,Sk+1,Sk+2) and Sk,Sk+1,Sk+2 ∈ S). The transi-tion probability between two states from S varies in different phasesof a rally (e.g., serve, receive, and two stalemates Fig 2(A)). Thusmodeling the tactic with a one-step transition matrix is inadequate.
Stroke characterization is insufficient. In table tennis, a strokeis typically characterized by stroke placement (Pla), stroke technique(Tec), and stroke position (Pos) (Table. 1). The original model charac-terizes the transition of stroke states with only one of the three attributes(Fig. 3(B) blue), which is insufficient to simulate the real situation.
However, compared with other deep learning models, this model ismore comprehensible because it depicts the interaction between playersclearly through a transition matrix. As a simple probabilistic graphicalmodel, the Markov chain can trace and interpret each step within thesimulation of table tennis as a practical stroke within the match.
Therefore, based on the original model, we constructed a hybridsecond-order Markov chain model. The new model improves thetwo aspects mentioned above. First, we split all rallies and dividedthem into four kinds of Markov processes on the basis of the three-phasemethod [39] (Fig. 2(A)). Each Markov process consists of two transitionmatrices (Fig. 3(A) red). One depicts the transition from Sk−1 to Sk andthe other depicts the transition from Sk−2 to Sk. In this way, tactics canbe modeled properly as the current stroke is determined not only by theformer stroke but also by the one before the former stroke (Fig. 3(C)red). Thus the simulation process of the hybrid second-order Markovchain model is more precise and reasonable. Second, we expanded thenumber of attributes used in stroke characterization to a maximum ofthree, namely, Sk = (sk
1,sk2,s
k3)(s
k1 ∈ Pla,sk
2 ∈ Tec,sk3 ∈ Pos) (Fig. 3(B)
red). Experts can conduct more complicated and flexible adjustmentswith strokes characterized by more attributes.
4.2 Hybrid Second Order Markov Chain ModelHere we introduce our hybrid second-order Markov chain model. Thedomain experts indicated that players always exhibit tactical awarenessduring matches. Therefore, a stroke is highly relevant to the formertwo strokes as a tactic contains three consecutive strokes. To modelthis feature, we ultimately decided to use a higher order Markov chainmodel [5]. Briefly, an nth-order Markov chain model is composed of nfirst-order models. Therefore, a conventional nth-order Markov chaincontains (m−1) ·mn parameters (m is the number of state attributes).Raftery [28] provided an optimization method to simplify the computa-tion process. Ching et al. further [5] extended this method to a moreaccurate one. Here we adopted the concept of the second-order Markovchain model to construct a hybrid model as follows:
Vk = λ1 ·Vk−1 ·T1 +λ2 ·Vk−2 ·T2, (1)
where λ1 +λ2 = 1. Given that a tactic involves three strokes, a second-order Markov chain model (Equation. 1) can appropriately model the
influence of tactics. Here T1 denotes the transition matrix from the(k−1)th stroke to the kth stroke whereas T2 indicates that from the (k−2)th stroke to the kth stroke (Fig. 3(A) red). λ1 and λ2 are the weightsestimated by minimizing the prediction deviation (Fig. 3(C) red). Thetransition matrices, T1 and T2, of the model is an empirical transitionprobability matrix. As shown in Fig. 3(A), the row headers and columnheaders of the matrices T1 and T2 (T for first-order Markov chainmodel) are the states of a former stroke and a latter stroke respectively.The transition matrices and initial state vectors are estimated by thefrequency of each state from the analyzed matches. Moreover, thedifferent phases in a rally are simulated by different Markov processes.In our case, the model comprises four Markov processes, as shownin Fig. 2(A). According to Wu et al. [39], the playing strategy of aplayer varies over rallies. When the player serves, he/she tends toconduct more offense than defense. However, when he/she receives,the situation is reversed. Meanwhile, the first tactics of the two playersin a rally are more diverse than those afterward. Therefore, we firstsubdivided the rallies of a game (Gi = {Ri
1,Ri2, . . . ,R
inGi}) into two
subsets (Gi,P1 and Gi,P2) according to the serving player (Fig. 2 red).Further, we split a rally (Ri
j) into four phases, the serve phase (Rij,S), the
receive phase (Rij,R), and the stalemate phases of two players (Ri
j,ST 1and Ri
j,ST 2)(Fig. 2(A) red). Rij,S and Ri
j,R are the first tactics of bothplayers, namely, the serve tactic for one player and the receive tactic forthe other, and Ri
j,ST 1 and Rij,ST 2 include the tactics at stalemate phases.
During simulation, two initial state vectors, namely, V1 correspond-ing to the first stroke S1 and V2 corresponding to the second stroke S2are required. Then the vectors of strokes (V3 and V4) can be obtainedby Equation. 1 with the transition matrices in RS and RR. After that,with V3 and V4, the vectors of the strokes in RST 1 and RST 2 are furtherobtained, as well as the convergent results.
C...
λ1 λ1λ2
λ2
S1V1
V1
V2
V2S2
V3
V3S3
Vn
VnSn
T2 T2
T T T
T1 T1
B Pla &&Tec PosPla //Tec Pos
AVk-1
...
v1, p1v2, p2
vn, p1vn, p2
wp1
wp2
Vk-1
...
v1, p1v2, p2
vn, p1vn, p2
wp1
wp2
Vk-1
...
v1, p1v2, p2
vn, p1vn, p2
wp1
wp2
Vk ...
T T1
SkSk-1SkSk-1
T2
SkSk-2
Vk ... Vk ...
player1player2
Fig. 3. The original model and the new model. Blue encodes the originalmodel, red encodes the new model. (A) and (B) present the state vectors.Specifically, in (A), Sk represents the stroke, Vk represents the statevector of each stroke Sk, vi,p1 and vi,p2 represents the state value ofstroke attributes and wp1 and wp2 represents the state value of winningof the two players. (C) presents the simulation process.
4.3 Making AdjustmentsIn the original model, adjustments are achieved by tuning the empiricaltransition matrix T . Then changes in the final scoring rates quantify theeffects for evaluation. However, according to the experts, tuning thetransition matrix means changing the playing style of a player whilegiving each of his/her stroke in a rally. It is too difficult for playersto achieve the adjustments. Therefore, we tune the state vectors inthe new model. The tuned vector is calculated based on all of theprobability values in the vector. Specifically, if we want to adjustPlayer 1 (P1) and need to adjust the state value vi,P1 ∈Vk, where vi,P1is the probability value of strokes given by flick to long-forehand with
forehand, then we need to enhance the utilization rates of tactics thatcontain the aforementioned stroke at Sk. We intially increase the vi,P1and then decrease v j,P1( j 6= i) in Vk. According to Pfeiffer et al. [24],the function for deflection is as follows,
δvi,P1 =C+B ·A · vi,P1 · (1− vi,P1) (2)
where δvi,P1 is the change in probability; C is a constant that describesthe deflection in the border probability; B is a constant that describesthe maximum value of the relative magnitude of deflection; and A isa normalization factor that allows the constant B to be equal to themaximum deflection value. In the current work, the constants are set toC = 0.05, B = 0.25 and A = 4 based on the previous work [24] to keepthe deflection value between 1%∼ 6%. The compensation function is:
δv j,P1 =−(v j,P1/(1− vi,P1)) ·δvi,P1 (3)
where δv j,P1 is the change in the probability.
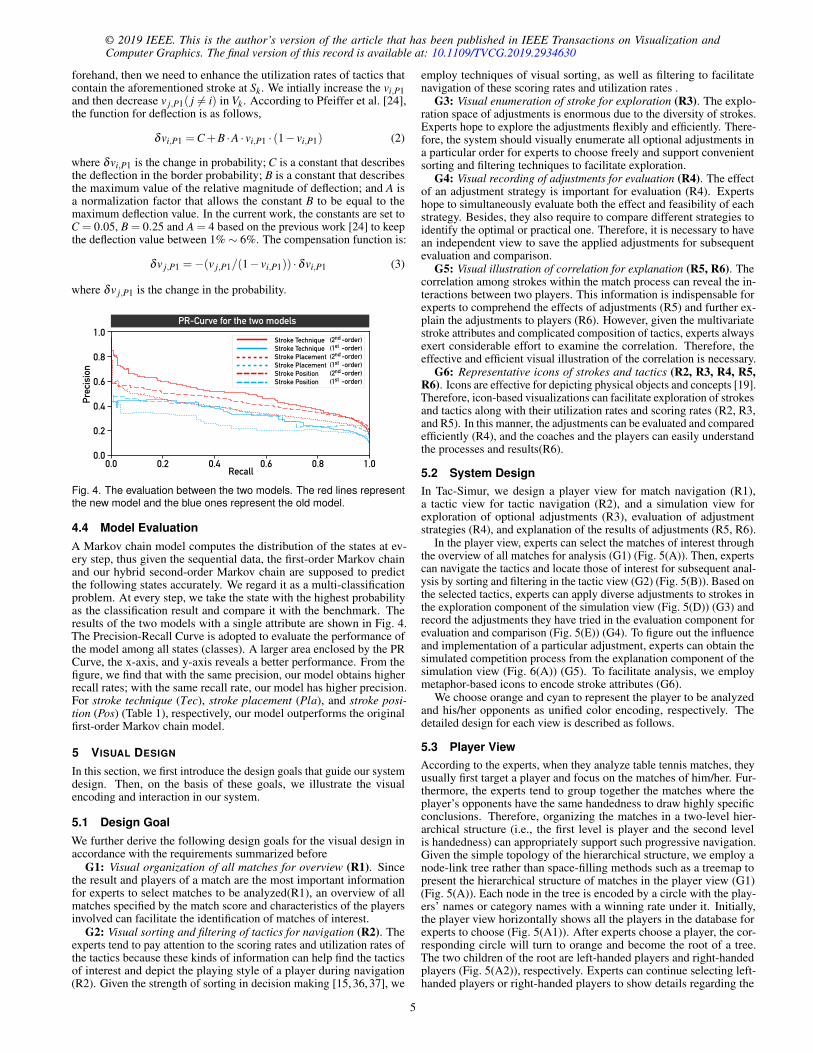
PR-Curve for the two models
0.0
1.0
0.8
0.6
0.4
0.2
Prec
isio
n
Stroke TechniqueStroke TechniqueStroke PlacementStroke PlacementStroke PositionStroke Position
nd(2 -order)
nd(2 -order)
nd(2 -order)st(1 -order)
st(1 -order)
st(1 -order)
0.0 0.2 0.4 0.6 0.8 1.0Recall
Fig. 4. The evaluation between the two models. The red lines representthe new model and the blue ones represent the old model.
4.4 Model EvaluationA Markov chain model computes the distribution of the states at ev-ery step, thus given the sequential data, the first-order Markov chainand our hybrid second-order Markov chain are supposed to predictthe following states accurately. We regard it as a multi-classificationproblem. At every step, we take the state with the highest probabilityas the classification result and compare it with the benchmark. Theresults of the two models with a single attribute are shown in Fig. 4.The Precision-Recall Curve is adopted to evaluate the performance ofthe model among all states (classes). A larger area enclosed by the PRCurve, the x-axis, and y-axis reveals a better performance. From thefigure, we find that with the same precision, our model obtains higherrecall rates; with the same recall rate, our model has higher precision.For stroke technique (Tec), stroke placement (Pla), and stroke posi-tion (Pos) (Table 1), respectively, our model outperforms the originalfirst-order Markov chain model.
5 VISUAL DESIGN
In this section, we first introduce the design goals that guide our systemdesign. Then, on the basis of these goals, we illustrate the visualencoding and interaction in our system.
5.1 Design GoalWe further derive the following design goals for the visual design inaccordance with the requirements summarized before
G1: Visual organization of all matches for overview (R1). Sincethe result and players of a match are the most important informationfor experts to select matches to be analyzed(R1), an overview of allmatches specified by the match score and characteristics of the playersinvolved can facilitate the identification of matches of interest.
G2: Visual sorting and filtering of tactics for navigation (R2). Theexperts tend to pay attention to the scoring rates and utilization rates ofthe tactics because these kinds of information can help find the tacticsof interest and depict the playing style of a player during navigation(R2). Given the strength of sorting in decision making [15, 36, 37], we
employ techniques of visual sorting, as well as filtering to facilitatenavigation of these scoring rates and utilization rates .
G3: Visual enumeration of stroke for exploration (R3). The explo-ration space of adjustments is enormous due to the diversity of strokes.Experts hope to explore the adjustments flexibly and efficiently. There-fore, the system should visually enumerate all optional adjustments ina particular order for experts to choose freely and support convenientsorting and filtering techniques to facilitate exploration.
G4: Visual recording of adjustments for evaluation (R4). The effectof an adjustment strategy is important for evaluation (R4). Expertshope to simultaneously evaluate both the effect and feasibility of eachstrategy. Besides, they also require to compare different strategies toidentify the optimal or practical one. Therefore, it is necessary to havean independent view to save the applied adjustments for subsequentevaluation and comparison.
G5: Visual illustration of correlation for explanation (R5, R6). Thecorrelation among strokes within the match process can reveal the in-teractions between two players. This information is indispensable forexperts to comprehend the effects of adjustments (R5) and further ex-plain the adjustments to players (R6). However, given the multivariatestroke attributes and complicated composition of tactics, experts alwaysexert considerable effort to examine the correlation. Therefore, theeffective and efficient visual illustration of the correlation is necessary.
G6: Representative icons of strokes and tactics (R2, R3, R4, R5,R6). Icons are effective for depicting physical objects and concepts [19].Therefore, icon-based visualizations can facilitate exploration of strokesand tactics along with their utilization rates and scoring rates (R2, R3,and R5). In this manner, the adjustments can be evaluated and comparedefficiently (R4), and the coaches and the players can easily understandthe processes and results(R6).
5.2 System DesignIn Tac-Simur, we design a player view for match navigation (R1),a tactic view for tactic navigation (R2), and a simulation view forexploration of optional adjustments (R3), evaluation of adjustmentstrategies (R4), and explanation of the results of adjustments (R5, R6).
In the player view, experts can select the matches of interest throughthe overview of all matches for analysis (G1) (Fig. 5(A)). Then, expertscan navigate the tactics and locate those of interest for subsequent anal-ysis by sorting and filtering in the tactic view (G2) (Fig. 5(B)). Based onthe selected tactics, experts can apply diverse adjustments to strokes inthe exploration component of the simulation view (Fig. 5(D)) (G3) andrecord the adjustments they have tried in the evaluation component forevaluation and comparison (Fig. 5(E)) (G4). To figure out the influenceand implementation of a particular adjustment, experts can obtain thesimulated competition process from the explanation component of thesimulation view (Fig. 6(A)) (G5). To facilitate analysis, we employmetaphor-based icons to encode stroke attributes (G6).
We choose orange and cyan to represent the player to be analyzedand his/her opponents as unified color encoding, respectively. Thedetailed design for each view is described as follows.
5.3 Player ViewAccording to the experts, when they analyze table tennis matches, theyusually first target a player and focus on the matches of him/her. Fur-thermore, the experts tend to group together the matches where theplayer’s opponents have the same handedness to draw highly specificconclusions. Therefore, organizing the matches in a two-level hier-archical structure (i.e., the first level is player and the second levelis handedness) can appropriately support such progressive navigation.Given the simple topology of the hierarchical structure, we employ anode-link tree rather than space-filling methods such as a treemap topresent the hierarchical structure of matches in the player view (G1)(Fig. 5(A)). Each node in the tree is encoded by a circle with the play-ers’ names or category names with a winning rate under it. Initially,the player view horizontally shows all the players in the database forexperts to choose (Fig. 5(A1)). After experts choose a player, the cor-responding circle will turn to orange and become the root of a tree.The two children of the root are left-handed players and right-handedplayers (Fig. 5(A2)), respectively. Experts can continue selecting left-handed players or right-handed players to show details regarding the
Fig. 5. The system interface. The donut charts and the pie charts encode the scoring rates and utilization rates, respectively. (A) is the player viewwhich displays all matches of Ito Mima and her opponents. It provides navigation of matches. (B) is the tactic view which displays the tactics specifiedby stroke placement at the serve phase. It provides navigation of tactics. (C) is the simulation view which is under the exploration mode. It contains(D), the exploration component for implementation of adjustments and (E), the evaluation component for evaluation of adjustments. (D) displays all ofthe adjustment options specified by stroke placement and stroke technique. (E) displays the three optimum strategies generated by the system.
opponents as the leaves of the treemap (Fig. 5(A3)). After the expertschoose the player and his/her opponents of interest, the correspondingmatches will be selected for analysis.
5.4 Tactic ViewThe tactic view is a tactic list consisting of all the tactics used by thetargeted player in the selected matches. These tactics are presented byicons of strokes (G6). They can be sorted based on scoring rates orutilization rates (G2) and classified according to rally phases.
Icon. iTTVis [40] has provided a set of icons for the three strokeattributes. Although the icons are well-designed, it is difficult forexperts to distinguish between the icons of the same attribute (e.g.,stroke position) when the visual space is limited (the analysis requiresexperts to inspect numbers of strokes). Therefore, we revised theseicons based on the features mentioned in [19]. The icons of each strokeattribute are as follows.
• Stroke placement. Table tennis table is widely used to illustratethe ball position of a stroke. Therefore, we use a half table tennistable to encode the stroke placement, which meets familiarity,concreteness, and meaningfulness [19]. Unlike that of iTTVis,the half table is divided into nine grids based on the real scale ofthe division criterion provided by the domain experts (Fig. 5(B1)).The filled grid represents a certain stroke placement of a stroke.
• Stroke technique. Encoding the fourteen stroke techniques bycolor or other visual channels is difficult. Therefore, we followiTTVis and use the abbreviation of the technique name to rep-resent the stroke techniques (Fig. 5(B2)). This encoding meetsmeaningfulness and semantic distance [19].
• Stroke position. In iTTVis, this attribute is encoded by the spe-cific poses of players. However, this encoding is difficult torecognize given the small size of the icon. Therefore, we use aracket to encode the stroke position since different poses can berepresented by different means to swing the racket. This encodingmeets concreteness and meaningfulness [19]. The four differentdirections denote backhand-turn, backhand, forehand, and pivot
from left to right, respectively (Fig. 5(B3)).Tactic list. The list is used for navigating tactics for subsequent
analysis. The tactics are all described by one kind of attributes becausefiltering with more attributes will severely diminish the adjustable can-didates in the simulation view, thereby limiting exploration. Each rowof the list contains three components: the tactic (Fig. 5(B4)), the scor-ing rate (Fig. 5(B5)), and the utilization rate (Fig. 5(B6)). The scoringrate of a tactic is symbolized by a donut chart. The utilization rate ispresented by a bar chart. These two encodings are straightforward forcomprehension and efficient for sorting (G2).
Interaction. Sorting buttons and sliders are set above the two ratesto enable descending sorting and filtering. Besides, experts can chooseto browse tactics in different phases through the button on the right side.Additionally, experts can click the icons on the left side to select thetactic attribute used to depict the tactics (Fig. 5(B1, B2, B3)).
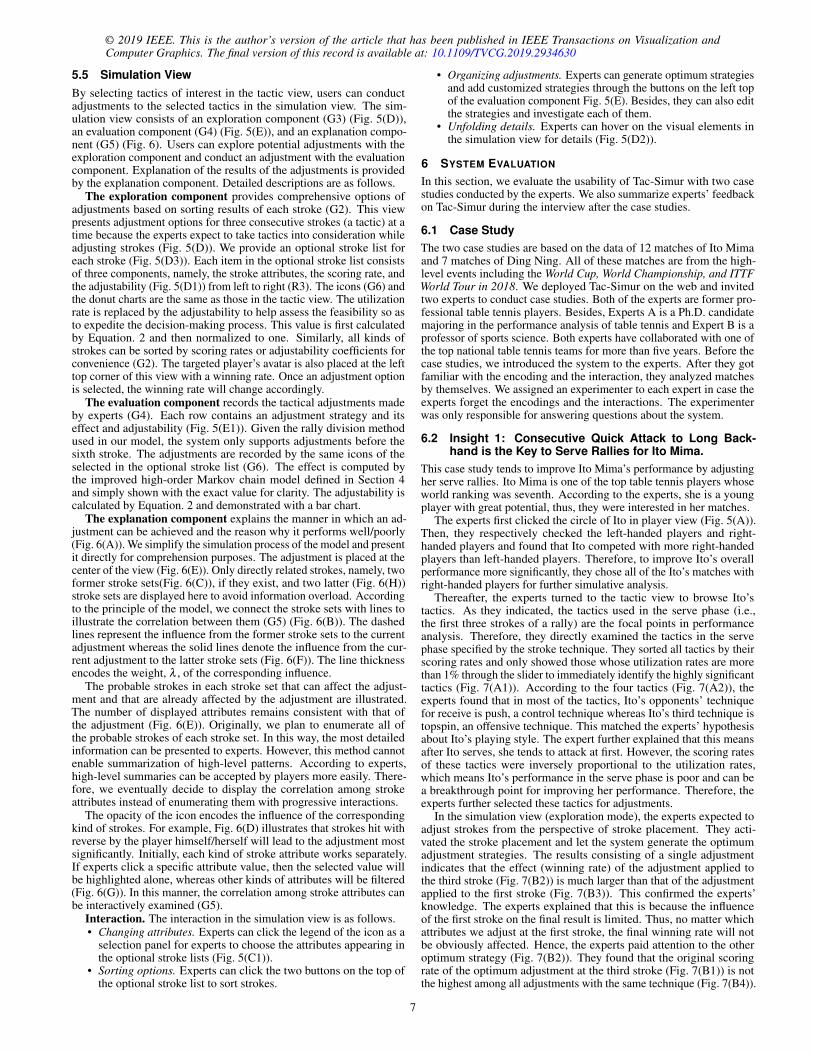
Fig. 6. The explanation mode of simulation view. (B) presents thecorrelation among strokes. (C) and (H) present the former and latter twostrokes of the adjustment (E).
5.5 Simulation ViewBy selecting tactics of interest in the tactic view, users can conductadjustments to the selected tactics in the simulation view. The sim-ulation view consists of an exploration component (G3) (Fig. 5(D)),an evaluation component (G4) (Fig. 5(E)), and an explanation compo-nent (G5) (Fig. 6). Users can explore potential adjustments with theexploration component and conduct an adjustment with the evaluationcomponent. Explanation of the results of the adjustments is providedby the explanation component. Detailed descriptions are as follows.
The exploration component provides comprehensive options ofadjustments based on sorting results of each stroke (G2). This viewpresents adjustment options for three consecutive strokes (a tactic) at atime because the experts expect to take tactics into consideration whileadjusting strokes (Fig. 5(D)). We provide an optional stroke list foreach stroke (Fig. 5(D3)). Each item in the optional stroke list consistsof three components, namely, the stroke attributes, the scoring rate, andthe adjustability (Fig. 5(D1)) from left to right (R3). The icons (G6) andthe donut charts are the same as those in the tactic view. The utilizationrate is replaced by the adjustability to help assess the feasibility so asto expedite the decision-making process. This value is first calculatedby Equation. 2 and then normalized to one. Similarly, all kinds ofstrokes can be sorted by scoring rates or adjustability coefficients forconvenience (G2). The targeted player’s avatar is also placed at the lefttop corner of this view with a winning rate. Once an adjustment optionis selected, the winning rate will change accordingly.
The evaluation component records the tactical adjustments madeby experts (G4). Each row contains an adjustment strategy and itseffect and adjustability (Fig. 5(E1)). Given the rally division methodused in our model, the system only supports adjustments before thesixth stroke. The adjustments are recorded by the same icons of theselected in the optional stroke list (G6). The effect is computed bythe improved high-order Markov chain model defined in Section 4and simply shown with the exact value for clarity. The adjustability iscalculated by Equation. 2 and demonstrated with a bar chart.
The explanation component explains the manner in which an ad-justment can be achieved and the reason why it performs well/poorly(Fig. 6(A)). We simplify the simulation process of the model and presentit directly for comprehension purposes. The adjustment is placed at thecenter of the view (Fig. 6(E)). Only directly related strokes, namely, twoformer stroke sets(Fig. 6(C)), if they exist, and two latter (Fig. 6(H))stroke sets are displayed here to avoid information overload. Accordingto the principle of the model, we connect the stroke sets with lines toillustrate the correlation between them (G5) (Fig. 6(B)). The dashedlines represent the influence from the former stroke sets to the currentadjustment whereas the solid lines denote the influence from the cur-rent adjustment to the latter stroke sets (Fig. 6(F)). The line thicknessencodes the weight, λ , of the corresponding influence.
The probable strokes in each stroke set that can affect the adjust-ment and that are already affected by the adjustment are illustrated.The number of displayed attributes remains consistent with that ofthe adjustment (Fig. 6(E)). Originally, we plan to enumerate all ofthe probable strokes of each stroke set. In this way, the most detailedinformation can be presented to experts. However, this method cannotenable summarization of high-level patterns. According to experts,high-level summaries can be accepted by players more easily. There-fore, we eventually decide to display the correlation among strokeattributes instead of enumerating them with progressive interactions.
The opacity of the icon encodes the influence of the correspondingkind of strokes. For example, Fig. 6(D) illustrates that strokes hit withreverse by the player himself/herself will lead to the adjustment mostsignificantly. Initially, each kind of stroke attribute works separately.If experts click a specific attribute value, then the selected value willbe highlighted alone, whereas other kinds of attributes will be filtered(Fig. 6(G)). In this manner, the correlation among stroke attributes canbe interactively examined (G5).
Interaction. The interaction in the simulation view is as follows.• Changing attributes. Experts can click the legend of the icon as a
selection panel for experts to choose the attributes appearing inthe optional stroke lists (Fig. 5(C1)).
• Sorting options. Experts can click the two buttons on the top ofthe optional stroke list to sort strokes.
• Organizing adjustments. Experts can generate optimum strategiesand add customized strategies through the buttons on the left topof the evaluation component Fig. 5(E). Besides, they can also editthe strategies and investigate each of them.
• Unfolding details. Experts can hover on the visual elements inthe simulation view for details (Fig. 5(D2)).
6 SYSTEM EVALUATION
In this section, we evaluate the usability of Tac-Simur with two casestudies conducted by the experts. We also summarize experts’ feedbackon Tac-Simur during the interview after the case studies.
6.1 Case StudyThe two case studies are based on the data of 12 matches of Ito Mimaand 7 matches of Ding Ning. All of these matches are from the high-level events including the World Cup, World Championship, and ITTFWorld Tour in 2018. We deployed Tac-Simur on the web and invitedtwo experts to conduct case studies. Both of the experts are former pro-fessional table tennis players. Besides, Experts A is a Ph.D. candidatemajoring in the performance analysis of table tennis and Expert B is aprofessor of sports science. Both experts have collaborated with one ofthe top national table tennis teams for more than five years. Before thecase studies, we introduced the system to the experts. After they gotfamiliar with the encoding and the interaction, they analyzed matchesby themselves. We assigned an experimenter to each expert in case theexperts forget the encodings and the interactions. The experimenterwas only responsible for answering questions about the system.
6.2 Insight 1: Consecutive Quick Attack to Long Back-hand is the Key to Serve Rallies for Ito Mima.
This case study tends to improve Ito Mima’s performance by adjustingher serve rallies. Ito Mima is one of the top table tennis players whoseworld ranking was seventh. According to the experts, she is a youngplayer with great potential, thus, they were interested in her matches.
The experts first clicked the circle of Ito in player view (Fig. 5(A)).Then, they respectively checked the left-handed players and right-handed players and found that Ito competed with more right-handedplayers than left-handed players. Therefore, to improve Ito’s overallperformance more significantly, they chose all of the Ito’s matches withright-handed players for further simulative analysis.
Thereafter, the experts turned to the tactic view to browse Ito’stactics. As they indicated, the tactics used in the serve phase (i.e.,the first three strokes of a rally) are the focal points in performanceanalysis. Therefore, they directly examined the tactics in the servephase specified by the stroke technique. They sorted all tactics by theirscoring rates and only showed those whose utilization rates are morethan 1% through the slider to immediately identify the highly significanttactics (Fig. 7(A1)). According to the four tactics (Fig. 7(A2)), theexperts found that in most of the tactics, Ito’s opponents’ techniquefor receive is push, a control technique whereas Ito’s third technique istopspin, an offensive technique. This matched the experts’ hypothesisabout Ito’s playing style. The expert further explained that this meansafter Ito serves, she tends to attack at first. However, the scoring ratesof these tactics were inversely proportional to the utilization rates,which means Ito’s performance in the serve phase is poor and can bea breakthrough point for improving her performance. Therefore, theexperts further selected these tactics for adjustments.
In the simulation view (exploration mode), the experts expected toadjust strokes from the perspective of stroke placement. They acti-vated the stroke placement and let the system generate the optimumadjustment strategies. The results consisting of a single adjustmentindicates that the effect (winning rate) of the adjustment applied tothe third stroke (Fig. 7(B2)) is much larger than that of the adjustmentapplied to the first stroke (Fig. 7(B3)). This confirmed the experts’knowledge. The experts explained that this is because the influenceof the first stroke on the final result is limited. Thus, no matter whichattributes we adjust at the first stroke, the final winning rate will notbe obviously affected. Hence, the experts paid attention to the otheroptimum strategy (Fig. 7(B2)). They found that the original scoringrate of the optimum adjustment at the third stroke (Fig. 7(B1)) is notthe highest among all adjustments with the same technique (Fig. 7(B4)).
This is a new insight for the experts. Therefore, they added the ad-justment with the highest scoring rate to the evaluation component(Fig. 7(B5)). They noticed that the effect (winning rate) of the newlyadded adjustment (Fig. 7(B2) is almost the same as the optimum one(Fig. 7(B5)). However, considering the adjustability, they eventuallychose the optimum adjustment.
To figure out the influence and the implementation of the optimumadjustment, the experts turned to the explanation mode. They noticedthat this adjustment mostly affects the fifth stroke (the solid line to thefifth stroke is thicker than that of the fourth line (Fig. 7(C2)). In the fifthstroke, Ito is most likely to use quick attack to match the quick attackof the adjustment (Fig. 7(C5)). The experts further clicked the quickattack in the fifth stroke and found the placement of the strokes hit byquick attack is also long backhand, the same as that of the adjustment(Fig. 7(C3)). They commented that this conclusion could hardly beobtained in the past without this system. They further concluded thatthis adjustment improves Ito’s performance by increasing Ito’s tactic,consecutive quick attack to long backhand. This tactic should beone of Ito’s dominant tactics. As for the implementation, the expertsinspected the second stroke (the dashed line from the second strokeis thicker than that from the first stroke (Fig. 7(C1)). As Fig. 7(C4)shows, the adjustment can be achieved mostly after Ito’s opponentsemploy offensive techniques (i.e., topspin and flick) at the second stroke.According to the experts, this suggests that Ito can still take back theinitiative through the dominant tactic even her opponents attack at first,which matched the experts’ knowledge about Ito’ s playing style.
Through this case study, the experts concluded that coaches can focuson training Ito’s tactic, consecutive quick attack to long backhandat the third stroke of her serve rallies to improve her performance.
6.3 Insight 2: Topspin to Long Forehand is the Key to Re-ceive Rallies for Ding Ning.
This case study mainly focuses on improving Ding Ning’s performanceby adjusting her receive rallies. Ding Ning is the top table tennis playerin the world and thus, the experts are also interested in her matches.
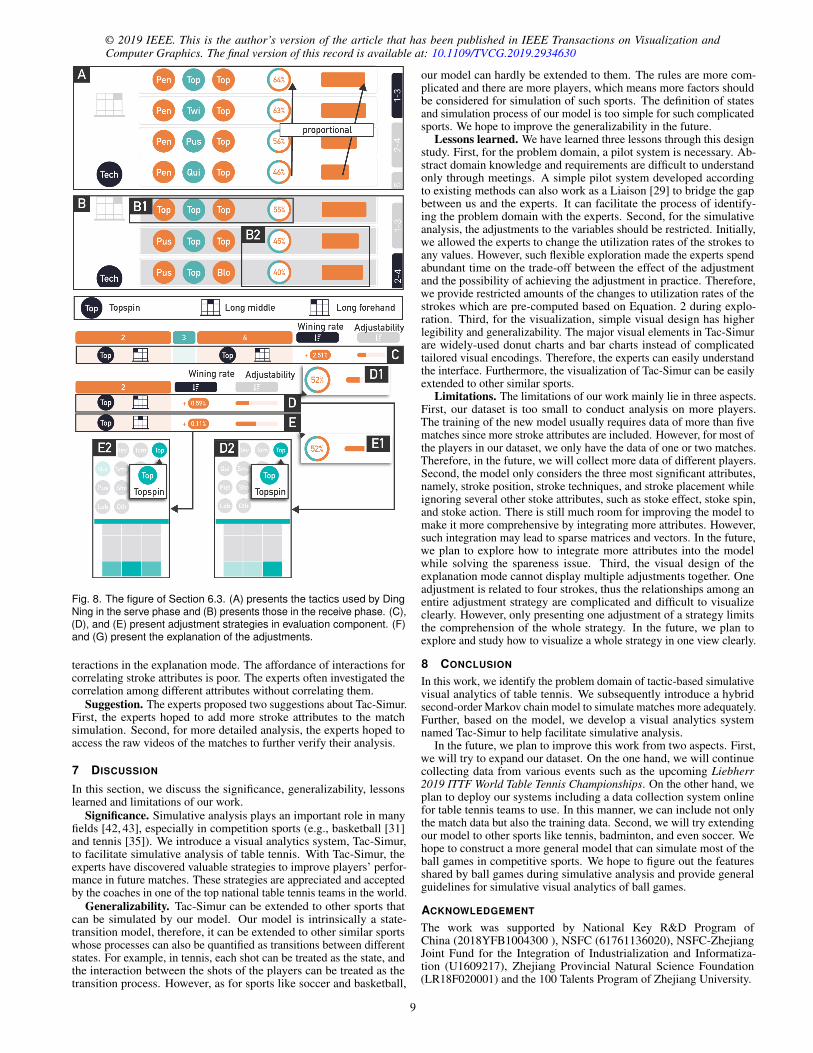
The experts chose Ding Ning to examine her matches. Since thereare only 7 matches of Ding Ning, they decided to analyze all matchesof Ding Ning. In the tactic view, they also first examined Ding’s tacticsin serve rallies from the perspective of the stroke technique. Similarly,they sorted the tactics based on the scoring rates and only showed thetactics whose utilization rates are more than 1%. As Fig. 8(A) shows,the scoring rates of all tactics are proportional to their utilization ratesand most of the scoring rates are larger than 50%. The experts agreedwith this result and explained that Ding performs well during her servephase, thus, there is little space to improve Ding’s performance in herserve phase. Thereafter, they turned to Ding’s receive phase of receiverallies with the same sorting and filtering conditions. As Fig. 8(B)shows, Ding’s tactics in the receive phase are worse compared to thosein the serve phase since the scoring rates of most of her tactics hereare less than 50% (Fig. 8(B2)). This result also matched the experts’knowledge about Ding Ning. They explained that Ding often usespush, a control technique while receiving the serve of her opponents,which means Ding often fails to attack at first and loses the initiative.They decided to take these tactics as a breakthrough to improve Ding’sperformance and chose all these tactics.
The experts activated the stroke placement in the simulation viewand let the system generate the optimum strategies at first. Accordingto the strategies consisting of two adjustments (Fig. 8(C)), if Ding canuse topspin, an offensive technique, while receiving the serve and keepusing topspin afterward more often, she can significantly enhance herwinning rates. The experts agreed with this strategy since consecutivetopspin within receive rallies is the tactic with highest scoring rates(Fig. 8(B1)). However, the optimum strategy consisting of a singleadjustment at the second stroke (Fig. 8(D)) confused them. There isan adjustment that shares the same stroke technique and scoring ratewith the optimum one and has higher adjustability in the option list(Fig. 8(E, E1)) but it is not the optimum adjustment. To figure out thereason, they added this adjustment to the evaluation component.
In the explanation component, the experts examined the influencesof the two adjustments separately. They noticed that the differencesbetween the two adjustments mainly lie in their individual influences to
Fig. 7. The figure of Section 6.2. (A) presents the tactics used by ItoMima in the serve phase. (B) presents the adjustment strategies in theevaluation component. (C) presents explanation of the adjustments.
the third stroke. If Ding hits the ball to long middle, then her opponentswill hit back to long middle ((Fig. 8(E2))) while if Ding hits the ballto long forehand, then her opponents will hit back to long forehand(Fig. 8(D2)). This is a new insight for the experts. The experts explainedthat the power of topspin of Ding can be enhanced if it is used to receivethe ball hit to forehand. Therefore, the stroke hit to long forehand willperform better than that hit to long middle.
Through this case, the experts concluded that coaches can focuson training Ding to receive her opponents’ serve by topspin to longforehand to improve her performance.
6.4 Expert FeedbackWe interviewed the experts individually after each case study andsummarized their feedback as follows.
Usability. According to the experts, Tac-Simur significantly facili-tates their analysis. Expert A appreciated the exploration mode mostbecause the combination of multiple stroke attributes within the ad-justments expands their exploration space. As for expert B, the visualexplanation of the simulation process impresses him most. He couldfigure out not only why particular adjustment performs well/poorly,but also how to achieve a particular adjustment. However, the expertsalso mentioned two limitations of Tac-Simur during the case studies.First, the icon of stroke position is not friendly for all users. One ofthe experts often forgot the exact meaning of each icon due to his habitof swinging the racket which is different from that of others. He oftenasked our experimenter for confirmation. After using the system fora while, He remembered the encodings eventually. The second is in-
Fig. 8. The figure of Section 6.3. (A) presents the tactics used by DingNing in the serve phase and (B) presents those in the receive phase. (C),(D), and (E) present adjustment strategies in evaluation component. (F)and (G) present the explanation of the adjustments.
teractions in the explanation mode. The affordance of interactions forcorrelating stroke attributes is poor. The experts often investigated thecorrelation among different attributes without correlating them.
Suggestion. The experts proposed two suggestions about Tac-Simur.First, the experts hoped to add more stroke attributes to the matchsimulation. Second, for more detailed analysis, the experts hoped toaccess the raw videos of the matches to further verify their analysis.
7 DISCUSSION
In this section, we discuss the significance, generalizability, lessonslearned and limitations of our work.
Significance. Simulative analysis plays an important role in manyfields [42, 43], especially in competition sports (e.g., basketball [31]and tennis [35]). We introduce a visual analytics system, Tac-Simur,to facilitate simulative analysis of table tennis. With Tac-Simur, theexperts have discovered valuable strategies to improve players’ perfor-mance in future matches. These strategies are appreciated and acceptedby the coaches in one of the top national table tennis teams in the world.
Generalizability. Tac-Simur can be extended to other sports thatcan be simulated by our model. Our model is intrinsically a state-transition model, therefore, it can be extended to other similar sportswhose processes can also be quantified as transitions between differentstates. For example, in tennis, each shot can be treated as the state, andthe interaction between the shots of the players can be treated as thetransition process. However, as for sports like soccer and basketball,
our model can hardly be extended to them. The rules are more com-plicated and there are more players, which means more factors shouldbe considered for simulation of such sports. The definition of statesand simulation process of our model is too simple for such complicatedsports. We hope to improve the generalizability in the future.
Lessons learned. We have learned three lessons through this designstudy. First, for the problem domain, a pilot system is necessary. Ab-stract domain knowledge and requirements are difficult to understandonly through meetings. A simple pilot system developed accordingto existing methods can also work as a Liaison [29] to bridge the gapbetween us and the experts. It can facilitate the process of identify-ing the problem domain with the experts. Second, for the simulativeanalysis, the adjustments to the variables should be restricted. Initially,we allowed the experts to change the utilization rates of the strokes toany values. However, such flexible exploration made the experts spendabundant time on the trade-off between the effect of the adjustmentand the possibility of achieving the adjustment in practice. Therefore,we provide restricted amounts of the changes to utilization rates of thestrokes which are pre-computed based on Equation. 2 during explo-ration. Third, for the visualization, simple visual design has higherlegibility and generalizability. The major visual elements in Tac-Simurare widely-used donut charts and bar charts instead of complicatedtailored visual encodings. Therefore, the experts can easily understandthe interface. Furthermore, the visualization of Tac-Simur can be easilyextended to other similar sports.
Limitations. The limitations of our work mainly lie in three aspects.First, our dataset is too small to conduct analysis on more players.The training of the new model usually requires data of more than fivematches since more stroke attributes are included. However, for most ofthe players in our dataset, we only have the data of one or two matches.Therefore, in the future, we will collect more data of different players.Second, the model only considers the three most significant attributes,namely, stroke position, stroke techniques, and stroke placement whileignoring several other stoke attributes, such as stoke effect, stoke spin,and stoke action. There is still much room for improving the model tomake it more comprehensive by integrating more attributes. However,such integration may lead to sparse matrices and vectors. In the future,we plan to explore how to integrate more attributes into the modelwhile solving the spareness issue. Third, the visual design of theexplanation mode cannot display multiple adjustments together. Oneadjustment is related to four strokes, thus the relationships among anentire adjustment strategy are complicated and difficult to visualizeclearly. However, only presenting one adjustment of a strategy limitsthe comprehension of the whole strategy. In the future, we plan toexplore and study how to visualize a whole strategy in one view clearly.
8 CONCLUSION
In this work, we identify the problem domain of tactic-based simulativevisual analytics of table tennis. We subsequently introduce a hybridsecond-order Markov chain model to simulate matches more adequately.Further, based on the model, we develop a visual analytics systemnamed Tac-Simur to help facilitate simulative analysis.
In the future, we plan to improve this work from two aspects. First,we will try to expand our dataset. On the one hand, we will continuecollecting data from various events such as the upcoming Liebherr2019 ITTF World Table Tennis Championships. On the other hand, weplan to deploy our systems including a data collection system onlinefor table tennis teams to use. In this manner, we can include not onlythe match data but also the training data. Second, we will try extendingour model to other sports like tennis, badminton, and even soccer. Wehope to construct a more general model that can simulate most of theball games in competitive sports. We hope to figure out the featuresshared by ball games during simulative analysis and provide generalguidelines for simulative visual analytics of ball games.
ACKNOWLEDGEMENT
The work was supported by National Key R&D Program ofChina (2018YFB1004300 ), NSFC (61761136020), NSFC-ZhejiangJoint Fund for the Integration of Industrialization and Informatiza-tion (U1609217), Zhejiang Provincial Natural Science Foundation(LR18F020001) and the 100 Talents Program of Zhejiang University.
[1] R. Y. S. Aoki, R. M. Assuncao, and P. O. S. V. de Melo. Luck is Hardto Beat: The Difficulty of Sports Prediction. In Proceedings of the 23rdACM SIGKDD International Conference on Knowledge Discovery andData Mining, pages 1367–1376, 2017.
[2] D. Cervone, A. D’Amour, L. Bornn, and K. Goldsberry. POINTWISE:Predicting Points and Valuing Decisions in Real Time with NBA OpticalTracking Data. In Proceedings of MIT Sloan Sports Analytics Conference,2014.
[3] S. Chen and T. Joachims. Predicting Matchups and Preferences in Context.In Proceedings of the 22nd ACM SIGKDD International Conference onKnowledge Discovery and Data Mining, pages 775–784, 2016.
[4] W. Chen, T. Lao, J. Xia, X. Huang, B. Zhu, W. Hu, and H. Guan. Game-Flow: Narrative Visualization of NBA Basketball Games. IEEE Transac-tions on Multimedia, 18(11):2247–2256, 2016.
[5] W. K. Ching, E. S.Fung, and M. K. Ng. Higher-Order Markov Chain Mod-els for Categorical Data Sequences. Naval Research Logistics, 51(4):557–574, 2004.
[6] P. O. S. V. de Melo, V. A. F. Almeida, A. A. F. Loureiro, and C. Faloutsos.Forecasting in the NBA and Other Team Sports: Network Effects in Action.ACM Transactions on Knowledge Discovery from Data, 6(3):13:1–13:27,2012.
[7] C. A. Dietrich, D. Koop, H. T. Vo, and C. T. Silva. Baseball4D: A Tool forBaseball Game Reconstruction and Visualization. In Proceedings of IEEEConference on Visual Analytics Science and Technology, pages 23–32,2014.
[8] M. Fuchs, R. Liu, I. M. Lanzoni, G. Munivrana, G. Straub, S. Tamaki,K. Yoshida, H. Zhang, and M. Lames. Table Tennis Match Analysis: AReview. Journal of Sports Sciences, 36(23):2653–2662, 2018.
[9] A. Gabel and S. Redner. Random Walk Picture of Basketball Scoring.Journal of Quantitative Analysis in Sports, 8(1):1–20, 2012.
[10] K. Goldsberry. Courtvision: New Visual and Spatial Analytics for theNBA. In Proceedings of MIT Sloan Sports Analytics Conference, 2012.
[11] M. Lage, J. P. Ono, D. Cervone, J. Chiang, C. A. Dietrich, and C. T. Silva.StatCast Dashboard: Exploration of Spatiotemporal Baseball Data. IEEEComputer Graphics and Applications, 36(5):28–37, 2016.
[12] M. Lames. Leistungsdiagnostik durch Computersimulation: ein Beitragzur Theorie der Sportspiele am Beispiel Tennis. Deutsch Harri GmbH,Frankfurt, 1991.
[13] I. M. Lanzoni, R. D. Michele, and F. Merni. Technical and TacticalPerformance of Top-Class Senior, Junior and Cadet Table Tennis Players.International Journal of Table Tennis Sciences, 8:80–85, 2013.
[14] P. A. Legg, D. H. S. Chung, M. L. Parry, M. W. Jones, R. Long, I. W.Griffiths, and M. Chen. MatchPad: Interactive Glyph-Based Visualizationfor Real-Time Sports Performance Analysis. Computer Graphics Forum,31(3):1255–1264, 2012.
[15] D. Liu, D. Weng, Y. Li, J. Bao, Y. Zheng, H. Qu, and Y. Wu. Smartadp:Visual analytics of large-scale taxi trajectories for selecting billboardlocations. IEEE Transactions on Visualization and Computer Graphics,23(1):1–10, 2017.
[16] A. G. Losada, R. Theron, and A. Benito. BKViz: A Basketball VisualAnalysis Tool. IEEE Computer Graphics and Applications, 36(6):58–68,2016.
[17] Y. Lu, R. Garcia, B. Hansen, M. Gleicher, and R. Maciejewski. The State-of-the-Art in Predictive Visual Analytics. Computer Graphics Forum,36(3):539–562, 2017.
[18] S. Merritt and A. Clauset. Scoring Dynamics Across Professional TeamSports: Tempo, Balance and Predictability. EPJ Data Science, 3(1):4,2014.
[19] A. W. Y. Ng and A. H. S. Chan. Visual and cognitive features on iconeffectiveness. In Proceedings of the International MultiConference ofEngineers and Computer Scientists, volume 2, pages 19–21, 2008.
[20] J. P. Ono, C. A. Dietrich, and C. T. Silva. Baseball Timeline: SummarizingBaseball Plays Into a Static Visualization. Computer Graphics Forum,37(3):491–501, 2018.
[21] L. Peel and A. Clauset. Predicting Sports Scoring Dynamics with Restora-tion and Anti-Persistence. In Proceedings of IEEE International Confer-ence on Data Mining, pages 339–348, 2015.
[22] C. Perin, R. Vuillemot, and J.-D. Fekete. SoccerStories: A Kick-off forVisual Soccer Analysis. IEEE Transactions on Visualization and ComputerGraphics, 19(12):2506–2515, 2013.
[23] C. Perin, R. Vuillemot, C. D. Stolper, J. T. Stasko, J. Wood, and S. Carpen-
dale. State of the Art of Sports Data Visualization. Computer GraphicsForum, 37(3):663–686, 2018.
[24] M. Pfeiffer, H. Zhang, and A. Hohmann. A Markov Chain Model of EliteTable Tennis Competition. International Journal of Sports Science andCoaching, 5(2):205–222, 2010.
[25] H. Pileggi, C. D. Stolper, J. M. Boyle, and J. T. Stasko. SnapShot: Visual-ization to Propel Ice Hockey Analytics. IEEE Transactions on Visualiza-tion and Computer Graphics, 18(12):2819–2828, 2012.
[26] T. Polk, J. Yang, Y. Hu, and Y. Zhao. TenniVis: Visualization for Ten-nis Match Analysis. IEEE Transactions on Visualization and ComputerGraphics, 20(12):2339–2348, 2014.
[27] F. Pradas, P. Martınez, M. Rapun, V. Bataller, C. Castellar, and L. Carrasco.Assessment of Table Tennis Temporary Structure. In Proceedings of the12th ITTF Sports Science Congress, pages 80–85, 2011.
[28] A. E. Raftery. A Model for High-Order Markov Chains. Journal ofthe Royal Statistical Society: Series B (Methodological), 47(3):528–539,1985.
[29] S. Simon, S. Mittelstadt, D. A. Keim, and M. Sedlmair. Bridging the gapof domain and visualization experts with a liaison. In Accepted at theEurographics Conference on Visualization (EuroVis 2015, Short Paper),volume 2015, pages 127–131. The Eurographics Association, 2015.
[30] S. Tamaki, K. Yoshida, and K. Yamada. A Shot Number Based Approachto Performance Analysis in Table Tennis. Journal of Human Kinetics,55(1):7–18, 2017.
[31] P. Vracar, E. Strumbelj, and I. Kononenko. Modeling basketball play-by-play data. Expert Systems with Applications, 44:58–66, 2016.
[32] W. Wang, J. Zhang, X. Yuan, and S. Liu. Matchorchestra: a generalizedvisual analytics for competitive team sports. Journal of Visualization,19(3):515–528, 2016.
[33] X. Wei, P. Lucey, S. Morgan, P. Carr, M. Reid, and S. Sridharan. PredictingServes in Tennis Using Style Priors. In Proceedings of the 21th ACMSIGKDD International Conference on Knowledge Discovery and DataMining, pages 2207–2215, 2015.
[34] X. Wei, P. Lucey, S. Morgan, and S. Sridharan. Predicting Shot Locationsin Tennis Using Spatiotemporal Data. In Proceedings of 2013 InternationalConference on Digital Image Computing: Techniques and Applications,pages 1–8, 2013.
[35] X. Wei, P. Lucey, S. Morgan, and S. Sridharan. “Sweet-Spot”: Using Spa-tiotemporal Data to Discover and Predict Shots in Tennis. In Proceedingsof MIT Sloan Sports Analytics Conference, 2013.
[36] D. Weng, R. Chen, Z. Deng, F. Wu, J. Chen, and Y. Wu. Srvis: Towardsbetter spatial integration in ranking visualization. IEEE Transactions onVisualization and Computer Graphics, 25(1):459–469, 2018.
[37] D. Weng, H. Zhu, J. Bao, Y. Zheng, and Y. Wu. Homefinder revisited:Finding ideal homes with reachability-centric multi-criteria decision mak-ing. In Proceedings of the 2018 CHI Conference on Human Factors inComputing Systems, pages 247:1–247:12, 2018.
[38] S. Wenninger and M. Lames. Performance Analysis in Table Tennis -Stochastic Simulation by Numerical Derivation. International Journal ofComputer Science in Sport, 15(1):22–36, 2016.
[39] H. Wu, Z. Li, Z. Tao, W. Ding, and J. Zhou. Methods of Actual StrengthEvaluation and Technical Diagnosis in Table Tennis Match. Journal ofNational Research Institute of Sports Science, 1:32–41, 1989.
[40] Y. Wu, J. Lan, X. Shu, C. Ji, K. Zhao, J. Wang, and H. Zhang. iTTVis:Interactive Visualization of Table Tennis Data. IEEE Transactions onVisualization and Computer Graphics, 24(1):709–718, 2018.
[41] Y. Wu, X. Xie, J. Wang, D. Deng, H. Liang, H. Zhang, S. Cheng, andW. Chen. ForVizor: Visualizing Spatio-Temporal Team Formations inSoccer. IEEE Transactions on Visualization and Computer Graphics,25(1):65–75, 2019.
[42] M. Xu, Z. Pan, M. Zhang, P. Lv, P. Zhu, Y. Ye, and W. Song. Charac-ter behavior planning and visual simulation in virtual 3d space. IEEEMultimedia, 20(1):49–59, 2013.
[43] M. Xu, H. Wang, S. Chu, Y. Gan, X. Jiang, Y. Li, and B. Zhou. Traffic sim-ulation and visual verification in smog. ACM Transactions on IntelligentSystems and Technology, 10(1):3:1–3:17, 2019.
[44] H. Zhang. Leistungsdiagnostik im Tischtennis. Verlag Dr. Kovac, Hamburg,1 edition, 2006.
[45] H. Zhang, W. Liu, J. Hu, and R. Liu. Evaluation of Elite Table TennisPlayers’ Technique Effectiveness. Journal of Sports Sciences, 31(14):1526–1534, 2013.
[46] H. Zhang, L. Yu, and J. Hu. Computer-aided Game Analysis of Net Sportsin Preparation of Chinese Teams for Beijing Olympics. International
Journal of Computer Science in Sport, 9(3):53–69, 2010.[47] H. Zhang and Z. Zhou. Two-factor combination analysis model of the first
four strokes for elite shake-hand table tennis players and its application.Journal of Shenyang Sport University, 36(6):115–124, 2017.
[48] M. Zhang, L. Chen, X. Yuan, R. Huang, S. Liu, and J. Yong. Visualizationof technical and tactical characteristics in fencing. Journal of Visualization,22(1):109–124, 2019.