84
TACB TESTING OF ASPHALTIC CONCRETE PLANT STACK EMISSIONS WOOD MATERIAL SUPPLY INC. CONROE, TEXAS JULY 1987 . NUS PROJECT NUMBER Y963 A Halliburton Company
TACB TESTING
OF
ASPHALTIC CONCRETE PLANT STACK EMISSIONS
WOOD MATERIAL SUPPLY INC.
CONROE, TEXAS
JULY 1987
. NUS PROJECT NUMBER Y963
A Halliburton Company
I
Prepared By:
TACB TESTING
OF
ASPHALTIC CONCRETE PLANT STACK EMISSIONS
WOOD MATERIAL SUPPLY INC.
CONROE, TEXAS
JULY 1987
NUS PROJECT NUMBER Y963
1 I
William J. Cole, P.E. 1 1 I Senior Project Manager
Approved By:
Calvin L. Spencer, P.E.
Manager - Industrial Programs
Waste Management Services Group
t CORPORATION 16360 PARK TEN PLACE, SUITE 300 HOUSTON. TEXAS 77084 71 3-462-1 888
C-34-8-7-066H August 27,1987
Mr. Paul Wood Wood Material Supply, Inc. 2338 Sleepy Hollow Road Conroe, Texas 77358
Subject: Hot Mix Asphalt Concrete Plant 100 South Second Street, Conroe Montgomery County, Texas NUS Project Number: Y963
Dear Mr. Wood:
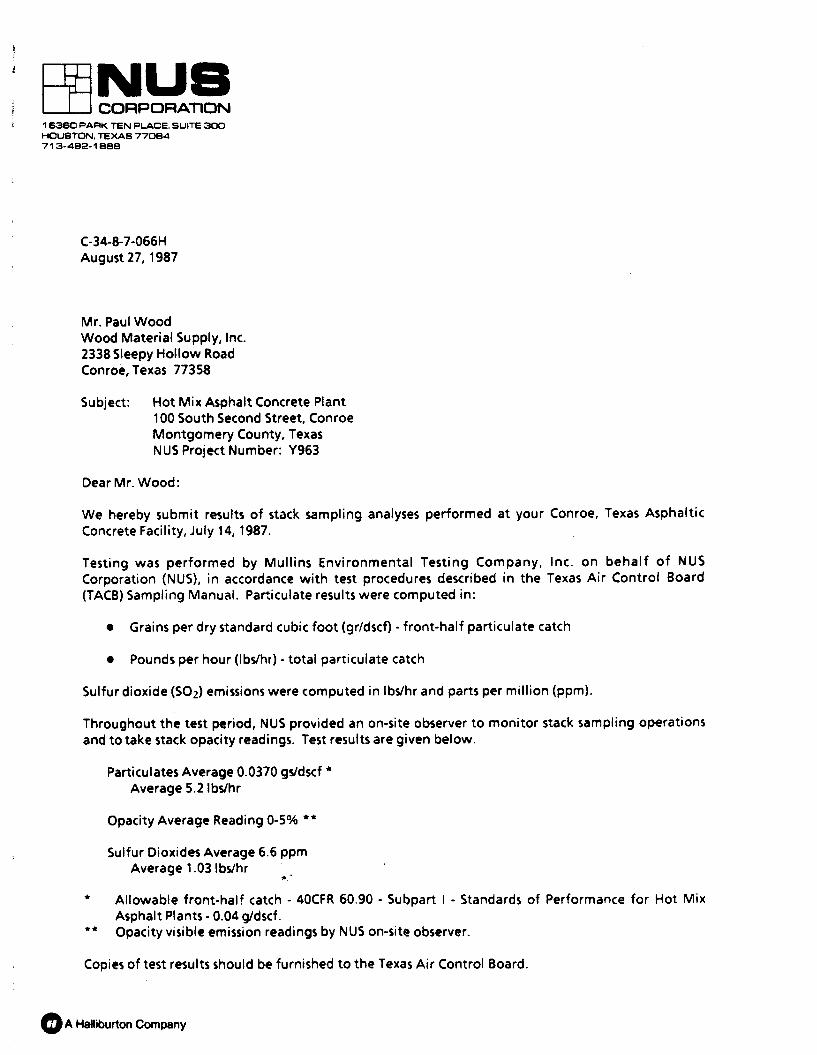
We hereby submit results of stack sampling analyses performed at your Conroe, Texas Asphaltic Concrete Facility, July 14, 1987.
Testing was performed by Mullins Environmental Testing Company, Inc. on behalf of NUS Corporation (NUS), in accordance with test procedures described in the Texas Air Control Board (TACB) Sampling Manual. Particulate results were computed in:
Grains per dry standard cubic foot (grfdscfl - front-half particulate catch
Pounds per hour (Ibs/hr) - total particulate catch
Sulfur dioxide (SO2) emissions were computed in Ibs/hr and parts per million (pprn).
Throughout the test period, NUS provided an on-site observer to monitor stack sampling operations and to take stack opacity readings. Test results are given below.
Particulates Average 0.0370 gs/dscf Average 5.2 Ibsfhr
Opacity Average Reading 0-5% +*
Sulfur Dioxides Average 6.6 ppm Average 1.03 Ibs/hr '
b
* Allowable front-half catch - 40CFR 60.90 - Subpart I - Standards of Performance for Hot Mix Asphalt Plants - 0.04 g/dscf.
* Opacity visible emission readings by NUS on-site observer.
Copies of test results should be furnished to the Texas Air Control Board.
0 A HaHibuRon Company
Mr. Paul Wood Wood Material Supply, Inc. August 27,1987 - Page 2
Please contact me at (713) 492-1888 if you have any questions concerning test results or if you istance on this project.
Senior Project Manager
NUS CORPORATIOF
This report contains results of testing performed on behalf of NUS Corporation by Mullins Environmental Testing, Inc. (METCO) at: Wood Materials Supply Inc.
Conroe, Texas July 1987
CORPORATION - 16360 PARK TEN PLACE. SUITE 300 HOUSTON. TEXAS 77084 71 3-492-1 889
@ A Wiburton Company
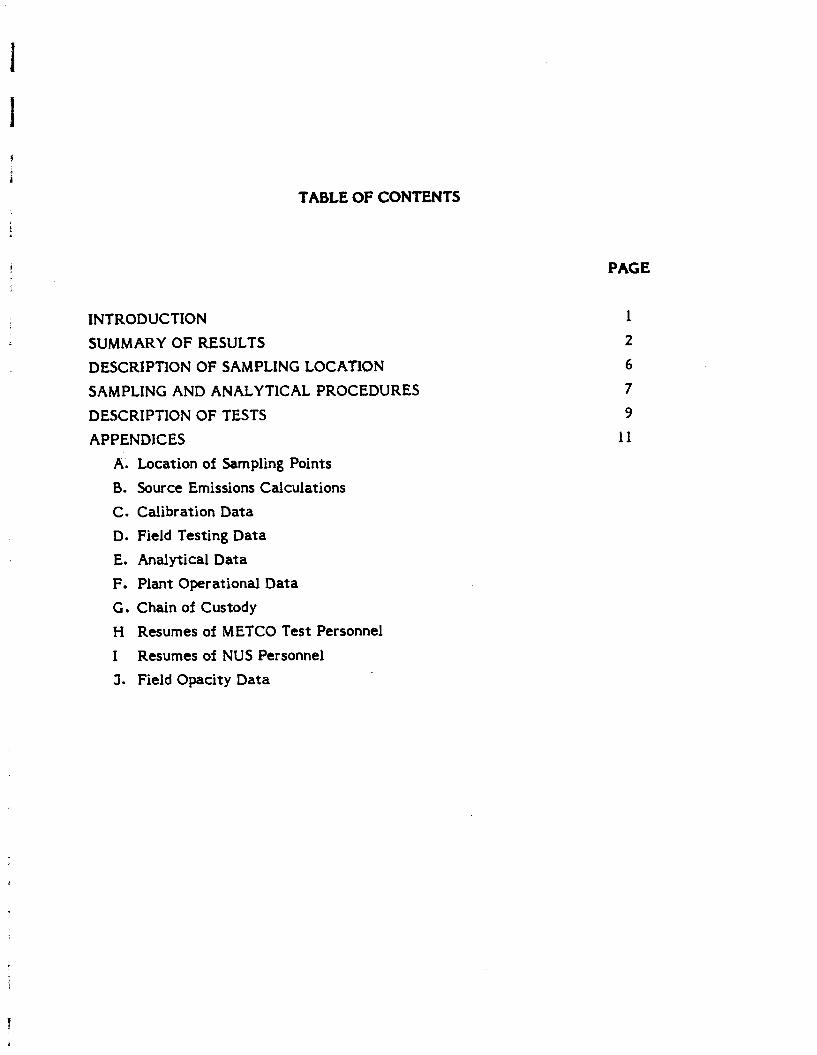
TABLE OF CONTENTS
PACE
INTRODUCTION
SUMMARY O F RESULTS
DESCRIPTION OF SAMPLING LOCATION
SAMPLING AND ANALYTICAL PROCEDURES
DESCRIPTION O F TESTS
APPENDICES
A. Location of Sampling Points
B. Source Emissions Calculations
C. Calibration Data
D. Field Testing Data
E. Analytical Data
F. Plant Operational Data
G. Chain of Custody
H Resumes of METCO Test Personnel
I Resumes of NUS Personnel
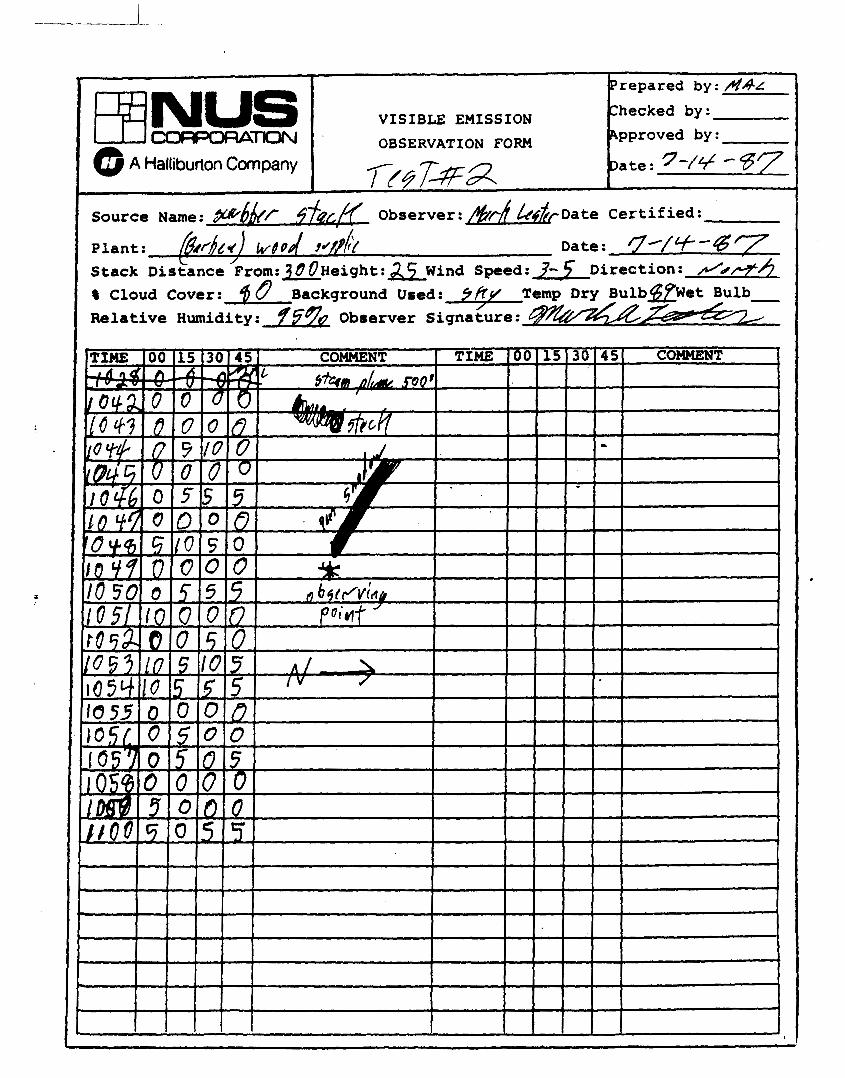
3. Field Opacity Data
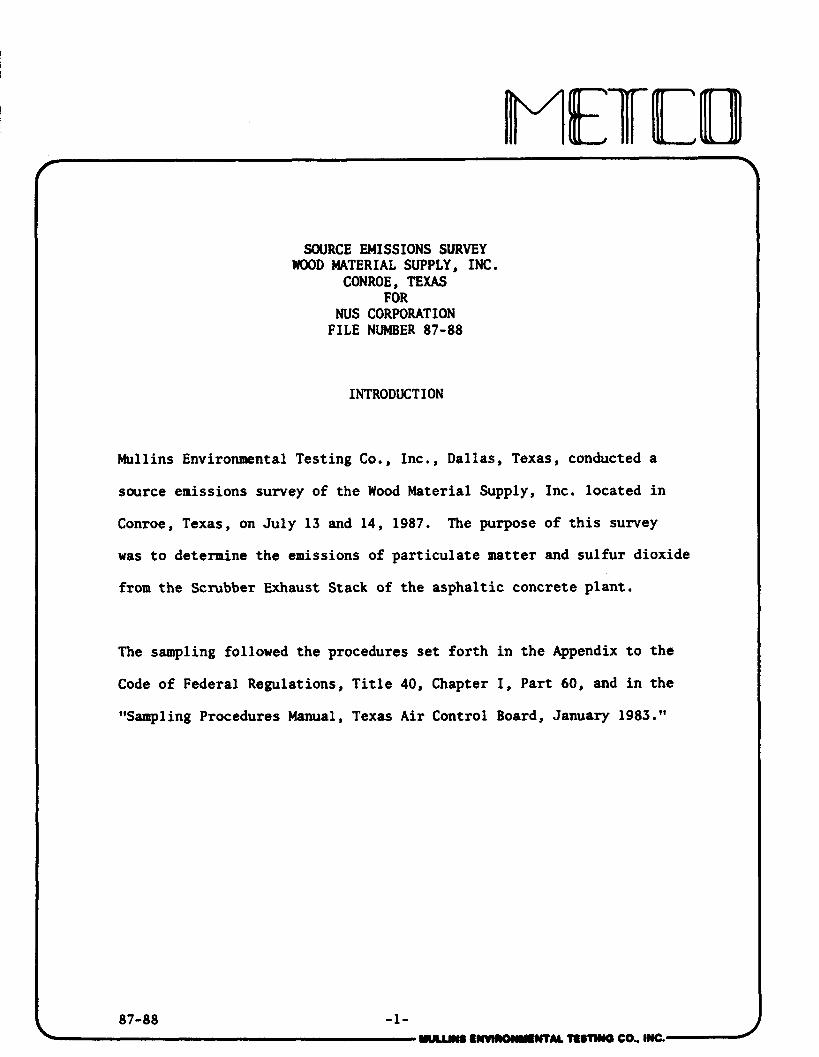
SOURCE EMISSIONS SURVEY m30D MATERIAL SUPPLY, INC.
CONROE, TEXAS FOR
NUS CORPORATION FILE NUMBER 87-88
INTRODUCTION
Mullins Environmental Testing Co., Inc., Dallas, Texas, conducted a
source emissions survey of the Wood Material Supply, Inc. located in
Conroe, Texas, on July 13 and 14, 1987. The purpose of this survey
was to determine the emissions of particulate matter and sulfur dioxide
from the Scrubber Exhaust Stack of the asphaltic concrete plant.
The sampling followed the procedures set forth in the Appendix to the
Code of Federal Regulations, Title 40, Chapter I, Part 60, and in the
"Sampling Procedures Manual, Texas Air Control Board, January 1983."
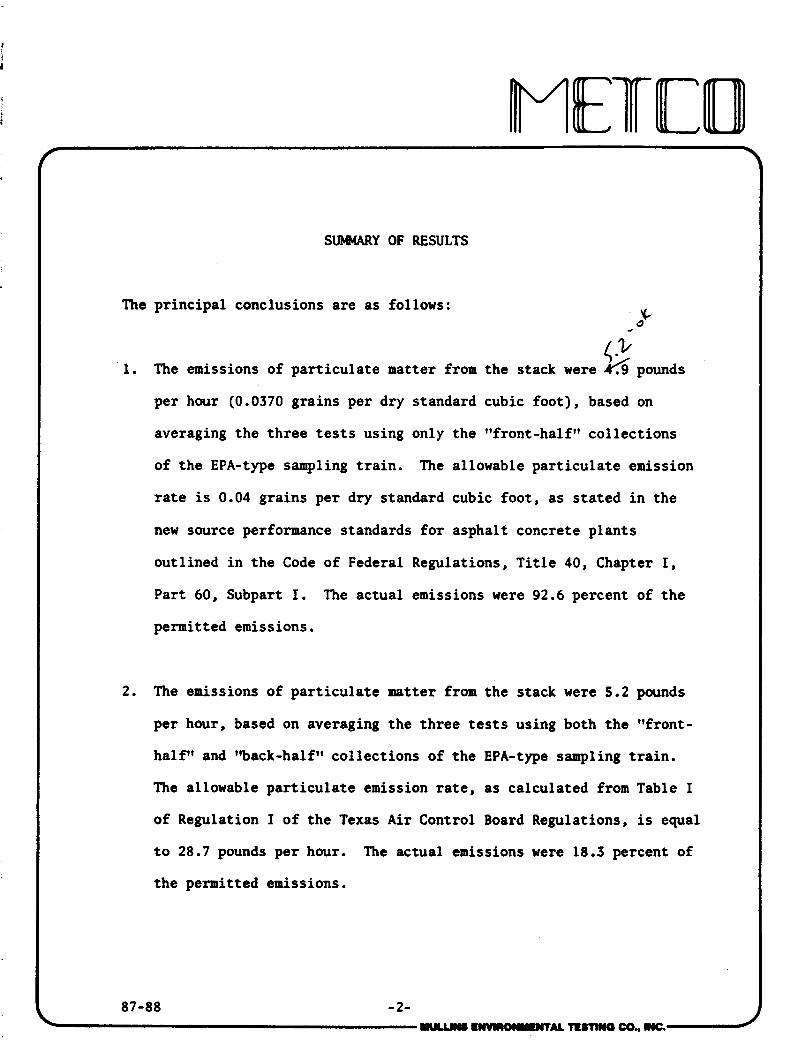
SUMWRY OF RESULTS
The pr incipal conclusions a re as follows:
<$ 1. The emissions of par t icu la te matter from the stack were 4% pounds
per hour (0.0370 grains per dry standard cubic foot) , based on
averaging the th ree t e s t s using only the "front-halftt col lect ions
of the EPA-type sampling t r a in . The allowable par t icu la te emission
r a t e is 0.04 grains per dry standard cubic foot , a s s ta ted i n the
new source performance standards f o r asphalt concrete plants
outl ined i n the Code of Federal Regulations, T i t l e 40, Chapter I ,
Part 60, Subpart I . The actual emissions were 92.6 percent of the
permitted emissions.
2. The emissions of par t icu la te matter from the stack were 5.2 pounds
per hour, based on averaging the three t e s t s using both the "front-
h a l P t and t%ack-halfu col lect ions of the EPA-type sampling t r a in .
The allowable pa r t i cu l a t e emission r a t e , as calculated from Table I
of Regulation I of the Texas A i r Control Board Regulations, is equal
t o 28.7 pounds per hour. The actual emissions were 18.3 percent of
the permitted emissions.
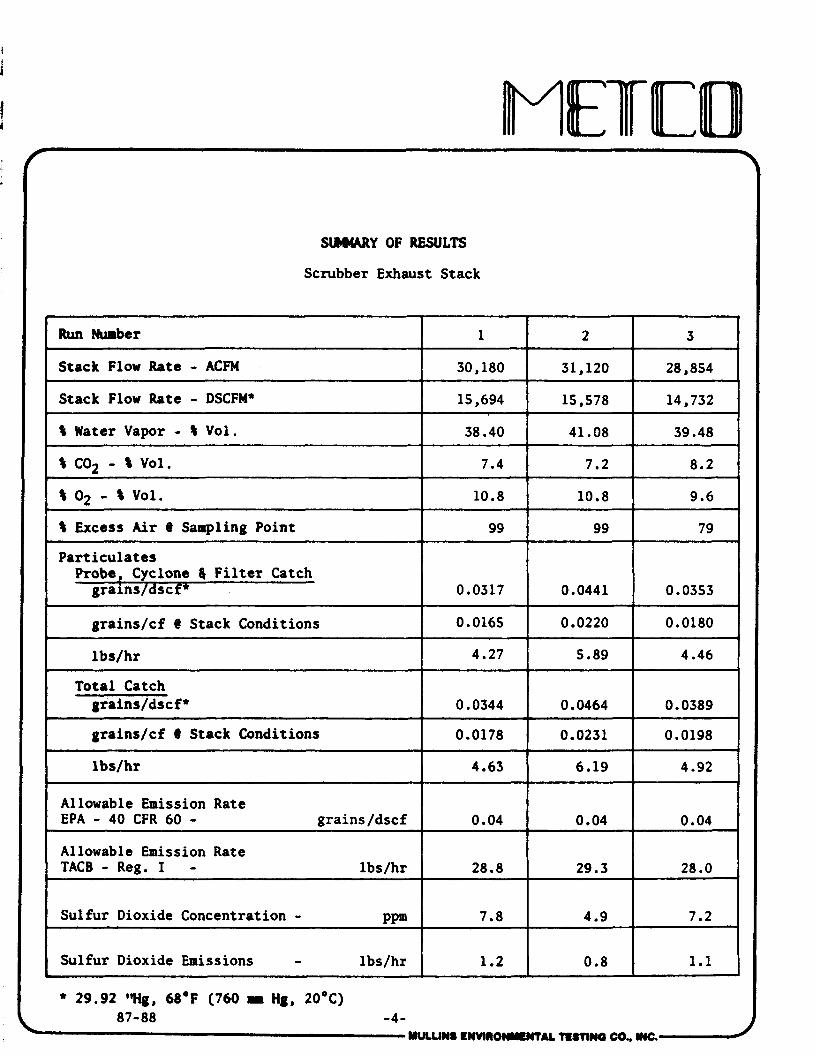
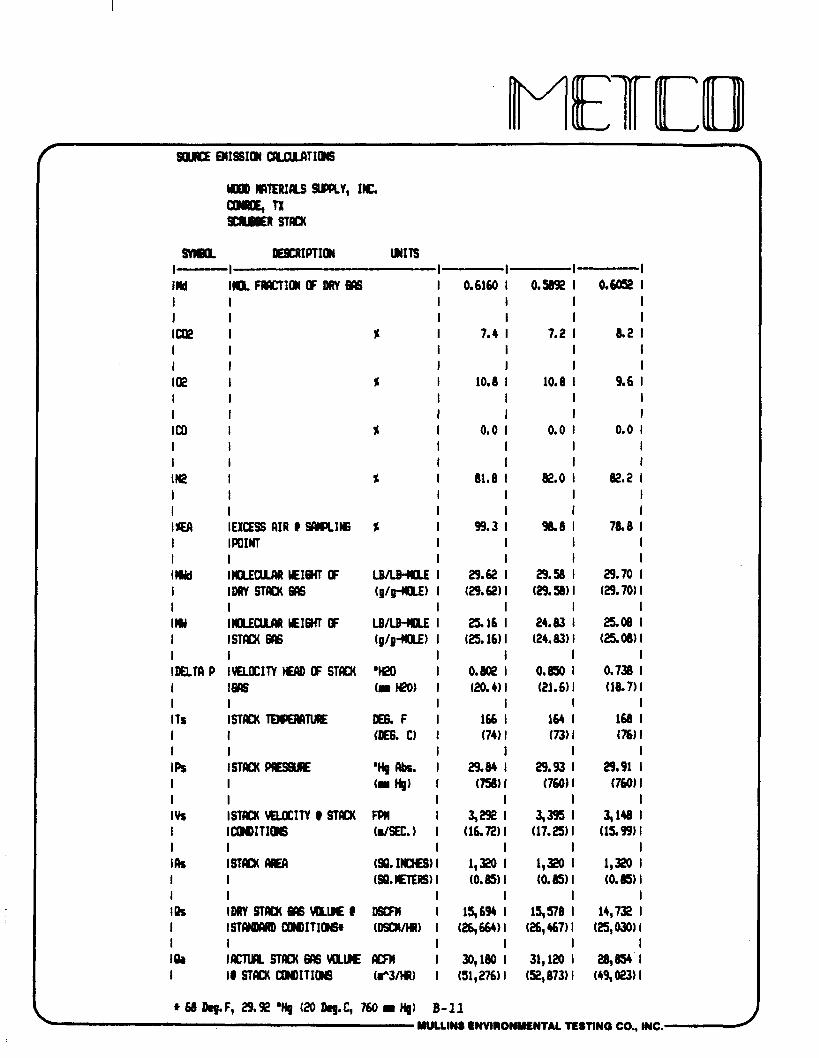
SUUARY OF RESULTS
Scrubber Exhaust Stack
29.92 Wg, 68.F (760 m Hg, 20°C) 87-88 -4-
tmum ~NWIIOWY~NTAL nanwa GO., mc.
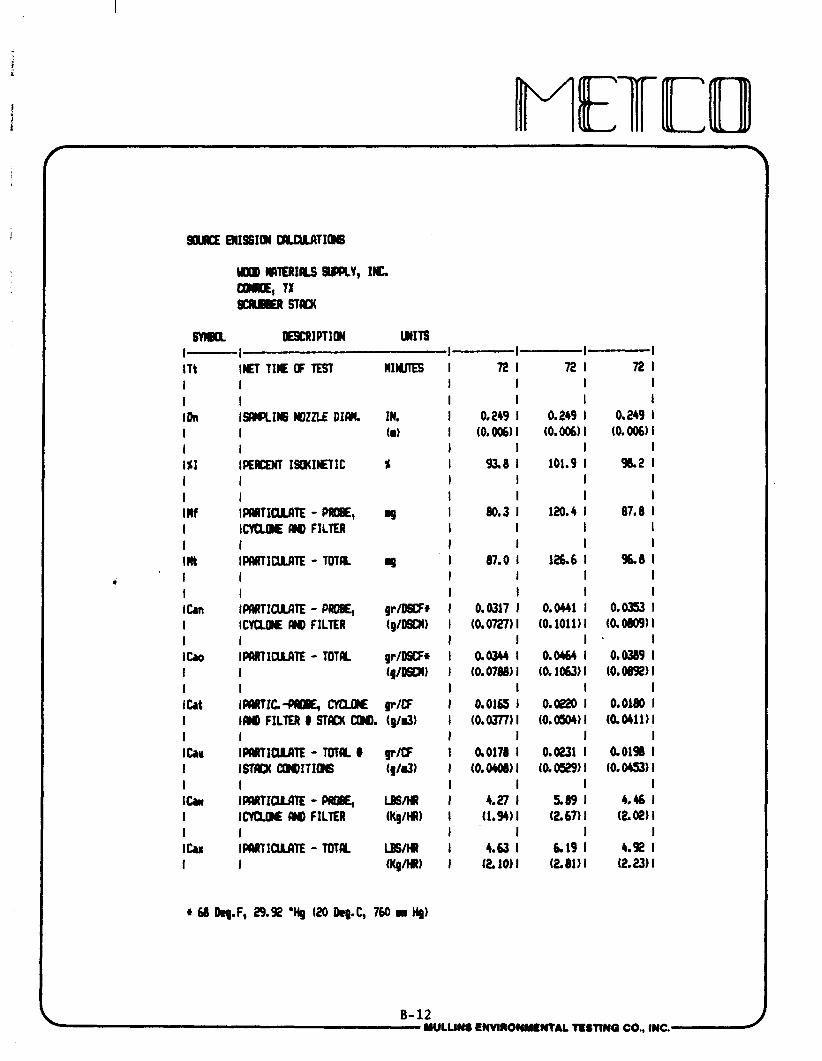
Run Number
Stack Flow Rate - ACFM
Stack Flow Rate - DSCFM* I Water Vapor - I Vol. I C02 - I Vol. I O2 - I Vol. I Excess Air 8 Sampling Point
Particulates Probe, Cyclone 4 Filter Catch grains/dsc f
grains/cf 8 Stack Conditions
lbs/hr
Total Catch grains/dscf
grains/cf @ Stack Conditions
lbslhr
Allowable Emission Rate EPA - 40 CFR 60 - grains /dscf
Allowable Emission Rate TACB - Reg. I - lbs/hr
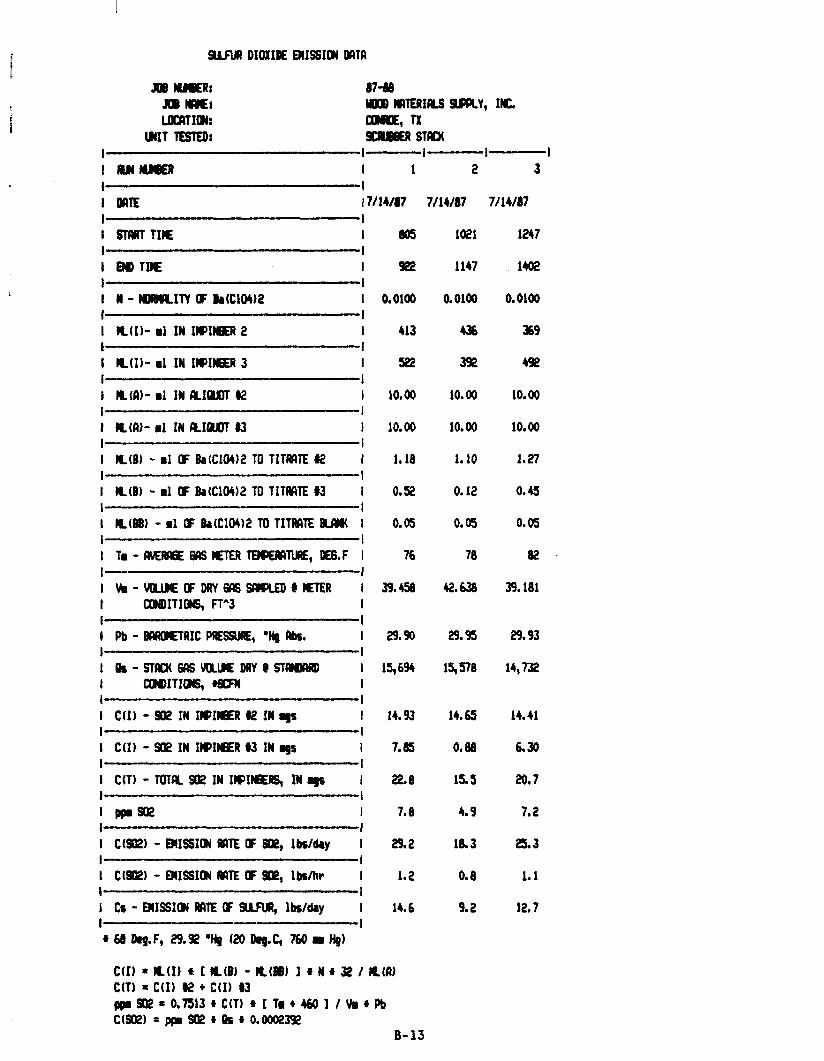
Sulfur Dioxide Concentration - PPm
Sulfur Dioxide Emissions - lbs/hr b
3
28,854
14,732
39.48
8.2
9.6
79
0.0353
0.0180
4.46
0.0389
0.0198
4.92
0.04
28.0
7.2
1.1
1
30,180
15,694
38.40
7.4
10.8
99
0.0317
0.0165
4.27
0.0344
0.0178
4.63
0.04
28.8
7.8
1.2
2
31,120
15,578
41.08
7.2
10.8
99
0.0441
0.0220
5.89
0.0464
0.0231
6.19
0.04
29.3
4.9
0.8
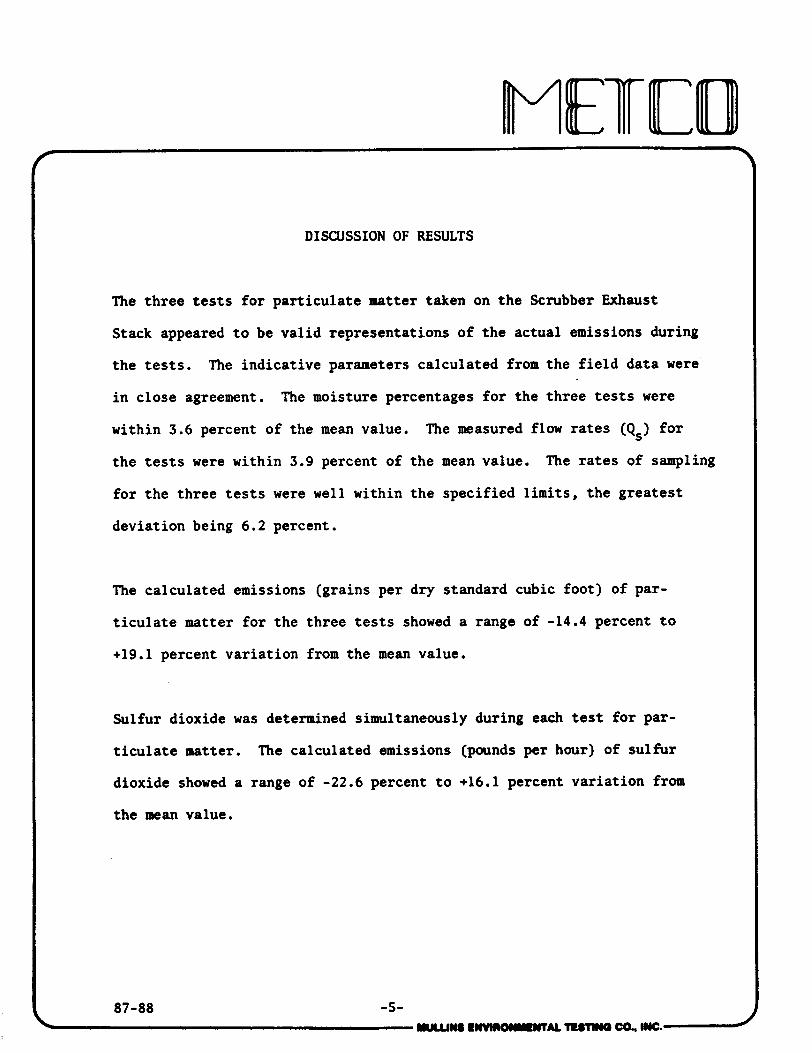
DISCUSSION OF RESULTS
The three tests for particulate matter taken on the Scrubber Exhaust
Stack appeared to be valid representations of the actual emissions during
the tests. The indicative parameters calculated from the field data were
in close agreement. The moisture percentages for the three tests were
within 3.6 percent of the mean value. The measured flow rates (QS) for
the tests were within 3.9 percent of the mean value. The rates of sampling
for the three tests were well within the specified limits, the greatest
deviation being 6.2 percent.
The calculated emissions (grains per dry standard cubic foot) of par-
ticulate matter for the three tests showed a range of -14.4 percent to
+19.1 percent variation from the mean value.
Sulfur dioxide was determined simultaneously during each test for par-
ticulate matter. The calculated emissions (pounds per hour) of sulfur
dioxide showed a range of -22.6 percent to +16.1 percent variation from
the mean value.
DESCRIPTION OF SAMPLING LOCATION
The sampling ports are located approximately 23 feet above the ground.
The sampling ports are located 8 feet 4 inches (2.44 stack diameters)
downstream from the inlet to the stack and 3 feet 6 inches (1.02 stack
diameters) upstream from the outlet of the stack.
87-88 -6- t)lVWlOrmWTAL rtmwO CO, W.
SAMPLING AND ANALYTICAL PROCEDURES
The sampling followed the procedures outlined in the Appendix to the
Code of Federal Regulations, Title 40, Chapter I, Part 60, and in the
"Sanpling Procedures Manual, Texas Air Control Board, January 1983."
A preliminary velocity traverse was made at each of the ports on the
stack, in order to determine the uniformity and magnitude of the flow
prior to testing. All points were checked for cyclonic flow and the
average angle of cyclonic flow was equal to 9.5 degrees. Twelve traverse
points were sampled from each of the two ports for a total of twenty-four
traverse points on the Scrubber Exhaust Stack. Samples of three-minute
duration were taken isokinetically at each of the twenty-four traverse
points using an EPA-type, heated, glass-lined probe.
On all tests, the sampling train was leak-checked at the nozzle at
15 inches of mercury vacuum before each test, and leak-checked at the
nozzle after each test at the highest vacuum reading recorded during
the tests. This was done to predetermine the possibility of a diluted
sample.
leaks under both a vacuum and a pressure. The lines were also checked
for clearance and the manometer was zeroed before each test.
Particulate emissions were calculated from gravimetric analysis using
both the "front-halftt and "back-halfn collections from the EPA-type
sampling train. The "back-halfv of the sampling train contained an
80-percent isopropyl alcohol solution to absorb sulfur trioxide, a
six-percent hydrogen peroxide solution to absorb sulfur dioxide, and
silica gel to absorb moisture. The isopropyl alcohol solution was
checked for hydrogen peroxide contamination and none was found.
At the conclusion of each test, the sampling train was purged for
fifteen minutes with ambient air at the same rate at which the sample
was taken.
A grab orsat sanple was taken during each test.
87-88 -8- auums rrmmmulmu rrrnno cow mc.
DESCRIPTION OF TESTS
Personnel from Mullins Environmental Testing Co., Inc. arrived at the
plant at 5:30 p.m. on Monday, July 13, 1987. Arrangements were made for
installation of monorail brackets on the stack. After the brackets were
installed, equipment was moved onto the stack and secured for the night
by 7:30 p.m.
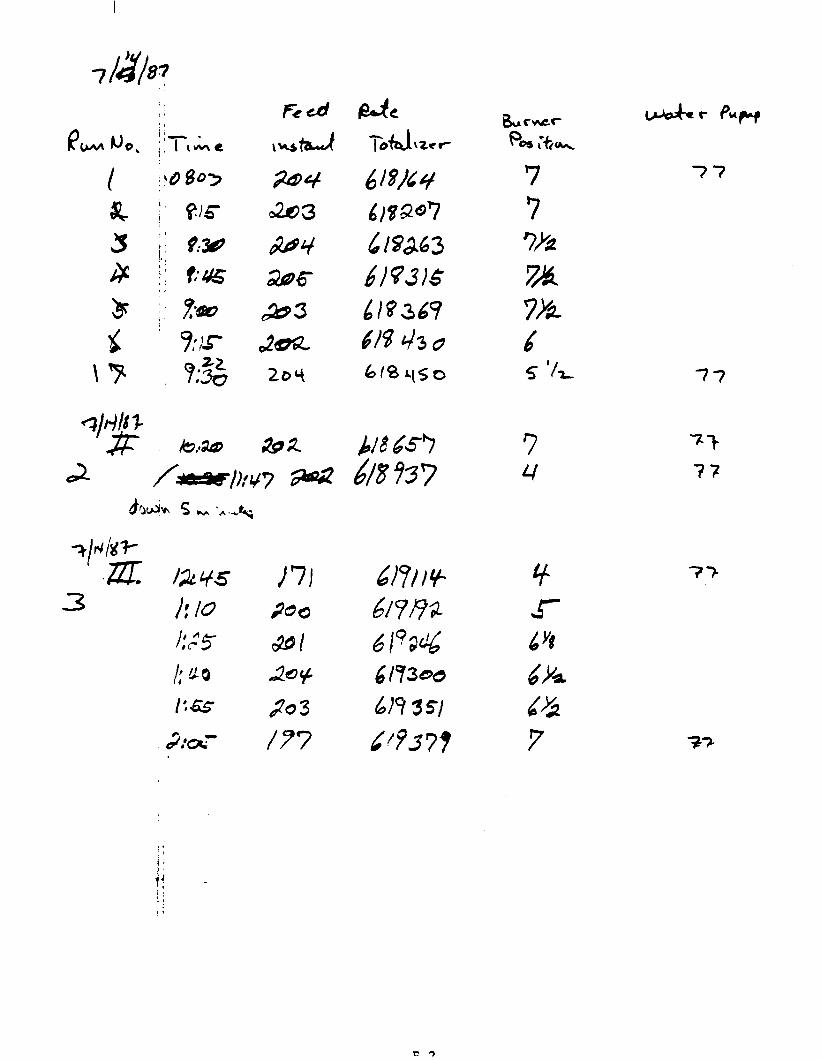
On Tuesday, July 14, work began at 5:45 a.m. The equipment was prepared
for testing, but testing was delayed because the plant was not operating
due to rain. The preliminary data was collected beginning at 7:00 a.m.
The first test for particulate matter and sulfur dioxide began at 8:05 a.m.
Testing continued until completion of the test at 9:22 a.m. The second
test began at 10:21 a.m. Testing continued until 10:30 a.m. when testing
was stopped due to a temporary plant upset. Testing was resumed at
10:40 a.m. and continued until completion of the second test at 11:47 a.m.
The third test began at 12:47 p.m. and was completed at 2:02 p.m.
The equipment was moved off of the stack and loaded into the sampling van.
The samples were recovered and transported to Mullins Environmental Testing
Co.'s laboratory in Dallas, Texas, for analysis and evaluation.
87-88 -9-
Operations at Wood Material Supply, Inc. in Conroe, Texas, were completed
at 3:30 p.m. on Tuesday, July 14, 1987.
president
APPENDICES
A. Location of Sampling Points
B. Source Emissions Calculations
C. Calibration'Data
D. Field Testing Data
E. Analytical Data
F. Plant Operational Data
G. Chain of Custody
H. Resumes of Test Personnel
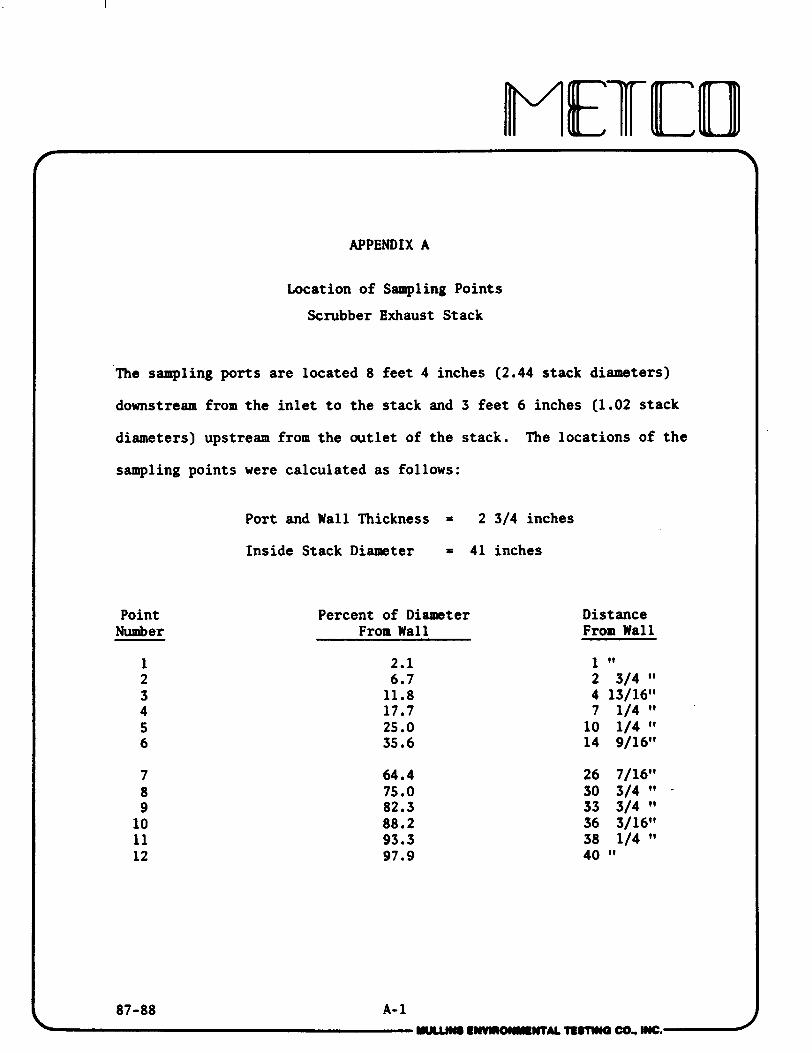
APPENDIX A
Location of Sampling Points
Scmbber Exhaust Stack
The sampling ports are located 8 feet 4 inches (2.44 stack diameters)
downstream from the inlet to the stack and 3 feet 6 inches (1.02 stack
diameters) upstream from the outlet of the stack. The locations of the
sampling points were calculated as follows:
Port and Wall Thickness = 2 3/4 inches
Inside Stack Diameter = 41 inches
Point Number
Percent of Diameter From Wall
Distance From Wall
r
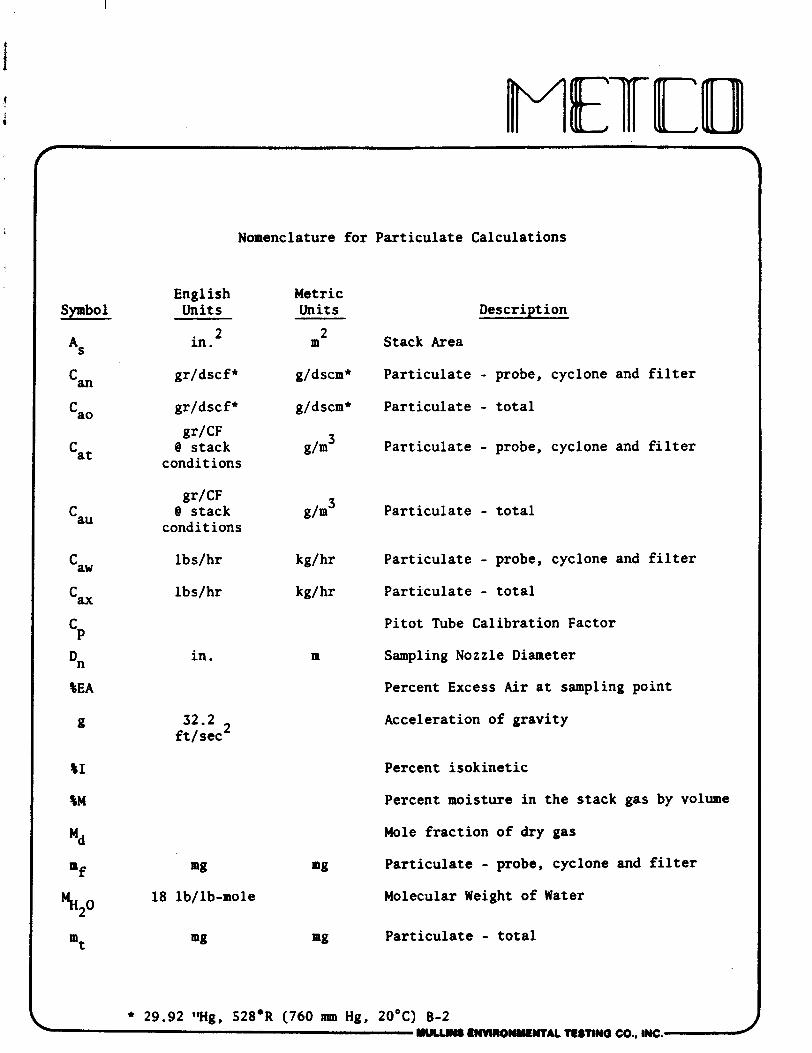
Nomenclature for Particulate Calculations
English Metric Symbol Units Units Description
in. 2 m 2
As Stack Area
I Can gr/dscf * g/dscm* Particulate - probe, cyclone and filter
I 'a0 gr/dscf * g/dscm* Particulate - total gr/CF
'at @ stack g/m3 Particulate - probe, cyclone and filter conditions
gr/CF
'au @ stack g/m3 Particulate - total conditions
I Caw lbslhr kg/hr Particulate - probe, cyclone and filter
C, lbs/hr kg/hr Particulate - total C Pitot Tube Calibration Factor P
Dn in. m Sampling Nozzle Diameter
SEA Percent Excess Air at sampling point
I Acceleration of gravity
I " Percent isokinetic
I '" Percent moisture in the stack gas by volume
I Md Mole fraction of dry gas
I mf W mg Particulate - probe, cyclone and filter
%20 18 lb/lb-mole Molecular Weight of Water
m t mg mg Particulate - total
29.92 'Wg, 528.R (760 mm Hg, 20°C) 8-2 YUU~WI~ R ~ ~ ~ O W Y I N T A L manno co., mc.-
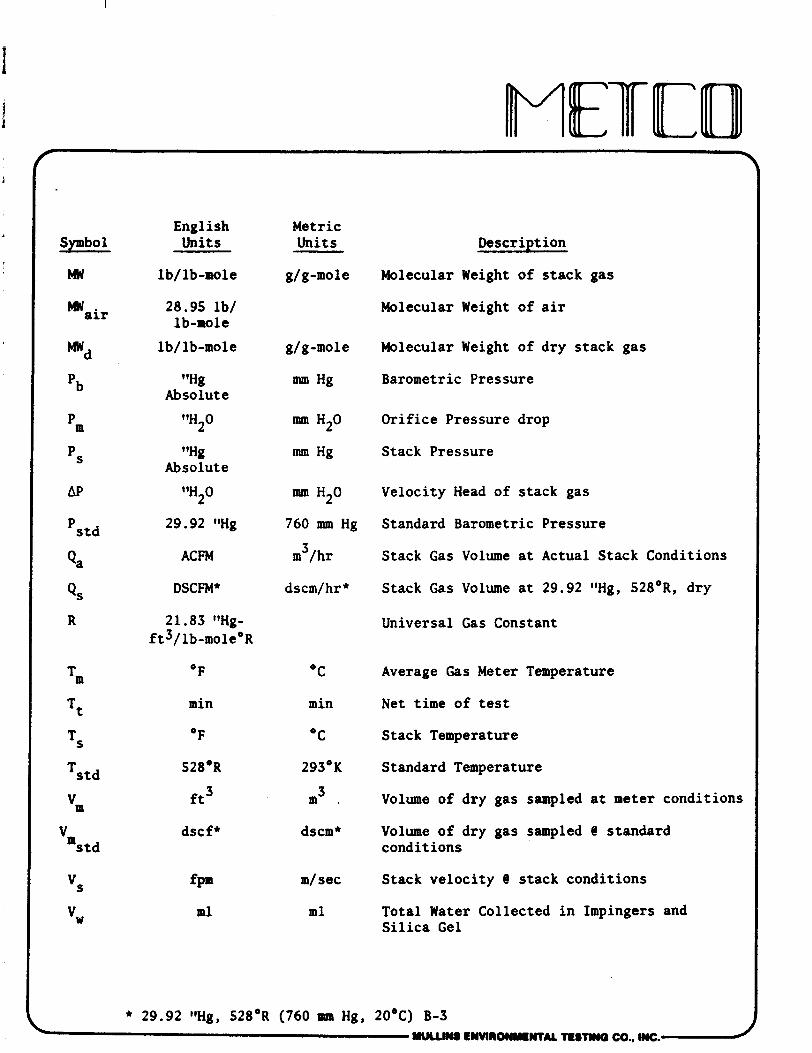
English Units
Metric Units Symbol
bw
Description
Molecular Weight of stack gas
28.95 lb/ lb-mole
Molecular Weight of air
Molecular Weight of dry stack gas
Barometric Pressure "Hg Absolute
Orifice Pressure drop
Stack Pressure "Hg Absolute
Velocity Head of stack gas
Standard Barometric Pressure
Stack Gas Volume at Actual Stack Conditions
Stack Gas Volume at 29.92 "Hg, 52a0R, dry
ACFM
DSCFM*
21.83 "Hg- ft3/lb-moleOR
Universal Gas Constant
Average Gas Meter Temperature
min min Net time of test
Stack Temperature
Standard Temperature
Volume of dry gas sampled at meter conditions
dscm* Volume of dry gas sampled @ standard conditions
m/ sec
ml
Stack velocity @ stack conditions
Total Water Collected in Impingers and Silica Gel
29.92 "Hg, 528'~ (760 Hg, 20°C) B-3 muwa tmwnm~mw manna co., wc.-
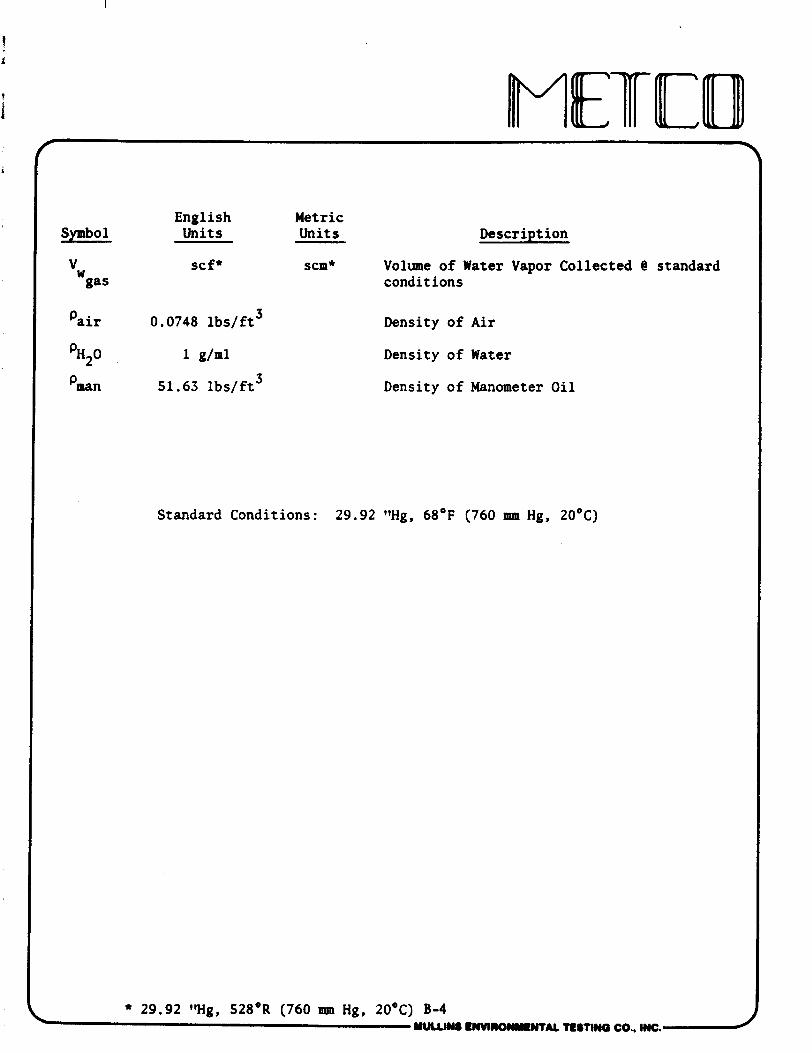
Standard Conditions: 29.92 "Hg, 68'~ (760 mm Hg, 20°C)
English Metric Symbol Units Units Description
"w scf* scm* Volume of Water Vapor Collected @ standard gas conditions
Pair 0.0748 lbs/ft3 Density of Air
'H,O 1 g/ml Density of Water
Pman 51.63 lbr/ft3 Density of Manometer Oil
* 29.92 "Hg, 528'R (760 ~ I O Hg, 20'~) B-4 ~ L I W LWVIRO-NTAL TCSTIMO CO.. (WC.
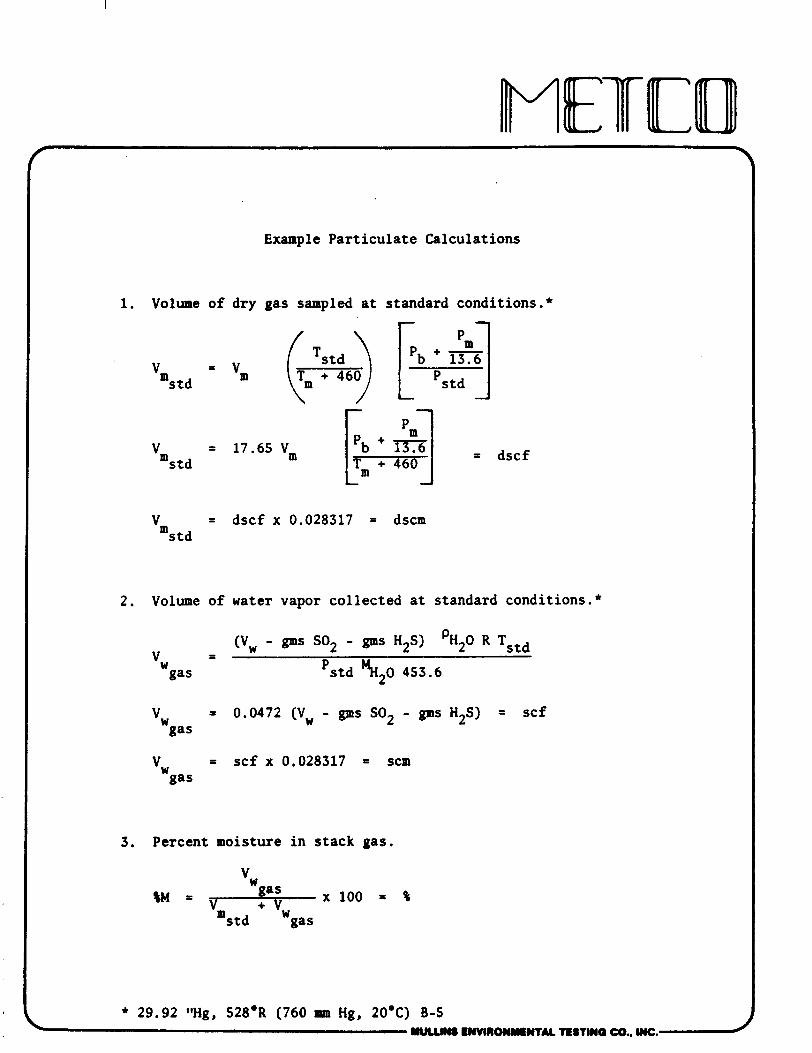
2. Volume of water vapor collected at standard conditions.*
- - (V, - gms SO2 - gms H2S) 'H~O R Tstd
vw = scf x 0.028317 = scm gas
Example Particulate Calculations
1. Volume of dry gas sampled at standard conditions.*
'm = vm s td (::t:69 Lb iS$J
= 17.65 Vm std fi:d = dscf
= dscf x 0.028317 = dscm std
* 29.92 "Hg, 528'R (760 nun Hg, 20°C) B-5 NULLW8 LNWROCIYINTAL TISTINQ CO., W.
3. Percent moisture in stack gas.
W = .&XlOO = 'L m std W
gas
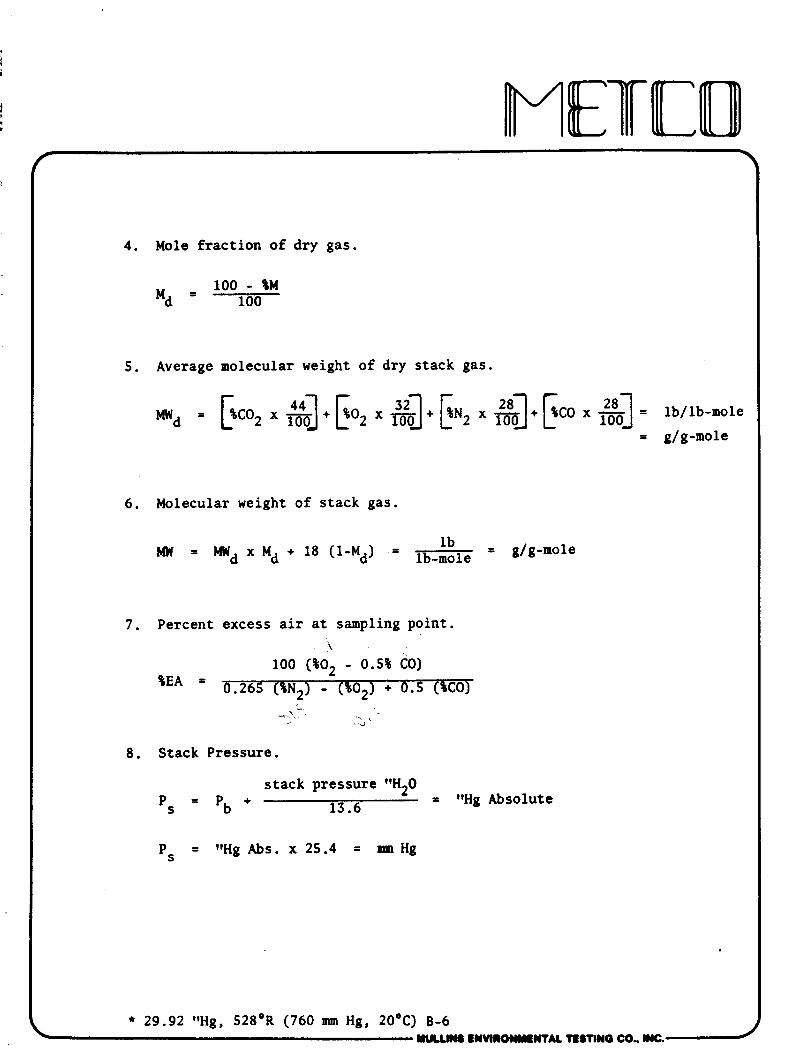
6. Molecular weight of stack gas.
MW = % x Md + 18 (I-Md) = lb = gig-mole
lb-mole
7. Percent excess air at sampling point.
8. Stack Pressure.
stack pressure 11H20 Ps = Pb + 13.6
= llHg Absolute
Ps = llHg Abs. x 25.4 = nun Hg
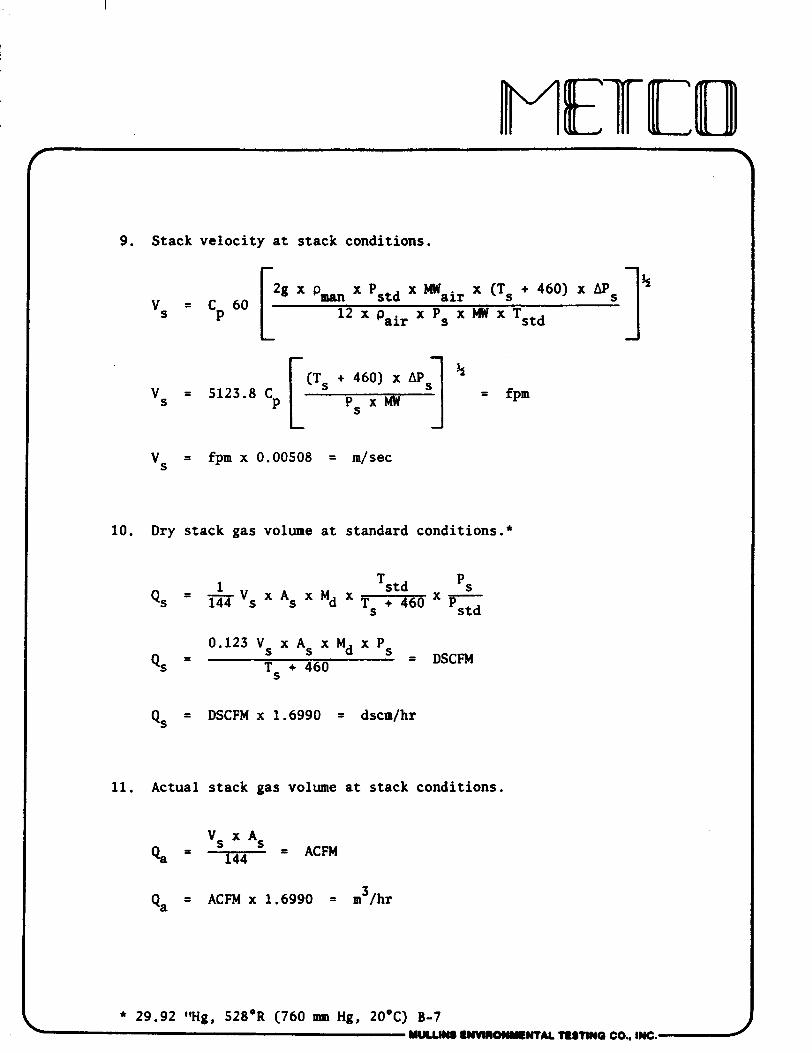
9. Stack velocity at stack conditions.
vs = fpm x 0.00508 = m/sec
10. Dry stack gas volume at standard conditions.*
0.123 VS x AS x Md x PS - Qs - Ts + 460
= DSCFM
Qs = DSCFM x 1.6990 = dscm/hr
11. Actual stack gas volume at stack conditions.
Vs *s Q a = T = ACFM
Qa = ACFM x 1.6990 = n5/hr
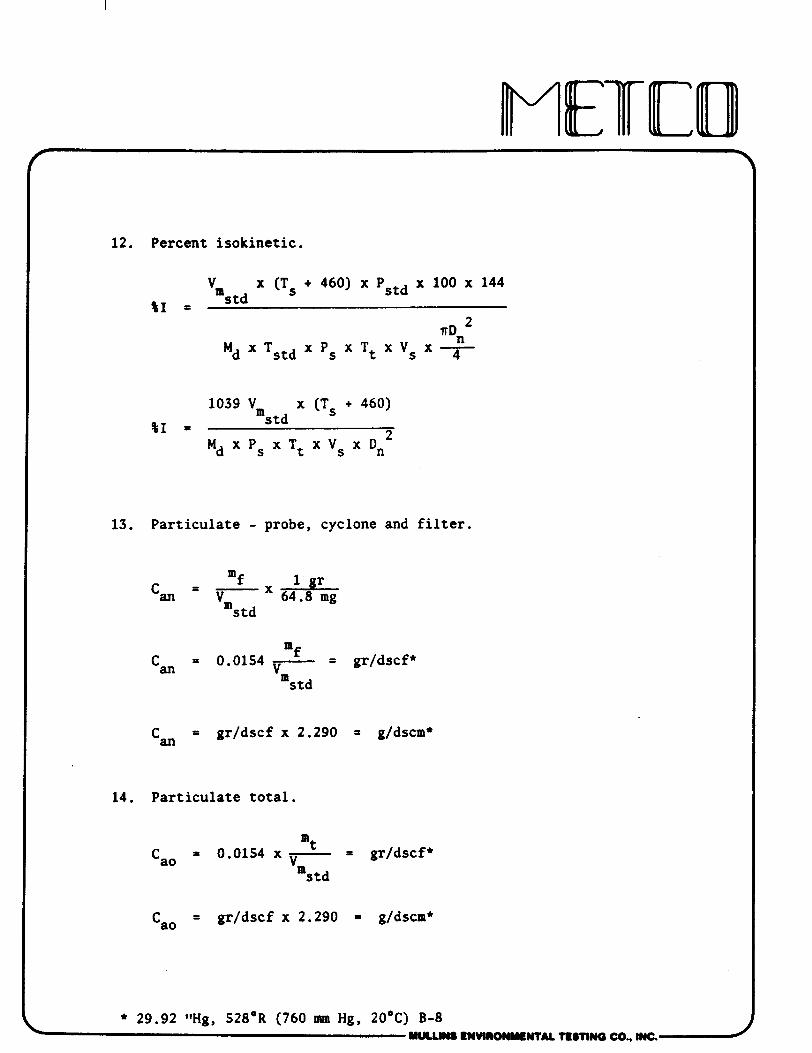
12. Percent i sok inet ic .
'm x (T + 460) x Pstd x 100 x 144 s td s
%I = 2
"Dn Md X Tstd X Ps X Tt X V X - s 4
1039 Vm x (Ts + 460)
%I = s td n
13. Particulate - probe, cyclone and f i l t e r .
C, = -2- x .&. vm s t d
='f Cm = 0.0154 - = gr/dscf* 'm s td
'an = gr/dscf x 2.290 = g/dscm*
14. Particulate t o t a l .
"t 'a0 = 0.0154 x - = gr/dscf*
"m s td
= gr/dscf x 2.290 = g/dscm*
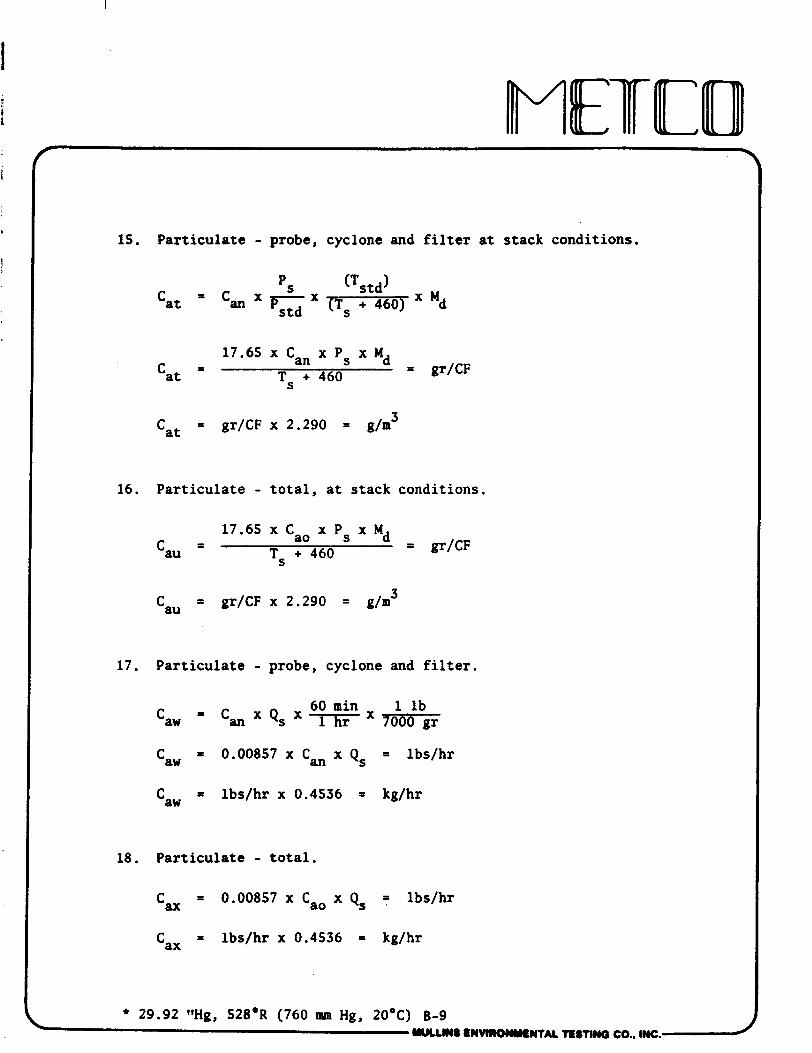
15. Particulate - probe, cyclone and filter at stack conditions.
'at = gr/CF x 2.290 = g/m3
16. Particulate - total, at stack conditions.
17. Particulate - probe, cyclone and filter.
60 min 1 lb 'aw = C a n x Q s x ~ x ~
18. Particulate - total.
* 29.92 "Hg, 528'R (760 mm Hg, 20°C) B-9 YULWS ~ N V I ~ ~ ~ ~ T A L R S ~ N O CO.. INC.-
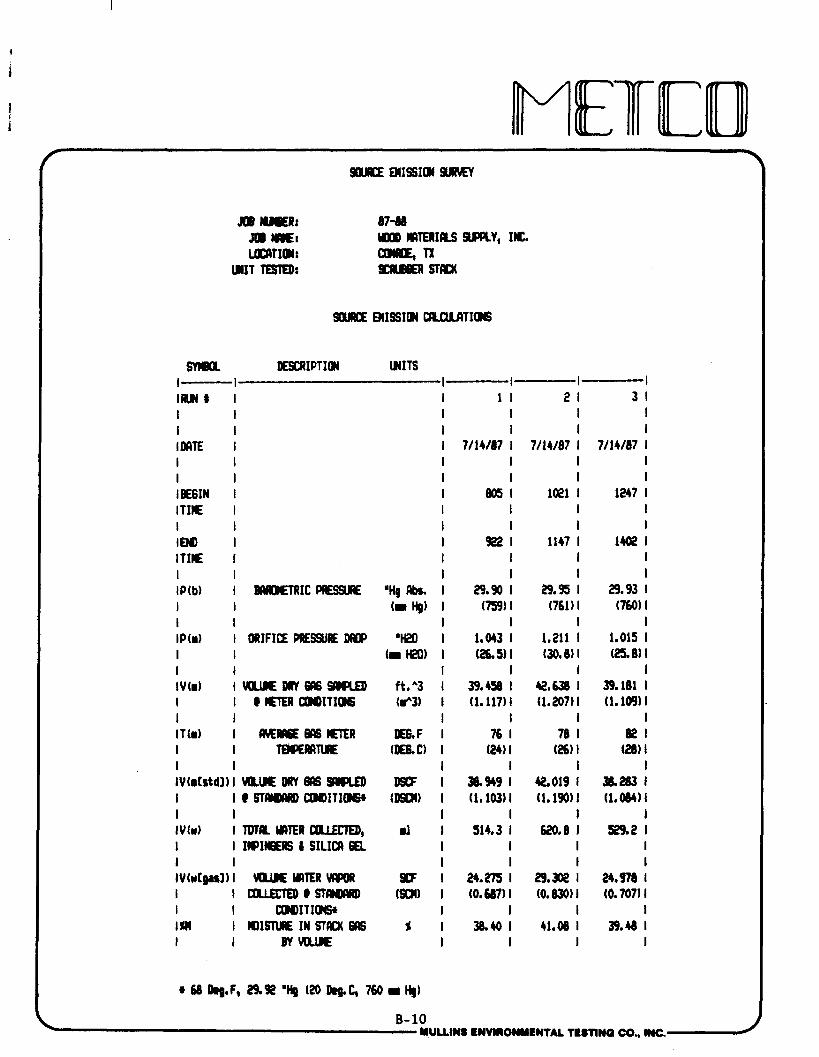
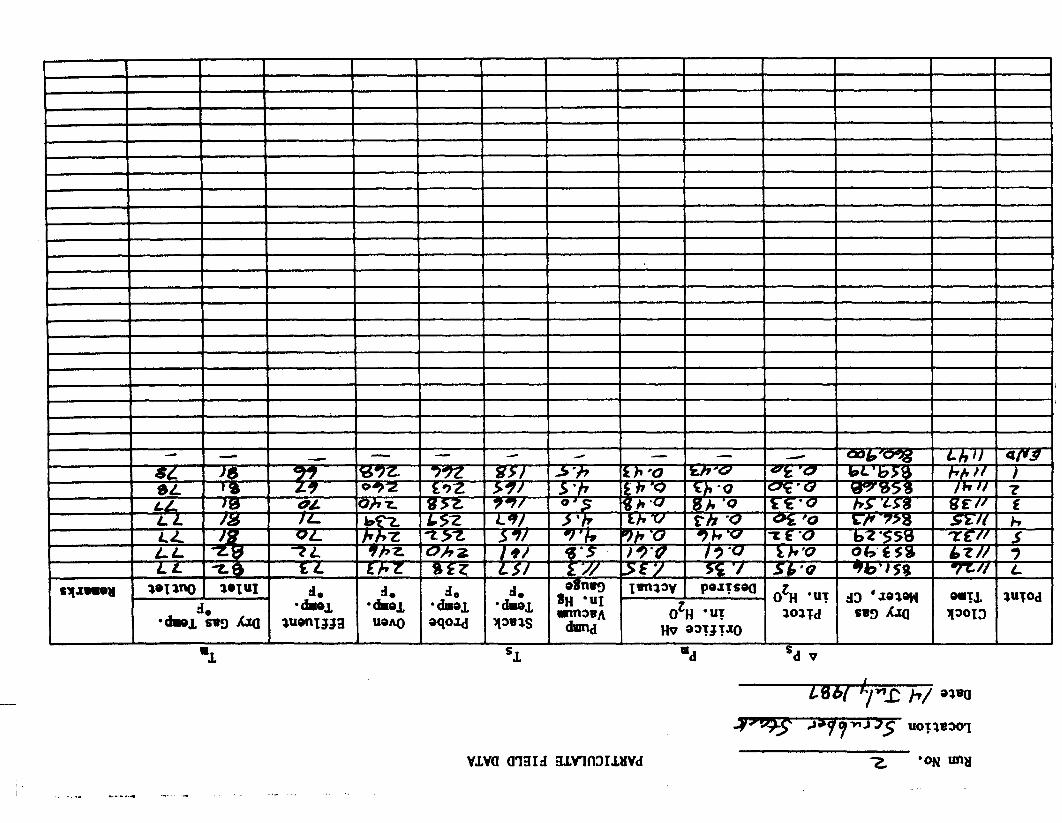
87-86 Ym IIRTERIU SLPQCY, IN. Q1IAa,n 9WIOER STACK
rmea #SCRIPTIOW I I I W t I I I I I IrnTE I I I I I IBE6IN I I T I E I I I I END I IlIE I I I IP(b) I I # R D R R I C I I I I IP(r) I ORIFICE PRESSURE DRIP I I I I I V ( r ) I \I(UZ: DRV 6B WUED I I @E'ER O(#ITIOIS I I I T ( d I (WEMI#SlRER I I TBOEmNRE I I IV(utstd1)l HUlE DRY I#S 9#QLaD I I e ST- #W)ITIONSI I I I V ( d I TDT# Y3TER 001ECTED, I I I~PIWBERS I SILI~ IS. I I IV(atprrl1l UU)IEYATERVRWR I I eOUECTEOCIST#QIIRD I I r n I T I a N 9 l W I W)ISNRE IN ST= 6M I I EYVOUIlE
B-10 YULUm LNVllOWYtNTAL TlESTlNQ CO.. I=.-
S[1I1Q EMISSION U U J A T I M S
SmBOL DEseRIPTIOW WITS I I I- I Hd 1114. FWTION fF DRY BIlS I I I I I I I 1m2 I % I I I I I I I 102 I % I 1 I I I I I I #1 I % I I I I I I I I CP I % I I I I I I I 1- lEXCESSBIRPS##IK % I I I WINT I I I I I W II(XECWR WEIW OF LB/L&WILE I I lDuY S T m 6116 (g/pSI1E) I I I I lrn InuECURR EIM OF LB/LBSIILE I I I S T W a6 (g/gS#E) I I I I I WTCI P IVEUICITY EM ff STKA 1 I 16115 (1111lQo) I I I I I Ts I S T m TD#RRTURE E 6 . F I I I (#6. C) I I I I IPS ISTXM PlFSBLRE '4 h. I I I (I Hp) I I I I I v s ISfacKVEUICIlY0ST#X FPM I I IQIQ)ITIMS (dSEC.1 I I I I Ik ISIm m (SQ. IISMS) I I I (99. mRS) I I I I IS lDRYSTACI(611SVOLUE@ DSMI I I ISTAHIClRD UMITIONS, (DSCII/HR) 1 I I I 101 I ~ S T r n 6 B ~ U E m I I I 0 ST#X UMIITIOWS (&3/HR) I
*68M.F, 29.92 '4 (2QDlg.C, 7 6 0 r H g ) B-11 \ NULLINS ENVIROWYLNTAL nsnno co., ~NC.
rmeu I- I T t I I IDn I I IS1 I I Inr I I Im
i I I I Can I I lCIo I I lht I I l h u I I lcvr I I ICu I
DESCRIPTIM WITS - 1 IKT TI= CF TEST M I W I I lSIYRIN6 WDZZLE DI#C IN. I (11 I IPERCDII ISO(1NRIC % I I IPIIRTIUTE -PROgE, q ImXPiE W FILTER I IPIVITICUFlTE-TOT# q I I IMIaJLRfE - PROE, gr/D9a* IMXM W FILTER (g/DscII) I IPCIRIICLILRTE - T D T k gr/DSCF* I (g/DSCII) I IrnIC-P#l#, mu31E gr/Q I#0 FILTER @ STIIO( CIW. (gIr3) I ImMIcU.ATE-TOT#@ gr/a ISTI10( [#Q)ITI(IYS (41.3) I IPSWTI~TE-PROBE, m/HI ICV[UIIE #O FILER (KgIHR) I ImRTIrnlE-TOT# L W H R I CKglHR,
L B- 12 YULUWS CWVIROlSYCNTAL TESTINQ CO., I*.
j %,FUR DIOXIDE UISSIOW MTCI Z
JOB W R : 8766 Jm m: Ym rnTERI#S m y , I N .
I m I M : QIIROE, n UiIT TESm)r 9CRB%R STW(
1 I I I I I mII)BER I 1 2 3 I I I DCLTE 17/14/87 7/14/87 7/14/87 I I I SI(IIIT T I E I do5 1421 1247
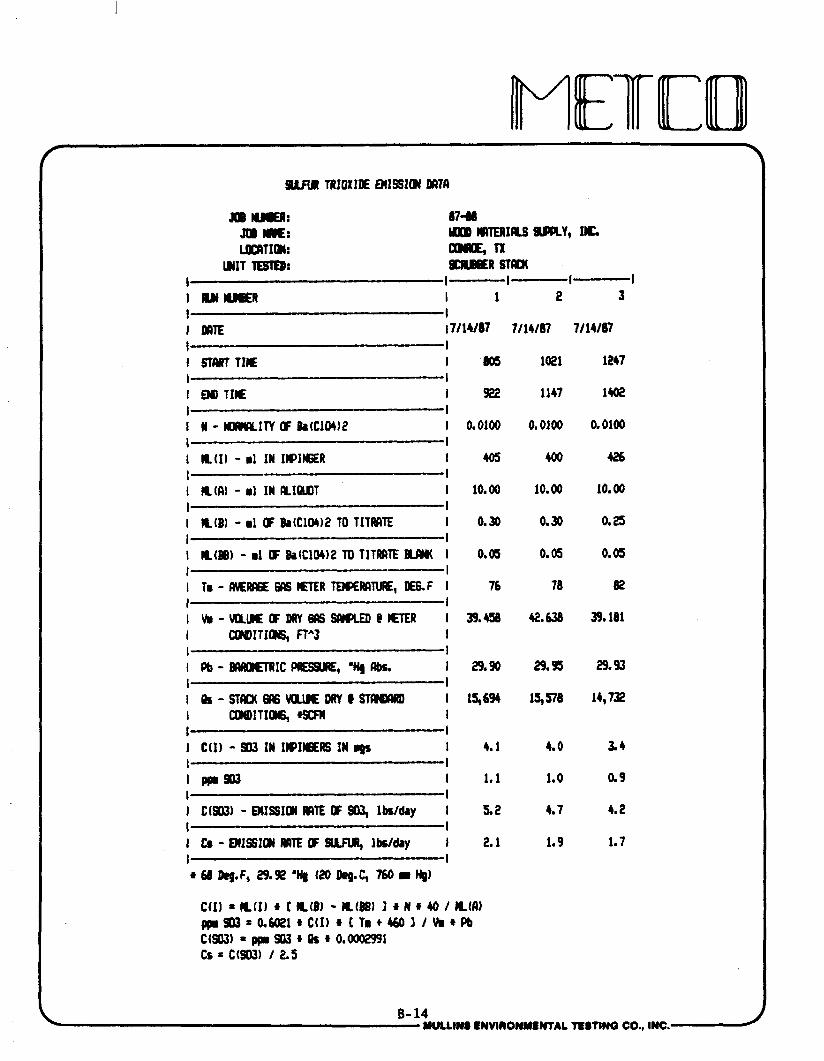
SUNR TRIOXILE MISSIM mTA
I I I START TIE I 605 1021 1247 I I I PO TIlE I 922 1147 1402 I I I N - WMIlFYITY OF L(C1M)L 1 0.0100 0.0100 0.OlOO I I I K(I1 - rl IN IIQINER I 405 100 426 I I 1 N(CI) - 81 IN #IWT 1 10.00 10.00 LO. 00
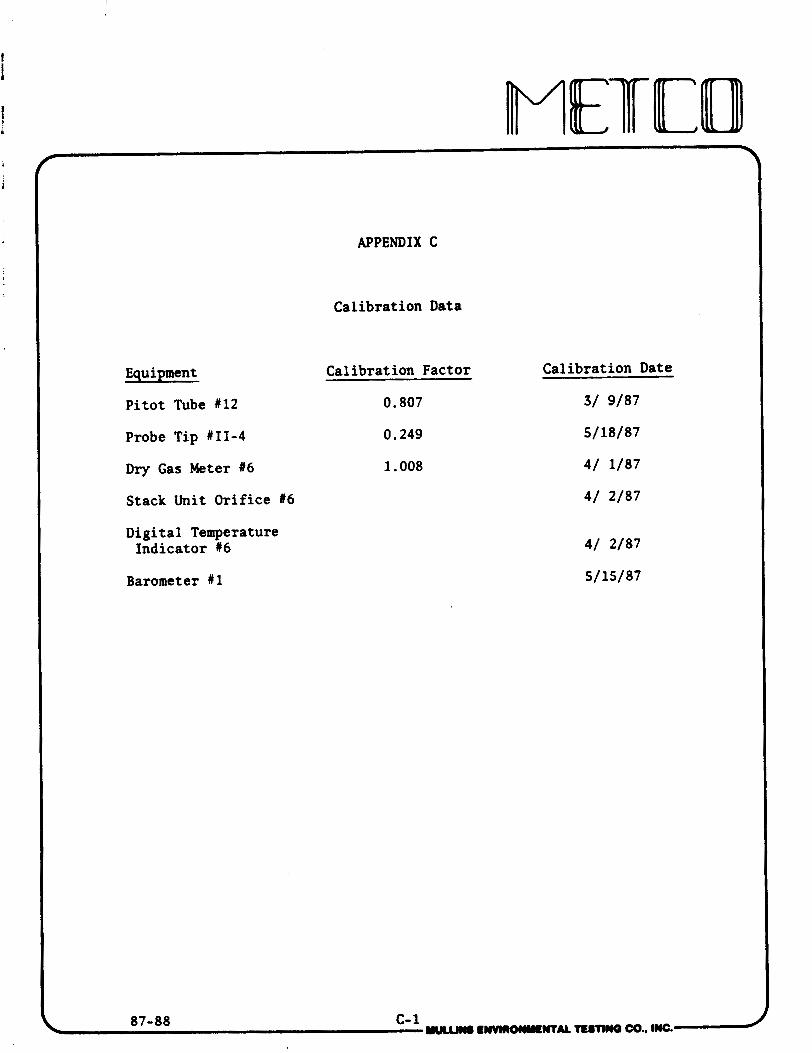
Equipment
Pitot Tube W12
Probe Tip UII-4
Dry Gas Meter W6
Stack Unit Orifice t 6
Digital Temperature Indicator W6
Barometer U 1
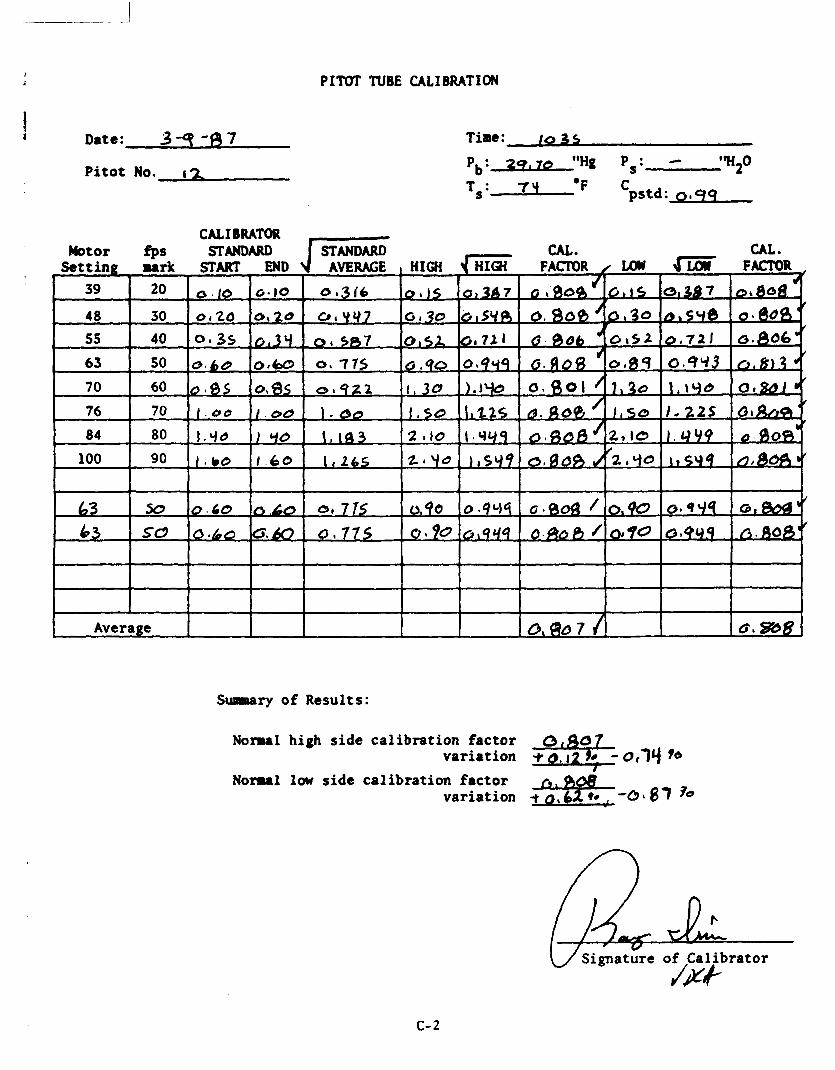
PITOT TUBE CALIBRATION
Date: 3-q-87 Time : lo 3s
Pitot No. r 2 , Pb: 7,q, "Hg P,: - "H20
CALIBRATOR -
Average 0 . 0 0 7 4 O& St38
Su~arary of Results :
Normal high side calibration factor
N o ~ l low side calibration factor %*-ol 87 170 variation t
ibrator *
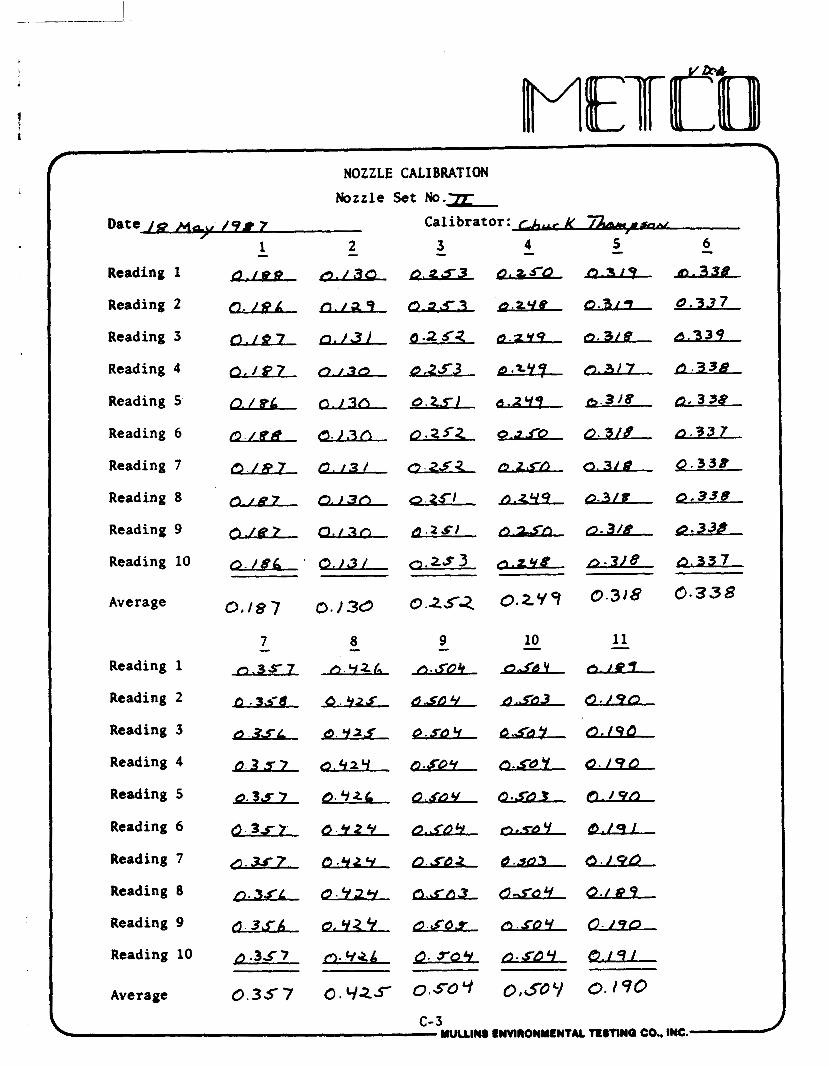
f NOZZLE CALIBRATION
Nozzle Set No.=
Date /p M- ,49* 7 C a l i b r a t o r : - .
1 2 - 3 - 4 - 5 - 6 - - Reading 1 d.lBB f2&%z / Q - t ~ 3 ~ * zL.3XL .338
Reading 2 0. j 9 k a I f292ys 0.317 0 . 3 3 7
, *,,3/ p . 2 b Z i9.Z"9 u.31@ f3.339 Reading 3
Reading 4 0 , / 8 7 0.13e p.253 6- D . 3 3 B
Reading 5 Q. %k o. 13n o./''? p . 3 / 8 0.3 38
Reading 6 D . / r @ (3+).3A p.252 9.sbo C U L L - 0 , 3 3 7
Reading 7 f i . / B l b. 13/.2sa UD 0 . 3 1 ~ 0 . 3 3 8
Reading 8 0.- 0) Q-3/* 0,338
Reading 9 @ . / B 2 CJ- 0 . 3 1 8 LLz&L
Reading 10 0 . / 8 6 ' Q , I 3 / 0.2S3 0- 0 - 3 1 8 p. 33 7
Average
7 - 8 - 9 - 10 - 11 - Reading 1 a . 3 5 7 &.YZL n . S O 4 ALs&L QAcL
Reading 2 0.42s b m - Reading 3 P .3s/ p. 92s 9 - 5 b 4 Q.d3Q-
Reading 4 f l . 3 ~ 7 a 4 2 Y 0.509 f i .g i9Y 0./96
Reading 5 @ . 3 J 7 0. Y 2 6 P.gbY ( r ) - l Y &
Reading 6 0 . 3 ~ 7 , /3.+'29 4 L L a L - m
Reading 7 a Q s * 2 Y O.Sd2 Q .so3 O . ) o f J
Reading 8 0.3JT/ 0 . 4 2 4 n ? Cl Q . 1 9 9
Reading 9 3 d. d4D09 P.soY 0.190
Reading 10 5 0.946 d. so4 o.$by a&ELL-
Average 0 . 3 5 7 0 . Y 2 S 0 . ~ ~ ~ O,sOr 0 . 1 9 0
Average
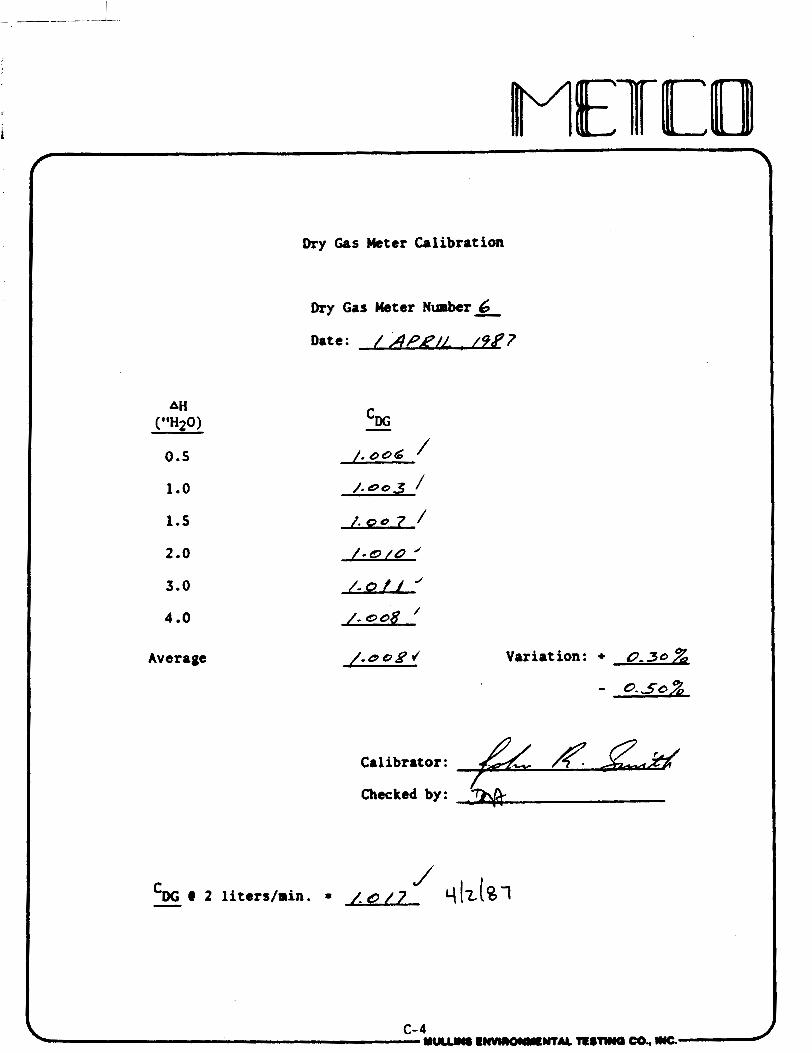
Dry Gas Meter Calibration
Dry Gas Meter Number
Date: / APE/L . 1987
Variation: + 0.30%
- 0.50%
Calibrator: //!& /? #gh$ Checked by: % . .
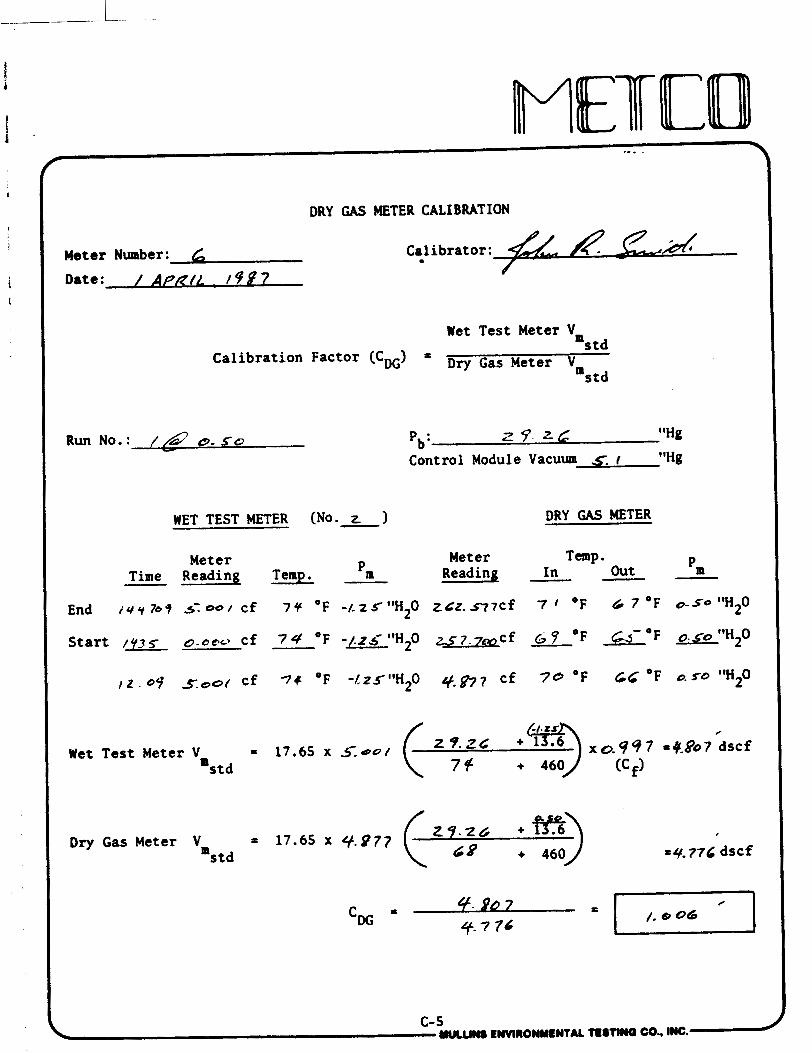
DRY GAS METER CALIBRATION I Meter Number: 6 Date: / @Il?!/ . 1497
Wet Test Meter V '"std - - -
Calibration Factor (CDG) = Dry Gas Meter m ~ t d
Run No.: /& Q- 50 -
WET TEST METER (No- - 2 1
P,,: z 5'. t L ItHg
Control Module Vacuum 5. r "Hg
DRY GAS METER
Meter Meter Temp. - Pm Time Reading Temp. In Reading Out
7 P, - I
End i r y h f ~ T ; . c o / cf 7 4 O F -1-+CWH20 Z L Z . R I C ~ 7 1 O F 6 7 ' ~ O - ~ O ' ~ H ~ O
S ta r t 1 ~ 3 9 0 . 0 ~ - cf - 7 Y O F -1.23- ItH20 u 7.ymcf G ? O F a- O F 0. go "H20
,z.cq j 4 0 ( c t 7 4 O F -l+5"H20 q.f.977 cf 70 O F LC 'F a 5 0 t t H 2 0
/
Wet Test Meter Vm = 17.65 x S':SU/ ( z ; F c : ' 5 ] x ~ . q 9 7 =+.&b7dsci s td (c fl
Dry Gas Meter V,,, = 17.65 x 4.977 + 460 s td
C-5 YUCUWS INWRoWyLWAL CO., IW.
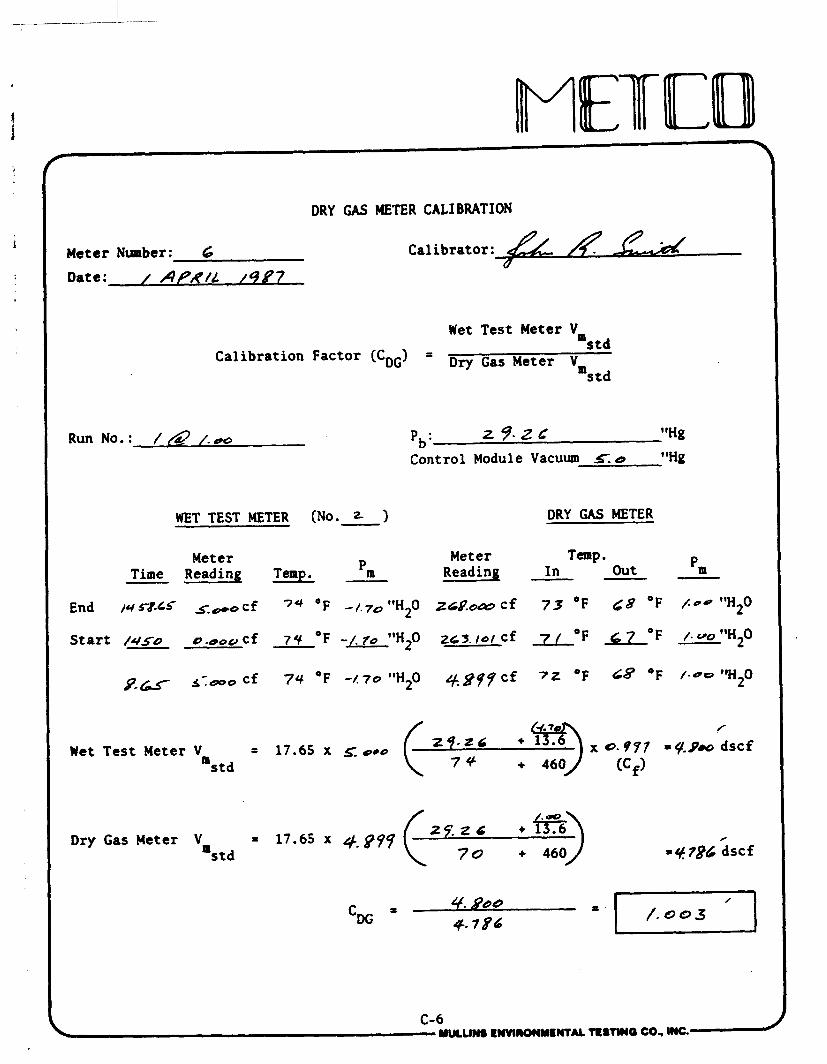
I DRY GAS METER CALIBRATION
Meter Number: 6
Date : / APRIL / 9 f 7
Calibrator:
Wet Test Meter V- 'std
Calibration Factor (CDG) = Dry Gas ,,, std
Run No.: /& Pb: z ? . Z C "Hg Control Module Vacuum 5. o "Hg
WET TEST METER (No. DRY GAS METER
Meter Meter Temp. Pm Time Reading Temp. Reading In Out P, -
End /+rb.4s ~ - @ o ~ f 74 O F - I ~ ~ " H ~ O z ~ ~ c o o c f 73 O F 48 O F / o @ " H Z O
; Start /450 o . ~ ~ ~ cf 7 4 O F -y.fo 91HZ0 ZSI. 101 cf 7 ( O F 7 O F /. ~0 ItH20
< Wet Test Meter Vm = 17.65 x g o r e
std
Dry Gas Meter Vm = 17.65 x 4-89? std 70 + 460
3 4. BOO 'DG
x
9-786
C-6 NULL- tMVlMlWMCNTIL It8TlNQ CO., W.-
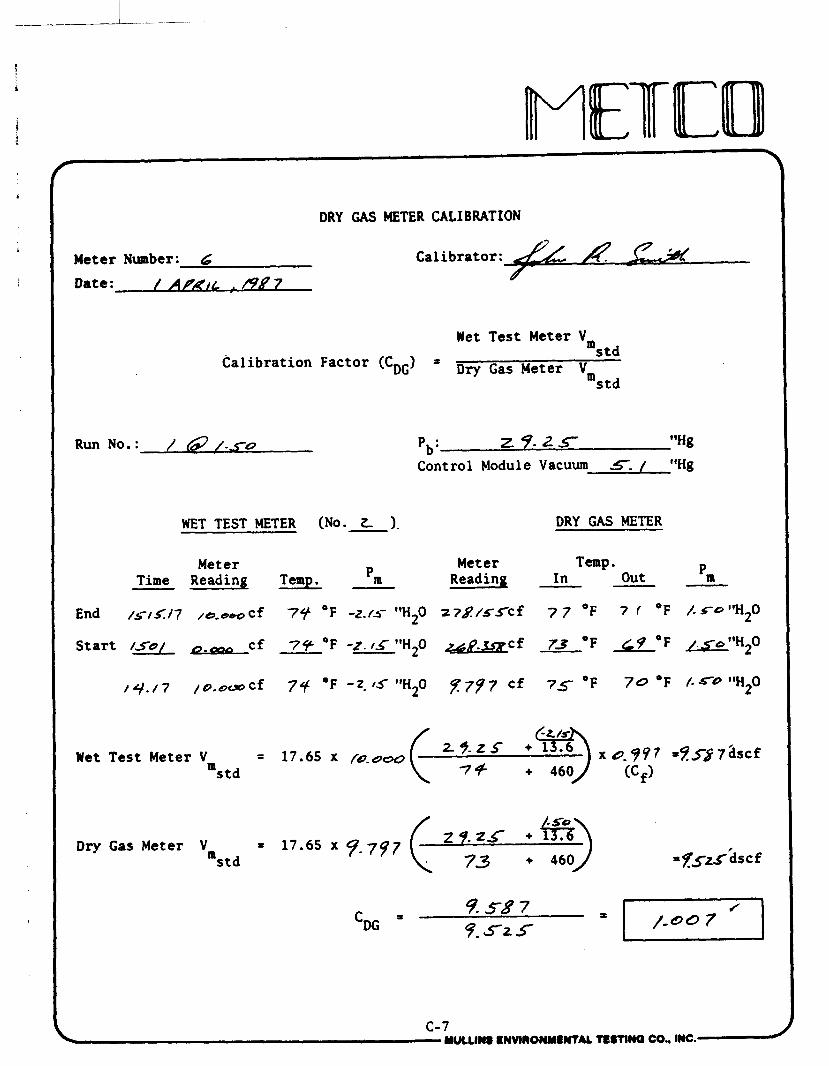
DRY GAS METER CALIBRATION
Meter Number: 6
Date: / AF&L , /9#7
Calibrator: -
Wet Test Meter V,
Calibration Factor (CDG) = Dry Gas P ~ t d
mstd
Run NO. : / @/-so pb: 2 9 - ~ r " ~ g
Control Module Vacuum 5. / ItHg
WET TEST METER (No. 2 I. DRY GAS METER
Meter Meter Temp. Time Reading Temp. - 'm Reading In Out - 'm
End /$-,C/7 ,c.erc cf 74 O F -z./a- ftH20 z ? g / g s c f 7 7 O F 7 f O F /. re 11H20
S t a r t /so/ - cf 79 O F - Z . I S * ~ H ~ O *p.=cf 73 O F 6 9 O F , . s o t * H 2 0
7 ,o.orc,~f 7rf 0 ~ - ~ . t ~ i t ~ 2 0 ~ 7 9 7 ~f 7 5 . 0 ~ 7 0 0 ~ /."*a0 2
Wet Test Meter Vm = 17.65 x /4.000
s t d
Dry Gas Meter Vm = 17.65 x 7- 797 s t d 73 + 460
C- 7 MULLlWt INVMONMtNTAL TSSTINQ CO.. INC.
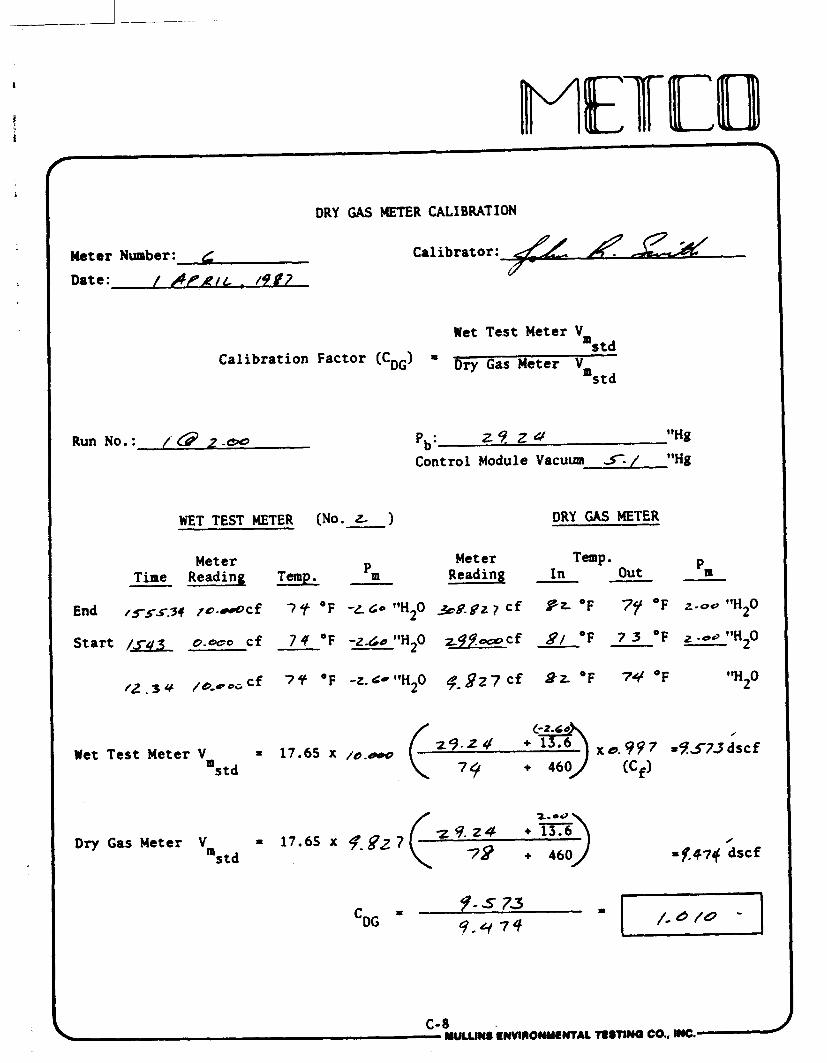
I DRY GAS METER CALIBRATION
Meter Number: L Date: / APRIL , /4#7
Calibrator:
Wet Test Meter Vm s t d
Calibration Factor (CDG) = Dry Gas Meter Vm s td
Run No.: Cd 2.- P,,: 27 Z # "Hg
Control Module Vacuum 5- / "Hg
WET TEST METER (NO. DRY GAS METER
Meter Meter Temp. Time Reading Temp. Out - Pm Reading In -
End t s s s . 3 4 zo.@cf 7 O F -L 60 "H20 +g. gz 7 cf I r O F 7v O F 2-oc, ltHZO
-- 2 - 7 3 O F 2 -or "H20 S ta r t /m 0-050 cf 7 t O F -2.41 "H 0 z 9 2 o 9 c f 8/ OF - /t .3 u / B , O O G C ~ 79 O F -z. L-"H20 4- 92 7 cf A?z O F 74 O F
"HZO
Wet Test Meter Vm = 17.65 x / ~ . o a ~ std
Dry Gas Meter V,,, = 17.65 x 4-gz 7 z9.224 +m std 78 + "? 460
0
=c474 dscf
9- s 75 'DG * 9 . 4 74
C- 8 #UUJMS CWWlOUYLNTAL TISTIWO CO., lW.-
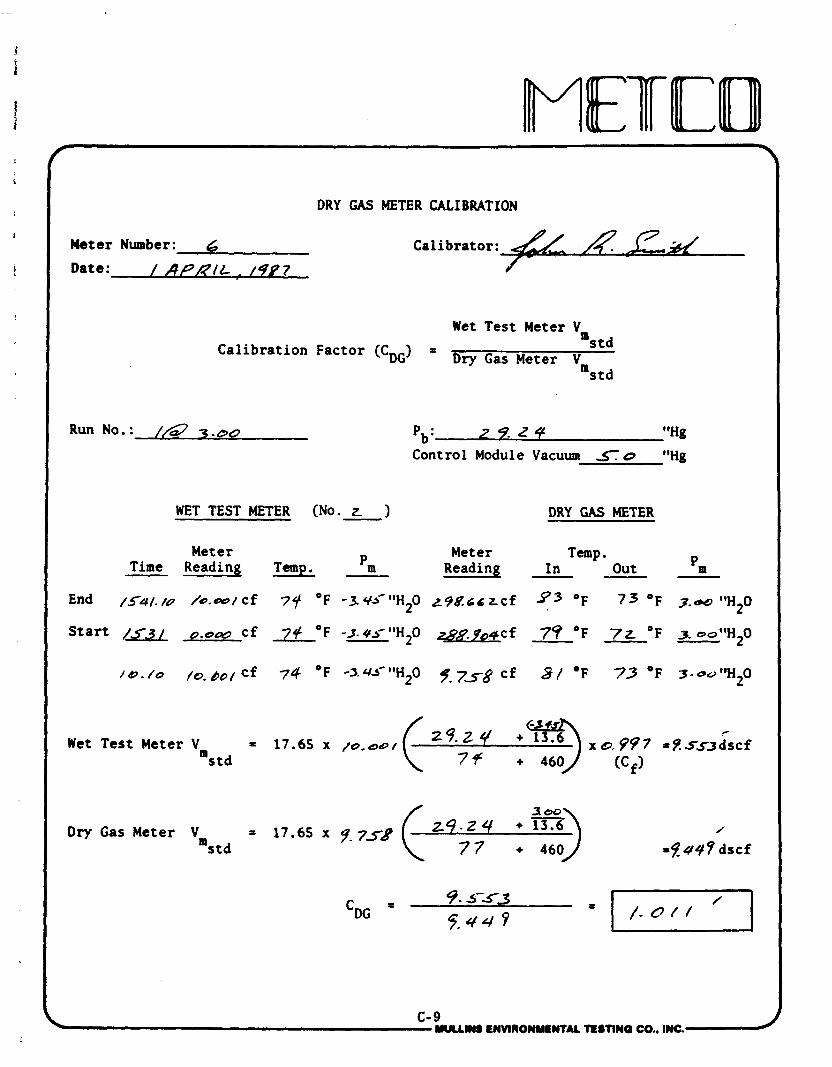
DRY GAS METER CALIBRATION
Meter Number: 6 Calibrator:
Date: / A P R I L , 148 7
Wet Test Meter Vm
Calibrat ion Factor (CDG) = Dry Meter vm s t d
s t d
Run No.: /,& 3 - 6 9 Pb: 7 9 Z 4 ItHg
Control Module Vacuum S o "Hg
WET TEST METER (No. z ) - DRY W METER
Meter Meter Temp. Time Reading Temp. Reading I n Out Pm
End 4 / cf 7f O F -3Y>#"H20 r98.sr r c f 9 3 O F 73 O F 3-ue 'H20
S t a r t / ~ , 3 0 . 0 ~ c f 7+ O F -3- J - V I ~ H ~ O e g B f 0 + c f 79 OF 7 2 OF 3 . 0 0 ~ ~ ~ 0
/o./c / a . ~ o , ~ f 74 O F -3.43-ItH20 f - 7 ~ g c f % / OF 73 O F 3-ou1H20
/
Wet Test Meter Vm = 17.65 x /O.OO/
s t d ('":I :':] x O. 997 =$!-dscf
(C,)
Dry Gas Meter Vm = 17.65 x 9- 7- (z.? + +m) 460 J s t d =f 44 9 dscf
a! 9- 5-33 'DG
7.44 9 = I
C-9 YULLINS tNVlROWtNTAL TESTIN0 CO., (EIC.
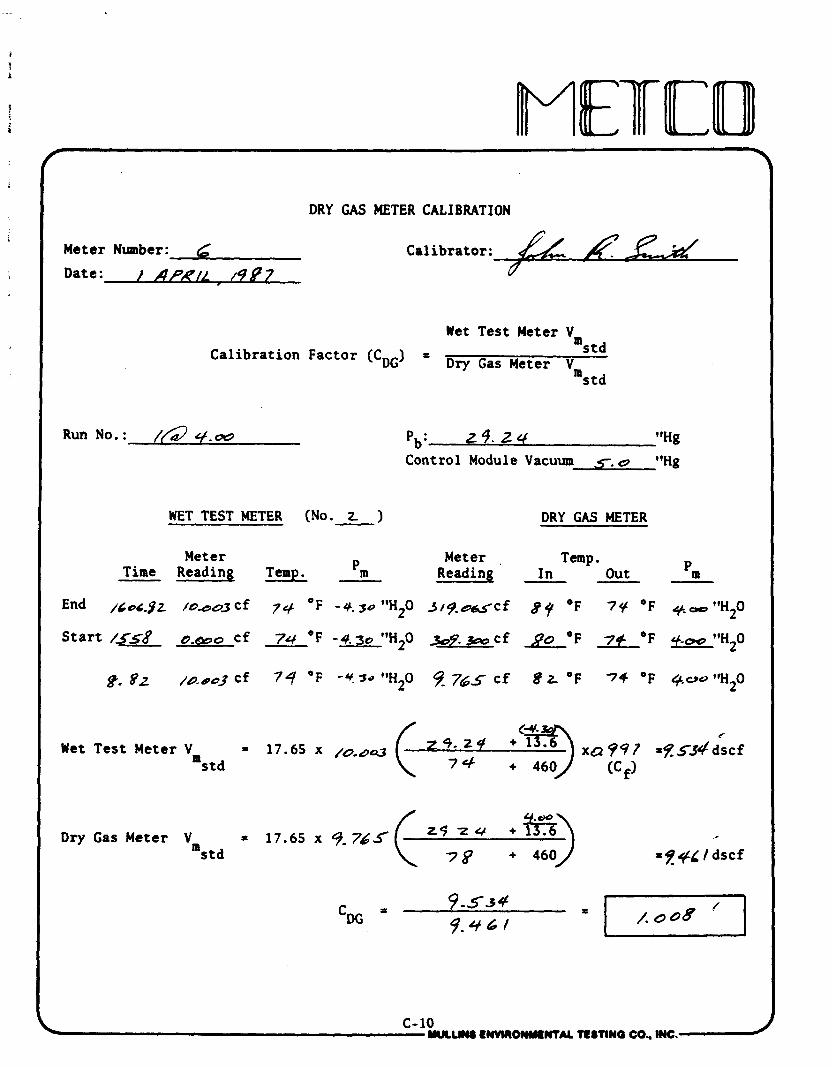
DRY GAS METER CALIBRATION
Meter Number: 6 Calibrator:
Date: , 19P7
Wet Test Meter V,,,
Calibrat ion Factor (CDG) = Dry Meter Vm s t d
s t d
Run No. : /& 4.- Pb: 24.24 "Hg
Control Module Vacuum .<. CJ "Hg
WET TEST METER (No. 2 ) DRY GAS METER
Meter Meter . Temp. Time Reading Temp. Pm Reading In - Out - 'm -
End /Coc.lt /0003cf 7+ O F -U.sottH20 3 1 ) t . w c f BY O F 74 O F +-"H20
S t a r t /558 o-~z?c cf 74 O F -4.30 I1H2O ~ o y - cf 90 O F 7+ OF +- ttH20
8. 82 /o.#pj cf 74 OF -4. "H20 9 765 cf B L O F 7t O F q u o "H20
<
Wet Test Meter Vm 17.65 x /o-da s t d
( 7 ; : q : c ) x a Y 9 ? ( c f) =$?&dscf
Dry Gas Meter Vm = 17.65 x 9- 765 +"> s t d z 9 z 4 7 8 + 460 =f+L / dscf
= 9-531 'DG 9-461 = I/ooBII
C-10 YLKLm8 EMWnOWYtNTM TLSTINQ CO., INC.
T
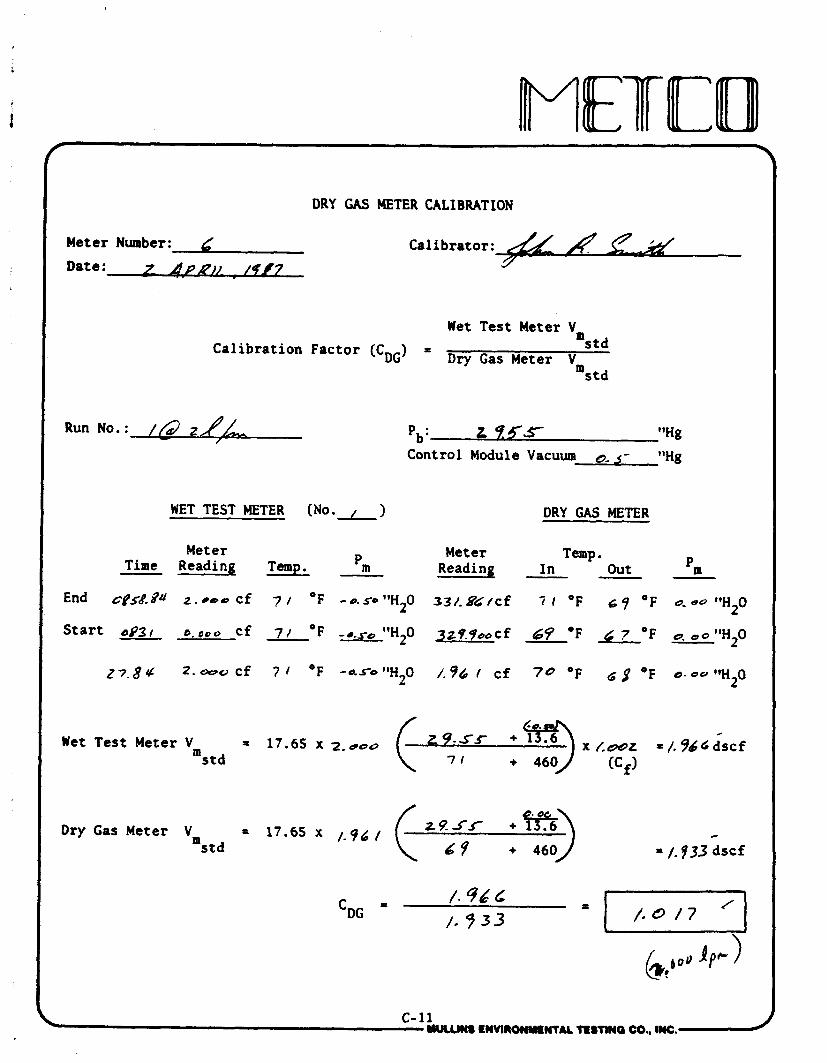
DRY GAS METER CALIBRATION
Meter Number: 6 Date: 7 d d p ~ , / q / 7
Calibrator:
Wet Test Meter Vm Calibration Factor (CDG) = Dry Gas Meter Ym std
std
Run NO. : //d - z , / L pb: z 9 5 s " ~ g /
Control Module Vacuum 0- 5- "Hg
WET TEST METER (No. DRY GAS METER
Meter Meter Temp. Time Reading Temp. - Reading In Out - 'm
End cgsd.2" r.rrecf 7 1 OF - r . s o U H 2 O 33/.&/cf 7 1 OF 6 9 OF o - * ~ ~ ~ H ~ 0
Start 0931 a o o r cf 7 ) OF -a.Te " H O 3~9.94ecf 69 'F 4 7 OF o . e o " H 2 0
27.8 4 2. -0 cf 7 1 OF - a S o q W 0 /. 96 I cf 70 OF 4 g OF O- 00 @*H2O 2
Dry Gas Meter Vm 17.65 x / - q g / std + 460
C-11 WIUIWI LWVIROWYIwT4L TESTIN0 CO.. I=.-
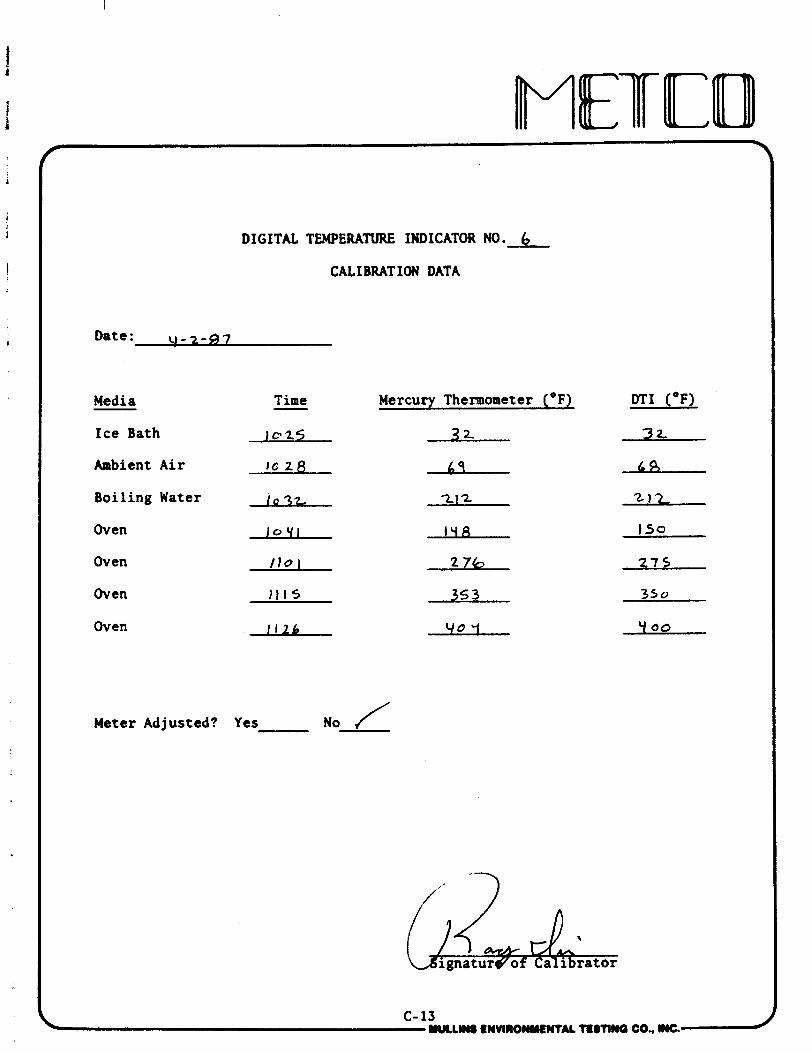
DIGITAL TEMPERATURE INDICATOR NO. 6
CALIBRATION DATA
Date: L I - 2 - 9 7
Media Time - Ice Bath to25
Ambient Air J G 2 8
Boiling Water - Oven 1 0 Y I
Oven / l o I
Oven Ills
Oven 1126
Mercury Thennometer (OF)
3 2
69
212
I ' i R
2 76
3s 3
yo q
Meter Adjusted? Yes No /'
DTI (OF)
32
LB 2 1 3 .
150
27 5
3s u
9 00
("A! ignatur o f a 1 rator
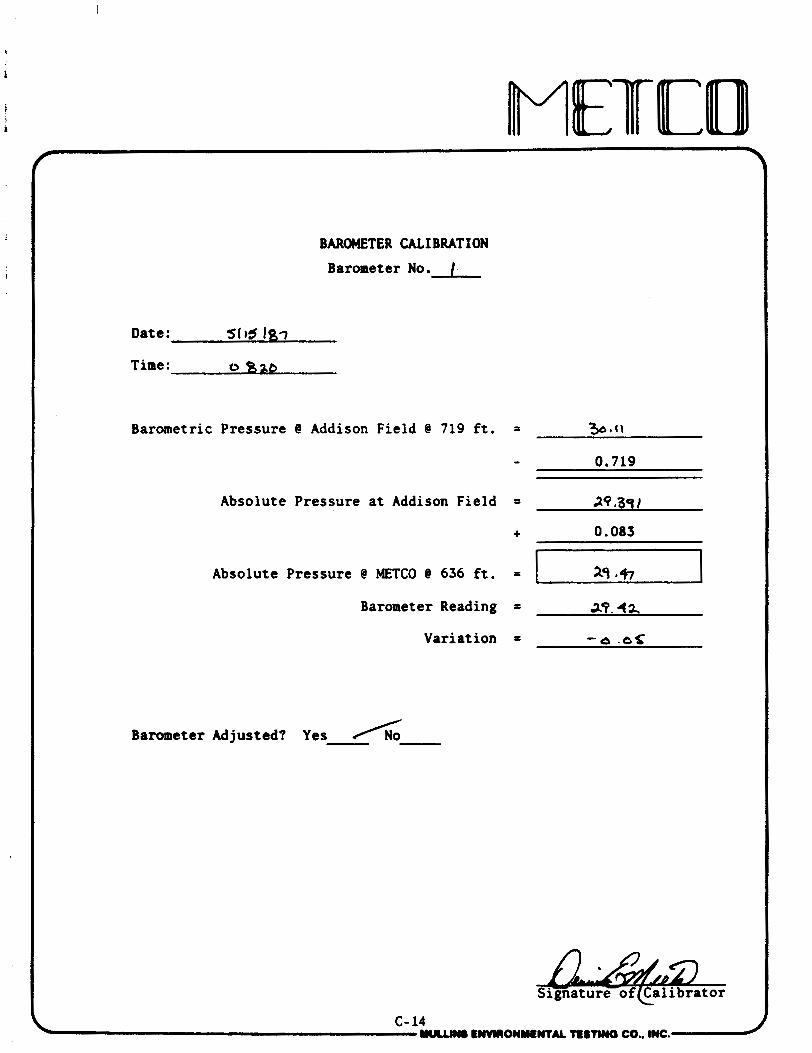
BAROMETER CALIBRATION
Barometer No. /
Oat e : 505
Time : u
Barometric Pressure @ Addison Field @ 719 ft. = 36,(\
- 0.719
Absolute Pressure at Addison Field = 29 .39 1
+ 0.083
Absolute Pressure @ METCO @ 636 ft. =
Barometer Reading = AT. 4Z
Variation = -a .aS
Barometer Adjusted? Yes - & -
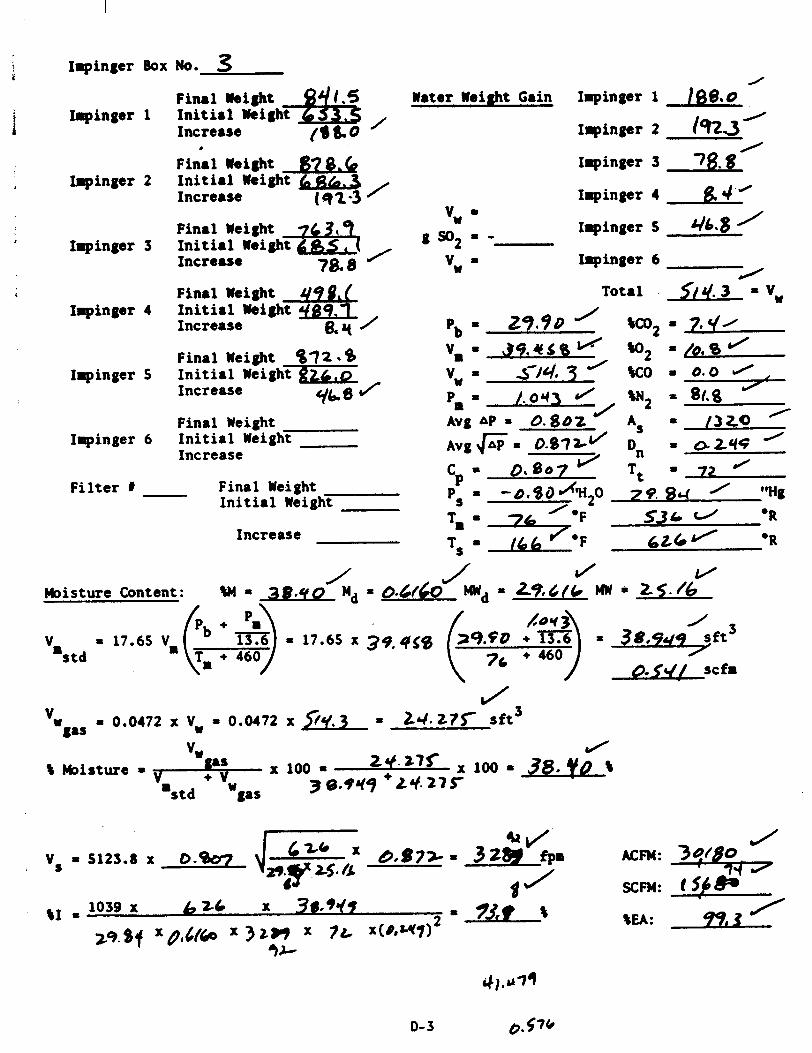
r I g i n g e r Box No. 3
I Water Weight Gain Impinger 1 IB8.0
I Impinger 1 Increase I q i n g e r 2 /*3'
/ Final Weight 8.6 I q i n g e r 3 78.8
Impinger 2 I n i t i a l Weight Increase (92-3 ' Impinger 4 & 4 (
Final Weight "w ' Impinger S
1 SO2 = - 46%8 / Impinger 1 I n i t i a l Weighs,
Increase 78.8 vw = Imp inger 6 /
a Final Weight 49 #.( Total 5 . 3 Impinger 4 I n i t i a l Weight 4fi9.7-
Increase 0 4 ' pb ' 29.90 ' \co2 = 2. q'
Final Weight % 7 2 ~ % V, = 3 4 . 4 ~ 8 ~ W2 =/0.0
I q i n g e r S I n i t i a l Weigh- V, = 4 , 3 WO = 0.0 J , Increase yk0 J
' /. %J2 = 81.8
A V ~ AP = 0.802 .0 /320 / Final Weight Impinger 6 I n i t i a l Weight
As = AV~G = 0 . 8 7 % ~ = 024C
/
Increase 'n Tt = ' Z J
F i l t e r t - Final Weight I n i t i a l Weight 2 9. 534 ' "Hg
53L 0 R Increase 6 ~ 6 ~ R
/ J r / r / Moisture Content: w = d,B.qn nd = 0.40 wd = L?,L(c mi = ZSJ6
vB = 17.65 Vm : 9 = 17-65 X 3% 11.
s t d
vw / \ ~ o i s t u r e = ,+ x 100 = 24t.27C x 100 = 38.70 t
.std w 30.9r(9 * ~ 1 ( . 2 ? r gas
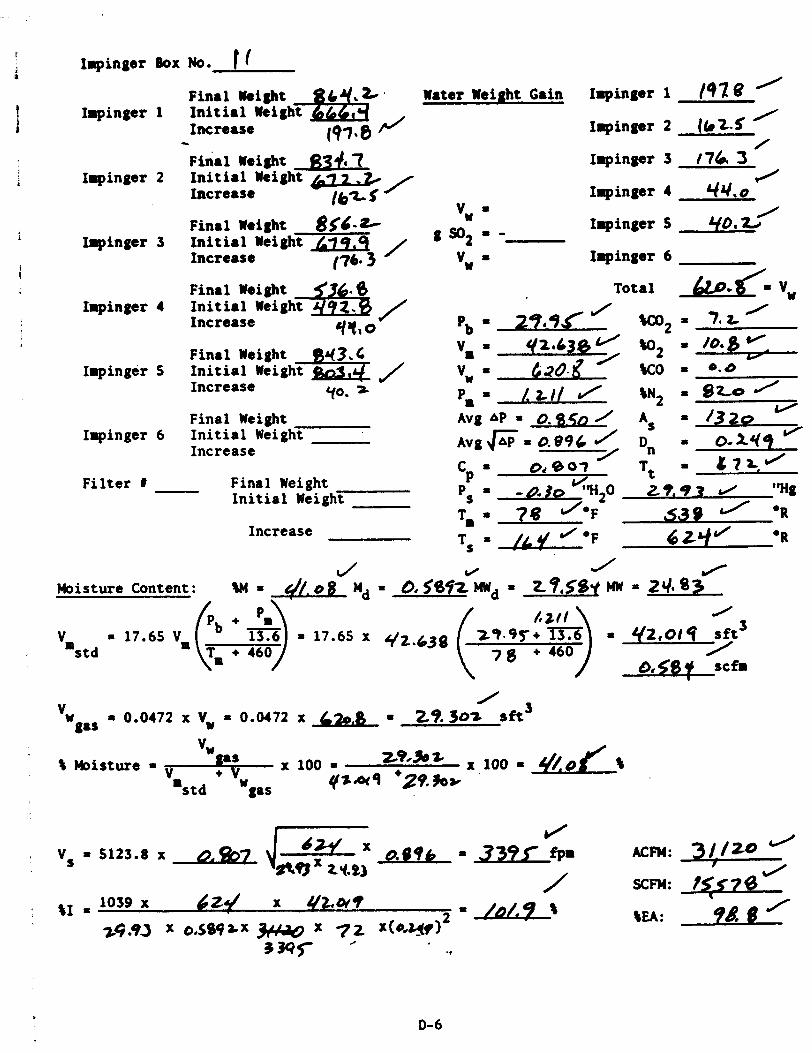
I I q i n g e r )ox ~ o . 1
Final Weight ~ t ~ ~ q ~ . water M i a h t ~ a i n Impinger 1 197 8 ' Impinger 1 I n i t i a l Weight
Increase 197-8 r / Impinger 2 (bZ-5 /
- /
Final L ight ~ 3 4 7 I q i n g e r 3 176 3 - Impinger 2 I n i t i a l Weight -,- 4
Increase 16% 1 I q i n g e r 4 44.0 vw = /
Final Weight %$/-* Impinger S YO, & I q i n g e r 3 I n i t i a l Weight L79,q g902 = -
Increase 176.3 = Impinger 6
Final Weight Impinger 4 I n i t i a l weigh#s /' /' w2 = 7 . t / Increase q'c, o pb ~ 9 ~ 9 <
Final Weight "8 ' 42.436 W2 = 10. s "--
Impinger S I n i t i a l Weigh* / I ~ ~ t 9 . f / (to = 8-4 Y
Increase c(0. a p~ I Lrr/ J a~~ = 920
, / / A = I3z0 Y
Final Weight Avg AP = 0 . S . 5 ~ Iapinger 6 I n i t i a l Weight Avg, /T-0 .e96 J D, = 0 . ~ 9 /
Increase Oc 8 0 7
/ c~ - Tt
= C 7 + / F i l t e r F ina 1 Weight Ps = - 0 . 3 ~ %i20
I n i t i a l Weight 29.93 L/ "HO
T. v'o - 38 F 2539
Increase TS
- / L J J O F 62qJ OR
/
vm s t d = 17.65 \(.. Tm + + 9 460 = 17.6, x qz.,, = 42,01 9 / sft3
0.58f scfm
vw a Moisture = ,+ X 100 = z9,k.+ xI0, - & @ / %
y-4 +29.90* 'std w gas
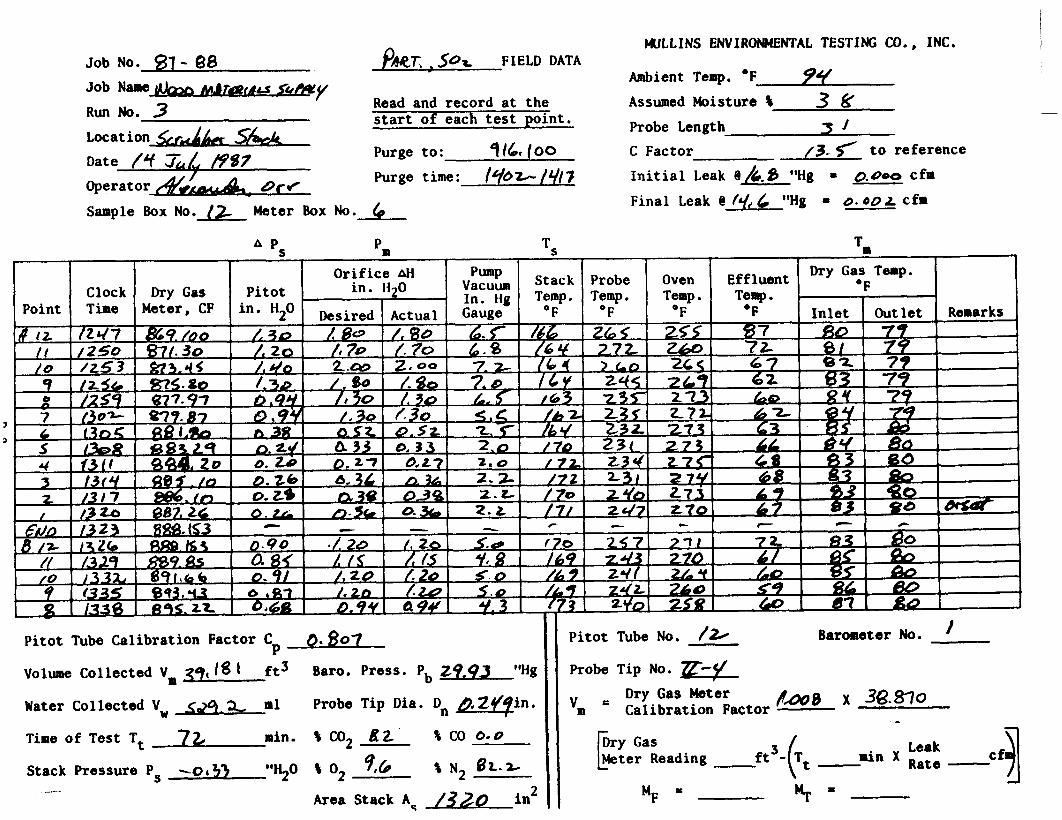
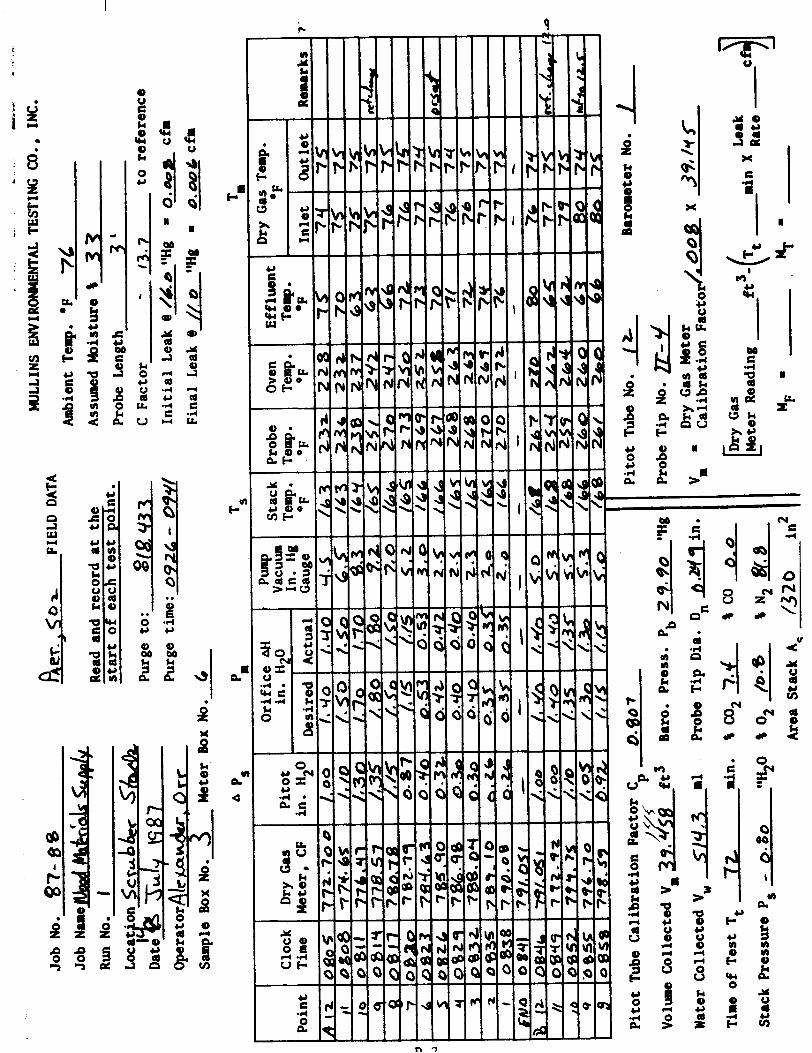
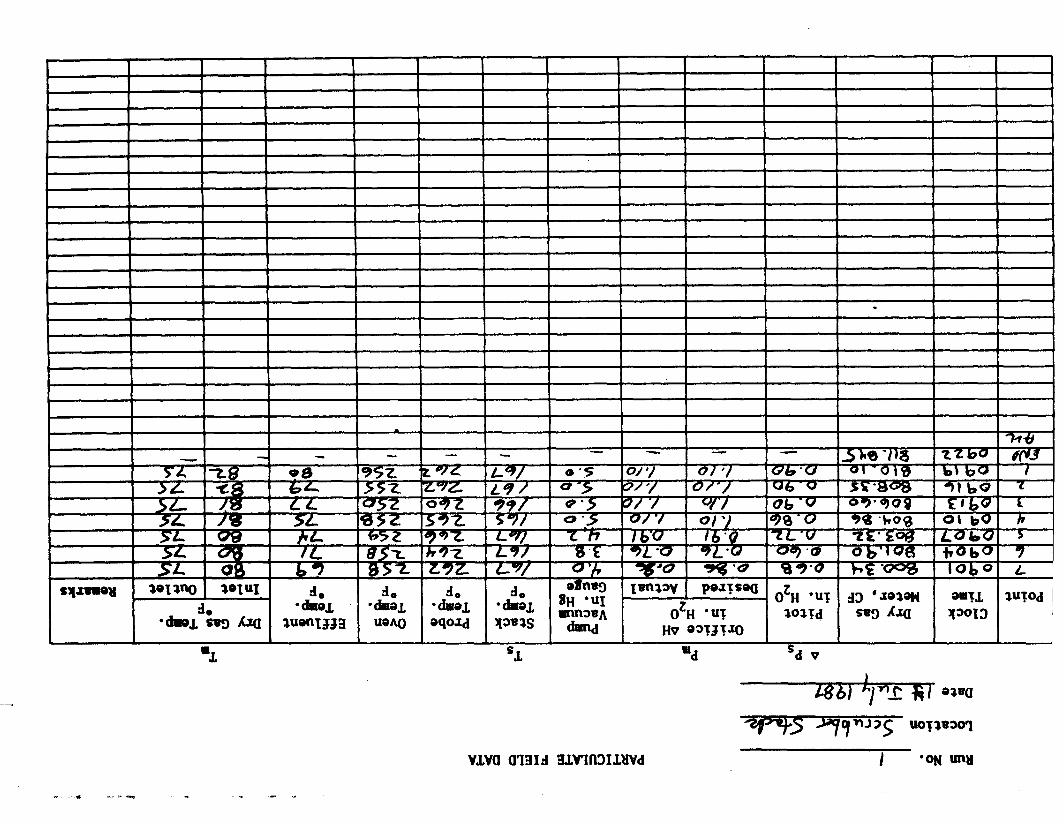
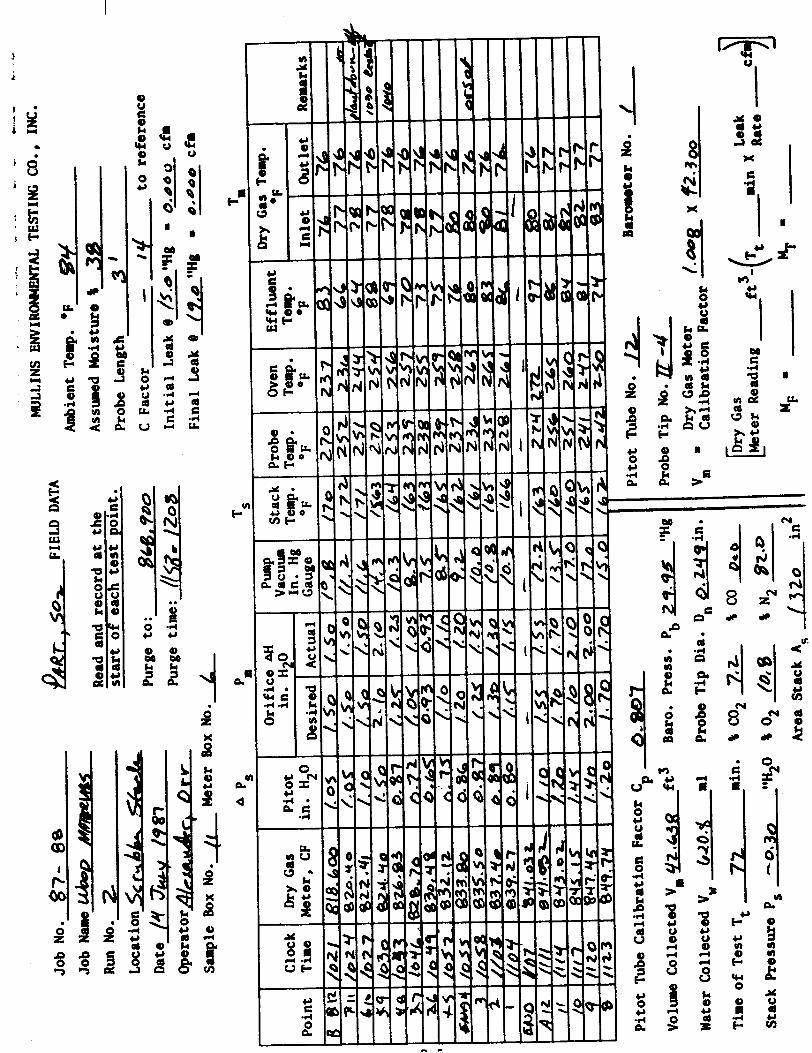
MULLINS ENVIRONMENTAL TESTING CO., INC. ~ o b No. $7 - 88 f??e~. .sO~o, FIELDDATA
Job Name - , t a u Y I ~ Y
R u n No. 3 Read and record a t the s ta r t of each tes t point.
~ o c a t ion- .$jr&~ Date /? zh/, /9%7 operator &L. D C ~
Purge to: 4 16. (00
Purge time: /qbL-/q/7 Sample Box No. [z hkter Box No. 6
Ambient Temp. O F
Assumed Moisture S 3 Probe Length 3 /
C Factor f 3- f t o reference
In i t i a l Leak @ b.8 I*Hg = 0.0-o cfm
Final Leak @ lqd 4 **Hg = o. a 0 L cfn
Pitot Tube Calibration Factor C 0.807 P Volume Collected Vm qql18 ft3 Baro. Press. Pb 29.93 "Hg
Probe Tip Dia. D,,b.Zq?in. Water Collected Vy 6201. Z m1
Time of Test Tt 7& min. Z C02 8 z . 8 CO 0-0
9,& 8 N2 @ L - z Stack Pressure Ps -0433 *@Hz0 Z O2
Area Stack As /320 in2
Pitot Tube No. /& Barometer No.
Probe Tip No. n-f V,,, a
Dry Gas Meter Calibration Factor
bkwa x 38.870 -
ft3- (Tt Leak - M~ = % =
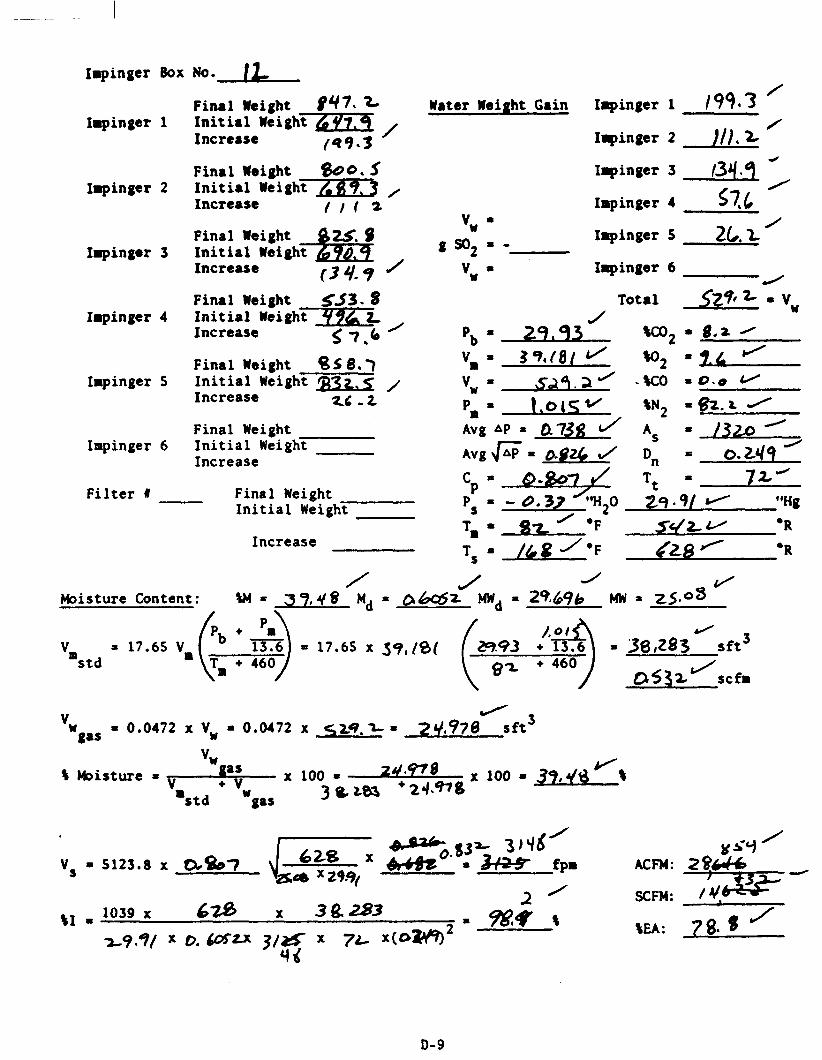
Impinger Box No. (L /
Fina l Weight $ 4 7 . 2 Lter Weight Gain Iapinger 1 199.3 Impingar 1 i n i t i a l weigh-, /
Increase (49.3 I q i n g e r 2 ) / I . Z
F i n a l Weight $00.5 Impinger 2 I n i t i a l weigh-3 ,
Increase / I ( 2 I
Impinger 4 57.4 "w = / Final Weight Impinger 5 2C, I,
Impinger 3 I n i t i a l f SOt = - Increase 134.9 ' vw I Iapinger 6
J
Fina l Weight 5 5 3 . % T o t a l s z ~ ~ ~ = V w Impinger 4 I n i t i a l ~e igh-~
Increase J
57.6' P, = 29.93 \c02 = 8, + A -
F i n a l Weight %58.') ". - 3 9 , ( 8 / J W2 = Z L Impinger 5 I n i t i a l Weight a vw = S ~ 4 . a ~ -%co = O . O
Increase 2 4 - 2 P* = t .o lqv w2 = 82. i J
Fina l Weight Impinger 6 I n i t i a l Weight
Increase C p = @.%07_-/ Tt = 7;t"
F i l t e r # Final Weight I n i t i a l Weight Ps I - 0.32 0 2 9 . 9 / "Hg
T. ' ilr *F s4t *R Increase
Ts = /&&?/*F a s R
Moisture Content: W = 3 9.4 8 Md 1 \
"m s t d = 17.65 Vm ('. ' 9 = 17.65 x
Tm + 460
"w = 0.0472 x V, = 0.0472 x 9 . = 2q / 3 gas
,978 s f t
t Moisture = Vwgas x 100 = 24*QIe x 100 = 39.46 .std + "w 3Uz03 + 2Jb*8
gas
ACFM :
SCFM:
%EA:
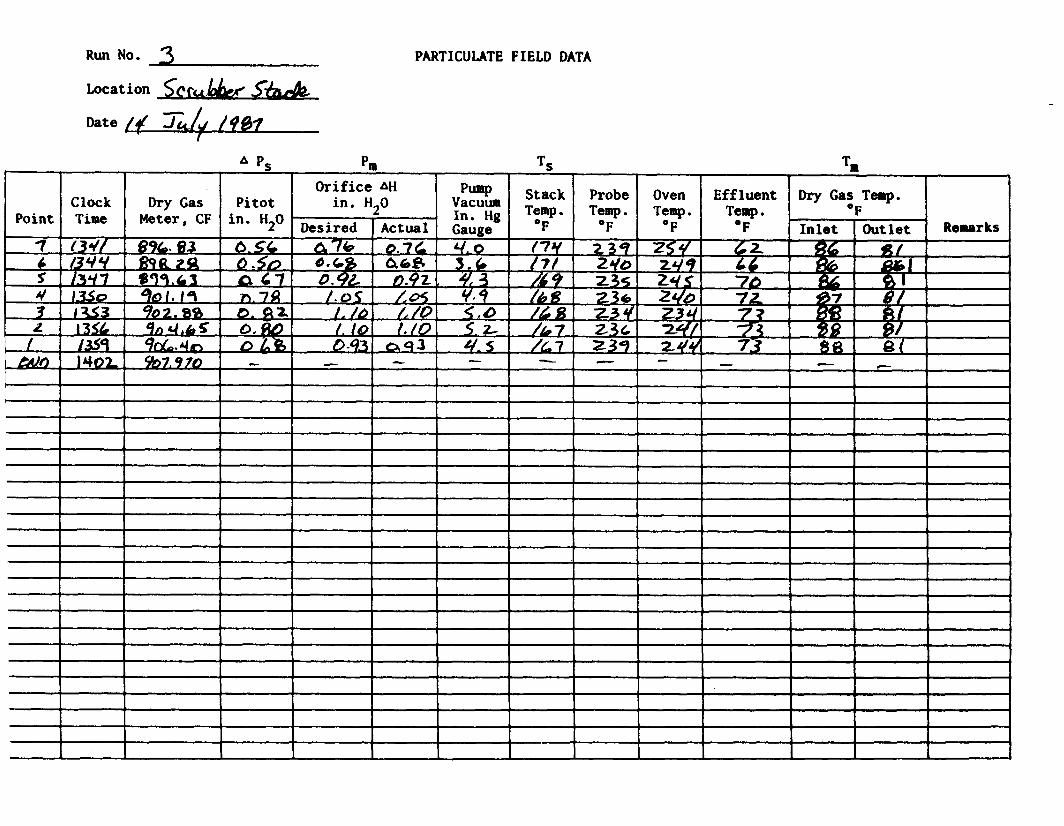
Run No. 3
- Date // J a
r
PARTICULATE FIELD DATA
Analytical Data
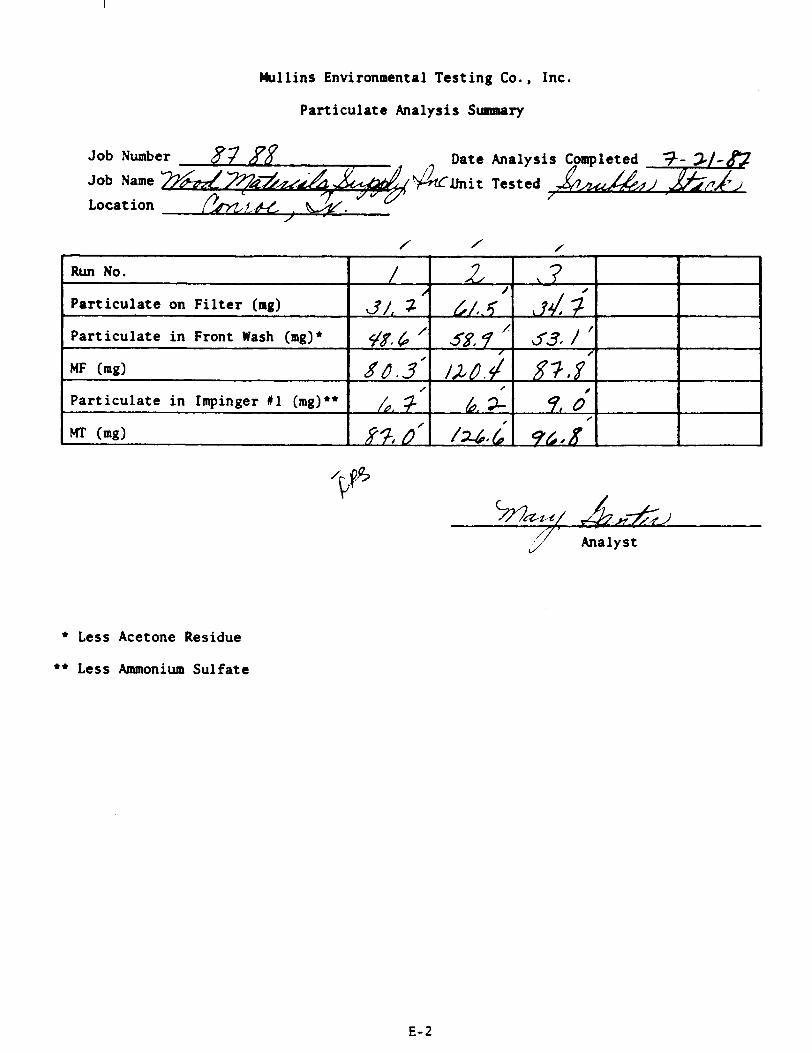
Mullins Environmental Testing Co., Inc.
Particulate Analysis Summary
Job Number 87 If Date Analysis Completed 3- 2/-&? Job Name %Unit 6' Tested &&,,) &pkj
/ Locat ion
,'' Analyst J
r
Run No.
Particulate on Filter (ng)
Particulate in Front Wash (mg)*
MF (mg)
Particulate in Impinger U l (mg) **
(mg)
Less Acetone Residue
** Less Ammonium Sulfate
/ / /
31, 7 / a . < s18.6 /
80.3' /
7 20'
5$# 7 L
/,LO./ /
6, 3-
I U , ~
53# 1 ' /.
83.8 #
9, 0 /
qd0x
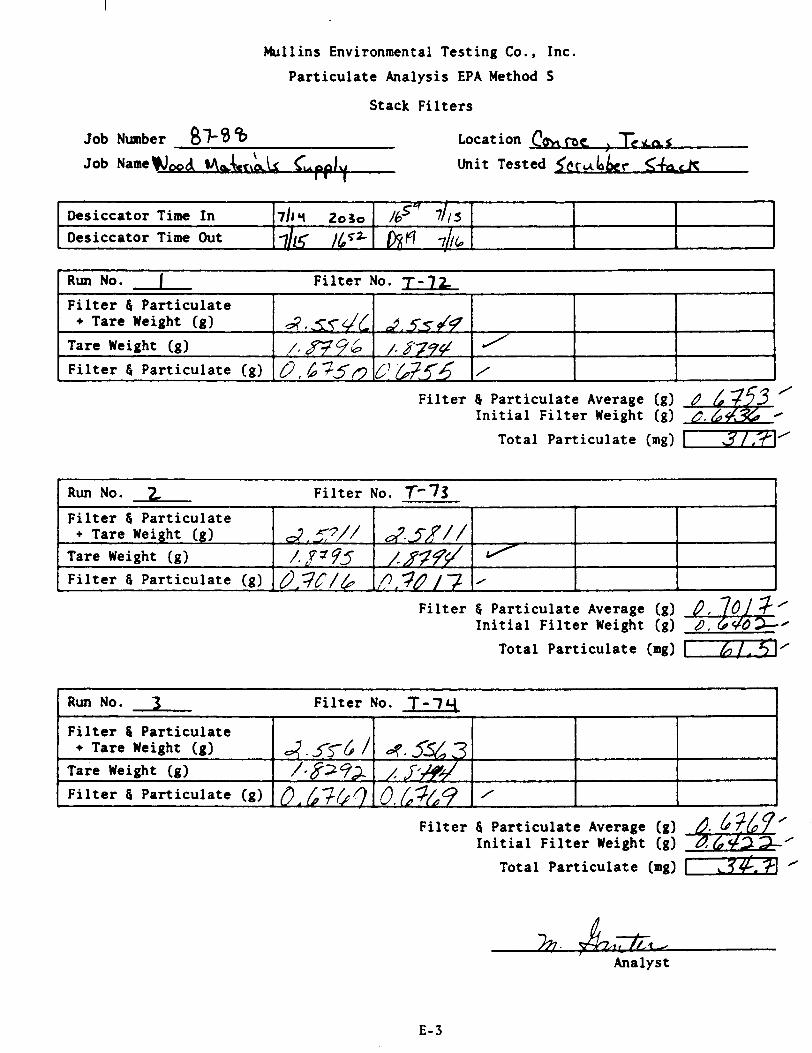
Mullins Environmental Testing Co., Inc.
Particulate Analysis EPA Method 5
Stack Filters
Job Number 8F 8 0 Job ~ a r n e Q ~ ~ d w,i \
e c \ a
Location C* ;
Unit Tested
Filter 8 Particulate Average (g) Initial Filter Weight (g)
Desiccator Time In
Run No. I Filter No. T-72
Total Particulate (mg) I]'
Desiccator Time Out 7 6 hr(l 7hb i
711 2 0 3 ~ /bSY 7/15
Filter 6 Particulate + Tare Weight (g)
Tare Weight (g)
Run No. 2 Filter No. T-73
1
a , ~ y J d ,/. 8 6
Filter & Particulate Average (g) Initial Filter Weight (g)
Filter & Particulate (g) 10, 6 3 5 ~
Filter 6 Particulate + Tare Weight (g)
F
Tare Weight (g)
Filter & Particulate (g)
Total Particulate (mg) 7 6 1 f l ~
a , s j / q /.8?7# /
L! M q 4
A, ~ 7 / /
/. 8175
Filter 8 Particulate Average (g) Initial Filter Weight (g)
L 3
/
5f// /.677/
Run No. 3 Filter No. f -7
Total Particulate (mg) 1-31
Filter 6 Particulate + Tare Weight (g)
Tare Weight (g)
Filter & Particulate (g)
Analyst
fl 1
4 . 5 d /$W,J 0 . L3k3
4.5%3 / p ~ d o./,%q
1
/
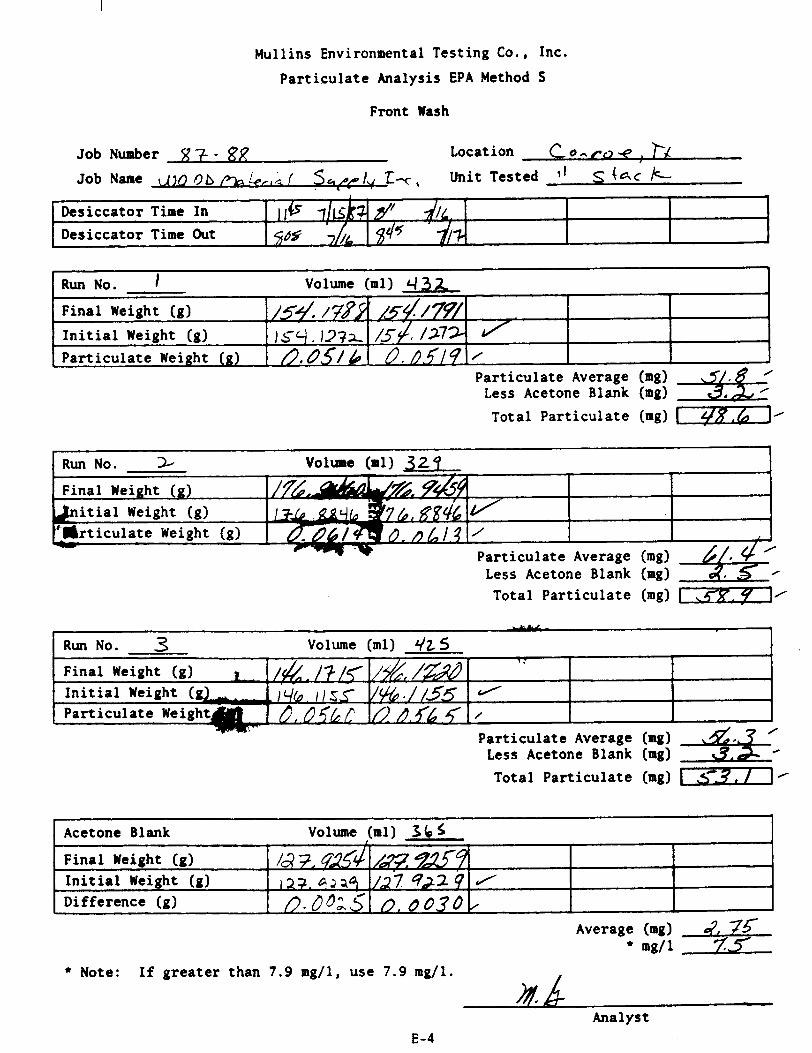
Mullins Environmental Testing Co., Inc.
Particulate Analysis EPA Method S
Front Wash
Job Number 8 3. - gR Locat ion
Unit Tested l ' ,C (GC k 1 I
Desiccator Time In d / ~ , Desiccator Time Out
Less Acetone Blank (mg) Total Particulate (mg)
Run No. I Volume (ml) 4 3 2
Particulate Average (mg) Less Acetone Blank (mg)
Total Particulate (mg)
J N
Average (eg) d, 75 ng/l
Particulate Average (mg) Less Acetone Blank (mg)
Total Particulate (ma) [-]]I
/54//77/ /5/* 1273
Final Weight (g)
Initial Weight (g)
Particulate Weight (g)
Note: If greater than 7.9 ng/l, use 7.9 mg/l.
/54 BE' I sLi . 137r f l . 051 L
Analyst
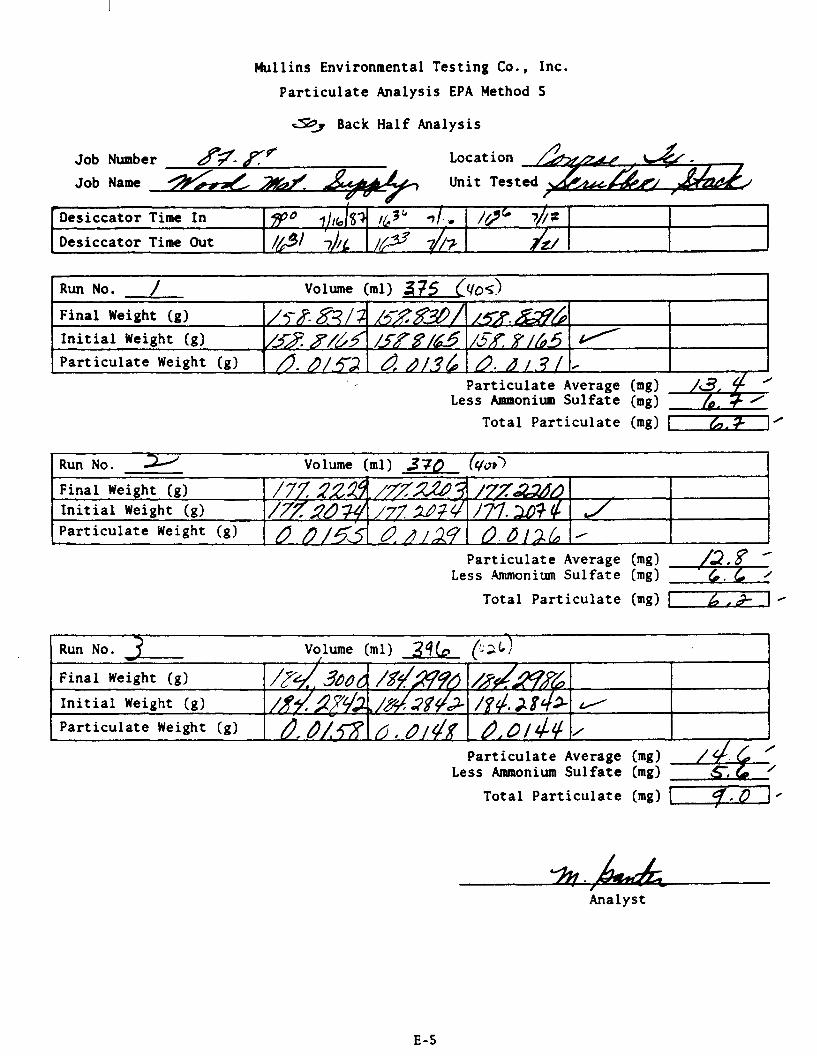
Mullins Environmental Testing Co., Inc.
Particulate Analysis EPA Method 5
;bl Back Half Analysis
Job Number 87- zf Locat ion
Job Name Unit Test
Final Weight (g) / ?' /78~3?/ - A g . &Zh Initial Weight (g) /52 z/M / ! n 3 / & 5 /d-x z /b 5 Particulate Weight (g) d/.TJ d 6/36 0. 6 /.? / f l
I
Particulate Average (mg) Less Ammonium Sulfate (mg)
Desiccator Time In 9' 7/16/8? 8 3 ' 71. r
Desiccator Time Out / ; j / ~ /d9 47
Total Particulate (mg) 1-1
/g' 7h?
A/
Particulate Average (mg) Less . h o n i u m Sulfate (mg)
Total Particulate (mg) 1-1
r Run No. Volume (ml) 376 ( q u a
Particulate Average (mg) Less Ammonium Sulfate (mg)
J I
Final Weight (g) Initial Weight (g) Particulate Weight (g)
r
Run No.
Total Particulate (mg)
Analyst
/7~- 9
@,?/A4
J
Final Weight (g)
Initial Weight (g)
Particulate Weight (g)
/- / 7 2 ~ 7 g / 7 7 . 2 ? $
OD12L
/ ~ J f l ? d /fdd LB& D,o/&
/$/ 3606 / g / f l ~& /x/&'L/!A C /d ,3842 0. d/:% 4. a/#%
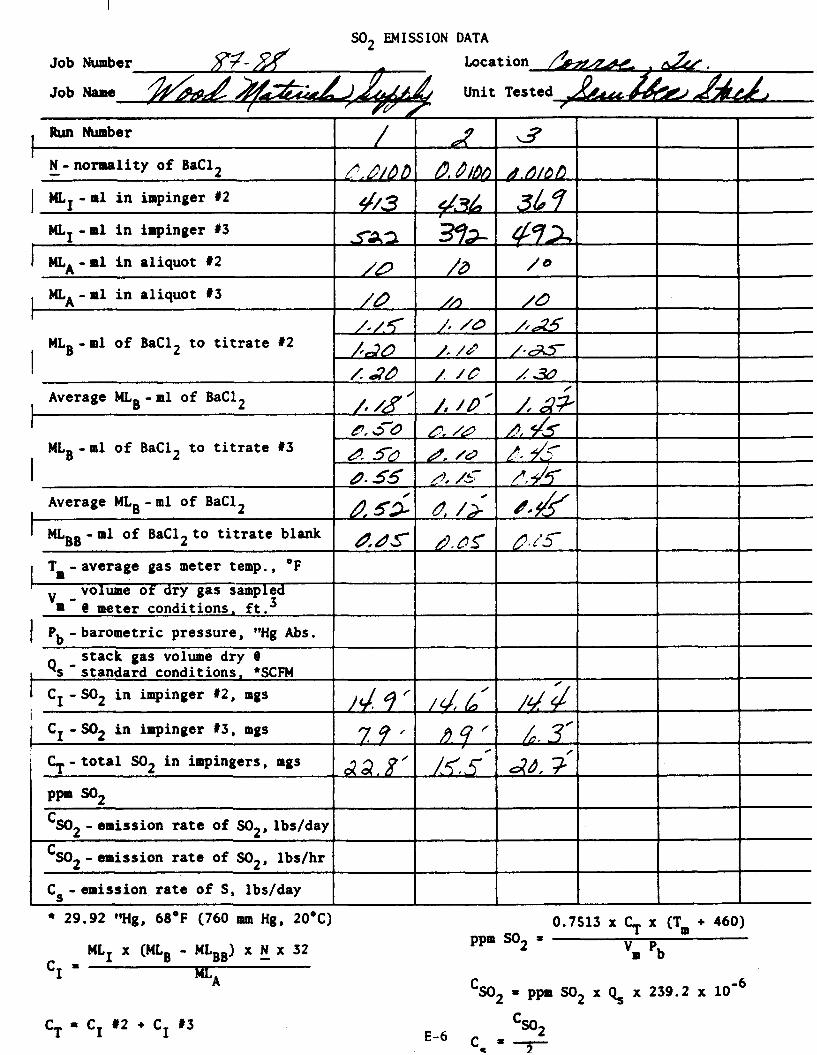
SO, EMISSION DATA
Average MLB-ml of BaC12 /# 18 I
Run Number 3
MLB-m1 of BaC12 to titrate 13 I
N - normality of BaCIZ - I MLI - m1 in impinger 12
ML, -m1 in impinger #3
MLA-m1 in aliquot U2
MLA-ml in aliquot 1 3
MLB-ml of BaC12 to titrate 12 1
Average MLB-ml of BaC12 I A 55 I MLBB -m1 of BaC12 to titrate blank 1 d 6 r
C.D/D D #/3
I T~ - averbe gas meter temp., OF I -
v - volume of dry gas sampled m @ meter conditions, ft. 3 1
D.
I Pb - barometric pressure, "Hg Abs . stack gas volume dry @
I Q~ - standard conditions. *SCFM
d/2!4&/60
34 9
I
/ d
/U //A5 /-a5
10
/D /-K LAO
I CI - SO2 in inpinger .12, mgs i
/a /A
,'. /D
1- /6'
14 9 / CI -SO2 in impinger 1 3 , mgs
Cs -emission rate of S, lbs/day
7 7 / CT-total SO2 in impingers, mgs
PPm so2 'SO2 - emission rate of SO2, lbs/day 'SO, - emission rate of SO,. lbr/hr
29.92 'Hg, 68'F (760 mm Hg, 20°C)
d a . 8 /
'SO2 = ppm SO2 x 9, x 239.2 x
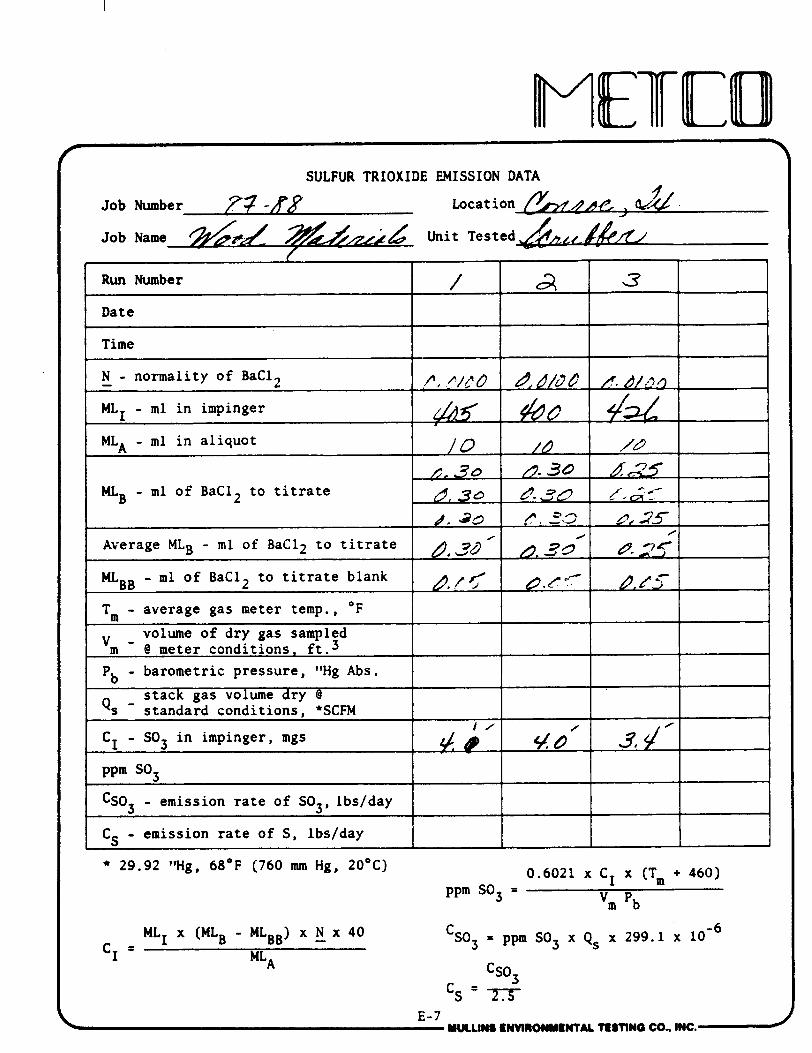
r SULFUR TRIOXIDE EMISSION DATA
Job Number Oe J , a&&.
Job Name
N - normality of BaC12 - 1
C
MLI - ml in impinger MLA - m1 in aliquot / O / D /4'
n, 30 #. 30 MLB - ml of BaC12 to titrate d,30 /..TO
7
3 2 Run Number
Date
Time
I
/
Average MLB - ml of BaC12 to titrate MLBB - ml of BaC12 to titrate blank
C S O ~ - emission rate of SO3, lbs/day
/
&. 38
T, - average gas meter temp., 'F
volume of dry gas sampled 'm - @ meter conditions, ft.3
Pb - barometric pressure, "Hg Abs . stack gas volume dry
Qs - standard conditions, lSCFM cI - so3 in impinger, mgs PPm SO3
I + y ?. -
29.92 "Hg, 68OF (760 mm Hg, 20°C)
4
8-20
J./J- 1
90'
I
CS - emission rate of S, lbs/day
-6 = ppm SO3 x Qs x 299.1 x 10
/
3, #
I
k- 1 MULLIN8 IWVIRONNINTM TESTING CO.. INC.-
/
a. 2 7 4 7 1

Plant Operational Data
APPENDIX F
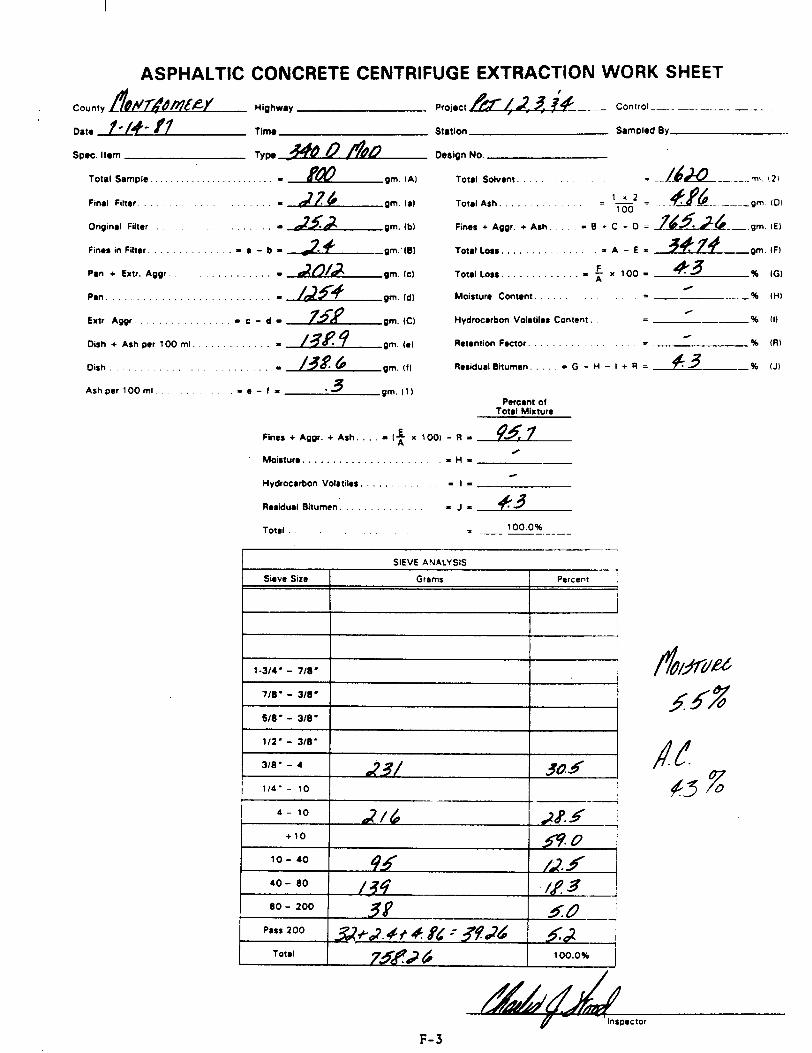
ASPHALTIC CONCRETE CENTRIFUGE EXTRACTION WORK SHEET
County &I~~~M[EY Highway r o c & & - Control
Date ?- 14- f7 Time Station Sampled By -
T y P -D bsipn No. Spec. Item
Total Sample. . . . . . . . . . . . . . . . . . . . . . . = L g m . Total Solvmt. . . . . . = ...L6&-- ml. ( 2 ,
Final Filter. . . . . . . . . . . . = 22 gm. la) . . . . . . . . 100
Orig~nal Filter . . , . . . . . . . = gm. lbl Fines + Agpr + Ash. . . . . = 8 + C * 0 = 2%2f~24&- .gm. ( E l
. . . . . . . . . . . . . . Fines in Filter. . . . . . . . . . . = e - b = 4 -gm.'(Bl Total Loss. = A - E = 34 7 gm. IF)
. . . . . . . . . . . . Pan + Extr. Apgr. . . . . . . . . . . . . . . . . I dd/d gm. Ic) Total Loss. = x 100 = 43 % IGI F
Pan . . . . . . . . . . . . . . . . .
Extr. A w r . . . . . . . . . . . . . . .
. . . . . . . . . . . . . . = &e gm. (dl Moistura Contant.
Hydrocarbon Vdatiles Content
/
= - % IHI
/
= - - % [I)
&?4 4
Dish + Ash per 100 mi. . . . . . . . . . . . . = 13 gm. (el Retantion Factor. . . . . . . . . = (RI
. . . . . . . . . . . . . . . . . . Dish. = /3g 6 gm, (t) Residual Bitumen. = G - H - I + A = # 3 _% (J) . . .
Ash per 100 ml = e - f = -3 pm. I l l Percent of
Total Mixture
Fines + A~QI + Ash. . . . = ( f x I 00) - R = 93: 7 /
Moisture. . . . . . . . . . . . . . . . . . . . = H =
Hydrocarbon Volatiles .
Rasidual Bitumen. . . . . . . . . . . = J = 43
1 SIEVE ANALYSIS
Sieve Size I Grams Percent
I I
APPENDIX G
Chain of Custody
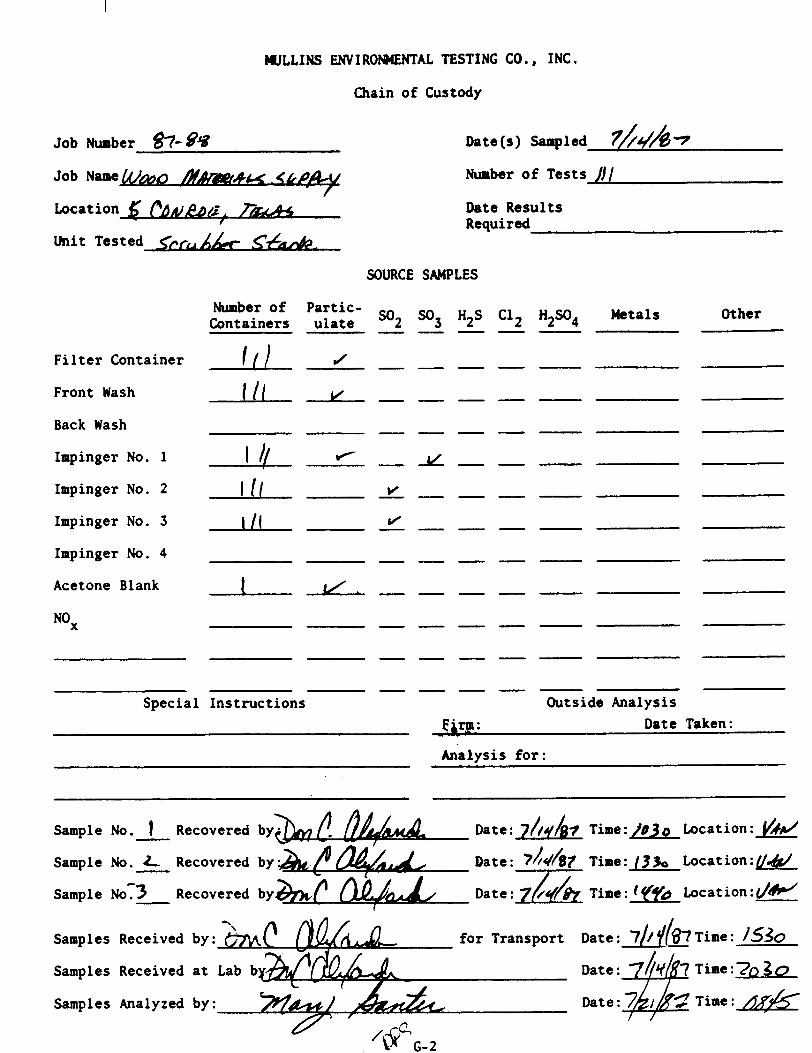
MJLLINS ENVIROIWENTAL TESTING CO., INC.
Chain of Custody
Job Number &- @%f
Job Name #&&&c(. <~p&q 1
Location i; 7- I
Unit ~ e s t e d - B -
Date(s) Sampled 7/~/k7 Number o f Tests / ) I
Date Results Required
SOURCE SAMPLES
Number of Par t ic- SO2 SOj H2S C12 H2S04 Metals Other Containers u l a t e ----- F i l t e r Container 1 ( 1 J ----- Front Wash -~LA----- Back Wash ----- ImpingerNo.1 I / / - A d - - -
Impingcr No. 2 1 / Y ----- ImpingerNo.3 I / [ J ----- Impinger No. 4 ----- Acetone Blank -I/.----
----- Special Ins t ruct ions Outside Analysis
Fq: Date Taken:
Analysis f o r :
Sample No. 1 Recovered b - Date: 7//5'h;r Time:]* Location: C/AJ Sample No. L Recovered by - Date: 744437 fime: (3% ~ o c a t i o n : g 4 d
Sample NO^ - Recovered by&)$ Date: 7bq/p, Time: (ff& ~ o c a t i o n : d W f
Samples Received by: fo r Transport Date: 7//f/@Time: / S ~ O
Samples Received a t Lab b time:-
Samples Analyzed by: ~ i m e : &
APPENDIX H
Resumes of Test Personnel
MUUINS ENVIRONMENTAL TESTING CO., INC. P.O. Box 598 Addiron. Tx 75001
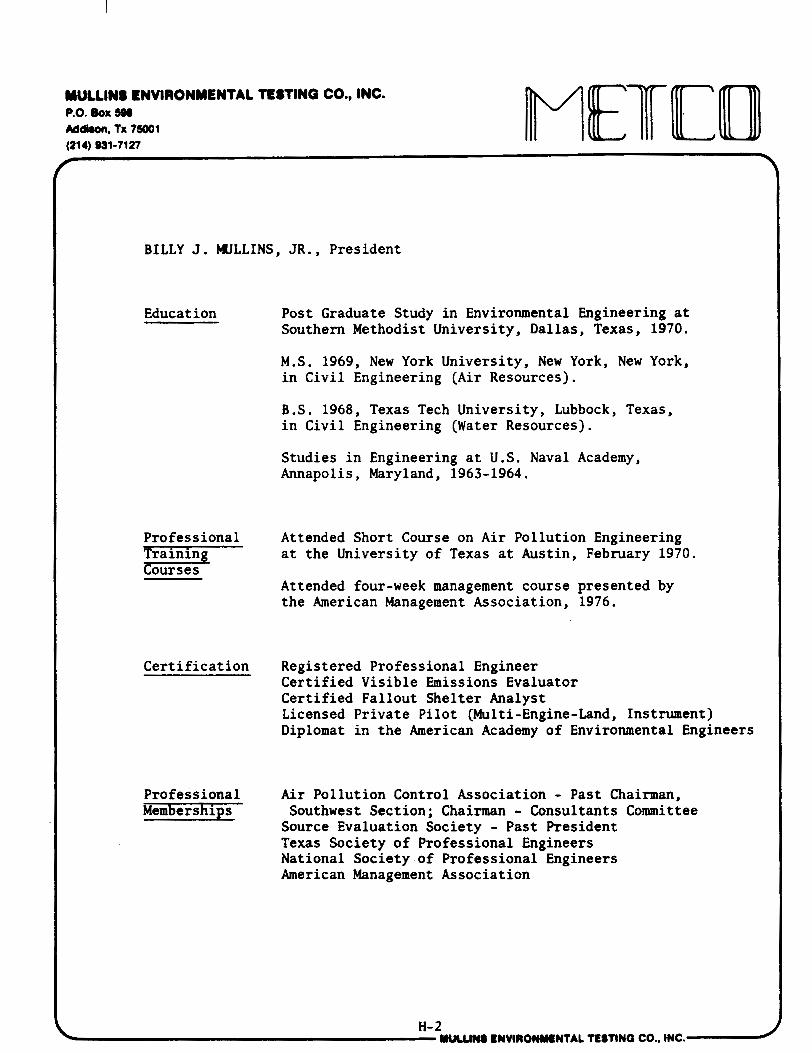
BILLY J. MULLINS, JR., President
Education Post Graduate Study in Environmental Engineering at Southern Methodist University, Dallas, Texas, 1970.
M.S. 1969, New York University, New York, New York, in Civil Engineering (Air Resources).
B.S. 1968, Texas Tech University, Lubbock, Texas, in Civil Engineering (Water Resources).
Studies in Engineering at U.S. Naval Academy, Annapolis, Maryland, 1963-1964.
Professional Attended Short Course on Air Pollution Engineering Traininn at the University of Texas at Austin, February 1970. Courses
Attended four-week management course presented by the American Management Association, 1976.
Certification Registered Professional Engineer Certified Visible Emissions Evaluator Certified Fallout Shelter Analyst Licensed Private Pilot (Multi-Engine-Land, Instrument) Diplomat in the American Academy of Environmental Engineers
Professional Air Pollution Control Association - Past Chairman, Memberships Southwest Section; Chairman - Consultants Committee
Source Evaluation Society - Past President Texas Society of Professional Engineers National Society of Professional Engineers American Management Association
H- 2 YULLfN8 LNVIRONWNTAL TESTING CO., INC. 2
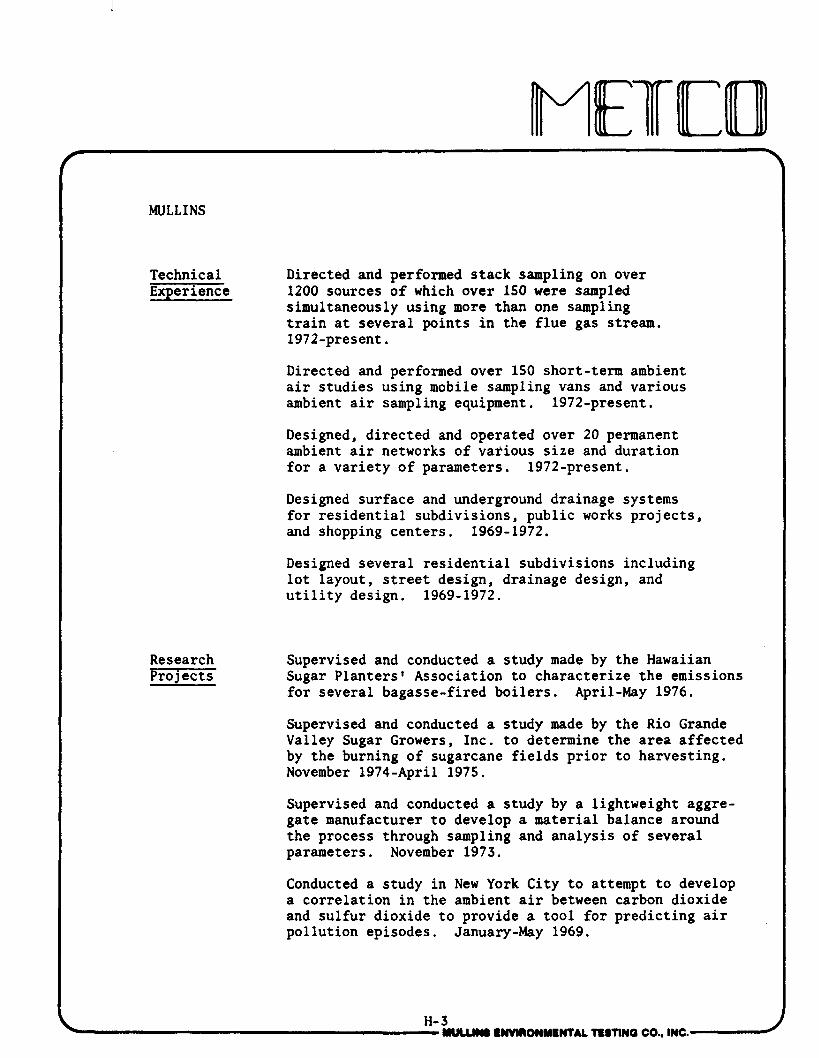
MULLINS
Technical Experience
Research Pro j ec ts
Directed and performed stack sampling on over 1200 sources of which over 150 were sampled simultaneously using more than one sampling train at several points in the flue gas stream. 1972-present.
Directed and performed over 150 short-term ambient air studies using mobile sampling vans and various ambient air sampling equipment. 1972-present.
Designed, directed and operated over 20 permanent ambient air networks of various size and duration for a variety of parameters. 1972-present.
Designed surface and underground drainage systems for residential subdivisions, public works projects, and shopping centers. 1969-1972.
Designed several residential subdivisions including lot layout, street design, drainage design, and utility design. 1969-1972.
Supervised and conducted a study made by the Hawaiian Sugar Planterst Association to characterize the emissions for several bagasse-fired boilers. April-May 1976.
Supervised and conducted a study made by the Rio Grande Valley Sugar Growers, Inc. to determine the area affected by the burning of sugarcane fields prior to harvesting. November 1974-April 1975.
Supervised and conducted a study by a lightweight aggre- gate manufacturer to develop a material balance around the process through sampling and analysis of several parameters. November 1973.
Conducted a study in New York City to attempt to develop a correlation in the ambient air between carbon dioxide and sulfur dioxide to provide a tool for predicting air pollution episodes. January-May 1969.
H- 3 YUWW INWRONYENTAL t t s t l ~ o CO., mc.
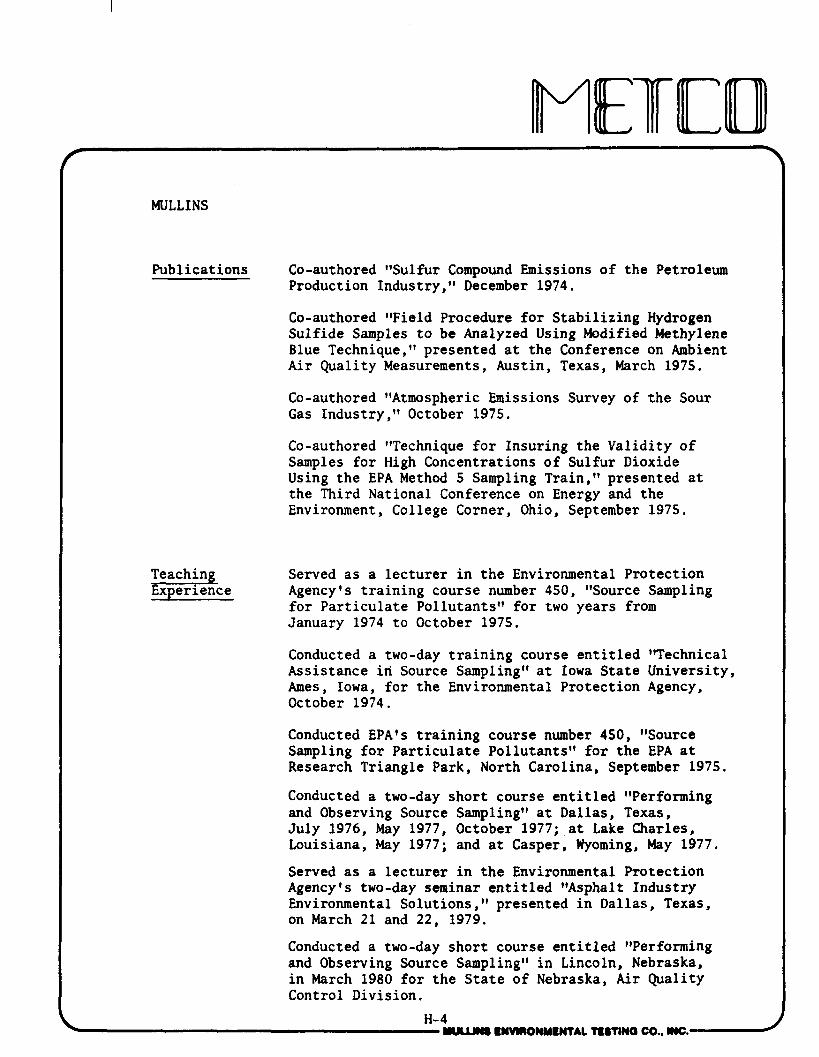
MULLINS
Publications Co-authored llSulfur Compound Emissions of the Petroleum Production Industry," December 1974.
Co-authored "Field Procedure for Stabilizing Hydrogen Sulfide Samples to be Analyzed Using Modified Methylene Blue Technique," presented at the Conference on Ambient Air Quality Measurements, Austin, Texas, March 1975.
Co-authored glAtmospheric Emissions Survey of the Sour Gas Indu~try,~~ October 1975.
Co-authored "Technique for Insuring the Validity of Samples for High Concentrations of Sulfur Dioxide Using the EPA Method 5 Sampling Train," presented at the Third National Conference on Energy and the Environment, College Corner, Ohio, September 1975.
Served as a lecturer in the Environmental Protection Agency's training course number 450, IgSource Sampling for Particulate Pollutantsg1 for two years from January 1974 to October 1975.
Conducted a two-day training course entitled 'lTechnica1 Assistance i~i Source Samplingw at Iowa State University, Ames, Iowa, for the Environmental Protection Agency, October 1974.
Conducted EPA1s training course number 450, ggSource Sampling for Particulate Pollutantsgg for the EPA at Research Triangle Park, North Carolina, September 1975.
Conducted a two-day short course entitled gtPerfonning and Observing Source Samplingv at Dallas, Texas, July 1976, May 1977, October 1977; at Lake Charles, Louisiana, May 1977; and at Casper, Wyoming, May 1977.
Served as a lecturer in the Environmental Protection Agency's two-day seminar entitled "Asphalt Industry Environmental Solutions," presented in Dallas, Texas, on March 21 and 22, 1979.
Conducted a two-day short course entitled lgPerforming and Observing Source Samplingv in Lincoln, Nebraska, in March 1980 for the State of Nebraska, Air Quality Control Division.
H-4 E ~ ~ ~ ~ N Y ~ N T A L nrnwo co., INC. 2
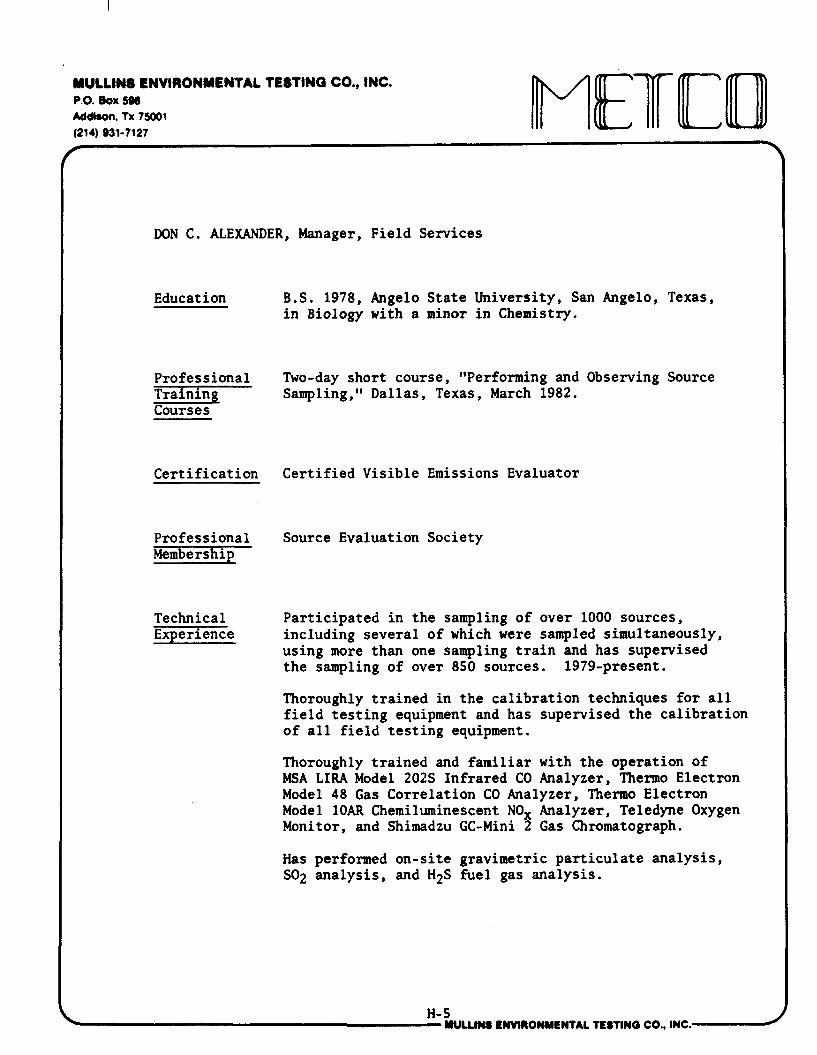
DON C. ALEXANDER, Manager, Field Services
Education B.S. 1978, Angelo State University, San Angelo, Texas, in Biology with a minor in Chemistry.
Professional Two-day short course, "Performing and Observing Source Training Sampling,I1 Dallas, Texas, March 1982. Courses
Certification Certified Visible Emissions Evaluator
Professional Source Evaluation Society Membership
Technical Participated in the sampling of over 1000 sources, Experience including several of which were sampled simultaneously,
using more than one sampling train and has supervised the sampling of over 850 sources. 1979-present.
Thoroughly trained in the calibration techniques for all field testing equipment and has supervised the calibration of all field testing equipment.
Thoroughly trained and familiar with the operation of USA LIRA Model 202s Infrared CO Analyzer, Thermo Electron Model 48 Gas Correlation CO Analyzer, Thenno Electron Model lOAR Chemiluminescent NOx Analyzer, Teledyne Oxygen Monitor, and Shimadzu GC-Mini 2 Gas Chromatograph.
Has performed on-site gravimetric particulate analysis, SO2 analysis, and H2S fuel gas analysis.
H- 5 Y U L W ENWRONMENTAL TESTIN0 CO., INC.
MULLINS ENVIRONMENTAL T ESTlNG CO., INC. p.0. Box sw Addiron, Tx 75001 (214) 831-7127
GREGGORY M. ORR, Environmental Field Technician
Education B.S. 1985, Louisiana Tech University, Ruston, Louisiana, in Geology.
Technical Experience
Participated in the sampling of over 25 sources, including several which were sampled simultaneously using more than one sampling train. Thoroughly trained in all EPA testing procedures. 1986-present.
APPENDIX I
RESUMES OF NUS PERSONNEL
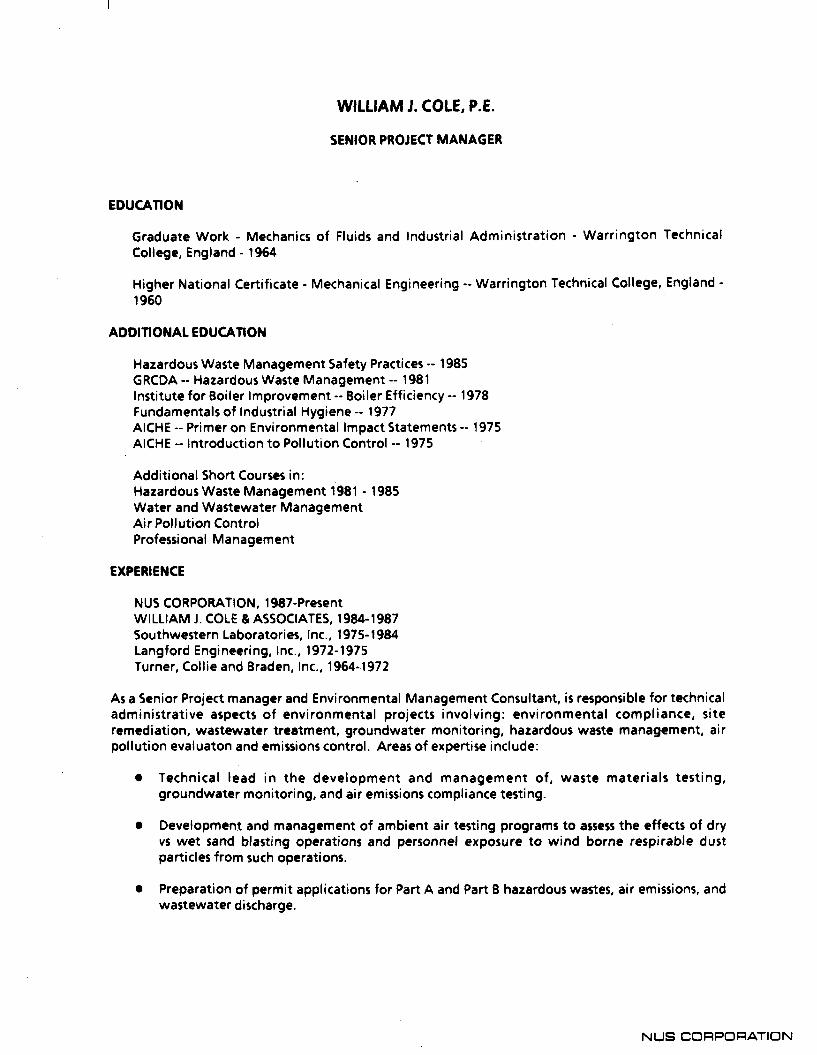
WILLIAM J. COLE, P.E.
SENIOR PROJECT MANAGER
EDUCATION
Graduate Work - Mechanics of Fluids and Industrial Administration - Warrington Technical College, England - 1964
Higher National Certificate - Mechanical Engineering -- Warrington Technical College, England - 1960
ADDITIONAL EDUCATION
Hazardous Waste Management Safety Practices -- 1985 GRCDA -- Hazardous Waste Management -- 1981 Institute for Boiler Improvement -- Boiler Efficiency -- 1978 Fundamentals of Industrial Hygiene -- 1977 AlCHE -- Primer on Environmental Impact Statements -- 1975 AlCHE -- Introduction to Pollution Control -- 1975
Additional Short Courses in: Hazardous Waste Management 1981 - 1985 Water and Wastewater Management Air Pollution Control Professional Management
EXPERIENCE
NUS CORPORATION, 1987-Present WILLIAM J. COLE & ASSOCIATES, 1984-1 987 Southwestern Laboratories, Inc., 1975- 1984 Langford Engineering, Inc., 1972- 1975 Turner, Collie and Braden, Inc., 1964-1 972
As a Senior Project manager and Environmental Management Consultant, is responsible for technical administrative aspects of environmental projects involving: environmental compliance, site remediation, wastewater treatment, groundwater monitoring, hazardous waste management, air pollution evaluaton and emissions control. Areas of expertise include:
Technical lead in the development and management of, waste materials testing, groundwater monitoring, and air emissions compliance testing.
Development and management of ambient air testing programs to assess the effects of dry vs wet sand blasting operations and personnel exposure to wind borne respirable dust particles from such operations.
Preparation of permit applications for Part A and Part B hazardous wastes, air emissions, and wastewater discharge.
NUS CORPORATION
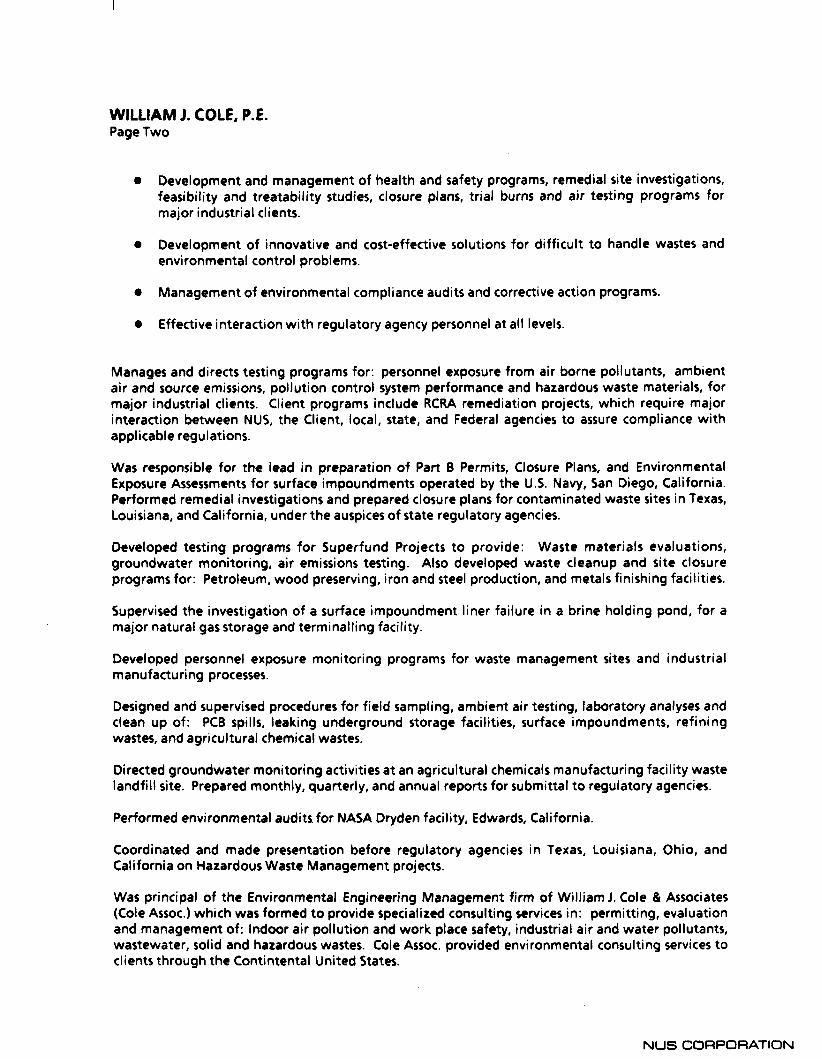
WILLIAM J. COLE, P.E. Page Two
Development and management of health and safety programs, remedial site investigations, feasibility and treatability studie, closure plans, trial burns and air testing programs for major industrial clients.
Development of innovative and cost-effective solutions for difficult to handle wastes and environmental control problems.
Management of environmental compliance audits and corrective action programs.
Effective interaction with regulatory agency personnel at all levels.
Manages and directs testing programs for: personnel exposure from air borne pollutants, ambient air and source emissions, pollution control system performance and hazardous waste materials, for major industrial clients. Client programs include RCRA remediation projects, which require major interaction between NUS, the Client, local, state, and Federal agencies to assure compliance with applicable regulations.
Was responsible for the lead in preparation of Part B Permits, Closure Plans, and Environmental Exposure Assessments for surface impoundments operated by the U.S. Navy, San Diego, California. Performed remedial investigations and prepared closure plans for contaminated waste sites in Texas, Louisiana, and California, under the auspices of state regulatory agencies.
Developed testing programs for Superfund Projects to provide: Waste materials evaluations, groundwater monitoring, air emissions testing. Also developed waste cleanup and site closure programs for: Petroleum, wood preserving, iron and steel production, and metals finishing facilities.
Supervised the investigation of a surface impoundment liner failure in a brine holding pond, for a major natural gas storage and terminalling facility.
Developed personnel exposure monitoring programs for waste management sites and industrial manufacturing processes.
Designed and supervised procedures for field sampling, ambient air testing, laboratory analyses and clean up of: PCB spills, leaking underground storage facilities, surface impoundments, refining wastes, and agricultural chemical wastes.
Directed groundwater monitoring activities at an agricultural chemicals manufacturing facility waste landfill site. Prepared monthly, quarterly, and annual reports for submittal to regulatory agencies.
Performed environmental audits for NASA Dryden facility, Edwards, California.
Coordinated and made presentation before regulatory agencies in Texas, Louisiana, Ohio, and California on Hazardous Waste Management projects.
Was principal of the Environmental Engineering Management firm of William J. Cole & Associates (Cole Assoc.) which was formed to provide specialized consulting services in: permitting, evaluation and management of: Indoor air pollution and work place safety, industrial air and water pollutants, wastewater, solid and hazardous wastes. Cole Assoc. provided environmental consulting services to clients through the Contintental United States.
NUS CORPORATION
WILLIAM J. COLE, P.E. Page Three
Was Manager of Environmental Engineering Services and responsible for marketing and directing, environmental engineering and testing services to clients throughout the southern United States. Services included engineering and analytical evaluation of: Industrial and indoor air pollutants, potable water and wastewater systems for industrial and municipal clients, health and safety programs, solid and hazardous wastes. This position entailed effective interaction between client and regulatory agencies in the permitting of industrial and municipal pollution control facilities.
Was Project Manager responsible for permitting, engineering design, and project management for new and upgraded municipal and industrial, water collection, treatment and distribution systems, and wastewater collection and treatment facilities in the State of Texas.
MEMBERSHIPS
PROFESSIONAL ENGINEER REGISTRATION - Texas
PROFESSIONAL AFFILIATION: Air Pollution Control Association Water Pollution Control Federation Institute of Mechanical Engineers National Society of Professional Engineers Texas Society of Professional Engineers American Society of Mechanical Engineers
NUS CORPORATIOh
MARK A. LESTER
EQUIPMENT TECHNICIAN
EDUCATION
H.S. Carrick High School, 1977 (electronics specialization) Connelley Skills Learning Center, 1978 (electronics) 2nd Class FCC License (with radar endorsement) Monitor Lab's Technical Training Course!, 1978
(sulfur dioxide, nitrogen oxides, ozone, data aquisition systems)
Thermo Electron Technical Training Course, 1981 (sulfur dioxide, nitrogen oxide)
EXPERIENCE
NUS CORPORATION, Houston, Texas, February 1987-Present Energy Impact Associates, Inc., E.I.A., Inc.,
Pittsburgh, Pennsylvania, Technician, 1978 to 1982
NUS Corporation - Air Quality Equipment Technician, responsible for performing and documenting accurate and defensible calibration of instruments and equipment used in Environmental Protection Agency (EPA) and state compliance and prevention of significant deterioration (PSD) sampling. Set- up, maintain and calibrate continuous emissions monitor systems for nitrogen oxides, sulfur dioxides, oxygen, carbon monoxide and hydrocarbons at stationary sources for compliance sampling.
E.I.A., Inc. - Air Quality Technician, responsible for installation, operation and maintenance of air quality/meteorological monitoring networks for the utility and steel industry and procesing and validating data. Speicifc projects included:
Installation and maintenance of an air quality/meteorological system for Niagara-Mohawk Power Company to investigate the affects of air pollutants on agricultural products (1978 - 1981). Equipment included: SO2 analyzers and O3 analyzers, wind speed and direction, delta temperature, dew point temperature, soil moisture gauges, electronic precipitation gauges, associated calibration devices, strip chart recorders and computer data loggers with magnetic tapes.
Conducted performance audits on air quality networks with sulfur dioxide analyzers and high volume particulate samplers (hi-vol) using Thermo Electron Corporation, Monitor Labs, Analytical Instrument Development (AID) and Bendix calibrators for SO2 and a standard reference flow device for hi-vols.
Conducted field tests with isokinetic sampler to assess fugitive emissions from road surfaces and material storage piles in integrated steel mills.
Trained and supervised a staff of twelve E.I.A. personnel in strip chart recorder data reduction,a nd reviewed and analyzed data to insure precision, reliability and validity of strip chart and computer logged data.
NUS CORPORATIC
MARK A. LESTER Page Two
CERTIFICATIONS
NUS Corporation Superfund Division Certification for Performance of Remedial Response Activities at Uncontrolled Hazardous Substance Facilities
Visible Emissions Evaluator, Texas Air Control Board
Sample Packaging, Preservation and Documentation Program for Uncontrolled Hazardous Substances Facilities - NUS Corporation
NUS CORPORATIC
APPENDIX J
FIELD OPACITY DATA
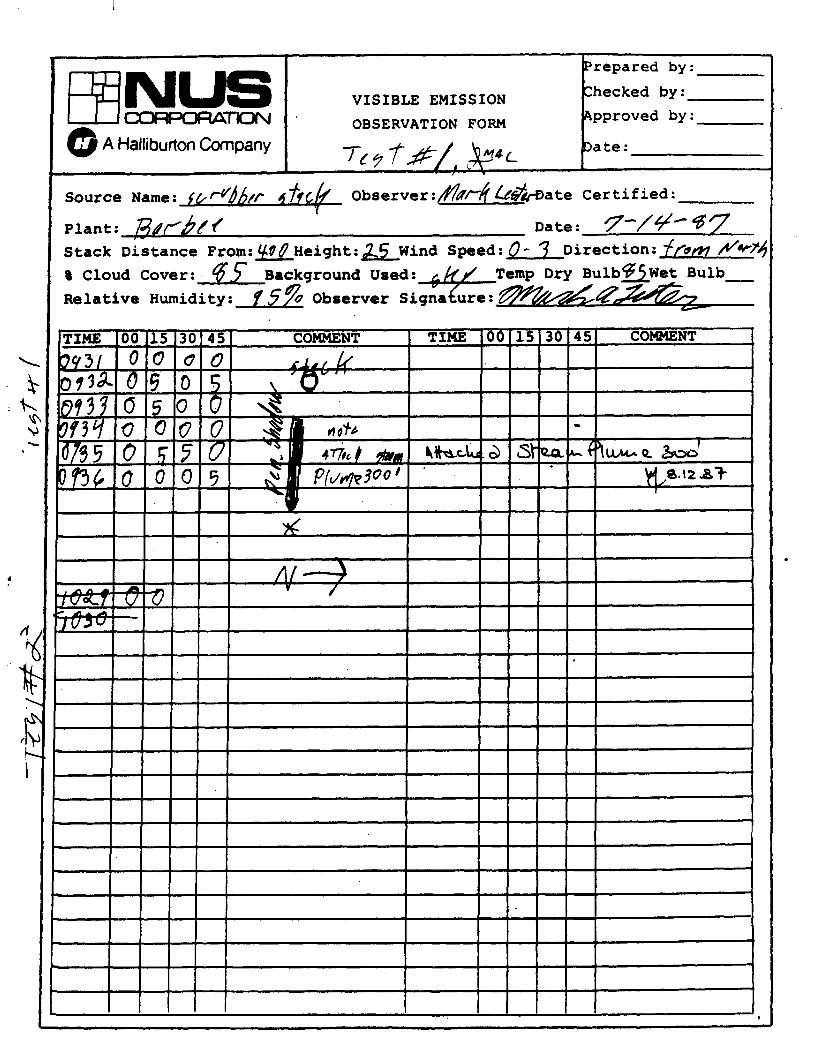
I Source Name: $&dbb/r d f f c k 0bserver:fl~~d b#@ate Certified: I
VISIBLE EMISSION
OBSERVATION FORM 0 A Halfiburton Company
f I ~lant:J/rb/ f Date: 7-/qc%7 I
Prepared by :
Checked by:
Approved by:
Date :
Stack Distance From: YVfl ~eight:As Wind Speed: 0- 7 Direction: /t/W7!3 8 cloud Cover:
Relative Humidity:
I
Temp Dry ~ u l b z w e t Bulb- % Cloud Cover: $0 Background Used: 4 5 ~ Relat ive Humidity: ff qfl Observer Signature: @%&&&--
Prepared by: &&A
Checked by: Approved by:
Date : q-/q 6 7
m
MNUS m i
0 A Hattiburton Company
Source Name: ~ 6 d / r ,$&N observer : ~ r k h4&~ate Cettiiied:
Plant: hIfhL4 & 0 0 d fdf?fl 1 ate: q~/% -6 '7 Stack ~iskaance /From:3 - @ u ~ e i ~ h t : 2 5 Wind Speed: 3--5 Direction: / H M ~
VISIBLE EMISSION
OBSERVATION FORM
Tf9 T-2
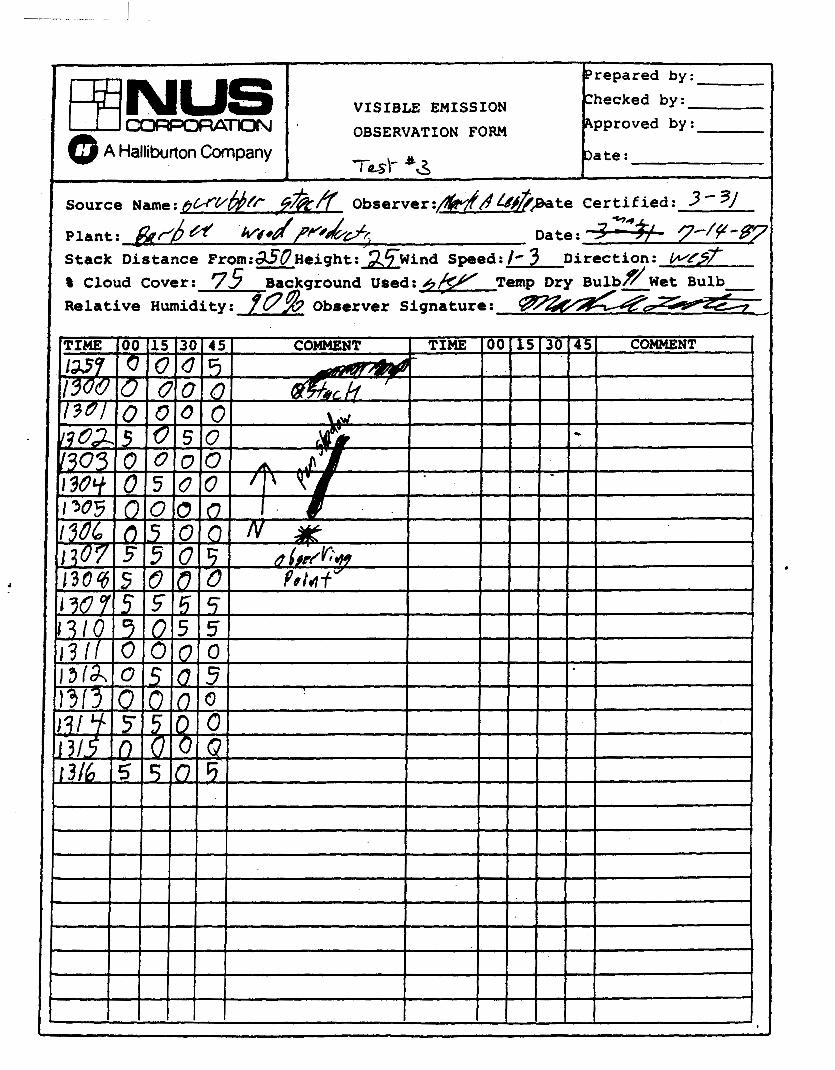
Source ~ a r n e : @ ~ & / r 9 . H ~ b s e r v e r : & / ~ d # ~ + t e Cortif i ed: 3 - 9. -4
Plant: ~ t d / ~ + k . i . i ~ Date: 2 Stack Distance ~ r o m : a O ~ e i ~ h t - :'zFwind Speed: I Cloud Cover: 75 Background ~ s a d : 3 / r ; Y / Te Relative Humidity: yQ$ Observer Signature:
Prepared by:
Checked by:
Approved by:
3ate:
~ W m O N 0 A Halliburton Company
I I
VISIBLE EMISSION
OBSERVATION FORM
Task #3 -


