TACK COAT OPTIMIZATION FOR HMA OVERLAYS: ACCELERATED PAVEMENT TEST REPORT Prepared By Imad L. Al-Qadi Samuel H. Carpenter Zhen Leng Hasan Ozer University of Illinois at Urbana-Champaign James S. Trepanier Illinois Department of Transportation Research Report ICT-09-035 A report of the findings of ICT-R55 Tack Coat Optimization for HMA Overlays Illinois Center for Transportation February 2009 CIVIL ENGINEERING STUDIES Illinois Center for Transportation Series No. 09-035 UILU-ENG-2009-2006 ISSN: 0197-9191
Transcript
TACK COAT OPTIMIZATION FOR HMA OVERLAYS:
ACCELERATED PAVEMENT TEST REPORT
Prepared By
Imad L. Al-Qadi Samuel H. Carpenter
Zhen Leng Hasan Ozer
University of Illinois at Urbana-Champaign
James S. Trepanier Illinois Department of Transportation
Research Report ICT-09-035
A report of the findings of
ICT-R55 Tack Coat Optimization for HMA Overlays
Illinois Center for Transportation
February 2009
CIVIL ENGINEERING STUDIES Illinois Center for Transportation Series No. 09-035
UILU-ENG-2009-2006 ISSN: 0197-9191
Technical Report Documentation Page
1. Report No.
FHWA-ICT-09-035
2. Government Accession No. 3. Recipient's Catalog No.
4. Title and Subtitle
Tack Coat Optimization for HMA Overlays: Accelerated Pavement Test Report
5. Report Date
February 2009 6. Performing Organization Code
8. Performing Organization Report N o. 7. Author(s)
Imad L. Al-Qadi, Samuel H. Carpenter, Zhen Leng, Hasan Ozer, James S. Trepanier
ICT-09-035 UILU-ENG-2009-2006
9. Performing Organization Name and Address
University of Illinois at Urbana Champaign Department of Civil and Environmental Engineering 205 North Mathews Ave, MC250 Urbana, IL 61801
10. Work Unit ( TRAIS)
11. Contract or Grant No.
13. Type of Report and Period Covered
Final Report
12. Sponsoring Agency Name and Address
Illinois Department of Transportation Bureau of Materials and Physical Research 126 E. Ash Street Springfleld, Illinois 62704
14. Sponsoring Agency Code
15. Supplementary Notes
16. Abstract
Interface bonding between hot-mix asphalt (HMA) overlays and Portland cement concrete (PCC) pavements is one of the most significant factors affecting overlay service life. This study was performed to quantify the effects of HMA type, tack coat type, tack coat application rate, and PCC surface texture on the interface bonding and overlay performance through laboratory testing, accelerated pavement testing (APT), and numerical modeling. This report presents the outcomes of the APT, as well as the numerical modeling of pavement interfaces. The results of the laboratory testing are covered in a companion report.
The APT built on and validated previously completed laboratory tests where an HMA overlay was placed on top of an existing PCC pavement having various surface textures including smooth, transverse tined, longitudinal tined, and milled. In addition, zebra sections were included to evaluate the effect of non-uniform tack coat application. Asphalt emulsion SS-1hP and cutback asphalt RC-70 were applied at three residual application rates, 0.02, 0.04, and 0.09 gal/yd2 (0.09, 0.18, and 0.41 L/m2); asphalt binder PG64-22 was applied at 0.04 gal/yd2 (0.41 L/m2). Two HMA designs, standard binder mix and moisture sensitive binder mix, were used along with the three tack coats. Twenty-five pavement test sections were constructed and loaded with the Accelerated Transportation Loading ASsembly (ATLAS) at the centerline. The tensile strains at the bottom of HMA, to quantify potential interface slippage, were measured for selective sections, and primary HMA rutting was analyzed for all sections. The APT results validated laboratory determined optimum tack coat application rate, which provided the lowest interface strain and surface rutting in the field. Both PG64-22 and SS-1hP showed better rutting resistance than RC-70. Milled PCC surface provided lower rutting than transverse-tined and smooth surfaces. The field testing also showed that PCC cleaning methods play an important role in the HMA-PCC bonding. Higher rutting depth was measured in sections with uneven tack coat distribution compared to that with uniform tack coat distribution. Field testing results don’t show enough evidence to prove that using a moisture-sensitive mix will result in higher HMA surface rutting. 17. Key Words
No restrictions. This document is available to the public through the National Technical Information Service, Springfield, Virginia 22161.
19. Security Classif. (of this report)
Unclassified
20. Security Classif. (of this page)
Unclassified
21. No. of Pages
54
22. Price
Form DOT F 1700.7 (8-72) Reproduction of completed page authorized
i
ACKNOWLEDGMENT
This report is based on the results of ICT-R55, Tack Coat Optimization for HMA Overlays. ICT-R55 was conducted in cooperation with the Illinois Center for Transportation; the Illinois Department of Transportation, Division of Highways; and the U.S. Department of Transportation, Federal Highway Administration. The authors would like to acknowledge the assistance of David Lippert, IDOT’s Engineer of Materials and Physical Research and the following members of the Technical Review Panel for ICT-R55: James Trepanier (Chair), Amy Schutzbach, Charles Weinrank, Patty Broers, Terry Hoekstra, Derek Parish, and Tom Winkelman. DISCLAIMER
The contents of this report reflect the view of the authors, who are responsible for the facts and the accuracy of the data presented herein. The contents do not necessarily reflect the official views or policies of the Illinois Center for Transportation, the Illinois Department of Transportation, or the Federal Highway Administration. This report does not constitute a standard, specification, or regulation.
ii
EXECUTIVE SUMMARY Interface bonding between hot-mix asphalt (HMA) overlays and Portland cement
concrete (PCC) pavements can be one of the most significant factors affecting overlay service life. Various factors may affect the bonding condition at the interface, including HMA material, tack coat material, tack coat application rate, PCC surface texture, temperature, and moisture condition. The objective of this study is to quantify the impact of these parameters on the permanent deformation of the HMA overlay. For this purpose, three major components are included in this study: laboratory testing, accelerated pavement testing (APT), and numerical modeling. This report presents the outcomes of the APT, as well as the numerical modeling of pavement interfaces. The results of the laboratory testing are covered in a companion report.
As a part of the tack coat optimization study, field investigation accompanied the extensive laboratory evaluation. The findings of the laboratory tests were used to construct a test site at the Advanced Transportation and Engineering Lab (ATREL) of University of Illinois at Urbana-Champaign (UIUC). Twenty-five test sections were carefully designed to provide the desired pavement interface conditions. The APT was performed to evaluate the effects of HMA type, tack coat type and its application rate, and PCC surface texture on the overlay permanent deformation, as well as to validate the laboratory test findings. The existing PCC pavements at ATREL were tack-coated with three types of tack coats: asphalt emulsion SS-1hP, cutback asphalt RC-70, and asphalt binder PG64-22. Two HMA designs, standard binder mix and moisture sensitive binder mix, were used along with the three tack coats. SS-1hP and RC-70 were applied at three residual application rates, 0.02, 0.04, and 0.09 gal/yd2
(0.09, 0.18, and 0.41 L/m2) to reflect the results of the laboratory tests. PG64-22 was applied at 0.04 gal/yd2 (0.41 L/m2). Four PCC surface textures: smooth, longitudinal tined, transverse tined, and milled, were investigated. In addition, zebra sections were included to evaluate the effect of non-uniform tack coat application. The HMA overlay consisted of a single thin layer of binder mix placed at 2.25 in. (57 mm) to magnify the shear effect of the traffic loading and optimize the testing time. The tensile and slippage strains at the HMA-PCC interface, to quantify potential interface slippage, were measured for selective sections, and primary HMA rutting was analyzed for all sections.
The APT results validated the laboratory-determined optimum tack coat application rate, which provided the lowest interface strains and surface rutting depths. Both PG64-22 and SS-1hP showed better rutting resistance than RC-70 as tack coat material. Milled PCC surfaces were found to provide lower rutting depths than smooth surfaces. The APT results also indicated that PCC cleaning methods played an important role in the HMA-PCC bonding. Sections with air-blast-cleaned milled PCC surfaces experienced lower surface rutting depths than those with broom-cleaned milled PCC surfaces. Uniformity of tack coat distribution was found to affect the HMA surface rutting. Higher rutting depth was measured in sections with uneven tack coat distribution compared to that with uniform tack coat distribution. Field testing results don’t show enough evidence to prove that using a moisture-sensitive mix will result in higher HMA surface rutting. This study recommends that asphalt emulsion SS-1hP (and SS-1h from the laboratory investigation) should be used as the tack coat materials at the HMA-PCC interface. The residual application rate of 0.04 gal/yd2 (0.18 L/m2) is recommended for the best interface bonding between HMA overlay and PCC pavement. The PCC surface is suggested to be milled if possible, and a thorough cleaning of the milled PCC surface is preferred. For better interface bonding and overlay performance, tack coat should be applied uniformly on the underlying PCC surface.
iii
TABLE OF CONTENTS
Acknowledgment ................................................................................................................. i Executive Summary ........................................................................................................... ii CHAPTER 1 Introduction .............................................................................................. 1 CHAPTER 2 Laboratory Testing Summary ................................................................... 2
2.1 Laboratory Testing Program ................................................................................ 2 2.2 Main Laboratory Test Findings ............................................................................ 4
7.2 ATLAS Test 1: Sections A1-5 ............................................................................ 33 7.3 ATLAS Test 2: Sections 6-9 .............................................................................. 35 7.4 ATLAS Test 4: Sections 16-19 .......................................................................... 37 7.5 ATLAS Test 5: Sections 20-24 .......................................................................... 39
CHAPTER 8 Conclusions and Recommendations ..................................................... 42 References ...................................................................................................................... 43
APPENDIX A: Numerical Modeling of Tack Coat Interfaces
1
CHAPTER 1 INTRODUCTION
The construction of hot-mix asphalt (HMA) overlays over existing Portland cement concrete (PCC) pavements is a common method of PCC pavement rehabilitation. The performance of the HMA overlay depends greatly on the bonding condition between the HMA overlay and the PCC pavement. The characteristics which may affect the interface bonding between HMA overlays and PCC pavements include HMA material, tack coat material, tack coat application rate, PCC surface texture, temperature, and moisture condition (Leng et al., 2008a). Poor bonding or loss of bonding between HMA overlays and PCC pavements may result in several distresses such as slippage cracking, as well as compaction difficulty (Romanoschi, 1999; West et al., 2005). Considerable research has been conducted on the interface bonding between pavement layers (Donovan et al., 2000; Hachiya et al., 1997; Leng et al., 2008b; Mohammad et al., 2002; Romanoschi, 1999; West et al., 2005; Uzan et al., 1978; Woods, 2004). However, most of these research studies focused only on laboratory evaluation, and no field validation has been conducted. In this study, both laboratory testing and full-scale accelerated pavement testing (APT) was performed to evaluate the effects of tack coat type, tack coat application rate, and PCC surface texture on the HMA-PCC interface bonding. In addition, numerical modeling was also conducted.
As a part of the tack coat optimization study, a laboratory evaluation was conducted prior to the APT investigation. By using a custom-designed shear testing fixture, the effects of HMA type, tack coat type, tack coat application rate, PCC surface type, and temperature and moisture conditions were evaluated through laboratory testing. To validate the findings of the laboratory tests, a test site including 25 pavement sections was constructed at the Advanced Transportation and Engineering Lab (ATREL) of the University of Illinois at Urbana-Champaign (UIUC) and the APT was performed. The laboratory testing results have been published in another stand-alone report (Al-Qadi et al., 2008); this report mainly discusses the overlay construction process and APT results.
This report is organized as follows. A summary of the laboratory test findings is first presented in Chapter 2. Then PCC pavement surface preparation, field tack coat application, instrument installation, and overlay construction are presented, respectively, in Chapters 3 to 6. Chapter 7 discusses the APT results. The conclusions and recommendations of this study are given in Chapter 8, and the numerical modeling of the pavement interface is described in the Appendix.
2
CHAPTER 2 LABORATORY TESTING SUMMARY
Laboratory testing, APT, and numerical modeling are the three major components of this study. The laboratory testing was conducted prior to the APT (Al-Qadi el al., 2008). The results of laboratory testing were used to construct the test site for the APT and would be validated by the APT results. This chapter presents a summary of the laboratory testing program and findings.
2.1 LABORATORY TESTING PROGRAM
A custom-designed direct shear testing fixture, as shown in Figure 2-1, was used to measure the interface shear strength of the HMA–PCC specimens in the laboratory testing. All laboratory tests were conducted in the monotonic mode with a displacement rate of 0.47 in./min (12 mm/min). Testing specimens were prepared using field PCC cores, laboratory-prepared HMA, and tack coats obtained from a supplier. All the PCC cores were taken from the same PCC pavement, which was used for the APT later.
Figure 2-1. Direct shear testing fixture.
Variables evaluated in the laboratory testing include the HMA material, tack coat
material, tack coat application rate, PCC surface texture, temperature, and moisture condition. The levels of each experimental variable are shown in Table 2-1. The properties of the HMA and tack coat materials are presented in Tables 2-2 and 2-3, respectively.
HMA PCC Interface
Vertical Loading
3
Table 2-1. Experimental Variables and Levels
Variables Levels (No. of Levels) HMA Type SM-9.5, IM-19.0A, IM-19.0B (3)
To optimize the total number of tests, a partial factorial experimental design was
performed. The effects of various variables were evaluated in several steps. In the first step, the effects of HMA type, tack coat type, and the application rate were evaluated. Specimens were prepared with two HMA types (SM-9.5 and IM-19.0A), three tack coat types (SS-1hP, SS-1h and RC-70), and four residual tack coat application rates (0, 0.02, 0.05, and 0.09 gal/yd2 (0, 0.09, 0.23, and 0.41 L/m2)). The PCC core surface was smooth and all tests were conducted at 680F (200C).
The second step evaluated the effect of PCC surface texture. The following textures were considered: smooth, transverse tined, longitudinal tined, and milled. All test specimens were prepared with IM-19.0A standard binder mix and SS-1hP tack coat at several residual application rates varying from 0.02 to 0.09 gal/yd2 (0.09 to 0.41 L/m2) at 68oF (20oC).
The third step examined the temperature effect on the interface shear strength. All specimens in this step were prepared with SM-9.5 surface mix, SS-1hP tack coat at a
4
residual application rate of 0.05 gal/yd2 (0.23 L/m2), and smooth-surfaced PCC cores. Tests were conducted at three temperatures: 50, 68 and 86oF (10, 20 and 30oC).
The fourth step assessed the moisture conditioning effect on the interface shear strength. Two HMA designs were evaluated. One was a standard binder mix, IM-19.0A, and the other a moisture sensitive binder mix, IM-19.0B. The aggregate gradations of the two mixes are similar. However, an anti-stripping additive is required in IM-19.0B. A modified approach to the standard conditioning procedure, AASHTO T283-02, was used for conditioning the HMA-PCC specimens (Leng et al., 2008a). All the specimens in this step were prepared with SS-1hP at 0.05 gal/yd2 (0.23 L/m2) and smooth-surfaced PCC cores.
2.2 MAIN LABORATORY TEST FINDINGS
A monotonic direct shear test with no normal force was used to determine the
optimum tack coat application rate at the HMA overlay-PCC pavement interface. This test measured the interface shear strength, and several interface parameters were examined, including the following: HMA type, tack coat type, tack coat application rate, PCC surface texture, temperature, and moisture condition. The laboratory study concluded the following:
HMA wearing surface provides better interface shear strength than binder HMA. Asphalt emulsions SS-1hP and SS-1h provide better interface shear strength
than cutback asphalt RC-70. No significant difference in the interface shear strength was found between SS-1hP and SS-1h.
The HMA tested have the same trend of interface shear strength and tack coat application rate for various tack coat types. The optimum residual tack coat application rate for SS-1hP asphalt emulsion using IM-19.0A binder HMA was found to be 0.04 gal/yd2 (0.18 L/m2). This finding applies to other tested HMA and tack coat materials.
Four PCC surface textures were evaluated in this study, including smooth, transverse tined, longitudinal tined, and milled. The surface-milled PCC provides the highest interface shear strength.
The direction of tining in the PCC surface has no effect on the interface shear strength at 68oF (20oC).
Tined PCC surfaces provide higher interface shear strength than a smooth surface at low tack coat application rates, while at the optimum tack coat application rate, the smooth surface can provide better bonding at intermediate temperatures, given that no normal forces are applied.
Better bonding was obtained at lower temperature than at intermediate temperature. However, this may not hold true as the temperature approaches the glassy temperature of the HMA and/or tack coat.
Moisture conditioning significantly decreases the interface shear strength. This reduction is more pronounced when a moisture sensitive mix is used.
5
CHAPTER 3 PRECONSTRUCTION PREPARATION OF PCC PAVEMENT SURFACES 3.1 CONSTRUCTION LAYOUT
A total of 25 field test sections were designed and constructed to evaluate and quantify the effects of HMA type, tack coat type and its application rate, and concrete surface texture on the overlay performance. Each test section was 12.5 ft (3.75 m) long and 12 ft (3.6 m) wide. Five ATLAS tests were performed with each test covering four to six sections. The construction layout is shown in Figure 3-1.
* ATLAS Test 3 compares the tack coat application rates.* ATLAS Tests 1, 2, & 4 compare various surface textures with one tack coat application rate.* ATLAS Test 5 compares the zebra distribution effect at various application rates.
As shown in Figure 3-1, four PCC surface textures were evaluated in the field testing: smooth, transverse tined, longitudinal tined, and milled. The PCC surface preparation was completed prior to the tack coat application and HMA overlay construction.
3.2.1 Existing PCC Pavement Surface As shown in Figure 3-2, the existing PCC pavement had three surface textures: smooth, transverse tined, and longitudinal tined. These surfaces were swept with a broom manually before the tack coat application to prevent accumulation of any debris.
6
Figure 3-2. PCC surface textures.
3.2.2 Surface Milling
Several of the smooth PCC sections were milled to investigate the effect of milling on interface bonding. The PCC surface milling was performed by Cross Construction Inc. of Urbana, IL. A Wirtgen 1000C milling machine was used (Figure 3-3). The working width of this machine is 3 ft (0.9 m). Therefore, four passes were conducted for each section to mill the 12-ft- (3.6-m-) wide PCC surface.
Figure 3-3. Wirtgen 1000C machine for PCC surface milling.
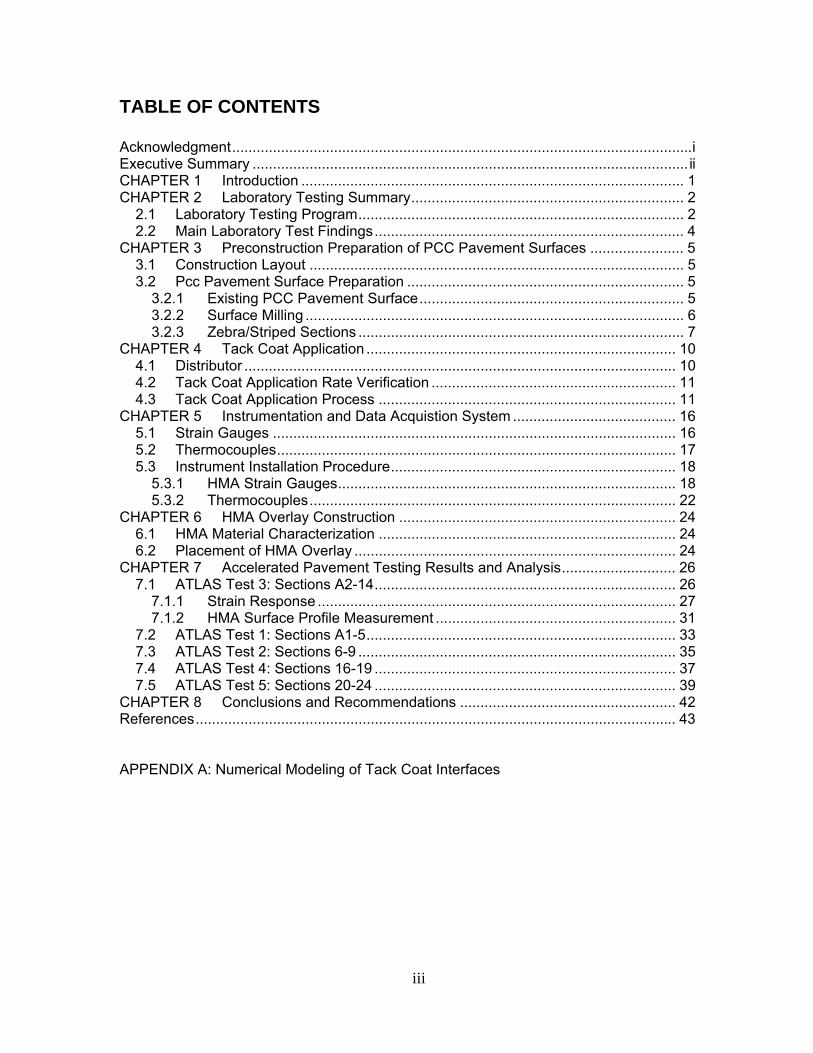
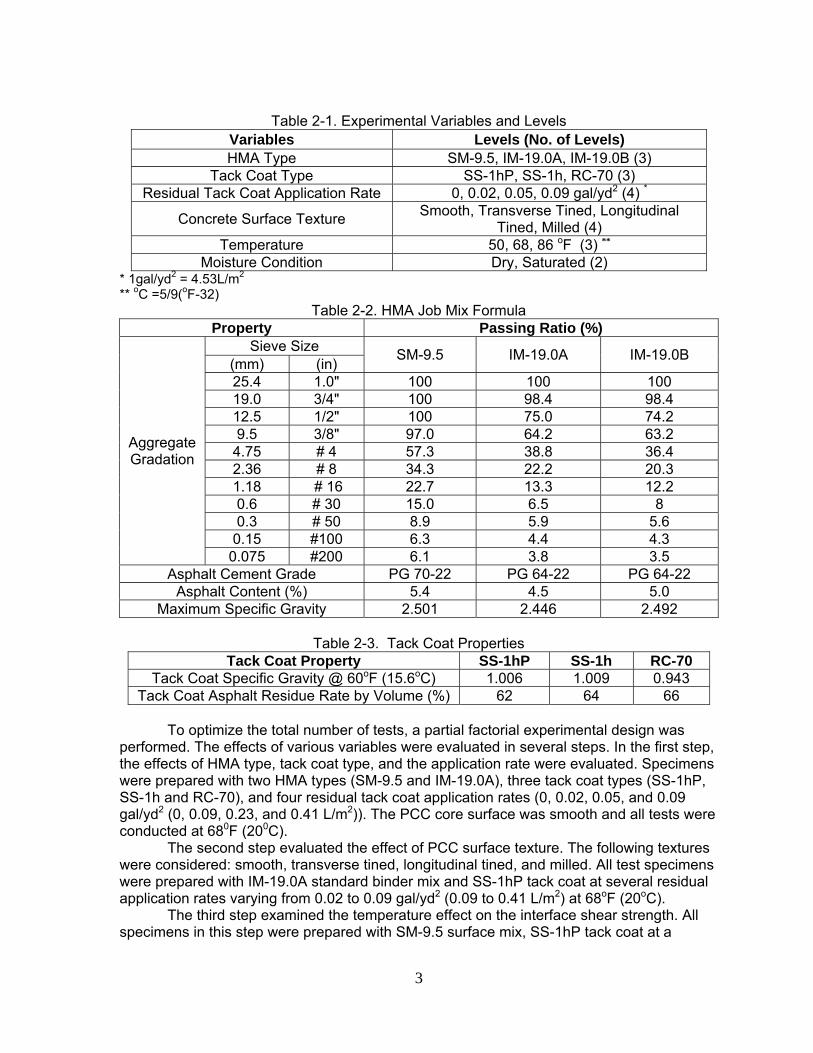
To evaluate the effect of the PCC surface cleanliness level on the interface bonding,
the milled PCC surfaces were cleaned in two ways: air-blast cleaning and powered-broom cleaning. Figure 3-4 shows the air compressor used to provide high air pressure and the process of cleaning PCC surface. Figure 3-5 shows the powered- broom used to provide the roughly cleaned PCC surface.
Traffic Direction
Transverse Tined Longitudinal Tined Smooth
7
Figure 3-4. PCC surface cleaning with air blast.
Figure 3-5. Powered-broom for cleaning milled sections.
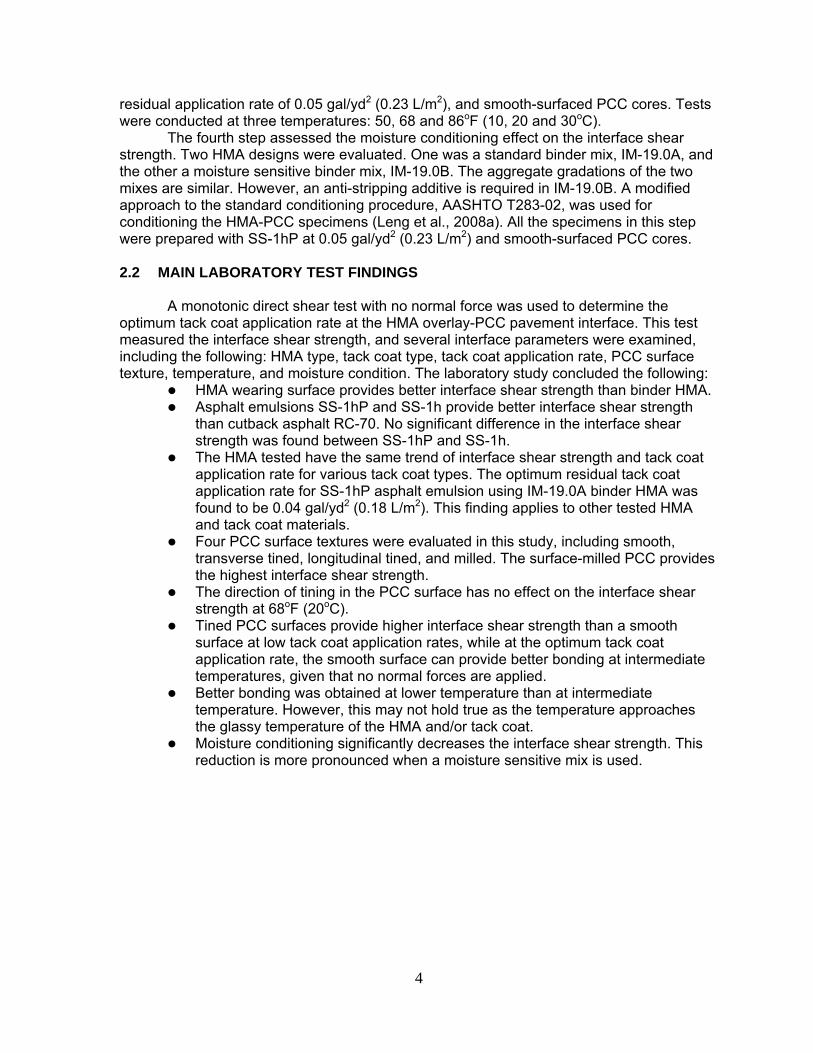
3.2.3 Zebra/Striped Sections
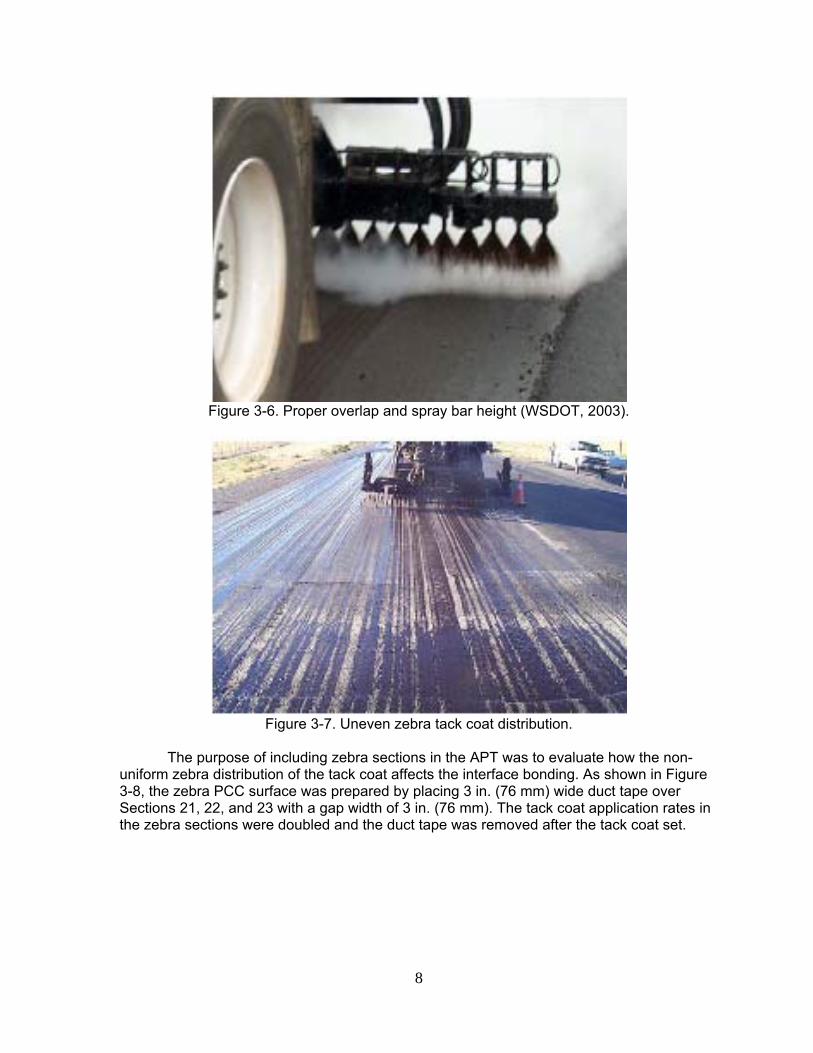
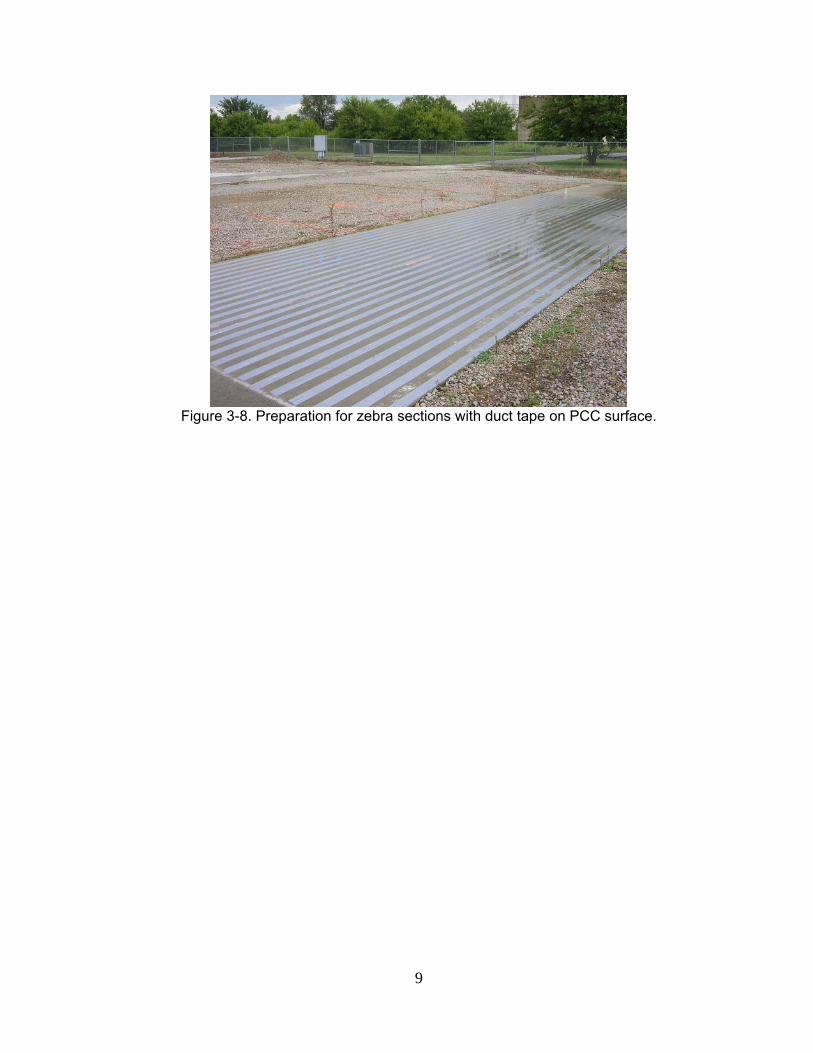
Uniform tack coat application is desired in the field. However, uneven tack coat application often occurs due to distributor malfunction or inappropriate operation of application devices. The angle of the spray bar nozzles and the spray bar height of the distributor are the key items for uniform tack coat application. All nozzles should be set at the same angle to maximize the overlap and minimize interference. Spray bar height depends on the speed of the truck, spray nozzle configuration, and the pressure used to apply the tack coat. Once the proper type of spray nozzle and configuration are chosen for the type of tack coat to be used, the pressure, truck speed, and spray bar height can be determined according to the needed application rate. The proper choice for these factors should produce double or triple coverage, as shown in Figure 3-6. Incorrect angle adjustment, spray bar height, and pressure will result in uneven distribution of the tack coat application, which usually exhibits a zebra or striped pattern (Figure 3-7).
8
Figure 3-6. Proper overlap and spray bar height (WSDOT, 2003).
Figure 3-7. Uneven zebra tack coat distribution.
The purpose of including zebra sections in the APT was to evaluate how the non-
uniform zebra distribution of the tack coat affects the interface bonding. As shown in Figure 3-8, the zebra PCC surface was prepared by placing 3 in. (76 mm) wide duct tape over Sections 21, 22, and 23 with a gap width of 3 in. (76 mm). The tack coat application rates in the zebra sections were doubled and the duct tape was removed after the tack coat set.
9
Figure 3-8. Preparation for zebra sections with duct tape on PCC surface.
10
CHAPTER 4 TACK COAT APPLICATION
Proper tack coat application at predetermined application rates is crucial for achieving the objectives of the field testing. Close attention was paid to the tack coat application so that the actual tack coat application rate was within a reasonable range of the target rate. This chapter presents the process of tack coat application.
4.1 DISTRIBUTOR
The tack coat distributor is essential to proper tack coat application. It must function properly to ensure the desired rate and uniformity. Distributors have to be capable of maintaining proper temperature, pressure, and spray bar height to apply the tack coat at the appropriate rate.
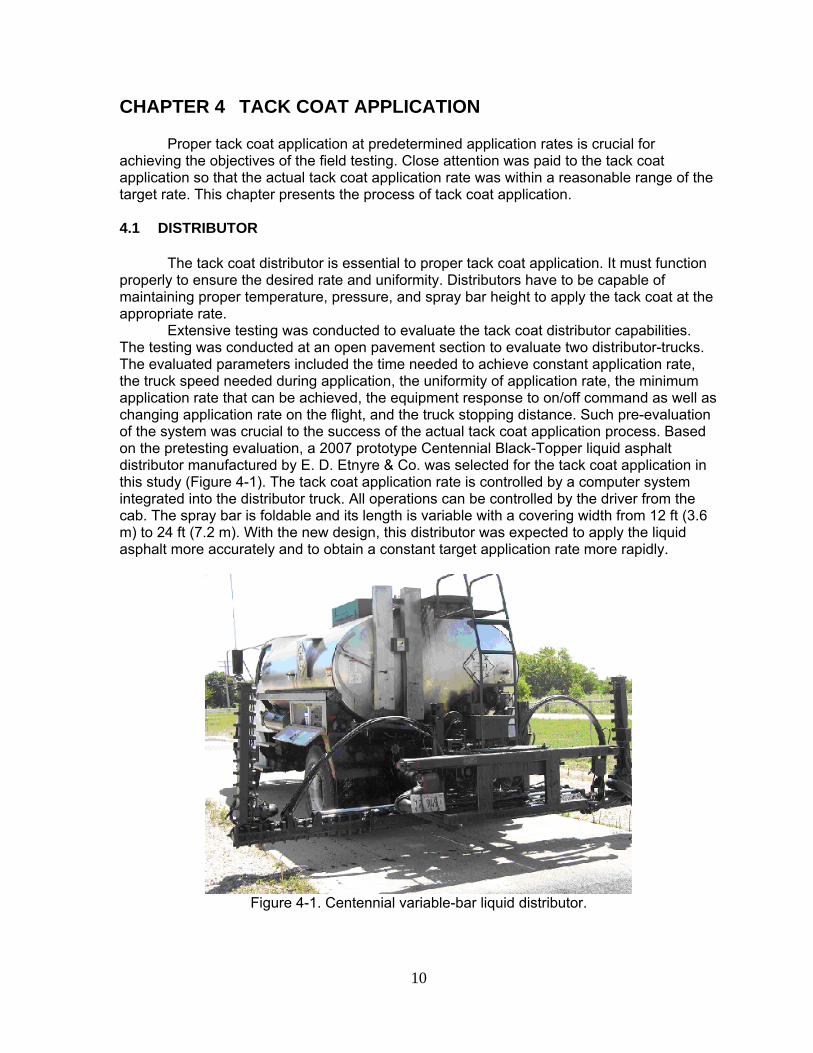
Extensive testing was conducted to evaluate the tack coat distributor capabilities. The testing was conducted at an open pavement section to evaluate two distributor-trucks. The evaluated parameters included the time needed to achieve constant application rate, the truck speed needed during application, the uniformity of application rate, the minimum application rate that can be achieved, the equipment response to on/off command as well as changing application rate on the flight, and the truck stopping distance. Such pre-evaluation of the system was crucial to the success of the actual tack coat application process. Based on the pretesting evaluation, a 2007 prototype Centennial Black-Topper liquid asphalt distributor manufactured by E. D. Etnyre & Co. was selected for the tack coat application in this study (Figure 4-1). The tack coat application rate is controlled by a computer system integrated into the distributor truck. All operations can be controlled by the driver from the cab. The spray bar is foldable and its length is variable with a covering width from 12 ft (3.6 m) to 24 ft (7.2 m). With the new design, this distributor was expected to apply the liquid asphalt more accurately and to obtain a constant target application rate more rapidly.
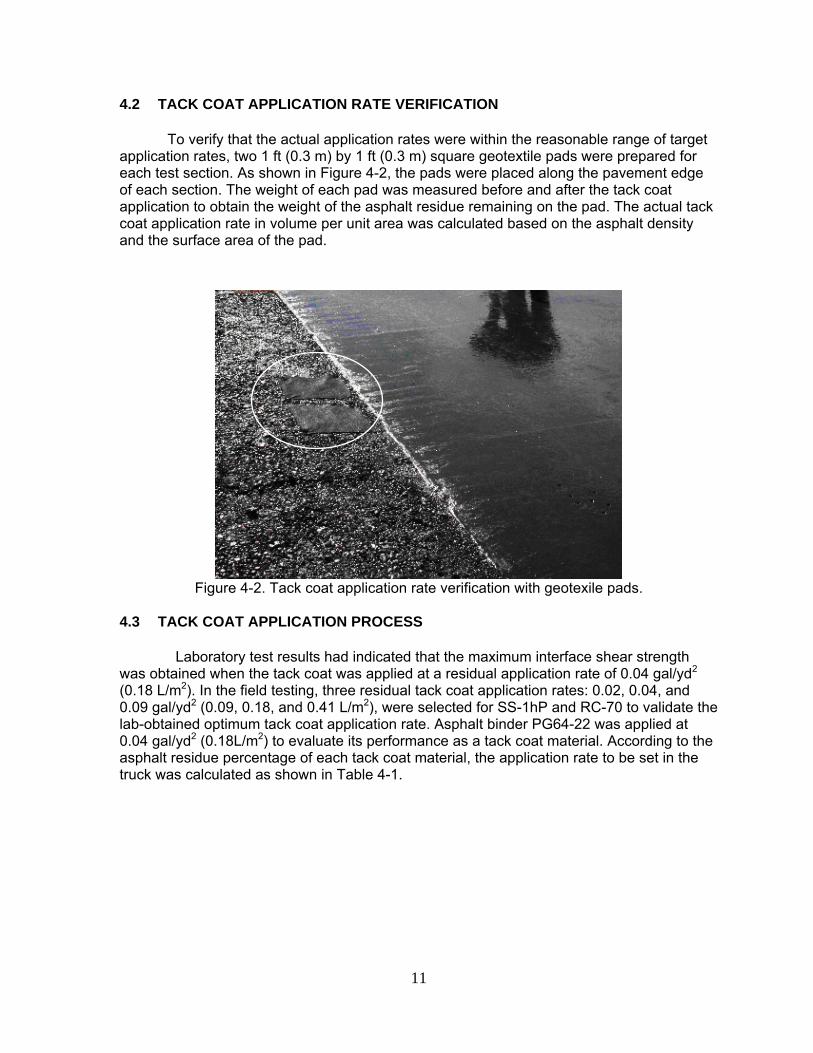
To verify that the actual application rates were within the reasonable range of target application rates, two 1 ft (0.3 m) by 1 ft (0.3 m) square geotextile pads were prepared for each test section. As shown in Figure 4-2, the pads were placed along the pavement edge of each section. The weight of each pad was measured before and after the tack coat application to obtain the weight of the asphalt residue remaining on the pad. The actual tack coat application rate in volume per unit area was calculated based on the asphalt density and the surface area of the pad.
Figure 4-2. Tack coat application rate verification with geotexile pads.
4.3 TACK COAT APPLICATION PROCESS
Laboratory test results had indicated that the maximum interface shear strength was obtained when the tack coat was applied at a residual application rate of 0.04 gal/yd2 (0.18 L/m2). In the field testing, three residual tack coat application rates: 0.02, 0.04, and 0.09 gal/yd2 (0.09, 0.18, and 0.41 L/m2), were selected for SS-1hP and RC-70 to validate the lab-obtained optimum tack coat application rate. Asphalt binder PG64-22 was applied at 0.04 gal/yd2 (0.18L/m2) to evaluate its performance as a tack coat material. According to the asphalt residue percentage of each tack coat material, the application rate to be set in the truck was calculated as shown in Table 4-1.
12
Table 4-1. Field Tack Coat Application Rates
Tack Coat Asphalt Residue Percentage (%)
Application Rates (gal/yd2) Low Optimum High
SS-1hP 64 Asphalt Residue 0.02 0.04 0.09
Rate for Truck 0.06 0.13 0.28
RC-70 66 Asphalt Residue 0.02 0.04 0.09
Rate for Truck 0.03 0.06 0.14
PG64-22 100 Asphalt Residue - 0.04 -
Rate for Truck - 0.04 - *1 gal/yd2 = 4.53 L/m2.
Although an improved computer control system had been used by the tack coat distributor and an experienced distributor truck driver had been hired, a certain distance of around 10 ft (3 m) was needed to obtain a constant application rate per the pre-testing of the distributor. Because the adjacent testing sections with various desired tack coat application rates had to be tack-coated in different passes, a detailed and optimized approach for tack coat application was developed and applied to ensure that coated surfaces were not driven on. As part of the application sequence approach, a geotextile sheet, as shown in Figure 4-3, was used to protect some sections from being tack-coated in a specific pass.
Figure 4-3. PCC surface protection with geotextile sheet.
Tack coat application on the prepared PCC surfaces started with SS-1hP at the
optimum residual rate [0.04 gal/yd2 (0.18 L/m2)]. In the first pass, SS-1hP was applied to Sections 6, 7, 8, 9, 14, 16, 17, 18, 19, and 22 at the optimum residual application rate [0.04 gal/yd2 (0.18 L/m2)] (see Figure 3-1). In that pass, Sections 11, 12, 13, 15, 20, 21, 23, and 24 were covered by geotextile sheets. The distributor moved from the west to the east.
13
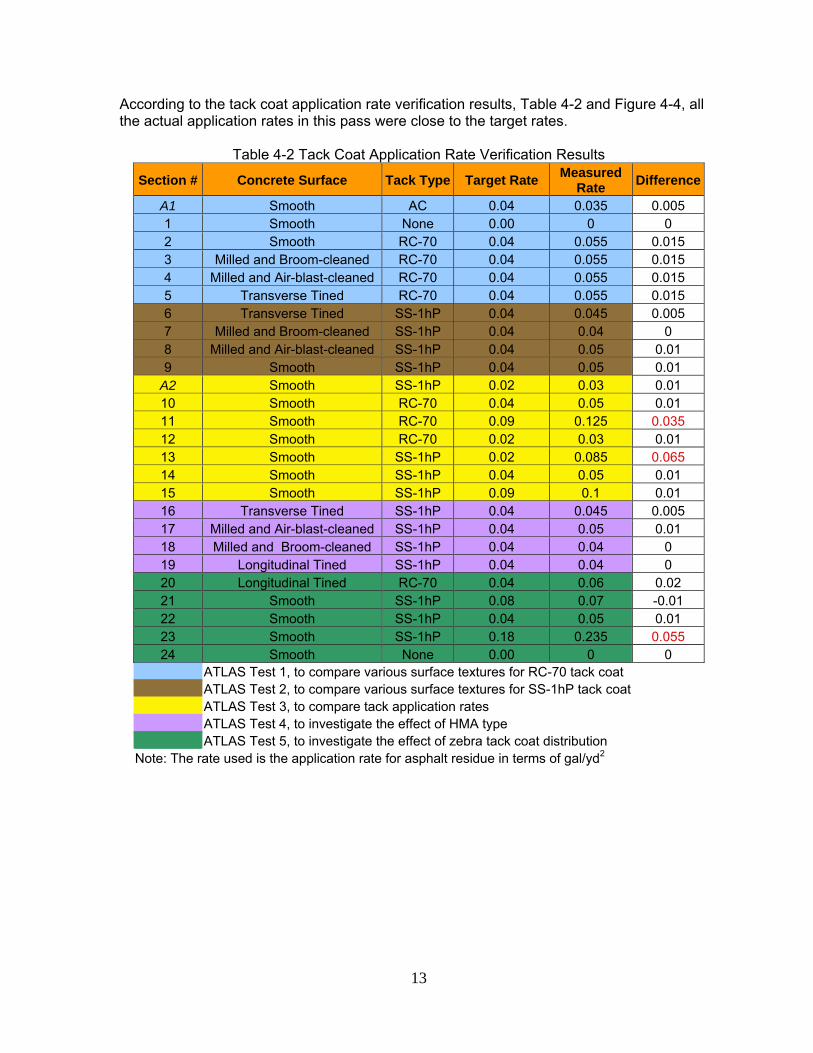
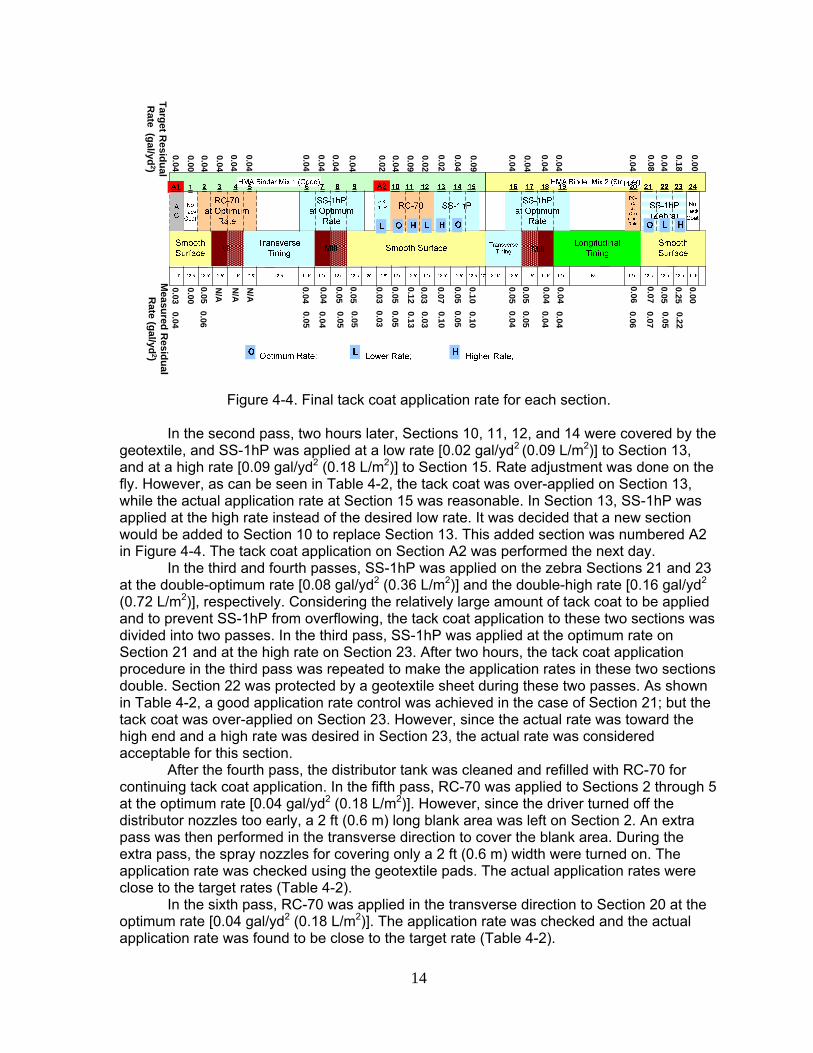
According to the tack coat application rate verification results, Table 4-2 and Figure 4-4, all the actual application rates in this pass were close to the target rates.
ATLAS Test 1, to compare various surface textures for RC-70 tack coat ATLAS Test 2, to compare various surface textures for SS-1hP tack coat ATLAS Test 3, to compare tack application rates ATLAS Test 4, to investigate the effect of HMA type ATLAS Test 5, to investigate the effect of zebra tack coat distribution Note: The rate used is the application rate for asphalt residue in terms of gal/yd2
14
Target Residual
Rate (gal/yd
2)M
easured Residual
Rate (gal/yd
2)
0.000.04
0.040.04
0.04
0.04
0.040.04
0.04
0.04
0.04
0.090.02
0.02
0.09
0.04
0.04
0.04
0.08
0.18
0.04
0.04
0.00
0.00
0.040.05
0.040.04
0.050.06
0.050.05
0.050.05
0.050.05
0.120.13
0.03
0.07
0.03
0.10
0.050.05
0.100.10
0.050.04
0.050.05
0.040.04
0.040.04
0.04
0.050.05
0.250.22
0.060.06
0.070.07
0.00
N/A
N/A
N/A
0.040.04
0.03
0.030.03
0.02
Figure 4-4. Final tack coat application rate for each section.
In the second pass, two hours later, Sections 10, 11, 12, and 14 were covered by the
geotextile, and SS-1hP was applied at a low rate [0.02 gal/yd2 (0.09 L/m2)] to Section 13, and at a high rate [0.09 gal/yd2 (0.18 L/m2)] to Section 15. Rate adjustment was done on the fly. However, as can be seen in Table 4-2, the tack coat was over-applied on Section 13, while the actual application rate at Section 15 was reasonable. In Section 13, SS-1hP was applied at the high rate instead of the desired low rate. It was decided that a new section would be added to Section 10 to replace Section 13. This added section was numbered A2 in Figure 4-4. The tack coat application on Section A2 was performed the next day.
In the third and fourth passes, SS-1hP was applied on the zebra Sections 21 and 23 at the double-optimum rate [0.08 gal/yd2 (0.36 L/m2)] and the double-high rate [0.16 gal/yd2 (0.72 L/m2)], respectively. Considering the relatively large amount of tack coat to be applied and to prevent SS-1hP from overflowing, the tack coat application to these two sections was divided into two passes. In the third pass, SS-1hP was applied at the optimum rate on Section 21 and at the high rate on Section 23. After two hours, the tack coat application procedure in the third pass was repeated to make the application rates in these two sections double. Section 22 was protected by a geotextile sheet during these two passes. As shown in Table 4-2, a good application rate control was achieved in the case of Section 21; but the tack coat was over-applied on Section 23. However, since the actual rate was toward the high end and a high rate was desired in Section 23, the actual rate was considered acceptable for this section.
After the fourth pass, the distributor tank was cleaned and refilled with RC-70 for continuing tack coat application. In the fifth pass, RC-70 was applied to Sections 2 through 5 at the optimum rate [0.04 gal/yd2 (0.18 L/m2)]. However, since the driver turned off the distributor nozzles too early, a 2 ft (0.6 m) long blank area was left on Section 2. An extra pass was then performed in the transverse direction to cover the blank area. During the extra pass, the spray nozzles for covering only a 2 ft (0.6 m) width were turned on. The application rate was checked using the geotextile pads. The actual application rates were close to the target rates (Table 4-2).
In the sixth pass, RC-70 was applied in the transverse direction to Section 20 at the optimum rate [0.04 gal/yd2 (0.18 L/m2)]. The application rate was checked and the actual application rate was found to be close to the target rate (Table 4-2).
15
In the seventh pass, RC-70 was applied at a target residual rate of 0.02 gal/yd2 (0.09 L/m2) on Section 10. However, the measured actual application rate was 0.04 gal/yd2 (0.18 L/m2), which was actually the optimum residual rate. To solve this problem, it was decided to apply RC-70 at the low rate [0.02 gal/yd2 (0.09 L/m2)] on Section 12, where an optimum application rate had been scheduled.
In the eighth pass, RC-70 was applied in the transverse direction on Section 12 at the low rate, [0.02 gal/yd2 (0.09 L/m2)]. The target application rate was achieved in this pass (Table 4-2).
In the ninth pass, RC-70 was applied at a target rate of 0.09 gal/yd2 (0.41 L/m2) on Section 11 in the transverse direction. Rate verification results showed that the tack coat was over-applied (Table 4-2). However, since the actual application rate was at the high end, and a high application rate was planned for Section 11, the actual rate on this section was considered acceptable.
On the second day, SS-1hP was applied at the added Section A2 at the low rate [0.02 gal/yd2 (0.09 L/m2)]. The application was performed in the transverse direction. As shown in Table 4-2, the target application rate was achieved. On the third day, the distributor applied PG64-22 asphalt binder. Practice was performed in advance at a parking lot to make sure the asphalt binder could be applied uniformly. The PG64-22 was applied on the added Section A1 at the optimum application rate [0.04 gal/yd2 (0.18 L/m2)]. The application rate was checked; the target value was achieved (Table 4-2).
16
CHAPTER 5 INSTRUMENTATION AND DATA ACQUISTION SYSTEM
Two types of instruments were used in this project to measure the pavement
responses at critical locations. H-type strain gauges were installed to measure the strains at the HMA-PCC interface. T-type thermocouples were placed in the HMA overlay to measure temperatures at various depths. This chapter presents a brief introduction to the instruments used in this project and the process of the instrument installation in the field.
5.1 STRAIN GAUGES
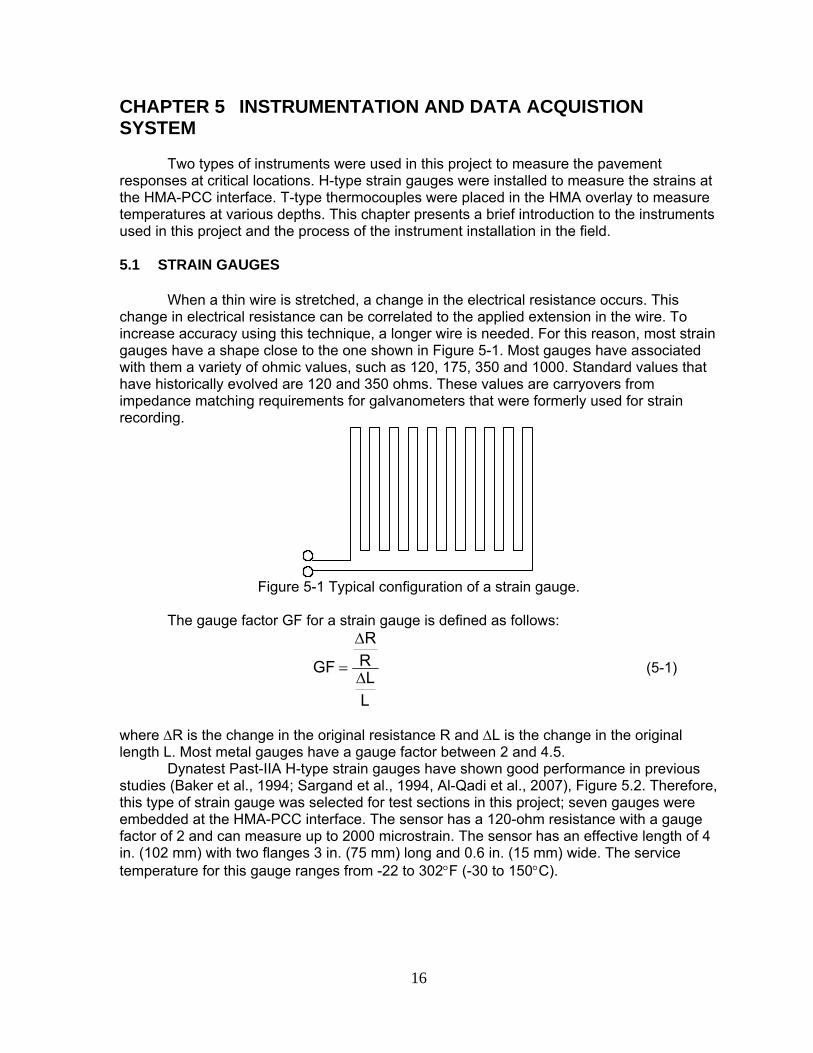
When a thin wire is stretched, a change in the electrical resistance occurs. This change in electrical resistance can be correlated to the applied extension in the wire. To increase accuracy using this technique, a longer wire is needed. For this reason, most strain gauges have a shape close to the one shown in Figure 5-1. Most gauges have associated with them a variety of ohmic values, such as 120, 175, 350 and 1000. Standard values that have historically evolved are 120 and 350 ohms. These values are carryovers from impedance matching requirements for galvanometers that were formerly used for strain recording.
Figure 5-1 Typical configuration of a strain gauge.
The gauge factor GF for a strain gauge is defined as follows:
LL
RR
GFΔ
Δ
= (5-1)
where ΔR is the change in the original resistance R and ΔL is the change in the original length L. Most metal gauges have a gauge factor between 2 and 4.5.
Dynatest Past-IIA H-type strain gauges have shown good performance in previous studies (Baker et al., 1994; Sargand et al., 1994, Al-Qadi et al., 2007), Figure 5.2. Therefore, this type of strain gauge was selected for test sections in this project; seven gauges were embedded at the HMA-PCC interface. The sensor has a 120-ohm resistance with a gauge factor of 2 and can measure up to 2000 microstrain. The sensor has an effective length of 4 in. (102 mm) with two flanges 3 in. (75 mm) long and 0.6 in. (15 mm) wide. The service temperature for this gauge ranges from -22 to 302°F (-30 to 150°C).
17
Figure 5-2 A Dynatest PAST-IIA strain gauge
Recognizing the fact that instrument calibration, as well as complete understanding
of the strain gauge operation, is crucial to its successful application in the field, a specially-designed caliper has been used to validate the calibration equations for the strain gauges provided by the manufacturers (Al-Qadi et al., 2007). The designed caliper is capable of applying a uniformly static or dynamic tension/compression force to the gauge by means of a screw shaft that moves in both directions without a resultant torsion or bending applied to the gauge. A sensitive micrometer head (7.8 x10⁻⁶ in.(2x10⁻⁴ mm)) is connected to the system to measure the exact amount of applied displacement to the gauge, Figure 5-3. Testing and evaluation of the strain gauge consisted of tensioning and/or compressing the tested strain gauge, measuring the mechanically induced strain, and comparing it with the strain from the data acquisition system. The acquisition system has a built-in module to convert voltage measurements using a full-bridge transducer into microstrain values.
Figure 5-3. Calibrating caliper for strain gauges.
5.2 THERMOCOUPLES
T-Type thermocouples were fabricated and used in this project. As shown in Figure 5-4, the T-Type thermocouple consists of a soldered pair of constantan and copper wires. After the wire pair was twisted and soldered, the exposed end was surrounded by 0.25 in. (6.4 mm) inside diameter copper tubing. The tubing was then attached to the cable insulated by a TFM-type inner mount-melt heat shrinkable Teflon tube. This was done to insulate the tubing from the exposed wire pair, and to provide a reservoir for epoxy. The shrink tube was chosen especially for its thermal resistance, where it has a maximum
18
operating range of 446°F (230°C). Epoxy (3M DP-270 electrical grade) was used to surround the thermocouple and to serve as a barrier to environmental effects.
Figure 5-4. T-Type thermocouple.
After fabrication, the response from the thermocouples was checked at two reference
temperatures: ice and boiling water. The response from each thermocouple was recorded and compared to a reading from a calibrated thermometer. From this procedure, it was determined that the thermocouples were working properly.
In this project, four thermocouples were used for each of the five ATLAS test sections to measure the temperatures at various depths in the HMA overlay. Thus, 20 thermocouples were instrumented.
As shown in Figure 5-5, seven strain gauges were placed in Sections 10, 11, and 12 to compare the interface strains when RC-70 was applied at various rates. To measure the relative deformation between the HMA overlay and PCC pavement, a strain gauge was placed in each section to measure the slippage strain between two pavement layers. One end (see red end in Figure 5-5) of the strain gauge was glued to the PCC surface and the other end (see black end in Figure 5-5) was left free to move with the bottom of the HMA layer. In addition, one strain gauge was placed at each section to measure the transverse tensile strain at the bottom of the HMA overlay; one strain gauge was placed at Section 10 to measure the longitudinal tensile strain at the bottom of HMA overlay.
19
Figure 5-5. Strain gauge instrumentation layout.
The following procedure was followed when installing the strain gauges at the HMA-
PCC interface: All the strain gauges were labeled on the wires using shrinkage tubes, and the
locations for installing the strain gauges were marked before tack coat application. The areas on the PCC surface for gluing strain gauge ends were covered by duct tape so that the strain gauge end could be directly glued to the concrete surface after tack coat application.
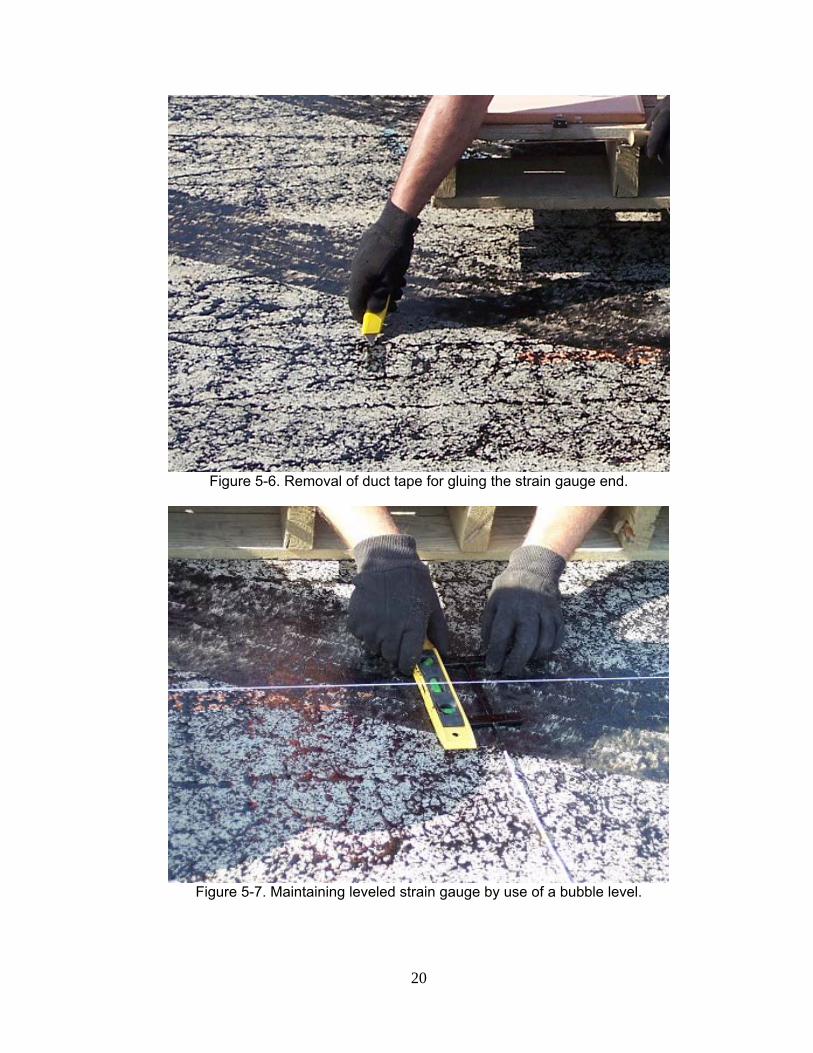
Strain gauge installation was performed after the tack coat application. Before installing the strain gauges for measuring interface slippage, the duct tape on the PCC surface was removed (see Figure 5-6). Heat-resistant epoxy was then used to glue one end of the strain gauge directly to the PCC surface. A level bubble was used to maintain the levelness of strain gauge (see Figure 5-7).
After the strain gauge was located in place, fine sand mixed with asphalt emulsion was placed around the strain gauge to protect it from being damaged by sharp aggregates during overlay compaction (see Figure 5-8).
The strain gauge wires were covered with geosynthetic fabric which was glued to the tack-coated PCC surface (see Figure 5-9).
Hot-mix asphalt was taken from the paver and placed on top of the transducer before the paver spread the mix over the gauge. The mix was first compacted by applying a static pressure through a square tile. Then a solid hand roller was used to compact the HMA in the direction of the anchor bars (see Figure 5-10).
When installing the strain gauges for measuring the transverse and longitudinal tensile strains, the same procedure used for installing the slippage strain gauges was followed, except that both ends of the strain gauges were left free instead of one end of the strain gauge being glued to the PCC surface.
The HMA was paved over the strain gauges and compacted by roller compactors until the required density was achieved.
20
Figure 5-6. Removal of duct tape for gluing the strain gauge end.
Figure 5-7. Maintaining leveled strain gauge by use of a bubble level.
21
Figure 5-8. Covering the strain gauge with emulsified asphalt sand.
Figure 5-9. Protecting strain gauges with geosynthetic fabric
22
Figure 5-10. Rolling and compacting HMA sampled from paver over the strain gauge.
5.3.2 Thermocouples
Thermocouples were installed at the bottom, one-third depth, two-thirds depth, and top of the HMA overlay in the middle of each ATLAS test section (see Figure 5-11). The thermocouple at the bottom of the layer was installed by directly placing it on the PCC surface. When installing the thermocouple at the top of the layer, HMA was taken from the paver as it approached the thermocouple. The thermocouple was then surrounded with the HMA, and the HMA was compacted to the exact layer thickness (see Figure 5-12). The thermocouples located in the middle of the layer were installed by simply placing them between the thermocouples on the top and bottom.
Bottom
Top
Upper Middle
Lower Middle
2.25” HMA Overlay
Figure 5-11. Locations of the thermocouples.
23
Figure 5-12. Surrounding the thermocouple with HMA.
24
CHAPTER 6 HMA OVERLAY CONSTRUCTION 6.1 HMA MATERIAL CHARACTERIZATION
Two HMA designs, standard binder mix and moisture sensitive mix, were used for the overlay. The HMA overlay consists of a single layer of binder mix 2.25 in. (57 mm) thick without placing any surface layer on top. The purpose of using a single thin layer was to magnify the shear effect at the HMA–PCC interface. Table 6-1 shows the job mix formulae of the two HMA binder mixes.
Asphalt Content (%) 4.5 5.0 Maximum Specific Gravity 2.488 2.487
6.2 PLACEMENT OF HMA OVERLAY
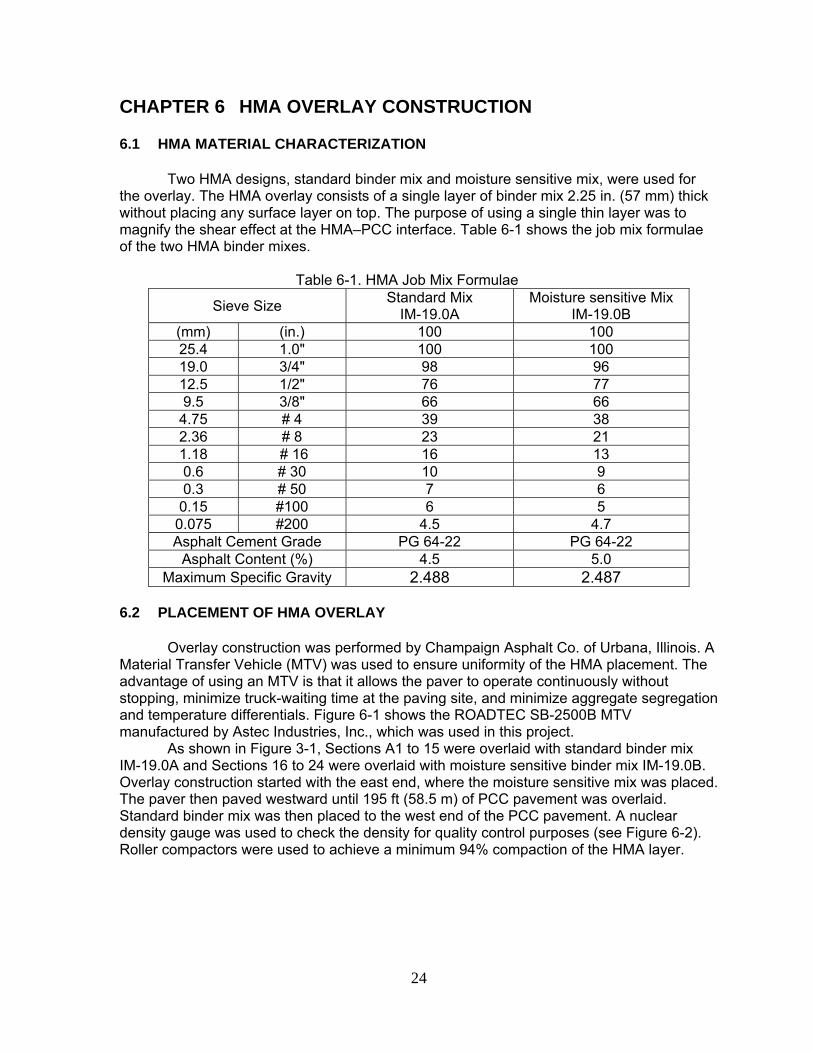
Overlay construction was performed by Champaign Asphalt Co. of Urbana, Illinois. A Material Transfer Vehicle (MTV) was used to ensure uniformity of the HMA placement. The advantage of using an MTV is that it allows the paver to operate continuously without stopping, minimize truck-waiting time at the paving site, and minimize aggregate segregation and temperature differentials. Figure 6-1 shows the ROADTEC SB-2500B MTV manufactured by Astec Industries, Inc., which was used in this project.
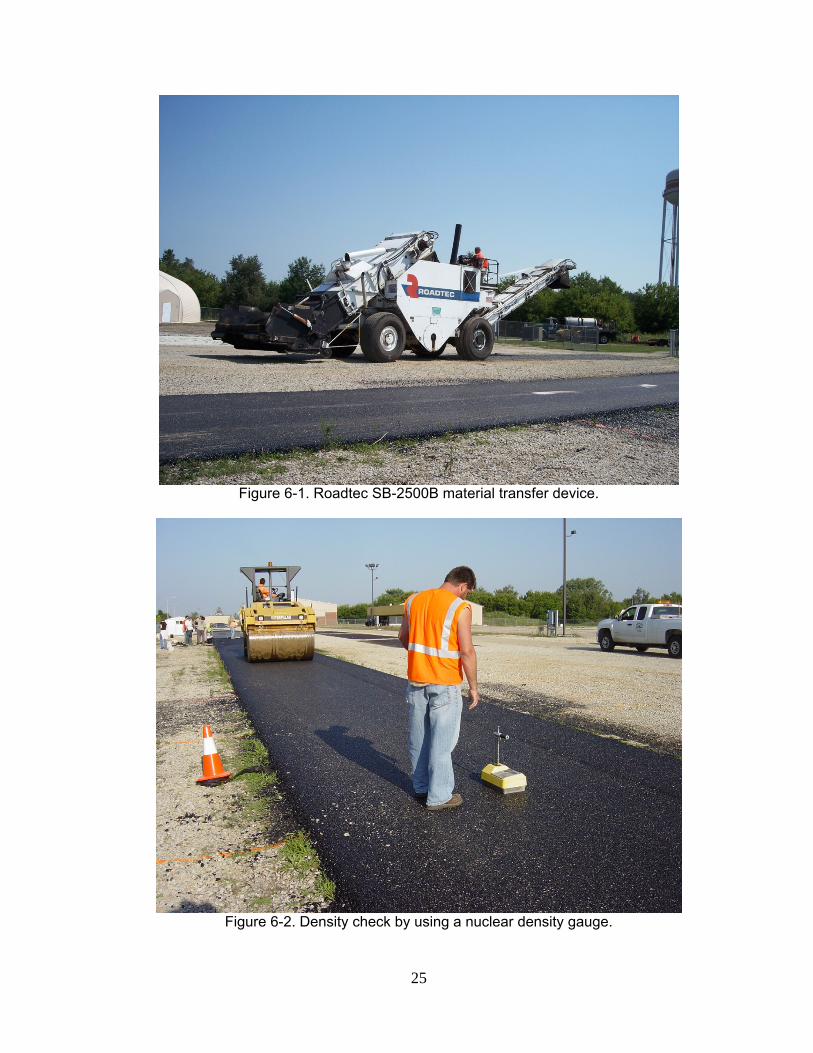
As shown in Figure 3-1, Sections A1 to 15 were overlaid with standard binder mix IM-19.0A and Sections 16 to 24 were overlaid with moisture sensitive binder mix IM-19.0B. Overlay construction started with the east end, where the moisture sensitive mix was placed. The paver then paved westward until 195 ft (58.5 m) of PCC pavement was overlaid. Standard binder mix was then placed to the west end of the PCC pavement. A nuclear density gauge was used to check the density for quality control purposes (see Figure 6-2). Roller compactors were used to achieve a minimum 94% compaction of the HMA layer.
25
Figure 6-1. Roadtec SB-2500B material transfer device.
Figure 6-2. Density check by using a nuclear density gauge.
26
CHAPTER 7 ACCELERATED PAVEMENT TESTING RESULTS AND ANALYSIS
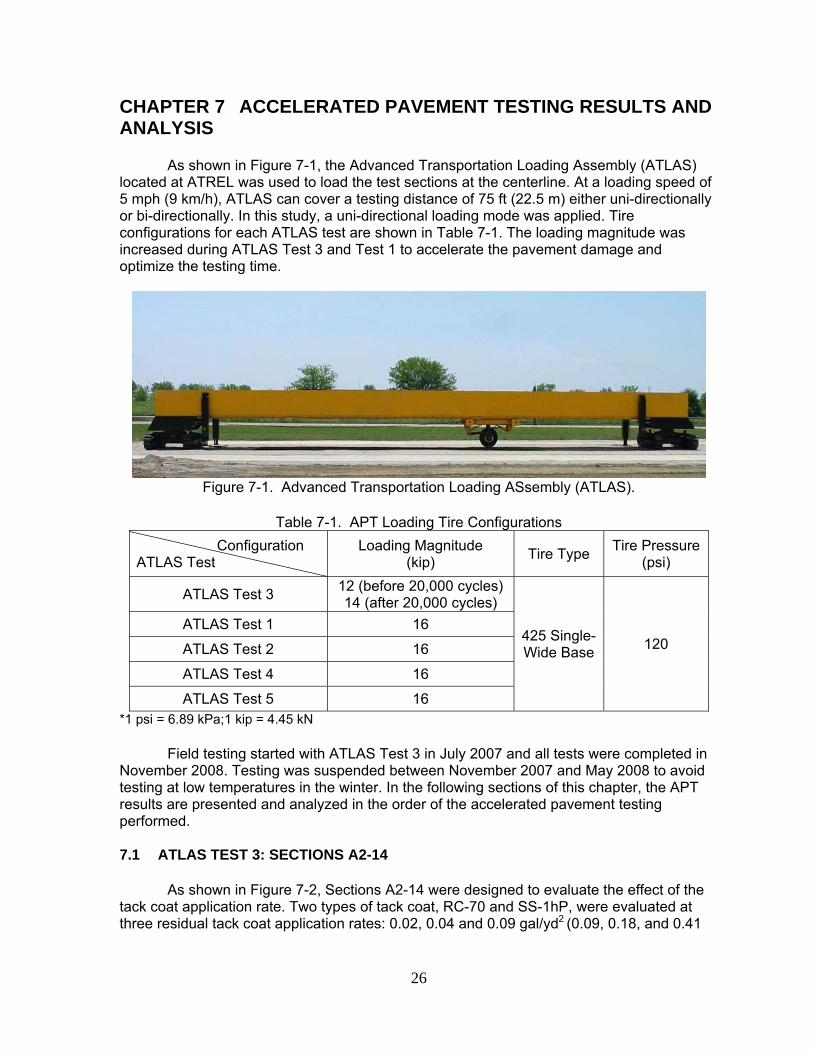
As shown in Figure 7-1, the Advanced Transportation Loading Assembly (ATLAS) located at ATREL was used to load the test sections at the centerline. At a loading speed of 5 mph (9 km/h), ATLAS can cover a testing distance of 75 ft (22.5 m) either uni-directionally or bi-directionally. In this study, a uni-directional loading mode was applied. Tire configurations for each ATLAS test are shown in Table 7-1. The loading magnitude was increased during ATLAS Test 3 and Test 1 to accelerate the pavement damage and optimize the testing time.
ATLAS Test 3 12 (before 20,000 cycles)14 (after 20,000 cycles)
425 Single- Wide Base 120
ATLAS Test 1 16
ATLAS Test 2 16
ATLAS Test 4 16
ATLAS Test 5 16 *1 psi = 6.89 kPa;1 kip = 4.45 kN
Field testing started with ATLAS Test 3 in July 2007 and all tests were completed in November 2008. Testing was suspended between November 2007 and May 2008 to avoid testing at low temperatures in the winter. In the following sections of this chapter, the APT results are presented and analyzed in the order of the accelerated pavement testing performed.
7.1 ATLAS TEST 3: SECTIONS A2-14
As shown in Figure 7-2, Sections A2-14 were designed to evaluate the effect of the tack coat application rate. Two types of tack coat, RC-70 and SS-1hP, were evaluated at three residual tack coat application rates: 0.02, 0.04 and 0.09 gal/yd2
(0.09, 0.18, and 0.41
27
L/m2). All six sections have the same smooth PCC surface and the same standard binder HMA.
Indicates a milled surface that is broom cleaned only.
Indicates a milled surface that is thoroughly cleaned with an air blast.
Figure 7-2. ATLAS Test 3 sections.
During the summer of 2007, 20,000 cycles of ATLAS loading at 12 kip (53.4 kN) and
55,000 cycles of ATLAS loading at 14 kip (62.3 kN) were completed for Test 3. The HMA overlay temperature measured by the thermocouples ranged from 55 to 104oF (13 to 40oC). Thermocouple readings also indicated that the temperature difference within the HMA layer was less than 4oF (2oC).
7.1.1 Strain Response
As shown in Figure 5-5, 7 strain gauges were installed in Sections 10 to 12 to track the strains at the interfaces of sections with various tack coat application rates. Figure 7-3 presents the typical HMA strain responses at an early stage for each of these instrumented sections. By comparing the peak reading of each strain gauge, it is clear that the section having a high tack coat application rate experienced the highest transverse tensile strain and slippage strain, while the section having an optimum rate showed the lowest strains. Another finding, from Figure 7-3, is that although the strain gauge readings were auto-zeroed at the beginning of each loading cycle, they did not actually go back to zero at the end of the wheel pass. This suggests that when the pavement was unloaded, residual strains accumulated at the interface. These residual strains would ultimately cause permanent shear deformation in the overlay.
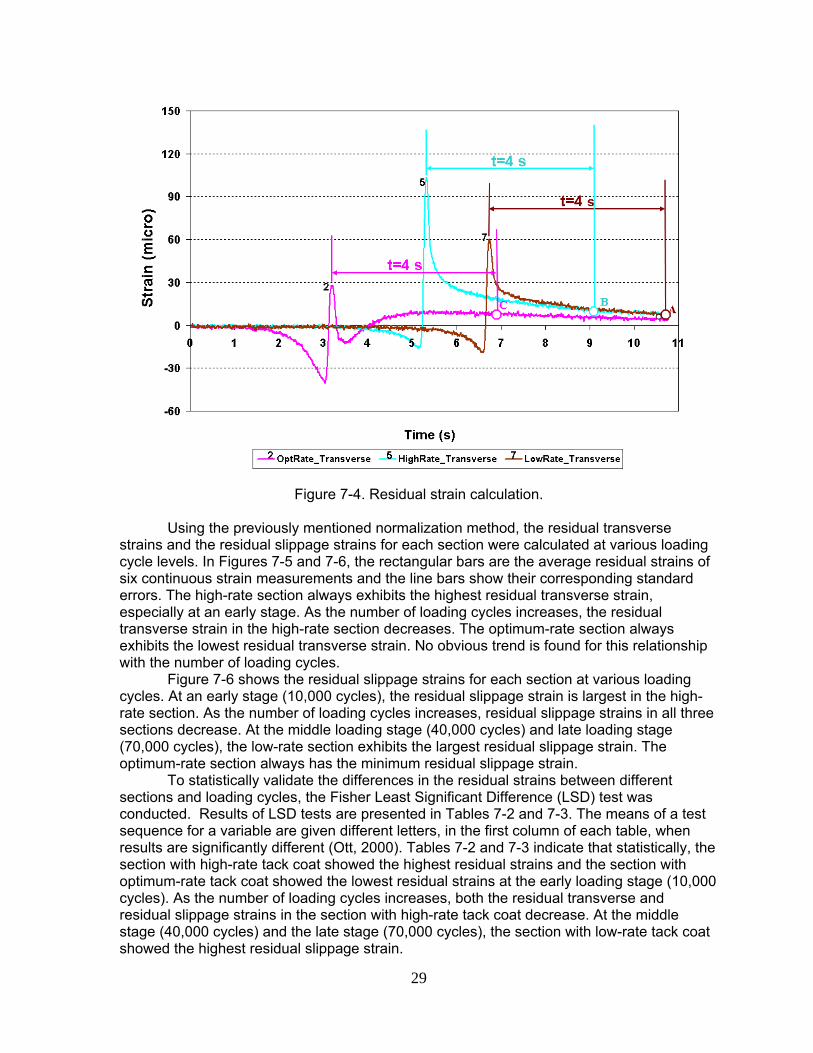
Note that the residual strains at the end of the loading cycle are not the same as the true residual strain occurring at the interface, because the strains don’t have enough time to fully recover between loading cycles. Therefore, the following normalization method was applied to allow comparison. As shown in Figure 7-4, the transverse tensile strain responses at each section are plotted against time. The residual strain is defined as the strain measured at 4 s after the maximum strain response. For example, strains at points A, B, and C in Figure 7-4 correspond to the residual transverse tensile strains at low-rate section, high-rate section, and optimum-rate section, respectively.
28
(a)
(b)
Figure 7-3. Typical strain responses at early age: (a) transverse tensile strain, and (b) slippage strain.
Optimum-Rate Section
High-Rate Section
Low-Rate Section
Optimum-Rate Section
High-Rate Section
Low-Rate Section
29
Figure 7-4. Residual strain calculation.
Using the previously mentioned normalization method, the residual transverse
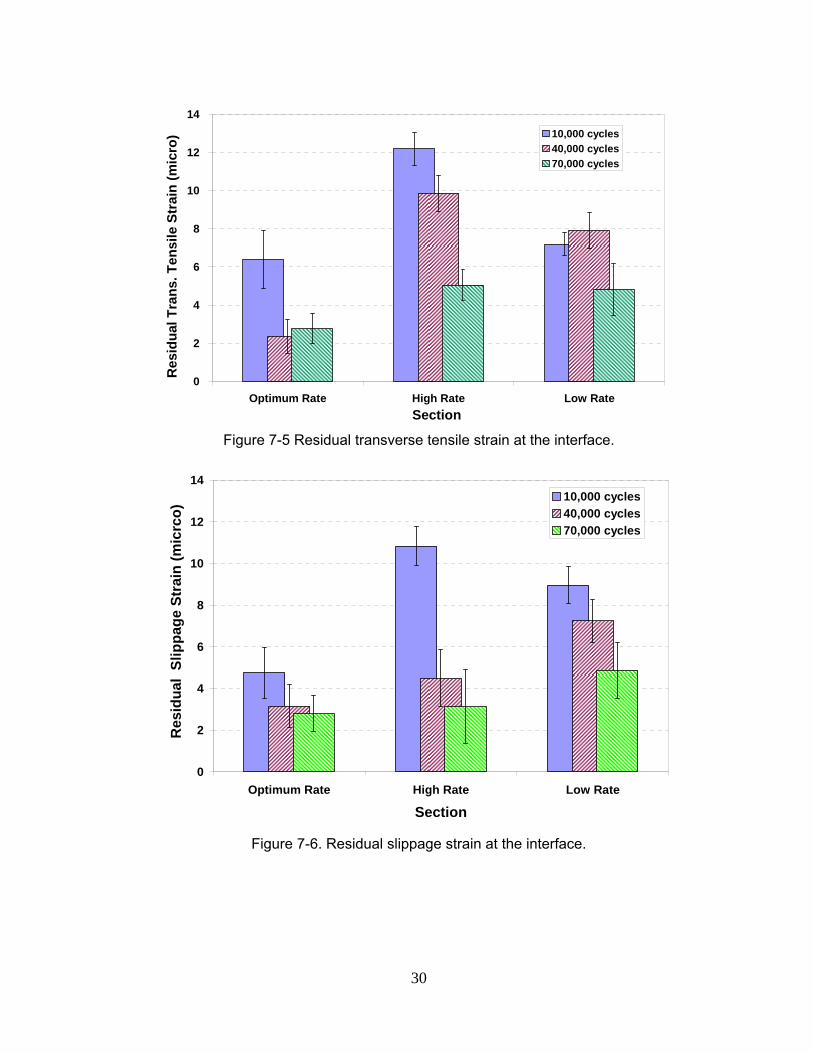
strains and the residual slippage strains for each section were calculated at various loading cycle levels. In Figures 7-5 and 7-6, the rectangular bars are the average residual strains of six continuous strain measurements and the line bars show their corresponding standard errors. The high-rate section always exhibits the highest residual transverse strain, especially at an early stage. As the number of loading cycles increases, the residual transverse strain in the high-rate section decreases. The optimum-rate section always exhibits the lowest residual transverse strain. No obvious trend is found for this relationship with the number of loading cycles.
Figure 7-6 shows the residual slippage strains for each section at various loading cycles. At an early stage (10,000 cycles), the residual slippage strain is largest in the high-rate section. As the number of loading cycles increases, residual slippage strains in all three sections decrease. At the middle loading stage (40,000 cycles) and late loading stage (70,000 cycles), the low-rate section exhibits the largest residual slippage strain. The optimum-rate section always has the minimum residual slippage strain. To statistically validate the differences in the residual strains between different sections and loading cycles, the Fisher Least Significant Difference (LSD) test was conducted. Results of LSD tests are presented in Tables 7-2 and 7-3. The means of a test sequence for a variable are given different letters, in the first column of each table, when results are significantly different (Ott, 2000). Tables 7-2 and 7-3 indicate that statistically, the section with high-rate tack coat showed the highest residual strains and the section with optimum-rate tack coat showed the lowest residual strains at the early loading stage (10,000 cycles). As the number of loading cycles increases, both the residual transverse and residual slippage strains in the section with high-rate tack coat decrease. At the middle stage (40,000 cycles) and the late stage (70,000 cycles), the section with low-rate tack coat showed the highest residual slippage strain.
30
0
2
4
6
8
10
12
14
Optimum Rate High Rate Low RateSection
Res
idua
l Tra
ns. T
ensi
le S
trai
n (m
icro
) 10,000 cycles40,000 cycles70,000 cycles
Figure 7-5 Residual transverse tensile strain at the interface.
0
2
4
6
8
10
12
14
Optimum Rate High Rate Low Rate
Section
Res
idua
l Sl
ippa
ge S
trai
n (m
icrc
o)
10,000 cycles40,000 cycles70,000 cycles
Figure 7-6. Residual slippage strain at the interface.
31
Table 7-2. LSD Results for Residual Transverse Strain t
group Mean of Residual
Transverse Strain (micro) N Section Loading Cycle
A 12.2 6 High Rate 10,000 B 9.9 6 High Rate 40,000 C 7.9 6 Low Rate 40,000
C/D 7.2 6 Low Rate 10,000 D 6.4 6 Optimum Rate 10,000 E 5.1 6 High Rate 70,000 E 4.8 6 Low Rate 70,000 F 2.8 6 Optimum Rate 70,000 F 2.4 6 Optimum Rate 40,000
Table 7-3. LSD Results for Residual Slippage Strain
t group
Mean of Residual Slippage Strain (micro) N Section Loading Cycle
A 10.8 6 High Rate 10,000 B 8.9 6 Low Rate 10,000 C 7.2 6 Low Rate 40,000 D 4.8 6 Low Rate 70,000 D 4.8 6 Optimum Rate 10,000
D/E 4.5 6 High Rate 40,000 E/F 3.2 6 Optimum Rate 40,000 F 2.9 6 Optimum Rate 70,000 F 2.8 6 High Rate 70,000
The following points summarize the findings from the strain gauge data:
In general, at the section with optimum-rate tack coat, minimum peak and residual strains were measured.
The section with high-rate tack coat had the maximum residual strains at an early stage, and this residual strain decreased with the increased loading cycle.
7.1.2 HMA Surface Profile Measurement
In addition to the strain response, HMA overlay surface profile data were also collected before APT testing and after 10,000, 30,000, 60,000, and 75,000 APT loading cycles. The profile data were collected using a straight steel beam and digital caliper, as shown in Figure 7-7. A dipstick was used later in the project.
Figure 7-7. HMA overlay surface profile measurement in ATLAS Test 3.
32
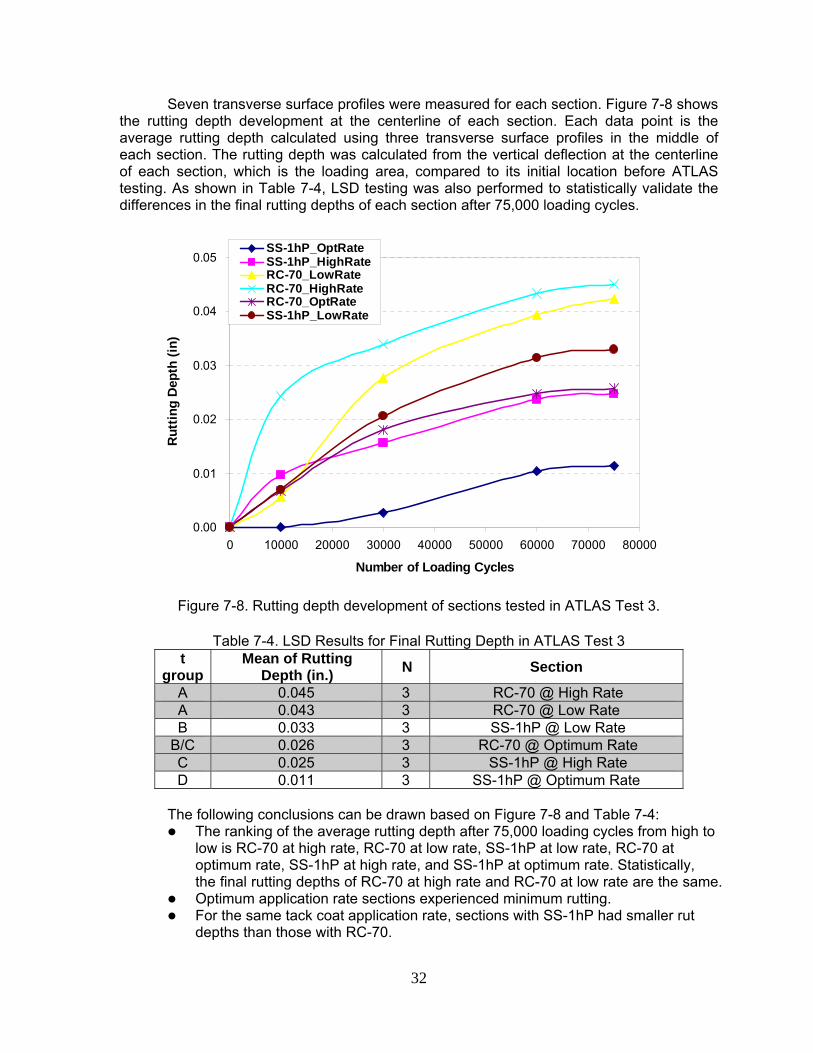
Seven transverse surface profiles were measured for each section. Figure 7-8 shows the rutting depth development at the centerline of each section. Each data point is the average rutting depth calculated using three transverse surface profiles in the middle of each section. The rutting depth was calculated from the vertical deflection at the centerline of each section, which is the loading area, compared to its initial location before ATLAS testing. As shown in Table 7-4, LSD testing was also performed to statistically validate the differences in the final rutting depths of each section after 75,000 loading cycles.
Figure 7-8. Rutting depth development of sections tested in ATLAS Test 3.
Table 7-4. LSD Results for Final Rutting Depth in ATLAS Test 3
t group
Mean of Rutting Depth (in.) N Section
A 0.045 3 RC-70 @ High Rate A 0.043 3 RC-70 @ Low Rate B 0.033 3 SS-1hP @ Low Rate
B/C 0.026 3 RC-70 @ Optimum Rate C 0.025 3 SS-1hP @ High Rate D 0.011 3 SS-1hP @ Optimum Rate
The following conclusions can be drawn based on Figure 7-8 and Table 7-4:
The ranking of the average rutting depth after 75,000 loading cycles from high to low is RC-70 at high rate, RC-70 at low rate, SS-1hP at low rate, RC-70 at optimum rate, SS-1hP at high rate, and SS-1hP at optimum rate. Statistically, the final rutting depths of RC-70 at high rate and RC-70 at low rate are the same.
Optimum application rate sections experienced minimum rutting. For the same tack coat application rate, sections with SS-1hP had smaller rut
depths than those with RC-70.
33
7.2 ATLAS TEST 1: SECTIONS A1-5 ATLAS was moved to the Test 1 location after Test 3 was completed. During the
summer of 2008, 67,000 cycles of APT loading at 16 kip (71.2 kN) were completed by ATLAS on Test 1. The HMA overlay temperature measured by the thermocouples ranged from 59 to109oF (15 to 43oC). The thermocouple readings indicated that the temperature difference within the HMA layer at any testing time was less than 5oF (3oC).
Indicates a milled surface that is broom cleaned only.
Indicates a milled surface that is thoroughly cleaned with an air blast.
Figure 7-9. ATLAS Test 3 sections.
As shown in Figure 7-9, ATLAS Test 1 was mainly designed to compare different
surface textures. Sections 2 through 5 had smooth, broom-cleaned milled, air blast-cleaned milled, and transverse tined PCC surfaces, respectively. The same tack coat, RC-70, was applied at the optimum residual application rate, 0.04 gal/yd2 (0.18 L/m2) at these four sections. Section A1 is an added section to evaluate the performance of asphalt binder PG64-22 as tack coat material. PG64-22 was applied at the optimum residual rate of 0.04 gal/yd2 (0.18 L/m2) on smooth PCC surface in this section. Section 1 is a reference section which has no tack coat on the smooth PCC surface.
Figure 7-10 shows the dipstick that was used in this test to monitor the primary HMA rutting development. Surface profile data were measured before loading, and after 7,000, 17,000, 37,000, 47,000, 67,000, and 75,000 cycles of loading. Figure 7-11 shows the final rutting depth (average of three surface profiles in the middle of each section) at the centerline of each section after 75,000 cycles and their corresponding standard errors. Table 7-5 presents the LSD statistical ranking of the final rutting depths in each section. The findings from Figure 7-11 and Table 7-5 can be summarized as follows:
Rutting depth ranking after 75,000 loading cycles from high to low is smooth surface with no tack, smooth surface with RC-70 at the optimum rate, transverse tined surface with RC-70 at the optimum rate, broom-cleaned milled surface with RC-70 at the optimum rate, air blast-cleaned milled surface with RC-70 at the optimum rate, and smooth surface with PG64-22 at the optimum rate.
34
Statistically, sections with transverse-tined PCC surface and smooth PCC surfaces have the same rutting depth. Milled PCC surfaces showed lower rutting depth than smooth and transverse-tined PCC surfaces.
Cleanliness level affects the rutting depth; the broom-cleaned surface resulted in higher rutting depth than the air blast-cleaned surface.
Sections with no tack coat showed the highest rutting depth compared to other sections.
Asphalt binder PG64-22 provided lower rutting depth than RC-70 at the same residual application rate.
Figure 7-10. Dipstick used for pavement surface profile measurement.
0
0.01
0.02
0.03
0.04
0.05
0.06
0.07
0.08
PG64-22Smooth
No TackSmooth
RC-70 Milled Broom
RC-70 Milled Air
RC-70Smooth
RC-70 Trans Tining
Section
Rut
ting
(in)
Figure 7-11. Rutting depth of each section in ATLAS Test 1 after 75,000 cycles.
35
Table 7-5. LSD Results for Final Rutting Depth in ATLAS Test 1 t
group Mean of Rutting Depth (in.) N Section (Tack Coat/ PCC Surface)
A 0.065 3 No Tack/Smooth B 0.043 3 RC-70/Smooth B 0.043 3 RC-70/ Transverse Tined C 0.029 3 RC-70/Broom Cleaned Milled D 0.016 3 RC-70/Air Blast Cleaned Milled D 0.014 3 PG64-22/Smooth
7.3 ATLAS TEST 2: SECTIONS 6-9
ATLAS was moved to the Test 2 location after it completed Test 1 loading. During the summer of 2008, 75,000 cycles of APT loading at 16 kip (71.2 kN) were completed by ATLAS on Test 1. The HMA overlay temperature measured by the thermocouples ranged from 57 to 103oF (14 to 39oC). The thermocouple readings indicated that the temperature difference within the HMA layer was less than 5oF (3oC).
Indicates a milled surface that is broom cleaned only.
Indicates a milled surface that is thoroughly cleaned with an air blast.
Figure 7-12. ATLAS Test 2 sections.
As shown in Figure 7-12, Sections 6 through 9 were included in ATLAS Test 2 to compare different PCC surface textures. The evaluated PCC surface textures in Test 2 were transverse tined, broom-cleaned milled, air blast-cleaned milled, and smooth. The same tack coat SS-1hP was applied at the optimum residual application rate, 0.04 gal/yd2 (0.18 L/m2), on these four sections.
Figure 7-13. Rutting depth progress in ATLAS Test 2.
Table 7-6. LSD Results for Final Rutting Depth in ATLAS Test 2
t group Mean of Rutting Depth (in.) N PCC Surface Texture
A 0.042 3 Smooth A 0.041 3 Transverse Tined B 0.033 3 Broom-cleaned Milled C 0.025 3 Air-blast-cleaned Milled Figure 7-13 shows the rutting depth progress in Test 2. Each data point in Figure 7-
13 is the average of the rutting depths measured from three transverse surface profiles in the middle of each section. To statistically validate the difference in the final rutting depth of each section, the LSD test was performed and the results are shown in Table 7-6. According to Figure 7-13 and Table 7-6, the following findings can be obtained:
The rank of the final rutting depth (from high to low) is SS-1hP with smooth PCC surface, SS-1hP with transverse-tined PCC surface, SS-1hP with broom-cleaned milled PCC surface, and SS-1hP with air blast-cleaned milled PCC surface.
Statistically, there’s no significant difference in the final rutting depth between the sections with smooth PCC surface and transverse-tined PCC surface.
The milled PCC surface provided lower final rutting depth than smooth PCC surface when SS-1hP was applied at 0.04 gal/yd2 (0.18 L/m2).
Surface cleaning method affects the HMA surface rutting depth for the sections with a milled PCC surface. The section with air blast-cleaned PCC surface showed lower rutting depth than the section with broom-cleaned PCC surface.
37
7.4 ATLAS TEST 4: SECTIONS 16-19
ATLAS was moved to the Test 4 location after it completed Test 2 loading. During the summer of 2008, 75,000 cycles of APT loading at 16 kip (71.2 kN) were completed by ATLAS on Test 4. The HMA overlay temperature measured by the thermocouples ranged from 52 to 106oF (11 to 41oC). The thermocouple readings indicated that the temperature difference within the HMA layer was less than 4oF (2oC).
Indicates a milled surface that is broom cleaned only.
Indicates a milled surface that is thoroughly cleaned with an air blast.
Figure 7-14 ATLAS Test 4 sections. As shown in Figure 7-14, Sections 16 through 19 were included in Test 4 to compare
PCC surface textures. Four PCC surface textures were evaluated in Test 4: transverse tined, air blast-cleaned milled, broom-cleaned milled, and longitudinal tined. SS-1hP was applied at the optimum residual rate of 0.04 gal/yd2 (0.18 L/m2), and the moisture sensitive binder mix was used in the HMA overlay.
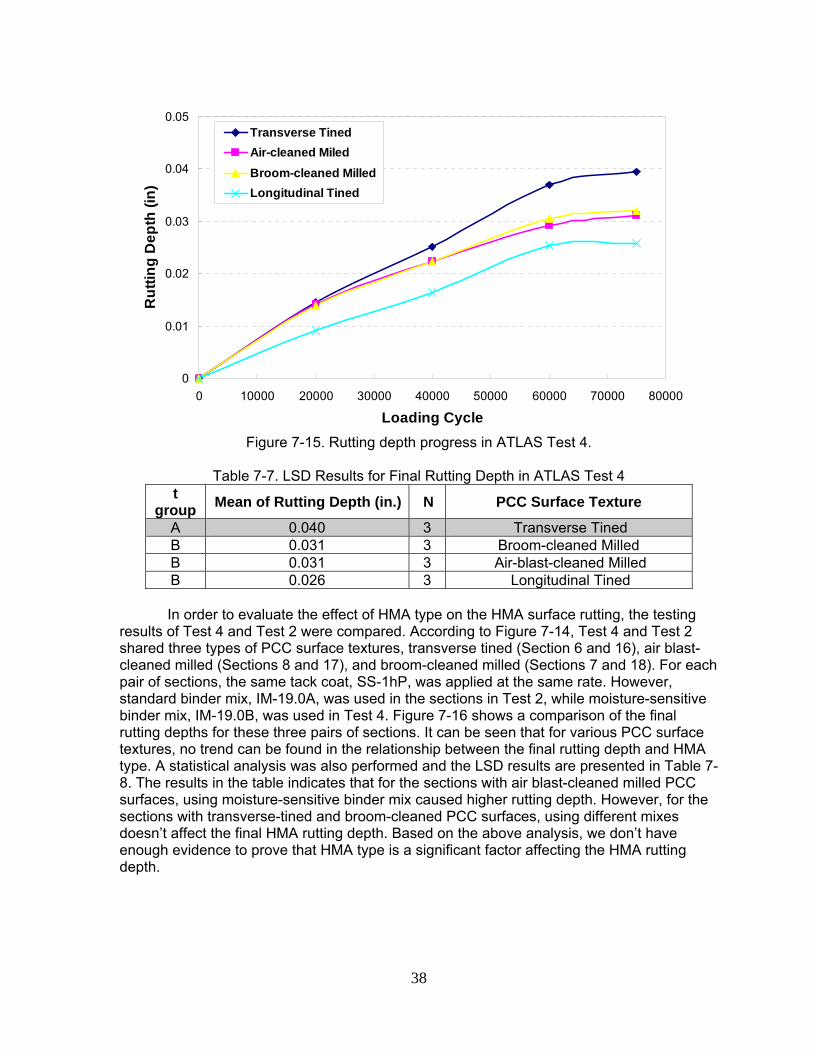
Figure 7-15 shows the rutting depth progress in ATLAS Test 4. The LSD testing results are presented in Table 7-7. The following concludes the findings of ATLAS Test 4:
The rank of the average final rutting depth (from high to low) is transverse tined, broom-cleaned milled, air blast-cleaned milled, and longitudinal tined.
No significant difference was found in the final rutting depths between the sections using different PCC surface cleaning methods.
No significant difference was found in the final rutting depths between the sections with milled PCC surfaces and the section with longitudinal-tined PCC surface.
Figure 7-15. Rutting depth progress in ATLAS Test 4.
Table 7-7. LSD Results for Final Rutting Depth in ATLAS Test 4
t group Mean of Rutting Depth (in.) N PCC Surface Texture
A 0.040 3 Transverse Tined B 0.031 3 Broom-cleaned Milled B 0.031 3 Air-blast-cleaned Milled B 0.026 3 Longitudinal Tined
In order to evaluate the effect of HMA type on the HMA surface rutting, the testing results of Test 4 and Test 2 were compared. According to Figure 7-14, Test 4 and Test 2 shared three types of PCC surface textures, transverse tined (Section 6 and 16), air blast-cleaned milled (Sections 8 and 17), and broom-cleaned milled (Sections 7 and 18). For each pair of sections, the same tack coat, SS-1hP, was applied at the same rate. However, standard binder mix, IM-19.0A, was used in the sections in Test 2, while moisture-sensitive binder mix, IM-19.0B, was used in Test 4. Figure 7-16 shows a comparison of the final rutting depths for these three pairs of sections. It can be seen that for various PCC surface textures, no trend can be found in the relationship between the final rutting depth and HMA type. A statistical analysis was also performed and the LSD results are presented in Table 7-8. The results in the table indicates that for the sections with air blast-cleaned milled PCC surfaces, using moisture-sensitive binder mix caused higher rutting depth. However, for the sections with transverse-tined and broom-cleaned PCC surfaces, using different mixes doesn’t affect the final HMA rutting depth. Based on the above analysis, we don’t have enough evidence to prove that HMA type is a significant factor affecting the HMA rutting depth.
Figure 7-16. Rutting Depth Comparison between Sections with Different HMA Types.
Table 7-8. LSD Results for Comparison between Sections with Different HMA Types
PCC Surface t group
Mean of Rutting Depth (in.) N HMA Type
Transverse-tined
A 0.041 3 Standard Binder Mix A 0.040 3 Moisture-Sensitive Binder Mix
Air Blast-Cleaned Milled
A 0.031 3 Moisture-Sensitive Binder MixB 0.025 3 Standard Binder Mix
Broom-Cleaned Milled
A 0.033 3 Standard Binder Mix A 0.032 3 Moisture-Sensitive Binder Mix
7.5 ATLAS TEST 5: SECTIONS 20-24
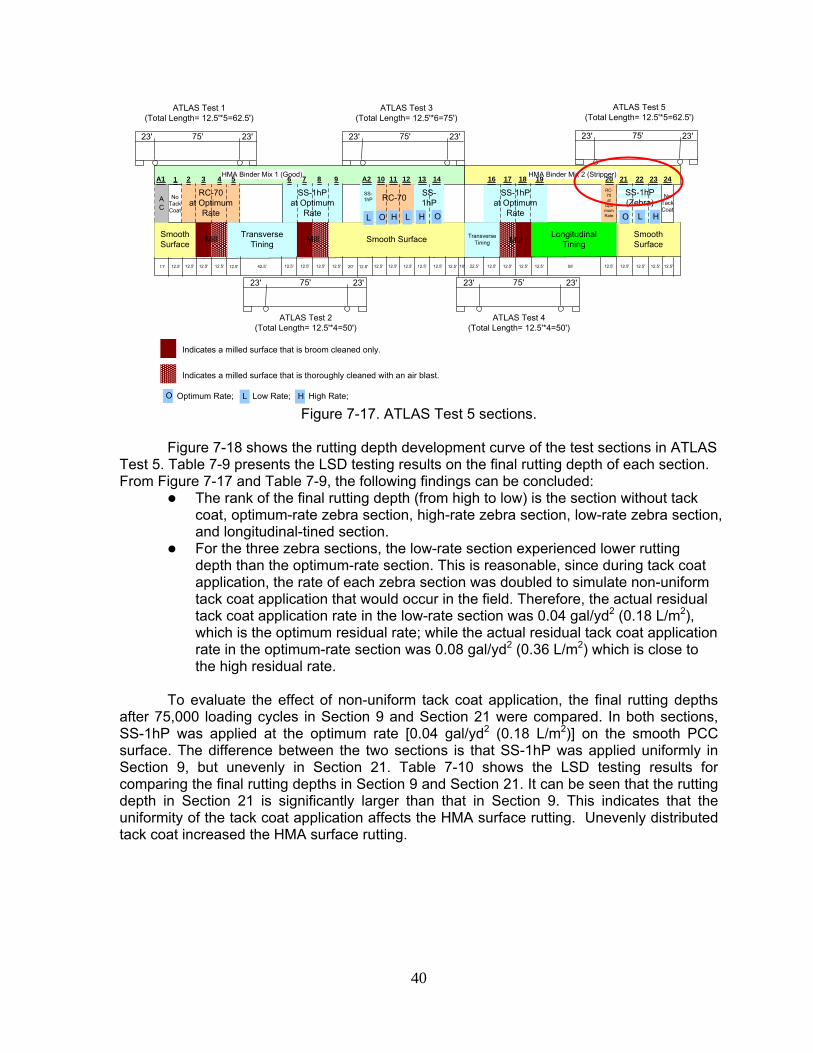
As shown in Figure 7-17, ATLAS Test 5 included Sections 20 through 24. The main purpose of Test 5 was to evaluate the zebra/non-uniform tack coat application effect on the overlay rutting. SS-1hP was applied in a zebra pattern on the smooth PCC surface on Sections 21 through 23. The widths of both the tack coat stripe and the gap between the stripes were 3 in. (76 mm). SS-1hP was applied on Sections 21 through 23 at a doubled optimum rate [0.08 gal/yd2 (0.36 L/m2)], a doubled low rate [0.04 gal/yd2
(0.18 L/m2)], and a doubled high rate [0.18 gal/yd2 (0.82 L/m2)], respectively. Section 20 had RC-70 at the optimum rate (0.04 gal/yd2) on the longitudinal-tined PCC surface, and Section 24 was a reference section which had no tack coat on the smooth PCC surface. The moisture sensitive mix was used in the HMA overlay of all sections in Test 5.
During the fall of 2008, 75,000 cycles of APT loading were completed by ATLAS on Test 5. The HMA overlay temperature measured by the thermocouples ranged from 48 to 100oF (9 to 38oC). The thermocouple readings indicated that the temperature difference within the HMA layer was less than 4oF (2oC).
Indicates a milled surface that is broom cleaned only.
Indicates a milled surface that is thoroughly cleaned with an air blast.
Figure 7-17. ATLAS Test 5 sections.
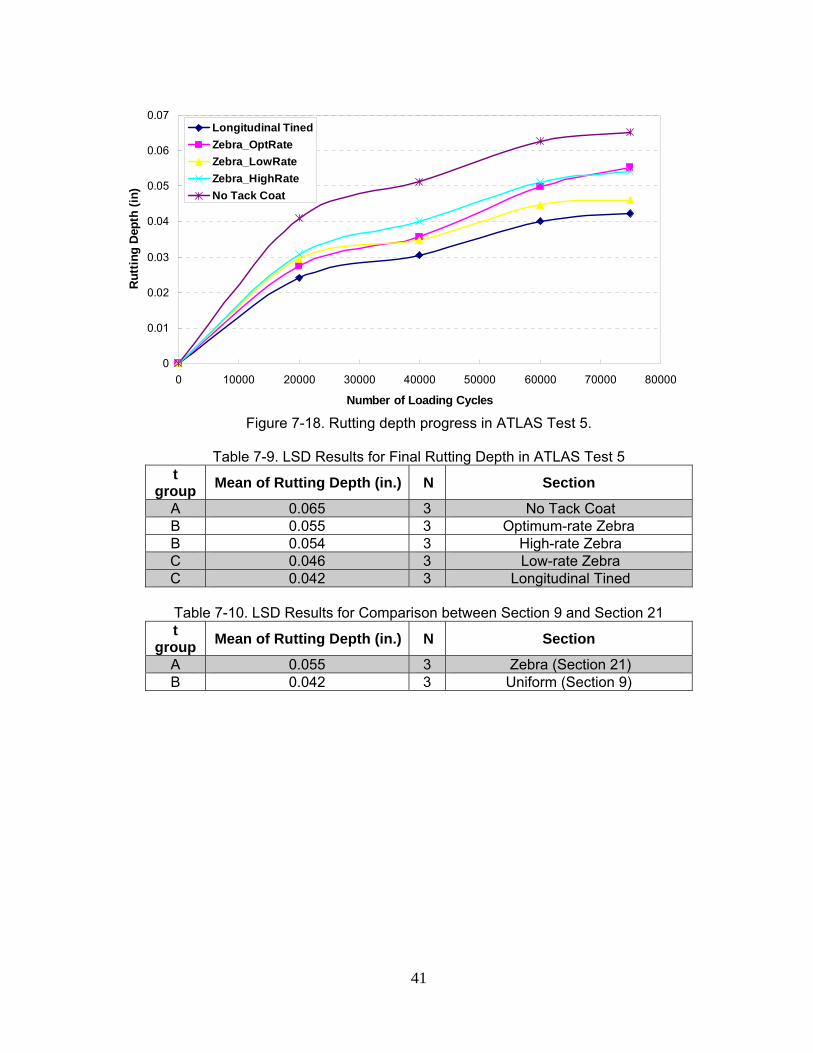
Figure 7-18 shows the rutting depth development curve of the test sections in ATLAS
Test 5. Table 7-9 presents the LSD testing results on the final rutting depth of each section. From Figure 7-17 and Table 7-9, the following findings can be concluded:
The rank of the final rutting depth (from high to low) is the section without tack coat, optimum-rate zebra section, high-rate zebra section, low-rate zebra section, and longitudinal-tined section.
For the three zebra sections, the low-rate section experienced lower rutting depth than the optimum-rate section. This is reasonable, since during tack coat application, the rate of each zebra section was doubled to simulate non-uniform tack coat application that would occur in the field. Therefore, the actual residual tack coat application rate in the low-rate section was 0.04 gal/yd2 (0.18 L/m2), which is the optimum residual rate; while the actual residual tack coat application rate in the optimum-rate section was 0.08 gal/yd2 (0.36 L/m2) which is close to the high residual rate.
To evaluate the effect of non-uniform tack coat application, the final rutting depths
after 75,000 loading cycles in Section 9 and Section 21 were compared. In both sections, SS-1hP was applied at the optimum rate [0.04 gal/yd2 (0.18 L/m2)] on the smooth PCC surface. The difference between the two sections is that SS-1hP was applied uniformly in Section 9, but unevenly in Section 21. Table 7-10 shows the LSD testing results for comparing the final rutting depths in Section 9 and Section 21. It can be seen that the rutting depth in Section 21 is significantly larger than that in Section 9. This indicates that the uniformity of the tack coat application affects the HMA surface rutting. Unevenly distributed tack coat increased the HMA surface rutting.
Figure 7-18. Rutting depth progress in ATLAS Test 5.
Table 7-9. LSD Results for Final Rutting Depth in ATLAS Test 5
t group Mean of Rutting Depth (in.) N Section
A 0.065 3 No Tack Coat B 0.055 3 Optimum-rate Zebra B 0.054 3 High-rate Zebra C 0.046 3 Low-rate Zebra C 0.042 3 Longitudinal Tined
Table 7-10. LSD Results for Comparison between Section 9 and Section 21 t
group Mean of Rutting Depth (in.) N Section
A 0.055 3 Zebra (Section 21) B 0.042 3 Uniform (Section 9)
42
CHAPTER 8 CONCLUSIONS AND RECOMMENDATIONS
This study evaluated the tack coat and bond between HMA overlays and PCC pavements through both laboratory testing and field testing. The following are the conclusions of the field validation study:
Field testing results support the laboratory testing outcome that asphalt emulsion provides better interface bonding than RC-70.
From laboratory testing, the optimum SS-1hP tack coat residual application rate was found at 0.04 gal/yd2
(0.18 L/m2). This value was validated in the field testing. Similar conclusion applied to RC-70.
PG64-22 binder provides the highest HMA-PCC interface bonding. Milled PCC surface provides better interface shear strength and rutting
resistance than tined and smooth PCC surfaces. A well-cleaned PCC surface would reduce HMA interface shear rutting. Non-uniform tack coat distribution would cause higher HMA surface rutting. Field testing results didn’t show enough evidence to prove that using a moisture-
sensitive mix will result in higher HMA surface rutting. According to the findings of this study, the following recommendations are proposed:
SS-1hP (or SS-1h from laboratory investigation) should be used as the tack coat material at the HMA-PCC interface; RC-70 should not be used.
The recommended optimum residual tack coat application rate is 0.04 gal/yd2
(0.18 L/m2) for maximum HMA –PCC interface bonding. Milling the PCC surface would increase the HMA–PCC interface bonding and
should be applied when possible. When the PCC surface is milled, thoroughly cleaning the milled PCC surface
using air blast before tack coat application is recommended for better interface bonding.
Tack coat should be applied uniformly on the PCC surface and zebra application should not be allowed.
PCC surface tining may not add to the HMA-PCC interface bonding.
43
REFERENCES Al-Qadi, I. L., T. L. Brandon, S. A. Bhutta, and A. K. Appea, Performances of Geosynthetically Stabilized Pavements, Final Report to Amoco Company, Virginia Polytechnic and State University, Blacksburg, VA, 1998. Al-Qadi, I. L., E. Tutumluer, S. Dessouky, and J. Kwon, Construction Report: Effectiveness of Geogrid-reinforcement in Flexible Pavements: A Full-Scale Testing, University of Illinois, Urbana-Champaign, IL, 2007. Al-Qadi, I. L., S. H. Carpenter, Z. Leng, and H. Ozer, Tack Coat Optimization for HMA Overlay: Laboratory Testing Report, Illinois Center for Transpiration, Rantoul, IL, 2008. Baker, H. B., M. R. Buth, and D. A. Van Deusen, Minnesota Road Research Project: Load Response Instrumentation Installation and Testing Procedures. Final Report No. MN/PR-94/01, Minnesota Department of Transportation, St. Paul, 1994. Donovan, E. P., I. L Al-Qadi, and A. Loulizi, “Optimization of Tack Coat Application Rate for Geocomposite Membrane on Bridge Decks,” Transportation Research Record: Journal of the Transportation Research Board, No. 1740, National Research Council, Washington, D.C., 2000, pp. 143-150. Hachiya, Y., K. and Sato, “Effect of Tack Coat on Bonding Characteristics at Interface between Asphalt Concrete Layers.” Proceedings of 8th International Conference on Asphalt Pavements, Vol. 1, Seattle, WA, 1997, pp. 349-362. Huang, Y. H., Pavement Analysis and Design, 2nd Edition, Prentice Hall, N.J., 2003. Leng, Z., I. L. Al-Qadi, H. Ozer, and S. H. Carpenter, “Tack Coat Application Rate Optimization and Environmental Effect on HMA Overlay-PCC Pavement Bonding.” Proceedings of the International ISAP Symposium on Asphalt Pavements and Environment, M. N. Partel, Ed., Zurich, Switzerland, 2008(a), pp. 825-836. Leng, Z., H. Ozer, I. L. Al-Qadi, and S. H. Carpenter, “Interface Bonding between Hot-Mix Asphalt and Various Portland Cement Concrete Surfaces: Laboratory Assessment.” Transportation Research Record: Journal of the Transportation Research Board, No.2057, Transportation Research Board of the National Academies, Washington , D.C., 2008(b), pp. 46-53. Mohammad, L. N., M. A Raqib, and B. Huang, “Influence of Asphalt Tack Coat Materials on Interface Shear Strength.” In Transportation Research Record: Journal of the Transportation Research Board, No. 1789, Transportation Research Board of the National Academies, Washington, D.C., 2002, pp. 56-65. Ott, R. L., and M. Longnecker. An Introduction to Statistical Methods and Data Analysis, 5th Edition. Duxbury Press, Pacific Grove, CA, 2000. Romanoschi, S. A., Characterization of Pavement Layer Interfaces. Ph.D. Dissertation, Louisiana State University, Baton Rouge, LA, 1999.
44
Sargand, S. Development of an Instrumentation Plan for the Ohio SPS Test Pavement. Final Report No. FHWA/OH-94/019, Ohio Department of Transportation, Columbus, OH, 1994. Uzan, J., M. Livneh, and Y. Eshed, “Investigation of Adhesion Properties between Asphaltic Concrete Layers.” Asphalt Paving Technology, Proceedings of the Association of Asphalt Paving Technologists, Technical Sessions, Vol. 47, Lake Buena Vista, FL, 1978, pp. 495-521. West, R., J. Zhang, and J. Moore, Evaluation of Bond Strength between Pavement Layers. NCAT Report 05-08, Auburn, AL, 2005. Woods, M. E., Laboratory Evaluation of Tensile and Shear Strengths of Asphalt Tack Coats. Master’s Thesis, Mississippi State University, Starkville, MS, 2004. WSDOT, Tack Coat. Tech Notes, Washington State Department of Transportation, Olympia, 2003.
A-1
APPENDIX A: NUMERICAL MODELING OF TACK COAT INTERFACES A.1 INTRODUCTION
Interface bonding conditions between pavement layers are some of the most influential factors on the service life of pavement structures. Poor bonding between pavement layers can lead to serious problems such as slippage cracking, compaction difficulties, and premature deformation. Accurate characterization of these interfaces is crucial for understanding the response of the pavement system. Interface bonding in pavement layers is no different from other interface problems; it stems from the relationship between friction and adhesives. From a numerical point of view, any constitutive model used to explain this phenomenon should include basic characteristics of friction with or without cohesion at the interface level. Similar interface problems have long been considered in geotechnical and structural applications. Interface elements within the concept of finite element (FE) theory have been commonly used in modeling of geometrical discontinuities that can exist in a variety of structures such as pavements, foundations, and buildings. Interface elements are powerful tools to capture the possible displacement jumps at the discontinuities within the concept of the FE method. A.2 METHODOLOGY AND OBJECTIVE
This Appendix introduces a friction model that characterizes pavement layer interfaces. The proposed model is built on three major parameters, shear strength, interface reaction modulus, and friction, to define the behavior of tack coat interfaces. The most important property of this model is its capability to capture the entire range of interface responses, from fully bonded (initial elastic) to fully debonded. The fracture-based elasto-plastic constitutive relationship has been implemented for a frictional interface model. Debonding that can occur in various modes (pure tensile, pure shear, shear with tension, and shear with compression) is formulated by a nonlinear softening model integrated into an elasto-plastic constitutive model. Pressure dependency of the interface shear strength and dilation due to the surface irregularities are two of the frictional properties examined by the model. The appendix includes several numerical examples to illustrate the model’s extensive capabilities.
The approach followed herein involves derivations of the elasto-plastic rate equations and integration algorithms and development of interface elements. Next is the implementation of the integration algorithms and the interface elements in ABAQUS as user elements (UEL). The parameters required for the model are obtained through a series of direct shear tests conducted on hot-mix asphalt (HMA)-Portland cement concrete (PCC) and HMA-HMA specimens bonded with various tack coat materials. The effects of temperature, normal pressure, and tack coat application rates have also been characterized by the frictional constitutive model. This model with its inherent frictional nature is desirable for interface problems especially under various loading conditions (pure tensile, pure shear, shear with compression, and shear with tension).
A.3 NUMERICAL MODEL PARTICULARITIES A.3.1 Interface Element Formulations (Geometric Approximation)
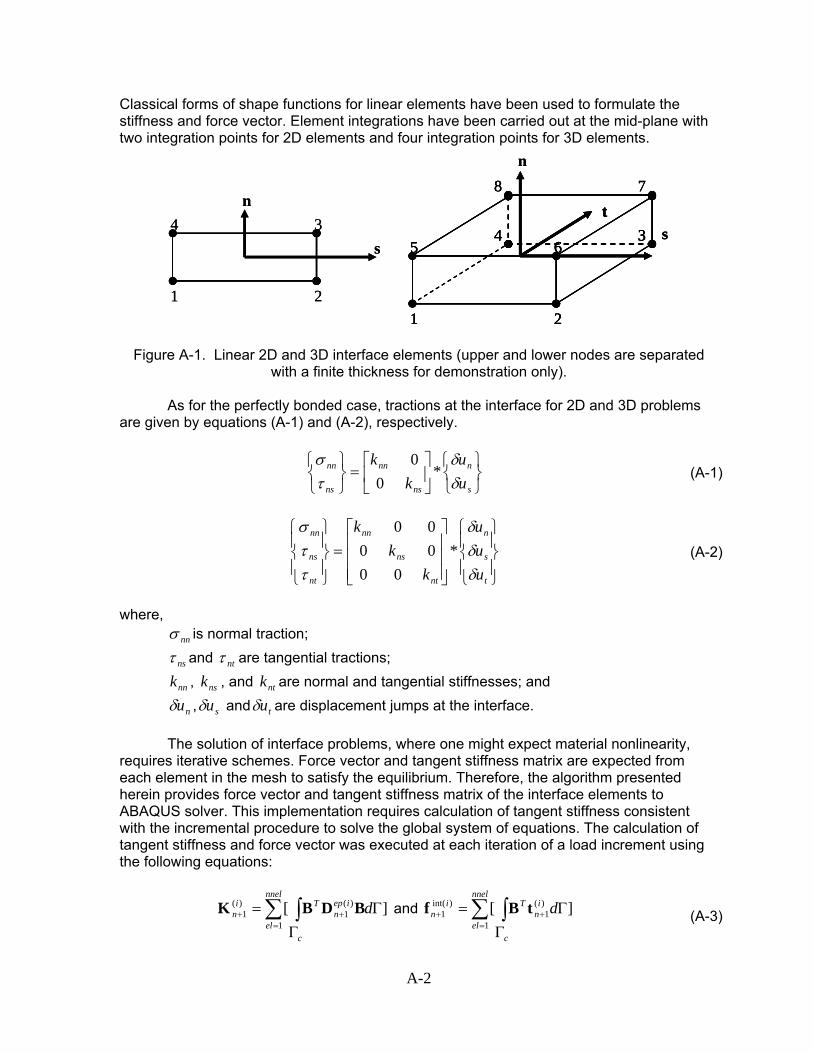
Zero thickness interface elements were formulated and implemented in the FE framework. Linear 2D and 3D isoparametric interface elements are shown in Figure A-1.
A-2
Classical forms of shape functions for linear elements have been used to formulate the stiffness and force vector. Element integrations have been carried out at the mid-plane with two integration points for 2D elements and four integration points for 3D elements.
s65
4 3
21
t8 7
n
s65
4 3
21
t8 7
s65
4 3
21
t
654 3
21
t8 7
n
1
3
2
4s
n
1
3
2
4s
n
Figure A-1. Linear 2D and 3D interface elements (upper and lower nodes are separated with a finite thickness for demonstration only).
As for the perfectly bonded case, tractions at the interface for 2D and 3D problems
are given by equations (A-1) and (A-2), respectively.
⎭⎬⎫
⎩⎨⎧
⎥⎦
⎤⎢⎣
⎡=
⎭⎬⎫
⎩⎨⎧
s
n
ns
nn
ns
nn
uu
kk
δδ
τσ
*0
0 (A-1)
⎪⎭
⎪⎬
⎫
⎪⎩
⎪⎨
⎧
⎥⎥⎥
⎦
⎤
⎢⎢⎢
⎣
⎡=
⎪⎭
⎪⎬
⎫
⎪⎩
⎪⎨
⎧
t
s
n
nt
ns
nn
nt
ns
nn
uuu
kk
k
δδδ
ττσ
*00
0000
(A-2)
where,
nnσ is normal traction;
nsτ and ntτ are tangential tractions;
nnk , nsk , and ntk are normal and tangential stiffnesses; and
nuδ , suδ and tuδ are displacement jumps at the interface.
The solution of interface problems, where one might expect material nonlinearity, requires iterative schemes. Force vector and tangent stiffness matrix are expected from each element in the mesh to satisfy the equilibrium. Therefore, the algorithm presented herein provides force vector and tangent stiffness matrix of the interface elements to ABAQUS solver. This implementation requires calculation of tangent stiffness consistent with the incremental procedure to solve the global system of equations. The calculation of tangent stiffness and force vector was executed at each iteration of a load increment using the following equations:
∑ ∫=
++ ΓΓ
=nnel
elc
iepn
Tin d
1
)(1
)(1 ][ BDBK and ][
1
)(1
)int(1 ∑ ∫
=++
ΓΓ=
nnel
elc
in
Tin dtBf (A-3)
A-3
where, epD is algorithmic consistent tangent operator;
B is the strain-displacement matrix; t are the tractions at the interface;
)(1
in=K is the interface element stiffness matrix calculated at load increment n+1 and
iteration (i); )int(
1i
n=f is the internal force vector calculated at load increment n+1 and iteration (i); nnel is total number of interface elements el is interface element
A.3.2 Interface Model Formulations (Constitutive Model) In this study, an interface constitutive relationship has been implemented with a
frictional Mohr-Coulomb plasticity model. Non-associated plasticity and nonlinear work softening rules have been implemented to describe an entire range of interface responses from fully bonded to debonded cases. The model is capable of capturing initial elastic response followed by nonlinear post peak softening tail, which is commonly observed at cohesive interfaces under shear loading.
The Hyperbolic Mohr-Coulomb friction model, as defined by Zienkiewicz and Pande (1977) and Carol et al. (2001), was implemented as the interface constitutive model. This relationship is shown in equation (A-4). The hyperbolic yield surface was chosen because of its suitability to plasticity equations where gradients of yield surface need to be calculated. The shape of the yield curve and also the potential surface are shown in Figure A-2. Fundamental model properties are listed in Table 1.
222 )tan*()tan*( φφστ sccF nneq −+−−= (A-4)
where,
F is the yield function;
22ntnseq σστ += is equivalent tangential tractions;
nnσ is normal traction; s is tensile strength;
c is cohesion; and φ is friction angle.
Table A-1. Interface Model Parameters Fundamental Plasticity Parameters Remarks s : tensile strength I
fG , IIfG , III
fG :failure energies in modes I, II, and III
Defines how much energy is required for failure under different loading conditions
c: cohesion Strength at zero normal stress
φ: friction angle Defines strength with normal stress
A-4
Normal Traction
Equi
vale
nt T
ange
ntia
l Tra
ctio
n
s
c
φ
Tensile Strength
Cohesion
Friction Angle
Compression Tension
Potential Surface
Yield Surface
Figure A-2. Yield and potential curves (Carol et al., 2001).
Various interface loading conditions are illustrated in Figure A-3. The interface model
developed in this study can resolve interface reaction under these loading conditions. These loading conditions correspond to different regions in Figure A-2, which shows the capacity of an interface. The tensile mode can be critical for a pavement interface consisting of a jointed PCC and HMA overlying. Figure A-3(c) illustrates mixed shear and compression mode, which is the loading conditions commonly observed at interfaces without any joints. A summary of the procedure describing interface element and model implementation in ABAQUS is presented in Figure A-4.
A.3.3 Test Simulations with Interface Model The experimental laboratory results of this study, presented in report ICT-08-023 (Al-Qadi et al., 2008), were used to develop a 3D HMA-PCC interface model. Since the phase of the experimental program didn’t involve normal pressure effect on the interface shear strength, yield surface definition (friction angle, cohesion, and tensile strength) was determined by a parametric study. Model parameters such as tensile strength and cohesion were optimized by matching the maximum shear stress measured in the experiment to that calculated from the model. Friction angle and residual friction angle were assumed to be 35o and 30o, respectively. However, this would need to be verified in the future when various normal pressures are applied.
A-5
Shear Mode(Mode-II and III)
Tensile Mode(Mode-I)
Shear andCompression
(a) (b) (c)
Shear Mode(Mode-II and III)
Tensile Mode(Mode-I)
Shear andCompression
(a) (b) (c)
FIGURE A-3. Various interface loading conditions
Figure A-4. ABAQUS implementation of interface model and elements. Figure A-5 shows a comparison between two experimental results, using SS1-1hP
emulsion applied at 0.362kg/m2 (0.08gal/yd2) rate, and the model outcome at 20oC and 30oC. It is clear that the model accurately matches the entire response. The model’s parameters that define the initial elastic response are stiffness in the two tangential directions kns and knt (MPa/mm). The maximum response is dominated by strength parameters s and c (MPa); while the softening part is governed by the fracture properties in the shear mode, II
fG
(N/mm), as well as the tensile mode, IfG (N/mm). Table A-2 presents the parameters that
satisfy the match between the experimental and simulation results. The results indicate that interface shear strength decreases significantly with temperature increase, as can be seen from the experimental results in Figure A-5. The model also shows a reduction in initial elastic stiffness, tensile strength and cohesion, and fracture energy parameters.
Plasticity model derivations and integration algorithms
Geometric approximation of interface with zero thickness interface elements
Convert algorithms to user element subroutines (UEL) in ABAQUS
Model verification with single element tests and experiments
A-6
0
100
200
300
400
0 2 4 6 8 10 12 14 16Shear Displacement (mm)
She
ar S
tress
(KP
a)Experimental results @ 20 C
Model results @ 20 C
Experimental results @ 30 C
Model results @ 30 C20 oC
30 oC
Figure A-5. Comparison of experimental results and model predictions at 20 and 30oC.
Table A-2. Emulsion Interface Model Parameters @ 20 and 30o C
SS-1hP @ 30oC and 0.08 gal/yd2 0.09 0.159 0.159 0.19 0.28 * 1 MPa = 145.0377psi, 1 N = 0.2248lbs-force, 1 mm = 0.03937in.
REFERENCES Al-Qadi, I.L., S.H. Carpenter, Z. Leng, and H. Ozer, Tack Coat Optimization for HMA Overlay: Laboratory Testing Report, Illinois Center for Transportation, Rantoul, IL, 2008. Carol, I., M. L. Carlos, and O. Roa, “Micromechanical Analysis of Quasi-Brittle Materials Using Fracture Based Interface Elements,” International Journal for Numerical Methods in Engineering, Vol. 52, 2001, pp. 193-215. Zienkiewicz, O. C., and G. N. Pande, “Some Useful Forms of Isotropic Yield Surfaces for Soil and Rock Mechanics,” FEs in Geomechanics, J. Wiley, London, 1977, pp. 179-190.