71
ATHABASCA 2015 TAGD FIELD TEST UPDATE FOR AER JANUARY 2014 TO DECEMBER 2014 Presented 2015-04-13

ATHABASCA 2015
TAGD FIELD TEST UPDATE FOR AER JANUARY 2014 TO DECEMBER 2014
Presented 2015-04-13

ATHABASCA 2015
INTRODUCTION
DOVER WEST LEDUC ASSET
TAGD PROCESS
TAGD FIELD TEST
o Introduction
o Subsurface
o Surface
o Compliance
PLANS
2
2

ATHABASCA 2015
DOVER WEST LEDUC ASSET

ATHABASCA 2015
THE LEDUC CARBONATE
OPPORTUNITY
o Northern extent of well-known prolific Leduc light oil reservoirs, but filled with bitumen.
o 14.8 billion bbl OOIP(1) (best estimate) in the Leduc carbonate reef (up to 100 m net pay).
o 2.7 billion bbl contingent resource best estimate based on CSS.
o Asset has potential for > 350 000 bbl/d(2), based on TAGD.
4
(1) Discovered (11 600 million bbl) plus Undiscovered.
(2) Based on management estimate.
Edmonton
Calgary
Fort McMurray
Imperial Wizard Lake Peak rate: 13 000 bbl/d Recovery factor: 85%
Dover West Leduc
Devonian Geologic Time ~ 360 million years ago
Grand Rapids
Pipeline
Dover
West Road
Leduc Light Oil Dover West
Leduc
Average Porosity 5% 15%
Average Permeability
1 000 mD >3 000 mD
Recovery Factor 70% Estimated >50%

ATHABASCA 2015
AREA MAP OF DOVER WEST 5
5
TAGD Field Test

ATHABASCA 2015
TAGD PROCESS

ATHABASCA 2015
7
TAGD OVERVIEW
THERMAL ASSISTED GRAVITY DRAINAGE
An in situ recovery process, in which:
o The reservoir is heated using a pattern of horizontal heating wells.
o Sufficient temperature is reached such that bitumen will flow by gravity to production wells.
WHAT IT’S NOT:
o NOT just a near-wellbore stimulation process – goal is reservoir-wide heating.
o Does NOT involve flow of electrical current in the reservoir; instead, reservoir heating occurs via thermal conduction.
o Does NOT result in chemical alteration of the bitumen – target temperature to achieve sufficient reduction in viscosity, without cracking the bitumen.
7
ATHABASCA 2015
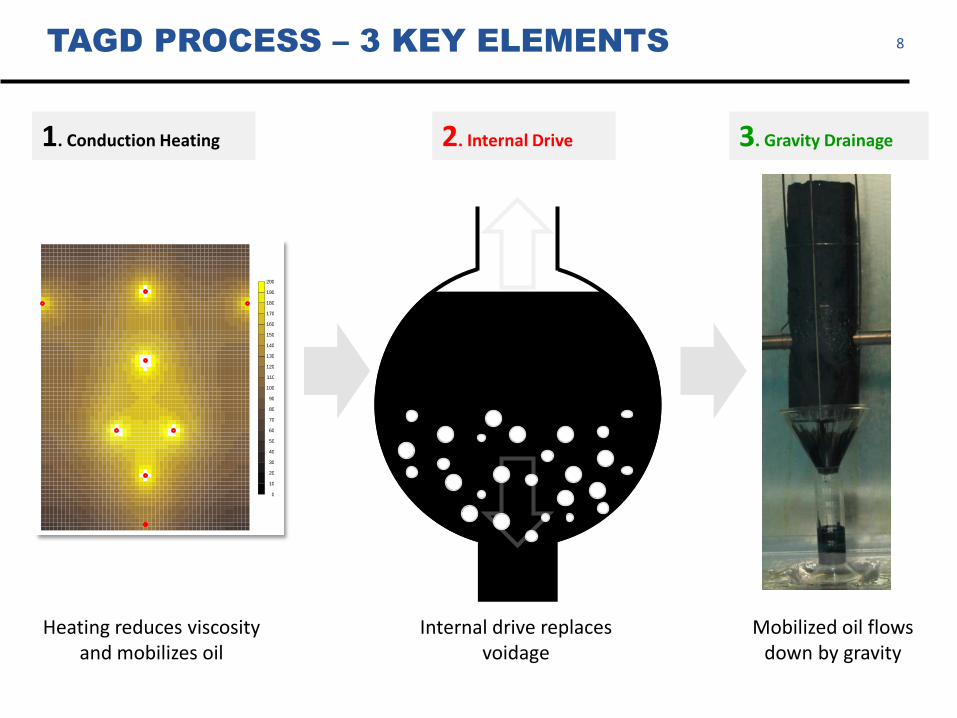
1. Conduction Heating
Internal drive replaces voidage
Heating reduces viscosity and mobilizes oil
2. Internal Drive
TAGD PROCESS – 3 KEY ELEMENTS 8
3. Gravity Drainage
Mobilized oil flows down by gravity
0
10
20
30
40
50
60
70
80
90
100
110
120
130
140
150
160
170
180
190
200
2016-01-01

ATHABASCA 2015
1: HEATING
o Steam injection pressure dictates high temperature
o Trade-off between additional energy (and cost) vs. benefit of reduced viscosity
o Conductive heating achieves desired optimum temperature
o Target temperature achieved via selection of well spacing and heater power input
9
TAGD Steam Brent crude -
- Olive Oil
- Peanut butter
1
10
100
1 000
10 000
100 000
1 000 000
10 000 000
0 50 100 150 200 250 300
Bit
um
en
Vis
co
sit
y,cP
Temperature, °C
- Arabian Heavy
50 150 250 350 450 550
Temperature, °F
- Ketchup
- Shortening
- Chocolate syrup
AOC’s Leduc
o Depth: ~280 m ASL
o Temperature: 12 °C
o Pressure: 480 kPa
o Leduc viscosity@ 12°C:
13 x 106 cP

ATHABASCA 2015
Gas-Oil Gravity Drainage
2 & 3: GRAVITY + INTERNAL DRIVE
Voidage Replacement o Expansion of in-place fluids
o Solution gas evolution
o CO2 generation (dolomite dissolution)
o Connate water vapourization
o Top gas drive from gassy bitumen zone
o Gas injection (optional)
10

ATHABASCA 2015
TAGD FIELD TEST INTRODUCTION
ATHABASCA 2015
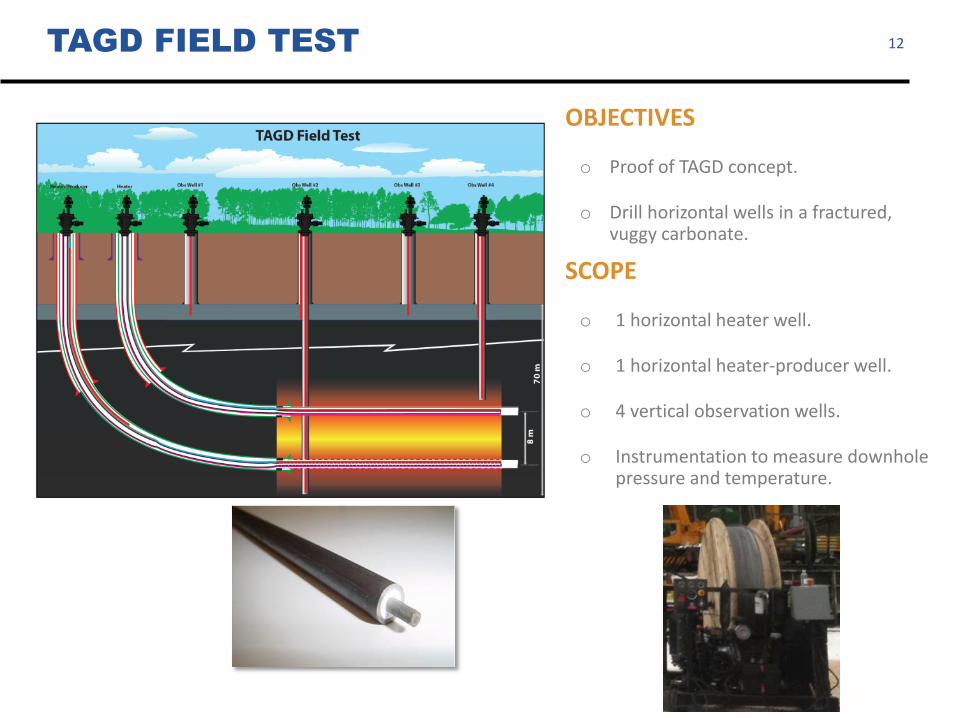
TAGD FIELD TEST
OBJECTIVES
o Proof of TAGD concept.
o Drill horizontal wells in a fractured, vuggy carbonate.
SCOPE
o 1 horizontal heater well.
o 1 horizontal heater-producer well.
o 4 vertical observation wells.
o Instrumentation to measure downhole pressure and temperature.
12
12

ATHABASCA 2015
SCHEME MAP 13
13
o No change in 2014

ATHABASCA 2015
TAGD FIELD TEST SURFACE AND
SUBSURFACE LAYOUT 14
14
6343400
6343500
6343600
6343700
6343800
6343900
6344000
6344100
385000 385100 385200 385300 385400 385500 385600 385700
No
rth
ing
Easting
OB4
OB3
OB2
OB1
6-8
Heater
Heater=Producer
4-8 3-8
13-5 14-5
5-8 6-8
o No change in 2014

ATHABASCA 2015
TIMELINE
o June 18, 2010 Filed TAGD Field Test Application #1653013
o December 17, 2010 Received Approval 11546 for the TAGD Field Test
o January to March 2011 Drilled And Completed Wells
o May 2011 Heating Initiated
o June 6, 2011 Received Approval For Early Production
o July 21, 2011 Received Approval 11546A Extend Project Life
o October to November 2011 Production Cycle #1
o February to April 2012 Production Cycle #2
o September 5, 2012 Received Approval 11546B for the Addition of
Submerged Combustion Evaporator
o October 25, 2012 Received Approval 11546C for the Addition of
Submerged Combustion Evaporator Tank
15
15

ATHABASCA 2015
TIMELINE
o November 27, 2012 First Evaporation
o December 2012 to February 2013 Production Cycle #3
o September 19, 2013 Received Approval 11546D for the
TAGD Pilot Project
o October 17, 2013 Filed Amendment for Gas Injection Test
o October 31, 2013 Received Approval 11546E for the Gas
Injection Test
o December 10, 2013 MARP approval for the TAGD Pilot Project
16
16

ATHABASCA 2015
17
2014 IN REVIEW
Gas Injection Test January & February
o Injected natural gas into OB1 up to 42,000 m³/d.
Oil Cut Test March
o One test performed to observe changes in oil cut with heating and time.
Heater Wellbore Fluid Change May
o Replaced natural gas with liquid heat transfer fluid.
o Reduced average wellbore temperatures by ~58°C. More uniform wellbore temperature.
Production Cycle #4 June onward
o Pumping between 2 m³/d to 24 m³/d of fluid.
o 512 m³ of bitumen produced in Cycle #4.
Heater Failures During Production Cycle
o Surface failures repaired easily.
o Downhole failures resulted in reduced capacity.
Multiphase Analyzer Trial June onward
o Installed an additional multiphase analyzer to evaluate performance.
Gas Co-injection December
o Injected gas into heater-producer well to stimulate productivity.
o Injected gas at an average rate of 600 m³/d
17
ATHABASCA 2015
TAGD FIELD TEST SUBSURFACE

ATHABASCA 2015
OBIP
APPROVAL AREA AND OPERATING PORTION
OBIP = rock volume x porosity x bitumen saturation x net-to-gross
Net Pay cutoffs are:
< 6% porosity
> 20% Sw
> 10% Vshale
19
Area Thickness Rock Volume Porosity Bitumen
Saturation Net-to-Gross
OBIP
(m2) (m) (m3) (%) (%) (frac) (m3)
TAGD Field Test Area
647 500 83 53 500 000 14.2 86 0.96 6 272 000
Approval Area No. 11546
3 940 000 75 312 615 000 14.7 89 0.94 37 000 000
Operating Portion
2 000 12 24 000 15 88 1.00 3 170

ATHABASCA 2015
Wabiskaw Mbr.
Leduc Fm.
Cooking Lake
Platform
Cooking Lake
Open Marine
Beaverhill Lake Gp.
Base of gas-bitumen zone
364.8 m MD (277 m ASL)
72.6 m
20
Type Well Location
1AA/06-08-095-18W4/00
TYPE WELL LOG 1AA/06-08-095-18W4/0
No change in 2014
No petrographic analysis were completed to identify minerals that could impact the scheme recovery.
20

ATHABASCA 2015
21
NET BITUMEN PAY MAP 21
o No change in 2014
o Net pay ranges from 66 to 86 m in the approval area.

ATHABASCA 2015
22
STRUCTURE MAP OF TOP OF BITUMEN PAY
No change in 2014
The top of the bitumen pay is the eroded Leduc Formation.
The structure for the top of the Leduc ranges from 281 to 292 m ASL in the approval area.
22

ATHABASCA 2015
23
STRUCTURE MAP OF BASE OF BITUMEN PAY
No change in 2014
The base of the bitumen pay is the top of the Cooking Lake open marine unit.
The structure for the top of Cooking Lake open marine unit has a uniform southwest dip and ranges from 192 to 216 m ASL in the approval area.
23
ATHABASCA 2015
24
Cored wells
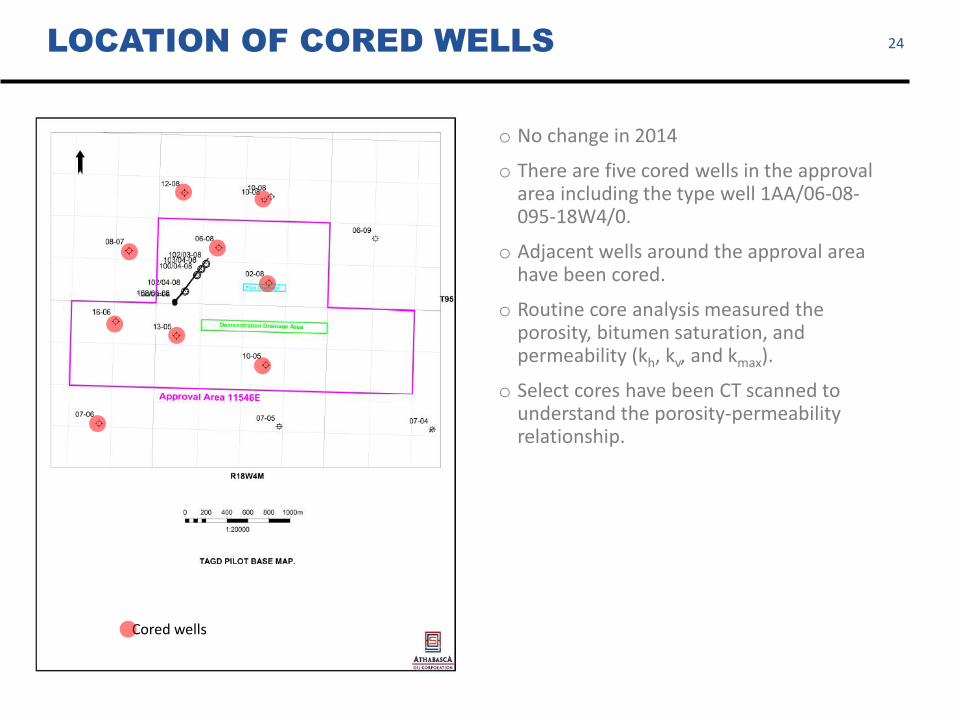
LOCATION OF CORED WELLS
o No change in 2014
o There are five cored wells in the approval area including the type well 1AA/06-08-095-18W4/0.
o Adjacent wells around the approval area have been cored.
o Routine core analysis measured the porosity, bitumen saturation, and permeability (kh, kv, and kmax).
o Select cores have been CT scanned to understand the porosity-permeability relationship.
24

ATHABASCA 2015
25
De
pth
(m
A
SL
)
STRUCTURAL CROSS SECTION 25
o No change in 2014

ATHABASCA 2015
26
SEISMIC
o No change in 2014
o 4D monitor survey acquired Q4 2012.
o 0.8 km2 total area being monitored.
o Original 2010 survey being used as baseline.
o Time delay map of the Beaverhill Lake surface between the 4D monitor survey (2012) and original (2010) survey.
o Time delay results show no correlation to TAGD Field Test.
26

ATHABASCA 2015
27
OB1 OB2 OB3 OB4 Heater Heater-Producer
WELLBORE SCHEMATIC 27

ATHABASCA 2015
28
HEATER WELL COMPLETION 28
o Prior to heat transfer fluid addition, AOC operated the well in vacuum. Observed high wellbore temperatures which limited power output.
o Heat transfer fluids added in Heater well to improve transfer of energy to reservoir, and reduce wellbore temperatures. This change enabled increase of power from Heater well.
o Heat transfer fluids tested: natural gas (July 2013), oil based fluid (May 2014)

ATHABASCA 2015
29
HEATER-PRODUCER WELL COMPLETION 29
o Producer is heated to accelerate thermal communication between wells
ATHABASCA 2015
30
ARTIFICIAL LIFT
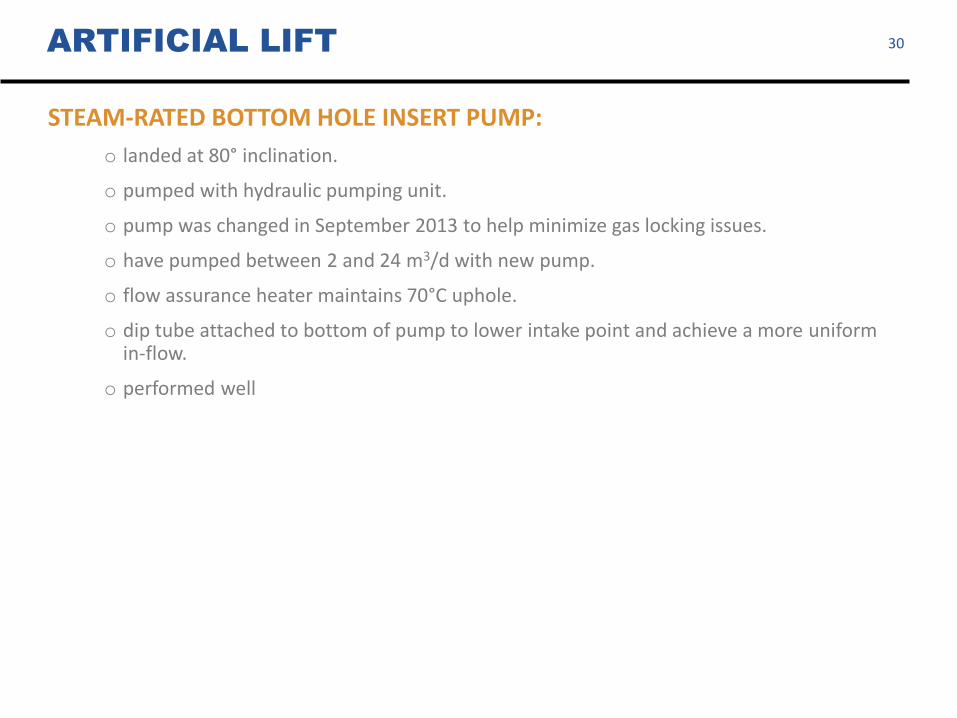
STEAM-RATED BOTTOM HOLE INSERT PUMP:
o landed at 80° inclination.
o pumped with hydraulic pumping unit.
o pump was changed in September 2013 to help minimize gas locking issues.
o have pumped between 2 and 24 m3/d with new pump.
o flow assurance heater maintains 70°C uphole.
o dip tube attached to bottom of pump to lower intake point and achieve a more uniform in-flow.
o performed well
30

ATHABASCA 2015
31
INSTRUMENTATION IN WELLS 31
o Base oil introduced in observation wells to reduce temperature smearing effects due to reflux
Thermocouples
Liner Hanger
ICP2
End of liner
5.5" - 4.5" X-OVER
4.5" - 4" X-OVER
Splices
ICP2
ICP
Liner Hanger
End of Liner
5.5" - 4.5" X-OVER
4.5" - 4" X-OVERPump
FA Heater
ICP 1
Leduc Gas Base
Leduc top
Cooking Lake Open Marine
ICP
PiezoPiezo
ICP
PiezoPiezo
PiezoPiezo
Piezo
Piezo
PiezoPiezo
Piezo
Piezo
ICPICP
Bubble Tube
Inflatable PackerInflatable Packer
Inflatable Packer
Inflatable Packer
190
210
230
250
270
290
Tru
e v
ert
ical
De
pth
, m A
SL
Horizontal Distance, m
-20
-15
-10
-5
0
5
10
0 100 200 300 400 500
Late
ral D
ista
nce
, m
Heater-Producer
Heater
102/04-08-95-18W4_OB1
100/04-08-95-18W4_OB2
103/04-08-9518W4_OB3
102/03-08-95-18W4_OB4
102/04-08-95-18W4_OB1 100/04-08-95-18W4_OB2 103/04-08-95-18W4_OB3 102/03-08-95-18W4_OB4
Heater-Producer
Heater

ATHABASCA 2015
32
INSTRUMENTATION OBSERVATIONS
Heater Well
o Fibre DTS data began to deviate from thermocouple data in April 2012.
o Fiber is now reading erroneously higher temperatures in majority of the heated section of the well.
o 1 failed thermocouple point.
Heater-Producer Well
o Fibre DTS data agree well with thermocouple data.
o 5 failed thermocouple points.
o Bubble tube has failed. Currently bubbling natural gas down casing annulus for pressure measurement.
Observation wells
o Convection in wellbore annulus is smearing temperature readings
o OB4 well has 2 failed thermocouple points.
32

ATHABASCA 2015
33
SCADA 33
o Instrumentation tied to central data acquisition system for remote real-time monitoring and control from the field and Calgary

ATHABASCA 2015
34
TAGD FIELD TEST PRODUCTION SUMMARY
o Heating all year in Heater well and Heater-Producer well.
o Production Cycle #4 (June 2014 to year-end).
• Pumping from 2 to 24 m³/d fluid
o Oil Cut Test
Total Volume Oil Cut (Corrected for load fluid)
March 14.3 m³ 94%
34

ATHABASCA 2015
Mini-Hydraulic Fracture Test Summary (TAGD Pilot Application)
35
GEOMECHANICS
o At caprock depth of 340 m TVD, fracture pressure estimated to be 7 300 kPa (i.e. 21.5 kPa/m).
o Minor increase in pressure due to heating at producer; no change in pressure at observations wells in gas-bitumen zone.
o All observed pressures well below maximum operating pressure of 5 100 kPa as specified in the Application.
o No heave monitoring was conducted.
35
0
500
1000
1500
2000
2500
3000
3500
4000
4500
5000
5500
Pre
ssu
re, k
Pag
Heater-Producer bubble tube pressure @ 228.28 m ASL
102030809518W400_OB4@ 277.7 m ASL (374.4 m MD)
Approved Maximum Operating Pressure
2011 2012 2013 2014

ATHABASCA 2015
36
HEATING PERFORMANCE
o Heater running at full power.
o Heater producer limited by maximum temperature.
o Heater power increased in mid-2014 when adding heat transfer fluid
o Power in producer decreasing as well warms up
36
0
5
10
15
20
25
30C
um
ula
tive
Hea
ter
Ener
gy, T
J Heater-Producer Heater
2011 2012 2013 2014
0
200
400
600
800
1000
1200
1400
Sub
surf
ace
Po
we
r, W
/m
Heater Producer Heater Design power
2011 2012 2013 2014

ATHABASCA 2015
37
HEATING WELL TEMPERATURES
Thermocouple data used to monitor heater temperature as fiber readings have become unreliable.
37
0
50
100
150
200
250
300
350
400
450
Tem
per
atu
re,
°C
December 31, 2011
December 31, 2012
December 31, 2013
December 31, 2014
HeaterHeaterHeaterHeaterHeaterHeaterHeaterHeater
0
50
100
150
200
250
300
350
400
450
500 550 600 650 700 750 800
Tem
pe
ratu
re, °
C
Depth, m MD
December 31, 2011
December 31, 2012
December 31, 2013
December 31, 2014
Heater-ProducerHeater-ProducerHeater-ProducerHeater-ProducerHeater-ProducerHeater-ProducerHeater-ProducerHeater-Producer

ATHABASCA 2015
38
ROCK FACE TEMPERATURE
o Based on transients observed when heaters are shut off
o Non-uniform rock-face temperature along well potentially due to:
• Porosity variations along well
• Refluxing in build section
• Fluid phase distribution along well
38
0
50
100
150
200
250
300
350
550 600 650 700 750 800
Ro
ck-f
ace
tem
pe
ratu
re, °
C
Measured Depth, m KB
06-Sep-11
02-Dec-12
26-Jun-13
01-May-14
Heater
0
50
100
150
200
250
300
550 600 650 700 750 800
Ro
ck-f
ace
tem
pe
ratu
re, °
C
Measured Depth, m KB
06-Sep-11
02-Dec-12
26-Jun-13
01-May-14
Heater-Producer

ATHABASCA 2015
190
200
210
220
230
240
250
260
270
280
290
10 20 30 40 50 60 70 80
Tru
e V
ert
ical
De
pth
, m A
SL
Temperature, °C
15-Apr-11
31-Dec-11
31-Dec-12
31-Dec-13
31-Dec-14
190
200
210
220
230
240
250
260
270
280
290
10 20 30 40 50 60 70 80
Temperature, °C
15-Apr-11
31-Dec-11
31-Dec-12
31-Dec-13
31-Dec-14
OB2 OB4
Temperature profile thought to be influenced by wellbore convection
Heater
Heater-Producer
39
OBSERVATION WELL TEMPERATURE
o Observed peak temperatures lower than expected from simulation.
o Convective smearing of temperatures.
39

ATHABASCA 2015
40
HEATING PHASE – PRESSURE CHANGES 40
-700
-600
-500
-400
-300
-200
-100
0
100
200
(P -
Pi),
kPa
100040809518W400_OB2 @ 224.5 m ASL
Heater-Producer BHP
Heating#1
Heating#2
Heating#3
Heating#4
Prod#1
Prod#2
Prod#3
Prod#4
2011 2012 2013 2014

ATHABASCA 2015
41
OB1 OB2 OB3 OB4
GAS INJECTION TEST (2014 Q1)
Objective:
o Investigate volume and lateral extent of the gas-bitumen transition zone
o Determine presence and degree of vertical communication
o Assess gas injectivity and effective gas permeability
Procedure:
o Inject natural gas into OB1 at ~ 42 000 m3/d.
o Shut-in injection and monitor pressure at injection well, observation wells, and TAGD producer during injection and fall-off periods
o Repeat test.
o A total volume of 643 x 10³ m³ was injected for two tests.
0
50
100
150
200
250
300
350
400
450
500
0
5
10
15
20
25
30
35
40
45
50
0 5 10 15 20
Cu
mu
lati
ve G
as, 1
0³ m
³
Gas
Inje
ctio
n R
ate
, 10
³ sm
³/d
ayTime, days
Gas Injection Rate
Cumulative Gas Injected
Gas Injected Test #1

ATHABASCA 2015
42 GAS INJECTION TEST (2014 Q1)
Analysis:
o Increase in post-injection pressure not observed; large connected gas accumulation
o No measureable pressure response at TAGD producer no or limited vertical communication between gas zone and base of Leduc
o Gas injection rate at 4500 kPa bottom-hole injection pressure estimated to be ~ 600×103 m3 /d
o Permeability ~ 800 mD (effective gas)
o During both tests, OB1 pressure dropped below initial pressure after shutin
• Static liquid in well pushed out into formation during injection. Wellbore is filled with compressed gas.
• When shut in, gas in the wellbore decompresses, and reservoir fluids flow back into well, resulting in wellbore pressure equilibrating with reservoir
Pressure Responses
-100
100
300
500
700
900
1100
DP
at
Inje
cto
r, k
Pa
OB1
-5
0
5
10
15
20
25
30
35
40
45
0 5 10 15 20 25 30 35 40
DP
at
OB
S W
ell
s, k
Pa
Time, days
OB2
OB3
OB4
HP

ATHABASCA 2015
43
PRESSURE IN GAS-BITUMEN TRANSITION
ZONE 43
350
400
450
500
550
600
650
700
Pre
ssu
re, k
Pag
100040809518W400_OB2 @ 280.9 m ASL (373.3 m MD)
2011 2012 2013 2014
Gas Injection Test

ATHABASCA 2015
PRODUCTION HISTORY
o Liquid rate controlled by pump
o High oil cut at start of each cycle
o Mobile water likely from disposal in 7-4
44
o Criteria for start up of each cycle varies in each cycle based on observations during heating, and predictions from history match
o Maximize oil recovery and initial oil cut

ATHABASCA 2015
0
20
40
60
80
100
Jun Jul Aug Sep Oct Nov Dec Jan
We
ekl
y O
il C
ut,
%
Time, days
CYCLE #4 - MAJOR EVENTS 45
Production shutin; gas injection
Gas co-injection
Heater Outages
Production shutin
Pump speed reduction
Pump speed increase

ATHABASCA 2015
GAS CO-INJECTION 46
ICP2
ICP2
ICP
ICP 1
Leduc Gas Base
Leduc top
Cooking Lake Open Marine
ICP
PiezoPiezo
ICP
PiezoPiezo
PiezoPiezo
Piezo
Piezo
PiezoPiezo
Piezo
Piezo
ICPICP
190
210
230
250
270
290
Tru
e v
ert
ical
De
pth
, m A
SL
Heater-Producer
OB1 OB2 OB3 OB4
Gas Injection
HeaterTop of liner perfs
Scope:
o Inject up to 1000 m³/d of natural gas into the casing of producer well during subsequent cycles
o Injection may be conducted during both shut-in and production conditions.
o The maximum injection pressure will be 1800 kPa.
o Impact of reduced relative permeability to oil due to gas injection offset by benefit from additional voidage replacement. High vertical absolute permeability would allow for gravity drainage
Objective:
o Understand the impact of gas co-injection on the TAGD process, particularly its role in providing additional voidage replacement for the gravity drainage process
o Gas injection during shut-in is expected to accelerate fluid redistribution by gravity drainage, and reduce the period of shut-in required between cycles

ATHABASCA 2015
47
OIL CUT TESTS
o Oil cut tests were conducted to establish trend of oil cut while heating.
o Evidence for redistribution of fluids by gravity as reservoir warms.
47
0
10
20
30
40
50
60
70
80
90
100
Oil
Cu
t, %
Star
t of
3rd
Pro
du
ctio
n C
ycle
End
of 3
rd P
rod
uct
ion
Cyc
leO
il C
ut
test
(Mar
12-
23,
2013
)
Oil
Cu
t te
st (S
ep
23-
27, 2
013)
Oil
Cu
t te
st (N
ov
5-8,
201
3)
Oil
Cu
t te
st (D
ec
10-1
5, 2
013)
Improvementin Oil Cut
Oil
Cu
t te
st (M
ar 2
6-29
, 20
14)
Star
t of
4th
Pro
du
ctio
n C
ycle
2012 2013 2014

ATHABASCA 2015
0%
5%
10%
15%
20%
25%
30%
35%
40%
2011 2012 2013 2014
Rec
ove
ry, %
Prod #1 Prod #1 Prod #1 Prod #1
Prod #2 Prod #2 Prod #2
Prod #3 Prod #3
Prod #4
48
RECOVERY FACTORS TO DATE
o Recovery factors (RF) have assumed a drainage box of 12 m H x 8 m W x 250 m L.
o RF only an estimate as system is unbounded
48
OBIP RF
(Year end)
RF
(end of test)
3 170 m3 38% 45 to 50%

ATHABASCA 2015
49
49
0
200
400
600
800
1000
1200
1400
1600
0 10 20 30 40 50 60
Cu
mu
lati
ve O
il re
cove
red
, m³
Cumulative Subsurface Energy Input, TJ
ENERGY VS CUMULATIVE OIL

ATHABASCA 2015
o History matched model
• 2D
• Dual-permeability
• Layer-cake model
• Discrete wellbore model
50
HISTORY MATCH 50
0
200
400
600
800
1000
1200
1400
Bo
tto
m-h
ole
pre
ssu
re in
HP,
kPa
(g) Field Data
Simulation
2011 2012 2013 2014
0
200
400
600
800
1000
1200
1400
1600
Cu
mu
lati
ve o
il p
rod
uct
ion
, m³
Field Data
Simulation
2011 2012 2013 2014

ATHABASCA 2015
Cycle 5 Objectives
Cycle 2 Cycle 3 Cycle 4
KEY LEARNINGS
51
Cycle 1 Objectives:
•Determine heating time required to re-establish oil production
Objectives:
•Demonstrate gravity drainage from upper well
Objectives:
•Validate forecasts
•Test ways to increase heater power
Observations:
• Fiber DTS showed oil production from toe and water from the heel
Observations:
• High initial oil cut with gradual decline
Observations:
• Heat Transfer Fluid reduced temp in Heater well
Objectives:
•Investigate early production potential
Observations:
• Produced more oil than expected; watered out at the end of cycle
Learnings & Implications:
• Oil mobilized at lower temperatures than expected
• Need to operate cyclically to minimize water production
Learnings & Implications:
• 3 months heating is too short to establish gravity drainage between wells
• Pump intake changed to achieve uniform inflow in HZ
Learnings & Implications:
• Inter-well gravity drainage demonstrated
Learnings & Implications:
• Higher heater power
• Increase inter-well temp to commercial target
• Test gas co-injection injection to enhance drainage

ATHABASCA 2015
52
2014 KEY OBSERVATIONS
o After heating for 14 months, observed 100% oil cut at beginning of Cycle #4. Stable production with gradual decline in oil cut until several heater outages occurred.
o Heater outages were caused by ESP cable failures and surface equipment failures.
o Heat transfer fluid significantly reduced temperatures in heater well and allowed higher power output.
o No pump locking issues observed related to gas/steam production with new design.
o High inter-well connectivity observed via fluid movement (liquid & gas).
o Observed significant reflux in Heater well annulus.
o Gas co-injection into producer significantly improved the oil cut.
52

ATHABASCA 2015
TAGD FIELD TEST SURFACE

ATHABASCA 2015
54
54 FIELD TEST PLOT PLAN

ATHABASCA 2015
55
GAS INJECTION TEST FLOW DIAGRAM
o Gas Injection Test piping and instrumentation added for the test.
o Subsequently the meter has been removed and the pipe is decommissioned.
55

ATHABASCA 2015
56
FACILITY PERFORMANCE
Generally stable and predictable battery performance
o Well pumping for ~162 days in 2014.
o Tubing production routed to separator.
o Solution gas is separated and sent to flare.
o Bitumen / water mix sent to production tanks.
o Emulsion trucked off site to sales.
o Submerged Combustion Evaporator operated to evaporate some of the produced water.
o Electrical power is generated on site.
o No steam generation.
56
ATHABASCA 2015
57
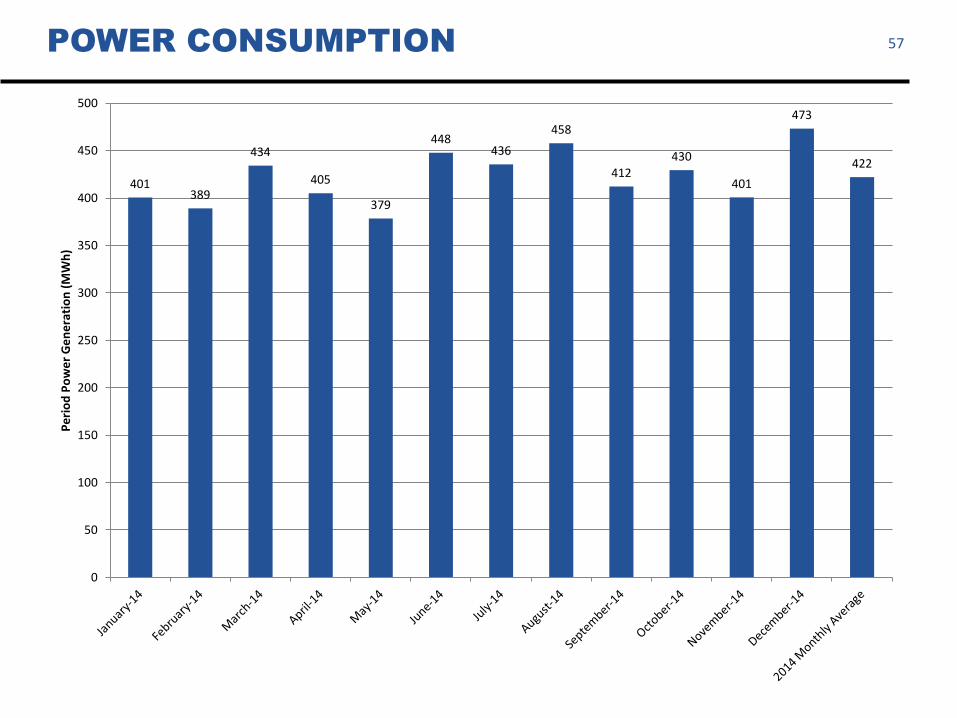
POWER CONSUMPTION 57
401 389
434
405
379
448 436
458
412 430
401
473
422
0
50
100
150
200
250
300
350
400
450
500
Pe
rio
d P
ow
er
Ge
ne
rati
on
(M
Wh
)

ATHABASCA 2015
58
NATURAL GAS CONSUMPTION 58
148 163 197 187 180
212 208 220 205 205 186 223
195
486
157
9
18 56
0
100
200
300
400
500
600
700
Pe
rio
d F
ue
l Co
nsu
mp
tio
n (
10
3 m3)
Fuel Consumed Gas Injection

ATHABASCA 2015
59
APPROVED FIELD TEST METERING SCHEMATIC 59
ATHABASCA 2015
60
PRODUCTION MEASUREMENT METHODOLOGY
No Changes to methodology
Bitumen and Water Production:
o Daily tank gauging and manual water cut measurements.
o Total fluid production meter FIT-0100 used as reference meter.
o Additional verification will be through trucking and third party processing.
o Evaluating new technologies: 2 Phase and 3 Phase BS&W analyzer.
Gas Production:
o Solution gas measured from the produced gas meter at the separator.
o Casing gas measured from the produced gas meter on casing line.
60
ATHABASCA 2015
61
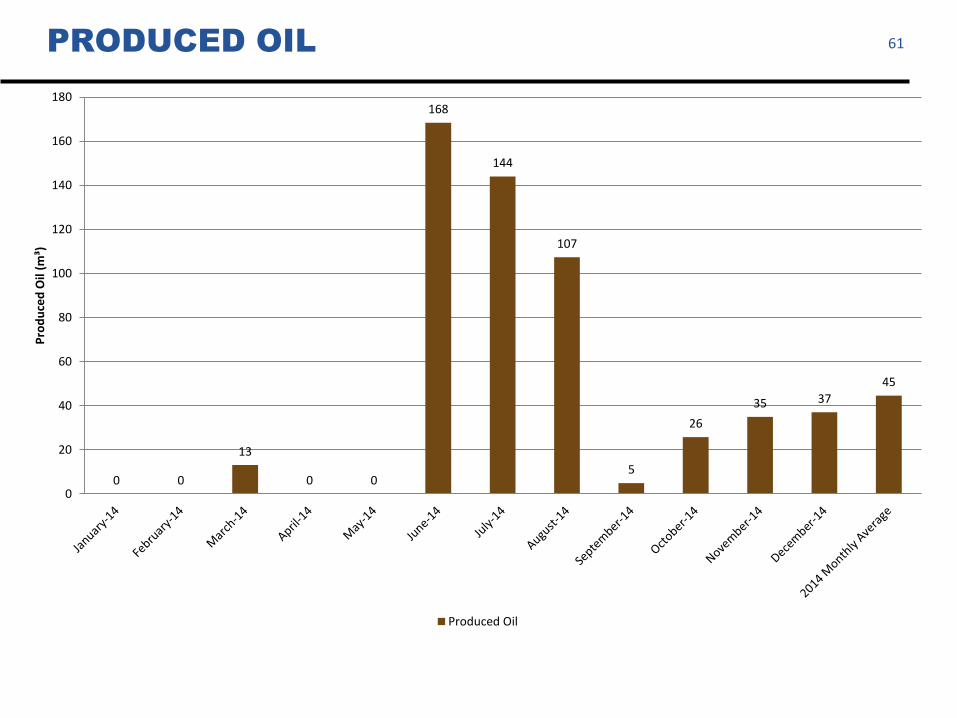
PRODUCED OIL
61
0 0
13
0 0
168
144
107
5
26
35 37
45
0
20
40
60
80
100
120
140
160
180
Pro
du
ced
Oil
(m³)
Produced Oil

ATHABASCA 2015
62
PRODUCED WATER MANAGEMENT
o Produced water was disposed through evaporation to atmosphere or was trucked with the emulsion.
62
0 0 1 0 0
43
62
139
43
90
279
307
80
0 0 0 0 0 0 0 1 4 3
59
173
20
0 0 0 0 0
73
89
32
59 51
93 106
42
0
50
100
150
200
250
300
350
Pe
rio
d W
ate
r P
rod
uce
d /
Eva
po
rate
d /
Dis
po
sed
(m
3)
Produced Water Evaporated Water Produced Water in Emulsion

ATHABASCA 2015
63
PRODUCED GAS 63
20
0
23
0
23
28
34
23
0
105
6
0
22
0
20
40
60
80
100
120
Pe
rio
d S
olu
tio
n G
as P
rod
uce
d /
Fla
red
(m
3)
Total Solution Gas Produced m³ Total Solution Gas Flared m³

ATHABASCA 2015
64
GREENHOUSE GAS EMISSIONS
GHG emissions based on CAPP’s “Calculating Greenhouse Gas Emissions” (April, 2003).
Detailed emissions calculation method used
64
Source Total GHG Emissions,
t CO2e/y
Combustion 5,289
Flaring 1
Venting 0
Total 5,290

ATHABASCA 2015
65
SULPHUR RECOVERY
o No Change
o The produced gas samples indicated no detectable H2S.
o Sulphur recovery is not required for this test.
65

ATHABASCA 2015
TAGD FIELD TEST COMPLIANCE

ATHABASCA 2015
67
COMPLIANCE
AOC confirms compliance to:
Experimental Scheme Approval No. 11546E
EPEA Approval 298764-00-00
AOC has not started reclamation as the project is still active.
67

ATHABASCA 2015
68
REGIONAL INITIATIVES
AOC is a funding member of the following:
o Oil Sands Community Alliance.
o Joint Oil Sands Monitoring Program (AEMERA).
o Wood Buffalo Environmental Association.
o Alberta Biodiversity Monitoring Institute.
68

ATHABASCA 2015
PLANS

ATHABASCA 2015
70
FUTURE PLANS
AOC intends to continue operating the facility with the following objectives:
o Finish Production Cycle #4
o Possibly begin Cycle #5
o Operate heaters at highest power ever
o Understand impact of gas injection
o Understand water mobility in the Leduc Formation
AOC has received approval to construct a TAGD Pilot:
o Approval 11546D received from AER on September 19, 2013
o Approval for the MARP received from AER on December 10, 2013
o EPEA Approval 298764-00-00 received from AESRD on December 17, 2013
70

ATHABASCA 2015
Corporate Office
1200, 215 - 9 Ave SW, Calgary, Alberta
Telephone: 403-237-8227
Fax: 403-264-4640
www.atha.com


