TAIEX Workshop on Air Pollution Control National Programs The implications of Air Pollution Control Programmes – example and experience of Greece (methods and results) Petros Varelidis Advisor of the Alternate Minister of Environment & Energy Director of the Greek National Center of Environment & Sustainable Development Israel, 20-21.6.2018
Transcript
TAIEX Workshop on Air Pollution Control National Programs
The implications of Air Pollution Control Programmes– example and experience of Greece (methods and
results)
Petros VarelidisAdvisor of the Alternate Minister of Environment & Energy
Director of the Greek National Center of Environment & Sustainable Development
Israel, 20-21.6.2018
Air Pollution
1. Identify the problem– Pollutants– Exceedances– Geographical distribution– Sources (quantitative detailed analysis, if necessary)
2. Make the problem politically visible– Academia– Press– Citizens– Political authorities
3. Take measures– Interministerial cooperation– Enforcement
4. Monitor their effectiveness– Systematic accurate monitoring + modelling
Creation of photochemical smog
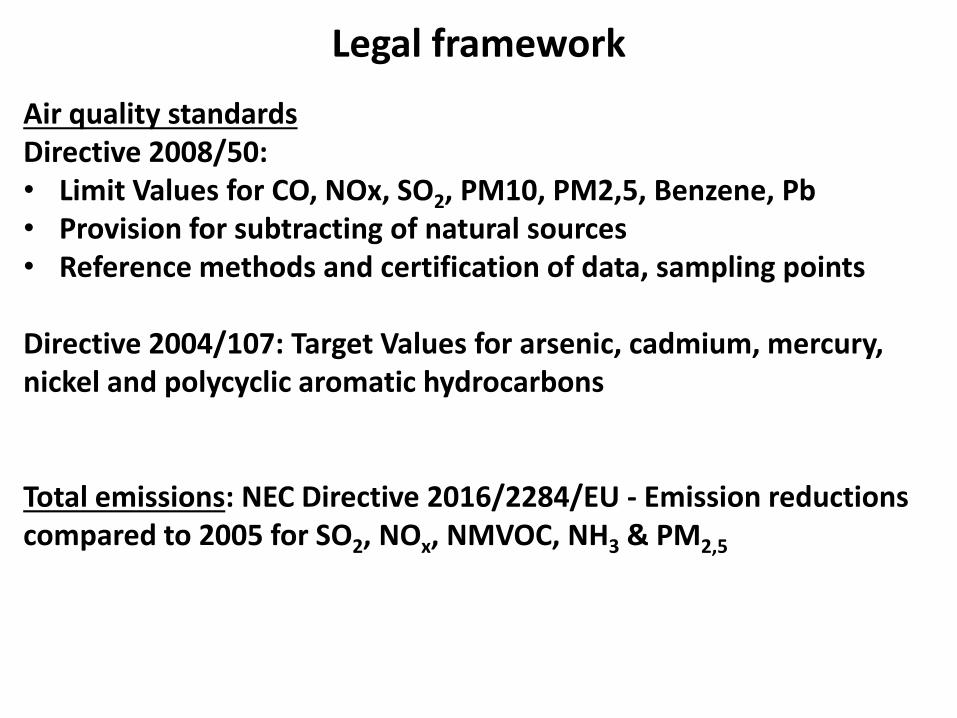
Legal framework
Air quality standardsDirective 2008/50: • Limit Values for CO, NOx, SO2, PM10, PM2,5, Benzene, Pb• Provision for subtracting of natural sources• Reference methods and certification of data, sampling points
Directive 2004/107: Target Values for arsenic, cadmium, mercury, nickel and polycyclic aromatic hydrocarbons
Total emissions: NEC Directive 2016/2284/EU - Emission reductions compared to 2005 for SO2, NOx, NMVOC, NH3 & PM2,5
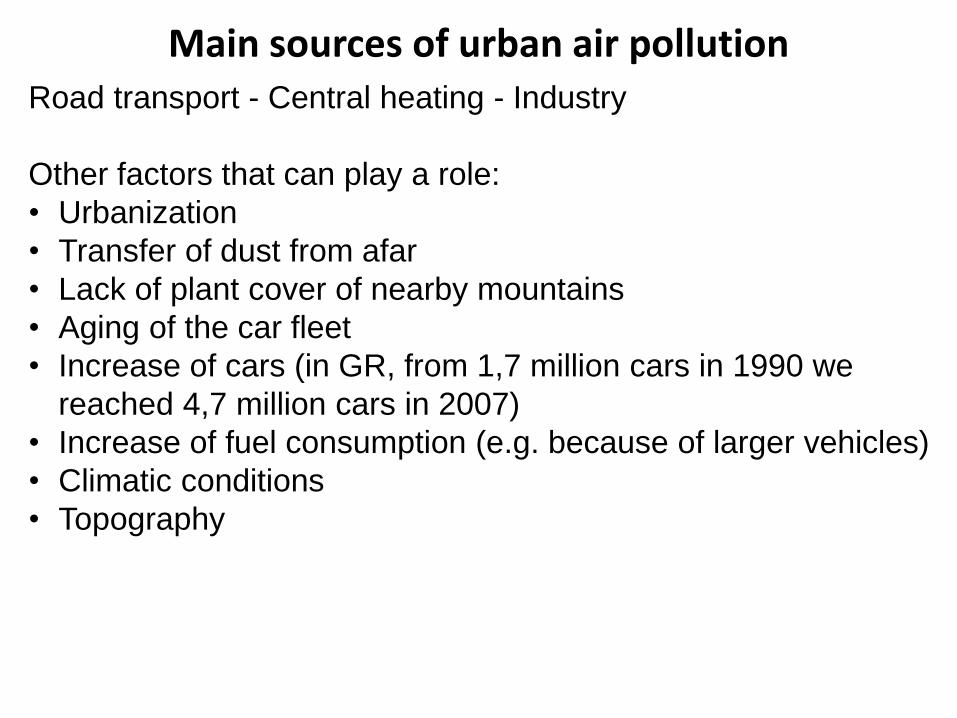
Main sources of urban air pollutionRoad transport - Central heating - Industry
Other factors that can play a role:
• Urbanization
• Transfer of dust from afar
• Lack of plant cover of nearby mountains
• Aging of the car fleet
• Increase of cars (in GR, from 1,7 million cars in 1990 we
reached 4,7 million cars in 2007)
• Increase of fuel consumption (e.g. because of larger vehicles)
• Climatic conditions
• Topography
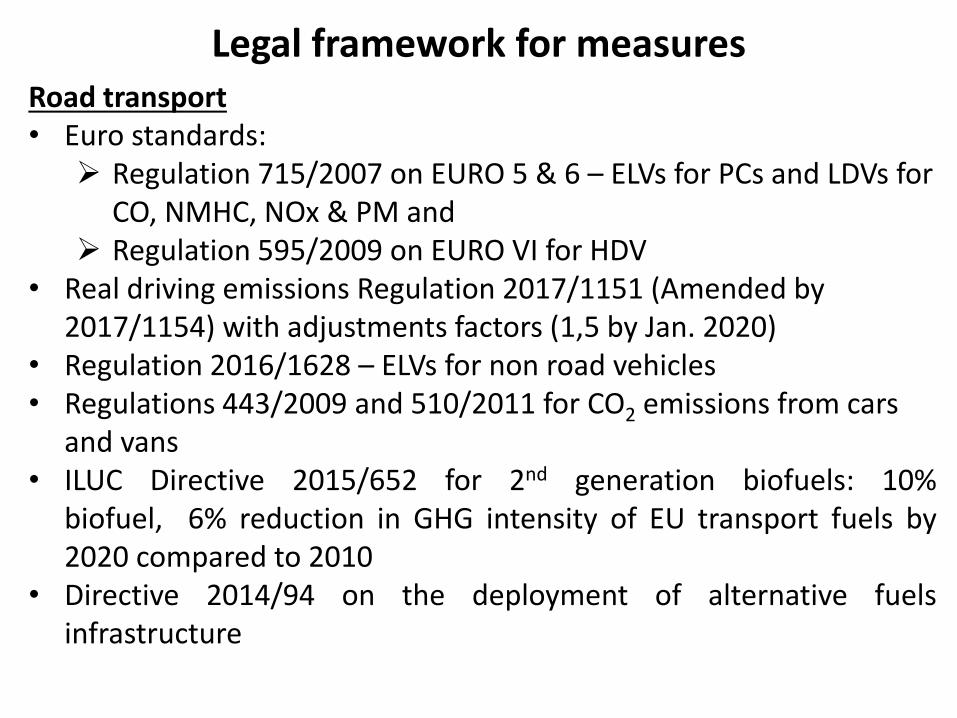
Legal framework for measuresRoad transport• Euro standards:➢ Regulation 715/2007 on EURO 5 & 6 – ELVs for PCs and LDVs for
CO, NMHC, NOx & PM and ➢ Regulation 595/2009 on EURO VI for HDV
• Real driving emissions Regulation 2017/1151 (Amended by 2017/1154) with adjustments factors (1,5 by Jan. 2020)
• Regulation 2016/1628 – ELVs for non road vehicles• Regulations 443/2009 and 510/2011 for CO2 emissions from cars
and vans• ILUC Directive 2015/652 for 2nd generation biofuels: 10%
biofuel, 6% reduction in GHG intensity of EU transport fuels by2020 compared to 2010
• Directive 2014/94 on the deployment of alternative fuelsinfrastructure
Legal framework for measuresIndustrial emissions• Industrial Emissions Directive 2010/75 • Large Combustion Plant BREF (Decision 2017/1442/ΕΕ)• Directive 2015/2193 on Medium Combustion Plants (1 to 50 MW)
that sets ELVs for NOx, SO2 and Dust. For existing installations, if > 5 MW → from 1/1/2025, if ≤ 5 MW from1/1/2030. About 500 MCPs
• Directives 94/63 and 2009/126 (stage II petrol vapour recovery) for gas stations
• Draft Regulation on electricity market: Capacity mechanism -requirements regarding CO2 < 550 gr CO2/kWh of energy or < 700kg CO2 on average per year per installed kW
Legal framework for measuresClimate Change MitigationGHG: CO2, CH4, NO2, HFCs, PFC και SF6
Α. Period till 2020• 20% reduction of GHG vs 1990
❖ ETS: 21% reduction vs 2005❖ Non ETS: 10% reduction vs 2005 (4% reduction for GR)
• 20% energy consumption from RES• 20% increase of energy efficiency
Β. Period till 2030• 40% reduction of GHG vs 1990
❖ ETS: 43% reduction vs 2005❖ Non ETS: 30% reduction vs 2005 (16% reduction for GR)
• 32% energy consumption from RES• 27% increase of energy efficiency
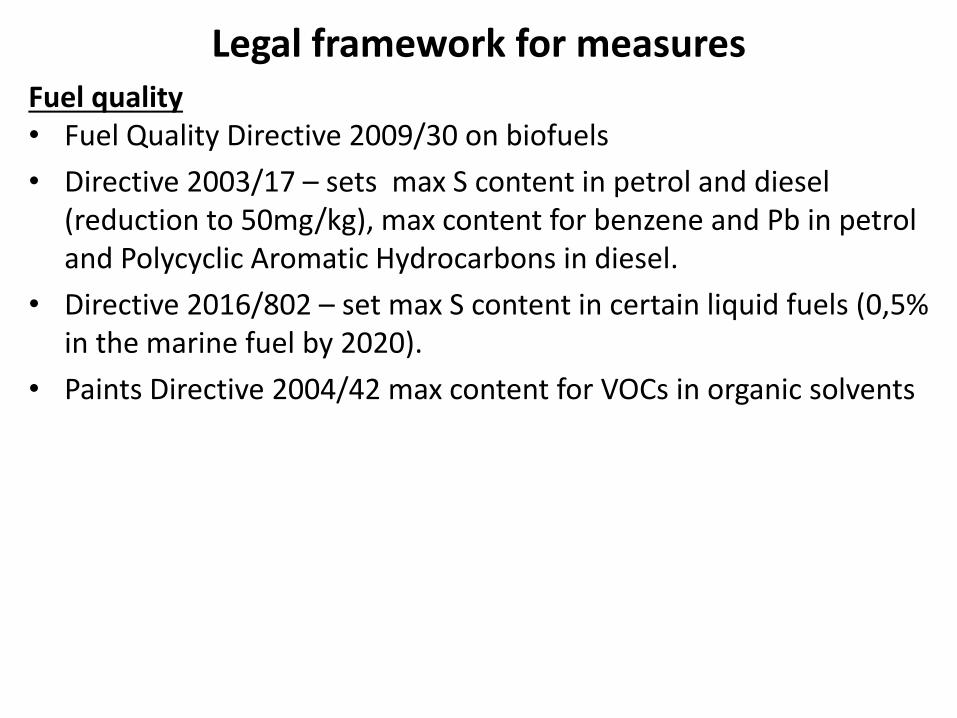
Legal framework for measuresFuel quality• Fuel Quality Directive 2009/30 on biofuels
• Directive 2003/17 – sets max S content in petrol and diesel(reduction to 50mg/kg), max content for benzene and Pb in petrol and Polycyclic Aromatic Hydrocarbons in diesel.
• Directive 2016/802 – set max S content in certain liquid fuels (0,5% in the marine fuel by 2020).
• Paints Directive 2004/42 max content for VOCs in organic solvents
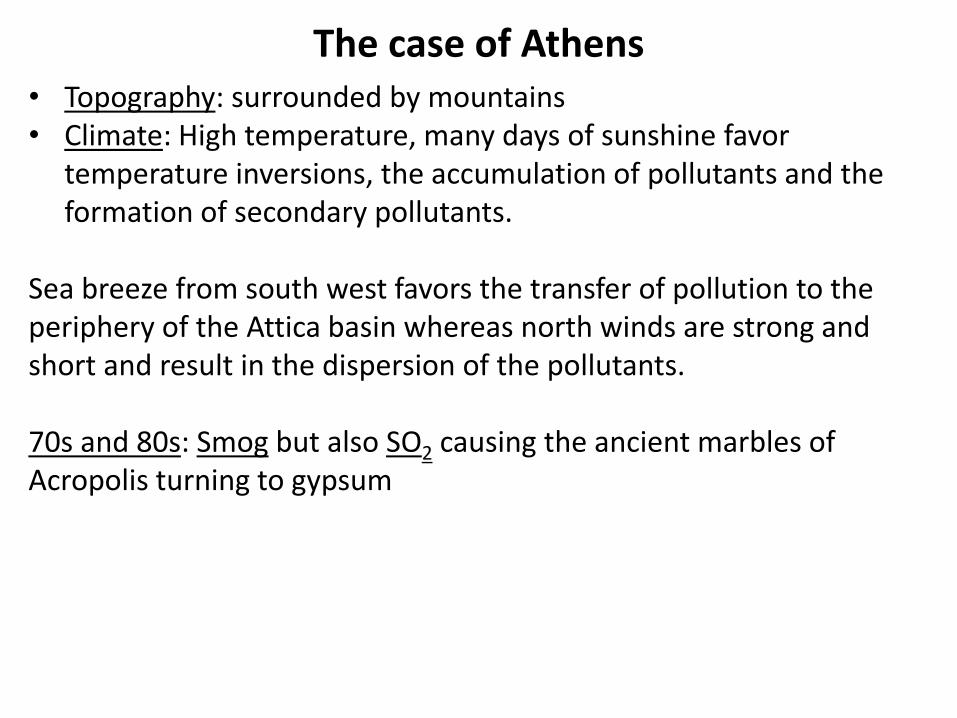
The case of Athens• Topography: surrounded by mountains• Climate: High temperature, many days of sunshine favor
temperature inversions, the accumulation of pollutants and the formation of secondary pollutants.
Sea breeze from south west favors the transfer of pollution to the periphery of the Attica basin whereas north winds are strong and short and result in the dispersion of the pollutants.
70s and 80s: Smog but also SO2 causing the ancient marbles of Acropolis turning to gypsum
Smog in Athens
National Air Quality Monitoring Network30 automatic stations (14 in Athens), monitoring air pollution on a24-h basis. Systematic monitoring since 1984. Calibration andcertification of data in the certified lab of the ministry
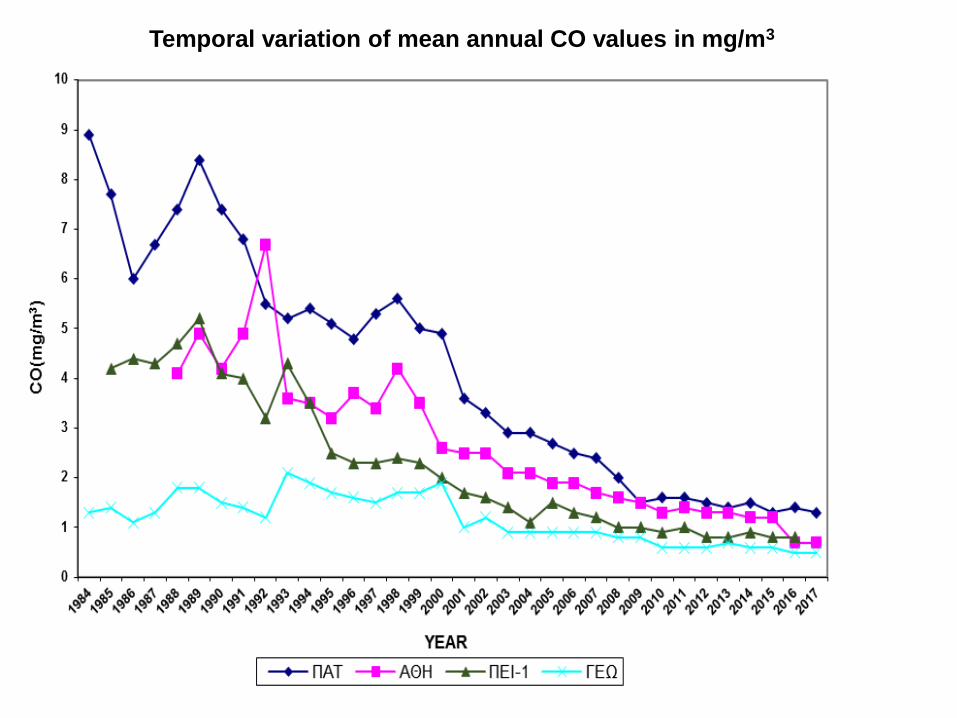
Temporal variation of mean annual CO values in mg/m3
Temporal variation of mean annual CO values in mg/m3
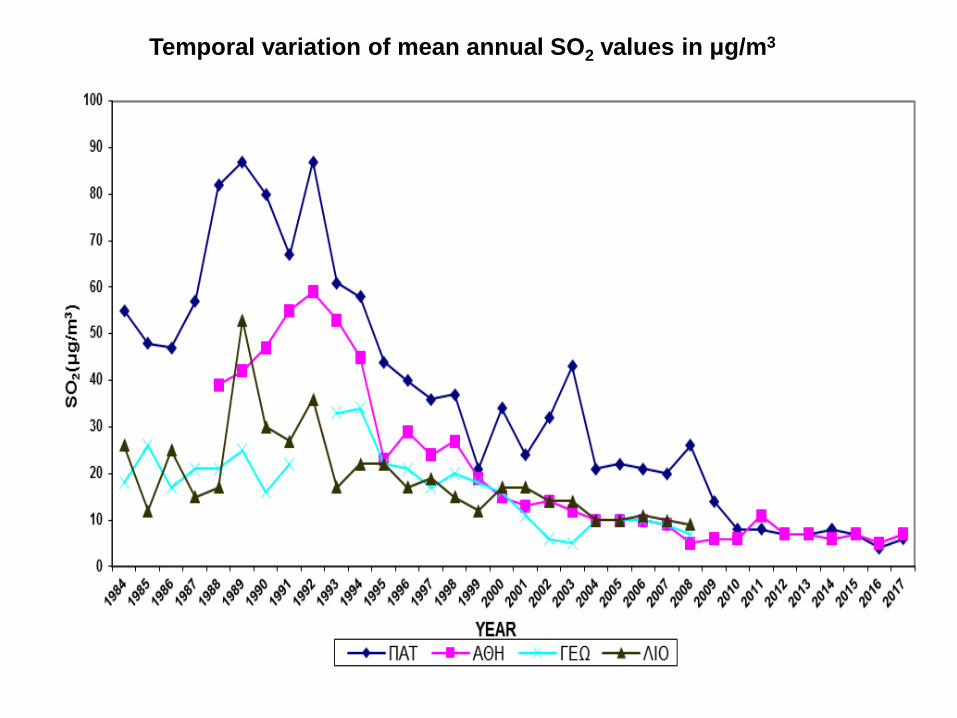
Temporal variation of mean annual SO2 values in μg/m3
Temporal variation of mean annual SO2 values in μg/m3
Temporal variation of mean annual C6H6 values in μg/m3
Temporal variation of mean annual NO values in μg/m3
Temporal variation of mean annual NO values in μg/m3
Temporal variation of mean annual NO2 values in μg/m3
Temporal variation of mean annual NO2 values in μg/m3
Geographical distribution of mean annual NO2 values in μg/m3
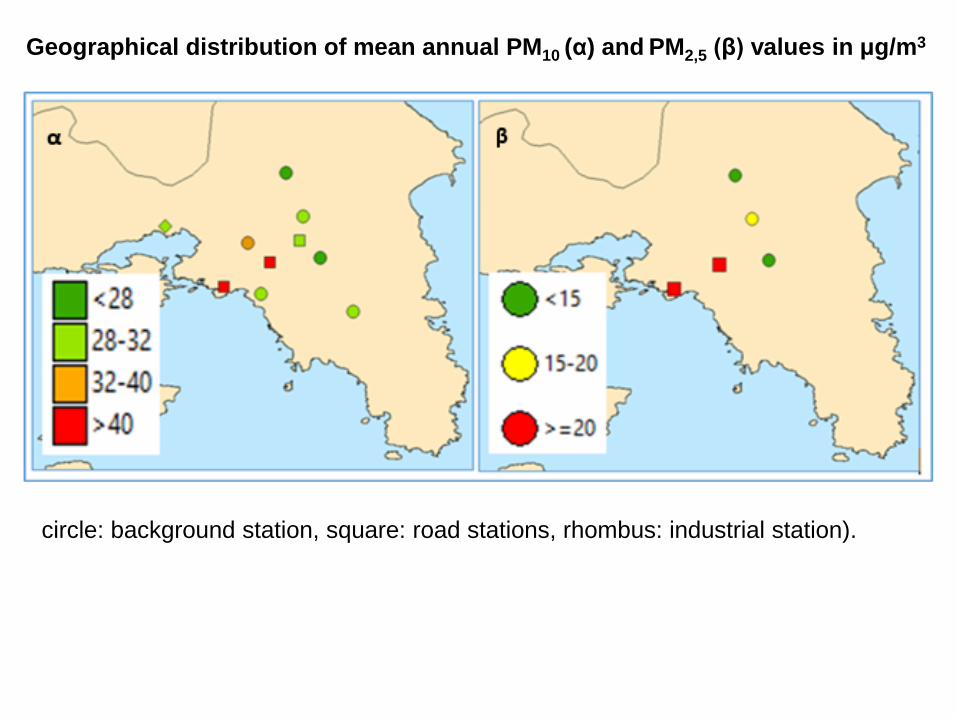
circle: background station, square: road stations, rhombus: industrial station
Temporal variation of mean annual O3 values in μg/m3
Temporal variation of mean annual O3 values in μg/m3
Geographical distribution of the 26th exceedance of the LV of max daily 8-hour O3
values in μg/m3
circle: background station, square: road stations, rhombus: industrial station
Temporal variation of mean annual PM10 values in μg/m3
Temporal variation of mean annual PM10 values in μg/m3
Temporal variation of mean annual PM2,5 values in μg/m3
Geographical distribution of mean annual PM10 (α) and PM2,5 (β) values in μg/m3
• General decrease of concentrations of the primary air pollutants, such as CO, NOand SO2.
• O3 remains almost stable (high solar radiation and sunshine duration favour itsphotochemical production). Exceedance of LV is frequent during the warmperiod of the year in Athens.
• PM10 violate LV for some monitoring stations. Saharan dust events are frequentthroughout the year while high values of PM10 are also present under favourablemeteorological conditions some winter days due to biomass burning for heating.
• Benzene exceeds the LV in the Athens city center.• Concentration values of SO2, NO2, and CO are higher at the downtown
monitoring sites, while for Ο3, typically higher values are observed at thesuburban sites. Topography combined with southwestern sea breeze in Athensoften result in Ο3 accumulation in the northern and north-eastern suburbs,especially during the summertime afternoon hours.
• NO2 exceedances of the annual LV are observed mainly at the periphery of inAthens.
• SO2 and CO concentrations during the winter period are higher than thoseduring summer period. Max CO values coincide with traffic peaks. Thesepollutants never exceed LV.
• Heavy metals like As, Cd. Ni, Pb are below LAT.
Assessment of atmospheric pollution of the country using numerical models
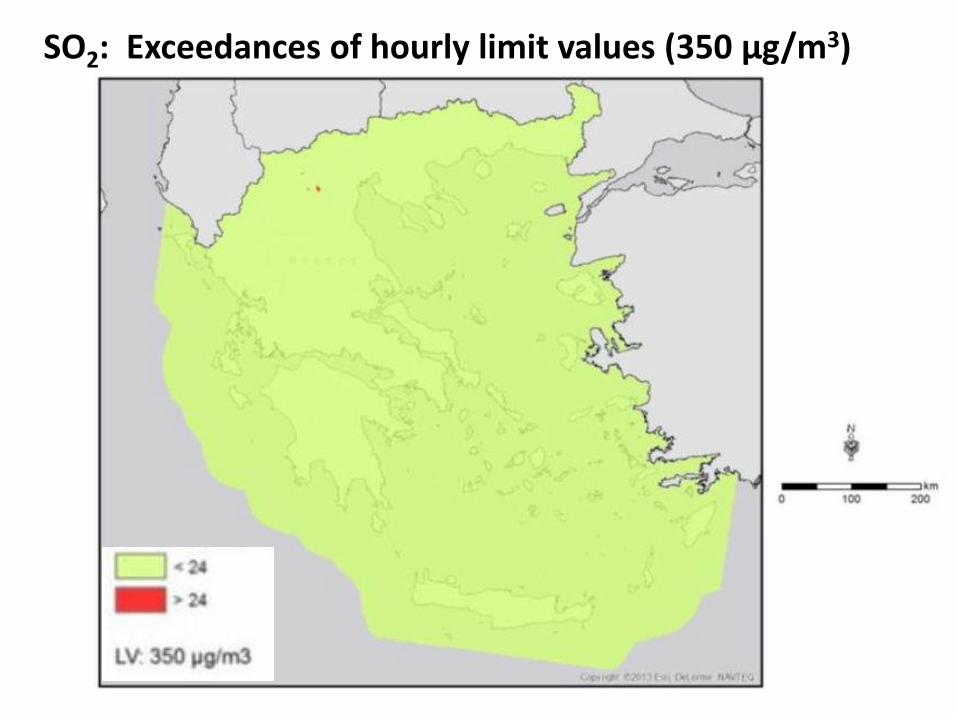
SO2: Exceedances of hourly limit values (350 μg/m3)
NO2: Mean annual value (40 μg/m3)
NOx: Mean annual value in Athens from all sources
NOx: Mean annual value in Athens from road sources
O3: Exceedances of max daily 8-hour mean (from hourly running 8 hours)(LV: 120 μg/m3) - 3 years average
PM10: Daily values - exceedances of limit value (50 μg/m3)
PM10: Mean annual value (40 μg/m3)
PM2,5: Mean annual value (25 mg/m3)
CO: Exceedances of max daily 8-hour mean LV (from hourly running 8 hours)(LV: 10 mg/m3) - 3 years average
Benzene: Mean annual average (5 μg/m3)
Population exposure to air pollution above LVs (2016)
Ο3: 55% NO2: 2% (annual LV)PM10: 21% (daily LV)
Benzene: 2% (annual LV)No exposure to PM2.5 (annual LV) and SO2 (daily LV)
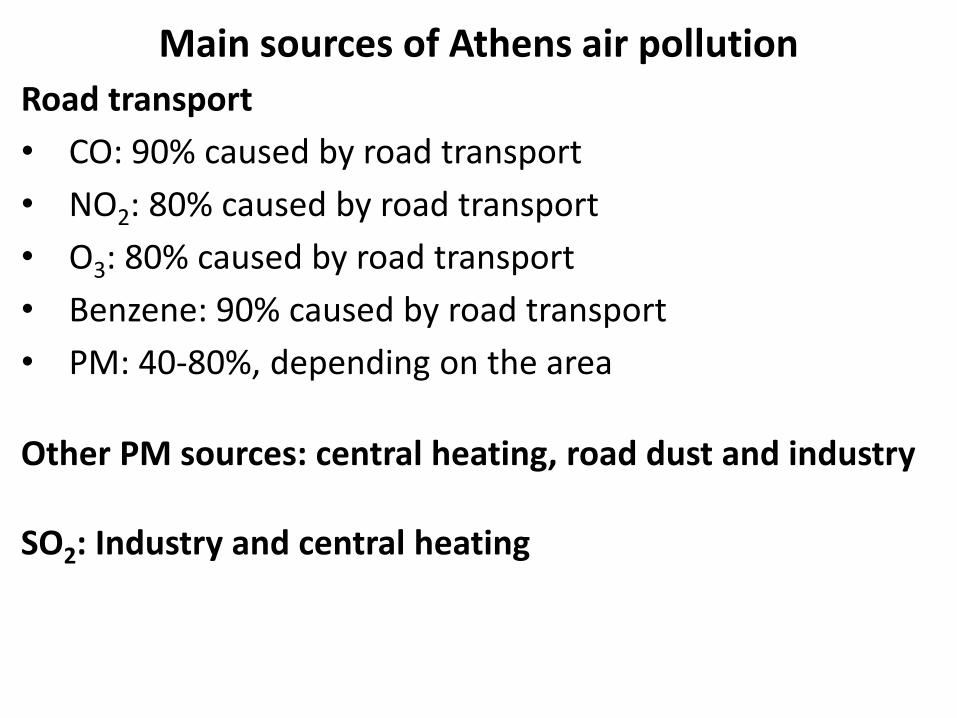
Main sources of Athens air pollution
Road transport
• CO: 90% caused by road transport
• NO2: 80% caused by road transport
• O3: 80% caused by road transport
• Benzene: 90% caused by road transport
• PM: 40-80%, depending on the area
Other PM sources: central heating, road dust and industry
SO2: Industry and central heating
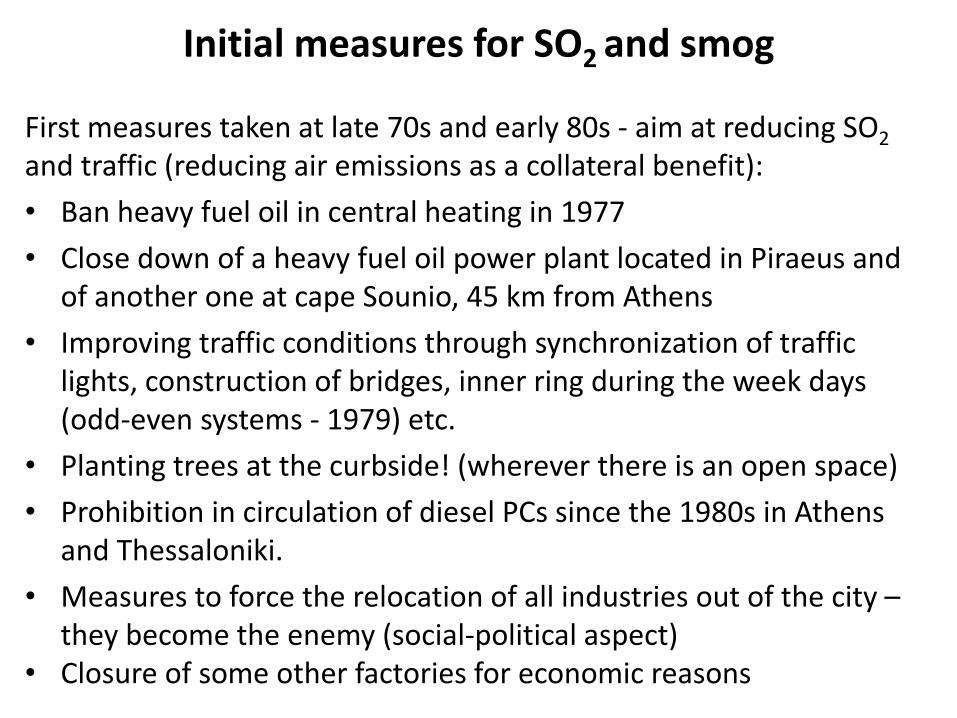
Initial measures for SO2 and smog
First measures taken at late 70s and early 80s - aim at reducing SO2
and traffic (reducing air emissions as a collateral benefit):
• Ban heavy fuel oil in central heating in 1977
• Close down of a heavy fuel oil power plant located in Piraeus and of another one at cape Sounio, 45 km from Athens
• Improving traffic conditions through synchronization of traffic lights, construction of bridges, inner ring during the week days (odd-even systems - 1979) etc.
• Planting trees at the curbside! (wherever there is an open space)
• Prohibition in circulation of diesel PCs since the 1980s in Athens and Thessaloniki.
• Measures to force the relocation of all industries out of the city –they become the enemy (social-political aspect)
• Closure of some other factories for economic reasons
Ongoing measures in the last decades
1. Heating:• Allowing only 0,1% S content in diesel - mandatory use of natural
gas downtown where available –
• Economic incentives to promote natural gas
• Economic incentives to use of electricity instead of biomass during high pollution days
• Money allowance for purchase of heating oil according to thepersonal income
• Standards for solid biomass fuels
1. Industry:• Still measures to discourage the installation or the expansion of
factories in Athens mainly through land use restrictions!!!
• Promotion of natural gas
• Improved environmental inspections
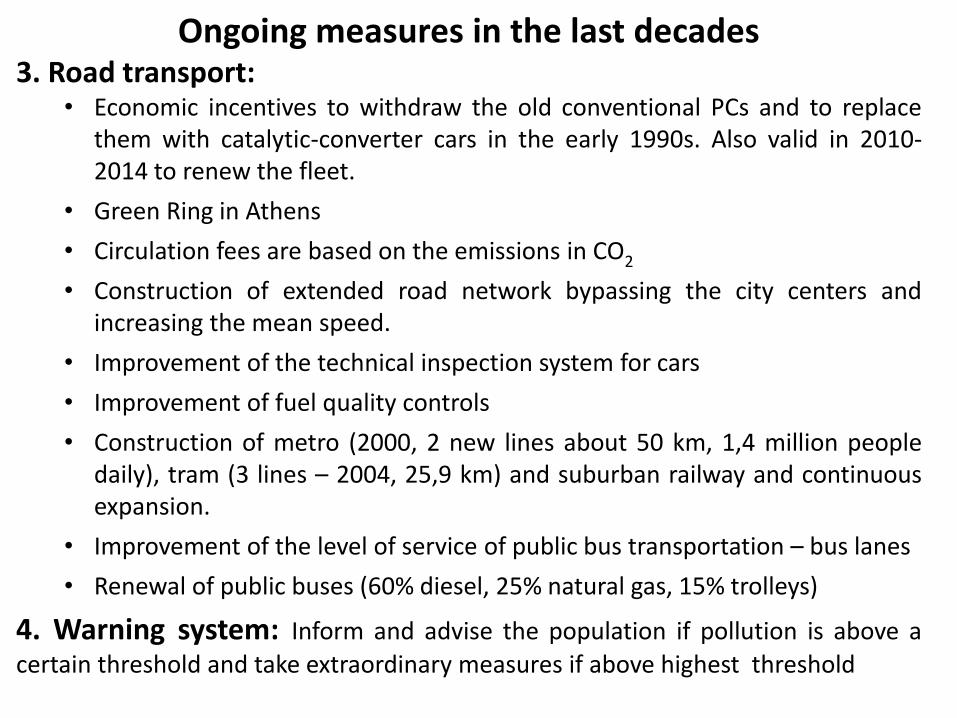
Ongoing measures in the last decades 3. Road transport:
• Economic incentives to withdraw the old conventional PCs and to replacethem with catalytic-converter cars in the early 1990s. Also valid in 2010-2014 to renew the fleet.
• Green Ring in Athens
• Circulation fees are based on the emissions in CO2
• Construction of extended road network bypassing the city centers andincreasing the mean speed.
• Improvement of the technical inspection system for cars
• Improvement of fuel quality controls
• Construction of metro (2000, 2 new lines about 50 km, 1,4 million peopledaily), tram (3 lines – 2004, 25,9 km) and suburban railway and continuousexpansion.
• Improvement of the level of service of public bus transportation – bus lanes
• Renewal of public buses (60% diesel, 25% natural gas, 15% trolleys)
4. Warning system: Inform and advise the population if pollution is above a
certain threshold and take extraordinary measures if above highest threshold
The measure of car withdrawal
YEAR PM NOx NMVOC CO
2011 0 -2 -4 -4
Expected reductions (%) in emissions in 2011 compared to 2010, 75.000 cars
Problem: all imported
Critical factors/parameters to fine tune the right measures and measure its effectiveness: type of vehicles, age of fleet, maintenance, km/vehicle
Air emissions from road transport in Athens
Parameters:• Type of vehicle (PCs, taxis, LDVs, trucks and buses, motorcycles)
• Age distribution
• Number of km per type of vehicle
• Speed profile
• Ambien temperature
COPERT IV
Annual air emissions per vehicle type in Athens
t/y CO NMVOCs NOX PM CO2 (kt/y)PCs 75639 11347 8665 Private 36
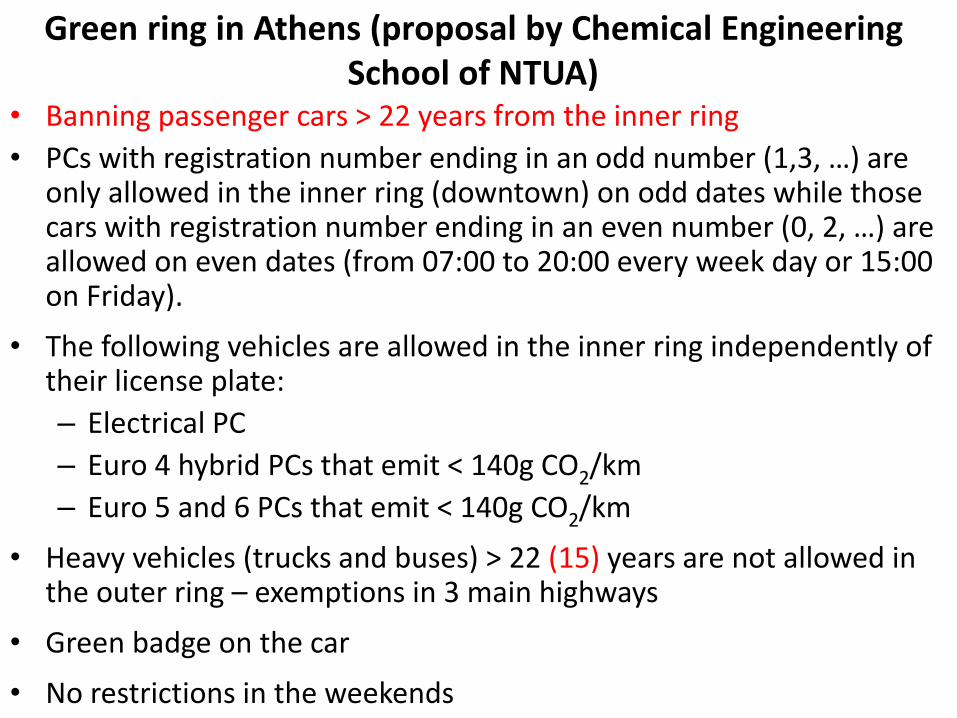
Green ring in Athens (proposal by Chemical Engineering School of NTUA)
• Banning passenger cars > 22 years from the inner ring
• PCs with registration number ending in an odd number (1,3, …) are only allowed in the inner ring (downtown) on odd dates while those cars with registration number ending in an even number (0, 2, …) are allowed on even dates (from 07:00 to 20:00 every week day or 15:00 on Friday).
• The following vehicles are allowed in the inner ring independently of their license plate:
– Electrical PC
– Euro 4 hybrid PCs that emit < 140g CO2/km
– Euro 5 and 6 PCs that emit < 140g CO2/km
• Heavy vehicles (trucks and buses) > 22 (15) years are not allowed in the outer ring – exemptions in 3 main highways
• Green badge on the car
• No restrictions in the weekends
Green ring in Athens Emission estimates
NTUA proposal of banning PC > 22 year
Estimated emission reductions in the Athens Greater Area in a typical day from road transport
Allowing EURO 5 & 6 diesel PC in Athens
Emission reductions in 2015 vs 2010 (including car withdrawal)
CO NMVOC NOX N2O CH4 CO2
-54% -45% -13% -10% -28% -10%
PM NOx NMVOC CO CO2
No diesel -2% -10% -31% -29% 3%
With diesel 1% -7% -32% -32% -5%
Green ring in Athens – Emission estimates
Banning buses and trucks > 15 years in the outer ring
Estimated emission reductions in Greater Athens Area from road transport in a typical day
Age of HDV in the outer ring
PM10 NMVOC NOX N2O CH4
< 15 year -66% -71% -44% -7% -52%
< 22 year -40% -13% -20% -6%
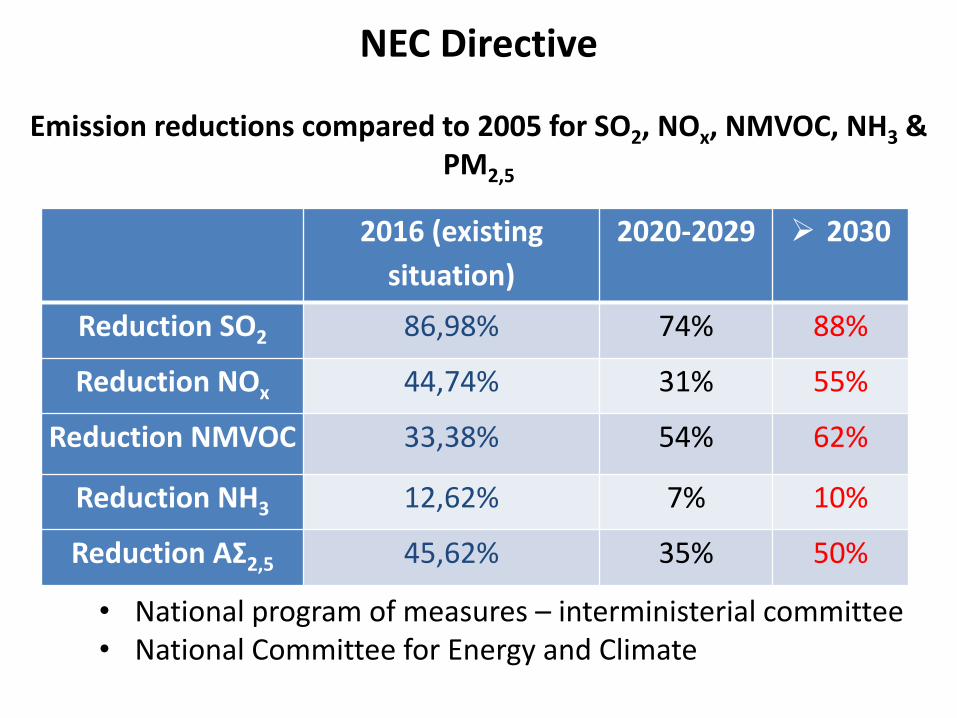
NEC Directive
Emission reductions compared to 2005 for SO2, NOx, NMVOC, NH3 &PM2,5
• National program of measures – interministerial committee• National Committee for Energy and Climate
2016 (existing
situation)
2020-2029 ➢ 2030
Reduction SO2 86,98% 74% 88%
Reduction NOx 44,74% 31% 55%
Reduction NMVOC 33,38% 54% 62%
Reduction ΝΗ3 12,62% 7% 10%
Reduction ΑΣ2,5 45,62% 35% 50%
NEC Directive – Existing measuresEU Climate –Energy package for 2020 and 2030
• ETS & non ETS (Effort Sharing Decision)• ILUC Directive• Renewables• Energy Efficiency• Ecodesign provisions on solid fuel combustion• etc…
EU transport legislation• Regulations CO2 emissions from cars and vans• Euro standards• Fuel Quality Directive &Marine Fuel Directive• Non road mobile machinery Regulation• Alternative fuel infrastructure Directive
Industry• IED & MCP Directives
Other• Nitrates Directive,
• CAP
• etc.
NEC Directive – Overall picture
NOxSources• Power plants - 30%• HDV road transport – 18%• Rest road transport – 8%• Shipping – 17%• Industry – 7%
Policy measures:• RES• Promotion of natural gas• Interconnection of the islands• Withdrawal of old power plants• Renewal of HDW fleet• Directives 2015/2193/EU (MCP), 2010/75/EU (LCP ELV),
2017/1442/EU (LCP BAT)
NOx
0
20
40
60
80
100
120
140
0.00
50.00
100.00
150.00
200.00
250.00
300.00
350.00
400.00
450.00
500.00
1990
1991
1992
1993
1994
1995
1996
1997
1998
1999
2000
2001
2002
2003
2004
2005
2006
2007
2008
2009
2010
2011
2012
2013
2014
2015
2016
Inde
x (1
990
emis
sion
s =
100)
NO
x, k
t
year
Energy IPPU Agriculture Waste Change compared to 1990
Emissions 2016: -33.21% compared to1990
-44,74% compared to 2005
NOx
Only emissions sectors that are accounted for the NEC Directive are included
SO2Sources• Power plants - 69%• Petroleum refinery– 14%
Policy measures:• Reduction of fuel S content• Desulphulization in power plants• RES• Promotion of natural gas• Interconnection of the islands• Withdrawal of old power plants
SO2
Emissions 2016: -85.21% compared to1990
-86,98% compared to 2005
0
20
40
60
80
100
120
0.00
100.00
200.00
300.00
400.00
500.00
600.00
19
90
19
91
19
92
19
93
19
94
19
95
19
96
19
97
19
98
19
99
20
00
20
01
20
02
20
03
20
04
20
05
20
06
20
07
20
08
20
09
20
10
20
11
20
12
20
13
20
14
20
15
20
16
Ind
ex (
19
90
em
issi
on
s =
10
0)
SOx,
kt
year
Energy IPPU Agriculture Waste Change compared to 1990
SO2
NH3Sources• Manure - 66%• Fertilizers – 16%
Policy measures:• Reduction of use of fertilizers• Organic farming• Manure management• CAP – green payments• Code of Good Agricultural Practice for the reduction of nitrate
pollution of groundwaters
NH3
Emissions 2016: - 26.55% compared to1990
-12.62% compared to 2005
0
20
40
60
80
100
120
0.00
10.00
20.00
30.00
40.00
50.00
60.00
70.00
80.00
90.00
19
90
19
91
19
92
19
93
19
94
19
95
19
96
19
97
19
98
19
99
20
00
20
01
20
02
20
03
20
04
20
05
20
06
20
07
20
08
20
09
20
10
20
11
20
12
20
13
20
14
20
15
20
16
Ind
ex (
19
90
em
issi
on
s =
10
0)
NH
3, k
t
yearEnergy IPPU Agriculture Waste Change compared to 1990
NH3
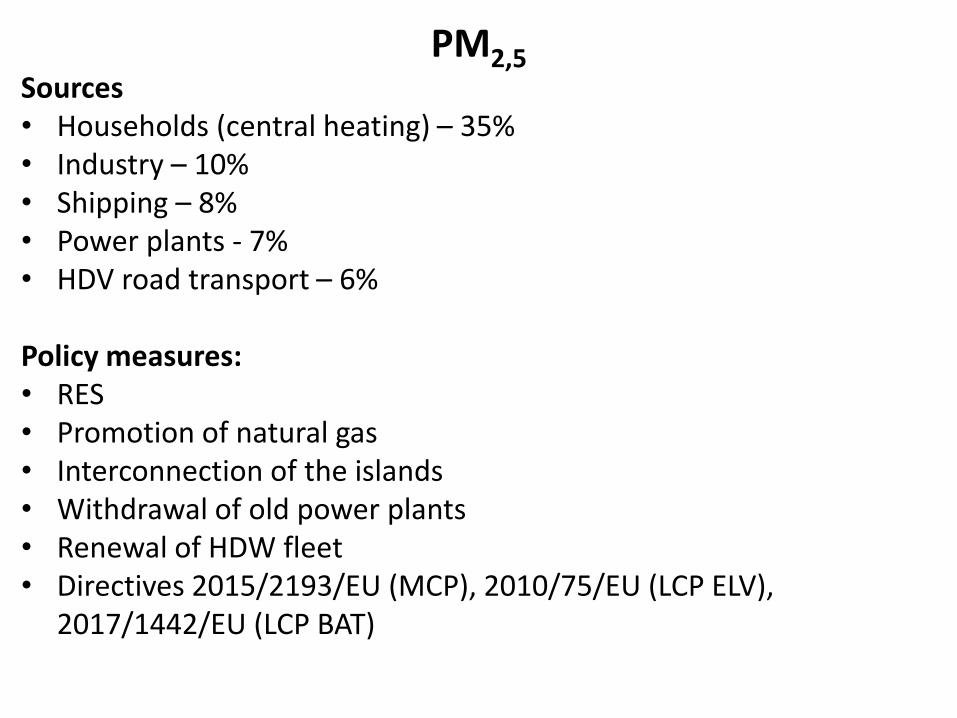
PM2,5Sources• Households (central heating) – 35%• Industry – 10%• Shipping – 8%• Power plants - 7%• HDV road transport – 6%
Policy measures:• RES• Promotion of natural gas• Interconnection of the islands• Withdrawal of old power plants• Renewal of HDW fleet• Directives 2015/2193/EU (MCP), 2010/75/EU (LCP ELV),
2017/1442/EU (LCP BAT)
PM2,5
Emissions 2016: - 41,28% compared to1990
- 45,62% compared to 2005
PM2,5
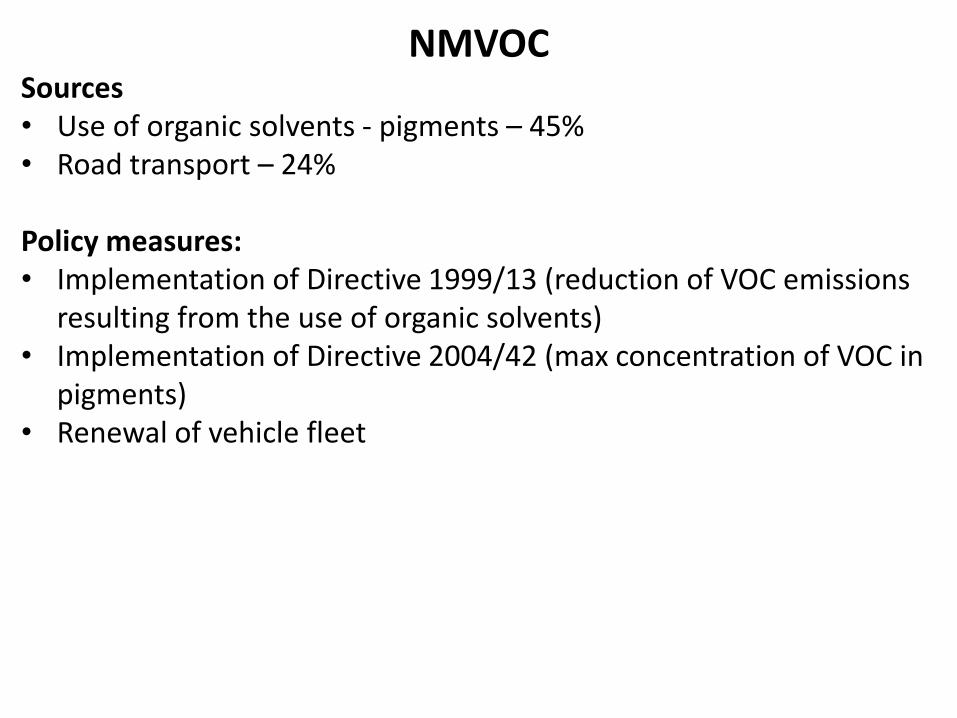
NMVOCSources• Use of organic solvents - pigments – 45%• Road transport – 24%
Policy measures:• Implementation of Directive 1999/13 (reduction of VOC emissions
resulting from the use of organic solvents)• Implementation of Directive 2004/42 (max concentration of VOC in
pigments)• Renewal of vehicle fleet
Non Methane Volatile Organic Compounds (NMVOC)
Emissions 2016: - 38,18% compared to1990
- 33,38% compared to 2005
0
20
40
60
80
100
120
0.00
50.00
100.00
150.00
200.00
250.00
300.00
350.00
Ind
ex (
19
90
em
issi
on
s =
10
0)
NM
VO
C, k
t
year
Energy IPPU Agriculture Waste Change compared to 1990
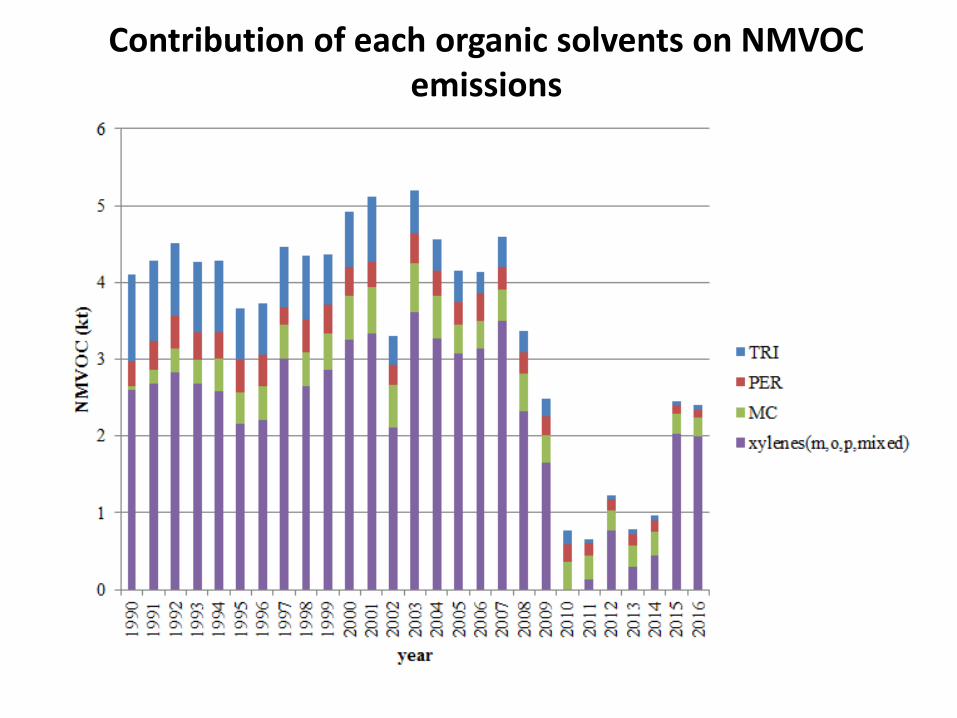
Contribution of each organic solvents on NMVOC emissions
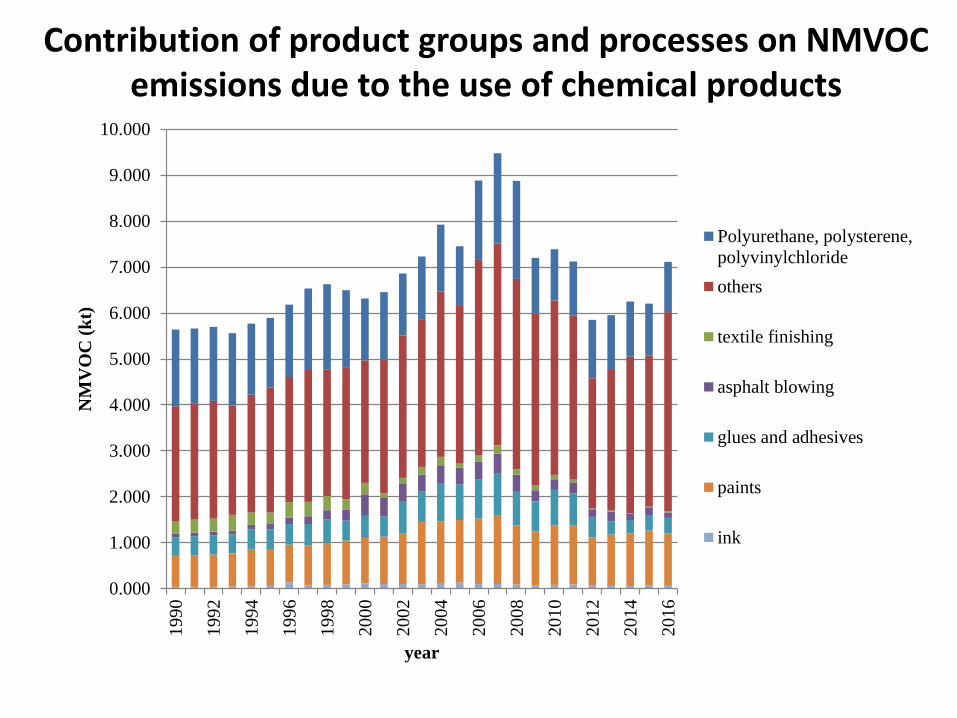
Contribution of product groups and processes on NMVOC emissions due to the use of chemical products
0.000
1.000
2.000
3.000
4.000
5.000
6.000
7.000
8.000
9.000
10.000
1990
1992
1994
1996
1998
2000
2002
2004
2006
2008
2010
2012
2014
2016
NM
VO
C (
kt)
year
Polyurethane, polysterene,
polyvinylchloride
others
textile finishing
asphalt blowing
glues and adhesives
paints
ink
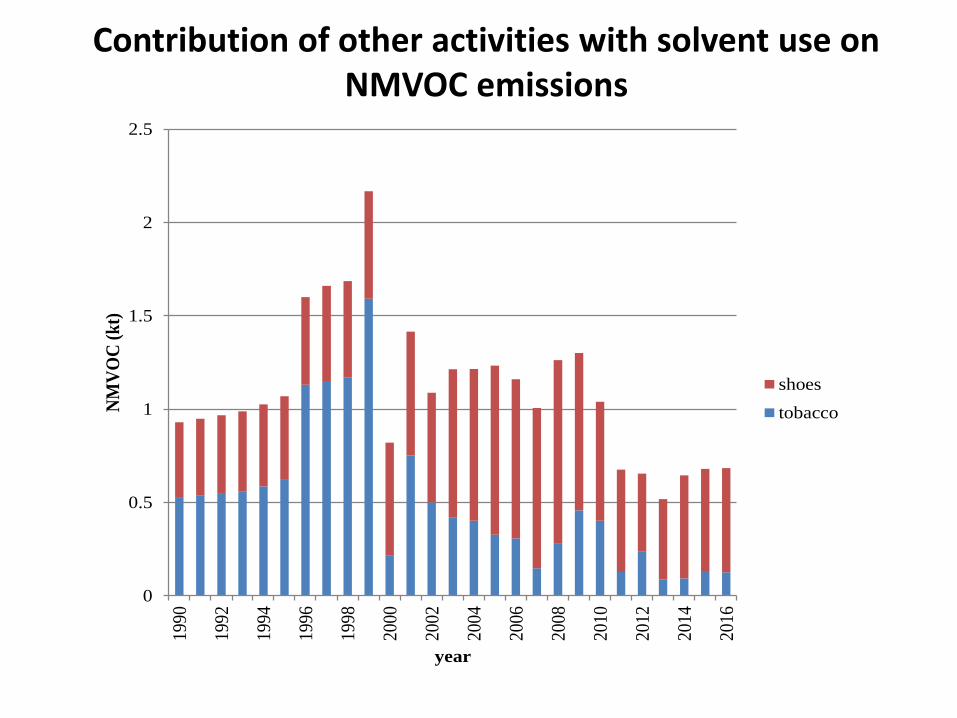
Contribution of other activities with solvent use on NMVOC emissions
0
0.5
1
1.5
2
2.5
1990
1992
1994
1996
1998
2000
2002
2004
2006
2008
2010
2012
2014
2016
NM
VO
C (
kt)
year
shoes
tobacco
Contribution of food and beverage on NMVOC emissions
0
1
2
3
4
5
6
19
90
19
91
19
92
19
93
19
94
19
95
19
96
19
97
19
98
19
99
20
00
20
01
20
02
20
03
20
04
20
05
20
06
20
07
20
08
20
09
20
10
20
11
20
12
20
13
20
14
20
15
20
16
NM
VO
C (
kt)
year
wine, beer and spirits
animal food
sugar and coffee
fish and paultry
bread and biscuits
fats
Non Methane Volatile Organic Compounds (NMVOC)
100
150
200
250
300
350
1990 1995 2000 2005 2010 2015 2020 2025 2030
NM
VO
C, k
t
έτος
Only emissions from sectors that are included in the NEC Directive
Pb
Pb emissions by sector (in kt) for the years 1990 – 2016
0
20
40
60
80
100
120
0.00
50.00
100.00
150.00
200.00
250.00
300.00
350.00
400.00
450.00
500.00
Ind
ex
(19
90
em
issi
on
s =
10
0)
Pb
, t
year
Energy IPPU Agriculture Waste Change compared to 1990