+ All Categories
Home > Documents > Taiwan Food Service - Hotel Restaurant Institutional ... · 12/26/2013  · People in Taiwan love...

Taiwan Food Service - Hotel Restaurant Institutional ... · 12/26/2013  · People in Taiwan love...

Date post: 18-Apr-2020
Category:
Upload: others
View: 3 times
Download: 0 times
Share this document with a friend
37
THIS REPORT CONTAINS ASSESSMENTS OF COMMODITY AND TRADE ISSUES MADE BY USDA STAFF AND NOT NECESSARILY STATEMENTS OF OFFICIAL U.S. GOVERNMENT POLICY Date: GAIN Report Number: Approved By: Prepared By: Report Highlights: The Taiwan foodservice industry enjoyed another year of success, expanding 7.7% to U.S. $13.2 billion in 2012. The rise of Taiwan’s tourism market continued to play a critical role in the growth of this sector, especially with the continued increase of Chinese tourists. As further confirmation of the sector’s success, several food service companies filed for successful initial public offerings during the past year. Post anticipates this trend will continue throughout the remainder of 2013 and eventually level off in early 2014. Cleo Fu Mark Ford Industry Expands Nearly 8 Percent Food Service - Hotel Restaurant Institutional Taiwan TW13050 12/26/2013 Required Report - public distribution
Transcript

THIS REPORT CONTAINS ASSESSMENTS OF COMMODITY AND TRADE ISSUES MADE BY

USDA STAFF AND NOT NECESSARILY STATEMENTS OF OFFICIAL U.S. GOVERNMENT

POLICY

Date:

GAIN Report Number:

Approved By:

Prepared By:

Report Highlights:

The Taiwan foodservice industry enjoyed another year of success, expanding 7.7% to U.S. $13.2 billion

in 2012. The rise of Taiwan’s tourism market continued to play a critical role in the growth of this

sector, especially with the continued increase of Chinese tourists. As further confirmation of the

sector’s success, several food service companies filed for successful initial public offerings during the

past year. Post anticipates this trend will continue throughout the remainder of 2013 and eventually

level off in early 2014.

Cleo Fu

Mark Ford

Industry Expands Nearly 8 Percent

Food Service - Hotel Restaurant Institutional

Taiwan

TW13050

12/26/2013

Required Report - public distribution

Executive Summary:

Although it is a small island (about the size of Maryland and Delaware combined) with a population of

only 23 million people, Taiwan has developed into one of the world's largest economic and trading

entities. Over the past decade, Taiwan has transformed itself from a light industry-manufacturing base

to a global center for the production of high technology products. With a nominal Gross Domestic

Product (GDP) of $473.7 billion in 2012, Taiwan is the world's 24th largest economy, as well as the 6th

largest economy in Asia. In 2012, Taiwan had an estimated per capita GDP of US$20,378 (US$38,486

when calculated in terms of Purchasing Power Parity). Overall, Taiwan is our 12th largest trading

partner and our 16th largest export market (as of July 2013).

Since the Taiwan economy is heavily dependent on exports, a drop in demand from its key export

markets such as Europe and the United States has impacted economic growth. With exports posting

near zero growth, Taiwan's economy grew by 1.32 percent in 2012, a pace much lower than expected.

For 2013, Taiwan's official forecast is for GDP to grow by about 1.74 percent. Inflationary pressures

remain moderate, and the official forecast is for consumer prices to increase by 0.84 percent in 2013.

Taiwan currently has the sixth-largest foreign exchange reserves in the world, with U.S. $417.82 billion

as of September 2013. The New Taiwan dollar (NTD) exchange rate closed at NTD29.136 per USD at

2012 year-end, a slight appreciation from NTD30.29 at 2011 year-end.

Taiwan is the largest investor in mainland China, where Taiwan companies have invested heavily in

electronic parts and components, computers and optoelectronics, electrical equipment, metal products,

plastics, food processing and other sectors. Official reports place the level of investment at U.S. $131.2

billion as of September 2013, but unofficial estimates speculate the amount may be two to three times

higher. Taiwan firms located in China are among China's largest exporters.

On June 29, 2010, Taiwan and China concluded the Economic Cooperation Framework Agreement

(ECFA), a pact designed in part to help Taiwan exporters stay competitive with the Association of

Southeast Asian Nations (ASEAN) following the signing of the "ASEAN plus 1" trade agreement with

China. ECFA is a preferential trade agreement designed to reduce barriers to trade and investment

gradually.

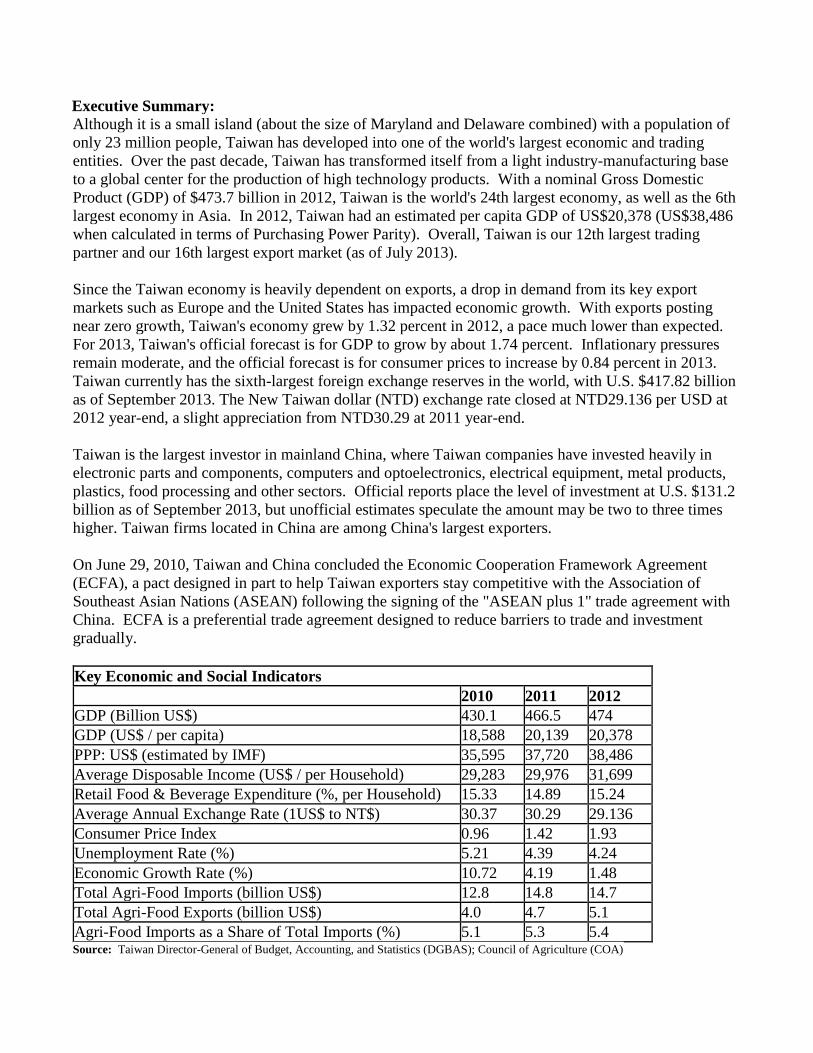
Key Economic and Social Indicators

2010 2011 2012

GDP (Billion US$) 430.1 466.5 474

GDP (US$ / per capita) 18,588 20,139 20,378

PPP: US$ (estimated by IMF) 35,595 37,720 38,486

Average Disposable Income (US$ / per Household) 29,283 29,976 31,699

Retail Food & Beverage Expenditure (%, per Household) 15.33 14.89 15.24

Average Annual Exchange Rate (1US$ to NT$) 30.37 30.29 29.136

Consumer Price Index 0.96 1.42 1.93

Unemployment Rate (%) 5.21 4.39 4.24

Economic Growth Rate (%) 10.72 4.19 1.48

Total Agri-Food Imports (billion US$) 12.8 14.8 14.7

Total Agri-Food Exports (billion US$) 4.0 4.7 5.1

Agri-Food Imports as a Share of Total Imports (%) 5.1 5.3 5.4 Source: Taiwan Director-General of Budget, Accounting, and Statistics (DGBAS); Council of Agriculture (COA)
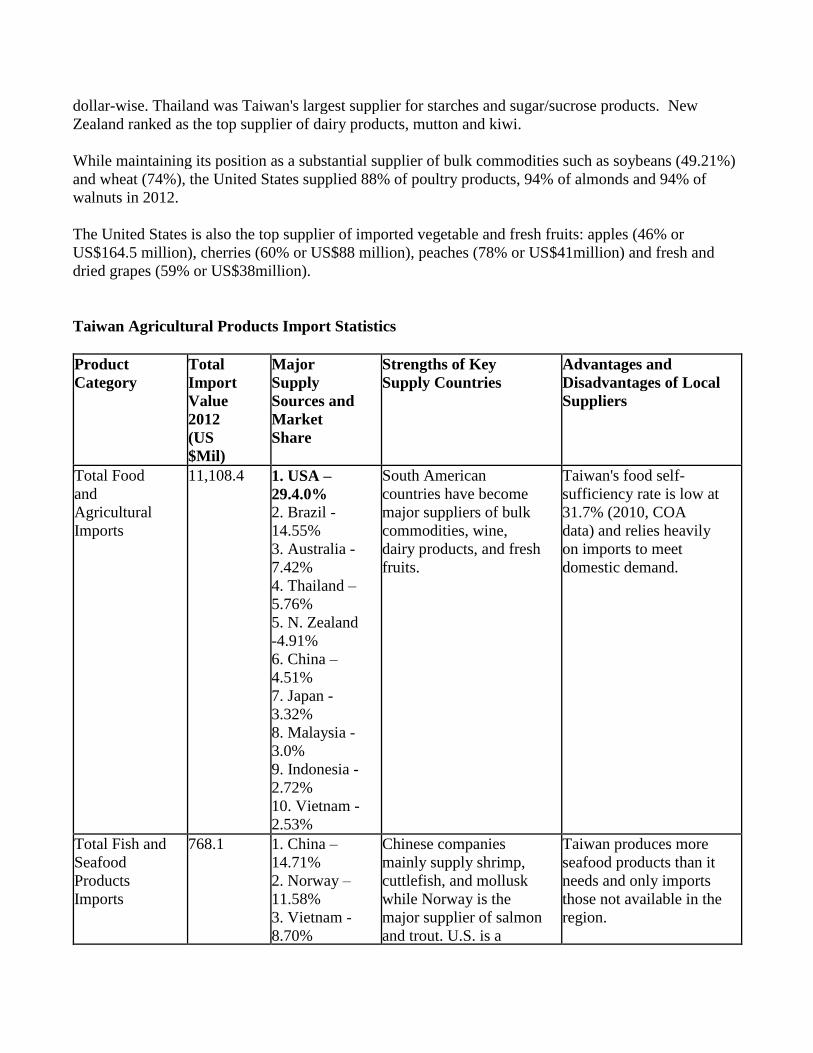
Agricultural Trade

Although Taiwan is an economic powerhouse, domestic agricultural production is somewhat limited.

As a result, Taiwan is increasingly reliant on imports of food and other agricultural products. The

United States has long been the major supplier of Taiwan's agri-food imports, followed by emerging

South American supplier Brazil, Australia, Thailand and New Zealand. In 2012, Taiwan imported

nearly US$3.3 billion dollars of food and agricultural products (including edible fishery products) from

the United States, accounting for about 29.4% of Taiwan's total agri-food imports. Of the U.S. total,

over US$1.4 billion was comprised of bulk commodities, including corn, soybeans and wheat. Other

major food imports include meat and poultry products, dairy, fresh fruits, alcohol and beverage.

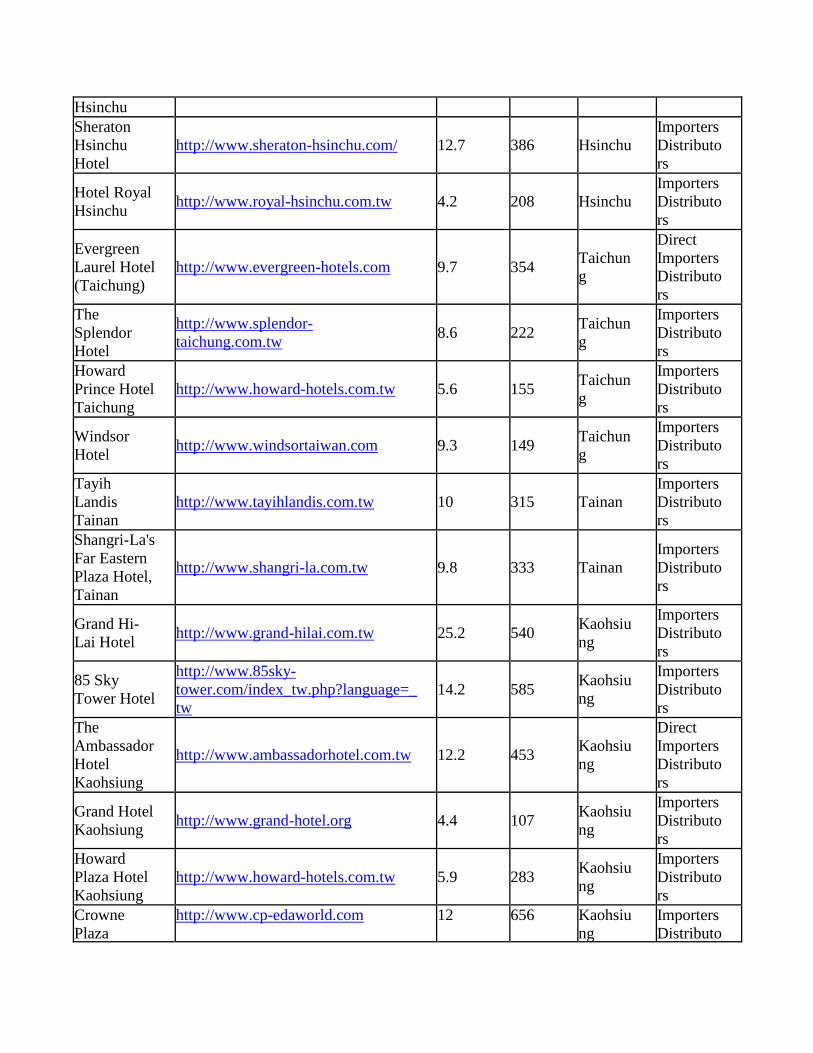
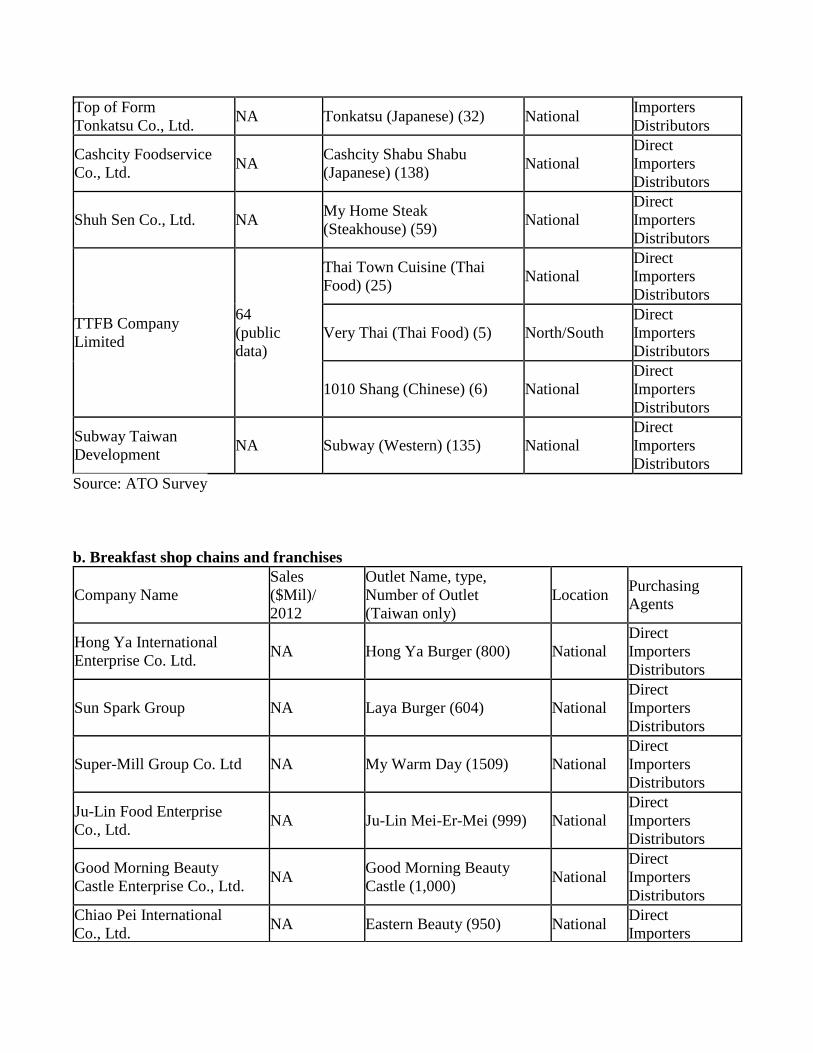
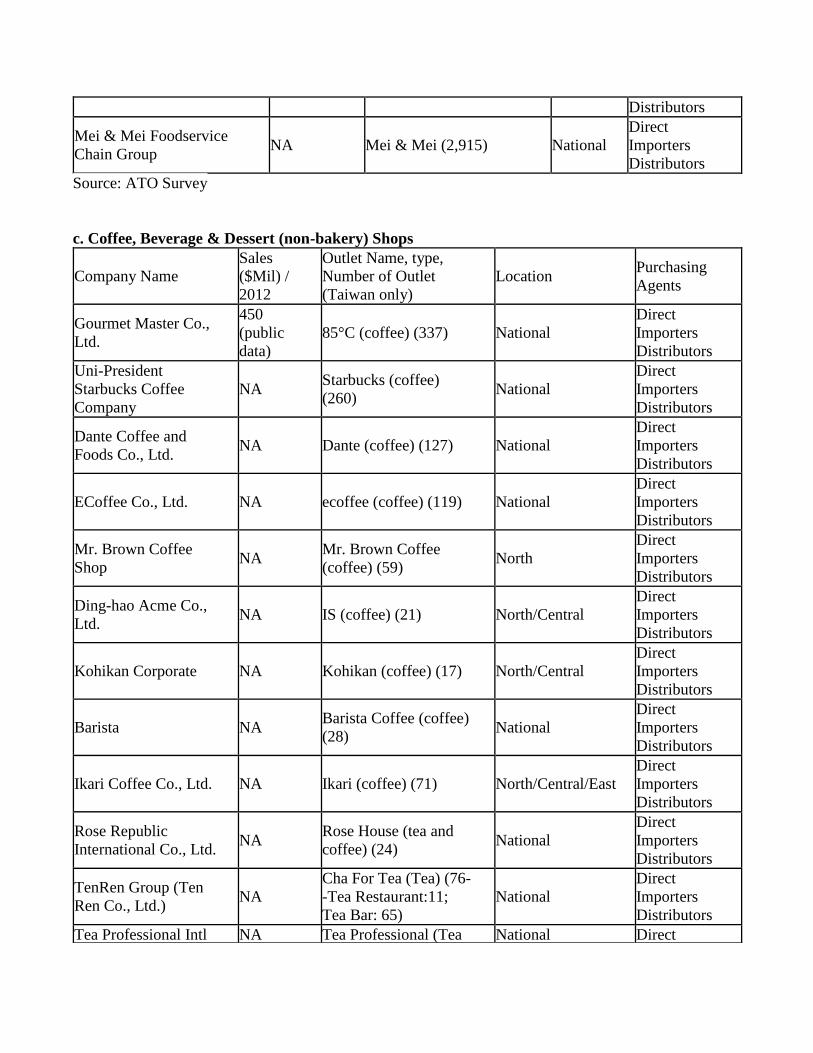
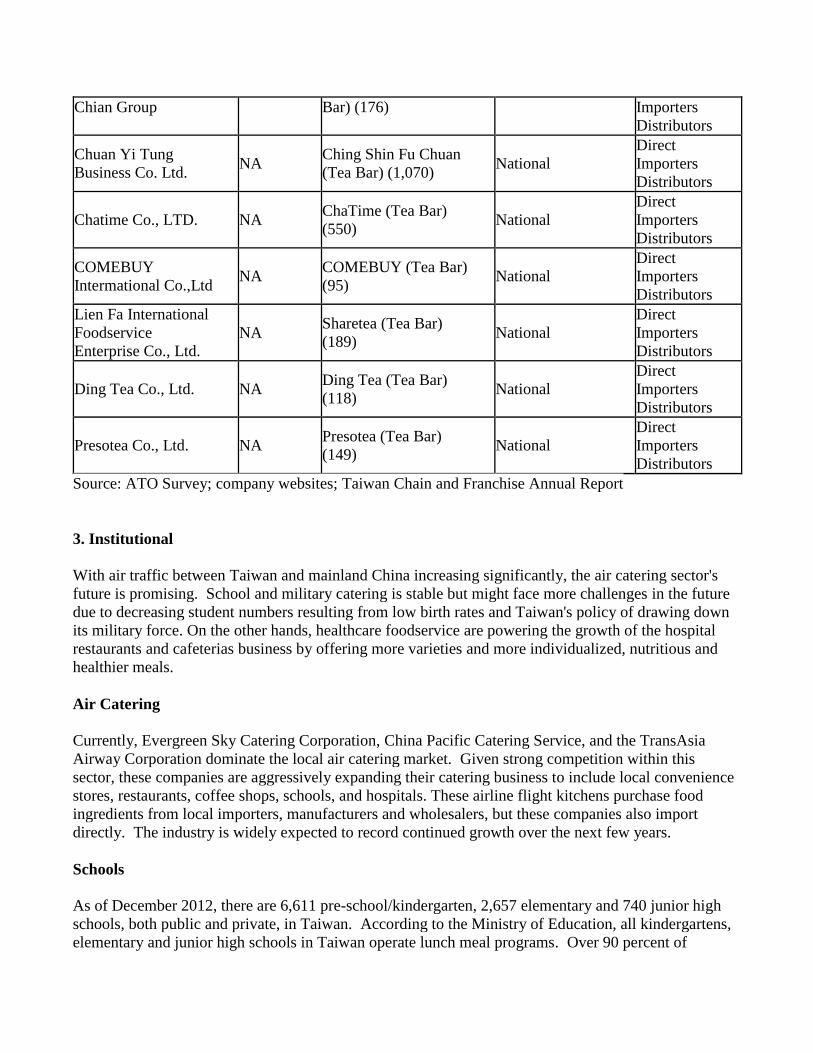
Taiwan Food Service Sector Overview and Trends

People in Taiwan love to eat out! Eating out is also very much a part of the food culture in Taiwan.

That statement was included in the 40th

Fiscal Term Interim Business Report of popular fast-food chain

MOS Burger, but most Taiwan consumers and foodservice managers and investors would agree.

According to Taiwan’s Ministry of Economic Affairs (MOEA), the economic output of Taiwan’s food

service sector, excluding institutional food service, is estimated at US$13.2 billion in 2012, a 7.7

percent increase from the previous year. The continued prosperity of tourism market has helped drive

up food service sector revenue, which is expected to continue to grow over the next decade. This

increase can also be attributed to other several factors, including the rise in consumer income, smaller

family size, increasing numbers of working women and the development of web marketing.

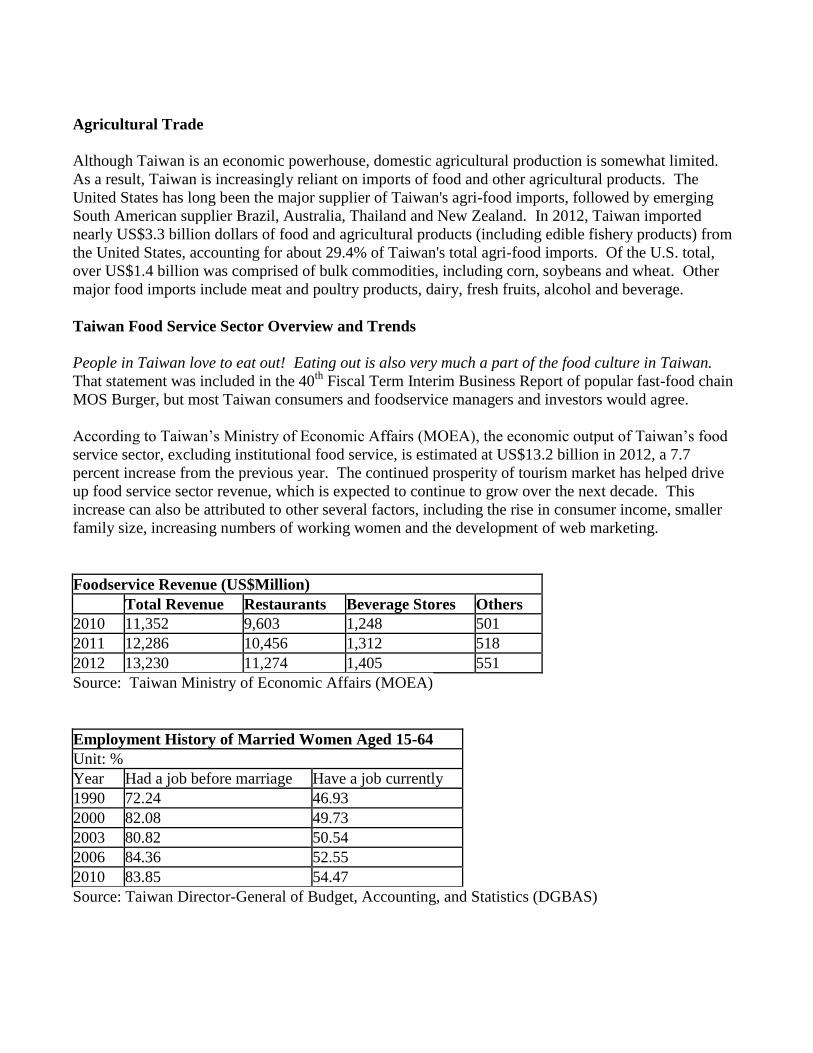
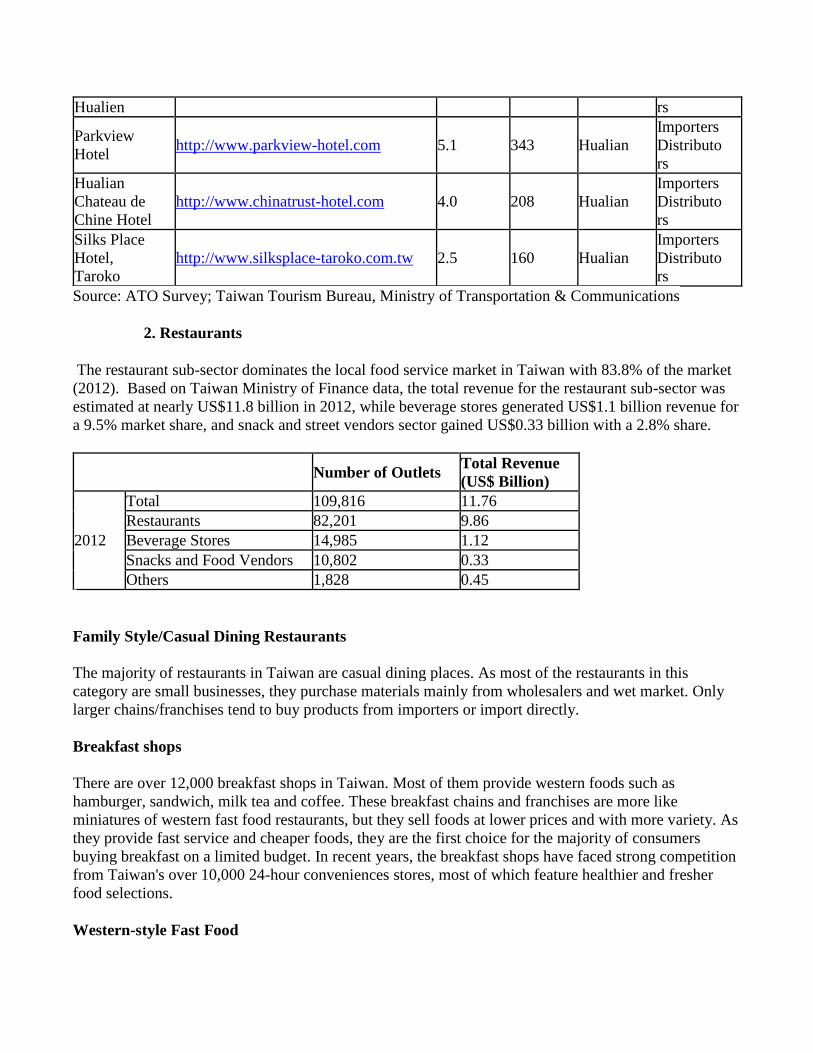
Foodservice Revenue (US$Million)

Total Revenue Restaurants Beverage Stores Others

2010 11,352 9,603 1,248 501

2011 12,286 10,456 1,312 518

2012 13,230 11,274 1,405 551

Source: Taiwan Ministry of Economic Affairs (MOEA)

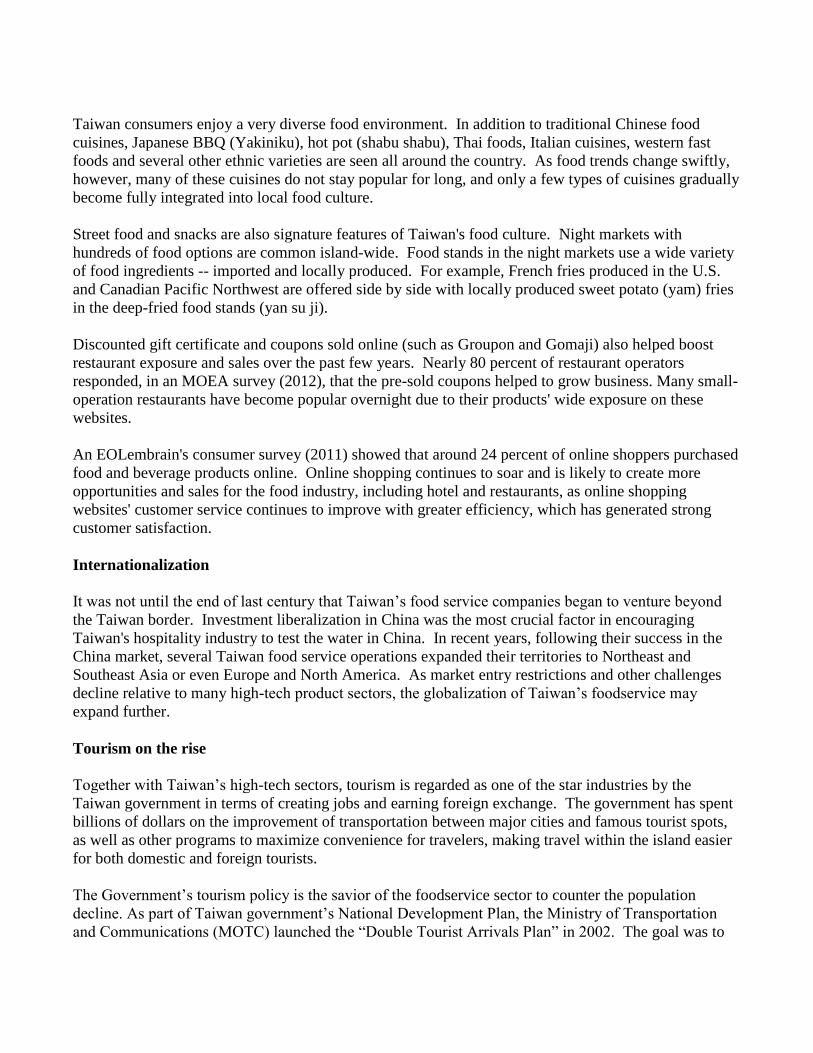
Employment History of Married Women Aged 15-64

Unit: %

Year Had a job before marriage Have a job currently

1990 72.24 46.93

2000 82.08 49.73

2003 80.82 50.54

2006 84.36 52.55

2010 83.85 54.47

Source: Taiwan Director-General of Budget, Accounting, and Statistics (DGBAS)

Taiwan consumers enjoy a very diverse food environment. In addition to traditional Chinese food

cuisines, Japanese BBQ (Yakiniku), hot pot (shabu shabu), Thai foods, Italian cuisines, western fast

foods and several other ethnic varieties are seen all around the country. As food trends change swiftly,

however, many of these cuisines do not stay popular for long, and only a few types of cuisines gradually

become fully integrated into local food culture.

Street food and snacks are also signature features of Taiwan's food culture. Night markets with

hundreds of food options are common island-wide. Food stands in the night markets use a wide variety

of food ingredients -- imported and locally produced. For example, French fries produced in the U.S.

and Canadian Pacific Northwest are offered side by side with locally produced sweet potato (yam) fries

in the deep-fried food stands (yan su ji).

Discounted gift certificate and coupons sold online (such as Groupon and Gomaji) also helped boost

restaurant exposure and sales over the past few years. Nearly 80 percent of restaurant operators

responded, in an MOEA survey (2012), that the pre-sold coupons helped to grow business. Many small-

operation restaurants have become popular overnight due to their products' wide exposure on these

websites.

An EOLembrain's consumer survey (2011) showed that around 24 percent of online shoppers purchased

food and beverage products online. Online shopping continues to soar and is likely to create more

opportunities and sales for the food industry, including hotel and restaurants, as online shopping

websites' customer service continues to improve with greater efficiency, which has generated strong

customer satisfaction.

Internationalization

It was not until the end of last century that Taiwan’s food service companies began to venture beyond

the Taiwan border. Investment liberalization in China was the most crucial factor in encouraging

Taiwan's hospitality industry to test the water in China. In recent years, following their success in the

China market, several Taiwan food service operations expanded their territories to Northeast and

Southeast Asia or even Europe and North America. As market entry restrictions and other challenges

decline relative to many high-tech product sectors, the globalization of Taiwan’s foodservice may

expand further.

Tourism on the rise

Together with Taiwan’s high-tech sectors, tourism is regarded as one of the star industries by the

Taiwan government in terms of creating jobs and earning foreign exchange. The government has spent

billions of dollars on the improvement of transportation between major cities and famous tourist spots,

as well as other programs to maximize convenience for travelers, making travel within the island easier

for both domestic and foreign tourists.

The Government’s tourism policy is the savior of the foodservice sector to counter the population

decline. As part of Taiwan government’s National Development Plan, the Ministry of Transportation

and Communications (MOTC) launched the “Double Tourist Arrivals Plan” in 2002. The goal was to

double the number of international tourist arrivals, which would deliver obvious benefits in creating

jobs and earning foreign exchange. Other than the neighboring countries such as South Korea, Japan

and China, North America and European countries are also Taiwan’s goal to open its tourism market.

According to statistics released by the MOTC, the number of foreign arrivals to Taiwan increased

significantly from 2004 to 2012, more than doubling to over 7.3 million, including 4.68 million tourists.

In 2012, cross-Strait air passenger traffic also surged by 29.6% to 8.46 million persons year on year,

reflecting larger numbers of tourists from China and increasing travel by Taiwan businessmen investing

in the mainland. The explosive growth of direct charter flights across the strait generated major profits

for Taiwan's airline companies and air-catering businesses, which had seen sluggish sales for several

years due to the completion of Taiwan's high speed rail connecting the major cities on the island.

MOTC statistics also show that in 2008 spending by foreign tourists exceeded the total tourism

expenditures of domestic tourists. A 2012 Taiwan Tourism Bureau survey indicated that food and

beverage expenditure accounted for 13.2% of foreign tourists' (non-business visitors) total expenditures

in Taiwan, generating over US$1.5 billion in income for the local food service industry.

Foodservice-Retail Marketing Alliance

With one store per 2,300 people, Taiwan has the highest convenience stores density in the world.

Taking this advantage, the foodservice operations started to work with convenience store chains to

provide oven-prepared, microwavable meals, bakery products and other processed food products via

these retail channels’ express delivery services. On the other hand, convenience store chains also

welcome this win-win cooperation which generates extra income.

Convenience Store Transformation

Convenience stores in Taiwan have become even more convenient than a few years ago. With the 24-

hour operation, when grocery and other retail stores are closed, consumers are able to get all kinds of

services they need. Starting approximately three years ago, 7-11 in Taiwan renovated some of its stores

to provide seating place for its customers. Consumers in a hurry can simply sit down in the stores to

enjoy the microwaved meals and freshly brewed coffee. This transformation has made 7-11 replace

McDonald to become the largest foodservice operation in Taiwan. According to 7-11, the company’s

revenue for “fresh food”, including lunch boxes and all kind of microwaveable foods, is estimated to

reach nearly US$1 billion in 2013. As of December 2013, 7-11 has 4,886 stores in Taiwan, accounting

for over 48 percent of market share. Other convenience store chains also duplicate the same model to

stay competitive.

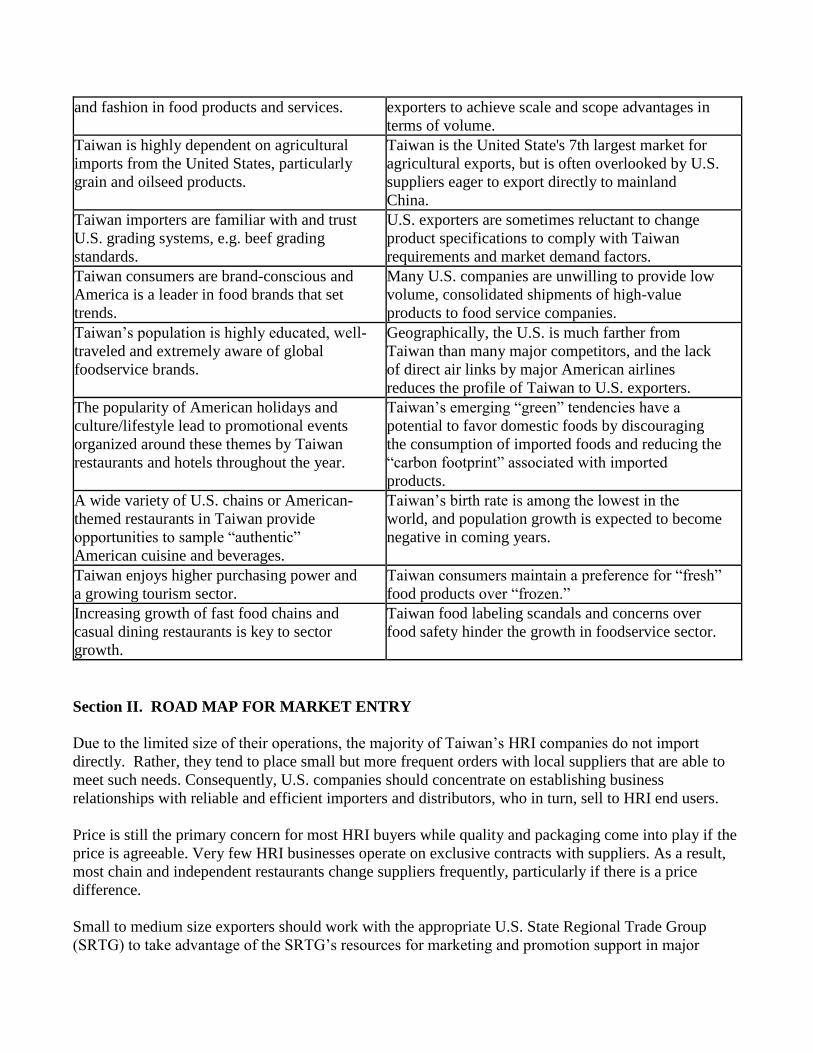
Advantages and Challenges for U.S. Exporters

Advantages Challenges

Taiwan consumers maintain a generally

positive perception of and consume many

U.S. food and agricultural products.

U.S. exporters face low price competitors in areas

such as juice and vegetables.

Consumers are strongly attracted by novelty High market fragmentation makes it hard for U.S.

and fashion in food products and services. exporters to achieve scale and scope advantages in

terms of volume.

Taiwan is highly dependent on agricultural

imports from the United States, particularly

grain and oilseed products.

Taiwan is the United State's 7th largest market for

agricultural exports, but is often overlooked by U.S.

suppliers eager to export directly to mainland

China.

Taiwan importers are familiar with and trust

U.S. grading systems, e.g. beef grading

standards.

U.S. exporters are sometimes reluctant to change

product specifications to comply with Taiwan

requirements and market demand factors.

Taiwan consumers are brand-conscious and

America is a leader in food brands that set

trends.

Many U.S. companies are unwilling to provide low

volume, consolidated shipments of high-value

products to food service companies.

Taiwan’s population is highly educated, well-

traveled and extremely aware of global

foodservice brands.

Geographically, the U.S. is much farther from

Taiwan than many major competitors, and the lack

of direct air links by major American airlines

reduces the profile of Taiwan to U.S. exporters.

The popularity of American holidays and

culture/lifestyle lead to promotional events

organized around these themes by Taiwan

restaurants and hotels throughout the year.

Taiwan’s emerging “green” tendencies have a

potential to favor domestic foods by discouraging

the consumption of imported foods and reducing the

“carbon footprint” associated with imported

products.

A wide variety of U.S. chains or American-

themed restaurants in Taiwan provide

opportunities to sample “authentic”

American cuisine and beverages.

Taiwan’s birth rate is among the lowest in the

world, and population growth is expected to become

negative in coming years.

Taiwan enjoys higher purchasing power and

a growing tourism sector.

Taiwan consumers maintain a preference for “fresh”

food products over “frozen.”

Increasing growth of fast food chains and

casual dining restaurants is key to sector

growth.

Taiwan food labeling scandals and concerns over

food safety hinder the growth in foodservice sector.

Section II. ROAD MAP FOR MARKET ENTRY

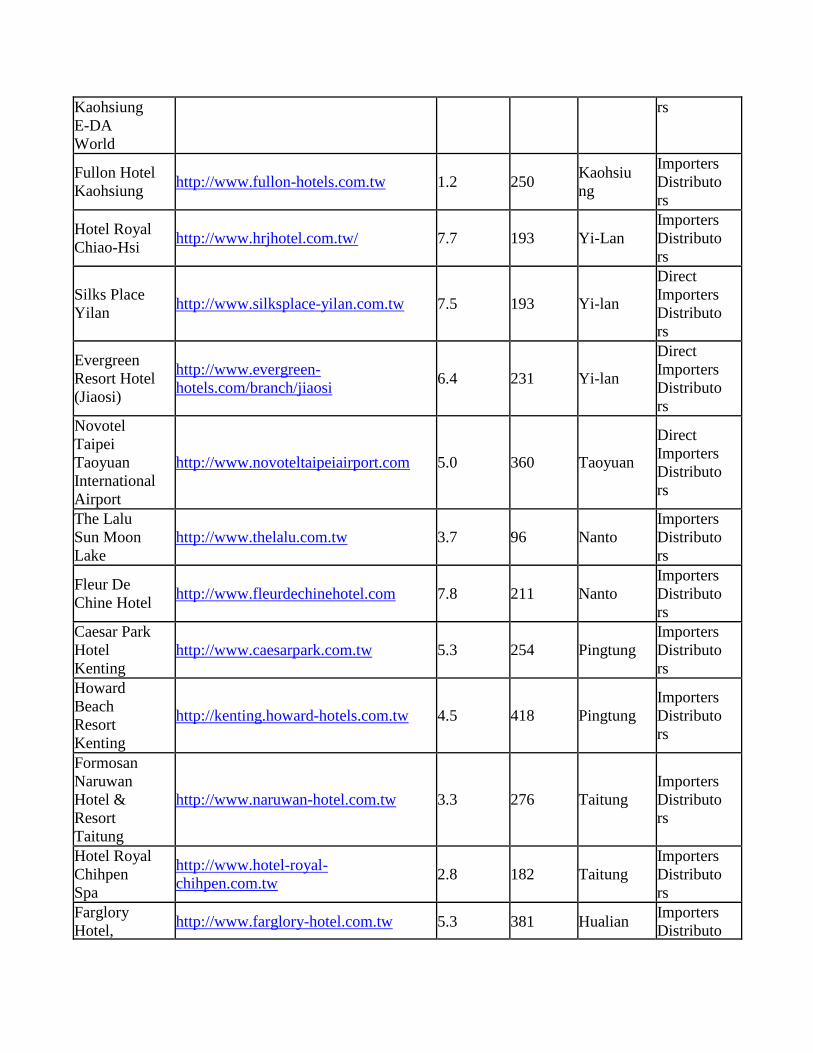
Due to the limited size of their operations, the majority of Taiwan’s HRI companies do not import

directly. Rather, they tend to place small but more frequent orders with local suppliers that are able to

meet such needs. Consequently, U.S. companies should concentrate on establishing business

relationships with reliable and efficient importers and distributors, who in turn, sell to HRI end users.

Price is still the primary concern for most HRI buyers while quality and packaging come into play if the

price is agreeable. Very few HRI businesses operate on exclusive contracts with suppliers. As a result,

most chain and independent restaurants change suppliers frequently, particularly if there is a price

difference.

Small to medium size exporters should work with the appropriate U.S. State Regional Trade Group

(SRTG) to take advantage of the SRTG’s resources for marketing and promotion support in major

export markets. The four SRTGs are non-profit trade development organizations that help U.S. food

producers, processors and exporters sell their products overseas. They are jointly funded by USDA's

Foreign Agricultural Service (FAS), the individual state departments of agriculture and private

industry. The SRTGs provide export assistance to companies located in their geographic region through

a variety of export programs and integrated marketing services. To learn more services available from

the SRTGs, find the SRTG for your geographic region in the list below and visit the website.

Western U.S. Agricultural Trade Association (WUSATA)

Southern U.S. Trade Association (SUSTA)

Food Export-Midwest (previously named MIATCO) (Food Export)

Food Export-Northeast (Previously named Food Export USA) (Food Export)

Market Structure

The majority of HRI companies in Taiwan purchase most of their food products from importers,

distributors, wholesalers, regional wholesale markets, wet markets, and supermarkets/hypermarkets,

depending on the type of food item. Imported fresh items such as produce, fish/seafood and beef, are

usually purchased and delivered directly from importers or through distributors or wholesalers.

Institutional users buy more products from local distributors or import directly. A recent trend is that

retail outlets such as Costco are frequented by many small food service/HRI operators to buy items in

quantity at the lowest possible cost, thereby avoiding the hassle of trying to source small volumes via

traditional import channels.

Food and beverage managers and executive chefs at international hotels are the key persons who decide

which items are purchased. The purchasing department procures various food ingredients based on the

list that F&B section provides. Hotels, especially those that employ foreign chefs or offer authentic

foreign cuisines, and other high-end family style restaurants typically use more imported items from

importers or wholesalers/distributors.

Western and local fast food restaurant chains usually have their own distribution centers or they contract

with an independent distribution center to purchase, partly process and deliver the daily needs to each

outlet island-wide. Fast food chains also maintain their own R&D team or work closely with one or

more contracted regional catering service(s) to develop and frequently renew menus to meet consumers’

demand.

Medium-level family style chain restaurants generally maintain a centralized purchasing department and

a centralized kitchen as well. The centralized kitchen prepares meals and delivers the foods to all

outlets of the restaurant chain.

Other smaller-scale drinking and eating establishments purchase the majority of their daily needs from

wholesalers, regional wholesale markets or wet markets.

Sub-Sector Profiles:

1. Hotels and Resorts

Socializing in hotel restaurants has been a popular practice in Taiwan. As a result, hotel restaurants

have become an important dollar earner for Taiwan’s international hotels, accounting for 51 percent of

total operating income (Source: Taiwan Tourism Bureau 2012 data). In 2012, in terms of F & B income

generated by hotel restaurants, the “Grand Formosa Regent Hotel Taipei” topped the list with US$50.6

million, followed by the “Sheraton Taipei” (US$46.3 million), the Ambassador Hotel (US$32.3

million), and the “Grand Hyatt Taipei” (US$29.3 million).

Taiwanese people often entertain their business counterparts, friends and relatives in restaurants,

especially on special occasions such as weddings/engagements, birthdays, Mother’s Day, “Honorary

Banquets in Praise of Teachers” and Lunar year-end parties hosted by company management. Food

served at these occasions tends to be either Western-style buffets or Chinese-style food banquets. In

addition, holiday celebrations are becoming more and more commercialized, especially western

holidays such as Christmas, Thanksgiving, Independence Day (American Week Food Promotions),

Oktoberfest and Valentine's Day. Taiwan’s hotel restaurants use these occasions to aggressively

promote set menus, offering excellent opportunities to promote American foods and beverages. U.S.

companies with products used principally in the HRI sector should consider how to take advantage of

these promotional opportunities by developing recipes, special menus or merchandise to help draw in

the different group.

In addition to the general food service business, hotels in Taiwan have also focused in recent years on

specific gift food packages for various festivals, such as moon cake gift packs for the Moon Festival,

chocolate gift packs for Valentines’ Day and turkey hampers for Thanksgiving. The development of

domestic courier services is also credited for the rapid growth of the gift-pack market.

Resorts in Taiwan, classified by areas of focus, fall primarily into the categories of hot spring towns,

scenic areas, cultural sites and amusements parks. With the completion of the freeway system

connecting metropolitan Taipei and Taiwan’s east coast, many real estate developers have built or are

building high end resorts in major hot spring towns and scenic spots in this area. As of December 2013,

fifteen resorts and spas with over 3,300 rooms were under construction in east coast cities. Most of the

resorts manage the food venues themselves and purchase primarily through importers and distributors.

New Resorts Under Construction on the East Coast of Taiwan

Name Number of

Rooms

Estimated Date of

Completion

Estimated Capital

(US$Mil)

Spring Park Jiaoshi Villa

Resort 84 01/30/2016 37

Shangrila Resort 146 12/31/2016 43

Sheraton Yilan Resort 193 12/31/2015 59

The Report Dancewoods 105 01/31/2015 46

Nature Beauty Cenesis

Resort 96 03/05/2015 48

Jiaosi Kilin Hotel 168 03/01/2016 47

Green Garden Hotel and

Spa 218 12/31/2016 33

Cosmos Spring Resort -

Ruisui 198 12/31/2015 49

Grand Green Island Resort 809 12/30/2016 165

LM Hot Spring Resort 192 12/31/2017 43

Castle Hotel 146 12/31/2015 37

Sen Chih Feng Chihpen

Resort 135 N/A 24

Huang family hotel 172 12/01/2014 12

Papago Resort 402 12/31/2017 40

Hua Lien Hotel 260 12/29/2017 36

Source: Taiwan Tourism Bureau

Major 4- & 5-star Hotels, Resorts, and Spas in Taiwan

Hotel/Resor

t Name Website

F & B

Sales

2012

(US$Mi

l)

Numb

er of

Rooms

Locatio

n

Purchasi

ng

Agent(s)

The Regent

Taipei http://www.grandformosa.com.tw 49.1 538 Taipei

Direct

Importers

Distributo

rs

Sheraton

Taipei Hotel http://www.sheraton-taipei.com 45.0 688 Taipei

Importers

Distributo

rs

Grand Hyatt

Taipei http://taipei.grand.hyatt.com 32.8 401 Taipei

Direct

Importers

Distributo

rs

The

Ambassador

Hotel

http://www.ambassadorhotel.com.tw 31.4 422 Taipei

Direct

Importers

Distributo

rs

Far Eastern

Plaza Hotel

(Taipei)

http://www.feph.com.tw 25.5 420 Taipei

Importers

Distributo

rs

The Westin

Taipei http://www.westin.com.tw 22.6 288 Taipei

Importers

Distributo

rs

Le Meridien http://www.lemeridien-taipei.com/ 25.0 160 Taipei Importers

Taipei Hotel Distributo

rs

The Grand

Hotel http://www.grand-hotel.org 20.3 489 Taipei

Importers

Distributo

rs

Howard

Plaza Hotel http://www.howard-hotels.com.tw 18.1 606 Taipei

Importers

Distributo

rs

W Taipei http://www.wtaipei.com/zh 25 405 Taipei

Importers

Distributo

rs

The

Sherwood

Hotel Taipei

http://www.sherwood.com.tw 11.4 343 Taipei

Direct

Importers

Distributo

rs

Palais De

Chine Hotel

Taipei

http://www.palaisdechinehotel.com/z

h-tw/

14.6 286 Taipei

Importers

Distributo

rs

Hotel Royal

Taipei http://www.royal-taipei.com.tw 7.8 202 Taipei

Importers

Distributo

rs

The Landis

Taipei Hotel

http://taipei.landishotelsresorts.com/c

hinese-trad/

7.5 209 Taipei

Importers

Distributo

rs

Imperial

Hotel Taipei http://www.imperialhotel.com.tw 5.2 326 Taipei

Importers

Distributo

rs

The Fullon

Hotel Taipei http://www.fullon-hotels.com.tw 5.4 120 Taipei

Importers

Distributo

rs

Radium-

Kagaya http://www.kagaya.com.tw 4.1 91 Taipei

Importers

Distributo

rs

Fullon Hotel

Danshuei

Fishermen's

Wharf

http://fishermen-wharf.fullon-

hotels.com.tw/

7.1 198 Taipei

Importers

Distributo

rs

Hotel

Landis

China

Yangmingsh

an

http://yangmingshan.landishotelsreso

rts.com

0.9 47 Taipei

Importers

Distributo

rs

The

Ambassador

Hotel

http://www.ambassadorhotel.com.tw 11.3 257 Hsinchu

Importers

Distributo

rs

Hsinchu

Sheraton

Hsinchu

Hotel

http://www.sheraton-hsinchu.com/ 12.7 386 Hsinchu

Importers

Distributo

rs

Hotel Royal

Hsinchu http://www.royal-hsinchu.com.tw 4.2 208 Hsinchu

Importers

Distributo

rs

Evergreen

Laurel Hotel

(Taichung)

http://www.evergreen-hotels.com 9.7 354 Taichun

g

Direct

Importers

Distributo

rs

The

Splendor

Hotel

http://www.splendor-

taichung.com.tw

8.6 222 Taichun

g

Importers

Distributo

rs

Howard

Prince Hotel

Taichung

http://www.howard-hotels.com.tw 5.6 155 Taichun

g

Importers

Distributo

rs

Windsor

Hotel http://www.windsortaiwan.com 9.3 149

Taichun

g

Importers

Distributo

rs

Tayih

Landis

Tainan

http://www.tayihlandis.com.tw 10 315 Tainan

Importers

Distributo

rs

Shangri-La's

Far Eastern

Plaza Hotel,

Tainan

http://www.shangri-la.com.tw 9.8 333 Tainan

Importers

Distributo

rs

Grand Hi-

Lai Hotel http://www.grand-hilai.com.tw 25.2 540

Kaohsiu

ng

Importers

Distributo

rs

85 Sky

Tower Hotel

http://www.85sky-

tower.com/index_tw.php?language=_

tw

14.2 585 Kaohsiu

ng

Importers

Distributo

rs

The

Ambassador

Hotel

Kaohsiung

http://www.ambassadorhotel.com.tw 12.2 453 Kaohsiu

ng

Direct

Importers

Distributo

rs

Grand Hotel

Kaohsiung http://www.grand-hotel.org 4.4 107

Kaohsiu

ng

Importers

Distributo

rs

Howard

Plaza Hotel

Kaohsiung

http://www.howard-hotels.com.tw 5.9 283 Kaohsiu

ng

Importers

Distributo

rs

Crowne

Plaza

http://www.cp-edaworld.com 12 656 Kaohsiu

ng

Importers

Distributo

Kaohsiung

E-DA

World

rs

Fullon Hotel

Kaohsiung http://www.fullon-hotels.com.tw 1.2 250

Kaohsiu

ng

Importers

Distributo

rs

Hotel Royal

Chiao-Hsi http://www.hrjhotel.com.tw/ 7.7 193 Yi-Lan

Importers

Distributo

rs

Silks Place

Yilan http://www.silksplace-yilan.com.tw 7.5 193 Yi-lan

Direct

Importers

Distributo

rs

Evergreen

Resort Hotel

(Jiaosi)

http://www.evergreen-

hotels.com/branch/jiaosi

6.4 231 Yi-lan

Direct

Importers

Distributo

rs

Novotel

Taipei

Taoyuan

International

Airport

http://www.novoteltaipeiairport.com 5.0 360 Taoyuan

Direct

Importers

Distributo

rs

The Lalu

Sun Moon

Lake

http://www.thelalu.com.tw 3.7 96 Nanto

Importers

Distributo

rs

Fleur De

Chine Hotel http://www.fleurdechinehotel.com 7.8 211 Nanto

Importers

Distributo

rs

Caesar Park

Hotel

Kenting

http://www.caesarpark.com.tw 5.3 254 Pingtung

Importers

Distributo

rs

Howard

Beach

Resort

Kenting

http://kenting.howard-hotels.com.tw 4.5 418 Pingtung

Importers

Distributo

rs

Formosan

Naruwan

Hotel &

Resort

Taitung

http://www.naruwan-hotel.com.tw 3.3 276 Taitung

Importers

Distributo

rs

Hotel Royal

Chihpen

Spa

http://www.hotel-royal-

chihpen.com.tw

2.8 182 Taitung

Importers

Distributo

rs

Farglory

Hotel, http://www.farglory-hotel.com.tw 5.3 381 Hualian

Importers

Distributo

Hualien rs

Parkview

Hotel http://www.parkview-hotel.com 5.1 343 Hualian

Importers

Distributo

rs

Hualian

Chateau de

Chine Hotel

http://www.chinatrust-hotel.com 4.0 208 Hualian

Importers

Distributo

rs

Silks Place

Hotel,

Taroko

http://www.silksplace-taroko.com.tw 2.5 160 Hualian

Importers

Distributo

rs

Source: ATO Survey; Taiwan Tourism Bureau, Ministry of Transportation & Communications

2. Restaurants

The restaurant sub-sector dominates the local food service market in Taiwan with 83.8% of the market

(2012). Based on Taiwan Ministry of Finance data, the total revenue for the restaurant sub-sector was

estimated at nearly US$11.8 billion in 2012, while beverage stores generated US$1.1 billion revenue for

a 9.5% market share, and snack and street vendors sector gained US$0.33 billion with a 2.8% share.

Number of Outlets Total Revenue

(US$ Billion)

2012

Total 109,816 11.76

Restaurants 82,201 9.86

Beverage Stores 14,985 1.12

Snacks and Food Vendors 10,802 0.33

Others 1,828 0.45

Family Style/Casual Dining Restaurants

The majority of restaurants in Taiwan are casual dining places. As most of the restaurants in this

category are small businesses, they purchase materials mainly from wholesalers and wet market. Only

larger chains/franchises tend to buy products from importers or import directly.

Breakfast shops

There are over 12,000 breakfast shops in Taiwan. Most of them provide western foods such as

hamburger, sandwich, milk tea and coffee. These breakfast chains and franchises are more like

miniatures of western fast food restaurants, but they sell foods at lower prices and with more variety. As

they provide fast service and cheaper foods, they are the first choice for the majority of consumers

buying breakfast on a limited budget. In recent years, the breakfast shops have faced strong competition

from Taiwan's over 10,000 24-hour conveniences stores, most of which feature healthier and fresher

food selections.

Western-style Fast Food

McDonald's, which opened its first outlet in 1984, remains the largest fast food chain in Taiwan with

388 stores (as of September 2012) island-wide. Competition among fast-food restaurants is becoming

more intense since Japan-based MOS Burger started its more aggressive expansion in foreign markets.

Among MOS burger's 265 outlets outside of Japan, as of September 2011, 202 outlets were in Taiwan.

MOS Burger's Taiwan franchisee, An Shin Food Services Inc., announced that the company’s goal is to

open as many as 250 outlets in Taiwan by the end of 2013 and 350 outlets within the next 3-5 years.

Facing growing competition, McDonald’s also announced plans to increase the franchising ratio to 30

percent as it increases the number of outlets to 500, while Kentucky Fried Chicken aims to open 30-50

new restaurants by 2014.

New products, such as coffee latte, bagels and rice burgers, were introduced into the Taiwan market,

leading to even greater diversity in consumer choices and expectations. In addition, promotions offered

by fast food establishments, including price-off, giveaways, and volume discounts, are increasingly

common.

Chinese-style Fast Food

As the entry barrier for Chinese-style fast food chains and franchisers is low, they have sprung up all

over Taiwan in the past decade. They have gained popularity with all ages of consumers, specializing in

dumplings, meat ball and sour-spicy soups, beef noodles and Chinese stews. Greater competition among

these fast food chains, combined with new competition from convenience store that are expanding into

prepared meal service, have led to increased pressure on margins in this segment.

Low labor costs and the fact that many chains have the ability to provide standardized products, have

made the outlet numbers of these chains grow faster than Western fast food restaurants in recent years,

which was contrary to industry experts’ expectations. Though the expansion of Chinese-style fast food

restaurants has slowed, they are still the major competitors for Western-style fast food chains.

Department Store Food Courts & Restaurants

Typically, major department stores in Taiwan have several sit-down restaurants, as well as a full or at

least part of a floor devoted to a food court. Revenues from restaurants and food courts represent

around 30% of the total department store revenue. Shin Kong Mitsukoshi, Far Eastern Department

Store, and Sogo Department Store (also managed by Far Eastern) are the major players.

Coffee Shop Chains

Coffee consumption in Taiwan has seen rapid growth in recent years. The market size is currently

estimated at over US$1 billion. Coffee import volume, including raw and roasted coffee, tripled in the

past decade, increasing from 6,844 metric tons (MT) in 2001 to 18,448 MT in 2012.

Current annual per capita coffee consumption in Taiwan is 110-125 cups according to industry

estimates. The market is still relatively underdeveloped compared to consumption in western countries

(300-400 cups) or even in the neighboring countries such as Japan and Korea (150-200 cups), so there is

room for further expansion.

Competition in the Taiwan coffee market segment intensified after chain convenience stores entered the

game by offering freshly-brewed coffee. Younger generations, especially white-collar workers, are the

major consumers of freshly brewed coffee. Drinking coffee in a coffee shop symbolizes fashion, taste,

and a stylish lifestyle, and it has become a social stimulant for conversation, logging onto a social web,

or business meetings. Hence, more and more younger people are seen drinking coffee in a variety of

circumstances.

Most coffee shops also provide sandwiches, salads, cakes and pastries prepared by catering companies

or other food processors. Some domestic and Japanese style coffee shops also offer freshly made

sandwiches and hot meals, which are shipped frozen from their food processors for reheating at the

outlets. Many coffee chains import coffee beans directly but purchase other food materials from

importers, wholesalers, and distributors. The significant growth of the coffee shope segment in recent

years in Taiwan has created a niche market for imported candy/chocolate and cookie products. Many

coffee shops, such as Starbucks, Dante, 85°C Coffee, Is Coffee and Barista, not only sell coffee and

light meals, but also sell candy/chocolate/cookie products with small and attractive packaging.

Latte (espresso with steamed milk) and Americano (adding water to espresso) are the most popular

orders in coffee shops. The growing demand for cafe latte has also stimulated demand for milk (fresh or

powdered).

Starting its first store in 2009, Cama Café, a coffee chain featuring freshly roasted beans, created a new

trend in Taiwan’s coffee industry. With average store size of 260 square feet, only one-fifth of

Starbucks, the coffee chain successfully overtook almost all coffee chains in terms of profit per unit.

Taiwan Import Statistics

Commodity: 0901, Coffee, Whether Or Not Roasted Or Decaffeinated; Coffee Husks And Skins;

Coffee Substitutes Containing Coffee

Calendar Year: 2007 - 2011, Year To Date: 12/2011 & 12/2012

Quantity

Partner

Country

Uni

t

Calendar Year Year To Date

2007 2008 2009 2010 2011 12/2011

12/201

2

%Chang

e

World T

13,87

2

11,60

0

13,39

5

17,88

7

17,68

5 17,685 18,448 4

Indonesia T 5,285 2,803 5,189 5,694 5,092 5,092 4,339 -15

Brazil T 2,319 1,720 2,183 3,265 3,654 3,654 3,783 4

Vietnam T 1,580 1,186 1,076 1,760 1,644 1,644 2,094 27

Guatemal

a T 1,412 1,646 690 1,918 1,638 1,638 1,606 -2

United

States T 687 824 875 1,024 1,265 1,265 1,292 2

Colombia T 525 683 641 739 1,020 1,020 942 -8

Ethiopia T 301 536 315 529 661 661 594 -10

India T 244 260 100 186 441 441 406 -8

Honduras T 309 375 497 532 363 363 585 61

Italy T 305 369 279 291 338 338 413 22

Source: Global Trade Atlas

Soft Drink Bars

Soft drink bars are seen on every corner of Taiwan's streets. This type of soft drink shop developed

rapidly after "bubble tea" gained popularity in the 1980s. "Pearl Milk Tea", which contains small chewy

balls made of tapioca starch, is the signature drink and the most popular order in many of the soft drink

bars.

In addition to Pearl Milk Tea, there are many other variants of soft drinks. Most of them are tea-or fruit-

based ice-blended and smoothie versions. Syrups, pulp, black and green tea, instant coffee, concentrated

fruit juice, creamer, and milk, which are purchased mostly from importers and distributors, are the basic

materials used in these shops.

Most of the bars only provide to-go service, and the shops might be as small as 100 square feet. Soft

drink stands are often seen in the night markets or near schools.

Major Restaurant Company Profiles

a. Restaurants

Company Name

Sales

($Mil) /

2012

Outlet Name, type, Number

of Outlet (Taiwan only) Location

Purchasing

Agents

Noble Family Co.,

Ltd NA

Noble Family Steakhouse,

(steakhouse) (120) National

Direct

Importers

Bullfight Group

Taiwan Inc. NA

Bullfight (steakhouse,

family style) (33) National

Direct

Importers

WowPrime Corp.

410

(public

data)

Wang Steak (steakhouse)

(14) National

Direct

Importers

Tasty (family style) (37) National Direct

Importers

Tokiya (family style) (31) National Direct

Importers

Yuanshao (Japanese BBQ)

(20) National

Direct

Importers

Giguo (Hot Pot) (28) National Direct

Importers

Ikki (Japanese family style)

(11) National

Direct

Importers

Chamonix (Teppenyaki) National Direct

(13) Importers

Pintian Farm (family style)

(22) National

Direct

Importers

12 Sabu (hot pot) (30) National Direct

Importers

Su Food (organic/healthy

food) (13) National

Direct

Importers

Famonn Coffee (coffee

shop) (7) National

Importers

Distributors

Skylark Co. NA

Skylark (family style) (13) North/Central Importers

Distributors

Grazie (Italian) (18) Importers

Distributors

Shin Yeh Co., Ltd. NA Shin Yeh (Taiwanese /

family style) (13) Taipei

Importers

Distributors

Ding Tai Fung NA Ding Tai Feng (Chinese)

(7) North/Central

Importers

Distributors

T.G.I. Friday's NA T.G.I. Friday's (American

style) (17) National

Director

Importers

Distributors

Hasmore Ltd. Co. NA

Swensen's (American style)

(6) National

Director

Importers

Distributors

Ruth's Chris (steakhouse)

(3) National

Macaroni Grill (American

style) (1) Taipei

Chili's (American style) (4) National

Trader Vic's

(western/Asian) (1) Taipei

Pâtisserie Sadaharu Aoki

Paris (bakery/cafe) (2) Taipei

Royal Host NA Royal Host (western/family

style) (14) National

Importers

Distributors

McDonald's

Restaurants (Taiwan)

Co., Ltd.

NA McDonald's (fast food)

(361) National

Direct

Importers

Distributors

Great Wall Enterprise

Co., Ltd. NA

Burger King (fast food)

(41) National

Direct

Importers

Distributors

Saboten Japanese

Restaurant (Japanese family

style) (16)

National

Direct

Importers

Distributors

Jardin Food Services

(Taiwan) Co., Ltd. NA

Kentucy Fried Chicken (fast

food) (129) National

Direct

Importers

Distributors

NA Pizza Hut (Pizza) (162) National

Direct

Importers

Distributors

An-Shin Food

Service Co., Ltd.

143

(public

data)

MOS Burger (fast food)

(219) National

Direct

Importers

Distributors

Eight Way Food Co.,

Ltd. NA

8 Way Dumplings

(Chinese/fast food) (450) National

Importers

Distributors

Long Mao Co., Ltd. NA Oversea Dragon (Chinese

/fast food) (190) National

Importers

Distributors

Mercuries &

Associates, Ltd. NA

Mercuries Food Chain

(Chinese/fast food) (151) National

Direct

Importers

Distributors

Napoli Pizza (fast

food/pizza) (89) National

Direct

Importers

Distributors

Pizzavest Co., Ltd.

(Regent Group) NA

Dominos Pizza (pizza)

(140) National

Direct

Importers

Distributors

Sushi Express CO.,

Ltd.

NA Sushi Express

(Japanese/Sushi) (150) National

Importers

Distributors

NA Sushi Take-out (Japanese

/Sushi) (25) North

Importers

Distributors

NA Dingshi 8 (family style)

(24) North

Importers

Distributors

NA Sushi Express Hot Pot

(family style/hot pot) (7) North/Central

Importers

Distributors

Yoshinoya NA Yoshinoya (Japanese beef

rice/fast food) (53) National

Direct

Importers

Distributors

Wang Zhang Fa

Industry Ltd. NA Gaibom (Chinese) (112) National

Direct

Importers

Distributors

Ji-Shang Industry

Co., Ltd. NA Wu Tao (Chinese) (232) National

Importers

Distributors

HuMax Taiwan Co,

Ltd. NA

Mo Mo Paradise

(Japanese)(10) National

Direct

Importers

Distributors

Bellini Pasta Pasta (5) North Importers

Distributors

Bellini Caffe (Italian) (1) North Importers

Distributors

Hwa Da Industry Co.,

Ltd. NA

YaYan Yakiniku Restaurant

(Japanese) (39) National

Direct

Importers

Distributors

Top of Form

Tonkatsu Co., Ltd. NA Tonkatsu (Japanese) (32) National

Importers

Distributors

Cashcity Foodservice

Co., Ltd. NA

Cashcity Shabu Shabu

(Japanese) (138) National

Direct

Importers

Distributors

Shuh Sen Co., Ltd. NA My Home Steak

(Steakhouse) (59) National

Direct

Importers

Distributors

TTFB Company

Limited

64

(public

data)

Thai Town Cuisine (Thai

Food) (25) National

Direct

Importers

Distributors

Very Thai (Thai Food) (5) North/South

Direct

Importers

Distributors

1010 Shang (Chinese) (6) National

Direct

Importers

Distributors

Subway Taiwan

Development NA Subway (Western) (135) National

Direct

Importers

Distributors

Source: ATO Survey

b. Breakfast shop chains and franchises

Company Name

Sales

($Mil)/

2012

Outlet Name, type,

Number of Outlet

(Taiwan only)

Location Purchasing

Agents

Hong Ya International

Enterprise Co. Ltd. NA Hong Ya Burger (800) National

Direct

Importers

Distributors

Sun Spark Group NA Laya Burger (604) National

Direct

Importers

Distributors

Super-Mill Group Co. Ltd NA My Warm Day (1509) National

Direct

Importers

Distributors

Ju-Lin Food Enterprise

Co., Ltd. NA Ju-Lin Mei-Er-Mei (999) National

Direct

Importers

Distributors

Good Morning Beauty

Castle Enterprise Co., Ltd. NA

Good Morning Beauty

Castle (1,000) National

Direct

Importers

Distributors

Chiao Pei International

Co., Ltd. NA Eastern Beauty (950) National

Direct

Importers

Distributors

Mei & Mei Foodservice

Chain Group NA Mei & Mei (2,915) National

Direct

Importers

Distributors

Source: ATO Survey

c. Coffee, Beverage & Dessert (non-bakery) Shops

Company Name

Sales

($Mil) /

2012

Outlet Name, type,

Number of Outlet

(Taiwan only)

Location Purchasing

Agents

Gourmet Master Co.,

Ltd.

450

(public

data)

85°C (coffee) (337) National

Direct

Importers

Distributors

Uni-President

Starbucks Coffee

Company

NA Starbucks (coffee)

(260) National

Direct

Importers

Distributors

Dante Coffee and

Foods Co., Ltd. NA Dante (coffee) (127) National

Direct

Importers

Distributors

ECoffee Co., Ltd. NA ecoffee (coffee) (119) National

Direct

Importers

Distributors

Mr. Brown Coffee

Shop NA

Mr. Brown Coffee

(coffee) (59) North

Direct

Importers

Distributors

Ding-hao Acme Co.,

Ltd. NA IS (coffee) (21) North/Central

Direct

Importers

Distributors

Kohikan Corporate NA Kohikan (coffee) (17) North/Central

Direct

Importers

Distributors

Barista NA Barista Coffee (coffee)

(28) National

Direct

Importers

Distributors

Ikari Coffee Co., Ltd. NA Ikari (coffee) (71) North/Central/East

Direct

Importers

Distributors

Rose Republic

International Co., Ltd. NA

Rose House (tea and

coffee) (24) National

Direct

Importers

Distributors

TenRen Group (Ten

Ren Co., Ltd.) NA

Cha For Tea (Tea) (76-

-Tea Restaurant:11;

Tea Bar: 65)

National

Direct

Importers

Distributors

Tea Professional Intl NA Tea Professional (Tea National Direct

Chian Group Bar) (176) Importers

Distributors

Chuan Yi Tung

Business Co. Ltd. NA

Ching Shin Fu Chuan

(Tea Bar) (1,070) National

Direct

Importers

Distributors

Chatime Co., LTD. NA ChaTime (Tea Bar)

(550) National

Direct

Importers

Distributors

COMEBUY

Intermational Co.,Ltd NA

COMEBUY (Tea Bar)

(95) National

Direct

Importers

Distributors

Lien Fa International

Foodservice

Enterprise Co., Ltd.

NA Sharetea (Tea Bar)

(189) National

Direct

Importers

Distributors

Ding Tea Co., Ltd. NA Ding Tea (Tea Bar)

(118) National

Direct

Importers

Distributors

Presotea Co., Ltd. NA Presotea (Tea Bar)

(149) National

Direct

Importers

Distributors

Source: ATO Survey; company websites; Taiwan Chain and Franchise Annual Report

3. Institutional

With air traffic between Taiwan and mainland China increasing significantly, the air catering sector's

future is promising. School and military catering is stable but might face more challenges in the future

due to decreasing student numbers resulting from low birth rates and Taiwan's policy of drawing down

its military force. On the other hands, healthcare foodservice are powering the growth of the hospital

restaurants and cafeterias business by offering more varieties and more individualized, nutritious and

healthier meals.

Air Catering

Currently, Evergreen Sky Catering Corporation, China Pacific Catering Service, and the TransAsia

Airway Corporation dominate the local air catering market. Given strong competition within this

sector, these companies are aggressively expanding their catering business to include local convenience

stores, restaurants, coffee shops, schools, and hospitals. These airline flight kitchens purchase food

ingredients from local importers, manufacturers and wholesalers, but these companies also import

directly. The industry is widely expected to record continued growth over the next few years.

Schools

As of December 2012, there are 6,611 pre-school/kindergarten, 2,657 elementary and 740 junior high

schools, both public and private, in Taiwan. According to the Ministry of Education, all kindergartens,

elementary and junior high schools in Taiwan operate lunch meal programs. Over 90 percent of

students eat meals provided by school kitchens or school lunch program contractors, which means that

nearly 2.68 million students in Taiwan eat at school. The budget for a meal is about NT$45

(approximately US$1.5) per child. In terms of animal proteins, due mainly to cost concerns, beef is not

used as much as pork and chicken. Leafy vegetables and fresh fruits are preferred. Given the small

budget allocated for school meals, the use of U.S. products in this sector is limited, including frozen

chicken and pork, fresh fruits and root vegetables.

Food and food ingredients suppliers of the public school lunch programs are requested to provide

locally produced food products with Chinese Agricultural Standards (CAS) certifications to support

local productions.

Hospitals

As of 2012, there were 503 hospitals (including branches) registered in Taiwan with over one hundred

thousand beds. Major hospitals are located in big cities in the west coast like Taipei, Kaohsiung, and

Taichung. Most of the major hospitals have restaurants for visitors and separate restaurants or cafeterias

for employees and patients. Restaurants for visitors are normally operated by contractors, while meals

for employees and patients are typically planned by dietitians and prepared by hospital kitchens. Some

small-scale hospitals outsource their food service business to catering companies. Since most hospitals

run on a tight budget for food, U.S.-sourced food products are rarely specified. However, some niche

opportunities exist, with pureed foods for dietary needs of the elderly, frozen items like sheet cakes for

labor saving dessert items, and fresh low-cost fruits for patients.

Military

Taiwan has had mandatory military service for all males since 1949. Currently, the total number of

soldiers in Taiwan is around 275,000 with males between the ages of 20-35 subject to 12-month

mandatory military service. The Ministry of Defense plans to decrease the number of soldier to 215,500

by 2013. The number of soldiers will continue to decline after 2014 when Taiwan starts to recruit for an

all-volunteer professional force.

Each military base or unit manages most of its food purchases on a daily basis and buys fresh products

from wholesalers or wet markets. They are usually required to support locally produced products except

when local products are in short supply. Larger military bases started to outsource their food service

business to catering companies in 2013 and maintain very little personnel to prepare food for special

occasions.

Section III. COMPETITION

In 2012, Taiwan imported nearly US$11.10 billion of food and agricultural products (not including

seafood) from many different sources, of which US$3.27 billion (29.4%) was imported from the United

States. The United States was the number one agricultural supplier to Taiwan, followed by Brazil,

Australia and Thailand. Brazil is the United State's largest competitor in terms of soybean and corn.

Australia is the largest supplier of beef in terms of volume up to date while the U.S. supplies more beef

dollar-wise. Thailand was Taiwan's largest supplier for starches and sugar/sucrose products. New

Zealand ranked as the top supplier of dairy products, mutton and kiwi.

While maintaining its position as a substantial supplier of bulk commodities such as soybeans (49.21%)

and wheat (74%), the United States supplied 88% of poultry products, 94% of almonds and 94% of

walnuts in 2012.

The United States is also the top supplier of imported vegetable and fresh fruits: apples (46% or

US$164.5 million), cherries (60% or US$88 million), peaches (78% or US$41million) and fresh and

dried grapes (59% or US$38million).

Taiwan Agricultural Products Import Statistics

Product

Category

Total

Import

Value

2012

(US

$Mil)

Major

Supply

Sources and

Market

Share

Strengths of Key

Supply Countries

Advantages and

Disadvantages of Local

Suppliers

Total Food

and

Agricultural

Imports

11,108.4 1. USA –

29.4.0% 2. Brazil -

14.55%

3. Australia -

7.42%

4. Thailand –

5.76%

5. N. Zealand

-4.91%

6. China –

4.51%

7. Japan -

3.32%

8. Malaysia -

3.0%

9. Indonesia -

2.72%

10. Vietnam -

2.53%

South American

countries have become

major suppliers of bulk

commodities, wine,

dairy products, and fresh

fruits.

Taiwan's food self-

sufficiency rate is low at

31.7% (2010, COA

data) and relies heavily

on imports to meet

domestic demand.

Total Fish and

Seafood

Products

Imports

768.1 1. China –

14.71%

2. Norway –

11.58%

3. Vietnam -

8.70%

Chinese companies

mainly supply shrimp,

cuttlefish, and mollusk

while Norway is the

major supplier of salmon

and trout. U.S. is a

Taiwan produces more

seafood products than it

needs and only imports

those not available in the

region.

4. Thailand -

6.66%

10. USA –

3.29%

major supplier of fresh

and chilled/frozen

lobsters.

Bulk Commodity

Corn 1,415.6 1. Brazil -

50.17%

2. USA -

24.71% 3. S. Africa -

5.0%

4. Argentina -

3.7%

5. India -

2.6%

Brazil surpassed the

USA to become the

leading supplier of corn

in 2012.

Taiwan relies heavily on

corn imports.

Soybean 1,459.2 1. Brazil –

49.51%

2. USA -

49.21%

Both USA and Brazil

are the leading soybean

suppliers, but Brazil has

been more aggressive in

recent years.

Taiwan relies heavily on

soybean imports to meet

both feed and food

needs.

Wheat 498.3 1. USA –

73.47%

2. Australia -

21.16%

USA is the leading

supplier of wheat,

followed by Australia.

Taiwan has no

significant wheat

production.

Meat & Poultry

Beef and beef

offal

504.1 1. Australia -

46.29%

2. USA –

24.30% 3. N. Zealand

– 22.81%

Australia dominates

market for cheaper beef

cuts while the USA is

traditionally the largest

chilled beef supplier.

Taiwan's beef

production only

accounts for 5% of total

beef consumed on the

island.

Pork and pork

offal

96.2

1. Canada -

35.57%

2. USA -

32.40% 3.

Natherlands –

16.52%

4. Denmark-

9.53%

5. Hungary -

5.23%

Imports have occurred

only in response to

occasional short supplies

and high local pork

prices. U.S. exports

slumped due to the feed

additive - ractopamine

disputes.

Local pork dominates

the market.

Poultry

192.4 1. USA -

87.86% 2. Canada -

11.88%

Taiwan consumer's

preference for dark meat

provides opportunities

for western countries.

Local chicken dominates

the market.

USA products are

generally price

competitive.

Fish & Seafood

Fish Meat,

Frozen

66.0 1. India –

51.66%

2. Vietnam –

18.84%

3. China –

11.04%

4. USA –

6.61

Taiwan imports frozen

fish fillets (esp. cod and

pollack) and surimi for

further processing.

Taiwan produces more

seafood products than it

needs and only imports

those not available in the

region.

Rock Lobster

and Other Sea

Crawfish,

Live/Fresh

10.8 1. Indonesia –

58.3%

2. Philippines

– 12.91%

3. USA –

8.98%

Indonesia is the key

suppliers of live/fresh

lobsters.

Lobsters are not often

seen along Taiwan's

coastlines.

Rock Lobster,

Frozen

9.6 1. Cuba –

51.88

2. Australia -

15.89%

2. USA –

11.47%

Canada is the key

suppliers of frozen

lobsters.

Lobsters are not often

seen along Taiwan's

coastlines.

Dairy Products

Cheese

108.7 1. USA –

28.71 2. N. Zealand

- 22.77%

3. Australia –

17.67%

4. Argentina -

12.08%

The USA is becoming

more competitive in

cheese supply to Taiwan

and became the largest

supplier in 2012.

Local production is

limited.

Whey

15 1. USA -

39.43%

2. France -

25.43%

3. Poland -

7.55%

USA is the leading

supplier of whey

products.

Local production is

limited.

Butter 51.3 1. N. Zealand

– 56.91%

2. Australia –

13.64%

3. France -

10.61%

4. Argentina

New Zealand leads with

butter and several other

dairy products. France

supplies high-end

products.

Local production is

limited.

– 6.15%

5.

Netherlands –

4.00%

6. USA –

2.31%

Fresh Fruits

Apples, Fresh

164.5 1. USA -

45.94% 2. Chile -

27.27%

3. Japan -

14.78%

4. N Zealand

- 8.39%

USA leads with several

fresh fruits that have

limited local production,

including apples.

Chilean and New

Zealand apples gain

seasonal advantage.

Taiwan is a significant

producer of fresh

tropical fruits, and local

fruit production is very

high quality. Taiwan

only imports fruits

typically not produced

locally.

Cherries,

Fresh

88 1. USA -

60.03% 2. Chile -

19.77%

3. N. Zealand

- 8.72%

USA provides high

quality products.

Southern hemisphere

countries gain seasonal

advantages.

There is no local

production.

Peaches,

Fresh

40.9 1. USA-

77.73% 2. Chile -

17.93%

USA products are in

good quality and price

competitive.

Local products meet

about half of local

demand.

Table Grape,

Fresh

38.0 1. USA -

59.13% 2. Chile -

18.73%

3. South

Africa -

7.82%

USA supply good

quality fresh table grape.

Chile and South Africa

supply price competitive

products.

Local farmers produce

different grape varieties

- typically sweeter.

Plum, Fresh

10.6 1. USA -

80.85%

2. Chile -

19.15%

USA is the leading

supplier of plums.

Local products are

different varieties.

Oranges,

Fresh

10.2 1. USA -

58.07% 2. South

Africa –

32.73%

3. Australia -

9.07%

USA is the dominant

supplier of imported

fresh oranges while

South African became

more competitive in

2012.

Local products are

different varieties.

Fresh Vegetable

Broccoli and

cauliflower,

12.5 1. USA -

98.03%

USA is the major

supplier of imported

Local products dominate

the market.

fresh 2. Vietnam -

1.83%

broccoli and

cauliflowers.

Onions and

shallots, fresh

21 1. USA -

67.88% 2. Vietnam -

11.59%

3. New

Zealand –

11.23%

USA is the major

supplier of imported

onions.

Local production fulfills

around 60% of local

demand.

Lettuce, fresh 5 1. USA -

98.39%

USA supplies good

quality products with

competitive prices.

Local products are

different varieties and

generally of lower

quality.

Potatoes, fresh 7.83 1. USA -

96.53% 2. Australia -

3.47%

USA is the major

supplier of imported

potato products,

providing good quality

products with

competitive pricing.

Local products dominate

the market and are

different varieties.

Alcohol and Other Beverages

Wine

117 1. France -

57.03%

2. USA -

8.38% 3. Chile -

7.49%

4. Australia -

7.04%

5. Italy -

6.05%

6. Spain -

5.98%

7 Argentina -

2.59%

France dominates the

market, but new world

countries are gaining

traction due to

competitive pricing.

U.S. is the fifth largest

supplier by volume.

Local companies are not

able to produce good

quality wine.

Beer 158 1.

Netherlands -

63.35%

2. China -

14.74%

3. USA -

5.76% 4. Japan -

5.44%

The Netherlands and

China are aggressive

suppliers with many

promotions in

restaurants and bars.

Local beer brands are

most popular.

Other products

Coffee,

roasted, not

31.29 1. USA -

53.72%

USA supplies over half

of roasted coffee while

There is little local

production available.

decaf 2. Italy -

13.52%

3. Malaysia -

11.34%

Indonesia, Brazil and

other tropical countries

supply most of the non-

roasted coffee beans.

Mixes and

Dough

18.44 1. USA -

51.64% 2. Japan -

13.20%

USA dominates the

mixes and dough

market.

Taiwan imports most of

its bakery ingredients.

Sauces and

Preps

75 1. Japan -

55.33%

2. USA -

12.56% 3. China -

8.04%

4. Hong

Kong - 6.56%

Taiwan consumers tend

to prefer the flavors of

Japanese sauces and

condiments.

Local products dominate

the market.

Almonds,

shelled

33.58 1. USA -

94.13% 2. China -

5.86%

USA is the dominant

supplier of tree nuts.

There is no local

production available.

Walnuts,

shelled

25.21 1. USA -

83.76% 2. China -

9.21%

USA is the dominant

supplier of tree nuts.

There is no local

production on a

commercial level.

Source: ATO survey; Council of Agriculture; Global Trade Atlas

SECTION IV. BEST PRODUCT PROSPECTS

Category A: Products Present in the Market That Have Good Sales Potential

Product

Category

2012

Import

Market

size

2012

Imports

(US$Mil)

5-Yr.

Avg.

Annual

Import

Growth

Import

Tariff

Rate

Key Constraints

Over Market

Development

Market

Attractiveness

for USA

Beef and

beef

variety

meat

87,367

MT

$504 2.6% Beef:

NT$10

per

kilogram

Beef

variety

meat:

15%

The U.S. regained

as the largest beef

supplier in terms

of value in 2013

after the Taiwan

authority

developed the

import

regulations for

beef contains

ractopamine.

The U.S. beef

industry is able to

supply large

volumes of

“Asian cuts” at

prices

competitive with

New Zealand and

Australia.

The quality of

Primary

competitors are

New Zealand and

Australia with

perceived

acceptable quality

at lower price.

U.S. chilled beef

has been

recognized by

Taiwan

consumers.

Cheese 23,066

(MT)

$109 8.5% 5% New Zealand

(29%) and

Australia (21%)

dominate the

market. Home

cooking

applications are

not yet popular.

U.S. market share

is increasing,

reflecting

growing

acceptance of

U.S. cheese.

Fish and

Seafood

Products

278,064

(MT)

$768 8.36%

NT$5.36

to

NT$225

per kg;

or 9% to

50%

With a bias in

favor of fresh fish

and Southeast

Asia- variety

crustaceans, U.S.

exporters will

need to work hard

to gain market

share.

Most U.S.

seafood products

are consumed in

restaurants rather

than purchased in

supermarkets or

traditional wet

markets.

The food

service/HRI

venues with a

strong Western

orientation and

up-market

positioning offer

the current best

opportunities for

U.S. exporters.

Poultry

Meat

130,546

(MT)

$192 12% 20% Import quotas on

poultry meat were

eliminated in

2005, but special

safe guard (SSG)

raises the tariff to

about 26%.

U.S. enjoys 89%

import market

share and is one

of only six

countries

certified to export

poultry meat to

Taiwan.

Tree Nuts 23,837

(MT)

$104.6 1.1% Varies

by

type

Cashews from

Asia have shifted

some market

U.S. dominates

market for

almonds, pecans,

share from U.S.

tree nuts.

Competition to

U.S. pistachios

comes from

Middle East and

Australia.

and walnuts.

Almonds and

pecans have great

potential growth,

but baking

industry needs to

learn how to use

pecans in

products.

Source: Taiwan Bureau of Foreign Trade: Taiwan Council of Agriculture

Section V. POST CONTACT AND FURTHER INFORMATION

Contact Information for FAS Offices in Taiwan and in the United States

For Trade Policy/Market Access and General Agricultural Issues:

Taiwan American Institute In Taiwan, AIT, Taipei

Office

Hours:

8:00 AM – 5:00 PM

Telephone: (011-866-2) 2162-2316

Fax: (011-886-2) 2162-2238

Email-FAS: [email protected]

Pouch - Diplomatic Agricultural Section

Department of State (AGR)

4170 AIT Taipei Place

Washington, DC 20189-4170

Physical Location American Institute in Taiwan

No. 7, Lane 134, Xinyi Rd., Sec 3

Taipei, 10659 Taiwan

Foreign Service Personnel Garth Thorburn (Chief)

Emily Scott (Deputy Chief)

Locally-Employed Staff Rosemary Kao (Ag Specialist)

Chiou Mey Perng (Ag Specialist)

Angela Hu * (Admin Assistant)

For Market Development Assistance:

Taiwan Agricultural Trade Office - Taipei, ATO, Taipei

Office Hours: 8:00 AM – 5:00 PM

Tel-Direct

Line: (011-886-2) 2705-6536

Fax: (011-886-2) 2706-4885

Email-FAS: [email protected]

Pouch - Diplomatic Agricultural Trade Office

Physical Location ATO / American Institute in Taiwan

Department of State (ATO)

4170 AIT Taipei Place

Washington DC 20189-4170

Suite 704 Lotus Mansion

7th fl No. 136 Renai Road Sec. 3

Taipei Taiwan

Foreign Service Personnel Mark Ford (Director)

Locally-Employed Staff Cleo W. Y. Fu (Ag Mktg Specialist)

Katherine Lee (Ag Mktg Specialist)

Angelique Su (Admin Assistant)

USDA Stakeholders

The Agricultural Trade office works with a large number of U.S. industry organizations, several of

which are resident or have local representatives in Taiwan. These cooperators share the view that

Taiwan is a promising market for agri-food products.

USDA Producer Associations - Taiwan Representatives (and PR Firms)

COOPERAT

OR

LOCAL

AGENT

CONTA

CT

PHON

E FAX

ADDRE

SS E-mail

California

Cherry

Advisory

Board

Steven

Chu &

Associat

es

Steven

Chu

(8862)

272619

39

(8862)

272618

15

10F-3,

508

Chung

Hsiao E.

Rd., Sec.

5, Taipei

[email protected]

et

California

Tree Fruit

Agreement

Pear Bureau

North-West

Raisin

Administrative

Committee

Washington

Apples

Food Export

Northeast/Mid

west

Wisconsin

Ginseng Board

California

Table Grape

Committee PR

Consulta

nts Ltd.

Rosaline

Chen

(8862)

878989

39

(8862)

272521

55

7D07, 5

HsinYi

Rd., Sec.

5, Taipei

[email protected] U.S. Dairy

Export

Council

USA Rice

Federation

Wine Institute

of California

US Potato

Board

Northwest

Cherry

Growers

Association

n/a Herman

Kuo

(88609)

321234

82

(8862)

236276

76

3F, 14,

lane 26,

Tai-shun

St.

Taipei

Taiwan

[email protected]

m;

U. S. Meat

Export

Federation

n/a Davis

Wu

(8862)

273612

00

(8862)

273615

00

12F-1,

23,

Keelung

Rd., Sec.

2, Taipei

[email protected];

[email protected]

California

Agricultural

Export

Council

n/a Irene

Tsai

(8862)

878988

55

(8862)

878988

33

Suite7C-

06,

Taipei

World

Trade

Center,

5, Hsin-

Yi Rd.,

Sec5,

Taipei

CAEC-

[email protected]

Oceanspray

(beverage) n/a

Daisy

Hong

(8862)

251840

05

(8862)

251846

09

9F, 88

Chien

Kuo N.

Rd.,

Sec.2,

Taipei

d.m.hong@oceanspray

.com

Oceanspray

(ingredient) n/a

Kenneth

Wang

(8862)

250233

31

(8862)

250410

94

9F, 88

Chien

Kuo N.

Rd.,

Sec.2,

Taipei

[email protected].

net

U.S. Highbush

Blueberry

Council,

California Fig

Producers

Association

n/a Millie

Hsia

(8862)

230931

30

PO 31-

90 PO

31-90

[email protected]

US Pet Food

Institute

Wise

ConsultiEcho Lin

(8862)

251409

(8862)

271848

8F.,

No.201,

[email protected];

[email protected]

ng 84 50 Fu-Shin

N. Rd,

Taipei

APA - The

Engineered

Wood

Association

n/a Charlie

Barnes

(8862)

272016

24

(8862)

272016

46

Taipei

World

Trade

Center,

Suite

7C-08,

#5 Hsin-

yi Road

Section

5, Taipei

110

charlie.barnes@apawo

od.org

ASA - IM n/a Anthony

Thang

(8862)

256029

27

(8862)

256838

69

6F, 27

Chang

E. Rd.

Sec.1,

Taipei

[email protected]

et

U.S. Grains

Council n/a

Clover

Chang

(8862)

250754

01

(8862)

250248

51

7F, 157,

Nanking

E. Rd.,

Sec.2,

Taipei,

Taiwan

[email protected]

t;

[email protected].

net

U.S. Wheat

Associates n/a

Ronald

Lu

(8862)

252111

44

(8862)

252115

68

3/3, lane

27,

ChungS

han N.

Rd.,

Sec.2,

Taipei,

Taiwan

[email protected]

Other Relevant Reports

Reports on the Taiwan food and agricultural market are available on the FAS website. The search

engine can be found at:

http://gain.fas.usda.gov/Lists/Advanced%20Search/AllItems.aspx

Toast to U.S. California Wines | Wine Market Promotion/ Competition | Taipei

ATO|Taiwan|11/6/2013

Recently, the California Wine Institute (CWI) hosted its annual grand wine tasting in Taiwan,

featuring over 200 diversified quality wines from 42 wineries. The tasting successfully attracted 250

trade contacts to attend, including importers, foodservice buyers and sommeliers. Currently, the

United States is the only supplier to Taiwan that continues to show growth in the wine market in

both volume and value. In 2012, wine exports from the United States to Taiwan totaled $10 million.

Toast to U.S. California Wines_Taipei ATO_Taiwan_10-31-2013

Taiwan Wine Market Grows More Diverse|Wine Export Promotion Programs Market

Promotion/Competition|Taipei ATO|Taiwan|11/4/2013

On September 27, 2013, the Agricultural Trade Office (ATO) Taipei featured over 30 U.S. wines

from California, Idaho, New Jersey, and Oregon at the International Wine Promotion which was

hosted by the Imports and Exporters Association of Taipei (IEAT). The event successfully attracted

over 300 wine lovers from the foodservice sector and the general public. This is the third year that

the IEAT has organized this wine event, and it provides an opportunity for wine exporters to test the

Taiwan mar...

Taiwan Wine Market Grows More Diverse_Taipei ATO_Taiwan_10-30-2013

U.S. Beef Gains Access to Taiwan Market|Livestock and Products Trade Policy Monitoring

Market Development Reports|Taipei ATO|Taiwan|9/11/2013

In September 2012, Taiwan authorities implemented a maximum residue limit (MRL) for

ractopamine in beef, expanding market access for U.S. products. Since then, U.S. beef exports to

Taiwan have recovered well and currently on pace to exceed the 2010 record year. Still, high prices

and increasingly limited supplies may constrain exports.

U.S. Beef Gains Access to Taiwan Market_Taipei ATO_Taiwan_9-6-2013

Asian Chefs Highlight U.S. Ingredients at GBI Chef Competition|Agricultural Trade Office

Activities Export Promotion Programs Food Service - Hotel Restaurant Institutional Market

Promotion/Competition|Taipei ATO|Taiwan|8/22/2013

On June 27, 2013, the inaugural United Tastes of America - Asian Chef Challenge at the Taipei

International Food Show’s USA Pavilion successfully drew a crowd of over 300 potential buyers,

producers and media representatives. Throughout the final competition, chefs from Hong Kong,

Shanghai, Taipei and Tokyo created 16 diversified dishes highlighting the use of over 20 different

U.S. ingredients. Not only did the competition highlight the use of U.S. ingredients, but it created a

buzz around va...

Asian Chefs Highlight U.S. Ingredients at GBI Chef Competition_Taipei ATO_Taiwan_8-16-2013

Taipei International Food Show 2013|Trade Show Evaluation Export Promotion

Programs|Taipei ATO|Taiwan|7/31/2013

At the Taipei International Food Show (TIFS), 33 USA Pavilion exhibitors reported on-site sales of

approximately US$660,000 and 12-month projected sales of nearly US$19 million, up 375% over

2012! The U.S. exhibitors introduced about 250 new-to-market products and reported making over

200 new business contacts. U.S. products drawing the most interest at the show were beef, chicken

leg quarters, sauces, snacks and potatoes. In addition, the inaugural USDA-supported United Tastes

of America - Asi...

Taipei International Food Show 2013_Taipei ATO_Taiwan_7-26-2013

United Tastes of America – Asian Chef Challenge Pits Taiwan's Top Ch|Agricultural Trade

Office Activities Export Promotion Programs Food Service - Hotel Restaurant Institutional

Market Development Reports|Taipei ATO|Taiwan|5/1/2013

On March 26, the team from Kaohsiung’s "Bite 2 Eat" stood out from a star-studded field of 16

competing teams of chefs at the Taipei preliminary competition of the United Tastes of America -

Asian Chef Challenge. The preliminary competition successfully engaged thirty-two competitive

chefs to create over sixty unique dishes by utilizing fifteen mandatory U.S. ingredients. The related

media coverage is estimated to reach hundreds of thousands of consumers.

United Tastes of America – Asian Chef Challenge Pits Taiwan's Top Ch_Taipei ATO_Taiwan_4-26-

2013

Taiwan Tree Nuts Market Overview 2013|Tree Nuts Promotion Opportunities|Taipei

ATO|Taiwan|4/29/2013

Taiwan imports of tree nuts jumped 14% to an all-time high of US$103 million with 21,581 tons of

volume in CY 2012. The increase is partly the result of higher prices but also reflects growing

demand from the food processing sector, particularly for powdered drinks production. It is noted

that as the supply of walnuts is unstable, the industry starts to look out for other substitutes, which

creates opportunities for a wide variety of tree nuts.

Taiwan Tree Nuts Market Overview 2013_Taipei ATO_Taiwan_4-25-2013

United Tastes of America – Asian Chef Challenge Kick-Off|Agricultural Trade Office

Activities Export Promotion Programs Food Service - Hotel Restaurant Institutional Market

Development Reports|Taipei ATO|Taiwan|2/7/2013

Pre-competition seminars for the planned first-ever United Tastes of America – Asian Chef

Challenge generated strong interest in Taiwan, drawing more than 100 professional chefs. The

seminars also helped build excitement about the upcoming Taiwan preliminary competition

scheduled for March 26, 2013 and the regional grand finale set for June 27, 2013 at the Taipei

International Food Show, where the winners from competitions in China, Japan and Hong Kong will

go head-to-head.

United Tastes of America – Asian Chef Challenge Kick-Off_Taipei ATO_Taiwan_2-5-2013

ATO Taipei Help Facilitate U.S. Chicken Export|Export Accomplishments - Trade Leads

Livestock and Products|Taipei ATO|Taiwan|1/18/2013

ATO Taipei helped a local chicken importer verify several U.S. based food trading companies'

existence and legitimacy. The company placed orders of 18 containers of chicken leg quarter after

ATO staff verified one company based in Virginia and briefed the company regarding the import

procedures and health and import certificates for poultry products export to Taiwan.

ATO Taipei Help Facilitate U.S. Chicken Export_Taipei ATO_Taiwan_1-16-2013

Taiwan: Top Ten Market & Springboard to Asia|Exporter Guide|Taipei

ATO|Taiwan|12/25/2012

In 2011, Taiwan was the sixth largest market for U.S. food and agricultural products with imports of

US$3.7 billion. While economic growth slowed in 2012, the economy is forecast to recover in 2013,

so Taiwan will continue to offer good opportunities for a wide range of U.S. products. In addition,

U.S. exporters have successfully used Taiwan as a springboard into China and other Asian markets,

taking advantage of close cultural, language and business ties.

Exporter Guide_Taipei ATO_Taiwan_12-20-2012

U.S. Eastern Red Cedar Seminars Result in Immediate Sales|Export Accomplishments - Events

Wood Products Market Promotion/Competition|Taipei ATO|Taiwan|11/9/2012

ATO Taipei and the Missouri State Department of Agriculture co-organized wood seminars in

Taiwan's three major cities to promote U.S. Eastern Red Cedar in July and August 2012. Three

importers placed orders right after the seminars with the first two shipments arrived in Taiwan in

September 2012.

U.S. Eastern Red Cedar Seminars Result in Immediate Sales_Taipei ATO_Taiwan_11-6-2012

Taiwan’s Food Service Enjoy Strong Growth|Food Service - Hotel Restaurant

Institutional|Taipei ATO|Taiwan|6/29/2012

Despite the recent economic slowdown, Taiwan’s food service sector has enjoyed strong growth,

expanding by nearly 13 percent to US$12.3 billion in 2011. The rise of Taiwan’s tourism market has

also played a critical role in creating new opportunities. As further confirmation of the sector’s

success, several food service companies filed for successful initial public offerings during the past

year.

Food Service - Hotel Restaurant Institutional_Taipei ATO_Taiwan_6-25-2012

Taiwan Architect Magazine Promotes U.S. Wood Products|Export Promotion Programs Wood

Products|Taipei ATO|Taiwan|4/25/2012

ATO Taipei worked closely with the Taiwan Architect Magazine to promote U.S. wood products and

wood frame construction. As a result of this collaboration, the magazine published a total of six

articles about U.S. wood products in the December 2011 edition of the magazine, which has a

readership of 50,000 construction and design professionals in Taiwan.

Taiwan Architect Magazine Promotes U.S. Wood Products_Taipei ATO_Taiwan_4-20-2012

Taiwan Baking Industry 2012|Product Brief|Taipei ATO|Taiwan|4/3/2012

In 2011, the Taiwan baking sector was valued at an estimated US$900 million based on the market

value of domestic production and imported baked goods. Though the market is maturing, it is

progressing toward diversified operations that offer more healthy and sophisticated products.

Consumers are becoming more and more health-conscious, increasing the demand for healthy

ingredients, such as whole grains, whole-wheat flour, tree nuts, dried/fresh fruits, natural butter,

natural sweeteners and che...

Taiwan Baking Industry 2012_Taipei ATO_Taiwan_3-26-2012

Videos:

"Doing Business in Taiwan" - A Day in Taipei

Part I: http://www.youtube.com/watch?v=wyIlsMjIEWg

Part II: http://www.youtube.com/watch?v=4SH3c5EiJm4&feature=related

ATO Taipei marketing program video clippings:

http://www.youtube.com/user/USFoodTaiwan?ob=0&feature=results_main


Recommended