48
EUROPEAN INSTITUTE FOR ASIAN STUDIES TAIWAN’S OUTWARD FOREIGN DIRECT INVESTMENT (OFDI) INTO THE EUROPEAN UNION AND ITS MEMBER STATES QUANTITATIVE RESEARCH October 2014 EIAS Report
EUROPEAN INSTITUTE
FOR
ASIAN STUDIES
TAIWAN’S OUTWARD FOREIGN
DIRECT INVESTMENT (OFDI)
INTO THE EUROPEAN UNION
AND ITS MEMBER STATES
QUANTITATIVE RESEARCH
October 2014
EIAS Report

2
Data collection and analysis
Quantitative Research

3
Acknowledgements
This research report was prepared as a result of a survey on 'Taiwan's Outward Foreign
Direct Investment into the EU and its Member States', conducted by the European
Institute for Asian Studies (EIAS) asbl with great support from the Taipei Representative
Office in the European Union. The report is researched, drafted and prepared by an EIAS
team comprising – Andras Megyeri (Research Coordinator), Marina Guajardo (Junior
Researcher), Stefano Facchinetti (Junior Researcher) and Prof. Sylvain Plasschaert
(Senior Associate).
We would also like to acknowledge all the experts consulted and agencies that
contributed to this report.
4
Table of Contents
List of Abbreviations .............................................................................................. 5
List of Figures ....................................................................................................... 6
Chapter 1: Taiwan's Outward Foreign Direct Investment (OFDI) to Europe ................... 7
1.1 Introduction .............................................................................................. 7
1.2 Taiwan’s Global OFDI .................................................................................. 9
1.3 Taiwan’s OFDI in the European Union ......................................................... 11
1.4 Conclusion .............................................................................................. 15
Chapter 2: Patterns and features of Taiwanese owned companies in Europe ............... 16
2.1 Introduction ............................................................................................ 16
2.2 Shareholders of European based Taiwanese firms: Shareholder overview,
ownership structure, size, year of establishment, and business form .................... 17
2.3 Sectorial distribution of Taiwanese owned firms in Europe ............................. 20
2.4 Geographical distribution of Taiwanese direct investment (TDI) in the EU ........ 22
2.5 Operating performance of Taiwanese firms .................................................. 25
2.6 Ten-year trend analysis ............................................................................ 29
Chapter 3. Entry form, ownership control and partnership of Taiwanese owned
enterprises in the EU ........................................................................................... 36
3.1 Introduction ............................................................................................ 36
3.2 Entry form and ownership structure............................................................ 36
3.3 Joint Venture partnerships ........................................................................ 40
3.4 Conclusion .............................................................................................. 44
Chapter 4: Final Conclusion .................................................................................. 45
Bibliography ....................................................................................................... 46
5
List of Abbreviations
BIA Bilateral Investment Agreement
EBITDA Earnings Before Interest, Taxes, Depreciation, and Amortisation
EU European Union
FDI Foreign Direct Investment
FTA Free Trade Agreement
GDP Gross Domestic Product
GMBH Gesellschaft mit Beschränkter Haftung (company with limited liability)
ICT Information and Communication Technology
ISO International Organisation for Standardisation
JV Joint Venture
KIS Knowledge-Intensive Services
LKIS Less Knowledge Intensive Service
OECD Organisation Economic Co-operation and Development
OEM Original Equipment Manufacturing
OFDI Outward Foreign Direct Investment
R&D Research and Development
SME Small and Medium Enterprise
SOE State Owned Enterprise
TDI Taiwanese Direct Investment
UNCTAD United Nations Conference on Trade and Development
USD US Dollar
6
List of Figures
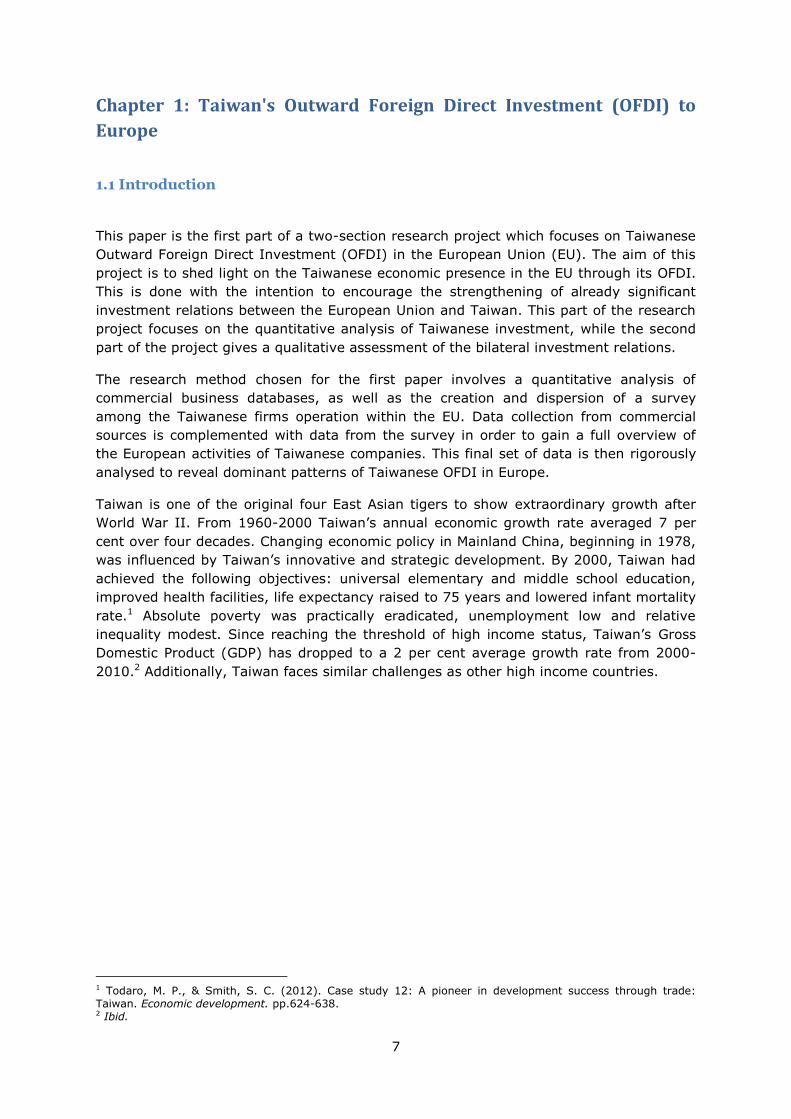
Figure 1: Taiwanese Outward Foreign Direct Investment Flows ................................... 8
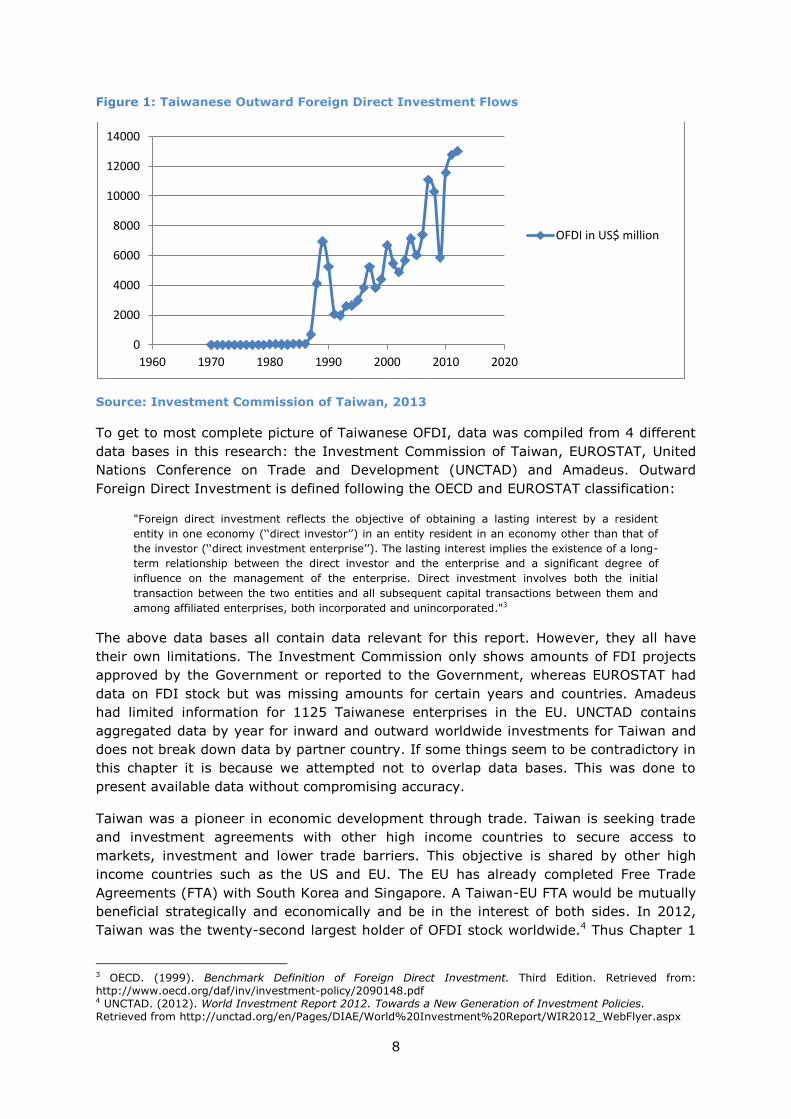
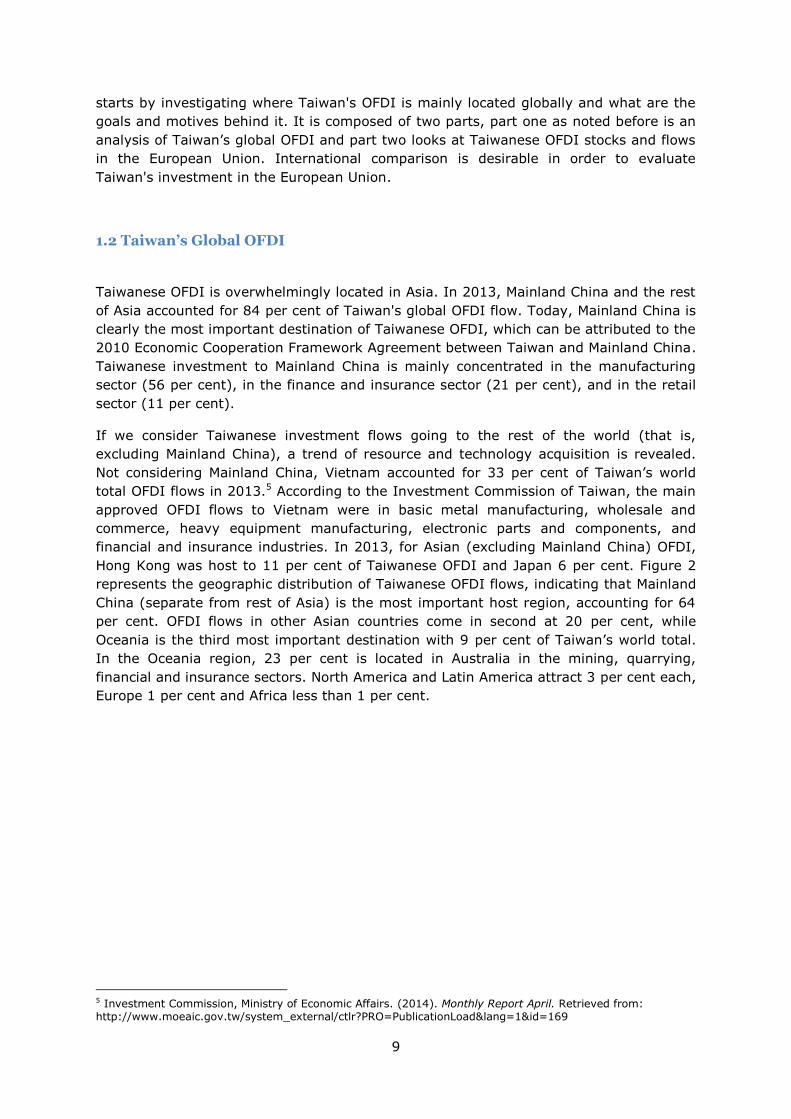
Figure 2: Geographical distribution of Taiwan's OFDI flow, 2013. .............................. 10
Figure 3: Sectorial Distribution of Taiwanese OFDI Globally ...................................... 11
Figure 4: Regional growth trends of Taiwanese OFDI Stock in Europe, 2008-2012 ....... 12
Figure 5: Taiwan's OFDI flows and stock in EU ........................................................ 13
Figure 6: Sectorial Distribution of Taiwanese FDI in the EU ....................................... 15
Figure 7: Type of shareholders of Taiwanese owned enterprises in Europe ................. 18
Figure 8: Size categories of Taiwanese owned firms per type of investor .................... 19
Figure 9: Period of establishment of Taiwanese firms in the European Union per type of
firms ................................................................................................................. 20
Figure 10: Sector distribution of Taiwanese owned manufacturing firms in the EU ....... 21
Figure 11: Sector distribution of Taiwanese owned firms in the EU per type of companies
......................................................................................................................... 22
Figure 12: Geographical distribution of Taiwanese direct investment companies in the EU
......................................................................................................................... 23
Figure 13: Geographical distribution of Taiwanese firms per type of investors ............. 24
Figure 14: Geographical distribution of Taiwanese firms per size of companies............ 25
Figure 15: Profitability of Taiwanese owned firms in the EU per type of investors ........ 26
Figure 16: Profitability of Taiwanese owned firms in the EU per type of investors ........ 26
Figure 17: Labour productivity of Taiwanese owned firms in the EU per type of investors
......................................................................................................................... 28
Figure 18: Labour productivity of Taiwanese owned firms in the EU per location.......... 28
Figure 19: Value ranges of employees ................................................................... 30
Figure 20: Estimated total number of employees per year. ....................................... 31
Figure 21: Value ranges of yearly turnover, thousand Euro ....................................... 32
Figure 22: Estimated total turnover per year, thousand Euro .................................... 33
Figure 23: Value ranges for assets per year, thousand Euro ..................................... 34
Figure 24: Estimated total assets per year, thousand Euro ....................................... 35
Figure 25: Entry forms of Taiwanese owned enterprises operating in the EU. .............. 38
Figure 26: Ownership structure depending on business sector activity ....................... 39
Figure 27: Origins of partners of Taiwanese JVs in the EU. ....................................... 41
Figure 28: Partnership composition of Taiwanese JVs in the EU ................................. 42
7
Chapter 1: Taiwan's Outward Foreign Direct Investment (OFDI) to
Europe
1.1 Introduction
This paper is the first part of a two-section research project which focuses on Taiwanese
Outward Foreign Direct Investment (OFDI) in the European Union (EU). The aim of this
project is to shed light on the Taiwanese economic presence in the EU through its OFDI.
This is done with the intention to encourage the strengthening of already significant
investment relations between the European Union and Taiwan. This part of the research
project focuses on the quantitative analysis of Taiwanese investment, while the second
part of the project gives a qualitative assessment of the bilateral investment relations.
The research method chosen for the first paper involves a quantitative analysis of
commercial business databases, as well as the creation and dispersion of a survey
among the Taiwanese firms operation within the EU. Data collection from commercial
sources is complemented with data from the survey in order to gain a full overview of
the European activities of Taiwanese companies. This final set of data is then rigorously
analysed to reveal dominant patterns of Taiwanese OFDI in Europe.
Taiwan is one of the original four East Asian tigers to show extraordinary growth after
World War II. From 1960-2000 Taiwan’s annual economic growth rate averaged 7 per
cent over four decades. Changing economic policy in Mainland China, beginning in 1978,
was influenced by Taiwan’s innovative and strategic development. By 2000, Taiwan had
achieved the following objectives: universal elementary and middle school education,
improved health facilities, life expectancy raised to 75 years and lowered infant mortality
rate.1 Absolute poverty was practically eradicated, unemployment low and relative
inequality modest. Since reaching the threshold of high income status, Taiwan’s Gross
Domestic Product (GDP) has dropped to a 2 per cent average growth rate from 2000-
2010.2 Additionally, Taiwan faces similar challenges as other high income countries.
1 Todaro, M. P., & Smith, S. C. (2012). Case study 12: A pioneer in development success through trade: Taiwan. Economic development. pp.624-638. 2 Ibid.
8
Figure 1: Taiwanese Outward Foreign Direct Investment Flows
Source: Investment Commission of Taiwan, 2013
To get to most complete picture of Taiwanese OFDI, data was compiled from 4 different
data bases in this research: the Investment Commission of Taiwan, EUROSTAT, United
Nations Conference on Trade and Development (UNCTAD) and Amadeus. Outward
Foreign Direct Investment is defined following the OECD and EUROSTAT classification:
"Foreign direct investment reflects the objective of obtaining a lasting interest by a resident
entity in one economy (‘‘direct investor’’) in an entity resident in an economy other than that of
the investor (‘‘direct investment enterprise’’). The lasting interest implies the existence of a long-
term relationship between the direct investor and the enterprise and a significant degree of
influence on the management of the enterprise. Direct investment involves both the initial
transaction between the two entities and all subsequent capital transactions between them and
among affiliated enterprises, both incorporated and unincorporated."3
The above data bases all contain data relevant for this report. However, they all have
their own limitations. The Investment Commission only shows amounts of FDI projects
approved by the Government or reported to the Government, whereas EUROSTAT had
data on FDI stock but was missing amounts for certain years and countries. Amadeus
had limited information for 1125 Taiwanese enterprises in the EU. UNCTAD contains
aggregated data by year for inward and outward worldwide investments for Taiwan and
does not break down data by partner country. If some things seem to be contradictory in
this chapter it is because we attempted not to overlap data bases. This was done to
present available data without compromising accuracy.
Taiwan was a pioneer in economic development through trade. Taiwan is seeking trade
and investment agreements with other high income countries to secure access to
markets, investment and lower trade barriers. This objective is shared by other high
income countries such as the US and EU. The EU has already completed Free Trade
Agreements (FTA) with South Korea and Singapore. A Taiwan-EU FTA would be mutually
beneficial strategically and economically and be in the interest of both sides. In 2012,
Taiwan was the twenty-second largest holder of OFDI stock worldwide.4 Thus Chapter 1
3 OECD. (1999). Benchmark Definition of Foreign Direct Investment. Third Edition. Retrieved from: http://www.oecd.org/daf/inv/investment-policy/2090148.pdf 4 UNCTAD. (2012). World Investment Report 2012. Towards a New Generation of Investment Policies. Retrieved from http://unctad.org/en/Pages/DIAE/World%20Investment%20Report/WIR2012_WebFlyer.aspx
0
2000
4000
6000
8000
10000
12000
14000
1960 1970 1980 1990 2000 2010 2020
OFDI in US$ million
9
starts by investigating where Taiwan's OFDI is mainly located globally and what are the
goals and motives behind it. It is composed of two parts, part one as noted before is an
analysis of Taiwan’s global OFDI and part two looks at Taiwanese OFDI stocks and flows
in the European Union. International comparison is desirable in order to evaluate
Taiwan's investment in the European Union.
1.2 Taiwan’s Global OFDI
Taiwanese OFDI is overwhelmingly located in Asia. In 2013, Mainland China and the rest
of Asia accounted for 84 per cent of Taiwan's global OFDI flow. Today, Mainland China is
clearly the most important destination of Taiwanese OFDI, which can be attributed to the
2010 Economic Cooperation Framework Agreement between Taiwan and Mainland China.
Taiwanese investment to Mainland China is mainly concentrated in the manufacturing
sector (56 per cent), in the finance and insurance sector (21 per cent), and in the retail
sector (11 per cent).
If we consider Taiwanese investment flows going to the rest of the world (that is,
excluding Mainland China), a trend of resource and technology acquisition is revealed.
Not considering Mainland China, Vietnam accounted for 33 per cent of Taiwan’s world
total OFDI flows in 2013.5 According to the Investment Commission of Taiwan, the main
approved OFDI flows to Vietnam were in basic metal manufacturing, wholesale and
commerce, heavy equipment manufacturing, electronic parts and components, and
financial and insurance industries. In 2013, for Asian (excluding Mainland China) OFDI,
Hong Kong was host to 11 per cent of Taiwanese OFDI and Japan 6 per cent. Figure 2
represents the geographic distribution of Taiwanese OFDI flows, indicating that Mainland
China (separate from rest of Asia) is the most important host region, accounting for 64
per cent. OFDI flows in other Asian countries come in second at 20 per cent, while
Oceania is the third most important destination with 9 per cent of Taiwan’s world total.
In the Oceania region, 23 per cent is located in Australia in the mining, quarrying,
financial and insurance sectors. North America and Latin America attract 3 per cent each,
Europe 1 per cent and Africa less than 1 per cent.
5 Investment Commission, Ministry of Economic Affairs. (2014). Monthly Report April. Retrieved from: http://www.moeaic.gov.tw/system_external/ctlr?PRO=PublicationLoad&lang=1&id=169
10
Figure 2: Geographical distribution of Taiwan's OFDI flow, 2013. Source: Taiwan MOEA Investment Commission, 2014
Source: Taiwan MOEA Investment Commission, 2014
In addition to needing raw materials for further processing in Taiwan, it should be borne
in mind that they make important inputs for the information and communications
technology (ICT) sector. Taiwan’s main export sector is ICT and consequently the
endogenous growth incentives for innovation to meet input needs are reflected in the
OFDI of this area.6 In 2013, Taiwanese companies invested USD 200,160,000 in Vietnam
to manufacture electronic parts and components for intermediary goods for its ICT
industry. Vietnam was the largest receiver of Taiwanese OFDI in this sector followed by
Thailand and the United States. The ICT sector may be the most strategic sector for
Taiwan but manufacturing of other primary inputs also takes a large piece of Taiwanese
outward OFDI. Basic metal manufacturing sees the highest investment rates within the
manufacturing sector making up 29 per cent of total OFDI outflows in 2013. Again
Vietnam took the cake of OFDI, with 89 per cent of basic metal manufacturing.7
6 UNCTAD. (2013). World Investment Report 2013. Global value chains: Investment and trade for development. Retrieved from: http://unctad.org/en/publicationslibrary/wir2013_en.pdf 7 Investment Commission, Ministry of Economic Affairs. (2014). Monthly Report April. Retrieved from: http://www.moeaic.gov.tw/system_external/ctlr?PRO=PublicationLoad&lang=1&id=169
Rest of Asia 20%
North America 3% Europe
1% Latin America
3% Oceania
9%
Africa 0%
Mainland China 64%
11
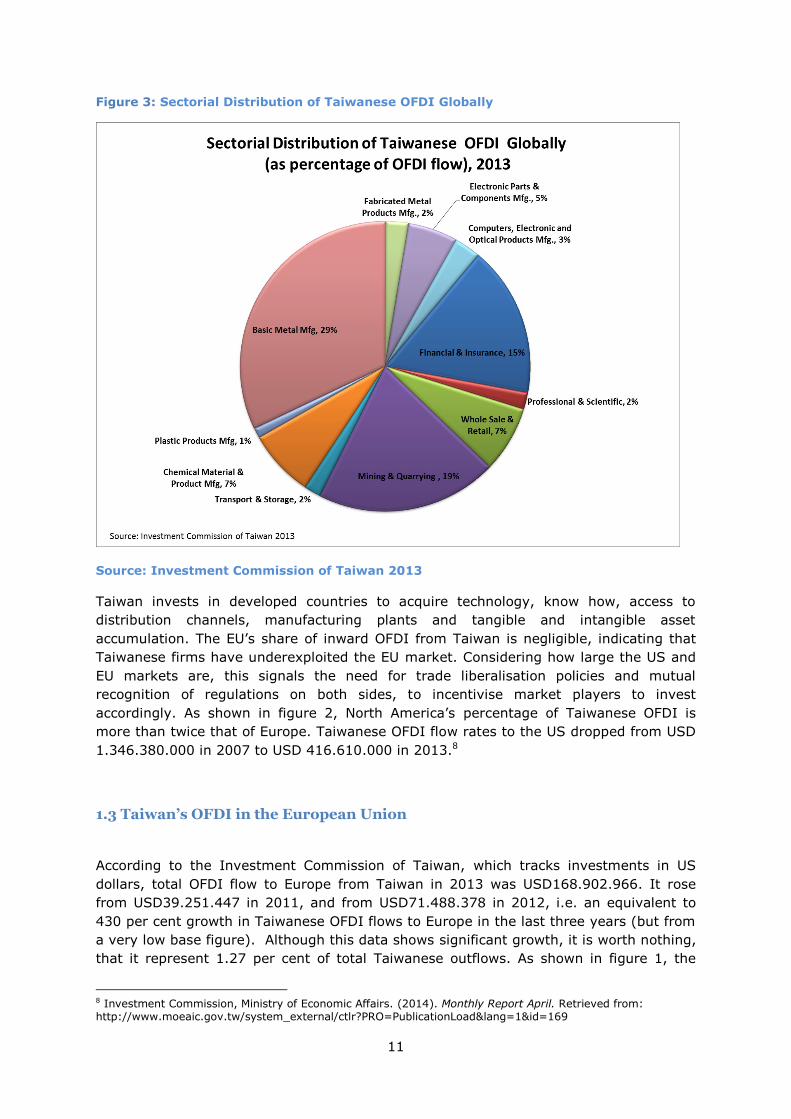
Figure 3: Sectorial Distribution of Taiwanese OFDI Globally
Source: Investment Commission of Taiwan 2013
Taiwan invests in developed countries to acquire technology, know how, access to
distribution channels, manufacturing plants and tangible and intangible asset
accumulation. The EU’s share of inward OFDI from Taiwan is negligible, indicating that
Taiwanese firms have underexploited the EU market. Considering how large the US and
EU markets are, this signals the need for trade liberalisation policies and mutual
recognition of regulations on both sides, to incentivise market players to invest
accordingly. As shown in figure 2, North America’s percentage of Taiwanese OFDI is
more than twice that of Europe. Taiwanese OFDI flow rates to the US dropped from USD
1.346.380.000 in 2007 to USD 416.610.000 in 2013.8
1.3 Taiwan’s OFDI in the European Union
According to the Investment Commission of Taiwan, which tracks investments in US
dollars, total OFDI flow to Europe from Taiwan in 2013 was USD168.902.966. It rose
from USD39.251.447 in 2011, and from USD71.488.378 in 2012, i.e. an equivalent to
430 per cent growth in Taiwanese OFDI flows to Europe in the last three years (but from
a very low base figure). Although this data shows significant growth, it is worth nothing,
that it represent 1.27 per cent of total Taiwanese outflows. As shown in figure 1, the
8 Investment Commission, Ministry of Economic Affairs. (2014). Monthly Report April. Retrieved from: http://www.moeaic.gov.tw/system_external/ctlr?PRO=PublicationLoad&lang=1&id=169
12
2008 recession significantly lowered Taiwanese ODFI. This is in line with global trends at
that time. The lack of investment and confidence in the world market is reflected in the
drop of Taiwanese OFDI flows between 2006 and 2011. Most recent data shows,
however, that Taiwanese OFDI flows are again rebounding at USD168.902.966 in 2013.9
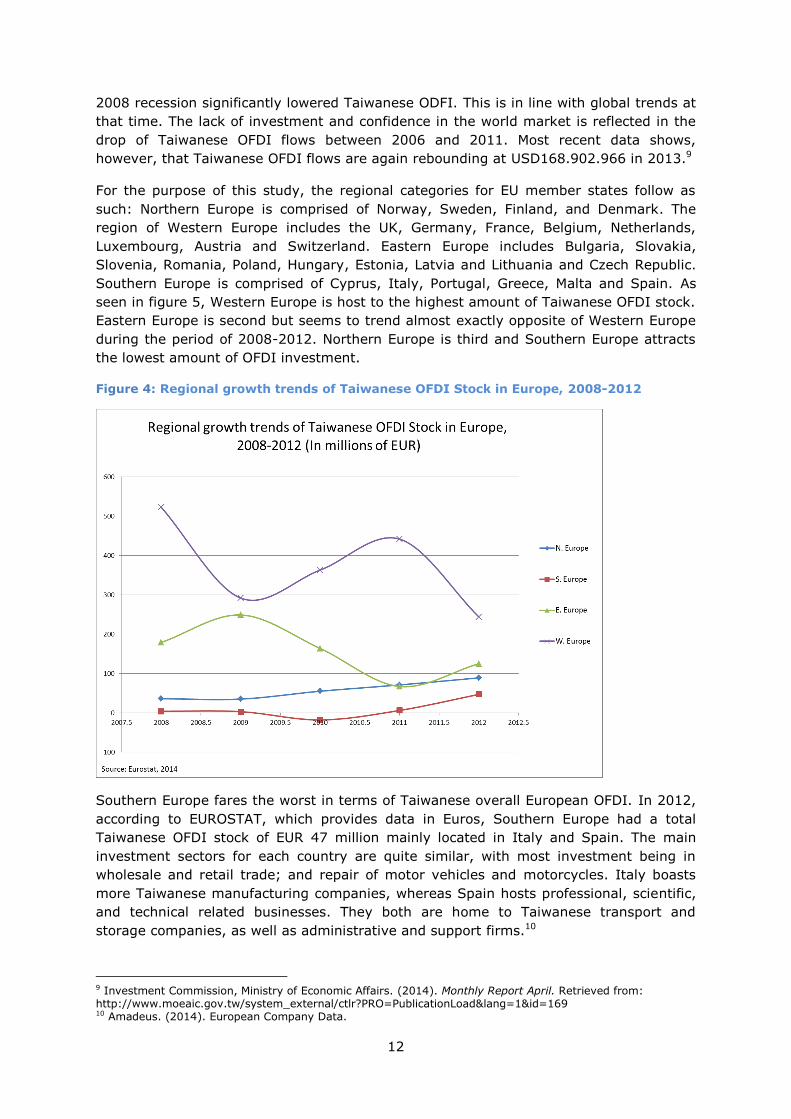
For the purpose of this study, the regional categories for EU member states follow as
such: Northern Europe is comprised of Norway, Sweden, Finland, and Denmark. The
region of Western Europe includes the UK, Germany, France, Belgium, Netherlands,
Luxembourg, Austria and Switzerland. Eastern Europe includes Bulgaria, Slovakia,
Slovenia, Romania, Poland, Hungary, Estonia, Latvia and Lithuania and Czech Republic.
Southern Europe is comprised of Cyprus, Italy, Portugal, Greece, Malta and Spain. As
seen in figure 5, Western Europe is host to the highest amount of Taiwanese OFDI stock.
Eastern Europe is second but seems to trend almost exactly opposite of Western Europe
during the period of 2008-2012. Northern Europe is third and Southern Europe attracts
the lowest amount of OFDI investment.
Figure 4: Regional growth trends of Taiwanese OFDI Stock in Europe, 2008-2012
Southern Europe fares the worst in terms of Taiwanese overall European OFDI. In 2012,
according to EUROSTAT, which provides data in Euros, Southern Europe had a total
Taiwanese OFDI stock of EUR 47 million mainly located in Italy and Spain. The main
investment sectors for each country are quite similar, with most investment being in
wholesale and retail trade; and repair of motor vehicles and motorcycles. Italy boasts
more Taiwanese manufacturing companies, whereas Spain hosts professional, scientific,
and technical related businesses. They both are home to Taiwanese transport and
storage companies, as well as administrative and support firms.10
9 Investment Commission, Ministry of Economic Affairs. (2014). Monthly Report April. Retrieved from: http://www.moeaic.gov.tw/system_external/ctlr?PRO=PublicationLoad&lang=1&id=169 10 Amadeus. (2014). European Company Data.
13
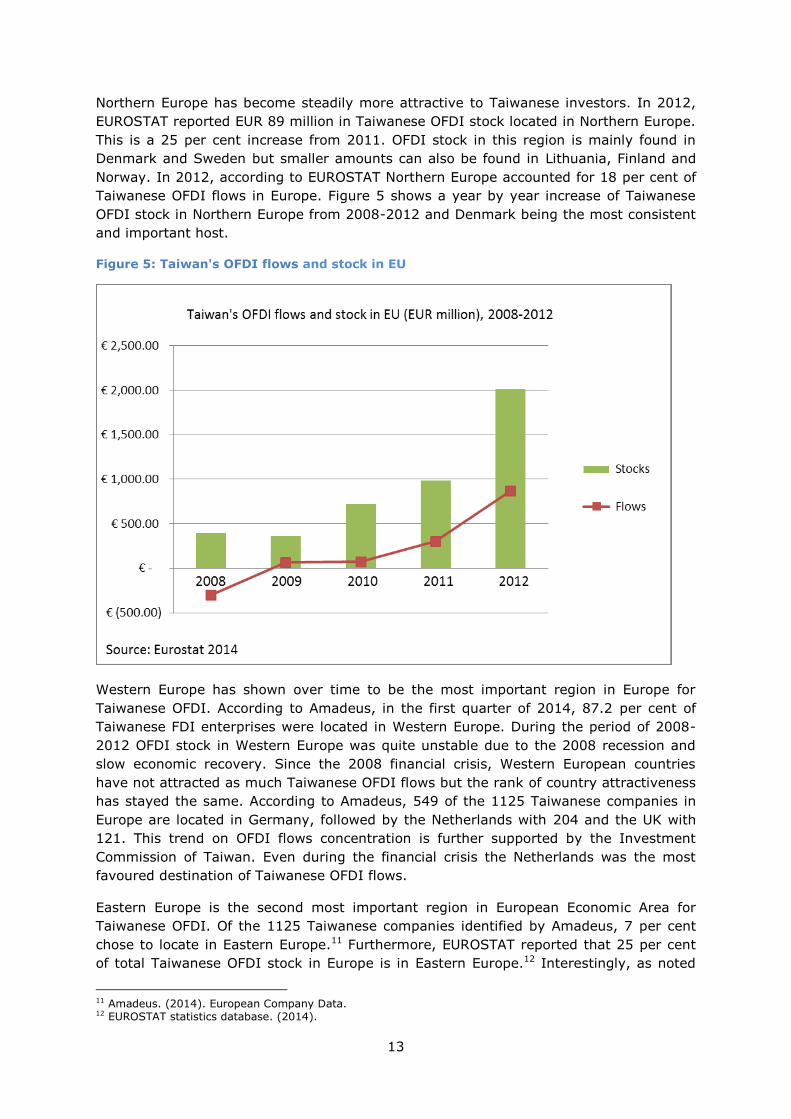
Northern Europe has become steadily more attractive to Taiwanese investors. In 2012,
EUROSTAT reported EUR 89 million in Taiwanese OFDI stock located in Northern Europe.
This is a 25 per cent increase from 2011. OFDI stock in this region is mainly found in
Denmark and Sweden but smaller amounts can also be found in Lithuania, Finland and
Norway. In 2012, according to EUROSTAT Northern Europe accounted for 18 per cent of
Taiwanese OFDI flows in Europe. Figure 5 shows a year by year increase of Taiwanese
OFDI stock in Northern Europe from 2008-2012 and Denmark being the most consistent
and important host.
Figure 5: Taiwan's OFDI flows and stock in EU
Western Europe has shown over time to be the most important region in Europe for
Taiwanese OFDI. According to Amadeus, in the first quarter of 2014, 87.2 per cent of
Taiwanese FDI enterprises were located in Western Europe. During the period of 2008-
2012 OFDI stock in Western Europe was quite unstable due to the 2008 recession and
slow economic recovery. Since the 2008 financial crisis, Western European countries
have not attracted as much Taiwanese OFDI flows but the rank of country attractiveness
has stayed the same. According to Amadeus, 549 of the 1125 Taiwanese companies in
Europe are located in Germany, followed by the Netherlands with 204 and the UK with
121. This trend on OFDI flows concentration is further supported by the Investment
Commission of Taiwan. Even during the financial crisis the Netherlands was the most
favoured destination of Taiwanese OFDI flows.
Eastern Europe is the second most important region in European Economic Area for
Taiwanese OFDI. Of the 1125 Taiwanese companies identified by Amadeus, 7 per cent
chose to locate in Eastern Europe.11 Furthermore, EUROSTAT reported that 25 per cent
of total Taiwanese OFDI stock in Europe is in Eastern Europe.12 Interestingly, as noted
11 Amadeus. (2014). European Company Data. 12 EUROSTAT statistics database. (2014).
14
earlier, OFDI stock in Eastern Europe mirrors Western Europe from 2008-2012, this
could possibly be because EUROSTAT was lacking data for Eastern Europe’s largest
Taiwanese OFDI host, the Czech Republic, for years 2011 and 2012. According to
Amadeus, 30 of the 1125 Taiwanese companies in Europe are based in the Czech
Republic. The Czech Republic also attracted EUR 5.2 million in OFDI flows in 2012. The
main sector is manufacturing of transport equipment. According to EUROSTAT, in 2012,
Hungary also accounted for EUR 105 million in Taiwanese OFDI stock, up from EUR45
million in 2011.13
The impact of the 2008-2009 financial crisis was the worst in post war history. In
Europe, countries initiated agencies to attract new sources of foreign investment to aid
the recovery process.14 Additionally, the EU has been pursuing a Global Europe Strategy
in an attempt to complete more Bilateral Investment Agreements (BIAs) and Free Trade
Agreements (FTAs) especially with Asian countries.15 For example, two have already
been completed with South Korea and Singapore to encourage trade, and investment
between the two regions. Furthermore, the recession has undervalued the assets of EU
companies and created incentives for acquisition and equity participation by Taiwanese
businesses.
According to commercial data sets, the Taiwan Investment Commission, as well as the
results from our online survey, we established that there are 1125 Taiwanese companies
within the European Union employing more than 60,000 people. This data is
complimented by EUROSTAT statistics, specifying that the 27 countries which were part
of the EU as of 2012, accumulated EUR2,012 million of Taiwanese OFDI stock by the end
of 2011. Additionally, the 27 EU Member States accumulated EUR 868 million of
Taiwanese OFDI outflow in 2012. Croatia joined the European Union in July 2013, for
which EUROSTAT does not yet provide statistical data. Figure 5 shows the stocks and
flows of Taiwanese investments in Europe since 2008. This graph shows the EU is a
growing key market for Taiwanese investment.
Taiwanese firms invest in Europe for access to technology, knowledge, proximity to the
European market and for competitive advantage. Taiwanese OFDI flows to Europe have
increased over the last 5 years by an average of 294 per cent per year. This shows a
positive recovery in Taiwanese business to invest in Europe. This increase is driven by
investment in professional, scientific and technical services, financial and insurance,
information and communication, wholesale and retail trade, motor vehicle and parts
manufacturing, machinery and equipment manufacturing, electrical equipment
manufacturing, computers, electronic and optical products manufacturing, medical goods
and beverage manufacturing.
13 EUROSTAT statistics database. (2014). 14 European Commission. 2009. Economic Crisis in Europe: Causes, Consequences and Responses. Retrieved from: http://ec.europa.eu/economy_finance/publications/publication15887_en.pdf Also see: European Business Council for Africa and the Mediterranean. (2014). Retrieved from: http://www.ebcam.eu/index.php?option=com_content&view=article&id=30&Itemid=4 15 The Swedish Institute for International Affairs. (2014). Towards a European Global Strategy. Retrieved from: http://www.euglobalstrategy.eu/
15
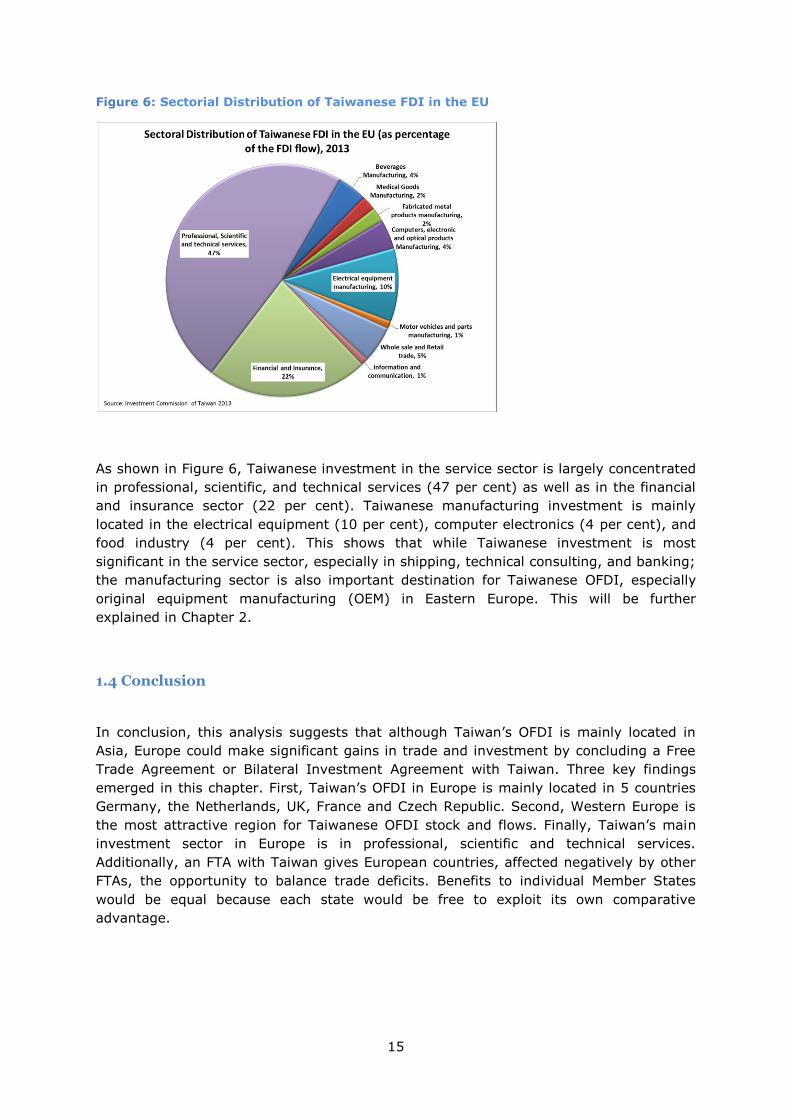
Figure 6: Sectorial Distribution of Taiwanese FDI in the EU
As shown in Figure 6, Taiwanese investment in the service sector is largely concentrated
in professional, scientific, and technical services (47 per cent) as well as in the financial
and insurance sector (22 per cent). Taiwanese manufacturing investment is mainly
located in the electrical equipment (10 per cent), computer electronics (4 per cent), and
food industry (4 per cent). This shows that while Taiwanese investment is most
significant in the service sector, especially in shipping, technical consulting, and banking;
the manufacturing sector is also important destination for Taiwanese OFDI, especially
original equipment manufacturing (OEM) in Eastern Europe. This will be further
explained in Chapter 2.
1.4 Conclusion
In conclusion, this analysis suggests that although Taiwan’s OFDI is mainly located in
Asia, Europe could make significant gains in trade and investment by concluding a Free
Trade Agreement or Bilateral Investment Agreement with Taiwan. Three key findings
emerged in this chapter. First, Taiwan’s OFDI in Europe is mainly located in 5 countries
Germany, the Netherlands, UK, France and Czech Republic. Second, Western Europe is
the most attractive region for Taiwanese OFDI stock and flows. Finally, Taiwan’s main
investment sector in Europe is in professional, scientific and technical services.
Additionally, an FTA with Taiwan gives European countries, affected negatively by other
FTAs, the opportunity to balance trade deficits. Benefits to individual Member States
would be equal because each state would be free to exploit its own comparative
advantage.
16
Chapter 2: Patterns and features of Taiwanese owned companies in
Europe
2.1 Introduction
This chapter will seek to provide a realistic picture of the patterns and trends of
Taiwanese companies operating in Europe, with the intention to facilitate the
understanding of their presence and features on the continent. A macro-perspective
examination of Taiwanese firms reveals important investment characteristics such as
distribution across different industry sectors and geographic locations, preferred entry
form, and dominant shareholder patterns. This is followed by a careful assessment of
firm-level indicators, such as profitability and labour productivity.
In order to maintain as much essential data as possible, and to avoid limitations, this
chapter further relied on various data sources, such as Amadeus. Furthermore, an online
survey was created with the intention to gather data from companies that do not appear
in commercial databases. This method of data collection was chosen with the intent to
mitigate limitations of a single source, in case some databases were not fully populated.
This allowed us to gain detailed and in-depth information. The databases allowed us to
view comparable business information on 1125 companies registered in 24 countries of
the European Union, through consistent and reliable datasets.
The majority of the data used has come from the Amadeus financial database. However,
the Amadeus database did lack some details for specific companies. To correct for this
gap in our data, we have created a survey for companies to provide a more accurate
view on Taiwanese enterprises in the EU.
To graphically represent the data of all companies in a meaningful manner, we classified
companies along industry types – manufacturing or services, and further divided them
according to technology level (high- or low-tech) and knowledge intensity (less
knowledge intensive or knowledge-intensive services) – based on each firm’s NACE
number. The NACE number is the European Classification of Economic Activity number
codified by EUROSTAT according to the 2008 Revision (Rev.2). The NACE numbers are
four digit numbers that group firms into the type of industry and sector for the purpose
of sector analytics.
The first part of the chapter will focus on profiling the investors and investment of the
1125 Taiwanese companies. Based on the information available on the Amadeus
database, and the survey responses from the companies themselves, we characterise
investors based on various parameters such as business form and investor type. In a
similar vein, we also characterise the investment (i.e. the companies based in the EU)
according to shareholder information: for instance, state owned enterprise, private
corporation, as well as practical information like years of establishment and the size of
the enterprise. The goal is to describe the profile of Taiwanese investment into the EU
using cross-sector analysis to show the advantages and disadvantages of investing in
Europe.
The second part will discuss the sectorial distribution of Taiwanese owned firms in
Europe. Manufacturing firms will be subdivided into high and low tech firms, while firms
17
in the service sector will be subdivided into high and low knowledge intensity. The aim is
to present a visual and proportional representation of Taiwanese investment into certain
industries.
The third part is dedicated to the geographical patterns. We will graphically present
Taiwanese investment in firms distributed geographically, in order to elucidate where
industrial clusters are forming within Europe.
The fourth part will present the profitability and labour productivity of Taiwanese
enterprises operating in the EU. Key accounting data is analysed on the aggregate level
and is compared across EU regions and various types of investors.
Finally, the fifth part will present the trends in Taiwanese investment over a ten-year
period. Data on total assets, employment, and turnover will be analysed across sectors
and geographical boundaries to demonstrate the areas of focus for past investment, and
to lay the stage for future investment prognosis. It should be pointed out here, that
commercial databases have not yet been fully populated with financial data for the year
2013. This means that the projections for aggregated employment, turnover, and
investment data, the 2013 data should be viewed with certain restrictions.
2.2 Shareholders of European based Taiwanese firms: Shareholder overview,
ownership structure, size, year of establishment, and business form
EU-Taiwanese trade measures close to USD 50 billion, with the European Union
registering as Taiwan’s fourth largest trading partner. The EU’s confidence in Taiwan has
only increased, with European FDI into Taiwan surpassing USD 30 billion, and accounting
for more than 26 per cent of total FDI into Taiwan. But compared to the 2780 European
companies with planned investments in Taiwan, only 1125 Taiwanese companies are
investing in Europe. This number has increased considerably in the last few years, and it
can only rise.
To better understand the type of OFDI into Europe from Taiwan, it is instructive to gain
insight into the companies’ types of investor makeup. These foreign direct investment
agents consist of corporate entities such as public or private multinational organisations,
or governmental or financial institutions, or even individual or family investors.
Therefore, investment into Europe can either be private or state-backed or joint-
ventures.
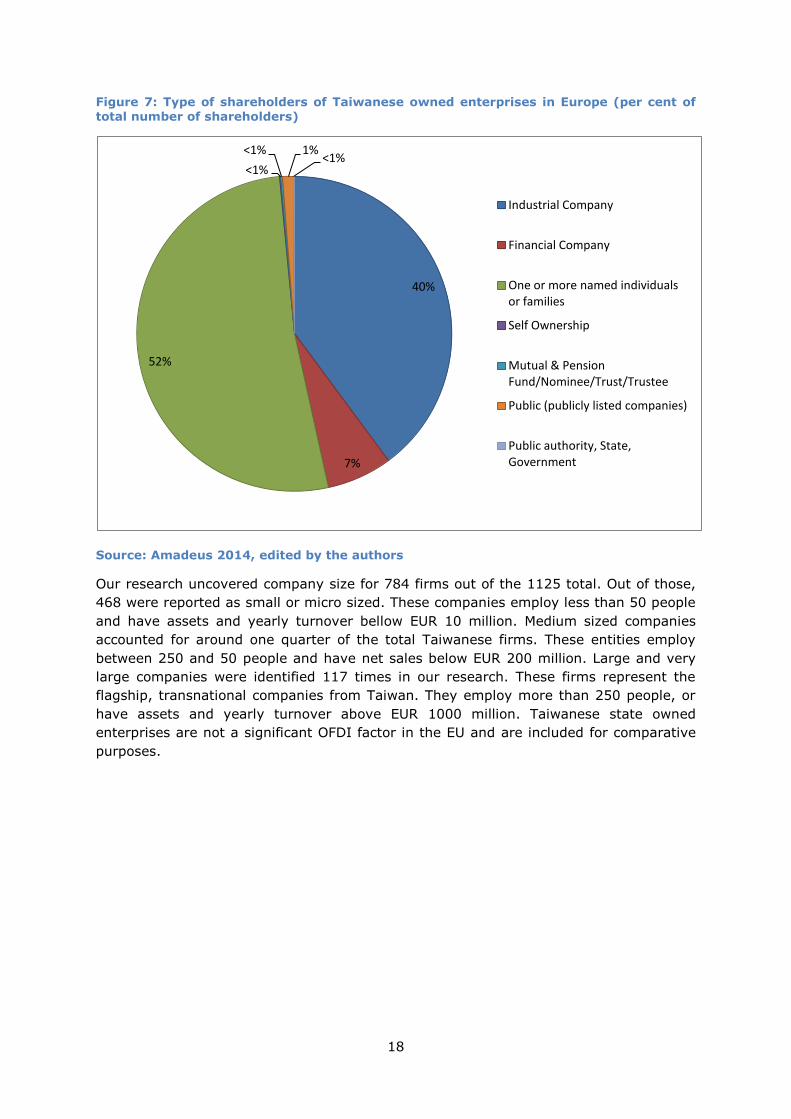
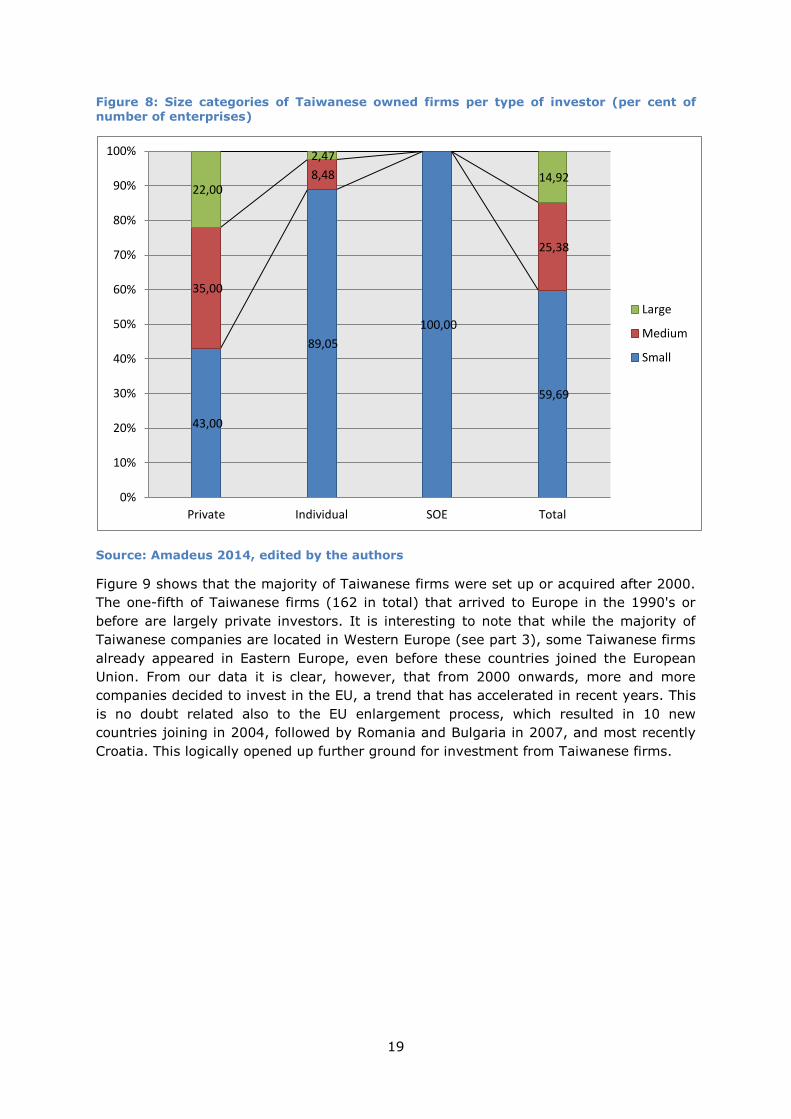
Figure 7 shows that Taiwanese investment in the EU is dominated by individual investors
(52 per cent) as well as industrial companies (40 per cent). Financial companies are the
third largest investors, albeit only at 7 per cent. This phenomenon is especially
interesting in light of Figure 8, which shows that individual investors overwhelmingly
invest in small or micro scale businesses. The private investors category, which
encompass industrial, financial, and other private entities give the majority of medium
and large scale enterprises. As shown later, this also has a significant impact on the
sectorial distribution of Taiwanese investment.
18
Figure 7: Type of shareholders of Taiwanese owned enterprises in Europe (per cent of total number of shareholders)
Source: Amadeus 2014, edited by the authors
Our research uncovered company size for 784 firms out of the 1125 total. Out of those,
468 were reported as small or micro sized. These companies employ less than 50 people
and have assets and yearly turnover bellow EUR 10 million. Medium sized companies
accounted for around one quarter of the total Taiwanese firms. These entities employ
between 250 and 50 people and have net sales below EUR 200 million. Large and very
large companies were identified 117 times in our research. These firms represent the
flagship, transnational companies from Taiwan. They employ more than 250 people, or
have assets and yearly turnover above EUR 1000 million. Taiwanese state owned
enterprises are not a significant OFDI factor in the EU and are included for comparative
purposes.
40%
7%
52%
<1%
<1% 1% <1%
Industrial Company
Financial Company
One or more named individuals or families
Self Ownership
Mutual & Pension Fund/Nominee/Trust/Trustee
Public (publicly listed companies)
Public authority, State, Government
19
Figure 8: Size categories of Taiwanese owned firms per type of investor (per cent of number of enterprises)
Source: Amadeus 2014, edited by the authors
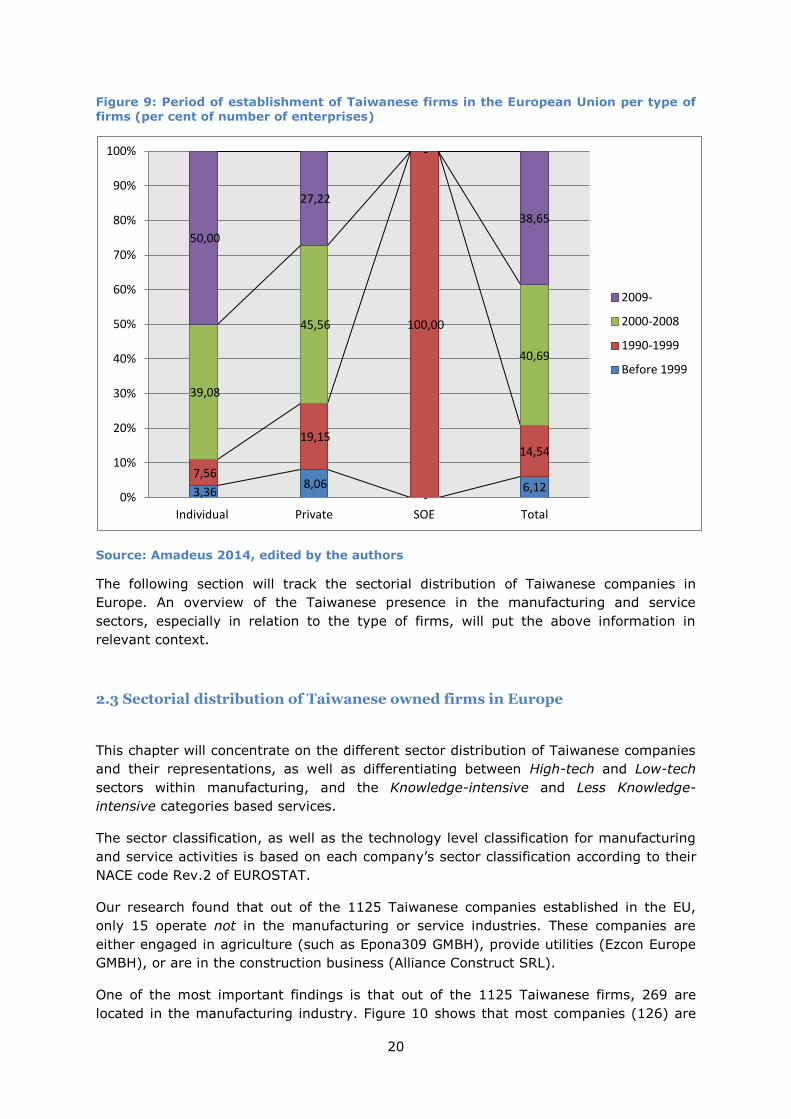
Figure 9 shows that the majority of Taiwanese firms were set up or acquired after 2000.
The one-fifth of Taiwanese firms (162 in total) that arrived to Europe in the 1990's or
before are largely private investors. It is interesting to note that while the majority of
Taiwanese companies are located in Western Europe (see part 3), some Taiwanese firms
already appeared in Eastern Europe, even before these countries joined the European
Union. From our data it is clear, however, that from 2000 onwards, more and more
companies decided to invest in the EU, a trend that has accelerated in recent years. This
is no doubt related also to the EU enlargement process, which resulted in 10 new
countries joining in 2004, followed by Romania and Bulgaria in 2007, and most recently
Croatia. This logically opened up further ground for investment from Taiwanese firms.
43,00
89,05
100,00
59,69
35,00
8,48
25,38
22,00
2,47
14,92
0%
10%
20%
30%
40%
50%
60%
70%
80%
90%
100%
Private Individual SOE Total
Large
Medium
Small
20
Figure 9: Period of establishment of Taiwanese firms in the European Union per type of firms (per cent of number of enterprises)
Source: Amadeus 2014, edited by the authors
The following section will track the sectorial distribution of Taiwanese companies in
Europe. An overview of the Taiwanese presence in the manufacturing and service
sectors, especially in relation to the type of firms, will put the above information in
relevant context.
2.3 Sectorial distribution of Taiwanese owned firms in Europe
This chapter will concentrate on the different sector distribution of Taiwanese companies
and their representations, as well as differentiating between High-tech and Low-tech
sectors within manufacturing, and the Knowledge-intensive and Less Knowledge-
intensive categories based services.
The sector classification, as well as the technology level classification for manufacturing
and service activities is based on each company’s sector classification according to their
NACE code Rev.2 of EUROSTAT.
Our research found that out of the 1125 Taiwanese companies established in the EU,
only 15 operate not in the manufacturing or service industries. These companies are
either engaged in agriculture (such as Epona309 GMBH), provide utilities (Ezcon Europe
GMBH), or are in the construction business (Alliance Construct SRL).
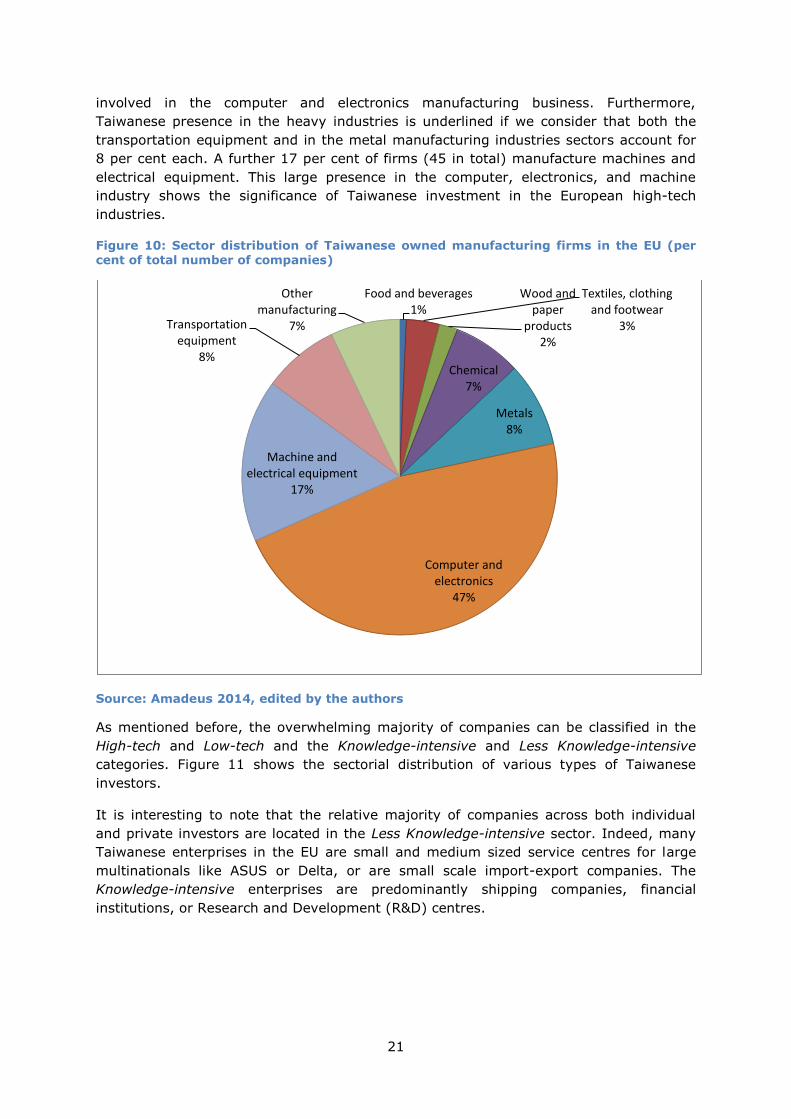
One of the most important findings is that out of the 1125 Taiwanese firms, 269 are
located in the manufacturing industry. Figure 10 shows that most companies (126) are
3,36 8,06
- 6,12
7,56
19,15
100,00
14,54
39,08
45,56
-
40,69
50,00
27,22
-
38,65
0%
10%
20%
30%
40%
50%
60%
70%
80%
90%
100%
Individual Private SOE Total
2009-
2000-2008
1990-1999
Before 1999
21
involved in the computer and electronics manufacturing business. Furthermore,
Taiwanese presence in the heavy industries is underlined if we consider that both the
transportation equipment and in the metal manufacturing industries sectors account for
8 per cent each. A further 17 per cent of firms (45 in total) manufacture machines and
electrical equipment. This large presence in the computer, electronics, and machine
industry shows the significance of Taiwanese investment in the European high-tech
industries.
Figure 10: Sector distribution of Taiwanese owned manufacturing firms in the EU (per cent of total number of companies)
Source: Amadeus 2014, edited by the authors
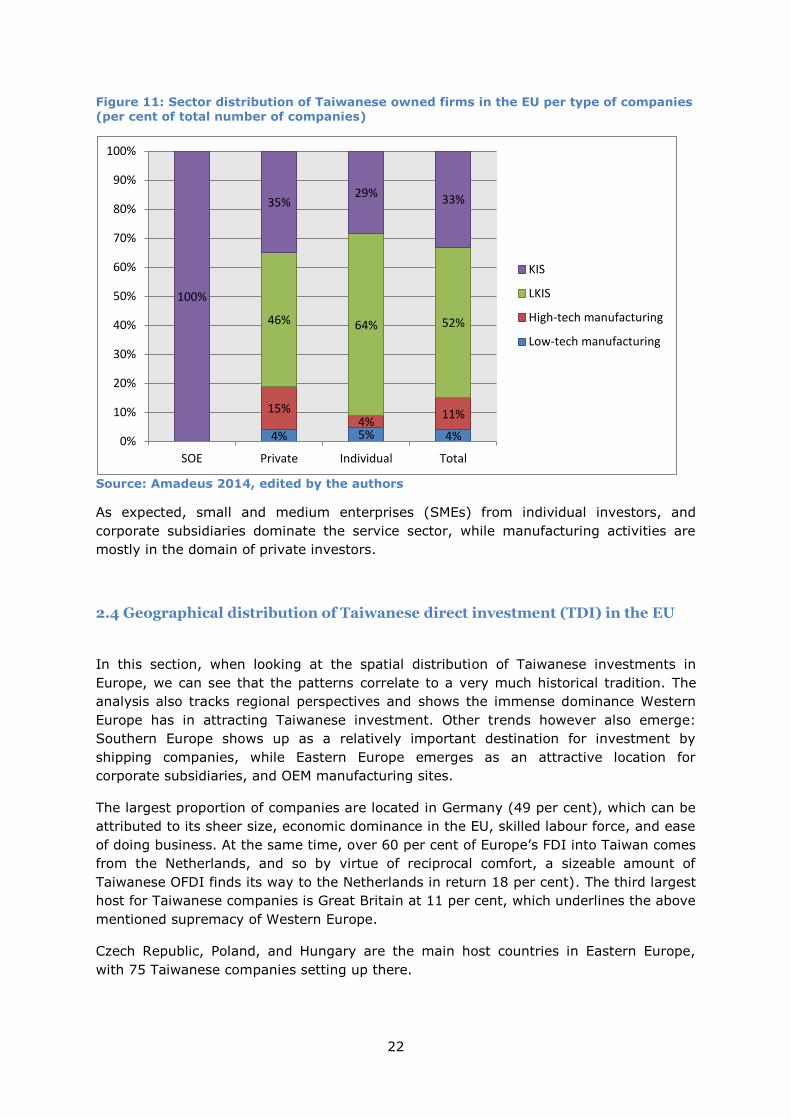
As mentioned before, the overwhelming majority of companies can be classified in the
High-tech and Low-tech and the Knowledge-intensive and Less Knowledge-intensive
categories. Figure 11 shows the sectorial distribution of various types of Taiwanese
investors.
It is interesting to note that the relative majority of companies across both individual
and private investors are located in the Less Knowledge-intensive sector. Indeed, many
Taiwanese enterprises in the EU are small and medium sized service centres for large
multinationals like ASUS or Delta, or are small scale import-export companies. The
Knowledge-intensive enterprises are predominantly shipping companies, financial
institutions, or Research and Development (R&D) centres.
Food and beverages 1%
Textiles, clothing and footwear
3%
Wood and paper
products 2%
Chemical 7%
Metals 8%
Computer and electronics
47%
Machine and electrical equipment
17%
Transportation equipment
8%
Other manufacturing
7%
22
Figure 11: Sector distribution of Taiwanese owned firms in the EU per type of companies (per cent of total number of companies)
Source: Amadeus 2014, edited by the authors
As expected, small and medium enterprises (SMEs) from individual investors, and
corporate subsidiaries dominate the service sector, while manufacturing activities are
mostly in the domain of private investors.
2.4 Geographical distribution of Taiwanese direct investment (TDI) in the EU
In this section, when looking at the spatial distribution of Taiwanese investments in
Europe, we can see that the patterns correlate to a very much historical tradition. The
analysis also tracks regional perspectives and shows the immense dominance Western
Europe has in attracting Taiwanese investment. Other trends however also emerge:
Southern Europe shows up as a relatively important destination for investment by
shipping companies, while Eastern Europe emerges as an attractive location for
corporate subsidiaries, and OEM manufacturing sites.
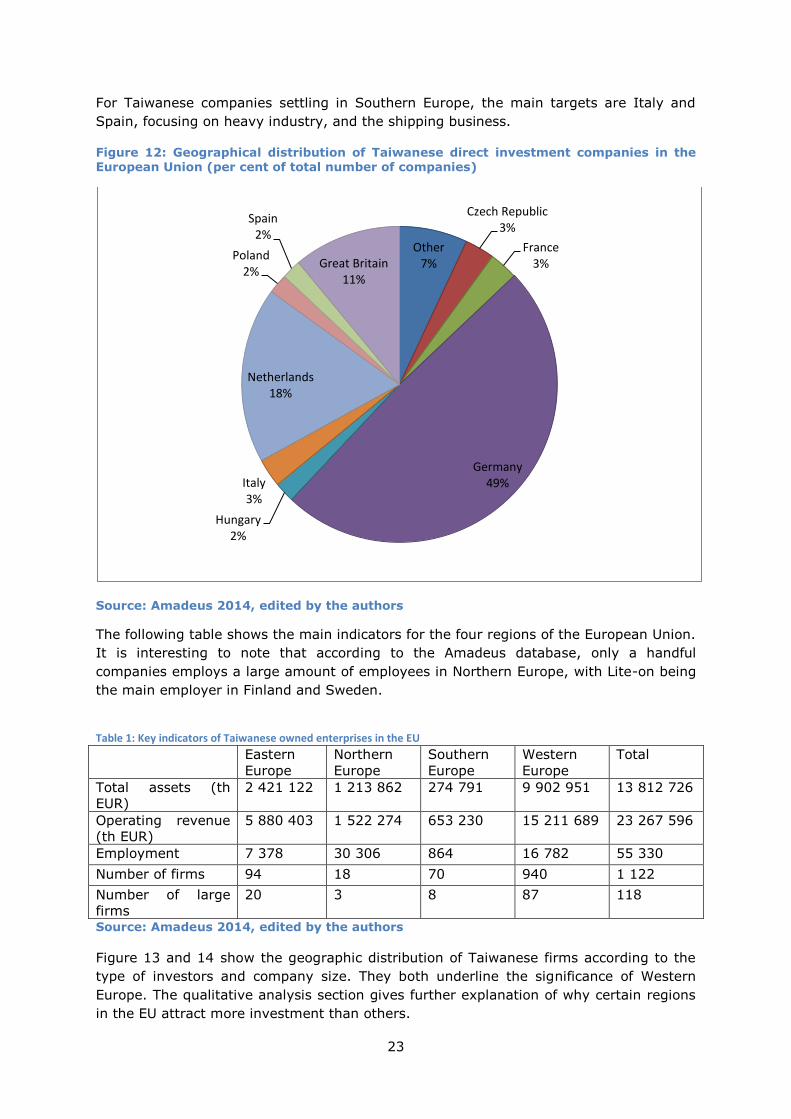
The largest proportion of companies are located in Germany (49 per cent), which can be
attributed to its sheer size, economic dominance in the EU, skilled labour force, and ease
of doing business. At the same time, over 60 per cent of Europe’s FDI into Taiwan comes
from the Netherlands, and so by virtue of reciprocal comfort, a sizeable amount of
Taiwanese OFDI finds its way to the Netherlands in return 18 per cent). The third largest
host for Taiwanese companies is Great Britain at 11 per cent, which underlines the above
mentioned supremacy of Western Europe.
Czech Republic, Poland, and Hungary are the main host countries in Eastern Europe,
with 75 Taiwanese companies setting up there.
4% 5% 4%
15% 4%
11%
46% 64% 52%
100%
35% 29% 33%
0%
10%
20%
30%
40%
50%
60%
70%
80%
90%
100%
SOE Private Individual Total
KIS
LKIS
High-tech manufacturing
Low-tech manufacturing
23
For Taiwanese companies settling in Southern Europe, the main targets are Italy and
Spain, focusing on heavy industry, and the shipping business.
Figure 12: Geographical distribution of Taiwanese direct investment companies in the European Union (per cent of total number of companies)
Source: Amadeus 2014, edited by the authors
The following table shows the main indicators for the four regions of the European Union.
It is interesting to note that according to the Amadeus database, only a handful
companies employs a large amount of employees in Northern Europe, with Lite-on being
the main employer in Finland and Sweden.
Table 1: Key indicators of Taiwanese owned enterprises in the EU Eastern
Europe
Northern
Europe
Southern
Europe
Western
Europe
Total
Total assets (th
EUR)
2 421 122 1 213 862 274 791 9 902 951 13 812 726
Operating revenue
(th EUR)
5 880 403 1 522 274 653 230 15 211 689 23 267 596
Employment 7 378 30 306 864 16 782 55 330
Number of firms 94 18 70 940 1 122
Number of large
firms
20 3 8 87 118
Source: Amadeus 2014, edited by the authors
Figure 13 and 14 show the geographic distribution of Taiwanese firms according to the
type of investors and company size. They both underline the significance of Western
Europe. The qualitative analysis section gives further explanation of why certain regions
in the EU attract more investment than others.
Other 7%
Czech Republic 3%
France 3%
Germany 49%
Hungary 2%
Italy 3%
Netherlands 18%
Poland 2%
Spain 2%
Great Britain 11%
24
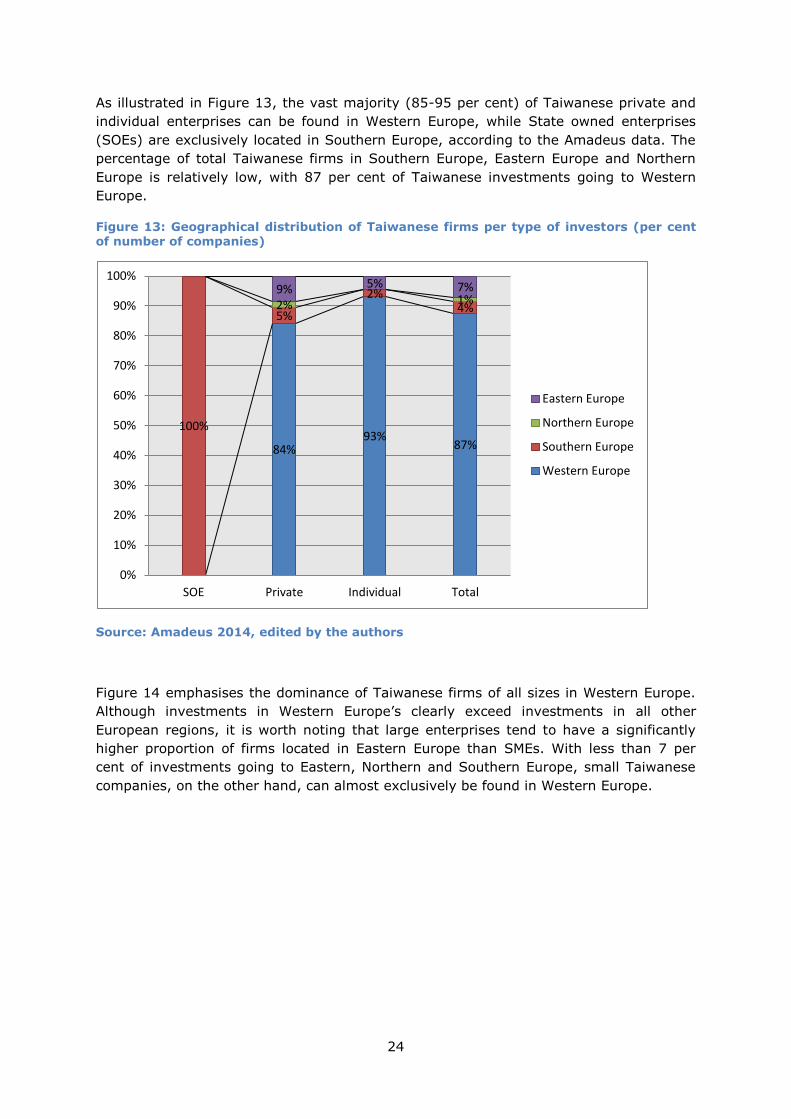
As illustrated in Figure 13, the vast majority (85-95 per cent) of Taiwanese private and
individual enterprises can be found in Western Europe, while State owned enterprises
(SOEs) are exclusively located in Southern Europe, according to the Amadeus data. The
percentage of total Taiwanese firms in Southern Europe, Eastern Europe and Northern
Europe is relatively low, with 87 per cent of Taiwanese investments going to Western
Europe.
Figure 13: Geographical distribution of Taiwanese firms per type of investors (per cent of number of companies)
Source: Amadeus 2014, edited by the authors
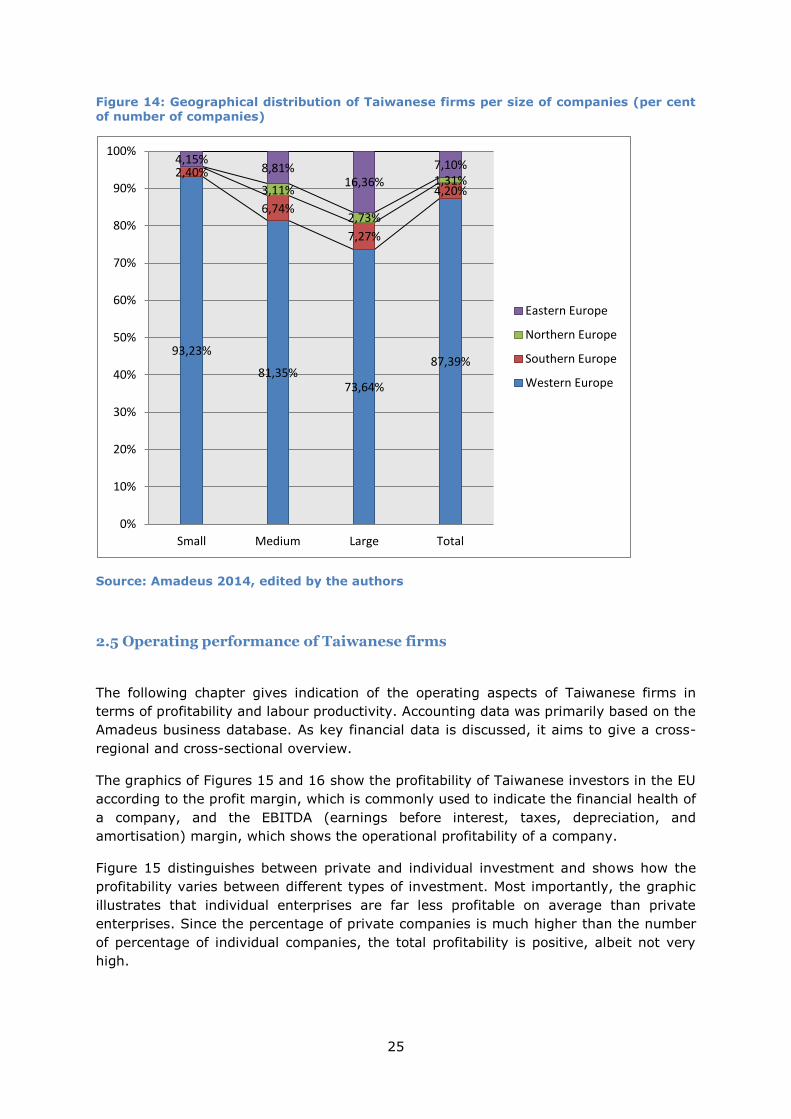
Figure 14 emphasises the dominance of Taiwanese firms of all sizes in Western Europe.
Although investments in Western Europe’s clearly exceed investments in all other
European regions, it is worth noting that large enterprises tend to have a significantly
higher proportion of firms located in Eastern Europe than SMEs. With less than 7 per
cent of investments going to Eastern, Northern and Southern Europe, small Taiwanese
companies, on the other hand, can almost exclusively be found in Western Europe.
84% 93%
87%
100%
5%
2% 4% 2% 1%
9% 5% 7%
0%
10%
20%
30%
40%
50%
60%
70%
80%
90%
100%
SOE Private Individual Total
Eastern Europe
Northern Europe
Southern Europe
Western Europe
25
Figure 14: Geographical distribution of Taiwanese firms per size of companies (per cent of number of companies)
Source: Amadeus 2014, edited by the authors
2.5 Operating performance of Taiwanese firms
The following chapter gives indication of the operating aspects of Taiwanese firms in
terms of profitability and labour productivity. Accounting data was primarily based on the
Amadeus business database. As key financial data is discussed, it aims to give a cross-
regional and cross-sectional overview.
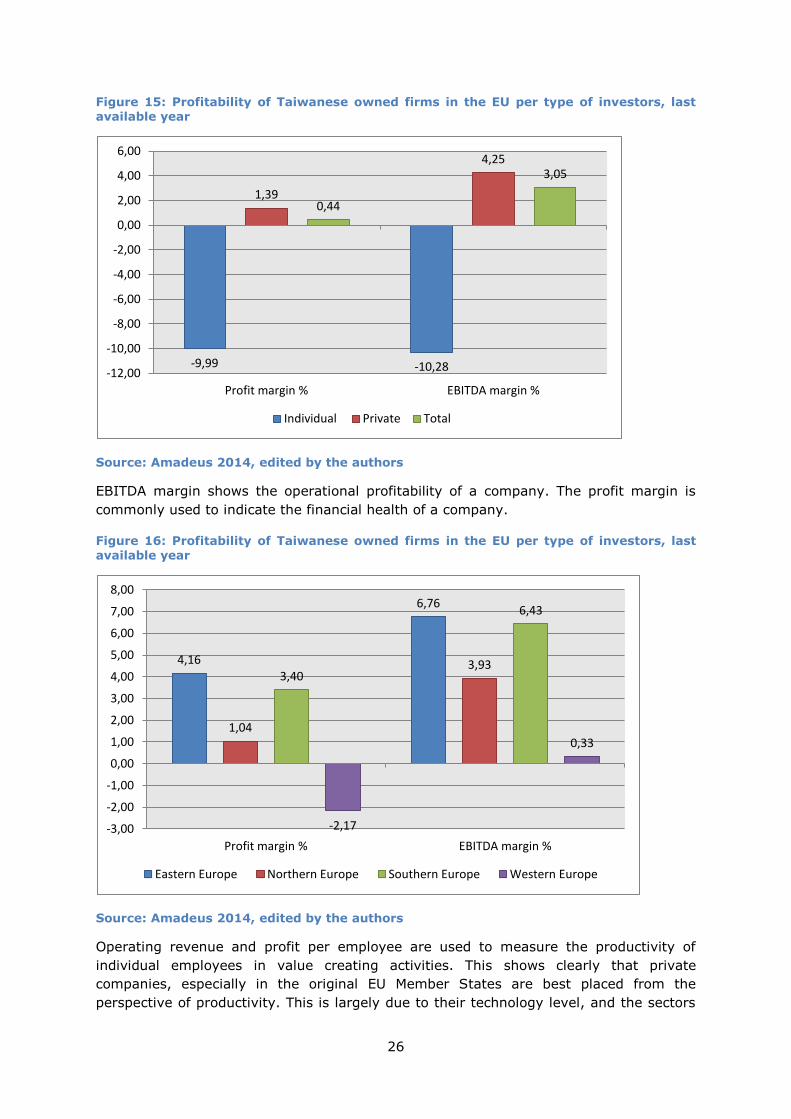
The graphics of Figures 15 and 16 show the profitability of Taiwanese investors in the EU
according to the profit margin, which is commonly used to indicate the financial health of
a company, and the EBITDA (earnings before interest, taxes, depreciation, and
amortisation) margin, which shows the operational profitability of a company.
Figure 15 distinguishes between private and individual investment and shows how the
profitability varies between different types of investment. Most importantly, the graphic
illustrates that individual enterprises are far less profitable on average than private
enterprises. Since the percentage of private companies is much higher than the number
of percentage of individual companies, the total profitability is positive, albeit not very
high.
93,23%
81,35% 73,64%
87,39%
2,40%
6,74%
7,27%
4,20% 3,11%
2,73%
1,31%
4,15% 8,81%
16,36%
7,10%
0%
10%
20%
30%
40%
50%
60%
70%
80%
90%
100%
Small Medium Large Total
Eastern Europe
Northern Europe
Southern Europe
Western Europe
26
Figure 15: Profitability of Taiwanese owned firms in the EU per type of investors, last available year
Source: Amadeus 2014, edited by the authors
EBITDA margin shows the operational profitability of a company. The profit margin is
commonly used to indicate the financial health of a company.
Figure 16: Profitability of Taiwanese owned firms in the EU per type of investors, last available year
Source: Amadeus 2014, edited by the authors
Operating revenue and profit per employee are used to measure the productivity of
individual employees in value creating activities. This shows clearly that private
companies, especially in the original EU Member States are best placed from the
perspective of productivity. This is largely due to their technology level, and the sectors
-9,99 -10,28
1,39
4,25
0,44
3,05
-12,00
-10,00
-8,00
-6,00
-4,00
-2,00
0,00
2,00
4,00
6,00
Profit margin % EBITDA margin %
Individual Private Total
4,16
6,76
1,04
3,93 3,40
6,43
-2,17
0,33
-3,00
-2,00
-1,00
0,00
1,00
2,00
3,00
4,00
5,00
6,00
7,00
8,00
Profit margin % EBITDA margin %
Eastern Europe Northern Europe Southern Europe Western Europe
27
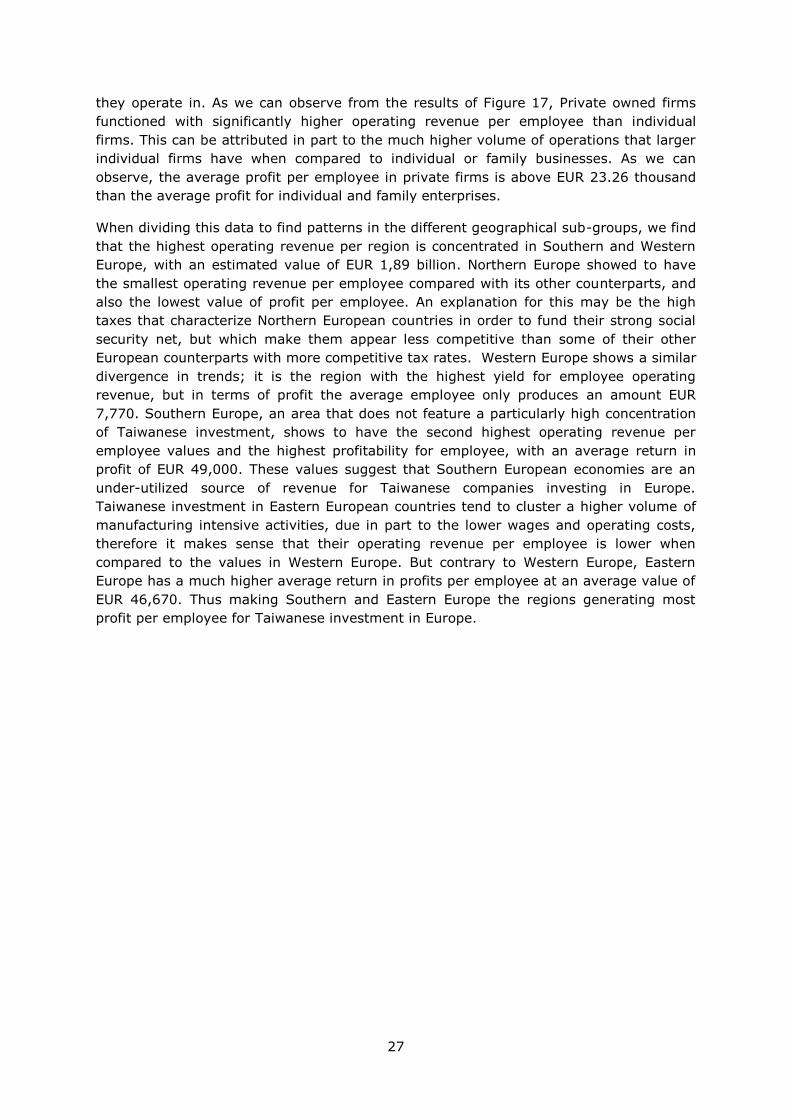
they operate in. As we can observe from the results of Figure 17, Private owned firms
functioned with significantly higher operating revenue per employee than individual
firms. This can be attributed in part to the much higher volume of operations that larger
individual firms have when compared to individual or family businesses. As we can
observe, the average profit per employee in private firms is above EUR 23.26 thousand
than the average profit for individual and family enterprises.
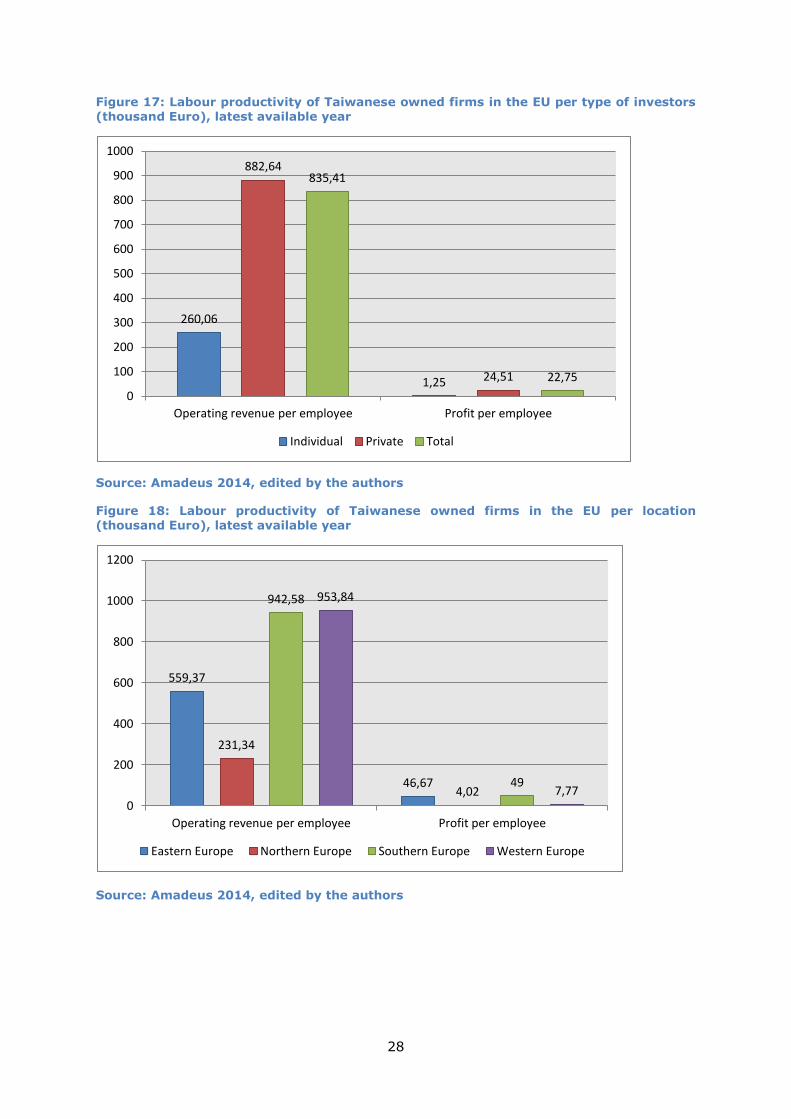
When dividing this data to find patterns in the different geographical sub-groups, we find
that the highest operating revenue per region is concentrated in Southern and Western
Europe, with an estimated value of EUR 1,89 billion. Northern Europe showed to have
the smallest operating revenue per employee compared with its other counterparts, and
also the lowest value of profit per employee. An explanation for this may be the high
taxes that characterize Northern European countries in order to fund their strong social
security net, but which make them appear less competitive than some of their other
European counterparts with more competitive tax rates. Western Europe shows a similar
divergence in trends; it is the region with the highest yield for employee operating
revenue, but in terms of profit the average employee only produces an amount EUR
7,770. Southern Europe, an area that does not feature a particularly high concentration
of Taiwanese investment, shows to have the second highest operating revenue per
employee values and the highest profitability for employee, with an average return in
profit of EUR 49,000. These values suggest that Southern European economies are an
under-utilized source of revenue for Taiwanese companies investing in Europe.
Taiwanese investment in Eastern European countries tend to cluster a higher volume of
manufacturing intensive activities, due in part to the lower wages and operating costs,
therefore it makes sense that their operating revenue per employee is lower when
compared to the values in Western Europe. But contrary to Western Europe, Eastern
Europe has a much higher average return in profits per employee at an average value of
EUR 46,670. Thus making Southern and Eastern Europe the regions generating most
profit per employee for Taiwanese investment in Europe.
28
Figure 17: Labour productivity of Taiwanese owned firms in the EU per type of investors (thousand Euro), latest available year
Source: Amadeus 2014, edited by the authors
Figure 18: Labour productivity of Taiwanese owned firms in the EU per location (thousand Euro), latest available year
Source: Amadeus 2014, edited by the authors
260,06
1,25
882,64
24,51
835,41
22,75
0
100
200
300
400
500
600
700
800
900
1000
Operating revenue per employee Profit per employee
Individual Private Total
559,37
46,67
231,34
4,02
942,58
49
953,84
7,77 0
200
400
600
800
1000
1200
Operating revenue per employee Profit per employee
Eastern Europe Northern Europe Southern Europe Western Europe
29
2.6 Ten-year trend analysis
For the ten-year trend analysis portion of this study we will look at the aggregate data
extending from 2004 to the present. It is important to note for this section that some of
the information extracted from databases has appeared to be incomplete. To an extent
we have complemented this information from the different data provided by the
Taiwanese Investment Commission, the results from the surveys, and other sources.
When all of these sources have proven insufficient to fulfil the gap in our data we have
made a note specifying these methodological issues, so that the reader may take into
account any anomalous trend appearing on this paper.
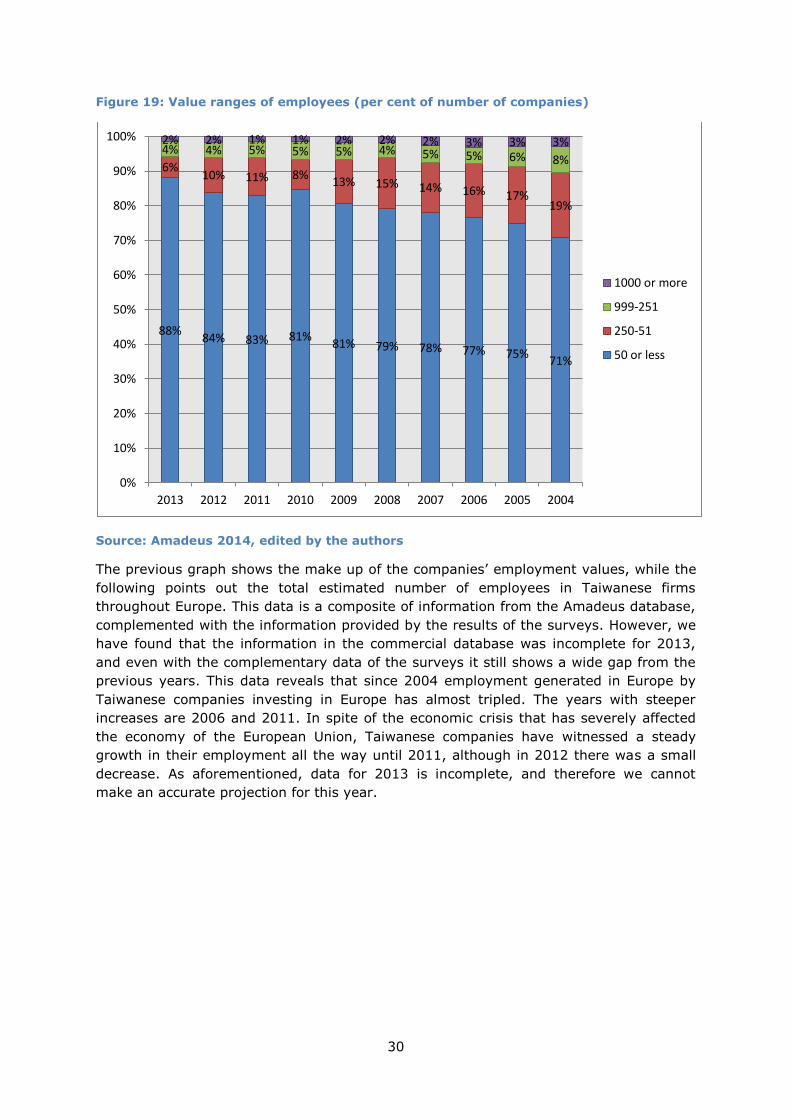
For this project we have looked at the amount of employment in Europe created by
Taiwanese investment. In order to look at the trends and the different structure in
Taiwanese investment employment creation, first we may see in Figure 19 the
composition in percentage terms of the value ranges of employment. What we find is
that since the year 2004 Taiwanese SMEs have been the main creators of employment
for Taiwanese investment in Europe. Since 2004 SMEs have slowly increased their share
in employment of 17 per cent until 2013, accounting for 88 per cent of all employment
generated by Taiwanese investment. Medium enterprises have seen a decrease of
relevance in terms of their generation of employment in the overall trend of Taiwanese
investment into Europe, in 2004 they accounted for 19 per cent of employment,
however, they notably decreased their influence, and accounted in 2013 for only 6 per
cent. Large companies followed a similar evolution as medium enterprises, although their
decline was less steep as that of medium enterprises, facing only a shrinkage of 4 per
cent. Very large companies have maintained very low values in terms of percentage, and
they also saw their value share decrease from 2004 data until 2010 and 2011, years in
which they only accounted for 1 per cent of companies in the range of 1,000 or more
employees. However, they have seen a modest increase of one per cent in 2012, which
has maintained for 2013.
30
Figure 19: Value ranges of employees (per cent of number of companies)
Source: Amadeus 2014, edited by the authors
The previous graph shows the make up of the companies’ employment values, while the
following points out the total estimated number of employees in Taiwanese firms
throughout Europe. This data is a composite of information from the Amadeus database,
complemented with the information provided by the results of the surveys. However, we
have found that the information in the commercial database was incomplete for 2013,
and even with the complementary data of the surveys it still shows a wide gap from the
previous years. This data reveals that since 2004 employment generated in Europe by
Taiwanese companies investing in Europe has almost tripled. The years with steeper
increases are 2006 and 2011. In spite of the economic crisis that has severely affected
the economy of the European Union, Taiwanese companies have witnessed a steady
growth in their employment all the way until 2011, although in 2012 there was a small
decrease. As aforementioned, data for 2013 is incomplete, and therefore we cannot
make an accurate projection for this year.
88% 84% 83% 81%
81% 79% 78% 77% 75% 71%
6% 10% 11% 8%
13% 15% 14% 16% 17% 19%
4% 4% 5% 5% 5% 4% 5% 5% 6% 8%
2% 2% 1% 1% 2% 2% 2% 3% 3% 3%
0%
10%
20%
30%
40%
50%
60%
70%
80%
90%
100%
2013 2012 2011 2010 2009 2008 2007 2006 2005 2004
1000 or more
999-251
250-51
50 or less
31
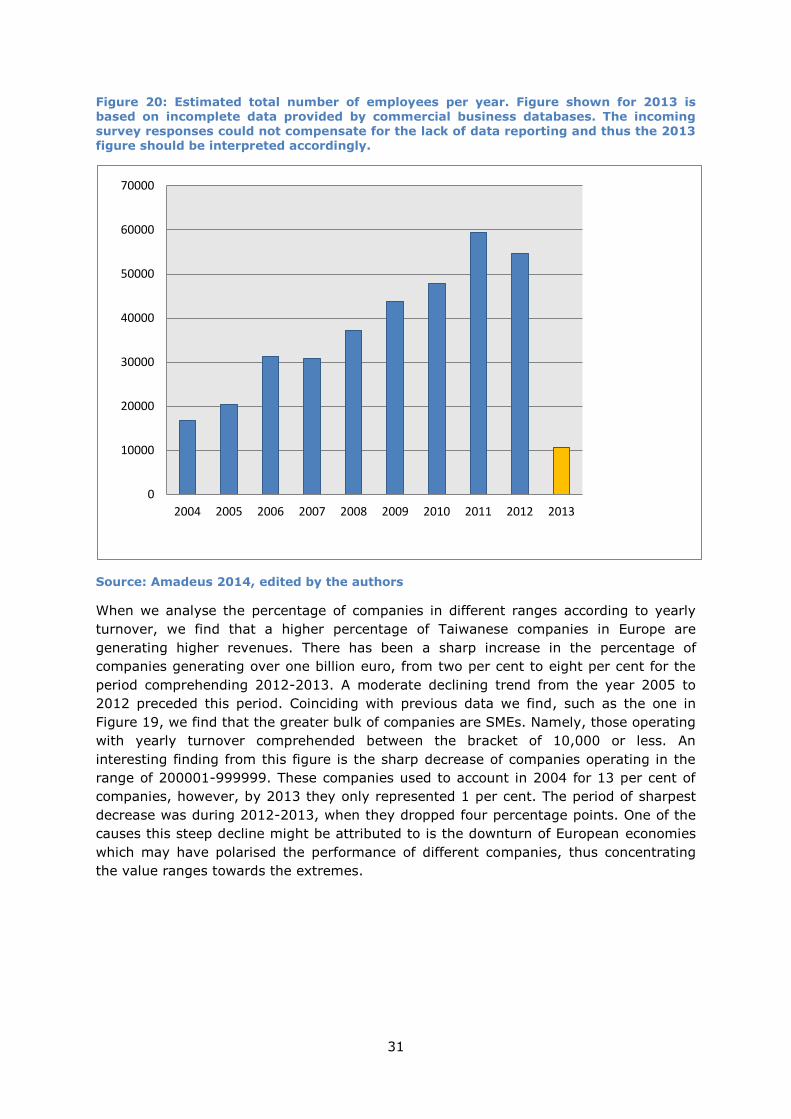
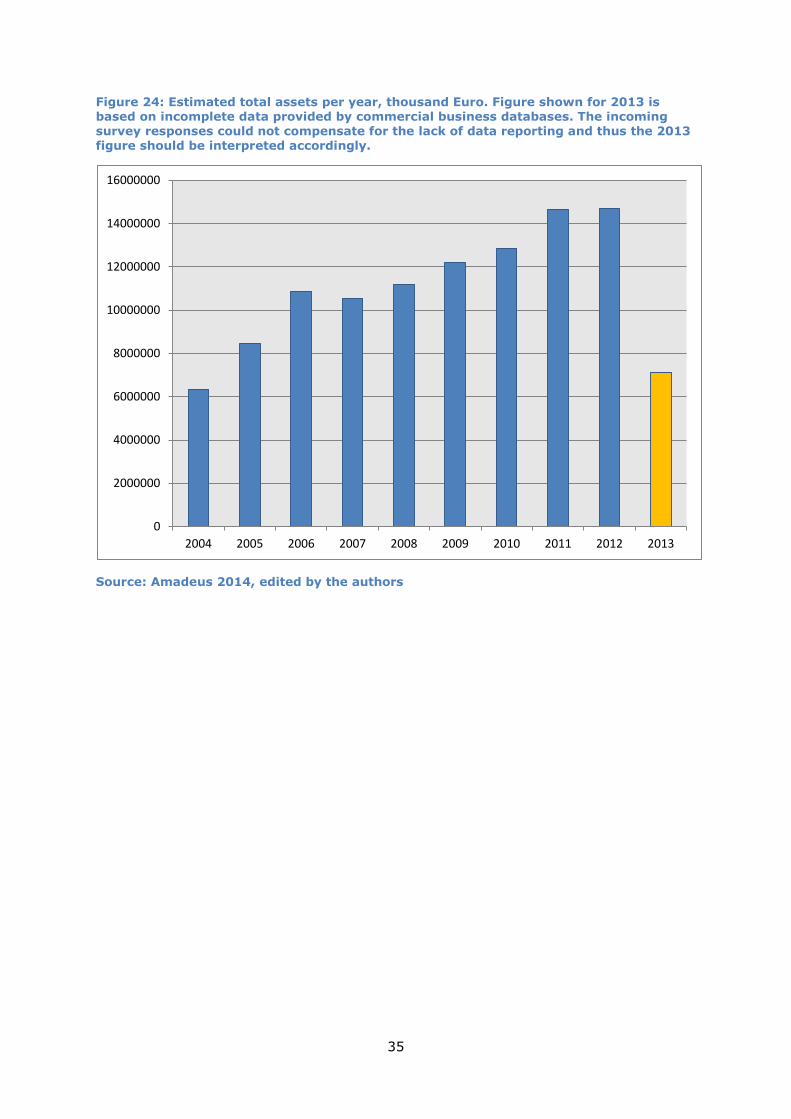
Figure 20: Estimated total number of employees per year. Figure shown for 2013 is based on incomplete data provided by commercial business databases. The incoming
survey responses could not compensate for the lack of data reporting and thus the 2013 figure should be interpreted accordingly.
Source: Amadeus 2014, edited by the authors
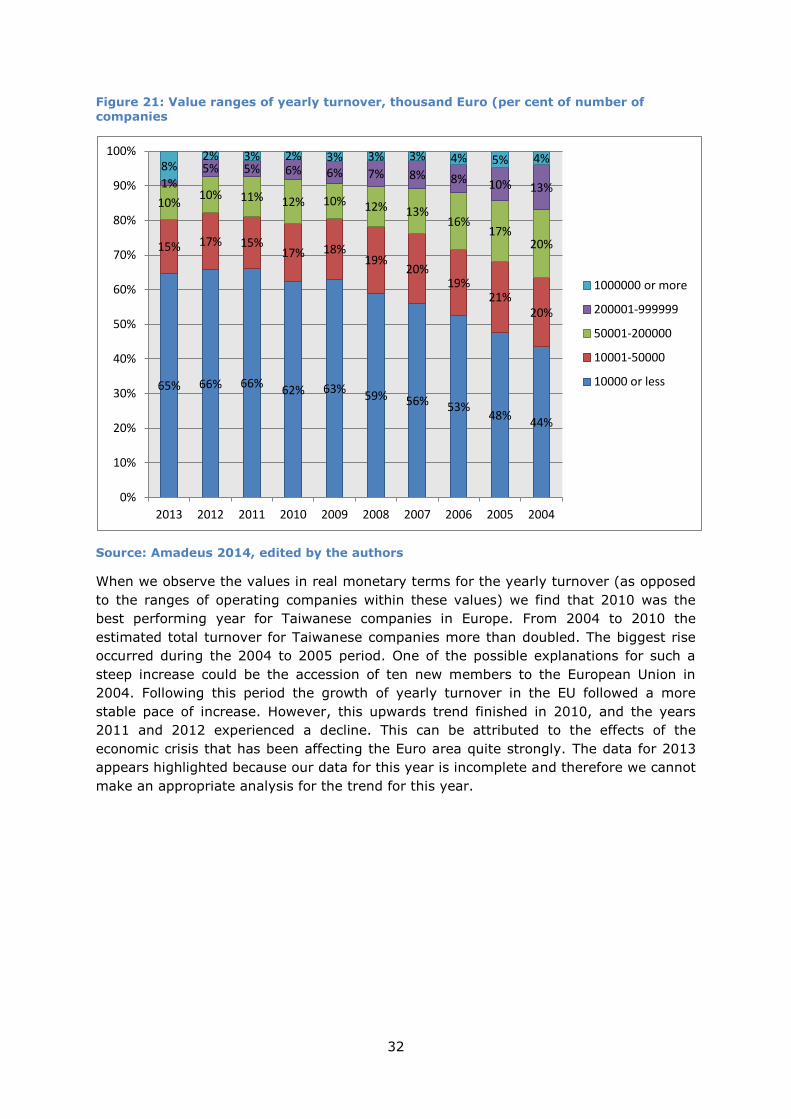
When we analyse the percentage of companies in different ranges according to yearly
turnover, we find that a higher percentage of Taiwanese companies in Europe are
generating higher revenues. There has been a sharp increase in the percentage of
companies generating over one billion euro, from two per cent to eight per cent for the
period comprehending 2012-2013. A moderate declining trend from the year 2005 to
2012 preceded this period. Coinciding with previous data we find, such as the one in
Figure 19, we find that the greater bulk of companies are SMEs. Namely, those operating
with yearly turnover comprehended between the bracket of 10,000 or less. An
interesting finding from this figure is the sharp decrease of companies operating in the
range of 200001-999999. These companies used to account in 2004 for 13 per cent of
companies, however, by 2013 they only represented 1 per cent. The period of sharpest
decrease was during 2012-2013, when they dropped four percentage points. One of the
causes this steep decline might be attributed to is the downturn of European economies
which may have polarised the performance of different companies, thus concentrating
the value ranges towards the extremes.
0
10000
20000
30000
40000
50000
60000
70000
2004 2005 2006 2007 2008 2009 2010 2011 2012 2013
32
Figure 21: Value ranges of yearly turnover, thousand Euro (per cent of number of companies
Source: Amadeus 2014, edited by the authors
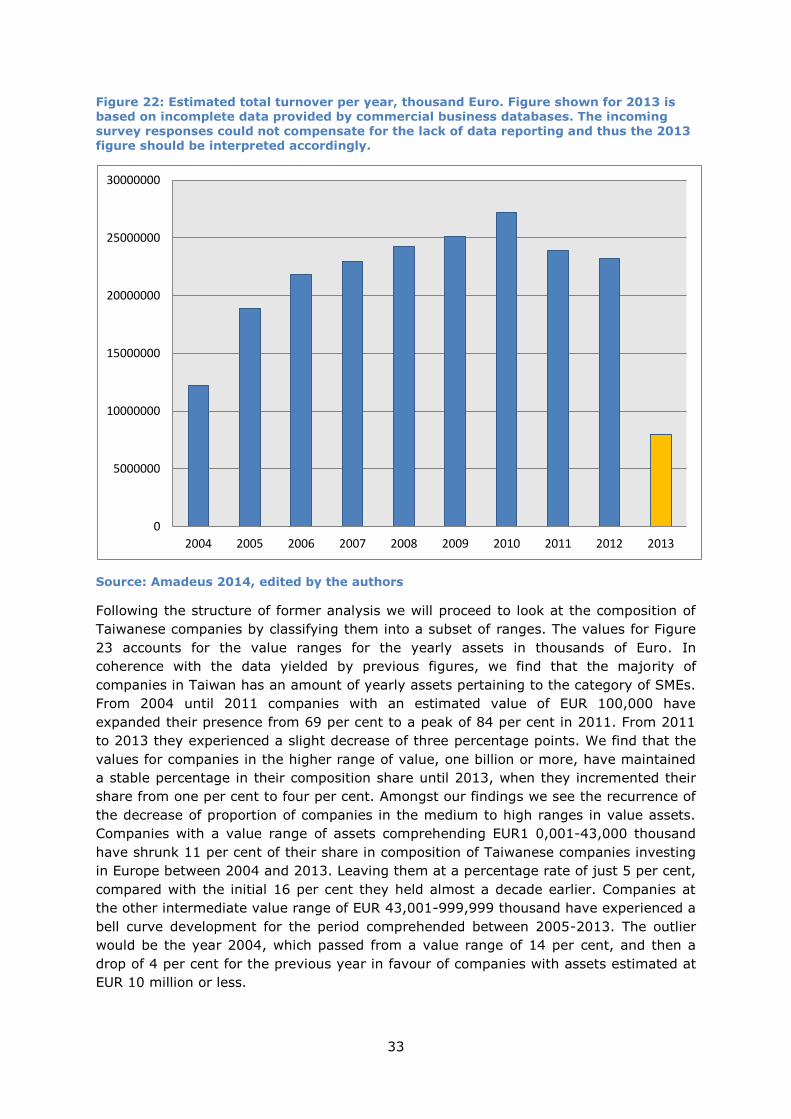
When we observe the values in real monetary terms for the yearly turnover (as opposed
to the ranges of operating companies within these values) we find that 2010 was the
best performing year for Taiwanese companies in Europe. From 2004 to 2010 the
estimated total turnover for Taiwanese companies more than doubled. The biggest rise
occurred during the 2004 to 2005 period. One of the possible explanations for such a
steep increase could be the accession of ten new members to the European Union in
2004. Following this period the growth of yearly turnover in the EU followed a more
stable pace of increase. However, this upwards trend finished in 2010, and the years
2011 and 2012 experienced a decline. This can be attributed to the effects of the
economic crisis that has been affecting the Euro area quite strongly. The data for 2013
appears highlighted because our data for this year is incomplete and therefore we cannot
make an appropriate analysis for the trend for this year.
65% 66% 66% 62% 63%
59% 56% 53% 48%
44%
15% 17% 15% 17% 18%
19% 20%
19% 21%
20%
10% 10% 11% 12% 10% 12% 13%
16% 17%
20%
1% 5% 5% 6% 6% 7% 8% 8% 10% 13%
8% 2% 3% 2% 3% 3% 3% 4% 5% 4%
0%
10%
20%
30%
40%
50%
60%
70%
80%
90%
100%
2013 2012 2011 2010 2009 2008 2007 2006 2005 2004
1000000 or more
200001-999999
50001-200000
10001-50000
10000 or less
33
Figure 22: Estimated total turnover per year, thousand Euro. Figure shown for 2013 is based on incomplete data provided by commercial business databases. The incoming
survey responses could not compensate for the lack of data reporting and thus the 2013 figure should be interpreted accordingly.
Source: Amadeus 2014, edited by the authors
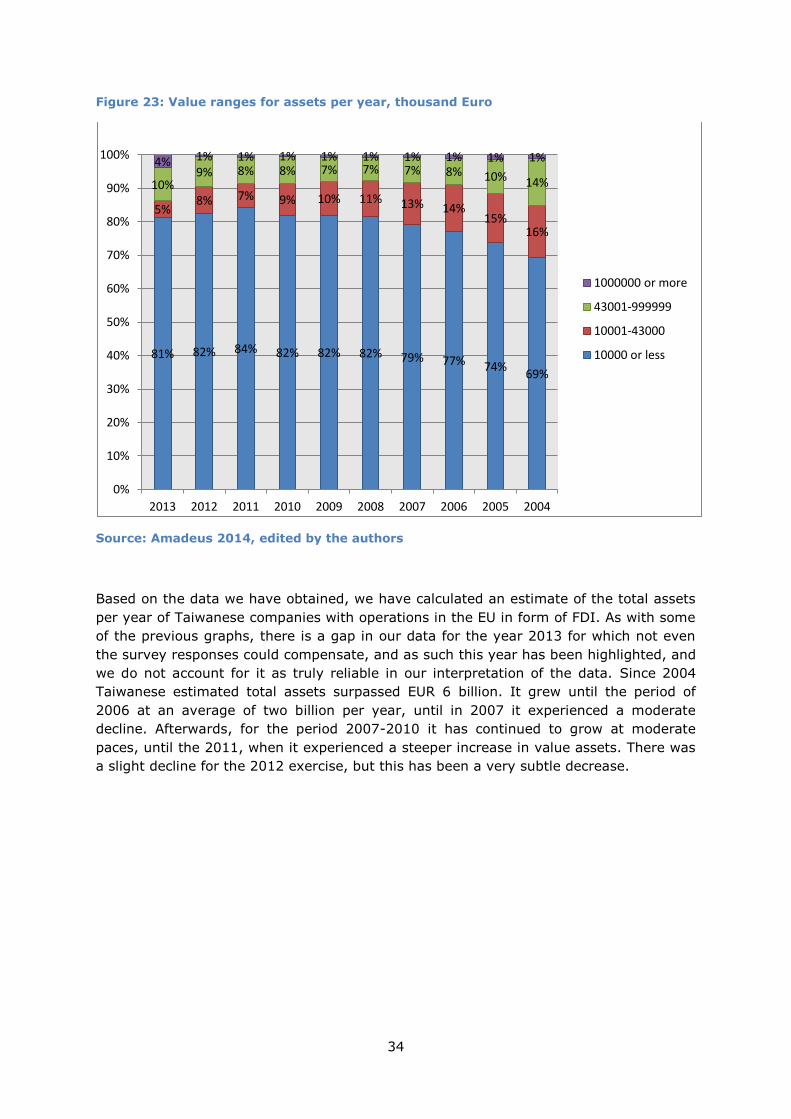
Following the structure of former analysis we will proceed to look at the composition of
Taiwanese companies by classifying them into a subset of ranges. The values for Figure
23 accounts for the value ranges for the yearly assets in thousands of Euro. In
coherence with the data yielded by previous figures, we find that the majority of
companies in Taiwan has an amount of yearly assets pertaining to the category of SMEs.
From 2004 until 2011 companies with an estimated value of EUR 100,000 have
expanded their presence from 69 per cent to a peak of 84 per cent in 2011. From 2011
to 2013 they experienced a slight decrease of three percentage points. We find that the
values for companies in the higher range of value, one billion or more, have maintained
a stable percentage in their composition share until 2013, when they incremented their
share from one per cent to four per cent. Amongst our findings we see the recurrence of
the decrease of proportion of companies in the medium to high ranges in value assets.
Companies with a value range of assets comprehending EUR1 0,001-43,000 thousand
have shrunk 11 per cent of their share in composition of Taiwanese companies investing
in Europe between 2004 and 2013. Leaving them at a percentage rate of just 5 per cent,
compared with the initial 16 per cent they held almost a decade earlier. Companies at
the other intermediate value range of EUR 43,001-999,999 thousand have experienced a
bell curve development for the period comprehended between 2005-2013. The outlier
would be the year 2004, which passed from a value range of 14 per cent, and then a
drop of 4 per cent for the previous year in favour of companies with assets estimated at
EUR 10 million or less.
0
5000000
10000000
15000000
20000000
25000000
30000000
2004 2005 2006 2007 2008 2009 2010 2011 2012 2013
34
Figure 23: Value ranges for assets per year, thousand Euro
Source: Amadeus 2014, edited by the authors
Based on the data we have obtained, we have calculated an estimate of the total assets
per year of Taiwanese companies with operations in the EU in form of FDI. As with some
of the previous graphs, there is a gap in our data for the year 2013 for which not even
the survey responses could compensate, and as such this year has been highlighted, and
we do not account for it as truly reliable in our interpretation of the data. Since 2004
Taiwanese estimated total assets surpassed EUR 6 billion. It grew until the period of
2006 at an average of two billion per year, until in 2007 it experienced a moderate
decline. Afterwards, for the period 2007-2010 it has continued to grow at moderate
paces, until the 2011, when it experienced a steeper increase in value assets. There was
a slight decline for the 2012 exercise, but this has been a very subtle decrease.
81% 82% 84% 82% 82% 82% 79% 77% 74% 69%
5% 8% 7% 9% 10% 11% 13% 14%
15% 16%
10% 9% 8% 8% 7% 7% 7% 8% 10% 14%
4% 1% 1% 1% 1% 1% 1% 1% 1% 1%
0%
10%
20%
30%
40%
50%
60%
70%
80%
90%
100%
2013 2012 2011 2010 2009 2008 2007 2006 2005 2004
1000000 or more
43001-999999
10001-43000
10000 or less
35
Figure 24: Estimated total assets per year, thousand Euro. Figure shown for 2013 is based on incomplete data provided by commercial business databases. The incoming
survey responses could not compensate for the lack of data reporting and thus the 2013 figure should be interpreted accordingly.
Source: Amadeus 2014, edited by the authors
0
2000000
4000000
6000000
8000000
10000000
12000000
14000000
16000000
2004 2005 2006 2007 2008 2009 2010 2011 2012 2013
36
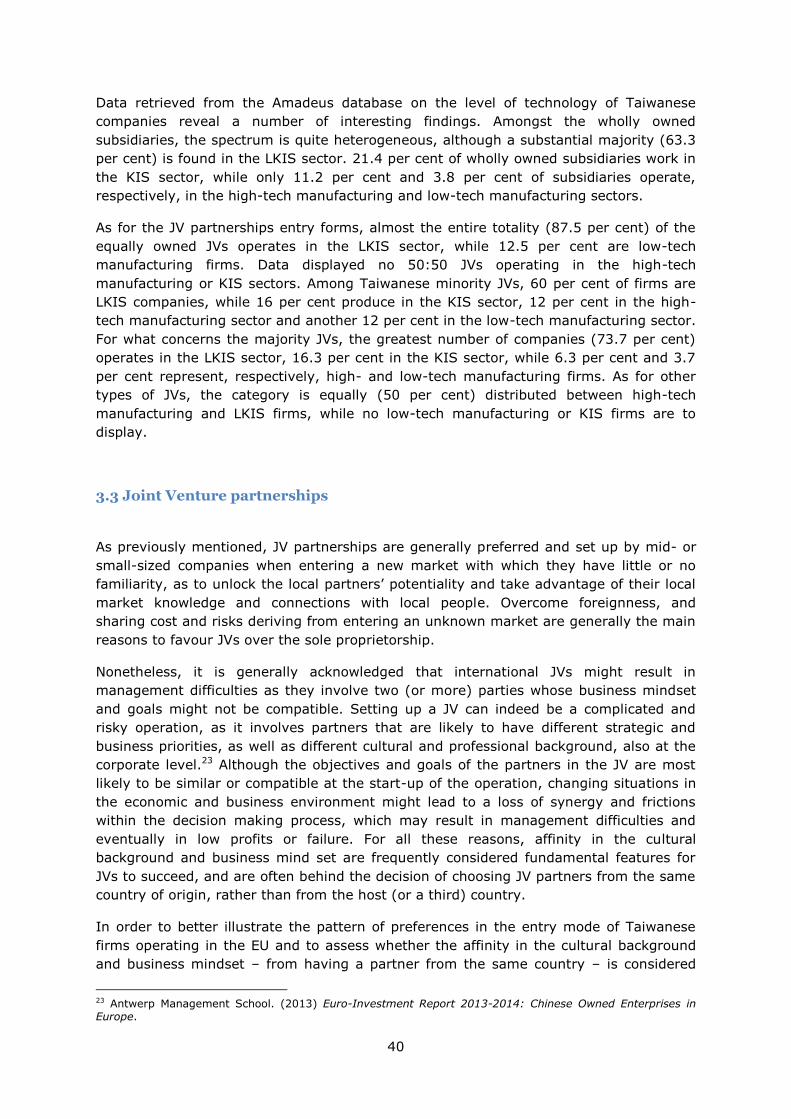
Chapter 3. Entry form, ownership control and partnership of
Taiwanese owned enterprises in the EU
3.1 Introduction
The entry form, known as the way a firm expands its business into a foreign market, and
joint venture partnership type, known as the kind of commercial enterprise undertaken
jointly by two (or more) commercial partners, are significant aspects of the
internationalisation strategy of companies. Nonetheless, few empirical studies have been
conducted so far on these characteristics for Taiwanese enterprises operating in the
European Union on the basis of large-scale database. This chapter uses data acquired
from the Amadeus database to study and provide a realistic picture of the patterns in the
entry modes, ownership structures and partnership strategies adopted by Taiwanese
owned companies operating in the EU. To this sake, the entry strategy and partnership
composition in joint ventures of Taiwanese firms will be analysed according to their
geographical location, business activity sector and other company specific factors, in
order to better understand their internationalisation strategy and process. The above
indicators were available and retrieved from the Amadeus database and from our online
survey for an amount of 815 out of the total 1125 Taiwanese companies operating in the
EU. Companies were further classified according to the geographical location, based on
their Country ISO code, and business activity sector, based on each firm’s NACE number
– as already done for earlier chapters.
This chapter is divided into three parts. The first part analyses the entry mode and
ownership structure of Taiwanese owned companies operating in the European Union,
paying specific attention to wholly owned subsidiaries, minority joint ventures (JVs),
majority JVs, 50:50 JVs or other forms of JVs to assess whether a preferred entry mode
to the Member States could be recognized. Moreover, the main factors (e.g. strategies,
size, ownership, business activity sector, financial capabilities, desire of full control over
decision making) that influence the general entry mode of Taiwanese companies are
identified. The second part of the chapter analyses the partnership patters of the
Taiwanese firms in JVs, displaying countries of origin of partners in the JVs (whether
they are from Taiwan, host country, third country, both or unknown) as well as the
partnership structure according to the type of business sector the operate in. To this
sake, Taiwanese companies are be sub-divided into high- and low-tech manufacturing
firms, and Knowledge-Intensive Services (KIS) and Less Knowledge Intensive Services
(LKIS) firms if in the service sector.
3.2 Entry form and ownership structure
The entry form and ownership structure are two of the most significant characteristics in
the internationalisation and investment strategy of multinational companies. A general
definition of entry form is the one first provided by Erin Anderson and Hubert Gatignon in
their Transaction Cost Theory, which defined entry mode as the way in which a firm
expands its business into foreign markets, including also the institutional arrangements
37
that arise because of this.16 Such theory suggests that the entry form adopted by a firm
depends on the related transaction costs, with the purpose of minimising them. Franklin
R. Root defined entry mode as the institutional arrangements implemented by a firm to
transfer its products, techniques, human resources, management or other resources to
an international or foreign market.17
Transaction Cost Theory further proposes that foreign competitiveness is related to firm-
specific assets, such as technology know-how, management skills, and product
differentiation.18 Therefore, Taiwanese multinational companies, well endowed with firm-
specific assets, are more likely to establish vertically integrated, wholly owned subsidies
for better local responsiveness. Meanwhile, joint ventures might be preferred by small
and medium sized businesses with less firm-specific assets to ally with local partners to
better exploit local resources. However, as this chapter shows, Taiwanese firms in
general prefer entering the European markets through wholly owned subsidiaries. The
relevant literature explains this choice by arguing that Taiwanese companies favour
owning the capacity for local responsiveness.19
As discussed above, the choice of a particular entry form – a wholly owned subsidiary or
some kind of JV – consists in a trade-off between different considerations, not only
related to the specific resources and strategies of the firms, but which depend also on
the location factors and regulations of host countries.20 The entry form of wholly owned
subsidiaries allows firms to independently decide their forms of organisational structure
as well as their way of management, and allows for a higher degree of control over the
decision making process and to solely cope with the risk of performance arising from
market uncertainty. In terms of market expansion, firms adopting the entry mode of
wholly owned subsidiary can fully control the whole system of production and sales, and
encounter fewer agency cost. On the other hand, however, the lack of connections with
local partners makes it more difficult for them to access sale channels or raw materials
in the local market, which generates more expansion costs.21 For this reason, studies
support that only larger firms, with more resources, information and better capabilities
to cope with risks, are generally more likely to choose the wholly owned subsidiary as
their entry mode in a new country.22
On the other hand, a lower degree of familiarity with the local market and preference to
share development costs and risks from market uncertainty among partners, appear to
be the main reasons behind the choice of a JV as entry form into a new country. When
direct experience with the host market is little or absent, companies are more likely to
set up JVs with local partners to get access more easily to market knowledge and take
advantage of the connections with local people. JVs are hence generally preferred by
small firms entering a new country, as they allow both partners to share costs, risks and
profits based on the investment proportions, and allow for greater understanding of the
16 Anderson, E., Gatignoon, H. (1986). Mode of foreign entry: A transaction cost analysis and propositions, Journal of International Business Studies, Vol.17, No.3 pp.1-26. 17 Root, F. (1987). Entry Strategies for International Markets, Lexington Books, Rowman & Littlefield. 18 Anderson, E., Gatignoon, H. (1986). Mode of foreign entry: A transaction cost analysis and propositions. 19 Chen, TJ. (2006). Liability of foreignness and entry mode choice: Taiwanese firms in Europe. Journal of Business Research, Vol. 59, pp.288-294. 20 Agarwal, S., Ramaswani, S.N. (1992). Choice of foreign market entry mode: impact on ownership, location and internalization factors, Journal of International Business Studies, Vol.23, No.1, pp.1-27. cited in Antwerp Management School. (2013). Euro-Investment Report 2013-2014: Chinese Owned Enterprises in Europe. 21 Yung-Heng Lee, Yann-Haur Huang, Mei-Jane Chan, Choice between Wholly-Owned Subsidiaries and Joint Venture of Taiwanese Firms in China–A Transaction Cost Perspective, Journal of Global Business Management, Volume 4, Issue 2, October 2008 22 Ibid.
38
local market dynamics thanks to the collaboration with local partners. Indeed, local
partners in the JV contribute greatly to the management performance, because of their
pre-existing connections with local people and market. By contrast, however, JV
partnerships might also result in management difficulties, as they involve two (or more)
parties whose business philosophy and goals might not be compatible.
Given these premises, the importance of investigating the entry mode adopted by
Taiwanese companies operating in the EU is evident, in order to better understand their
internationalisation and investment strategies, to identify common trends and
preferences, and to isolate areas where economic reform and agreements are most
needed.
For this research, data was acquired, and then edited by the authors, through the
Amadeus database, which provided information for a dataset of 815 Taiwanese
companies operating in the EU. For this dataset, information regarding the ownership
structure and entry modes was analysed.
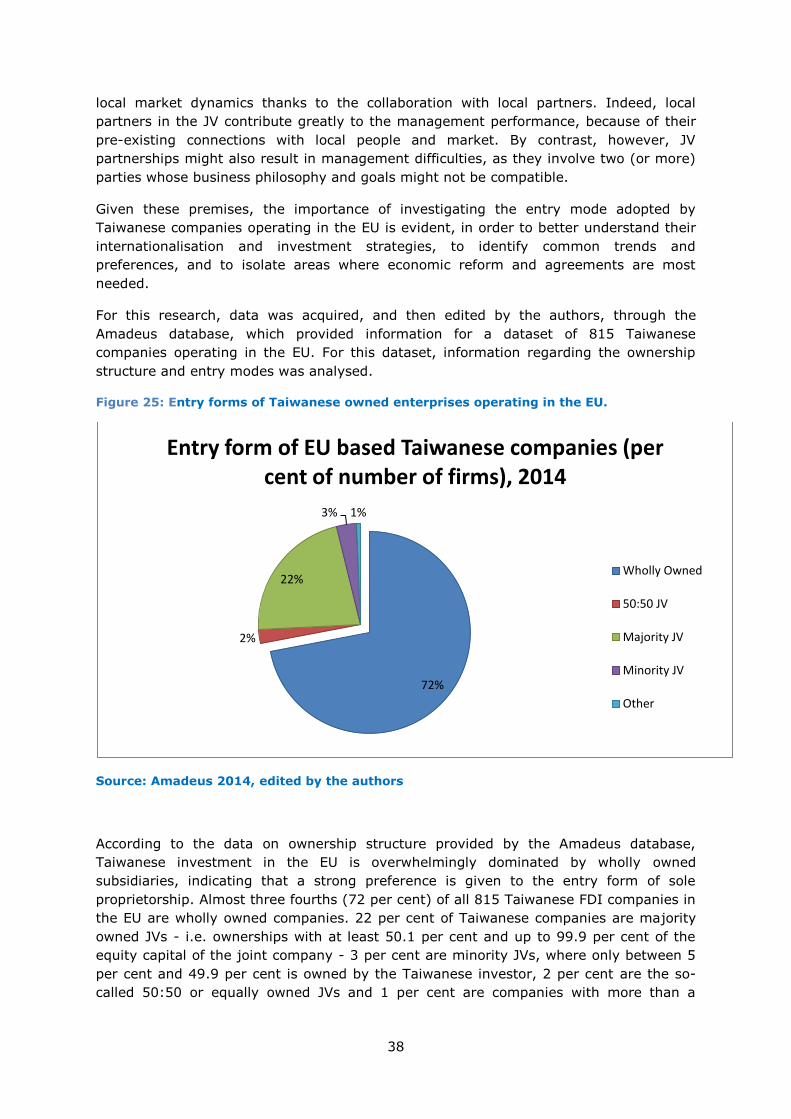
Figure 25: Entry forms of Taiwanese owned enterprises operating in the EU.
Source: Amadeus 2014, edited by the authors
According to the data on ownership structure provided by the Amadeus database,
Taiwanese investment in the EU is overwhelmingly dominated by wholly owned
subsidiaries, indicating that a strong preference is given to the entry form of sole
proprietorship. Almost three fourths (72 per cent) of all 815 Taiwanese FDI companies in
the EU are wholly owned companies. 22 per cent of Taiwanese companies are majority
owned JVs - i.e. ownerships with at least 50.1 per cent and up to 99.9 per cent of the
equity capital of the joint company - 3 per cent are minority JVs, where only between 5
per cent and 49.9 per cent is owned by the Taiwanese investor, 2 per cent are the so-
called 50:50 or equally owned JVs and 1 per cent are companies with more than a
72%
2%
22%
3% 1%
Entry form of EU based Taiwanese companies (per cent of number of firms), 2014
Wholly Owned
50:50 JV
Majority JV
Minority JV
Other
39
shareholder, but with no information on the division of the shares between the partners
(Figure 25).
The firm’s specific characteristics - size, resources, information, experience to cope with
risks, level of technology and know-how, strategic vision, familiarity with the local
market, strategic vision, investment motivation - all clearly participate in affecting the
entry form of Taiwanese companies operating in the EU. A higher tendency for wholly
owned subsidiaries and majority JVs of corporate investors, is symptomatic of their
greater financial capabilities and of their desire and determination to obtain and uphold
full or dominant ownership control over their European subsidiaries. Vice-versa, the
choice of small entrepreneurial investors for minority or equally owned JVs reflects their
limited financial resources, little or non-existent familiarity with the local market and
their need to share investment costs and risks in entering European markets. Differences
in the ownership structure and entry form also become evident based on the size of the
firms: larger companies more frequently prefer the wholly owned subsidiaries and
majority JVs entry forms, whereas small sized firms more often rely on minority or 50:50
owned JVs.
Among all indicators, level of technology and know-how is particularly significant to the
analysis of the entry form of Taiwanese firms into the EU. These two factors find
expression in the business sector activity. To this purpose, firms are sub-divided into
high- and low-tech manufacturing companies, and into Knowledge-Intensive Services
and Less Knowledge Intensive Services companies if in the service sector. The emerging
pattern is then analysed to identify a relation between entry mode and level of
technology of Taiwanese firms operating in the EU (Figure 26).
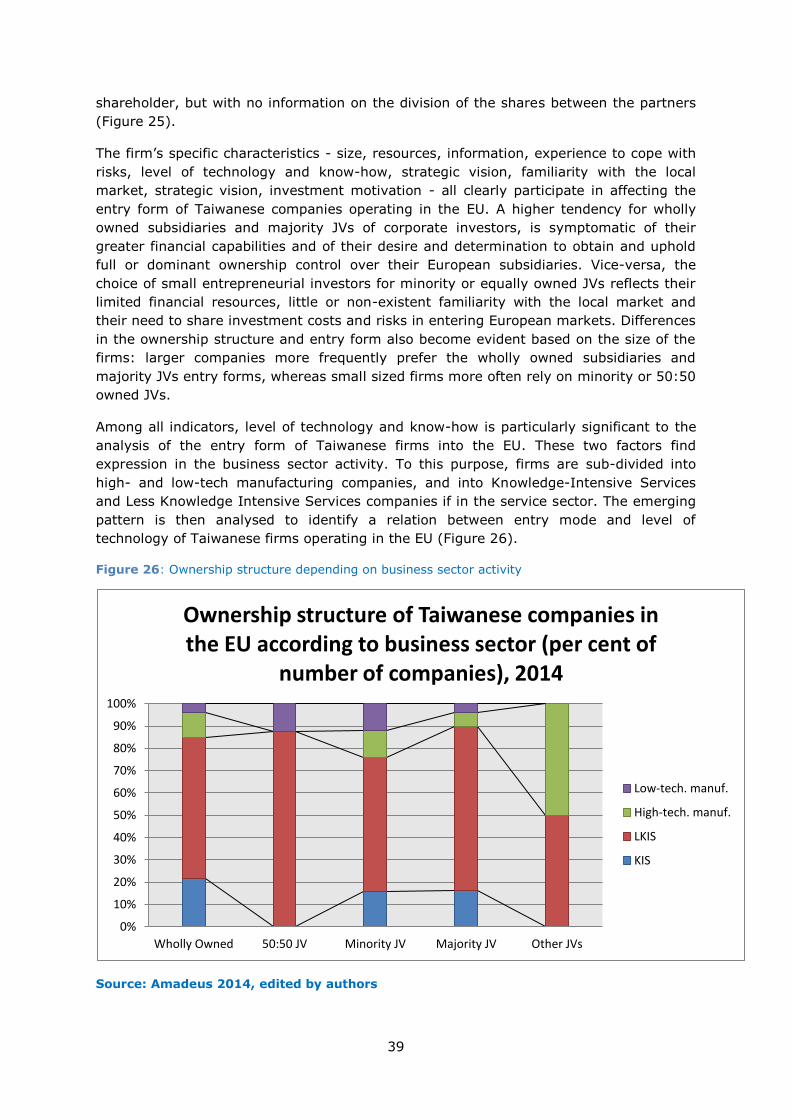
Figure 26: Ownership structure depending on business sector activity
Source: Amadeus 2014, edited by authors
0%
10%
20%
30%
40%
50%
60%
70%
80%
90%
100%
Wholly Owned 50:50 JV Minority JV Majority JV Other JVs
Ownership structure of Taiwanese companies in the EU according to business sector (per cent of
number of companies), 2014
Low-tech. manuf.
High-tech. manuf.
LKIS
KIS
40
Data retrieved from the Amadeus database on the level of technology of Taiwanese
companies reveal a number of interesting findings. Amongst the wholly owned
subsidiaries, the spectrum is quite heterogeneous, although a substantial majority (63.3
per cent) is found in the LKIS sector. 21.4 per cent of wholly owned subsidiaries work in
the KIS sector, while only 11.2 per cent and 3.8 per cent of subsidiaries operate,
respectively, in the high-tech manufacturing and low-tech manufacturing sectors.
As for the JV partnerships entry forms, almost the entire totality (87.5 per cent) of the
equally owned JVs operates in the LKIS sector, while 12.5 per cent are low-tech
manufacturing firms. Data displayed no 50:50 JVs operating in the high-tech
manufacturing or KIS sectors. Among Taiwanese minority JVs, 60 per cent of firms are
LKIS companies, while 16 per cent produce in the KIS sector, 12 per cent in the high-
tech manufacturing sector and another 12 per cent in the low-tech manufacturing sector.
For what concerns the majority JVs, the greatest number of companies (73.7 per cent)
operates in the LKIS sector, 16.3 per cent in the KIS sector, while 6.3 per cent and 3.7
per cent represent, respectively, high- and low-tech manufacturing firms. As for other
types of JVs, the category is equally (50 per cent) distributed between high-tech
manufacturing and LKIS firms, while no low-tech manufacturing or KIS firms are to
display.
3.3 Joint Venture partnerships
As previously mentioned, JV partnerships are generally preferred and set up by mid- or
small-sized companies when entering a new market with which they have little or no
familiarity, as to unlock the local partners’ potentiality and take advantage of their local
market knowledge and connections with local people. Overcome foreignness, and
sharing cost and risks deriving from entering an unknown market are generally the main
reasons to favour JVs over the sole proprietorship.
Nonetheless, it is generally acknowledged that international JVs might result in
management difficulties as they involve two (or more) parties whose business mindset
and goals might not be compatible. Setting up a JV can indeed be a complicated and
risky operation, as it involves partners that are likely to have different strategic and
business priorities, as well as different cultural and professional background, also at the
corporate level.23 Although the objectives and goals of the partners in the JV are most
likely to be similar or compatible at the start-up of the operation, changing situations in
the economic and business environment might lead to a loss of synergy and frictions
within the decision making process, which may result in management difficulties and
eventually in low profits or failure. For all these reasons, affinity in the cultural
background and business mind set are frequently considered fundamental features for
JVs to succeed, and are often behind the decision of choosing JV partners from the same
country of origin, rather than from the host (or a third) country.
In order to better illustrate the pattern of preferences in the entry mode of Taiwanese
firms operating in the EU and to assess whether the affinity in the cultural background
and business mindset – from having a partner from the same country – is considered
23 Antwerp Management School. (2013) Euro-Investment Report 2013-2014: Chinese Owned Enterprises in Europe.
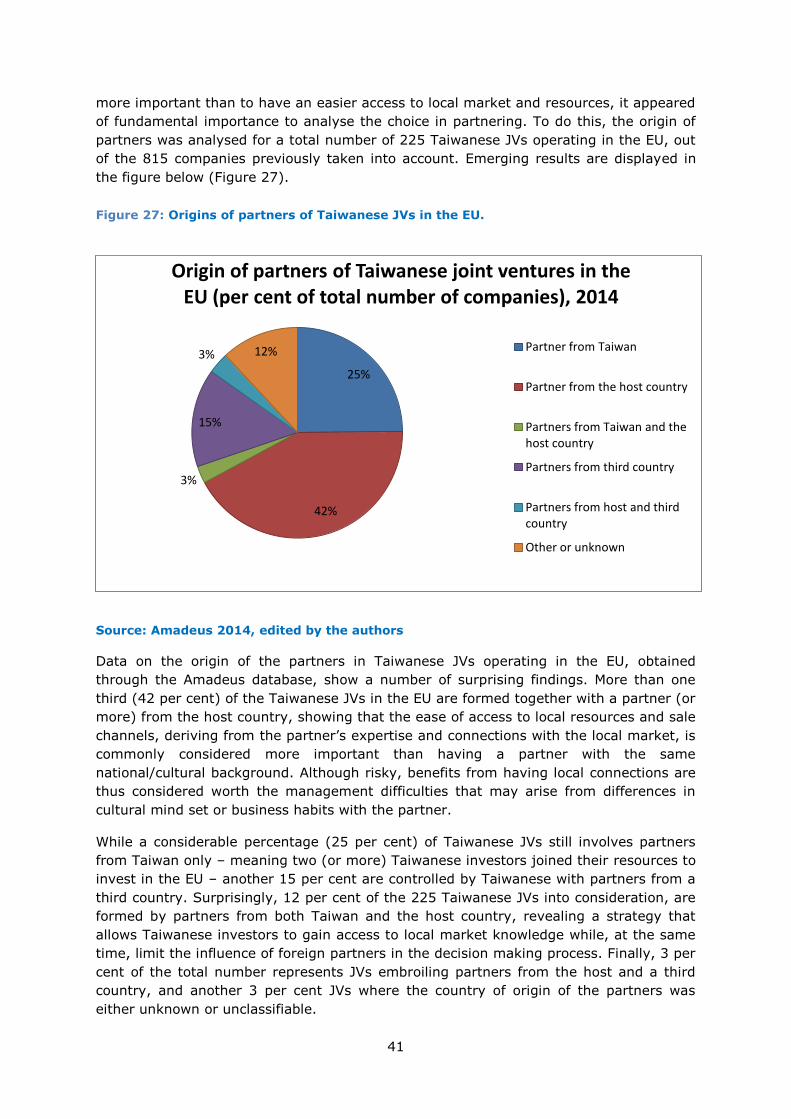
41
more important than to have an easier access to local market and resources, it appeared
of fundamental importance to analyse the choice in partnering. To do this, the origin of
partners was analysed for a total number of 225 Taiwanese JVs operating in the EU, out
of the 815 companies previously taken into account. Emerging results are displayed in
the figure below (Figure 27).
Source: Amadeus 2014, edited by the authors
Data on the origin of the partners in Taiwanese JVs operating in the EU, obtained
through the Amadeus database, show a number of surprising findings. More than one
third (42 per cent) of the Taiwanese JVs in the EU are formed together with a partner (or
more) from the host country, showing that the ease of access to local resources and sale
channels, deriving from the partner’s expertise and connections with the local market, is
commonly considered more important than having a partner with the same
national/cultural background. Although risky, benefits from having local connections are
thus considered worth the management difficulties that may arise from differences in
cultural mind set or business habits with the partner.
While a considerable percentage (25 per cent) of Taiwanese JVs still involves partners
from Taiwan only – meaning two (or more) Taiwanese investors joined their resources to
invest in the EU – another 15 per cent are controlled by Taiwanese with partners from a
third country. Surprisingly, 12 per cent of the 225 Taiwanese JVs into consideration, are
formed by partners from both Taiwan and the host country, revealing a strategy that
allows Taiwanese investors to gain access to local market knowledge while, at the same
time, limit the influence of foreign partners in the decision making process. Finally, 3 per
cent of the total number represents JVs embroiling partners from the host and a third
country, and another 3 per cent JVs where the country of origin of the partners was
either unknown or unclassifiable.
25%
42%
3%
15%
3% 12%
Origin of partners of Taiwanese joint ventures in the EU (per cent of total number of companies), 2014
Partner from Taiwan
Partner from the host country
Partners from Taiwan and the host country
Partners from third country
Partners from host and third country
Other or unknown
Figure 27: Origins of partners of Taiwanese JVs in the EU.
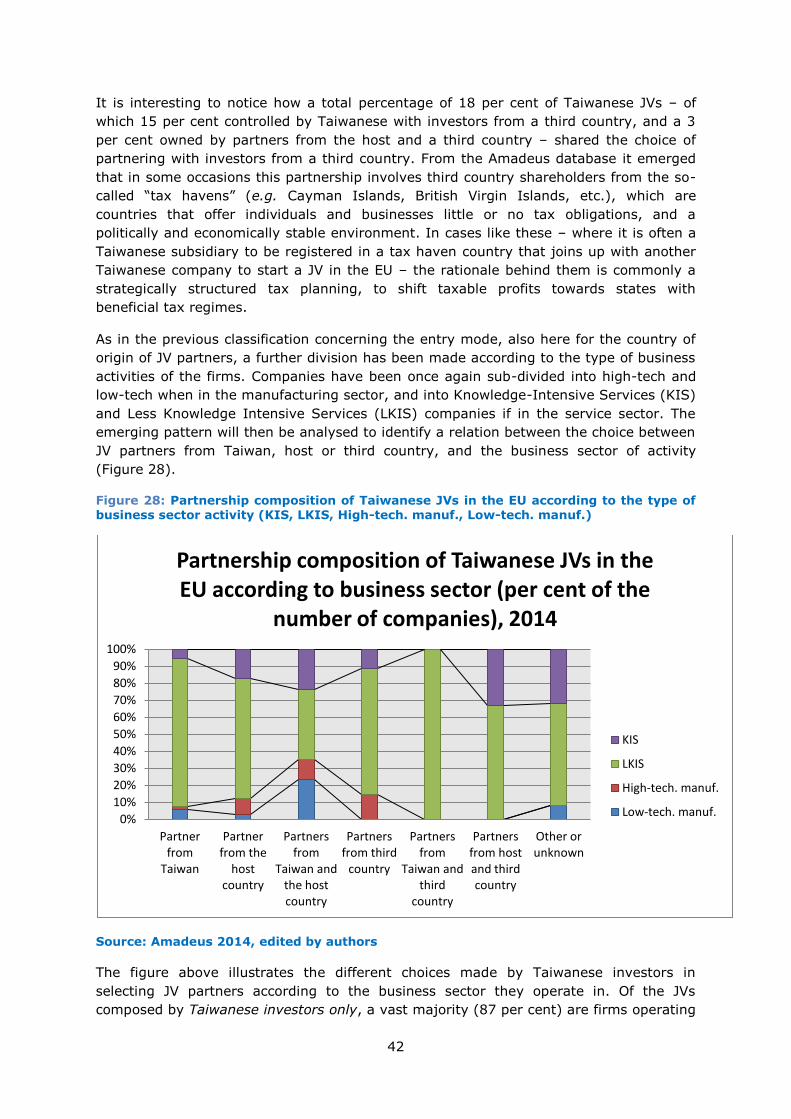
42
It is interesting to notice how a total percentage of 18 per cent of Taiwanese JVs – of
which 15 per cent controlled by Taiwanese with investors from a third country, and a 3
per cent owned by partners from the host and a third country – shared the choice of
partnering with investors from a third country. From the Amadeus database it emerged
that in some occasions this partnership involves third country shareholders from the so-
called “tax havens” (e.g. Cayman Islands, British Virgin Islands, etc.), which are
countries that offer individuals and businesses little or no tax obligations, and a
politically and economically stable environment. In cases like these – where it is often a
Taiwanese subsidiary to be registered in a tax haven country that joins up with another
Taiwanese company to start a JV in the EU – the rationale behind them is commonly a
strategically structured tax planning, to shift taxable profits towards states with
beneficial tax regimes.
As in the previous classification concerning the entry mode, also here for the country of
origin of JV partners, a further division has been made according to the type of business
activities of the firms. Companies have been once again sub-divided into high-tech and
low-tech when in the manufacturing sector, and into Knowledge-Intensive Services (KIS)
and Less Knowledge Intensive Services (LKIS) companies if in the service sector. The
emerging pattern will then be analysed to identify a relation between the choice between
JV partners from Taiwan, host or third country, and the business sector of activity
(Figure 28).
Figure 28: Partnership composition of Taiwanese JVs in the EU according to the type of business sector activity (KIS, LKIS, High-tech. manuf., Low-tech. manuf.)
Source: Amadeus 2014, edited by authors
The figure above illustrates the different choices made by Taiwanese investors in
selecting JV partners according to the business sector they operate in. Of the JVs
composed by Taiwanese investors only, a vast majority (87 per cent) are firms operating
0%
10%
20%
30%
40%
50%
60%
70%
80%
90%
100%
Partner from
Taiwan
Partner from the
host country
Partners from
Taiwan and the host country
Partners from third
country
Partners from
Taiwan and third
country
Partners from host and third country
Other or unknown
Partnership composition of Taiwanese JVs in the EU according to business sector (per cent of the
number of companies), 2014
KIS
LKIS
High-tech. manuf.
Low-tech. manuf.
43
in the LKIS sector, whereas companies investing in the KIS and low-tech manufacturing
sectors hold the 5.6 per cent respectively. Finally, only a meek 1.8 of JVs with Taiwanese
partners in the EU are active in the high-tech manufacturing sector.
Among JVs formed with investors from the host country, 70.7 per cent decided to invest
in LKIS activities, revealing that in such business sector the partner’s familiarity with
local market dynamics is highly beneficial and – for this reason – largely preferred rather
than operating with Taiwanese investors only. Secondly, 17.3 per cent of the mentioned
JVs are involved in the KIS sector, whilst 9.3 per cent operate in the high-tech
manufacturing sector and only 2.7 per cent in the low-tech manufacturing sector.
On the other hand, statistics related the JVs composed by both Taiwanese and partners
from the host country show a much more balanced distribution. Although the majority of
these JVs companies (41.3 per cent) are working in the LKIS sector, a significant
number (23.5 per cent) is representative of companies operating both in the KIS and
high-tech manufacturing sectors. Only 11.7 per cent are instead companies producing in
the low-tech manufacturing sector.
For what concerns JVs controlled by Taiwanese together with partners from a third
country an overwhelming majority (74.1 per cent) is operative in the LKIS sector,
whereas only 11.1 per cent work in the KIS sector and 14.8 per cent in the high-tech
manufacturing sector. No JV with this ownership pattern is found operative in the low-
tech manufacturing sector.
As regards JVs started-up with partners from Taiwan and a third country, the entirety of
them (100 per cent) operates in the LKIS sector, with no firms with other type of
business activities.
Unexpectedly, data related to JVs held together with partners from both the host country
and one (or more) third country (-ies) are polarised in the service sectors, with 66.7 per
cent active in the LKIS sector and the remaining 33.3 per cent in the KIS sector. Vice-
versa no such JVs are operative in any of the manufacturing sectors.
Also in the case of JVs involving partners from unknown or unclassifiable the country of
origin, the service sector is predominant, with more than half (60 per cent) of them
active in the LKIS sector, and one third of them (32 per cent) in the KIS sector. A small
percentage (8 per cent) is found operative in the low-tech manufacturing sector, while
no such companies are classified as high-tech manufacturing.
44
3.4 Conclusion
It is evident, from the data retrieved from the Amadeus database and from the cross-
sector analysis performed in earlier pages, that the distinguishing characteristic of the
Taiwanese multi-national companies operating in the EU is that of being mostly wholly
owned by Taiwanese investors. In most of the other cases, where the choice of starting-
up a JV in made, it is commonly a majority JV, so to achieve benefits deriving from the
partner’s knowledge of the local market dynamics, but also retain a greater control on
the decision-making process.
Looking at the business activity sector, it is clear that Taiwanese-owned firms operating
in the EU strongly concentrate at the lower-end of value added activities, with typically a
low level of technology (low-tech manufacturing sector) and limited intensity of
knowledge (LKIS sector). Such activities generally entail lower investments and risks,
and are therefore accessible also to small and medium companies. This is particularly
true for both wholly owned companies and JVs. The tendency than, that even companies
with fewer firm specific assets favour wholly owned entry mode, can be explained by the
fact that local responsiveness is preferred.
In accordance with the above analysis, the findings of this paper show that 72 per cent
of Taiwanese firms investing in the EU prefer to set up wholly owned subsidiaries. This is
supported by other empirical studies which argue that Taiwanese firms in the EU
"overcome the liability of foreignness [through] local facilities and local relationships".24
The ability for a company to quickly respond to changing trends in the European
business environment becomes especially important "if investors have to manage a
complex web of cross-country relationships".25 More than one quarter, 27 per cent, of
Taiwanese firms however set up as joint venture, which means that there is still a
perceived benefit for low-cost, horizontal market expansion for small and medium sized
enterprises. The firms that expand through joint ventures seek to exploit local resources
and are not constrained by having to protect distinctive firm-specific advantages, such as
unique technology, managerial expertise, brand name, or marketing know-how.26
24 Chen, TJ. (2006). Liability of foreignness and entry mode choice: Taiwanese firms in Europe. 25 Ibid. 26 Dunning JH. (1988). The eclectic paradigm of international production: a restatement and some possible extensions. In: Chen, TJ. (2006). Liability of foreignness and entry mode choice: Taiwanese firms in Europe.
45
Chapter 4: Final Conclusion
The purpose of this research paper is to evaluate the significance of Taiwanese OFDI in
the European Union. This is achieved by highlighting key characteristics of Taiwanese
enterprises operating in the EU. The gravity of Taiwanese OFDI is assessed based on
diverse investment indicators such as geographic location, technology level, or financial
performance.
It is clear from this study that Taiwan has a significant global presence through its
Outward Foreign Direct Investment. While the majority of Taiwanese OFDI is going to
Asia, this paper shows that the presence of Taiwanese companies has solidified in Europe
in the last decade. As noted in the study, FDI inflows to the EU have not been immune to
the effects of the 2008 financial crisis. With Taiwanese investment flows on the rebound,
it should be noted that the majority of Taiwanese companies in the EU produce goods or
perform services in the computer, electronics, and machinery industries. Consequently,
the presence of Taiwanese firms in the European ICT and clean technology sectors is
crucial to improving the competitiveness of the EU in these fields.
The analysis of firm-specific indicators shows that while the type of Taiwanese investors
are roughly evenly divided between individual investors and industrial companies, there
is a strong correlations between investor type and size of investment. Owing to the
specialties of Taiwanese economy, many small and medium sized businesses venture
abroad as individual investors. This also has a large impact on the entry form, and the
sectorial distribution of Taiwanese OFDI. While setting up wholly owned subsidies in
preferred in general, larger firms tend to expand their investment across multiple
countries and through different segments of the product chain, while SMEs focus on the
service sector with minimal presence in manufacturing. As a final recommendation, it
should be noted that although Taiwan has a strong presence in the ICT manufacturing
sector in Europe, there is undeniable potential for further cooperation in the R&D,
innovation, and marketing of ICT products, especially with regional knowledge- and
research clusters.
46
Bibliography
Studies and reports
Antwerp Management School. (2013). Euro-Investment Report 2013-2014: Chinese
Owned Enterprises in Europe.
Dreyer, I., Erixon, F., Lee-Makiyama, H., & Sally, R. (2010). Beyond geopolitics – the
case for a free trade accord between Europe and Taiwan. European Centre for
International Political Economy.
UNCTAD. (2012). World Investment Report 2012. Towards a New Generation of
Investment Policies. Retrieved from:
http://unctad.org/en/Pages/DIAE/World%20Investment%20Report/WIR2012_WebFlyer.
aspx
UNCTAD. (2013). World Investment Report 2013. Global value chains: Investment and
trade for development. Retrieved from:
http://unctad.org/en/publicationslibrary/wir2013_en.pdf
Papers and conference papers
Agarwal, S., Ramaswani, S.N. (1992). Choice of foreign market entry mode: impact on
ownership, location and internalization factors, Journal of International Business Studies,
Vol.23, No.1. pp.1-27.
Anderson, E., Gatignoon, H. (1986). Mode of foreign entry: A transaction cost analysis
and propositions, Journal of International Business Studies, Vol.17, No.3. pp.1-26.
Chen, T.J. (2006). Liability of foreignness and entry mode choice: Taiwanese firms in
Europe. Journal of Business Research, Vol. 59. pp.288-294.
Dunning, J.H. (1988). The eclectic paradigm of international production: a restatement
and some possible extensions. Journal of International Business Studies. Vol.19, No.1.
pp. 1-31.
Todaro, M. P., & Smith, S. C. (2012). Case study 12: A pioneer in development success
through trade: Taiwan, Economic development (Eleventh Edition ed.)
Yung-Heng L., Yann-Haur H., Mei-Jane C. (2008) Choice between Wholly-Owned
Subsidiaries and Joint Venture of Taiwanese Firms in China–A Transaction Cost
Perspective, Journal of Global Business Management, Vol. 4, No. 2.
Books
Root, F. (1987). Entry Strategies for International Markets, Lexington Books, Rowman &
Littlefield.
Database
Amadeus. (2014). European Company Data.
47
EUROSTAT statistics database. (2014). Retrieved from
http://epp.EUROSTAT.ec.europa.eu/portal/page/portal/statistics/search_database
Investment Commission, Ministry of Economic Affairs. (2014). Monthly Report April.
Retrieved from:
http://www.moeaic.gov.tw/system_external/ctlr?PRO=PublicationLoad&lang=1&id=169
UNCTAD statistics database: Foreign direct investment. (2014). Retrieved from
http://unctadstat.unctad.org/ReportFolders/reportFolders.aspx?sRF_ActivePath=p,5&sRF
_Expanded=,p,5
Official documents
European Commission. (2009). Economic crisis in Europe: causes, consequences and
responses. Retrieved from
http://ec.europa.eu/economy_finance/publications/publication15887_en.pdf
European Commission. (2014). Northern dimension. Retrieved from
http://eeas.europa.eu/north_dim/index_en.htm
OECD. (1999). Benchmark Definition of Foreign Direct Investment. Third Edition.
Retrieved from: http://www.oecd.org/daf/inv/investment-policy/2090148.pdf
Websites
European Business Council for Africa and the Mediterranean. (2014). Governments and
EU delegations investment promotion agencies. Retrieved 05/28, 2014, Retrieved from
http://www.ebcam.eu/index.php?option=com_content&view=article&id=30&Itemid=4
The Swedish Institute for International Affairs. (2014). Towards a European Global
Strategy. Retrieved from: http://www.euglobalstrategy.eu/
48
COPYRIGHT © EUROPEAN INSTITUTE FOR ASIAN STUDIES – EIAS asbl
ISSN 2294-7828
Rue de la Loi 67, Brussels
Tel: +32 (0)2230 8122 E-mail: [email protected] Web: www.eias.org


