j ourna l homepage: www.e lsev ie r .com/ locate /geoderma
Does hydrocarbon contamination induce water repellency and changesin hydraulic properties in inherently wettable tropical sandy soils?
Ammishaddai Takawira, Willis Gwenzi ⁎, Phillip Nyamugafataa Department of Soil Science and Agricultural Engineering, University of Zimbabwe, P.O. Box MP167, Mt. Pleasant, Harare, Zimbabwe
Hydrophobicity influences soil hydrological and ecological functions. Compared to naturally-occurring and fire-induced hydrophobicity, limited information is available on the impacts of hydrocarbon contamination onwaterrepellency and hydraulic properties. Water repellency and hydraulic properties were measured on laboratorysimulated, and field contaminated soils, 1 and 5 years after an accidental petroleumhydrocarbon spill. The objec-tives were; (1) to compare the water droplet penetration test (WDPT) to the molarity of ethanol droplet (MED)test, (2) to investigate the effect of hydrocarbon contamination onwater repellency and hydraulic properties, and(3) to evaluate the performance of pedotransfer functions for hydraulic properties. The WDPT and MED testsgave qualitatively similar water repellency results as evidenced by a significant positive correlation (p b 0.05,r2 = 0.95) between the mean time for the two methods. Laboratory simulated hydrocarbon contamination in-duced soil water repellency. Saturated hydraulic conductivity (Ks) increased linearly with level of contamination(p b 0.05; r2 ≈ 0.8), indicating that rapid flow of water attributed to a reduction of the dielectric constant,and hence water–soil matrix interactions. No water repellency was observed in contaminated field soils(WDPT b 3 s), but the residual signature of hydrocarbon contamination was evident in other soil properties par-ticularly electrical conductivity. This indicates that natural soils were inherently wettable and that hydrocarbon-induced hydrophobicity could be transient. This non-persistence was attributed to high decomposition ratesstimulated by tropical conditions and nutrients added to promote revegetation. Predictions of pedotransfer func-tionswere comparable tomeasured hydraulic data (p b 0.05, r2 N 0.8), confirming their general validity for waterand solute transportmodeling even on contaminated soils. The study confirmed the hypothesis that hydrocarboncontamination induces water repellency and reduces soil moisture retention at low suction (b100 kPa) for lab-oratory contaminated soils, but effects were inconsistent for field samples. However, the increased saturated hy-draulic conductivity associated with laboratory contaminated soils contradicted the original hypothesis. Thefindings imply that storms falling on initially dry recently contaminated soils may trigger contaminant transportand erosion via enhanced surface runoff, and rapid spreading of contaminants once they reach the groundwatersystems. These hydrological impacts are critical for remediation of contaminated sites. Future research could usea contamination chronosequence/gradient to provide comprehensive information on the temporal evolution ofwater repellency and hydraulic properties under field conditions.
Hydrophobicity or water repellency is a well-recognized phenome-non influencing soil hydrological behavior and agricultural productivity.Water repellent soils resist wetting, and inhibit infiltration (Dekker andRitsema, 1994). Naturally-occurring and fire-induced water repellencyhas been the subject of several studies conducted in Mediterranean en-vironments in Australia, Spain, Portugal and Chile (Doerr et al., 2000,2006) and sandy dunes in Netherlands (Dekker and Ritsema, 1994),where water repellency appears more widely reported than in other
regions. Besides fire and antecedent soil moisture, the occurrence andseverity of water repellency are also influenced by soil type and proper-ties (Badía et al., 2013; Doerr et al., 1996), vegetation type, soil manage-ment and land use practices (Harper et al., 2000; Zavala et al., 2009). Forexample, although water repellency has often been associated withcoarse-textured soils, several studies have shown that severe water re-pellency also occurs in various soil types including those that are fine-textured, aggregated, acidic and alkaline soils (Doerr et al., 2000;Jordán et al., 2013; Mataix-Solera and Doerr, 2004).
In earlier studies, researchers investigated the origin and character-istics of water repellency (Doerr et al., 2000; Jordán et al., 2013), evalu-ation methods (e.g. Doerr, 1998; King, 1981; Letey, 1969; Letey et al.,2000; Watson and Letey, 1970), impacts on hydrological behavior in-cluding preferential flow (Dekker and Ritsema, 1994; Wallach, 2010;
280 A. Takawira et al. / Geoderma 235–236 (2014) 279–289
Wallach and Jortzick, 2008) and amelioration and management prac-tices (e.g. Dlapa et al., 2004). The causes of hydrophobicity includeplant derived waxes, humic and fulvic acids and organic compoundsfrom forest fires (Arcenegui et al., 2007; Doerr et al., 2000; Huffmanet al., 2001; Ritsema et al., 1993; Scott, 2000). Water repellency influ-ences water redistribution via reduced infiltration, enhanced surfacerunoff and erosion, and preferential flow or fingering (Doerr et al.,2000). These changes in hydrological balance, may in turn impact onsoil–plant water relations, resulting in impeded seed germination,stunted plant growth and reduced plant productivity (Mainwaringet al., 2004). Other researchers have investigated the potential to ame-lioratewater repellency and the associated impacts through localized ir-rigation, tillage, and application of clays and surfactants or wettingagents (Buczko et al., 2006; Dlapa et al., 2004; Kostka, 2000). Severalmethods exist for evaluating the occurrence and severity of soil waterrepellency, themolarity of ethanol droplet (MED) and thewater dropletpenetration test (WDPT) being the most prominent (Dekker andJungerius, 1990; Dekker and Ritsema, 1994; King, 1981). However,comparative studies on their performance particularly on hydrocarboncontaminated soil are limited. Therefore uncertainty exists about thesensitivity and comparability of results between the two methods.
In comparison to other areas, little is known about the occurrence ofwater repellency in the predominant tropical soils of southern Africa.The reason for this lack of information is unclear, but could be indicativeof the general lack of hydrological research in the region. An exception isa study by Scott (2000) documenting water repellency and reduced in-filtration and enhanced runoff in an exotic eucalyptus timber and pineplantation, and natural Acacia dominated miombo woodland in SouthAfrica. The miombo woodlands are the dominant native vegetationtype in southern Africa, covering over 3.6 million km2 across 11 coun-tries (Timberlake and Chidumayo, 2011). The miombo woodlands con-sist predominantly of deciduous broad-leaved leguminous trees with awell-developed grass understory, giving rise to frequent and wide-spread veld fires. Although documented cases of naturally-occurringor fire-induced water repellency are scarce in the region, soil contami-nation through anthropogenic activities could potentially cause waterrepellency. In particular, wastewater irrigation, soil application of bio-solids and hydrocarbon contamination may introduce hydrophobicorganic compounds into the soil system. However, compared tonaturally-occurring and fire induced hydrophobicity, little is knownabout the impacts of contamination on water repellency and soil hy-draulic properties.
Aislabie et al. (2004) noted that few studies exist on the impacts ofhydrocarbon contamination and associated additives onwater repellen-cy and moisture retention. In an arid region, wastewater irrigation hasbeen reported to cause water repellency (Wallach et al., 2005). Astudy conducted in Canada on weathered oil-contaminated sitesshowed that some long-chain and polycyclic aliphatic organic com-pounds of petroleum origin were water repellent (Roy et al., 1999).On Barrow islands in Australia, George et al. (2011) observed thatflowline additives associated with oilfield installation had no effect onwater repellency. In the Antarctic region, hydrocarbon-contaminatedsoils were weakly hydrophobic, but impacts on moisture retentionwere negligible (Aislabie et al., 2004). Elsewhere, hydrocarbon contam-ination was also reported to alter soil field capacity, porosity, soil bulkdensity and optimumwater content even at low hydrocarbon contam-ination levels (Adams and Cruz, 2008; Adams et al., 2008; Caravaca andRolda, 2003; Rahman et al., 2010). In other studies, soil contaminationby petroleum hydrocarbons was reported to increase the moisture re-tention of soil at high suction values (Burckhard et al., 2004; Hyunet al., 2008), while a decline in water retention was observed by Royand McGill (1998). These changes often result in reduced plant growthand productivity (Adams and Cruz, 2008). In summary, the findings ofthese earlier studies are inconsistent, and often contradicting. More-over, the bulk of these studies were drawn from cool and humid tem-perate and arctic conditions (Adams and Cruz, 2008; Balks et al., 2002;
Foght andWaterhouse, 2004;Quyum, 2000). By contrast, there is a pau-city of information on the impacts of hydrocarbon contamination onwater repellency and hydraulic properties in tropical environments typ-ical of southern Africa. Unlike temperate and Arctic environments, thetropics experience distinct warm to hot and seasonally dry climatic con-ditions, resulting in diverse soil types. These unique climatic and soilcharacteristics constrain the extrapolation and generalization of find-ings obtained in other environments.
Knowledge of soil hydraulic properties is crucial for understandingthe hydrology and remediation of contaminated sites (Gwenzi et al.,2011). Soil hydraulic properties particularly saturated hydraulicconductivity (Ks) and soil moisture retention (SMR) influence soilmois-ture storage, deep drainage, runoff and infiltration, and provide keyinputs for water balance and solute transport models (Gwenzi,2010; Gwenzi et al., 2011; Holländer et al., 2009). Most existing waterand solute transport models rely on hydraulic properties estimatedfrom pedotransfer functions derived for uncontaminated natural soils(Bohnhoff et al., 2009; Holländer et al., 2009). Hydrocarbon contamina-tion could potentially cause water repellency and associated changes inhydraulic properties. Consequently, PTFs for Ks and SMR developed foruncontaminated natural soils may fail to predict field measurementson such contaminated soils. Therefore, there is need to evaluate the ca-pacity of existing pedotransfer functions to predict saturated hydraulicconductivity and soil moisture retention for hydrocarbon contaminatedsoils. In the current studywe investigated the hypothesis that hydrocar-bon contamination induces water repellency and reduces moisture re-tention and saturated hydraulic conductivity in inherently wettabletropical sandy soils. The objectives of the study were; (1) to comparethe water droplet penetration test (WDPT) to the molarity of ethanoldroplet (MED) as water repellency tests, (2) to investigate whetherhydrocarbon contamination induces water repellency and changes insoil hydraulic properties, and (3) to evaluate the performance ofpedotransfer functions for soil moisture retention curve and saturatedhydraulic conductivity.
2. Materials and methods
2.1. Description of study sites
The study was conducted on two field sites in Zimbabwe; Ruwa(E 031° 13′ 04.0″, S 17°52′ 52.7″, altitude: 1521 m asl) and Goromonzi(E 031° 24′ 10.9″, S 180° 07′ 54.0″, altitude: 1609 m asl). The siteswere located along the Mutare highway, approximately 10 (Ruwa)and 30 km (Goromonzi) from Harare, the capital city of Zimbabwe.The highway links Zimbabwe to the international seaport of Beira inMozambique, and is frequently used by oil tankers for the transport ofoil and other petroleum products. The two sites were approximately10 km apart, and had similar soils, vegetation types and climatic condi-tions. The climate of the area is tropical, characterized by distinct warmwet summers (27 °C) and cool dry winters (17.5 °C). Average annualrainfall is about 800 mm, occurring mainly in summer stretching fromNovember to February. Soils are predominantly in-situ sands derivedfrom granites. They are classified as Harare 6G.2 according to theZimbabwe soil classification system, corresponding to Udic Kandiustalf(USDA, 1994) and Gleyic Luvisol (FAO, 1988) (Nyamapfene, 1991). Nat-ural vegetation in the study area ismiombowoodlands consisting of de-ciduous trees and a grass understorey.
Two sampling sites representing hydrocarbon-contaminated anduncontaminated soils (control) were selected within each study site.Contaminated soils were selected from sites that experienced alarge spillage of petroleum hydrocarbons through road accidents in-volving oil tankers. Petroleum hydrocarbon contamination occurred in2007 at Ruwa and 2012 at Goromonzi. Sampling was conducted be-tween January and April 2012, approximately 5 and 1 year later, respec-tively. No clean-up or remediation was conducted at the Ruwasite, while at Goromonzi, post-contamination remediation involved
281A. Takawira et al. / Geoderma 235–236 (2014) 279–289
application of nutrient solution containing 9:1 phosphorus to nitrates ata rate of 20 l ha−1 diluted in 200 l. The application of the nutrient solu-tion was meant to promote vegetation growth. Field observationsshowed that contaminated sites differed from the control sites interms of soil color and smell. Moreover, compared to the control sites,sedges and grasses growing on the contaminated sites were sparse, yel-lowish and stunted. Control sampling areas were uncontaminated sitesidentified within natural undisturbed miombo woodlands approxi-mately 1 km from the road and upstream of the contaminated area.The identification of contaminated and control sites was conductedwith the assistance of officials from the Hazardous Substances Inspec-torate of the Zimbabwe Environmental Management Agency (EMA).EMA documents and maintains an up-to-date database of all freightsand accidents involving hazardous substances in Zimbabwe. The agencyalso provides emergency response services including the clean-up andremediation of contaminated sites. Therefore historical information in-cluding the nature of the hydrocarbons, year of contamination andpost-contamination clean-up and rehabilitation activities were readilyavailable for the study sites. Additional information on the spatial extentof the contamination, and whether there were any fire outbreaks wereobtained from local peoplewhowitnessed the accidents, and have livedin the study sites since then.
To address the study objectives, soil samples for laboratory simula-tion of hydrocarbon contamination were collected from the controlsites. Contaminated and control field soil samples were also collectedfrom both sites for general soil characterization, water repellency testsand measurement of hydraulic properties. Details of the sampling pro-tocol are described in Section 2.2.
2.2. Evaluation of water repellency
2.2.1. Laboratory hydrocarbon contaminated soilsDisturbed composite samples from the control within each site were
used for laboratory simulation of hydrocarbon contamination. Eachcomposite sample weighing approximately 50 kg consisted of five ran-dom sub-samples collected from the top 10-cm depth using a spade.The samples were air-dried under room conditions, thoroughly mixedand then passed through a 2-mm sieve. Six levels of hydrocarbon con-tamination replicated three times were tested; control (0.0), 30, 60,120 and 150 mg of diesel per gram of soil. These contamination levelsare consistent with experimental values used in previous studies(Adams and Cruz, 2008; Millioli et al., 2009) and concentrations mea-sured in field contaminated soils (Aislabie et al., 2004). To facilitate ho-mogeneous mixing with soil, the corresponding volume of diesel wasadded to a 200-ml flask, and the volume made up to the mark with ac-etone (Awada et al., 2004). The acetone was expected to evaporatewithout altering the water repellency properties of the soil. Neverthe-less, a control soil treated with 170 ml of acetone only was included toconfirm that acetone had no effect on water repellency. For each repli-cate, one kilogram of soil was weighed into a container. The diesel–ace-tone solution was then added and thoroughly mixed by hand. The soilwas then kept for 14 days under room conditions (25–26 °C). The soilwas mixed at two-day intervals during the aging process.
The contaminated soils were then oven-dried at 60 °C for 48 h, andthen allowed to equilibrate for two days under room conditions(Contreas et al., 2008). A portion of soil from each replicate was thenput in a petri dish and the surface smoothened. Two methods werecompared for the evaluation of water repellency, namely, the waterdrop penetration time method (WDPT) (Letey, 1969; Watson andLetey, 1970) and the molarity of ethanol droplet test (MED) (King,1981). For the WDPT, a syringe was used to place a droplet on thesmoothed surface and time required for the water droplet to penetratethe soil surface recorded using a stopwatch. The WDPT values of eachsample were given by the average of seven drops of distilled waterplaced onto the smoothened surface of 30–40 g of soil placed in apetri dish (Contreas et al., 2008). Samples were classified as hydrophilic
or wettable (below 5 s), slightly water repellent (5–60 s), stronglywater repellent (60–600 s), severely water repellent (600–3600 s)and extremely water repellent (more than 3600 s) (Dekker andJungerius, 1990; Dekker and Ritsema, 1994).
In the MED test water repellency was recorded as the molarity ofethanol in a droplet of water needed to penetrate the soil within 10 s(King, 1981). Solutions ranging from 0 to 6M concentration at 0.2M in-tervals were used for theMED test (Roy et al., 1999). Results of theMEDtests were evaluated using the criteria developed by King (1981). Theclassification system consists of four categories; non-water repellent(MED=0), lowwater repellency (0 bMED b 1), moderate water repel-lency (MED = 1–2.2) and severe water repellency (MED N 2.2) (King,1981).
2.2.2. Field hydrocarbon contaminated soilsTo investigate the impacts of hydrocarbon contamination under
field conditions, contaminated and control soils were collected fromboth sites. The soils were used for general characterization, water repel-lency test and measurement of soil moisture retention and saturatedhydraulic conductivity. Metal cores (7 cm diameter and 5 cm height)were used to collect undisturbed samples for the determination offield water repellency, soil bulk density (Blake and Hartge, 1986) andtotal porosity. As will be presented later, comparison of the MED andWDPT data showed that the two methods gave similar results. There-fore, the WDPT, which was quicker and cheaper, was used in subse-quent water repellency tests conducted on field samples.
2.3. Determination of soil chemical properties
Soil pH, electrical conductivity (EC) and organic carbon (SOC) weremeasured on triplicate samples from the contaminated and controlsites. Soil pH and electrical conductivity were measured in 1:5 soil:water suspension using standard methods (Gwenzi et al., 2011;Rayment and Higginson, 1992). Briefly, the soil–water suspensionwere shaken for 1 h on a mechanical shaker and allowed to settle for30 min (Gwenzi et al., 2011). Soil pH and electrical conductivity weremeasured using EC and pH electrodes, respectively (model: Mettler To-ledo). The modified Walkley–Black method was used for determiningSOC on samples passed through a 0.5-mm sieve (Okalebo et al., 1993).The method is based on wet oxidation of soil organic carbon using po-tassium dichromate with external heating at 145 °C.
2.4. Determination of soil hydraulic properties
Particle size distribution, soil bulk density, total porosity, soil mois-ture retention and saturated hydraulic conductivity were measured toevaluate the effects of hydrocarbon contamination on hydraulic proper-ties. Particle size analysis was done using a combination of wet sievingand sedimentation (Gee and Bauder, 1986). The core method (Blakeand Hartge, 1986) was used for the determination of bulk densityusing metallic cores measuring 7 cm by 5 cm. The soil cores werethen oven dried at 105 °C for 24 h. Total porosity (n) was calculated as;n = 1 − ρb/ρs, where ρb is the dry bulk density of the soil (kg m−3),and ρs is the particle density assumed to be 2650 kg m−3 (Hillel, 1998).
The pressure plate method was used to determine soil moisture re-tention curves on core samples collected from the field (Klute andDirksen, 1986). Saturated hydraulic measurements were conducted onrepacked laboratory contaminated soils. Sampleswere subjected to suc-tions of 2, 5, 10, 33, 100 and 200 kPa and allowed to equilibrate in thepressure plate chamber. At equilibrium, samples were oven-dried at105 °C and then weighed to determine soil moisture content at eachsuction level. Single- and dual-porosity PTF models were then fitted tothe data using the RETC software (van Genuchten et al., 1991).Section 2.5 presents the details of the PTFs investigated and the perfor-mance evaluation criteria.
282 A. Takawira et al. / Geoderma 235–236 (2014) 279–289
As water repellency tests showed that all field contaminated sam-ples were non-water repellent, evaluation of the effect of hydrocarboncontamination on Ks was limited to laboratory contaminated samples.Ks was determined by the constant-head method (Reynolds andElrick, 2002) using a set-up developed by Verboom (1991). The setupwas originally designed and applied to investigate the effect of electro-lytes on hydraulic conductivity of Zimbabwean soils (Verboom, 1991).The set-up consisted of a plastic permeameter consisting of two doublerings; an outer ring with an internal diameter of 59 mm attached toinner ring with internal diameter of 37 mm. Laboratory contaminatedbulk samples from the previous experiment were repacked in the plas-tic permeameters to a bulk density of approximately 1500 kgm−3.Wiregauzewas placed on the soil surface to reduce the impact ofwater drop-lets. A burette was used to provide a constant supply of water byallowingwater to fall on the soil surface from a height of 25 cm tomain-tain a constant head of 2 cm above the soil column. The soil column hada height of 5 cm and a diameter of 37 mm. To reduce edge effects, out-flow data were collected from the internal ring and used to compute Ks.Outflow data were measured using a balance to the nearest 0.00 g andtimemonitored using a stopwatch. Cumulative outflow data were plot-ted against time to obtain a straight linewhose gradient represented av-erage flow rate. Darcy's law was used to calculate Ks using a hydraulichead of 7 cm and column dimensions of 5 cm height and diameter of37 mm (Reynolds et al., 2000, 2002).
2.5. Evaluation of pedotransfer functions
To evaluate the capacity of existing pedotransfer functions (PTFs),laboratory-measured saturated hydraulic conductivity (Ks) and soilmoisture retention curve (SMRC) data were compared to PTF modelpredictions. Specifically, four prominent PTFs for estimating Ks wereevaluated (Sobieraj et al., 2001; Tietje and Hennings, 1996). ThesePTFs have been investigated in previous studies conducted on naturalsoils and artificial substrates including mine wastes (Gwenzi et al.,2011; Sobieraj et al., 2001; Tietje and Hennings, 1996). The vanGenuchten (1980) model is the most widely used PTF for prediction ofsoil moisture retention curves (Ippisch et al., 2006). Three forms of thesingle-porosity van Genuchten (1980) model; VG1, VG2 and VG3were used for SMRC prediction. The three forms differed in the valueof the van Genuchten parameter, m (Table 1). RETC software (version6.02) (van Genuchten et al., 1991) was used for model fitting and esti-mation of the air-entry value (α) and pore size distribution (n) param-eters. Table 1 presents the PTF models and their input data on particlesize distribution and soil bulk density.
Table 1Pedotransfer functions used to predict soilmoisture retention curve (SMRC) and saturatedhydraulic conductivity (Ks, mm h−1). Input data for PTFs are moisture retention data forSMRC and sand (Sa): 50–2000 μm, silt (Si): 2–50 μm and clay (C): ≤2 μm and dry soilbulk density (ρb) for Ks.
Reference Pedotransfer function
Soil moisture retention curve (SMRC):1. Van Genuchten (1980) (VG1)
θ hð Þ ¼ θr þ θs−θr1þ αhj jn½ �m h≤0
θs hN0
(
2. Van Genuchten (1980)(Mualem) (VG2)
VG1 with m = 1–1/n
3. Van Genuchten (1980)(Burdine) (VG3)
VG1 with m = 1–2/n
Saturated hydraulic conductivity (mm h−1):1. Puckett et al. (1985) Ks = 156.96 exp[−1975C]2. Dane and Puckett (1994) Ks = 303.84 exp[−0.144C]3. Cosby et al. (1984) Ks = 25.4 × 10[−0.6 + 0.0126Sa − 0.0064C]
In the van Genuchtenmodel, θ is the volumetric water content, h is pressure head (cm); θrand θs are the residual and saturated water contents, respectively. The parameter α is re-lated to the inverse of the air-entry value, and n is a measure of the pore-size distribution(van Genuchten, 1980).
2.6. Data analysis
Shapiro–Wilk's and Barlett's tests were used to test data normalityand homogeneity of variances, respectively, at 5% level. Two-sample t-test and analysis of variance (ANOVA) were conducted to test effectsof site, hydrocarbon contamination, and interactions onwater repellen-cy and hydraulic properties. Non-normal data were transformed toachieve normality, and those that failed to meet assumptions for para-metric tests were analyzed using non-parametric statistical tests. Re-gression was used to test the relationship between the two methodsfor determining water repellency, and relations between hydrocarboncontamination levels, water repellency (WR) and hydraulic properties.Statistical tests were done at p=0.05 usingMinitab version 16.0 statis-tical package. Least significant differences (lsd) were used for the sepa-ration of treatment means at probability level (p) of 0.05. Correlationwas used to evaluate the performance of PTF models for SMRC usingthe coefficient of determination (r2) to assess the goodness of fit.Given that Ks varies considerably with method of measurement(Gwenzi, 2010; Gwenzi et al., 2011; Johnston et al., 2009; Muñoz-Carpena et al., 2002), comparison of measured Ks values to those pre-dicted by PTF model focused on evaluating whether values were withinthe same orders of magnitude. Therefore, box-and-whisker plots show-ing median, minimum, maximum and 25th and 75th percentile valuesof measured and predicted values were used for this purpose.
3. Results
3.1. General soil properties
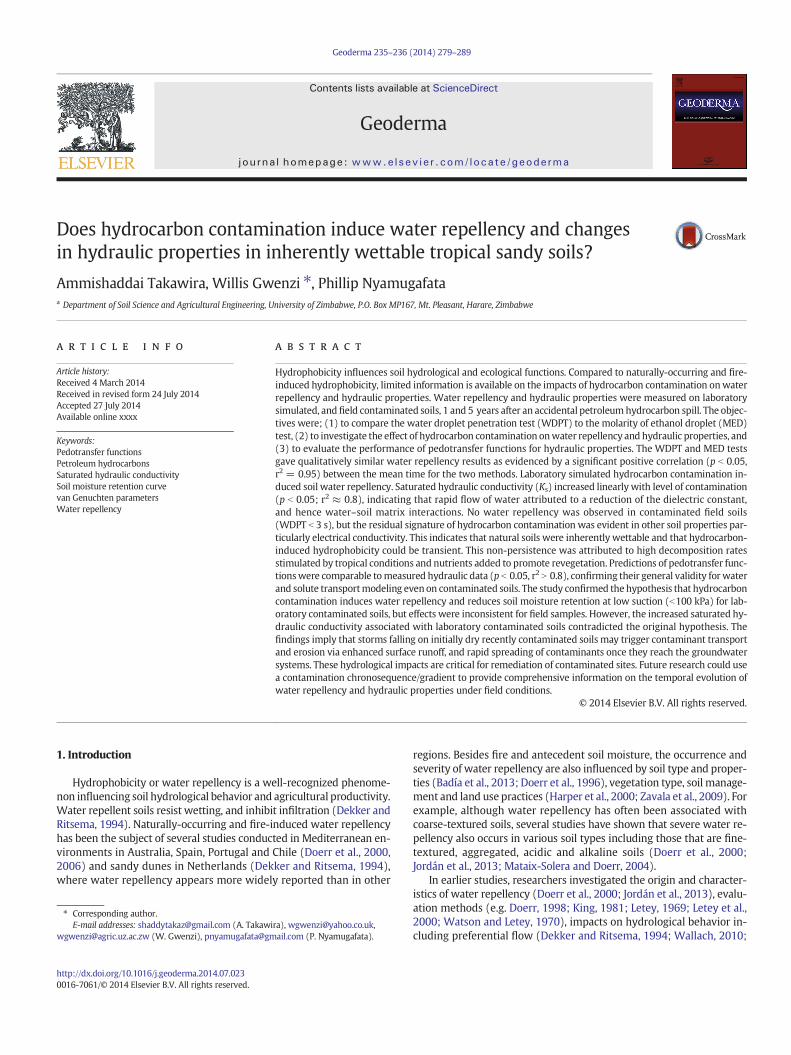
The soils at the two study sites were classified as well-sorted pre-dominantly fine sandy loam and fine loamy sand with approximately80–88% sand (Fig. 1). At both sites, the differences in particle size distri-bution between the control and contaminated soils were considered in-sufficient to justify classifying into different textural classes according totheUSDASoil Classification (Fig. 1). Therefore, the soilswere consideredto have comparable particle size distribution.
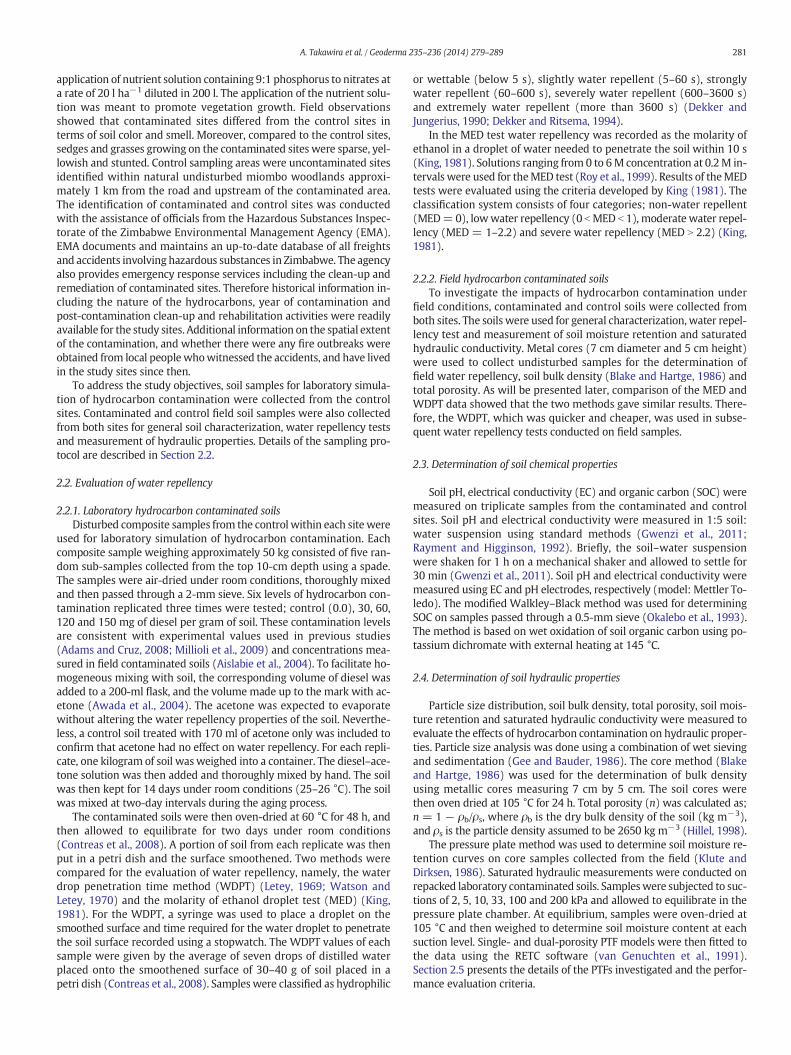
The soils at both sites had mean bulk density values of1350–1613 kg m−3. Soil bulk density, porosity, SOC and EC variedsignificantly (p b 0.05) between the control and contaminated sites,but the trendwas inconsistent (Table 2). The Ruwa control site had sig-nificantly (p= 0.002) lower bulk density, and hence higher total poros-ity than the contaminated site, while comparable values were observedfor the Goromonzi sites (Table 2). On the other hand, the Goromonzicontaminated site had higher SOC than the control, while those forthe Ruwa soils were comparable. Soil EC was consistently higher forthe contaminated sites than the control. All soils were characterizedby similar slightly acidic soil pH. No remarkable pHdifferenceswere ob-served between the contaminated soil and the control at the Goromonzisite. The pHof the Ruwa contaminated soil was significantly higher thanthat of the control.
3.2. Soil water repellency
Laboratory-contaminated soil samples were used to compare theWDPT and the MED tests. The average time for the WDPT and theMED increased exponentially with increasing concentration of hydro-carbon contamination, with coefficients of determination (r2) of 0.94and 0.91, respectively (Fig. 2(a)). Accordingly, for any given concentra-tion of hydrocarbon contamination, themean time forWDPT and that ofMED were also positively correlated (p b 0.001, r2 = 0.97–0.99)(Fig. 2(b)), demonstrating that the two methods yielded qualitativelysimilar results.
The WDPT showed that hydrocarbon contamination exceeding30 mg g−1 caused soil water repellency at both sites. Significant(p b 0.05) differences inWDPTwere observed among all treatments ex-cept the control and the 30 mg g−1 concentration, which were similar
Fig. 1. Semi-logarithmic plot of particle size distribution for control (○) and hydrocarbon contaminated (●) field soils at Goromonzi (a) and Ruwa (b).
283A. Takawira et al. / Geoderma 235–236 (2014) 279–289
(Fig. 3). According to the classification system of Dekker and Ritsema(1994), the soils from both sites were grouped into three water repel-lency classes; non-water repellent (control and 30 mg g−1), slightlywater repellent (60.0 mg g−1) and strongly water repellent (120 and150 mg g−1). The control and contaminated field soils at both siteswere classified as wettable (Dekker and Ritsema, 1994), with very lowWDPT time (b1 s), which were approximately 5-times lower than 5-sminimum for a slightly wettable soil. At both sites, the WDPT forthe control soils in a nativemiombowoodlandwere significantly higher(p = 0.05) than that of the contaminated soils. The results of the MEDtest for both Ruwa and Goromonzi soils were qualitatively similar tothat of the WDPT. Based on MED, the control and 30 mg g−1 wereclassified as non-water repellent (MED = 0), while the 60, 120 and150 mg g−1 hydrocarbon concentrations were classified as severelywater repellent with (MED: 5–8). Both WDPT and MED tests classifiedthe control soils treated with acetone as non-water repellent, demon-strating that acetone used as a solvent for the petroleum hydrocarbonshad no effect on the observed water repellency. WDPT was stronglyand positively correlated to the concentration of hydrocarbon contami-nation, with regression coefficients (r) of 0.90 and 0.95 for Ruwa andGoromonzi, respectively. For Goromonzi, the times for WDPT andMED were related to hydrocarbon concentration (mg g−1) (HC)by power functions; WDPT = 1.10e0.033 ∗ HC, r2 = 0.94 and MED =1.32e0.037 ∗ HC, r2 = 0.91, respectively. A similar relationship wasobtained for Ruwa.
3.3. Impact of hydrocarbons on soil hydraulic properties
3.3.1. Soil moisture retention curveSoil moisture content for the control and contaminated soils de-
clined gradually for suctions below 100 kPa for both sites, followed bya rapid decline at 200 kPa (Fig. 4). The effect of hydrocarbon contamina-tion wasmore pronounced for laboratory-contaminated soils than field
Table 2Summary properties of field soil samples from Goromonzi and Ruwa used in the study. Valuesand total porosity (n = 5).
samples. Hydrocarbon contamination significantly (p b 0.01) reducedsoil moisture retention in laboratory contaminated soils (Fig. 4). Atlow suction ranges (2–33 kPa), the 120 and 150 mg g−1 treatmentshad consistently lower (p b 0.05)moisture content than the other treat-ments (0–60 mg g−1), which were comparable. On the other hand, theeffects of hydrocarbon contamination on soil moisture retention of fieldsamples were inconsistent between sites. At Ruwa, the control soil hadsignificantly (p b 0.05) higher moisture content at 2-kPa suction thanthe contaminated soil, but no significant effects were observed atother suction levels (Fig. 4). At Goromonzi, for any given suction, soilmoisture retention of the contaminated soils was similar to that of thecontrol (Fig. 4).
Evaluation of PTFs for SMRConly focussed on single-porositymodelsof van Genuchten with various functions (e.g. Mualem, 1976) for esti-mating the pore size distribution parameter (n). The soil moisture re-tention curves for the laboratory contaminated soils was bestdescribed by the single porosity van Genuchten (1980) model (VG1)(r2 = 0.92–0.99, p ≤ 0.003) (Fig. 4(a)). Similar results were observedfor the control and contaminated soils at both sites (p b 0.001, r2 =0.98) (Fig. 4(b) and (c)). No attempts were made to fit double ordual-porosity models (e.g. Mualem, 1976), which are often used onwell-structured soils and those with a substantial proportion of rockfragments and fractures, where both preferential and matrix flow aredominant. This was motivated by the fact that particle size distributionand soil moisture retention data showed no evidence of bimodality.
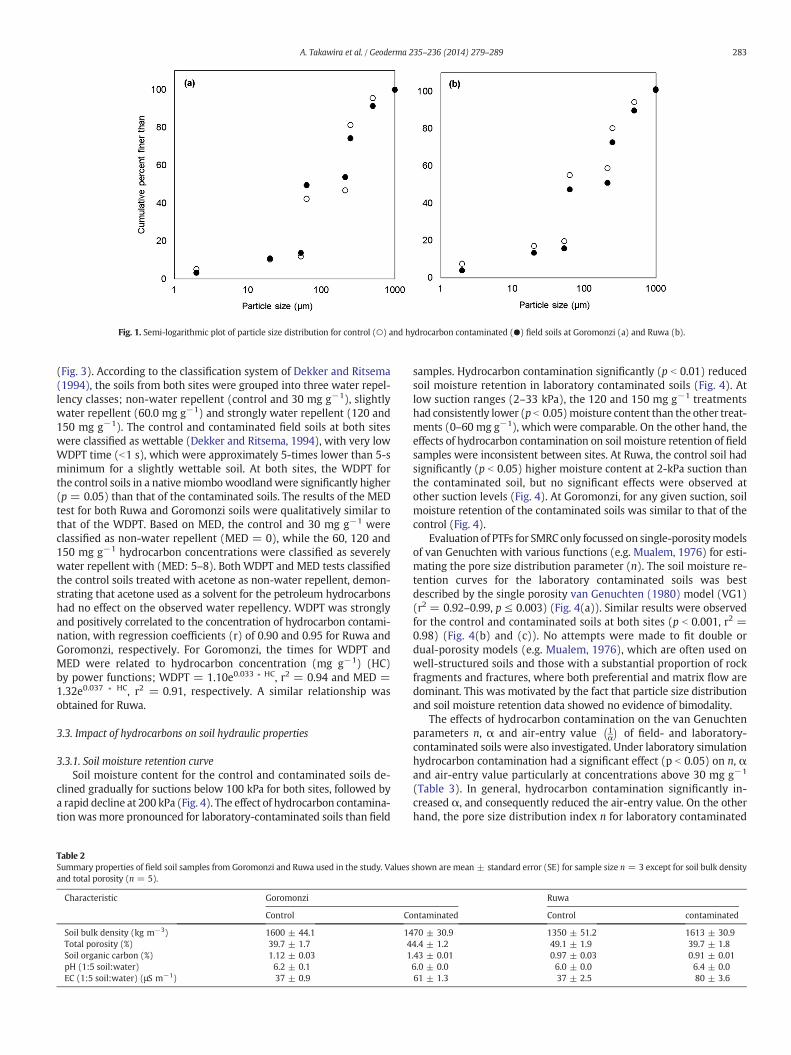
The effects of hydrocarbon contamination on the van Genuchtenparameters n, α and air-entry value 1
α
� �of field- and laboratory-
contaminated soils were also investigated. Under laboratory simulationhydrocarbon contamination had a significant effect (p b 0.05) on n, αand air-entry value particularly at concentrations above 30 mg g−1
(Table 3). In general, hydrocarbon contamination significantly in-creased α, and consequently reduced the air-entry value. On the otherhand, the pore size distribution index n for laboratory contaminated
shown are mean ± standard error (SE) for sample size n = 3 except for soil bulk density
Fig. 2. (a) Relationships between hydrocarbon contamination and time for WDPT ( ) and MED (○) water repellency tests, and (b) correlation between time forWDPT andMED for lab-oratory contaminated Goromonzi soil. Similar results were obtained for the Ruwa soil (data not shown).
284 A. Takawira et al. / Geoderma 235–236 (2014) 279–289
soils generally decreased with increasing hydrocarbon contamination.Field contaminated soils had significantly lower α (p b 0.05) andhence higher air-entry value than the uncontaminated control, but ef-fects on n were not significant at both field sites.
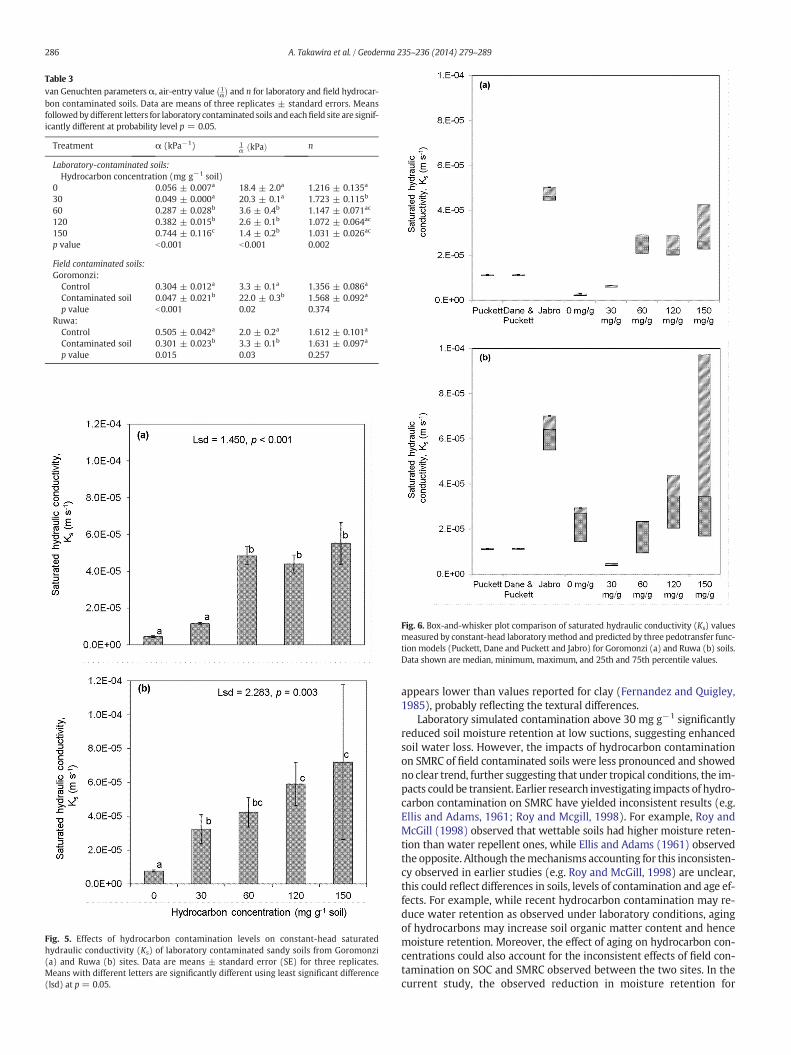
crease in Ks at both sites (Fig. 5), but site effects were not significant.At Goromonzi, all hydrocarbon contaminated soils had significantlyhigher (p b 0.001) Ks than the control. A similar trend was observed atRuwa, but the 30mg g−1 treatment had Ks similar to that of the control.Although site had no significant effect on Ks, Ruwa had slightly higherKs (4.27 × 10⁻⁵ m s−1) than Goromonzi (3.27 × 10⁻⁵ m s−1).A significant linear relationship (p b 0.05) was observed betweenthe level of hydrocarbon contamination (HC) and Ks at both Ruwa(Ks = 5 × 10⁻⁷ ∗ HC + 1 × 10⁻⁵, r2 = 0.88) and Goromonzi (Ks =3 × 10⁻⁷ ∗ HC + 9 × 10⁻⁵, r2 = 0.78).
Evaluation of five PTFs on Goromonzi soil revealed that predictedmedian Ks values (1.0–4.0 × 10⁻⁵ m s−1) were of similar orders of
Fig. 3. Effect of concentration of hydrocarbon contamination on water repellency mea-sured by the water droplet penetration test (WDPT) on Ruwa (○) and Goromonzi (●)laboratory-contaminated soils. Data are mean of three replicates. Errors bars show 1 stan-dard error.
magnitude to laboratory-measured ones (2 × 10⁻⁶–2.4 × 10⁻⁵ m s−1)(Fig. 6(a)). The Puckett, and Dane and Puckett PTF models yielded theclosest estimate ofKs for the control and the 30mgg−1 hydrocarbon con-centration, but tended to under-estimate Ks for higher level of hydrocar-bon contamination (60–150 mg g−1). The opposite trend was observedfor the Jabro PTF model, which over-predicted Ks for low hydrocarbonconcentrations (control and 30 mg g−1) by approximately an order ofmagnitude, but gave estimates comparable to laboratory measuredvalues for higher hydrocarbon concentrations (60–150 mg g−1)(Fig. 6(a)). The performance of PTFs on Ruwa soil was generallycomparable to that of Goromonzi soil. The only exception was that thePuckett, and Dane and Puckett PTF models performed equally well forthe 60 mg g−1 hydrocarbon contamination (Fig. 6(b)). The Jabro PTFmodel also tended to under-predict the median Ks for all samples, butits values were within the range for the 150 mg g−1 hydrocarbon con-tamination. For both soils, laboratory-measured Ks showed higher vari-ability than predicted values. However, it is noteworthy that theevaluation of PTFs compared predicted values based on input data mea-sured on control and contaminated field samples to those measured onthe control and laboratory-contaminated samples. This was motivatedby the findings of the current and previous research (e.g. Roy et al.,1999) demonstrating that hydrocarbon contamination of laboratorysoils had negligible effects on the input data for the PTFs for Ks (PSD,bulk density and soil organic carbon).
4. Discussion
Hydrocarbon contamination via accidental spills, leakages fromoilfield installations and disposal of used petroleum products potential-ly alters soil hydrological and ecological functions. Understanding theimpacts of hydrocarbon contamination on soil and chemical propertiesis critical for remediation of contaminated sites. The current study in-vestigated water repellency and hydraulic properties of laboratory andfield contaminated sandy loam and loamy sands derived from graniticparent material in tropical Zimbabwe. The soils were inherently wetta-ble, and consisted predominantly of sand fraction (80–91%). Here, wediscuss the key findings on general soil properties, water repellency, hy-draulic properties and evaluation of prominent PTFs for the predictionof SMRC and Ks, and highlight the implications.
The time for WDPT and MED tests were positively correlated, indi-cating that the two methods gave comparable results. Although previ-ous research (e.g. Dekker and Ritsema, 1994) has reported that theWDPT test tends to be less sensitive than the MED test, our resultsshowed that for soils similar to those studied here, either of the twomethodsmay be used for water repellency evaluation. This observation
Fig. 4. Soil moisture retention curves for laboratory contaminated soils (a) and field contaminated soils (●) and control (○) at Ruwa (b) and Goromonzi (c) sites. RETC software(version 6.02) was used to fit the single-porosity van Genuchten (VG) pedotransfer function to measured data (van Genuchten et al., 1991).
285A. Takawira et al. / Geoderma 235–236 (2014) 279–289
is consistent with a few earlier studies showing agreement betweenWDPT andMED results (e.g. Badía et al., 2013). In this regard, consider-ing that no special reagents are required for the WDPT, this method isideal for rapid water repellency evaluation under field conditions, par-ticularly where laboratory facilities are lacking.
Subsequent water repellency evaluation based on the WDPT andMED tests both revealed that the uncontaminated soils were wettable.Followinghydrocarbon contamination, all samples becamewater repel-lent except the 30 mg g−1 treated sample, evidently confirming ouroriginal hypothesis that hydrocarbon contamination induces water re-pellency in inherently wettable tropical sandy soils. In earlier studies,water repellency has been documented in natural sandy soils (Dekkerand Ritsema, 1994; Mainwaring et al., 2004;Wahl, 2008), while limitedevidence exists for hydrocarbon contaminated soils. In these studies,water repellency has been attributed to fire, type and vegetation spe-cies, and hence soil organic carbon (Wahl, 2008). Here, we present thefirst evidence suggesting that uncontaminated sandy soils associatedwith themiombowoodlands of southernAfrica are inherentlywettable.However, hydrocarbon contamination through spills, leakages and dis-posal of petroleum hydrocarbons has the capacity to induce water re-pellency. In this case, we attribute the induced water repellency to the
presence of hydrophobic long-chain aliphatic and aromatic compoundsin petroleum hydrocarbons.
Contrary to our expectation, Ks increased linearly (p b 0.05) as theconcentration of hydrocarbons increased between 30 and 150 mg g−1.Although elucidating the exact mechanisms was beyond the scope ofthe current study, we hypothesize that the presence of hydrophobic pe-troleum hydrocarbons caused a drop in the dielectric constant of water.The resulting reduction of electrostatic interactions between the dipolarwater molecules and the charged soil matrix triggers rapid and exten-sive outflow of pore water. Indeed, a recent study by Calla et al.(2011) show that the dielectric constant of saline water droppedwhen the diesel increased from 0 to 120% by weight. Further evidencesupporting this hypothesis is provided by the two laboratorystudies on the effects of liquid hydrocarbons as soil permeants onKs (Fernandez and Quigley, 1985, 1988). Fernandez and Quigley(1985) observed that decreasing the dielectric constant from 80 to 2 in-creased Ks of clay soils by 5 orders ofmagnitude from 5× 10⁻⁹ to 1 × 10⁻⁴ cm s−1. As a result, using alcohol and liquid aromatics as permeantsat 30% of the pore volume increased Ks by 10 and 1000 fold, respectively(Fernandez andQuigley, 1985). However, themagnitude of increase ob-served on the predominantly sandy soils used in the current study
Table 3van Genuchten parameters α, air-entry value 1
α
� �and n for laboratory and field hydrocar-
bon contaminated soils. Data are means of three replicates ± standard errors. Meansfollowedby different letters for laboratory contaminated soils and eachfield site are signif-icantly different at probability level p = 0.05.
Fig. 5. Effects of hydrocarbon contamination levels on constant-head saturatedhydraulic conductivity (Ks) of laboratory contaminated sandy soils from Goromonzi(a) and Ruwa (b) sites. Data are means ± standard error (SE) for three replicates.Means with different letters are significantly different using least significant difference(lsd) at p = 0.05.
Fig. 6. Box-and-whisker plot comparison of saturated hydraulic conductivity (Ks) valuesmeasured by constant-head laboratorymethod and predicted by three pedotransfer func-tion models (Puckett, Dane and Puckett and Jabro) for Goromonzi (a) and Ruwa (b) soils.Data shown are median, minimum, maximum, and 25th and 75th percentile values.
286 A. Takawira et al. / Geoderma 235–236 (2014) 279–289
appears lower than values reported for clay (Fernandez and Quigley,1985), probably reflecting the textural differences.
Laboratory simulated contamination above 30 mg g−1 significantlyreduced soil moisture retention at low suctions, suggesting enhancedsoil water loss. However, the impacts of hydrocarbon contaminationon SMRC of field contaminated soils were less pronounced and showedno clear trend, further suggesting that under tropical conditions, the im-pacts could be transient. Earlier research investigating impacts of hydro-carbon contamination on SMRC have yielded inconsistent results (e.g.Ellis and Adams, 1961; Roy and Mcgill, 1998). For example, Roy andMcGill (1998) observed that wettable soils had higher moisture reten-tion than water repellent ones, while Ellis and Adams (1961) observedthe opposite. Although themechanisms accounting for this inconsisten-cy observed in earlier studies (e.g. Roy and McGill, 1998) are unclear,this could reflect differences in soils, levels of contamination and age ef-fects. For example, while recent hydrocarbon contamination may re-duce water retention as observed under laboratory conditions, agingof hydrocarbons may increase soil organic matter content and hencemoisture retention. Moreover, the effect of aging on hydrocarbon con-centrations could also account for the inconsistent effects of field con-tamination on SOC and SMRC observed between the two sites. In thecurrent study, the observed reduction in moisture retention for
287A. Takawira et al. / Geoderma 235–236 (2014) 279–289
laboratory contaminated soils was consistent with increased soil hy-draulic conductivity attributed to the reduced dielectric constant ofwater in the presence of hydrocarbons. Water repellency tests on fieldsamples showed that soils from both control and contaminated siteswere wettable. Unlike other sandy soils in Australia (King, 1981) andNetherlands (Dekker and Ritsema, 1994; Ritsema et al., 1993), resultsshowed that sandy soils derived from granites associated with miombonatural woodlands are inherently wettable. Contrastingwater repellen-cy results on similar textures probably reflected the effects of vegetationtype and species on the amount and forms of soil organic carbon. How-ever, t-test comparisons indicate that the WDPT for control soils werehigher than that of the contaminated soils. This observation impliesthat the organic compounds causing water repellency were relativelyhigher in natural woodlands than contaminated soils. Despite thelarge pulse spills, our findings on field contaminated soils indicate nowater repellency. There is lack of information on the persistence ofhydrocarbon-induced water repellency in tropical soils. However, thefindings of few studies conducted in temperate and arctic regions sug-gest that hydrocarbon-inducedwater repellency persists long after con-tamination (Roy and McGill, 1998). Several reasons could account forthe putative lack of persistence in the current study. First, given thatthe Ruwa site was contaminated in 2007, there exists a possibility thatbreakdown of hydrocarbons could have occurred during the 5-yearpost contamination period. Moreover, contrary to the low temperaturesthat could retard microbial activity in the temperate and arctic regions(e.g. Roy et al., 1999), relatively high temperatures associatedwith trop-ical conditions in Zimbabwe could account for the lack of persistence.Second, the application of nutrient solution to promote revegetationcould also have stimulated native microbes responsible for the decom-position of hydrocarbons. The stimulation of microbial activity causinghydrocarbon degradation through nutrient application has been report-ed in previous studies (Garcia-Blanco, 2004; Garcia-Blanco et al., 2007).However, determining the key mechanism accounting for the observedlack of persistence will require conducting further experimentationcomparing similar sites with and without nutrient addition.
Despite the lack of water repellency, residual signature of hydrocar-bon contamination was evident at both sites. For instance, EC was con-sistently higher in contaminated soils than the control soils, signifying aresidual salt load. The high EC could be associated with fuel additivesand/or soluble products of hydrocarbon decomposition. At Goromonzi,the recently (b1 year) contaminated soil had higher SOC than the con-trol. The enhanced soil structural stability arising from the relativelyhigher SOC could account for the significantly lower density and moreporous soils observed on the contaminated soil than the control. AtRuwa, the 5-year old contaminated site had significantly higher pH,bulk density and lower porosity than the control. An increase in soilpH on soils contaminated with flowline additives for oil pipelines hasalso been reported under tropical conditions in the Barrow Island inAustralia (George et al., 2011). The high bulk density, and low total po-rosity were attributed possibly to compaction associated with its closeproximity to the road compared to the control. The control and contam-inated sites had comparable SOC, suggesting that over the 5-year period,carbon derived from hydrocarbon could have undergone rapid decom-position to background levels.
Evaluation of PTFs showed that the single-porosity van Genuchtenfunction developed initially for uncontaminated natural soils providedthe best fit for soil moisture retention. The good fit for both control,and laboratory and field contaminated soils supports earlier observa-tions indicating that the impact of hydrocarbon contamination onSMRC was minimal. However, laboratory simulated hydrocarbon con-tamination increasedα and reduced the air-entry value, an observationconsistent with the reduced moisture retention in Fig. 4(a). The oppo-site effectwas observed forfield contaminated soil suggesting improvedmoisture retention on contaminated soils evident in soil moisture re-tention curves in Fig. 4(b) and (c). Although the mechanisms are un-clear, this could reflect changes in the nature and amount of soil
organic carbon especially for the Goromonzi site. However, in general,the values of n and α were comparable to those reported for naturalsandy soils (2.0 to 3.2 kPa) (e.g. Wang et al., 2009; Zhu and Mohanty,2002). Exceptionswere laboratory (0 and 30mg g−1) and field contam-inated soils from Goromonzi which had comparatively higher air entryvalues than the other treatments, probably due tofitting errors associat-ed with the RETC software. Overall, the van Genuchten parametersappeared more sensitive to hydrocarbon contamination than thelaboratory-measured soil moisture retention data. Therefore, we inferthat water and solute transport models based on the van Genuchtenfunction may be applied to the studied soils with minimum bias inmodel outputs.
Evaluation of PTFs for Ks indicate that the Puckett, and Dane andPuckett models provide Ks estimates closer to the measured valuesthan the Jabro model, which tended to over-estimate. The oppositetrend was observed for the 60–150 mg g−1 hydrocarbon contamina-tion, where the Jabro model provided a better estimate than the othertwo. The discrepancy between measured and observed Ks for the60–150 mg g−1 was associated with the observed unexpected increasein Ks with hydrocarbon contamination. These PTFs, originally developedfor natural uncontaminated soils, do not account for the phenomenonassociated with hydrocarbon contamination. It is also noteworthy thatthe PTFs forKs used in the current study all involve clay as an input. Con-sidering that the soils studied here contained 80–88% sand, it is alsolikely that the variation of predicted Ks among PTFs possibly reflects dif-ferences in input parameters. Overall, both measured and predicted Ks
values were within the range reported in literature for such texturalclasses (Sobieraj et al., 2001; Tietje and Hennings, 1996). Although thecapacity of PTFs to predict measured hydraulic properties of uncontam-inated soils has been reported in earlier studies (Dikinya, 2005; Kooland Parker, 1988), our results further confirm the validity of suchmodels on hydrocarbon contaminated soils investigated in the currentstudy.
The induced water repellency and increase in saturated hydraulicconductivity have implications on hydrological and ecological functionsof contaminated soils. Water repellency alters the water balancethrough reduced infiltration, enhanced surface runoff and erosion, andreduced soil moisture. In a seasonally dry environment, reduced soilmoisture may have adverse impacts on soil-plant-water relations, caus-ing shifts in plant species through invasion by alien species and vegeta-tion die-off. Indeed, field observations showed that contaminated siteshad sparse, yellowish and stunted vegetation consisting predominantlyof sedges and grass species, indicative of reduced vegetation growth andvigor and possibly mortality. Moreover, enhanced surface runoff maytransport hydrocarbons and other associated contaminants into surfacewater bodies, posing significant public and environmental risks. The ob-served increase in Ks on contaminated soils suggests that once saturat-ed, rapid water and contaminant transport including preferential flowmay occur in the sub-surface into groundwater systems. The generallyhigh residence times of groundwater in aquifers, coupled with anaero-bic conditions and low microbial activity in the saturated zone, implythat hydrocarbons andother contaminants tend to persist in groundwa-ter systems. This will exert a strong influence on groundwater remedi-ation and clean-up, and pose significant public and environmentalrisks particularly in southern Africa, where approximately 90% of ruralhouseholds depend on groundwater sources for domestic supply.
5. Summary, conclusions and outlook
Hydrocarbon contamination of soils occurs frequently yet limited re-search has investigated water repellency and changes in soil hydraulicproperties induced by such contamination. In addition, comparison ofwater repellencymethods and evaluation of existing PTFs for estimatinghydraulic properties on such soils have been lacking. The current studymeasured water repellency and hydraulic properties, and evaluatedPTFs on laboratory-and field-contaminated tropical sandy soils. The
288 A. Takawira et al. / Geoderma 235–236 (2014) 279–289
WDPT and MED methods for water repellency evaluation gave compa-rable results. Laboratory simulated hydrocarbon contamination of soilsinduced water repellency (WR) and a significant increase in saturatedhydraulic conductivity (Ks) in an inherently wettable sandy soil. The in-crease in Ks was attributed to the reduction of the dielectric constant ofwater caused by the presence of hydrophobic hydrocarbons. Contrary tostudies conducted in temperate and arctic environments where WRpersists for over 20 to 50 years after hydrocarbon contamination, thecurrent study showed that hydrocarbon contaminated field soils werewettable, as evidenced by WDPT far below the minimum threshold forwater repellent soils. This indicates that under tropical conditions,such induced water repellency could be transient or non-persistent.The induced water repellency could potentially offset the hydrologicalbalance and adversely affect soil–plant–water relations and soil ecology.On recently contaminated sites, the associated increase inKsmay triggerrapid movement of water and contaminants into the groundwater sys-tems, and influence remediation or clean-up process. Non-persistenceof water repellency in the tropics could be attributed to high biodegra-dation rates stimulated bywarm conditions. At the Goromonzi site, nat-ural breakdown could have been further stimulated by nutrients addedto promote revegetation of the contaminated sites. The fact that bothrelatively old (5 years) and recent (b1 year) sites had similar water re-pellency further suggests that this breakdown could be rapid undertropical conditions. However, the residual signature of hydrocarboncontamination onfield sampleswas evident through stunted vegetationand changes in electrical conductivity, pH, soil organic carbon, bulk den-sity and total porosity. Despite these changes in soil properties, the re-sults suggest that the existing PTFs provide reliable estimations ofSMRC and Ks as evidenced by values within the same order of magni-tude. By inference, water and solute balance models relying on thesePTFs to estimate storages and fluxes may yield outputs with minimumbias. Coupled with additional field data, these data are sufficiently accu-rate for large-scale simulation of water and solute transport on contam-inated soils using existing models based on the PTFS evaluated here.
In general, the findings support the hypothesis that hydrocarboncontamination induces water repellency and reduces moisture reten-tion on inherently wettable tropical sandy soils. However, the positivelinear relationship between hydrocarbon contamination and Ks
contradicted the original hypothesis, an observation attributed to a de-crease in the dielectric constant of water. Future research should focuson elucidating the key mechanisms responsible for the increased Ks inhydrocarbon contamination. Further field investigations based on acontamination chronosequence or gradient are also required to confirmour laboratory findings. Such studies will also provide comprehensiveinformation on the temporal evolution of water repellency and hydrau-lic properties, and the fate and degradation mechanisms of hydrocar-bons under tropical conditions.
Acknowledgments
We are grateful to staff from the Hazardous Substance Inspectorateof the Zimbabwe Environmental Management Agency (EMA) for de-tailed site information, and their time and effort during site identifica-tion and sampling. We also thank staff from the Department of Soiland Agricultural Engineering at the University of Zimbabwe for assis-tance during laboratory analyses. Laboratory reagents were partly pro-vided by WG's biochar research project funded by the SwedishInternational Foundation for Science (IFS) Grant Number C/5266-1.The authors are solely responsible for the experimental design, data col-lection and interpretation, manuscript compilation and conclusionsdrawn thereof. We are also grateful to Professor Jirka Simunek ofthe Department of Environmental Sciences, University of California Riv-erside for help with interpretation of RETC results. The manuscript alsobenefited from valuable comments provided by two anonymous re-viewers, to whom we are sincerely thankful.
References
Adams, R.H.,Cruz, J.Z., 2008. Water repellency in oil contaminated sandy and clayey soils.Int. J. Environ. Sci. Technol. 5 (4), 445–454.
Adams, R.H.,Osorio, F.J.G.,Cruz, J.Z., 2008. Water repellency in oil contaminated sandy andclayey soils. Int. J. Environ. Sci. Technol. 5 (4), 445–454.
Aislabie, J.M.,Balks, M., Foght, J.M.,Waterhouse, J., 2004. Hydrocarbon spills on antarcticsoils: effects and management. Environ. Sci. Technol. 38 (5), 1265–1274.
Arcenegui, V.,Mataix-Solera, J.,Guerrero, R.,Zornoza, R.,Mayoral, A.M.,Morales, J., 2007.Factors controlling the water repellency induced by fire in calcareous Mediterraneanforest soils. Eur. J. Soil Sci. 58, 1254–1259.
Badía, D., Aguirre, J.A., Martí, C., Márquez, M.A., 2013. Sieving effect on the intensityand persistence of water repellency at different soil depths and soil types from NE-Spain. Catena 108, 44–49.
Balks, M.R.,Paetzold, R.F.,Kimble, J.M.,Aislabie, J.,Campbell, I.B., 2002. Effects of hydrocar-bon spills on the temperature and moisture regimes of Cryosols in the Ross Searegion. Antarct. Sci. 14 (4), 319–326.
Blake, G.R.,Hartge, K.H., 1986. Bulk density, In: Klute, A. (Ed.), Methods of Soil AnalysisPart 1 ASA Monograph No. 9, 2nd ed. American Society of Agronomy, Madison, Wis-consin, pp. 363–376.
Bohnhoff, G.L., Ogorzalek, A.S., Benson, C.H., Shackelford, C.D., Apiwantragoon, P., 2009.Field data and water-balance predictions for a monolithic cover in a semiarid climate.J. Geotech. Geoenviron. 135 (3), 333–348.
Buczko, U., Bens, O., Huttl, R.E., 2006. Tillage effects on hydraulic properties andmacroporosity in silty and sandy soils. Soil Sci. Soc. Am. J. 70, 1998–2007.
Burckhard, S.R.,Pirkl, D.,Schaefer, V.R.,Kulakow, P.,Levenet, B., 2004. A study of soil water-holding properties as affected by TPH. Proceedings of the 2000 Conference ofHazardous Waste.
Calla, O.P.N.,Hasan, S.,Almadian, N., 2011. Variability of dielectric constant of saline waterin combination with diesel in Cj band (5.3 GHz) and Ku band (13.4 GHz). Indian J.Radio Space Phys. 40, 153–158.
Caravaca, F.,Rolda, A., 2003. Assessing changes in physical and biological properties in asoil contaminated by oil sludges under semiarid Mediterranean conditions.Geoderma 117, 53–61.
Contreas, S.,Cantón, Y.,Solé-Benet, A., 2008. Sieving crusts and macrofaunal activity con-trol soil water repellency in semiarid environments: evidences from SE Spain.Geoderma 145, 252–258.
Cosby, B.J.,Hornberger, G.M., Clapp, R.B.,Ginn, T.R., 1984. A statistical exploration of soilmoisture characteristics to the physical properties of soils. Water Resour. Res. 20,682–690.
Dane, J.H.,Puckett, W., 1994. Field soil hydraulic properties based on physical and miner-alogical information. In: van Genuchten, M.Th., et al. (Eds.), Proceedings of the Inter-national Workshop on Indirect Methods for Estimating the Hydraulic Properties ofUnsaturated Soils. University of California, Riverside, pp. 389–403.
Dekker, L.W., Jungerius, P.D., 1990. Water repellency in the dunes with special referenceto the Netherlands. Catena Suppl. 18, 173–183.
Dekker, L.W.,Ritsema, C.J., 1994. How water moves in a water repellent sandy soil: I. Po-tential and actual water repellency. Water Resour. Res. 30, 2507–2517.
Dikinya, O., 2005. Comparison of the instantaneous profile method and inverse modelingfor prediction of effective soil hydraulic properties. Soil Res. 43, 599–606.
Dlapa, P., Doerr, S.H., Lichner, L., Sir, M., Tesar, M., 2004. Effect of kaolinite and Ca-montmorillonite on the alleviation of soil water repellency. Plant Soil Environ. 50(2), 358–363.
Doerr, S.H., 1998. On standardizing the ‘water drop penetration time’ and the ‘molarity ofan ethanol droplet' techniques to classify soil hydrophobicity: a case study using me-dium textured soils. Earth Surf. Process. Landf. 23, 663–668.
Doerr, S.H., Shakesby, R.A., Walsh, R.P.D., 1996. Soil hydrophobicity variations withdepth and particle size fraction in burned and unburned Eucalyptus globulus andPinus pinaster forest terrain in the Águeda Basin, Portugal. Catena 27, 25–47.
Doerr, S.H.,Shakesby, R.A.,Walsh, R.P.D., 2000. Soil water repellency: its causes, character-istics and hydro-geomorphological significance. Earth-Sci. Rev. 51, 63–65.
Doerr, S.H.,Shakesby, R.A.,Dekker, L.W.,Ritsema, C.J., 2006. Occurrence, prediction and hy-drological effects of water repellency amongst major soil and land-use types in ahumid temperate climate. Eur. J. Soil Sci. 57, 741–754.
Ellis Jr., R.,Adam Jr., R.S., 1961. Contamination of soils by petroleum hydrocarbons. Adv.Agron. 13, 197–216.
FAO (Food and Agriculture Organization), 1988. UNESCO soil map of the world, revisedlegend. World Resources Report, 60. FAO-UNESCO, Rome.
Fernandez, F.,Quigley, R.M., 1985. Hydraulic conductivity of natural clays permeated withsimple liquid hydrocarbons. Can. Geotech. J. 22 (2), 205–214.
Fernandez, F.,Quigley, R.M., 1988. Viscosity and dielectric constant control on the hydrau-lic conductivity of clay soils permeated with water-soluble organics. Can. Geotech. J.25, 582–589.
Foght, J.M.,Waterhouse, E.J., 2004. Critical review hydrocarbon spills on Antarctic soils: ef-fects and management. Environ. Sci. Technol. 38 (5), 1265–1274.
Garcia-Blanco, S., 2004. Testing the Resource-ratio Theory as a Framework forSupporting a Bioremediation Strategy for Clean-up of Crude Oil-contaminated Envi-ronments (Ph.D. Dissertation) University of Cincinnati, Cincinnati, OH.
Garcia-Blanco, S.,Venosa, A.D.,Suidan, M.T.,Lee, K.,Cobanli, S.,Haines, J.R., 2007. Biostimu-lation for the treatment of an oil-contaminated coastal salt marsh. Biodegradation 18(1), 1–15.
Gee, G.W., Bauder, J.W., 1986. Particle size analysis, In: Klute, A. (Ed.), Methods of SoilAnalysis, Part 1. Physical and Mineralogical Methods, 2nd edn ASA SSSA, Madison,WI, pp. 383–411.
289A. Takawira et al. / Geoderma 235–236 (2014) 279–289
George, S.J.,Sherbone, J.,Hinz, C.,Tibbett, M., 2011. Terrestrial exposure of oilfield flowlineadditives diminish soil structural stability and remediative microbial function. Envi-ron. Pollut. 159, 2740–2749.
Gwenzi, W., 2010. Vegetation and Soil Controls onWater Redistribution on Recently Con-structed Ecosystems in Water-limited Environments(PhD thesis) The University ofWestern Australia, Perth.
Harper, R.J.,McKissock, I.,Gilkes, R.J.,Carter, D.J.,Blackwell, P.S., 2000. Amultivariate frame-work for interpreting the effects of soil properties, soil management and landuse onwater repellency. J. Hydrol. 231–232, 371–383.
Hillel, D., 1998. Environmental Soil Physics. Academic Press, San Diego, CA.Holländer, H.M., Blume, T., Bormann, H., Buytaert, W., Chirico, G.B., Exbrayat, J.-F.,
Gustafsson, D.,Hölzel, H.,Kraft, P.,Stamm, C.,Stoll, S.,Blöschl, G.,Flühler, H., 2009. Com-parative predictions of discharge from an artificial catchment (Chicken Creek) usingsparse data. Hydrol. Earth Syst. Sci. 13, 2069–2094.
Huffman, L.,Forest, A.N.,Collins, F., 2001. Strength of hydrophobicity and persistence frontof fire-induced and lodge pole soil under Colorado ponderosa. Hydrol. Process. 15,2877–2892.
Hyun, S., Mi-Youn, A., Zimmerman, A.R., Minhee, K., Kim, G.-J., 2008. Implication ofhydraulic properties of bio-remediated diesel-contaminated soil. Chemosphere 71,1646–1653.
Ippisch, O., Vogel, H.J., Bastian, P., 2006. Validity limits for the van Genuchten–Mualemmodel and implications for parameter estimation and numerical simulation. Adv.Water Resour. 29 (12), 1780–1789.
Jabro, J.D., 1992. Estimation of saturated hydraulic conductivity of soils from particle sizedistribution and bulk density data. Trans. ASAE 35 (2), 557–560.
Jordán, A.,Zavala, L.M.,Mataix-Solera, J.,Doerr, S.H., 2013. Soil water repellency: origin, as-sessment and geomorphological consequences. Catena 108, 1–5.
King, P.M., 1981. Comparison of methods for measuring severity of water repellence ofsandy soils and assessment of some factors that affect its measurements. Aust. J.Soil Res. 19, 275–285.
Klute, A.,Dirksen, C., 1986. Hydraulic conductivity and diffusivity: laboratory methods, In:Klute, A. (Ed.), Methods of Soil Analysis, Part 1. Physical and Mineralogical Methods,2nd ed. ASA SSSA, Madison, WI, pp. 687–734.
Kool, J.B.,Parker, J.C., 1988. Analysis of the inverse problem for transient unsaturated flow.Water Resour. Res. 24 (6), 817–830. http://dx.doi.org/10.1029/WR024i006p00817.
Kostka, S.J., 2000. Amelioration of water repellency in highly managed soils and the en-hancement of turfgrass performance through the systematic application of surfac-tants. J. Hydrol. 231 (232), 359–368.
Letey, J., 1969. Measurement of contact angle, water drop penetration time, and criticalsurface tension. Proceedings of the Symposium on Water-repellent Soils, 6–10 May1968. University of California, Riverside, pp. 43–47.
Letey, J., Carrillo, M.L.K.,Pang, X.P., 2000. Approaches to characterize the degree of waterrepellency. J. Hydrol. 231 (232), 61–65.
Mainwaring, K.A., Morley, C.P., Doerr, S.H., Douglas, P., Llewellyn, C.T., Llewellyn, G.,Matthews, I.,Stein, B.K., 2004. Role of heavy polar organic compounds for water repel-lency of sandy soils. Environ. Chem. Lett. 2, 35–39.
Mataix-Solera, J.,Doerr, S.H., 2004. Hydrophobicity and aggregate stability in calcareoustopsoil from fire affected pine forests in southeastern Spain. Geoderma 118, 77–88.
Millioli, V.S.,Servulo, E.L.-C.,Sobral, L.G.S.,De Carvalho, D.D., 2009. Bioremediation of crudeoil-bearing soil: evaluating the effect of rhamnolipid addition to soil toxicity and tocrude oil biodegradation efficiency. Global NEST J. 11 (2), 181–188.
Mualem, Y., 1976. A new model for predicting the hydraulic conductivity of unsaturatedporous media. Water Resour. Res. 12, 513–522.
Muñoz-Carpena, R.,Regalado, C.M.,Álvarez-Benedí, J., Bartoli, F., 2002. Field evaluation ofthe new Philip–Dunne permeameter for measuring saturated hydraulic conductivity.Soil Sci. 167 (1), 9–24.
Nyamapfene, K., 1991. Soils of Zimbabwe. Nehanda Publishers, Harare.Okalebo, J.R., Gathua, K.W.,Wormer, P.L., 1993. Laboratory methods of soil and plant
analysis: a working manual. Soil Science Society of East Africa Technical PublicationNo. 1Marvel EPZ (Kenya) LTD, Nairobi, Kenya.
Puckett, W.E.,Dane, J.H.,Hajek, B.H., 1985. Physical and mineralogical data to determinesoil hydraulic properties. Soil Sci. Soc. Am. J. 49, 831–836.
Quyum, A., 2000. Water Migration Through Hydrophobic Soils(M.Sc. thesis) Departmentof Civil Engineering. The University of Calgary, Alberta, p. 157.
Rahman, A.Z.,Hamzah, U.,Mohd, P.,Taha, R.,Ithnain, N.,Ahmad, N.S., 2010. Influence of oilcontamination on geotechnical properties of basaltic residual soil. Am. J. Appl. Sci. 7(7), 954–961.
Rayment, G.E.,Higginson, F.R., 1992. Australian laboratory handbook of soil and waterchemical methods. Australian Soil and Land Survey HandbookInkata Press, Mel-bourne, Sydney.
Reynolds, W.D., Elrick, D.E., 2002. Constant head well permeameter (vadose zone). In:Dane, J.H., Topp, G.C. (Eds.), Methods of Soil Analysis, Part 4. Physical Methods. SoilScience Society of America, Inc., Madison, WI, pp. 844–858.
Reynolds, W.D.,Bowman, B.T.,Brunke, R.R.,Drury, C.F.,Tan, C.S., 2000. Comparison of ten-sion infiltrometer, pressure infiltrometer, and soil core estimates of saturated hydrau-lic conductivity. Soil Sci. Soc. Am. J. 64, 478–484.
Reynolds,W.D.,Elrick, D.E.,Young, E.G.,Amoozegar, A.,Booltink, H.W.G.,Bouma, J., 2002. Sat-urated and field-saturated water flow parameters. In: Dane, J.H., Topp, G.C. (Eds.),Methods of Soil Analysis, Part 4. Physical Methods. Soil Science Society of America,Inc., Madison, WI, pp. 797–878.
Ritsema, C.,Dekker, L.W.,Hendrickx, J.M.H.,Hamminga, W., 1993. Preferential flow mech-anism in a water repellent sandy soil. Water Resour. Res. 29, 2183–2193.
Roy, J.L.,Mcgill, W.B., 1998. Characterization of disaggregated nonwettable surface soilsfound at old crude oil spill sites. Can. J. Sci. 78, 331–344.
Roy, J.L., McGill, W.B., Rawluk, M.D., 1999. Petroleum residues as water-repellentsubstances in weathered nonwettable oil-contaminated soils. Can. J. Soil Sci. 79,367–380.
Scott, D.F., 2000. Soil wettability in forested catchments in South Africa; as measuredby different methods and as affected by vegetation cover and soil characteristics. J.Hydrol. 232, 87–104.
Tietje, O.,Hennings, V., 1996. Accuracy of the saturated hydraulic conductivity predictionby pedotransfer functions compared to the variability within FAO textural classes.Geoderma 69, 71–84.
Timberlake, J.,Chidumayo, E., 2011. Miombo ecoregion vision report. Occasional Publica-tions in Biodiversity No. 20Biodiversity Foundation for Africa/WWF SARPRO, p. 80.
USDA (United States Department of Agriculture), 1994. Keys to Soil Taxonomy, 6th ed.USDA Soil Conservation Service, Washington DC.
van Genuchten, M.Th., 1980. A closed-form equation for predicting the hydraulic conduc-tivity of unsaturated soils. Soil Sci. Soc. Am. J. 44, 892–898.
van Genuchten, M.Th.,Leij, F.J.,Yates, S.R., 1991. The RETC code for quantifying the hydrau-lic functions of unsaturated soils. Version 6.02 EPA Report 600/2-91/065. U.S. SalinityLaboratory, USDA, ARS, Riverside, California (Available on-line http://www.pc-prog-ress.com/en/Default.aspx?RETC.).
Verboom, W.C., 1991. The Influence of Soil Surface Settling and Sealing on the Water Dy-namics of Three Zimbabwean Topsoils(PhD thesis) Department of Soil Science andAgricultural Engineering, Faculty of Agriculture, University of Zimbabwe, Harare.
Wahl, N.A., 2008. Variability of water repellency in sandy forest soils under broadleavesand conifers in north-western Jutland/Denmark. Soil and Water Research 3 (1),155–164.
Wallach, R., 2010. Effect of soil water repellency on moisture distribution from a subsur-face point source. Water Resour. Res. 46, W08521. http://dx.doi.org/10.1029/2009WR007774.
Wallach, R., Jortzick, C., 2008. Unstable finger-like flow in water-repellent soils duringwetting and redistribution — the case of a point water source. J. Hydrol. 351 (1–2),26–41.
Wallach, R.,Ben-Arie, O.,Graber, E.R., 2005. Soil water repellency induced by long-term ir-rigation with treated sewage effluent. J. Environ. Qual. 34 (5), 1910–1920.
Wang, T.,Zlotnik, V.,Šimunek, J.,Schaap, M., 2009. Using pedotransfer functions in vadosezonemodels for estimating groundwater recharge in semiarid regions. Water Resour.Res. 45, W04412. http://dx.doi.org/10.1029/2008WR006903.
Watson, C.L., Letey, J., 1970. Indices for characterizing soil water-repellency based uponcontact angle-surface tension relationships. Proc. Soil Sci. Soc. Am. 34, 841–844.
Zavala, L.M.,González, F.A., Jordán, A., 2009. Intensity and persistence of water repellencyin relation to vegetation types and soil parameters in Mediterranean SW Spain.Geoderma 152, 361–374.
Zhu, J.,Mohanty, B.P., 2002. Spatial averaging of van Genuchten hydraulic parameters forsteady-state flow in heterogeneous soils: a numerical study. Vadose Zone J. 1,261–272.