Lund University Lund Institute of Technology Department of Industrial Management & Logistics Division of Production Management Taking ERP to ROI How to Benefit from ERP Investments Master Thesis at the Department of Industrial Management & Logistics, Summer 2003 Authors: Mikael Norbäck & Johan Åkerblom Supervisors: Stig-Arne Mattsson, LTH Martin Kjellin, Applied Value AB
Transcript
Lund University Lund Institute of Technology Department of Industrial Management & Logistics Division of Production Management
Taking ERP to ROI How to Benefit from ERP Investments
Master Thesis at the Department of Industrial Management & Logistics, Summer 2003 Authors: Mikael Norbäck & Johan Åkerblom Supervisors: Stig-Arne Mattsson, LTH Martin Kjellin, Applied Value AB
II
Acknowledgements We would like to acknowledge our assigner Applied Value AB and all its employees for the assistance and guidance provided. Our two supervisors, Martin Kjellin and Stig-Arne Mattsson, deserve all the credit for their excellent feed-back and thoughtful remarks. Without them our findings would have lost their edge. Additionally we know that this project have made us neglect our friends and family, and are truly grateful for their patience. Finally we would like to recognize all the interviewees that made this thesis feasible. Stockholm, August 2003 Mikael Norbäck Johan Åkerblom
III
Abstract Title Taking ERP to ROI – How to Benefit from ERP Investments Authors Mikael Norbäck Johan Åkerblom Supervisors Martin Kjellin – Applied Value Stig-Arne Mattsson – Lund Institute of Technology Project Assigner Applied Value AB Problem definition Even though a great deal of research have been done exploring the ERP
field, companies still have a hard time determining and obtaining the full potential scope of benefits that comes with a fully working ERP system. Implementing an ERP system is like changing a heart while the patient still is running. It is therefore hard to measure the benefits and the improved efficiencies, since those don’t appear over night. The important questions asked in this master thesis are: How does a company identify their potential benefits of an ERP system, to make an investment analysis for a potential purchase? How does the company then realize those benefits and control costs through a successful ERP project? Which companies are in need of a new ERP system in the first place?
Purpose The purpose of the master thesis is to construct a model for determining
the company specific price for an ERP system, by measuring and validating the potential benefits and improved efficiencies, realized by implementing a new ERP system. In addition critical success factors and best practice when buying and implementing ERP systems will be identified.
Method By conducting a number of case studies of ERP projects, mainly in
production companies, and focusing on the cost drivers, we have identified the most common and important benefits and efficiencies from the acquisition of an ERP system. In addition, we have gathered information by interviewing seasoned officers within the business and compared our results with their wisdoms. This has given us an insight in how ERP projects are run, which in combination with a broad understanding of the ERP business has given us the knowledge to compare new findings with previous experience, and thereby reaching our goal of making a model for how to run a successful ERP project.
Conclusions We have identified 24 cost drivers, which we believe to be the most
important to take in concern when making an investment analysis for an ERP project. We have also found that there is a great difference between companies that already have an older ERP system installed and companies where no fully integrating business system exists. In the first case, benefits with the new ERP system are hard to realize and the investment analysis should instead be based on the alternative costs for
IV
keeping the old ERP system running. In the second case, possible benefits are easier to find and the investment analysis may rely on a summarization of the discounted future cash flows from those. In addition, an analysis of actual costs and learnings from the case studies has been conducted and a guideline with best practice for running an ERP project is presented.
Keywords ERP, ROI, business system, investment analysis, project management,
change management.
V
Table of Contents Part Ι – Introduction, Methodology & Theory ........................................................................... 1 1. Introduction ............................................................................................................................ 2
2. Methodology .......................................................................................................................... 6 2.1. Previous Comprehension and Experience....................................................................... 6 2.2. The Research Disposition................................................................................................ 6 2.3. Choice of Scientific Approach ........................................................................................ 7
2.3.1. The Scientific Philosophy ........................................................................................ 7 2.3.2. The Relationship between Existing Theory and Empiric Content ........................... 9 2.3.3. The Research Method............................................................................................... 9
2.6. Case Studies .................................................................................................................. 12 2.6.1. In-depth Interviews................................................................................................. 13 2.6.2. Metrics of Potential Gains...................................................................................... 13
3. Theory .................................................................................................................................. 15 3.1. Value Chain................................................................................................................... 15 3.2. Change Management ..................................................................................................... 16
3.2.1. The ADKAR Model ............................................................................................... 16 3.3. Organizational Development......................................................................................... 18
3.3.1. Diagnosing the Starting Conditions ....................................................................... 19 3.4. Resistance to Change..................................................................................................... 19 3.5. Three Perspectives......................................................................................................... 19 3.6. What is ERP?................................................................................................................. 20
3.6.1. The Five Major Reasons......................................................................................... 20 3.6.2. History .................................................................................................................... 21
3.7. Previous Research Studies – Deloitte Consulting Report ............................................. 22 3.7.1. Summary ................................................................................................................ 22 3.7.2. Anticipated vs. Realized Benefits .......................................................................... 22 3.7.3. A Time Schedule .................................................................................................... 23 3.7.4. Learnings ................................................................................................................ 24 3.7.5. Conclusions ............................................................................................................ 25
Part II – Analysis, Conclusion & References........................................................................... 26 4. Case Studies Summary......................................................................................................... 27
4.1. Company A.................................................................................................................... 27 4.2. Company B.................................................................................................................... 27 4.3. Company C.................................................................................................................... 27
VI
4.4. Company D.................................................................................................................... 27 4.5. Company E .................................................................................................................... 28 4.6. Company F .................................................................................................................... 28 4.7. Company G.................................................................................................................... 28 4.8. Company H.................................................................................................................... 28
5.2. Costs .............................................................................................................................. 34 5.2.1. The Underestimation of Costs ................................................................................ 34 5.2.2. The Typical Cost Structure of an ERP Project....................................................... 36
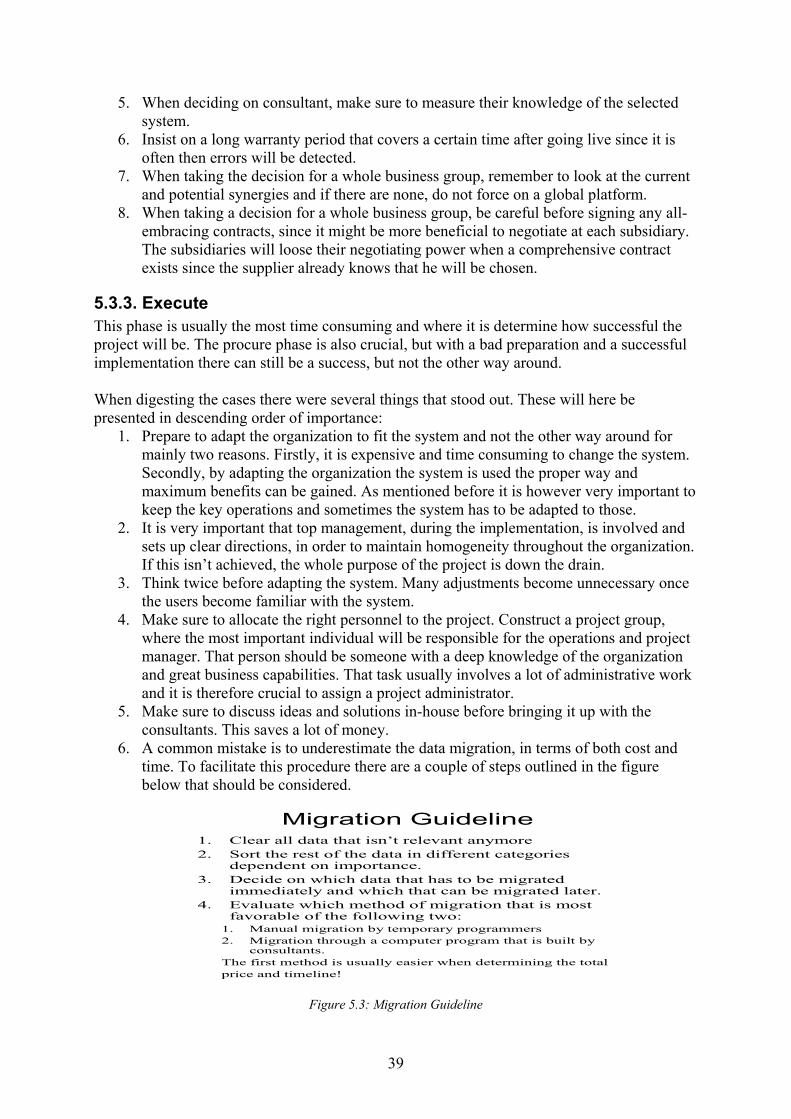
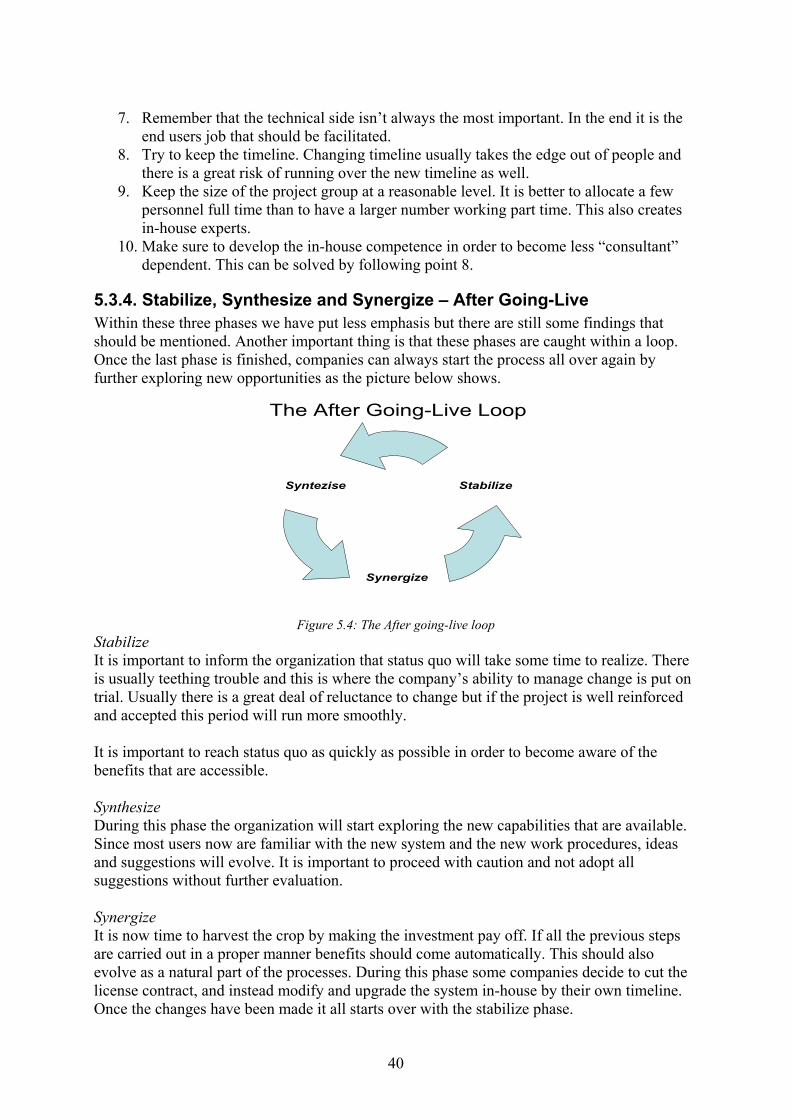
5.3. Best Practice .................................................................................................................. 37 5.3.1. Procure.................................................................................................................... 37 5.3.2. Decide..................................................................................................................... 38 5.3.3. Execute ................................................................................................................... 39 5.3.4. Stabilize, Synthesize and Synergize – After Going-Live....................................... 40
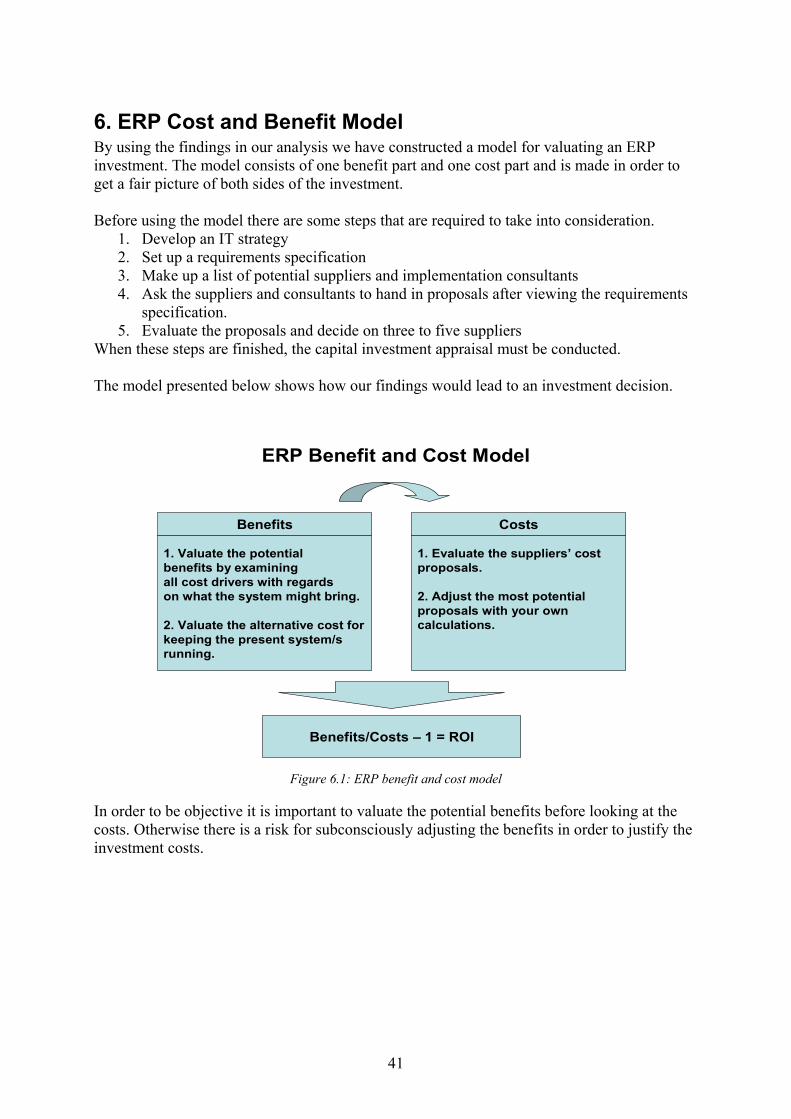
6. ERP Cost and Benefit Model ............................................................................................... 41 7. Conclusions .......................................................................................................................... 42
7.1. Benefits.......................................................................................................................... 42 7.2. Costs .............................................................................................................................. 44 7.3. Best Practice .................................................................................................................. 44
Part ΙΙI – Case Studies .............................................................................................................. 49 9. Company A........................................................................................................................... 50
9.1. Company Overview....................................................................................................... 50 9.2. Company A’s Former System ....................................................................................... 50 9.3. Company A’s New System ........................................................................................... 50 9.4. Organizational Changes, Benefits and Costs ................................................................ 51
10. Company B......................................................................................................................... 57 10.1. Company Overview..................................................................................................... 57 10.2. The Former System ..................................................................................................... 57 10.3. The New System ......................................................................................................... 58
10.3.1. The Decision Process ........................................................................................... 58 10.3.2. Extension .............................................................................................................. 58
11. Company C......................................................................................................................... 63 11.1. Company Overview..................................................................................................... 63 11.2. Company C Existing Business System ....................................................................... 63 11.3. Changed Conditions .................................................................................................... 63 11.4. Defining the Need ....................................................................................................... 64 11.5. System Evaluation....................................................................................................... 64
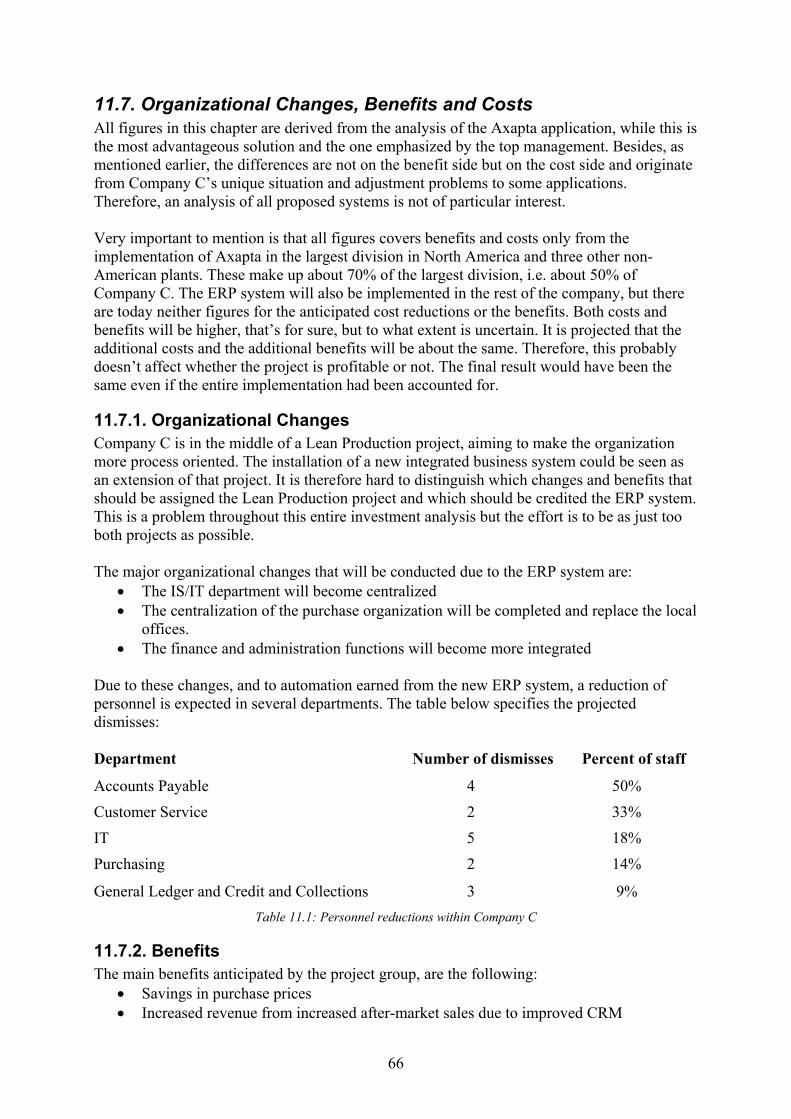
11.5.1. The Choice ........................................................................................................... 65 11.6. Planned Implementation.............................................................................................. 65 11.7. Organizational Changes, Benefits and Costs .............................................................. 66
11.9. Metrics of Potential Gains........................................................................................... 69 11.10. Conclusions ............................................................................................................... 70
12. Company D......................................................................................................................... 71 12.1. Company Overview..................................................................................................... 71 12.2. The Acquisition ........................................................................................................... 71
12.2.1. The Former System .............................................................................................. 71
VIII
12.3. The New System ......................................................................................................... 72 12.3.1. The Decision Process ........................................................................................... 72 12.3.2. Expectations ......................................................................................................... 72
13. Company E ......................................................................................................................... 77 13.1. Company overview...................................................................................................... 77
13.1.1. Global Supply and IT ........................................................................................... 77 13.1.2. Capital Structure................................................................................................... 78
13.2. ERP System Background ............................................................................................ 78 13.3. The New System ......................................................................................................... 78
13.3.1. Expectations and Choice ...................................................................................... 78 13.3.2. The Implementation ............................................................................................. 79 13.3.3. Problems............................................................................................................... 79
14. Company F ......................................................................................................................... 82 14.1 Company Overview...................................................................................................... 82
14.1.1. Production Complexity......................................................................................... 82 14.1.2. Capital Structure................................................................................................... 83 14.1.3. The ERP Systems Used by Company F’s business group ................................... 83
14.2. The Previous System................................................................................................... 83 14.3. The New System ......................................................................................................... 83
14.3.1. Expectations and Choice ...................................................................................... 83 14.3.2. The Implementation ............................................................................................. 84 14.3.3. Problems............................................................................................................... 84
15. Company G......................................................................................................................... 87 15.1. Company Overview..................................................................................................... 87 15.2. Company G’s Previous Business System.................................................................... 88
15.2.1. An Urge for Something New................................................................................ 88
IX
15.2.2. The Decision Process ........................................................................................... 88 15.3. Company G’s New System ......................................................................................... 89
15.3.1. The Choice ........................................................................................................... 89 15.3.2. Expectations ......................................................................................................... 89 15.3.3. The Implementation ............................................................................................. 89
16. Company H......................................................................................................................... 95 16.1. Company Overview..................................................................................................... 95 16.2. System Background..................................................................................................... 95
16.2.1 Global Strategy...................................................................................................... 96 16.3. The Pilot Project.......................................................................................................... 97
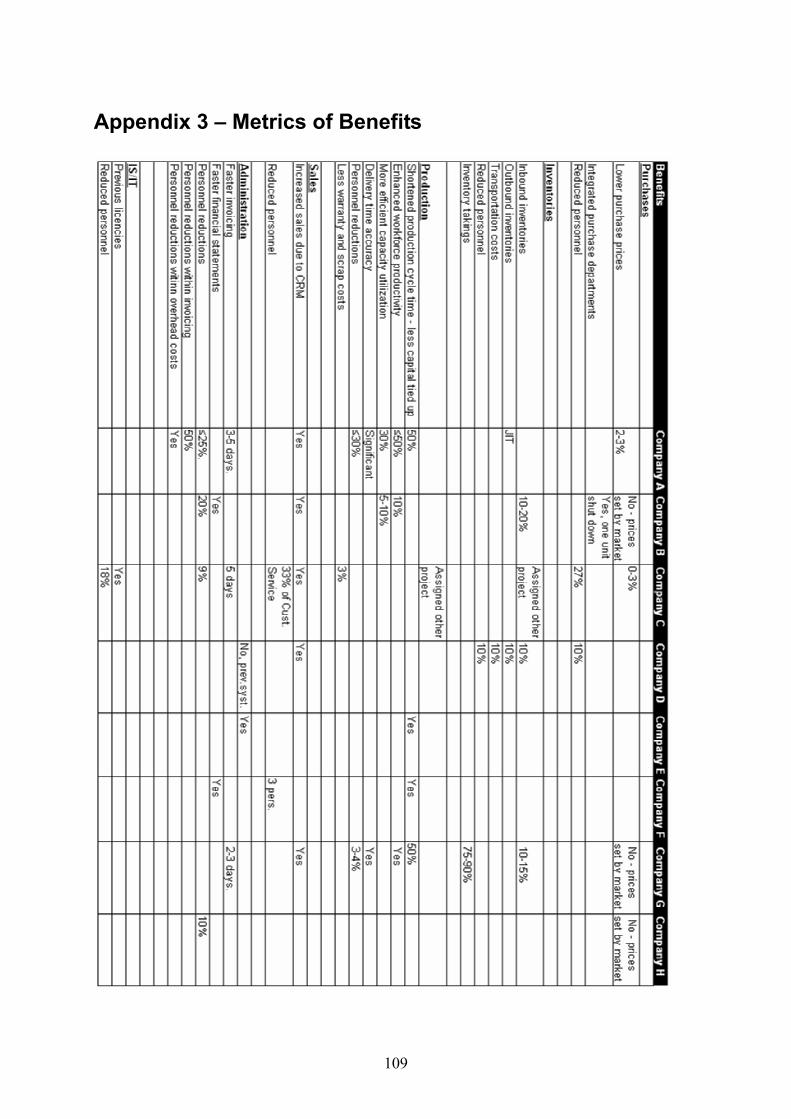
Appendix 1 – The Questionnaire............................................................................................ 102 Appendix 2 – Interview Protocol ........................................................................................... 108 Appendix 3 – Metrics of Benefits .......................................................................................... 109 Appendix 4 – Metrics of Costs............................................................................................... 110
1
Part Ι – Introduction, Methodology & Theory In this part the reader will first be introduced to the problem. Then the methods and theories used in the thesis will be described. After this part the reader should have a clear understanding of the thesis purpose.
Part Ι
1. IntroductionBackground,
problem and purpose
1. IntroductionBackground,
problem and purpose
2. Methodology2. Methodology
3. Theory3. Theory
2
1. Introduction In this chapter the reader will get a clear picture of the problem background as well as what the thesis emphasis. There will also be a presentation of the scope and the target group along with a couple of clarifying definitions.
1.1. Background Enterprise Resource Planning (ERP) systems are integrated enterprise-wide standard information systems that automate all aspects of an organization’s business processes. The ERP philosophy is that business systems incorporating sales, marketing, manufacturing, distribution, personnel and finance modules can be supported by a single integrated system with all of the company’s data captured in a central database1. During the big trend of ERP systems the last ten years, lots of companies invested huge amounts of time and money into selecting, buying and implementing ERP systems that were supposed to make life easier. The benefits were said to be twofold. First, using fewer resources to perform the same amount of work would increase the efficiency. Administrative tasks would be automated, information flows speeded up and coordination of time, materials and other resources simplified. Second, the systems would increase the effectiveness by letting companies focus on doing the right things and doing them better. Instead of spending time and money on support functions and services, the systems would allow companies to focus on their core business with increased flexibility. There was especially a boom before Y2K because many companies had concerns with adapting their IT-systems for the new millennium. However, the results so far have been very poor and only a limited number of companies can say that they have increased their efficiency by investing in ERP systems. It is estimated that at least 90% of ERP implementations end up late or even over budget2. Looking back many managers would have chosen not to invest in a full-blood ERP system, but instead chosen a simple, off-the-shelf-solution. The key concerns are often the initial investment, implementation time, maintenance cost and product lifetime. The investments are often huge ranging from 1%-10% of the revenue, all depending on the level of customization and to what extent the cost controls are managed. The implementation time is often significant and as a rule much longer than planned. The cost of maintaining the system is rarely even considered when buying the system, but often turns out to be in the same size as the initial investment. Lastly, the system is often out of date by the time it starts to pay off and a new system has to be implemented.
1.2. Problem Description Even though a great deal of research have been done in this field, companies still have a hard time determining the full potential scope of benefits that comes with a fully working ERP system. The problem is that implementing an ERP system is like changing a heart while the patient still is running and therefore it is hard to measure the benefits and the improved efficiencies. By conducting a number of case studies on mainly production companies and 1 Koch, C. The ABC of ERP 2 Martin, M.H. An ERP strategy
3
focusing on the cost drivers, we believe it’s feasible to find how much the companies have saved by using an ERP system and how to derive accurate cost and time estimations.
1.3. Purpose The purpose of the master thesis is to construct a model for determining the company specific price for an ERP system, by measuring and validating the potential benefits and improved efficiencies, realized by implementing a new ERP system. In addition critical success factors and best practice when buying and implementing ERP systems will be identified.
1.4. Demarcation Only manufacturing firms in Sweden are examined, with one exception. This includes all sorts of manufacturing processes but excludes service operations. We have also decided to only investigate the main activities in the value chain along with the accounting and finance department when setting boundaries on the ERP system. The target was to observe a large number of companies initially, and thereafter in-depth studies on five to ten firms were to be undertaken. We have chosen to focus on large Swedish companies where the business group as a whole has minimum revenue around 5,000 MSEK. The prime objective of the thesis was to identify important areas within the organization, where benefits and efficiencies usually are achieved, and evaluate those benefits as accurate as possible. The implementation of ERP systems is therefore not in focus. Instead, companies are examined before and after the implementation and differences are the prime interests. However, a best practice guideline for organizing implementation of ERP system, derived from experiences gained during the project, is presented in the conclusions.
1.5. Target Group The primary target group is the assigner, Applied Value, but also any company that is in the process of buying an ERP system as well as any other person interested in the subject at hand.
1.6. Definitions Adjustments – The conversion of data and the integration of business systems outside the ERP system. Best-of-Breed – Individual enterprise applications, selected because of their superior functionality, without regard to considerations of choosing a common vendor Big Bang – All modules on all markets are implemented at the same time Customer Relationship Management (CRM) – Information industry term for methodologies, software, and usually Internet capabilities that help an enterprise manage customer relationships in an organized way.
4
Electronic Data Interchange (EDI) – The computer-to-computer exchange of information between separate organizations. Franchising Strategy – Implementing either one module or market at a time Going Live – Turning on a new software system such as ERP Just-in-Time – A production and logistics method designed to result in minimum inventory by having material arrive at each operation just in time to be used.
Key Operation – A business, unit or function within a company, which is fundamental in order to keep a comparative advantage.
Legacy Systems – The existing computer applications, often custom developed, which are replaced by enterprise systems. Logistics – Refers to the functions of obtaining and distributing material and products Metrics – Quantitative measurements of enterprise, cross-process and individual process performance along revenue, cost, quality, time and service dimensions. Migration – The procedure to transfer data from the old business system to the new. This can be done either by building a data program that takes care of the migration or by just using manual programming to transfer the data. Performance Dip – The temporary decrease in process performance caused by user unfamiliarity to the new system, which many companies experience during the first period after going live ROI – Measures how effectively the firm uses its capital to generate profit. Net Income/Investment Cost – 1. Slam Dunk – Fast implementation of the most important modules, while the rest are gradually executed within time. Supply Chain – The activities, such as procurement, logistics and transportations, which link an organization to its suppliers π-factor – The factor π is an ironic measure claiming that an ERP implementation often ends up π times more expensive than projected.
5
1.7. Outline In order to create a clear structure the thesis has been divided into three parts. All the chapters are split up between these parts as the outline picture shows below.
Part Ι Part ΙΙ Part ΙΙΙ
1. IntroductionBackground,
problem and purpose
1. IntroductionBackground,
problem and purpose
2. Methodology2. Methodology
3. Theory3. Theory6-7. Model
& Conclusion6-7. Model
& Conclusion
5. Analysis5. Analysis
4. Case StudiesSummary
4. Case StudiesSummary
8. References8. References
9-16. Case Studies
9-16. Case Studies
Figure 1.1: The outline of the thesis
6
2. Methodology In this chapter our previous comprehension and the research disposition will be discussed and also the choice of scientific approach and the validity of the work.
2.1. Previous Comprehension and Experience The perception of a certain situation is something very individual, even temporary. The same person may experience the same events differently at different moments. This is because our understanding is influenced by many factors, ranging from environmental aspects, such as social and ethic background, to individual issues, such as educational level, job experience and age. Even the mood we are in affects our judgment and analytic capabilities. In order to work according to a scientific method, it is important to take these circumstances in account. We, the authors, must be aware of our preconceived notions, so that we can minimize their influence on our result. Our backgrounds are similar. We are both in the final stage of a Master of Science in Industrial Engineering and Management, and both of us have additional education. One of us has finished a year at McGill in Montreal and one is in the final stage of a Master of Science in Business Administration. Our previous knowledge about ERP systems was limited, almost non-existent. Therefore, preconceived notions have not significantly affected our research.
2.2. The Research Disposition There are different categories under which you may classify an investigation. Depending on the purpose of the analysis, a distinction between explorative, descriptive, explanatory, diagnostic and evaluative can be made3. Explorative studies are conducted to gain basic knowledge about a topic. The goal is to determine the when, the what and the how! This calls for the following questions to be answered. What needs to be investigated? How do you perform the investigation? Which variables are of importance and which are not? What is part of the problem and what is not4? Descriptive studies are suitable for determining the properties of the research object. In a descriptive study you gather information and determine the values of the variables5. When facing problems where several theories may be applied, you may want to do an explanatory study. Explanatory studies answer the question why and are often constructed as a hypothesis test6? Which explanation is relevant and why? If the purpose is to find the reason for a certain phenomenon, this is called a diagnostic study7.
3 Ahlström, Norbäck, Seldin (2001), p 6 4 Wallén (1993), p 43 5 ibid 6 Ahlström, Norbäck, Seldin (2001), p 7 7 ibid
7
An evaluative study’s general purpose is to measure the effects of a certain operation. The analysis may be qualitative or quantitative and compares data from before the operation with data from after the change. The work with the thesis started with an explorative study. Information was gathered and we asked ourselves “what do we want?” and “how do we reach our goals?” We decided that the best way to find the maximum price a company should pay for an ERP system is to look at the benefits. If you determine the cost reductions and the improved efficiencies an ERP system brings, and validate those in a discounted cash flow model, the maximum price that a company should pay for the system could be derived. We also decided that to reach our goals, we would have to make case studies of ERP projects already carried out in major companies in Sweden. These case studies will be designed as follow-up reports, made in cooperation with the companies. The second part of our investigation was performed as a descriptive study. Here we gathered data and other information about the business system solution in almost every company in Sweden with revenues exceeding 5,000 MSEK. We made a short interactive questionnaire, which was sent to the ERP project managers of the respective companies. The first contact with the managers was always verbal, making an agreement to send the questionnaire. Based on how well and how fast the questionnaires were responded, we gained an understanding of which managers were most willing to help us, and how uncomplicated a collaboration would turn out to be in making the case studies with their company. The actual answers in the questionnaire were of minor importance. The purpose was to arrange an interview with head officers in these companies and from them gain the information needed. Interviews were then made with managers in charge of the ERP project, managers in charge of production and managers in charge of finance operations. In total, 15 head officers were interviewed in eight different companies. These interviews, and interviews with leading ERP consultants and scientists, were sufficient to obtain a clear view of the benefits and problems concerning ERP implementations. The last part of the research was an evaluative study. The cost structure before the implementation of an ERP system was compared with the cost structure afterwards. The overall goal was to value the efficiencies and cost reductions, in order to determine the value of the benefits from the system. A case study was conducted for every company that had been interviewed. Finally the data from the case studies were compared and a model for determining a fair price for an ERP system was created.
2.3. Choice of Scientific Approach There are mainly three areas in which you may categorize the scientific methods in a thesis. The first concerns the scientific philosophy of the research. The second concerns the relationship between existing theory and the empiric content. The third concerns the research method.
2.3.1. The Scientific Philosophy Ever since the dawn of science, philosophers have argued about the true face of knowledge. The main questions have been: How do you gain science without transforming the information in the research process? What is indeed a fact and what are just speculations?
8
Depending on the nature of the investigation, you must choose a suitable scientific philosophy. The decision is based on which methods that are most appropriate to solve the task. For example, if a thesis is based on interviews, you probably can’t use mathematical and statistical instruments to analyze the answers. The most common scientific approaches are the following8: Positivism The foundation of positivistic scientific theory is rationality. All data must be empirically testable. No estimates are allowed. The information must be derived through measurements that can be repeated in order to test the results. In positivism there is a strong emphasis on cause and effect relationships and laws originating from natural science. The scientist must be objective and not influenced by non-scientific sources. System Theory In system theory, the characteristics of the research objects are not determined only through a cause and effect perspective. The object is considered to be more complicated, with all components intricate in and affecting each other. Because of this complexity, the processes don’t follow a straight line of natural laws. Hence, you must consider the object as a system. But here the following problems arise:
• How do you separate the system from the environment around it? • In which ways do the processes inside the system interact with each other and how are
they affected by stimulation from outside? • How is the system controlled?
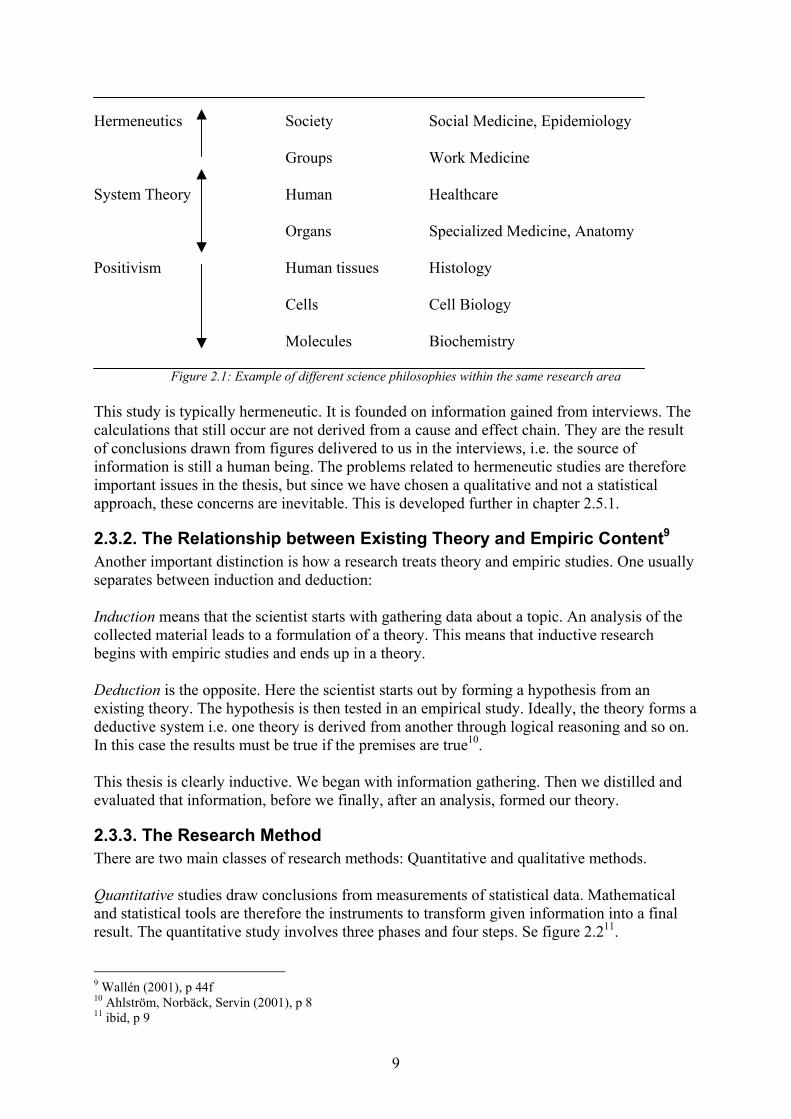
The overall context is that a system is more than just the sum of its parts. Hermeneutics In hermeneutic research, interpretation and valuation of information in texts, symbols, words, acts and experiences are central. The interpreter must be aware of his or hers preconceived notions, and also clarify those to the reader. Problems occur when the scientist tries to extract the reality from the given information. The source is affected both by the media in which the information is presented to the scientist, and by his or hers preferences. The interpreter must put the source in a context by asking: What are the source’s intentions? What is the source’s concept of the target group for the information? The hermeneutic study can’t be replicated. The results are often not precise enough to state a fact, but several studies in combination may be sufficient to form a theory. The figure below illustrates scientific philosophies within a well-known topic, the human and his surroundings. The arrows indicate the directions in which the philosophies of science theory breed applicable resource methods:
8 Wallén (2001), p 24ff
9
Hermeneutics Society Social Medicine, Epidemiology Groups Work Medicine System Theory Human Healthcare Organs Specialized Medicine, Anatomy Positivism Human tissues Histology Cells Cell Biology Molecules Biochemistry
Figure 2.1: Example of different science philosophies within the same research area This study is typically hermeneutic. It is founded on information gained from interviews. The calculations that still occur are not derived from a cause and effect chain. They are the result of conclusions drawn from figures delivered to us in the interviews, i.e. the source of information is still a human being. The problems related to hermeneutic studies are therefore important issues in the thesis, but since we have chosen a qualitative and not a statistical approach, these concerns are inevitable. This is developed further in chapter 2.5.1.
2.3.2. The Relationship between Existing Theory and Empiric Content9 Another important distinction is how a research treats theory and empiric studies. One usually separates between induction and deduction: Induction means that the scientist starts with gathering data about a topic. An analysis of the collected material leads to a formulation of a theory. This means that inductive research begins with empiric studies and ends up in a theory. Deduction is the opposite. Here the scientist starts out by forming a hypothesis from an existing theory. The hypothesis is then tested in an empirical study. Ideally, the theory forms a deductive system i.e. one theory is derived from another through logical reasoning and so on. In this case the results must be true if the premises are true10. This thesis is clearly inductive. We began with information gathering. Then we distilled and evaluated that information, before we finally, after an analysis, formed our theory.
2.3.3. The Research Method There are two main classes of research methods: Quantitative and qualitative methods. Quantitative studies draw conclusions from measurements of statistical data. Mathematical and statistical tools are therefore the instruments to transform given information into a final result. The quantitative study involves three phases and four steps. Se figure 2.211.
9 Wallén (2001), p 44f 10 Ahlström, Norbäck, Servin (2001), p 8 11 ibid, p 9
10
Hypothesis formulation
ResearchPlanning
Data Collection
AnalysingOf Data
Planning Phase Data Collecting Phase
Analysis Phase
Figure 2.2: The research when conducting a quantitative research study The strength of a quantitative analysis lies in the possibility to compare data, due to the high level of standardization. The main weakness is that the high level of standardization leads to low flexibility. Moreover is the distance to the source of information often great, which indicates a lower reliability of the information gathered. Qualitative studies are based on soft data, for example how people experience themselves, their existence and their environment. The research process of a qualitative study can not be split up into stages like a quantitative study. It should instead be looked upon more as an entity in a developmental process. The strength of a qualitative study lies in its proximity to the source. The scientist is given the possibility to modify the investigation structure during the research process, which allows the quantitative study a greater flexibility than the quantitative one. With a qualitative study, its strength also becomes its weakness. The flexibility affects the comparison possibilities, as the information from different respondents is influenced by the questions asked. This thesis is based mainly on qualitative research, since all information is gathered through interviews. Even if calculations occur frequently, the research could not be characterized as quantitative, since the data is often based on qualitative information.
2.4. Information Sources There are two main sources of information, secondary and primary data12:
2.4.1. Secondary Data Secondary data is already existing information, collected earlier by someone else than the scientist. Examples are literature, statistical material and previous studies.
2.4.2. Primary Data Primary data is data never used in any other study and must therefore be collected by the scientists themselves. This may be done in three ways:
• Direct observation • Interviews • Experiments
This study is mainly based on interviews. Interviews are categorized in personal interviews, telephone interviews and surveys. We have, almost exclusively, performed personal interviews. Telephone interviews have been used only to ask additional questions that were
12 Abnor, Bjerke (1994), p241
11
forgotten in the personal interviews. A survey was also conducted, but the information obtained, is not of much importance to the final result.
2.5. Statistical Credibility How reliable is the result of a study? To gain scientific credibility, the study must measure what it is supposed to measure. It must be free from systematic errors and the statistical decline should be random.
2.5.1. Validity One of the vectors of reliability is validity. Validity is separated into two aspects: internal and external validity13. Internal validity implies that the gauge measures the right thing, if the information is free from systematic errors. Is the information relevant for the problem? External validity focuses on if there is a correspondence between the respondents’ words and their actions. Are the interviewed persons speaking the real truth, their conceived truth or are they hiding the truth? The validity in our study is, as in most qualitative studies, not perfect. The information is based on interviews and since written documents confirming the words of the respondents seldom exist, we have no possibility to control the information. There might exist reasons for persons in top management to withhold the information and numbers of a failed project, but we do not believe that occasions of deliberate lies have existed. Our reasons for that belief are at least three:
• First, all revealing information provided for this thesis is handled confidentially and not exposed to anybody outside the office where we work.
• Secondly, we often interviewed two persons simultaneously. A lie would imply that both persons lied in collaboration, which is very unlikely.
• Third and most important, why would a company speak with us in the first place if the intention was to lie?
More probable is that the conceived truth of the respondents isn’t the objective truth. All information is of course affected by personal involvement, thus one must remember that the truth lies in the eyes of the beholder. We have however, little possibility to question the information given to us, and most respondents have also acted most trustworthy and open-minded. We believe that the data in our thesis is as close to the truth that one may possibly come and that the situations where we have been misled are spread randomly and are not repeated in a systematic, distorting way.
2.5.2. Reliability Reliability concerns whether the measurements are consistent, i.e. if the study can be replicated. If validity decides whether the research is free from systematic errors, reliability decides whether it is free from random errors. The study’s reliability is affected in several ways:
• What officials have been interviewed? Does a CIO give the same answers as a Head of Operations officer? Probably not. It is logical to assume that a CIO is more positive to ERP projects. Since the interviewees in this study come from different departments,
13 Ahlström, Norbäck, Servin (2001), p 13
12
reliability suffers. Though, often more than one official have been interviewed and the reliability is thereby strengthened.
• The ERP projects in this study don’t constitute a homogeneous group. Some are started quite recently, and some have been running for a while. This affects whether benefits have been realized. An older system is of course more probable to function properly and to have delivered benefits than a recently executed system.
• Situation dependency. Some companies are more in need of an ERP system than other. Therefore more improvements are made in those companies.
These aspects have one thing in common, they are all effects of our strive to make a broad study. If we had spoken to the same official in similar companies, all with ERP systems implemented say 1999, the reliability had been excellent, but the study hadn’t created any value. The intention is to create a model for how any company could put a price on an ERP system, not only some particular industry. The intention is also to gain a corporate overview of ERP effects. Therefore, different officials have been interviewed. We believe that even though the reliability suffers, our approach is the most suitable to reach our goals
2.5.3. Statistical Decline The statistical decline in this report is the companies we wished to speak with, but where our proposals were rejected. It is possible that there is a tendency that these companies belong to a certain category. Companies that have carried out a successful ERP project might have been more willing to speak with us than companies that have failed. This would have generated a great problem if this had been a statistical study, but since it is not, the study doesn’t suffer. Every company investigated in this thesis has been treated as a separate project. We do present a generalizing model for all companies and that model suggests that there are common features, but it doesn’t provide a universal result for all companies or ERP projects. For the model to work as an investment analysis aid, the characteristics of the company, in which the investment is supposed to take place, must be determined and inserted in the model. We are not providing a simple answer like “an ERP system is worth 5% of the annual revenue”. The statistical decline is of course a concern, but it doesn’t affect our result to a high degree.
2.6. Case Studies Case studies were undertaken in order to reach the goal and gain a deeper understanding of how organizations are reasoning regarding ERP systems. Since the topic is broad and different companies have differing views, we decided to focus mainly on larger producing companies in Sweden, with a minimum revenue around 5,000 MSEK (in the total business group), where only one ERP system was in use. This meant that in several cases we ended up evaluating the subsidiary to a larger Swedish conglomerate. To select companies for our case studies we put together a list of potential companies. The next stage was to subject this list to a number of screening stages in order to reach the appropriate target group. These stages will be described below:
1. Firstly we listed most Swedish companies with revenue over 5,000 MSEK. This gave us a list of over 70 companies in a variety of different industries.
2. Once that list was completed we decided to focus on more production oriented firms, why some pure service oriented companies were ruled out. We also highlighted companies that we thought would adequately fit the purpose of our thesis, and those
13
companies where we thought we could establish a good contact. When that list was completed we had about 60 potential firms to approach.
3. Our next significant step was to get a hold of the CFO of each of these companies, in order to establish a preliminary contact. This was carried out by telephone and by using this method we managed to get a hold of over 40 people we could contact.
4. As soon as the contacts accepted to participate in our study, we sent out a survey (see appendix 1) in order to obtain a better picture of the company. The survey was sent out to 35 companies in total.
5. As the surveys began to return we evaluated the answers and decided whether we should deepen our knowledge by requesting an interview with the company. As a total we received 20 answers. Not everyone was suitable for our study but we tried to ascertain the cases through which we had the best chance in obtaining interesting material through one or two interviews.
6. When selecting the potential cases we looked at several criteria. First of all it was important that the company at hand used one ERP system and that it had been installed relatively recently. Secondly, it was important that we felt the company’s commitment to help us, since our work depended largely on these interviews. Thirdly, it was important that we were able to meet with the right people at each company.
2.6.1. In-depth Interviews Since there are no right answers to our goal formulation we had to base our thesis on in-depth interviews and then digest and analyze the material in order to reach a conclusion. We therefore had to meet the right people at each interview in order to receive the required information. When selecting the cases with which we should work, we wanted to isolate a success and one definitive failure in order to set the higher and lower limits within all our cases would lie. We also strived to identify a broad spectrum of cases with regards to the following issues:
• Type of industry • Recent implementation vs. pioneer • Changing from a previous ERP system vs. buying an ERP system for the first time.
In addition to that we also wished to find a case were the company at hand was in the procedure of acquiring an ERP system in order to take part of their thought process. The case studies were based on one to three interviews with one or more of the following: The project manager, the IT manager, the head of the steer group, the director of finance, the CIO or the director of production. The questions asked were based on a four step approach which can be seen in appendix 2. Follow-up questions were realized by mail or by telephone in most cases.
2.6.2. Metrics of Potential Gains To make a quantitative analyze of each case we carried out a metrics of potential benefits. This was made by quantifying the benefits identified through the interviews. In doing so we used conservatism when going through all cost drivers throughout the value chain. Once the potential gains or savings were recognized we derived the annual benefit as well as the total benefit for each cost centre. The total cost calculated by using the net present value method and discounting with 10% for five years at the most. Then total benefits were summed up and compared to total costs, which were summed up by the same procedure and with the same lifetime and discount rate.
14
The Cost of Capital The reason for using the same discount rate for all companies was that since we looked at the same type of investment in all cases we chose to work with one cost of capital. The specific cost of capital was however differently internal assigned between the companies, but in order to compare the cases just, we decided to set a fixed rate, namely 10%. We also feel that the cost of capital is not the crucial factor in our thesis since it is so easy to adjust for every specific case if there is a need. Based on empiric findings in combination with expertise advisory, 10% was regarded as a reasonable cost of capital. The reader should however be aware that this number is company specific and also depends on the current economic situation. Lifespan We also decided to work with a lifespan of five years since that is the most common depreciation time for these types of investments. Furthermore, in a lot of cases the system may last for more than five years but then most benefits are overridden by increasing maintenance and support costs. Year zero was always the year the from which each company went live, even though in a lot of cases benefits were not realized until later on. Therefore benefits were only accounted for from the day they were recognized. In most cases there was a year of teething troubles after going live.
15
3. Theory In the following chapter some of the frameworks and theories that will be employed later in the thesis will be discussed and explained.
3.1. Value Chain14 The value chain from Porter’s perspective includes both the primary activities (inbound and outbound logistics, operations, marketing and sales and service) and the support activities (infrastructure, finance, human resources, technology and procurement). The goal of these activities is to create value that exceeds the cost of providing the product or service, thus generating a profit margin.
• Inbound logistics include the receiving, warehousing, and inventory control of input materials.
• Operations are the value-creating activities that transform the inputs into the final product.
• Outbound logistics are the activities required to get the finished product to the customer, including warehousing, order fulfillment, etc.
• Marketing & Sales are those activities associated with getting buyers to purchase the product, including channel selection, advertising, pricing, etc.
• Service activities are those that maintain and enhance the product's value including customer support, repair services, etc.
Any or all of these primary activities may be vital in developing a competitive advantage.
ServiceMkt/Sales
Outbound Logistics
OperationsInbound Logistics
Primary Activities
Support
Finance
Procurement
Technology
Human Resources
Infrastructure
Figure 3.1: Porter’s Value Chain
The purpose of the value chain is to identify and separate the value driving sources in the company in order to determine where improvements and savings can be made, thus it is can be used for exploring and evaluating the benefits of ERP systems.
14 Porter, M.E., (1998), p 103
16
3.2. Change Management “Change is the law of life. And those who look only to the past or the present are certain to miss the future” John F. Kennedy The most important issue of change management is the change problem, namely, the future state to be realized, the current state to be left behind, and some structured, organized process for getting from one state to another. Change problems may be large or small in scope and scale. They may focus on individuals or groups, on one or more divisions or departments, the entire organization, or on one or more aspects of the organization’s environment.
There are several definitions regarding change management, but we decided to work with the following two:
1. A body of knowledge15 Originating from the view of change management as an area of professional practice, there arises yet another definition of change management: The content or subject matter of change management. This consists chiefly of the models, methods and techniques, tools, skills, and other forms of knowledge that go into making up any practice. The content or subject matter of change management is drawn from psychology, sociology, business administration, economics, industrial engineering, systems engineering, and the study of human and organizational behavior.
2. The task of managing change16
The second definition of change management refers to inducing change in a planned, managed and systematic way. The main objective is to implement new methods and new systems in an ongoing organization in a more effective manner. Changes might have been triggered by events originating from internal or external factors. Thus, the second facet of managing change, is responding to changes over which the organization exercises little or no control.
3.2.1. The ADKAR Model17
A host of theories and models flourish in the world of change management. However, no matter what theory or model one subscribes to, there are three universal “angles” from which to approach change strategy.
• From the organizational process side, • from the personal behavior side, • or from the interaction between organizational and personal18.
We have decided to look at the ADKAR model which integrates the first two of these angles and deals with the third. It was developed to help employees identify their standings in the change process as well as providing a tool for helping managers identify gaps in change management processes and to provide feedback and guidance to change affected employees.
The ADKAR model is used primarily to: 1. Diagnose employee resistance 2. Help employees transition from the current state to the changed state 3. Create a successful action plan for personal and professional advancement during the
period of change. 4. Develop a change management plan for your employees
To use the ADKAR model effectively, it is necessary to understand the underlying framework behind change initiatives. As the diagram below illustrates, change happens on two dimensions: the business dimension (vertical axis) and the human dimension (horizontal axis). Successful change happens when both dimensions of change occur simultaneously.
Post-Implementation
Implementation
Concept and Design
Business Need
Awareness Desire Knowledge Ability Reinforcement
SuccessfulChange
Phas
es o
f a ch
ange
proje
ct
Phases of change for employees
Figure 3.2: The ADKAR model
The Business Dimension Business Need – Identify a business need or opportunity Concept and Design – The change “project” is defined. This includes scope, objectives, and timelines. It also defines new processes, systems, or organizational structures. Implementation – Solutions are implemented Post-Implementation – Evaluate the current change process and assess areas for improvement for future change efforts. The People Dimension Awareness – Organizations communicate the need for change Desire – Employees want to participate in and support the change Knowledge – Employees understand the vision driving the change and how the change will take place. Ability – Employees comply with the changes; they are able to implement the change into their work. Reinforcement – Reward and discipline practices support changed behavior
18
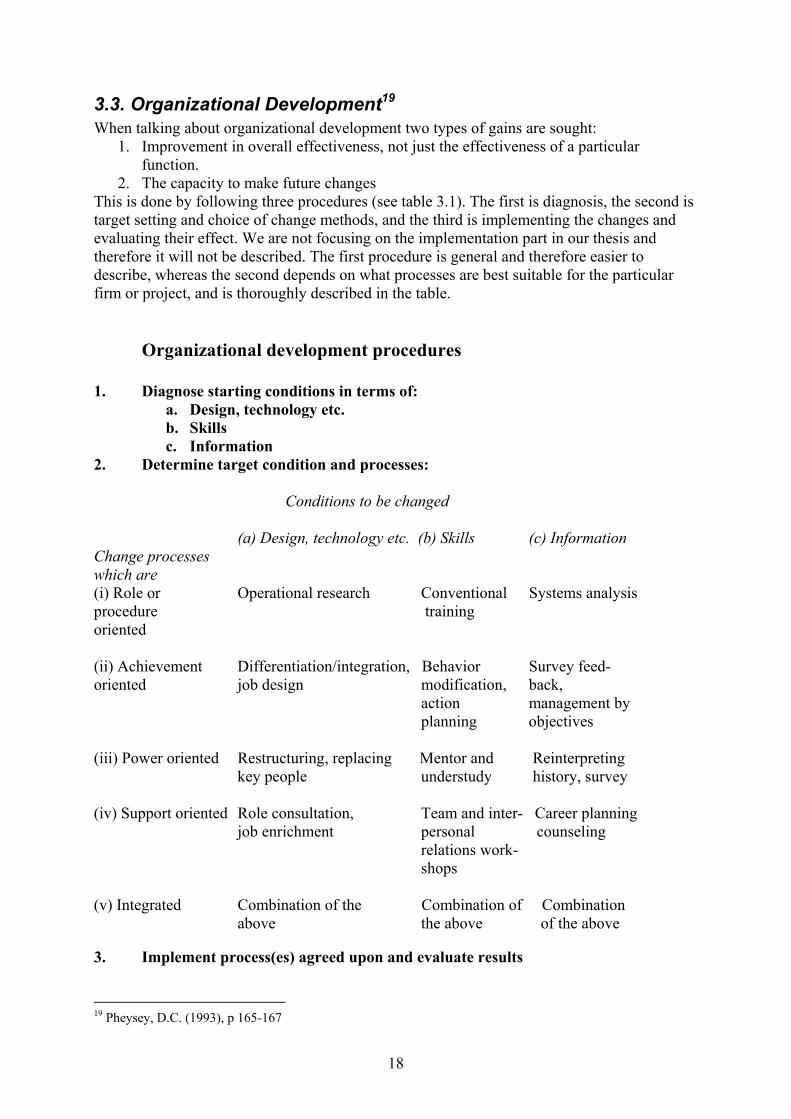
3.3. Organizational Development19 When talking about organizational development two types of gains are sought:
1. Improvement in overall effectiveness, not just the effectiveness of a particular function.
2. The capacity to make future changes This is done by following three procedures (see table 3.1). The first is diagnosis, the second is target setting and choice of change methods, and the third is implementing the changes and evaluating their effect. We are not focusing on the implementation part in our thesis and therefore it will not be described. The first procedure is general and therefore easier to describe, whereas the second depends on what processes are best suitable for the particular firm or project, and is thoroughly described in the table. Organizational development procedures 1. Diagnose starting conditions in terms of:
a. Design, technology etc. b. Skills c. Information
2. Determine target condition and processes:
Conditions to be changed (a) Design, technology etc. (b) Skills (c) Information Change processes which are (i) Role or Operational research Conventional Systems analysis procedure training oriented (ii) Achievement Differentiation/integration, Behavior Survey feed- oriented job design modification, back,
action management by planning objectives
(iii) Power oriented Restructuring, replacing Mentor and Reinterpreting key people understudy history, survey (iv) Support oriented Role consultation, Team and inter- Career planning job enrichment personal counseling relations work- shops (v) Integrated Combination of the Combination of Combination above the above of the above
3. Implement process(es) agreed upon and evaluate results
19 Pheysey, D.C. (1993), p 165-167
19
3.3.1. Diagnosing the Starting Conditions First one must define what currently is unsatisfactory, or likely to be so if nothing is changed, and to determine the starting conditions of all areas that will be affected. Change will be easier if it is in accordance with commonly accepted values, i.e. if the time is right, if circumstances are favorable and if the yield in terms of benefits is calculable and obvious. Resistance will be less if people experience acceptance and support. At times in-house or external consultants are asked to help at this stage.
3.4. Resistance to Change20 Resistance to change is not only caused by culture clashes. Marlow chartered a number of change efforts, using a diagramming method. The x-axis shows time and the y-axis the levels in an organization’s hierarchy that are involved. Symbols are used to represent the type of activity that currently running and whether it is “official” or “unofficial”. The conclusion is that the intensity and extensiveness of activity and of resistance varies over time.
• First there is a slow and sporadic start-up during which resistance is primarily directed towards testing out the role of any “consultant” employed. This may last for as long as six months. It’s the equivalent of Tuckman’s “forming” stage in a group.
• Resistance during the next stage may be more intense and hostile. Some people may refuse to shoulder responsibility.
• Finally, as a secondary culture moves into the dominant place, people become afraid of the possible consequences of what seem to be irreversible change.
The principle asserts that the timing and sequence of intervention techniques must allow for the dynamics of resistance.
3.5. Three Perspectives There has recently been a new theory developed about three perspectives on expectations and changes when implementing information systems. These perspectives have been formulated to better understand the reasons for unexpected and unplanned consequences. Usually when implementing and evaluating implementations, focus is drawn on the planning perspective; planning, risk analysis and follow-up. This perspective tends to often overlook different expectations on changes that might throw the project plans overboard, mislead the training and neglect the different stakeholders’ significance.21 The three perspectives are about regarding the process from three starting points, in order to reach a better understanding of unexpected changes and deviations that occur in connection with implementation and usage of significant systems that involve a lot of people. The perspectives are the following:
• The planning-traditional-perspective, which focus on activities within the circumstances of the plan; follow-up of the plan, deviations from the plan, how the plan can be improved and key success factors in successful projects22.
• The structural perspective looks at the individual as a part in a social context of sense creation, domination and authorization. This perspective brings forward how participants’ different conceptions about the organization’s activity changes. It also
20 Ibid, p 171 21 Gäre, K. (2003) p 12 ff 22 Ibid p 199 ff
20
focuses on how their own role in the big picture, develops actions and consequences that often are different from those in the project plan23.
• The participant network perspective focuses on the interactions between participants in the network. Participants are not only people but also human creations as business systems. The central issue is the participants’ driving forces and how they adopt and try to adopt others to networks24.
3.6. What is ERP? In Enterprise Resource Planning system is a packaged business software system that enables a company to manage the efficient and effective use of its resources. Among the most important ERP attributes are the ability to:
• Automate and integrate the majority of an organization’s business processes • Share common data and practices across the entire enterprise • Produce and access information in a real-time environment
3.6.1. The Five Major Reasons25 There are five major reasons why companies undertake ERP. Those are: • Integrate financial information – In a lot of companies different systems are used in
different departments. Different business units may each have their own version of how much they contributed to revenues. ERP creates a single version of the truth that cannot be questioned because everyone is using the same system.
• Integrate customer order information – ERP systems can become the place where the customer order lives from the time a sales representative receives it, until the merchandise is shipped and finance sends an invoice. By having this information in one software system, rather than spread out among many different systems that can’t communicate with one another, companies can keep track of orders more easily, and coordinate production, inventory and shipping among many different locations at the same time.
• Standardize and speed up manufacturing processes – Manufacturing companies, especially those with a desire for mergers and acquisitions, often find that multiple business units across the company make the same widget using different methods and computer systems. ERP systems come with standard methods for automating some of the steps of a manufacturing process. Standardizing those processes and using a single, integrated computer system can save time, increase productivity and reduce head count.
• Reduce inventory – ERP helps the manufacturing process flow more smoothly, and it improves the transparency of the order fulfillment process inside the company. That can lead to reduced inventories of the components used to make products (work-in-progress inventory), and it can help users better plan deliveries to customers, reducing the finished good inventory at the warehouses and shipping docks.
• Standardize HR information – Since we have decided not include the HR aspect in our thesis, we feel that it is irrelevant to explain this part.
23 Ibid p 140 ff 24 Ibid p 251 ff 25 http://www.cio.com/research/erp/edit/erpbasics.html 2003-08-06
21
3.6.2. History26 ERP is not something new. The ERP systems we see today became a popular tool in businesses worldwide in the beginning of the nineties, but the idea origins as far back as to the fifties. The evolution has developed step by step, from very simple inventory control systems to the enterprise integrating real-time colossuses of today. A brief history of the decades passed is presented below: Early 1950s Inventory control systems that were designed to track stock levels and their locations became popular. These were the first technological business applications that grew outside the finance and accounting areas. 1950s-1960s MRP (Materials Requirements Planning) was developed to help companies plan their material purchases. Though, MRP systems ran on expensive mainframe computers, making them difficult to manage and expensive to maintain. 1970s-1980s The systems continued to focus on the manufacturing industry and developed into MRP II (Manufacturing Resource Planning). The financial systems were integrated and the system started to appear more as a closed-loop planning tool. Mid 1980s Two breakthroughs changed the situation dramatically: The introduction of Lean Production and Just-in-Time delivery revolutionized the manufacturing industry and the falling price of computers dramatically increased the potential markets for automated systems. The popularity of the MRP II systems escalated in a non-diminishing rate and the business system industry flourished and expanded. Late 1980s-1990s With the development of client-server technology, the boundaries of MRP II expanded to include other essential routines, especially human and capital resources. The conception ERP was born. Late 1990s ERP had become the common technological support system in business across all industry sectors, manufacturing as well as services. Complementary systems, such as Customer Relations Management and Supply Chain management, were added and extended the company’s visibility up and down the value chain. The future The value chain extensions of the ERP systems will continue through increased usage of eBusiness and Internet applications. Strategy will be another area where the human brain loses its sovereignty.
26 Deloitte Consulting (1999), p 5
22
3.7. Previous Research Studies – Deloitte Consulting Report In 1999 Deloitte Consulting presented an extensive research study about the anticipated and the realized benefits of ERP systems. The study consisted of 230 interviews with 85 global companies operating in different industries both in North America and in Europe. 85% of the companies had annual revenue between 1-50 BUSD.
3.7.1. Summary The report has two major topics of interest:
• How do realized benefits correlate to the anticipated benefits? • How long time after going live are benefits usually realized?
The answer is that future benefits often are overestimated. This is especially the case with soft, or intangible, benefits. Many companies also have great problems in realizing the benefits. The median stabilization time is six to twelve months, but many companies are much later than so in realizing the benefits of the ERP system.
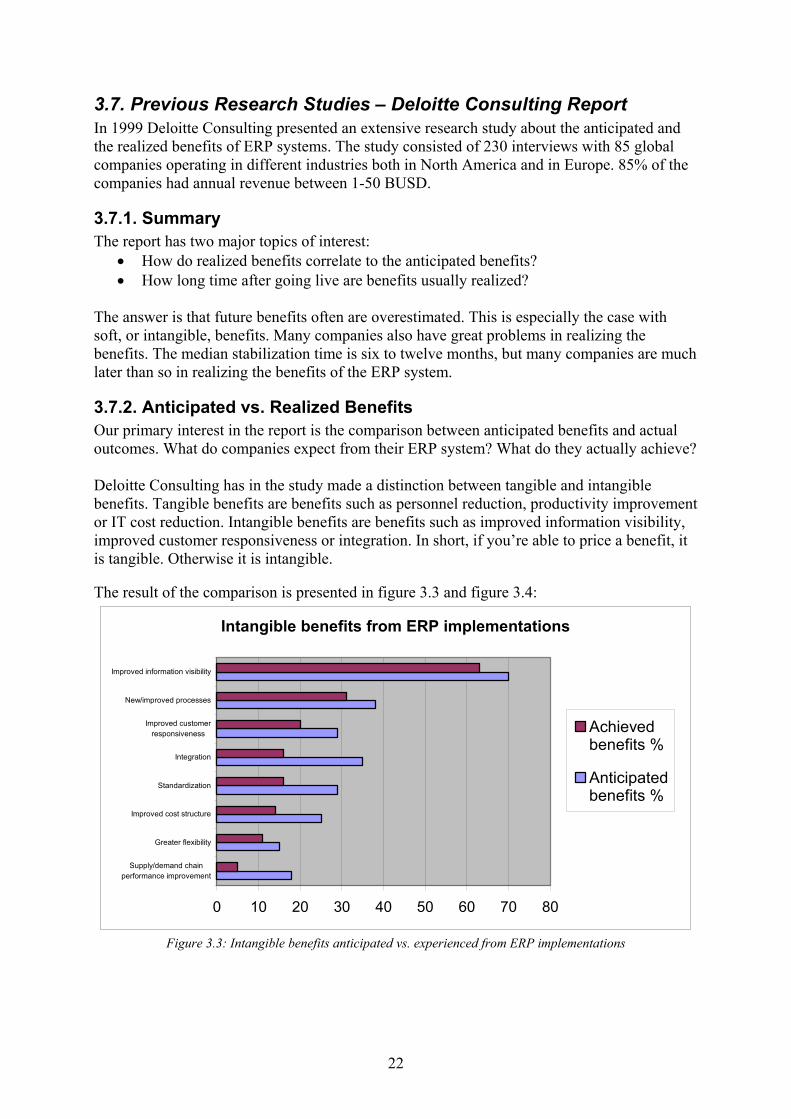
3.7.2. Anticipated vs. Realized Benefits Our primary interest in the report is the comparison between anticipated benefits and actual outcomes. What do companies expect from their ERP system? What do they actually achieve? Deloitte Consulting has in the study made a distinction between tangible and intangible benefits. Tangible benefits are benefits such as personnel reduction, productivity improvement or IT cost reduction. Intangible benefits are benefits such as improved information visibility, improved customer responsiveness or integration. In short, if you’re able to price a benefit, it is tangible. Otherwise it is intangible.
The result of the comparison is presented in figure 3.3 and figure 3.4:
Intangible benefits from ERP implementations
0 10 20 30 40 50 60 70 80
Supply/demand chainperformance improvement
Greater flexibility
Improved cost structure
Standardization
Integration
Improved customerresponsiveness
New/improved processes
Improved information visibility
Achievedbenefits %
Anticipatedbenefits %
Figure 3.3: Intangible benefits anticipated vs. experienced from ERP implementations
23
Tangible benefits from ERP implementations
0 10 20 30 40 50
On-time delivery improvement
Transportation/logistics cost reduction
Maintenance cost reduction
Cash management improvement
Revenue/profit enhancement
IT cost reduction
Procurement cost reduction
Order management/cycle time improvement
Faster financial close cycle
Productivity improvement
Inventory reduction
Personnel reduction
% ofrespondentswith benefitsachieved
% ofrespondentswith benefitsanticipated
Figure 3.4: Tangible benefits anticipated vs. experienced from ERP implementations Many observations and conclusions may be made from these figures, but most noticeable is that in most cases, achieved benefits don’t match what has been anticipated. This is especially evident among the intangible benefits, which are seemingly overrated in ERP prognoses. The entry among the tangible benefits where respondents are most dissatisfied is IT cost reduction. Companies seem to have expectations that a new integrated system reduces IT costs due to a more centralized IT environment. This is obviously often not the case. Two benefits, both tangible, stands out in the opposite direction: Productivity improvement and faster financial close cycles are clearly aspects that are underestimated in the investment analyses.
3.7.3. A Time Schedule Another aspect of interest is when the benefits are realized. It matters a lot in the investment analysis if the system is expected to work satisfactory directly after going live or after one or two years. The reasons are two:
• If a system is expected to be profitable for five years (which is our assumption) it matters a lot if the first year is accounted for or not
• The first year is the most important year to achieve a positive effect, if you intend to use a discounted cash flow approach
An example of the effect of a one-year benefit delay is that if we account for five years of profitability and use a 10% discount rate, annual benefits then have to be more than 30% higher to achieve the same net project cash flow. In the Deloitte Consulting study, one question is when the benefits are realized. The result is presented in figure 3.5:
24
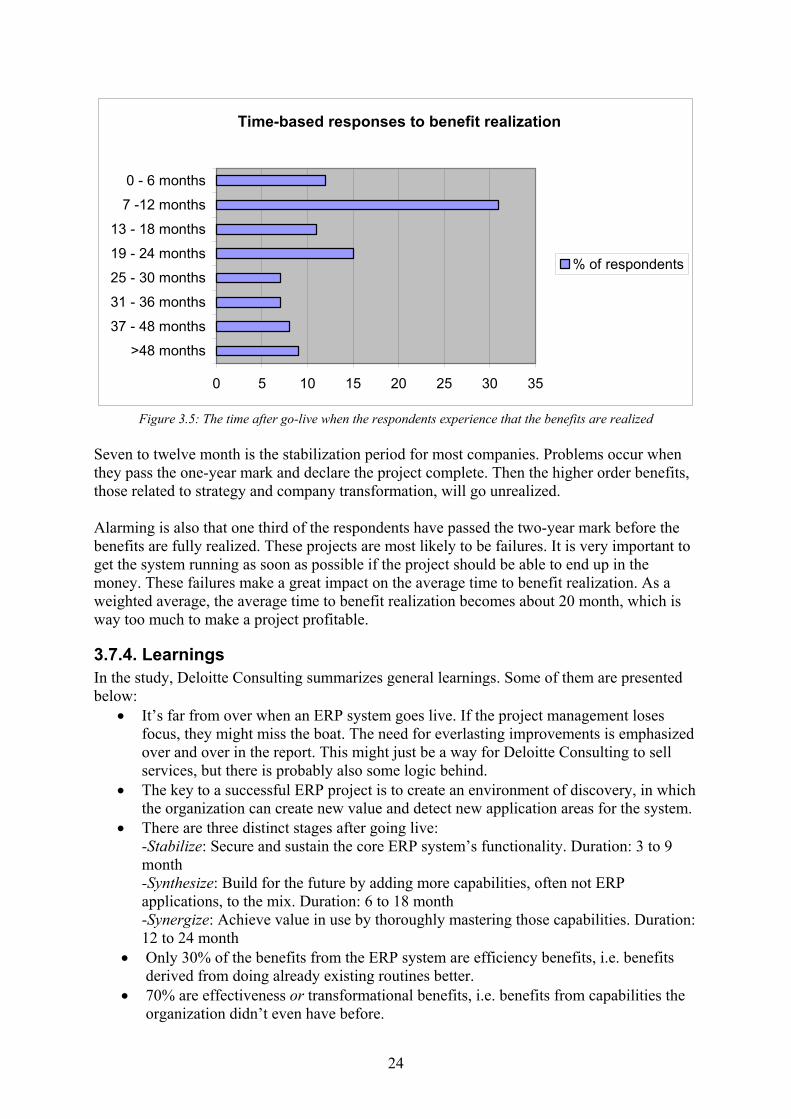
Time-based responses to benefit realization
0 5 10 15 20 25 30 35
>48 months
37 - 48 months
31 - 36 months
25 - 30 months
19 - 24 months
13 - 18 months
7 -12 months
0 - 6 months
% of respondents
Figure 3.5: The time after go-live when the respondents experience that the benefits are realized Seven to twelve month is the stabilization period for most companies. Problems occur when they pass the one-year mark and declare the project complete. Then the higher order benefits, those related to strategy and company transformation, will go unrealized. Alarming is also that one third of the respondents have passed the two-year mark before the benefits are fully realized. These projects are most likely to be failures. It is very important to get the system running as soon as possible if the project should be able to end up in the money. These failures make a great impact on the average time to benefit realization. As a weighted average, the average time to benefit realization becomes about 20 month, which is way too much to make a project profitable.
3.7.4. Learnings In the study, Deloitte Consulting summarizes general learnings. Some of them are presented below:
• It’s far from over when an ERP system goes live. If the project management loses focus, they might miss the boat. The need for everlasting improvements is emphasized over and over in the report. This might just be a way for Deloitte Consulting to sell services, but there is probably also some logic behind.
• The key to a successful ERP project is to create an environment of discovery, in which the organization can create new value and detect new application areas for the system.
• There are three distinct stages after going live: -Stabilize: Secure and sustain the core ERP system’s functionality. Duration: 3 to 9 month -Synthesize: Build for the future by adding more capabilities, often not ERP applications, to the mix. Duration: 6 to 18 month -Synergize: Achieve value in use by thoroughly mastering those capabilities. Duration: 12 to 24 month
• Only 30% of the benefits from the ERP system are efficiency benefits, i.e. benefits derived from doing already existing routines better.
• 70% are effectiveness or transformational benefits, i.e. benefits from capabilities the organization didn’t even have before.
25
• Companies should anticipate a temporary performance dip after going live. • Be prepared for that issues and obstacles show a dramatic shift in emphasis after
going live. The issues of increasing importance are those concerning the system’s teething troubles and the initial dip in process performance. Less focus is laid on planning and strategy.
3.7.5. Conclusions Overall, the expectations on the ERP systems, especially on the intangible benefits, seem to exceed the outcomes. Therefore, if a company doesn’t have any particular reason to believe that they would be able to make a better prognosis than other companies, they should account for this drawback. The implication is that if an ERP investment doesn’t end up in the money in the preparation analysis, it is likely to be even more disadvantageous when executed. Therefore, an investment analysis with black figures becomes even more important. Many companies have great trouble in establishing stability in the ERP system and to realize the benefits within it. Important is to follow the three stages stabilize, synthesize and synergize, to start with mastering the basic functionalities of the system before trying to achieve any miracles.
26
Part II – Analysis, Conclusion & References The second part of the study consists of the case summary, analysis and the conclusion. In the analysis the quantitative and qualitative findings from the cases are summed up together with the theories. The conclusion then summarizes our findings and presents a solution to the problem description.
Part ΙΙ
6-7. Model& Conclusion6-7. Model
& Conclusion
5. Analysis5. Analysis
4. Case StudiesSummary
4. Case StudiesSummary
8. References8. References
27
4. Case Studies Summary Here all the summaries from the cases are presented in order to give the reader a picture of every case. The cases are presented in full versions after the references.
4.1. Company A Company A implemented their first ERP system in 1984. Since then they have made a major upgrade in 1994 and after that they have developed the system in-house. The major benefits have been large rationalizations by both white and blue collars, as well as lower capital tied up in production and finished goods and more efficient invoicing. This has led to a successful and profitable investment due to out of the box solutions and openness to changes. When looking at the figures, Company A had 23.8 MSEK in costs compared to at least 64 MSEK in benefits without accounting for the major rationalizations.
4.2. Company B At a first glance Company B is the typical ERP case, with Y2K as the main reason for implementing a new system and without any greater expectations. But when examining the outcome more systematically there have been rather significant benefits. Just looking at the accrued benefits compared to the costs the investment has a 50% pay off. On top of that they have the potential to integrate the system in more subsidiaries to a cost of around 1% of the original cost. The reason for this success is that they have both deliberately and unconsciously adopted the organization to fit the system and therefore the new system has become somewhat of a strategic tool.
4.3. Company C Company C’s ERP project seems to end up in success. The costs are projected to 62 MSEK and the anticipated benefits are 87 MSEK. The main reasons are coordination efficiencies gained from common operations. Better finance control also makes a great influence. 50% of the benefits are gained from lower purchase prices and faster invoicing. Company C’s attitude towards the ERP project is very healthy. It is not at all considered a necessary evil but instead as an investment like any other, with demands on ROI. The preparation work has been extensive and thorough, creating a well-planned and well-organized project. The investment analysis is so detailed that it may be used as a role model for how an ERP investment analysis should be constructed.
4.4. Company D When Company D acquired five large subsidiaries from a Danish conglomerate, located in four different Nordic countries and with total revenue of 1,300 MSEK, they had to make a decision. It was whether to keep the old ERP system that had been developed internally and that came with a high annual cost (15 MSEK), or to buy and implement a new ERP system. They decided on a new system and bought IFS Applications. Once the decision was taken, they only had nine months to get the project onboard. Even though some misjudgments were made, the project as a whole became successful and had a return of 200%. Costs added up to
28
50.5 MSEK while benefits and alternative costs savings added up to around 100 MSEK in total.
4.5. Company E When Company E became an independent company in the late nineties, they had four years to build up their own IT system. This project began in the beginning of 2001, with the decision to implement SAP R/3. The project ran smoothly until they made a major acquisition in June 2001, which doubled the size of Company E in terms of revenue and employees. The acquisition made an already tight time-line even tighter. By using 120 consultants and dedicating 60 full time employees they managed to reach the goal line in time, but this came with a huge cost of 350 MSEK and 100,000 man-hours. In addition, the system’s running cost is almost 90 MSEK annually, which raises the total project cost to 670 MSEK. Benefits have been incurred but not enough to justify the costs. When talking to the company they feel that the project was successful, but our findings indicate that the cost control got out of hand and that is also confirmed when benchmarking the total cost to net sales, which for Company E was 15%.
4.6. Company F With the Y2K problems approaching fast, Company F implemented Oracle in 1998/1999. The system however, turned out to be too big and too complex for their production needs. The project also suffered from weak management support and the tailor-making became far too extensive, making the system even more complicated to work with. Some benefits have of course been realized, but those could have happened with any ERP system of decent size and complexity. Company F over-dimensioned the IT project and in retrospect it is easy to realize that a simpler system had done the task as well, but to a lower cost.
4.7. Company G In 1999, just before the millennium shift, Company G implemented SAP R/3 for the markets in Sweden, Finland, Norway and the Baltic States. The main ambition was to manage the Y2K bug. Profitability therefore became of subordinate importance and the project became very costly. Though, all goals have been fulfilled and other unanticipated benefits have also appeared. Therefore, even though the project didn’t finish in the money, it was no failure. The uncertainty about the magnitude of the millennium bug made the decision to buy a new business system unavoidable. We rate the project neither as a success nor a failure, but somewhere in between.
4.8. Company H In May 2001 when a global ERP strategy was formulated by top management in Company H’s parent company, the distribution subsidiary Company H was pretty much forced to take on the pilot. This became a total failure with much higher costs than anticipated and very few
29
benefits. They did not even get to buy the system they preferred. The conclusion is that Company H’s parent company made some crucial mistakes when pushing Company H to take on the project. The most evident is that it did not make any sense for the distribution company to act as a pilot, since they operated completely independent from the rest of the group. Once the decision was taken, Company H also made several mistakes, which made the project expensive and time consuming.
30
5. Analysis
5.1. Benefits When analyzing and comparing ERP projects in different companies, one must understand that the benefits gained are totally dependent on the situation. There is no generalizing formula for how much a company will achieve from an ERP system. All investments must be analyzed independently. What is possible, however, is to identify the most common areas within organizations, where benefits can be realized. Our approach is to identify specific entries within the different steps in the value chain, and explain how and why ERP systems can make a difference and create value. We state that ERP projects should be subdivided into two categories, depending on a major difference:
1. An ERP system already exists in the organization and the purchase of a new system is only an upgrade of the previous one.
2. The current IT environment consists of separate islands and the ERP system would thereby be the first integrating business system in the corporation
ERP ERP
BenefitsAlternative
cost+
Total project value
=
ERP
BenefitsAlternative
cost+
=Total project value
Figure 5.1: The two ERP categories
If an ERP system already exists, new benefits from implementing a new system are hard to find and will definitely not motivate an investment. It can be compared to when Microsoft issues a new version of Windows or Office. There are new features but most crucial tasks could be done also in the old version. Therefore, if an ERP system already exists in the company, the investment analysis must be based mainly on alternative costs. Questions like “what costs exists with the present system and how could they be lowered with a new?” and “how do we value the risk of system breakdown in the present system?” should be asked. In addition to these alternative costs, benefits gained from new abilities should be calculated. It is however important to remember that if there already exists an ERP system in a company,
31
the investment of a new ERP system can seldom be motivated by only summarizing benefits and improvements with the new one. If no ERP system exists, the situation is completely different. Then benefits and efficiencies can add up to a lot of value. Alternative costs exist also in this case and should be accounted for, but the main emphasis in the investment analysis should be on the potential benefits and efficiencies. The focus in this thesis is to identify those benefits and efficiencies. The only alternative costs taken in consideration are license, support and administrative expenditures related to running the old system. Risk of breakdown has for example not been accounted for. Below follows a list of the most important benefits gained from ERP systems. We point out that each company must themselves estimate what impact the benefits would have on their organization. We present a list of the most common major factors, but to generalize quantities is often not possible since every company have different needs of improvement. The benefits are categorized from where in the value chain they belong.
5.1.1. Purchases Lower Purchase Prices Purchase prices may be reduced of three reasons: Mainly, an ERP system facilitates the comparison of supplier prices. Second, improved production planning due to the ERP system strengthens the negotiation power with suppliers. Third, integrated purchases result in larger quantities, which benefit supplier negotiations. The effect is only a few percent of the total price but since purchases normally is a heavy entry, the impact could nevertheless be substantial. Though, the possibilities to reduce purchase prices are highly dependent on the industry in which the company operates. In some industries, where raw material consists mainly of bulk metal or other market traded resources, it is not possible to lower purchase prices. If a raw material is traded publicly, for example on the London Metals Exchange, the price is set by the market and fixed and that’s something an ERP system cannot change. Integrated Purchase Departments In many major companies, each subsidiary runs its own purchase department and sometimes each production plant within the subsidiaries handles purchases separately. Integrating local purchase departments into one large and integrated purchase organization rationalizes personnel and could, as mentioned above, lower purchase prices. Reduced Personnel Personnel reductions could be accomplished mainly from structural changes in the purchase organization, but also from less manual routines.
5.1.2. Inventories Inbound Inventories Improved production planning implies less stock level fluctuations, which leads opportunities to lower inventory levels. Among the respondents in this study that had experienced reduced inbound inventory levels, a 10-20% reduction was the normal improvement.
32
Outbound inventories Most of the companies in this study don’t have a large amount of capital tied up in outbound inventories since their production mainly is run against order. However, in those industries where Just-in-Time production isn’t possible, improvements can be made. A better sales planning ability due to an ERP system then reduces the requirement for outbound inventories. Distribution costs Most companies have outsourced transportations, but if it is an in-house competence, there is money to save. Integrated purchase and sales departments bring economies of scale to the distribution system and lower the costs. Inventory Takings An ERP system brings order and control to the storage rooms. It is therefore not necessary to take inventories as often as if all routines are manual. Usually, this is a small cost for the companies, but a reduction of inventory takings up to 75-90% is nevertheless possible. Reduced Personnel Lower stock levels and fewer inventory takings can make it possible to rationalize personnel. A reduction of personnel equivalent to the reduction in inventories seems like a fair estimation.
5.1.3. Production Shortened production cycle time A shortened production cycle time, and thereby less capital tied up in production, is experienced by most companies in this study. The efficiency is an effect of improved production management instruments providing better resource utilization. Usually, they couldn’t give any figures for how much the cycle time had been reduced, but in the two cases where figures were given, 50% was the claimed improvement. This seems to be a lot and is probably not normal, but it is noticeable that such a great efficiency improvement is possible. Enhanced workforce productivity Workforce productivity is experienced by some of the companies in the case studies, namely those companies involved in industrial manufacturing. The quantity varies a lot but it is not surprising that production efficiencies, such as shortened production cycle time, also has an effect on workforce productivity. More efficient capacity utilization Capacity utilization refers to the efficient use of machinery and other fixed costs within production. This is an entry very connected to cycle time improvement. It is the improved production management instruments that enable both shorter cycle time and more efficient capacity utilization. Gains in capacity utilization render the possibility to reduce capital tied up in the machinery park and other fixed costs, per unit of finished products. Less warranty and scrap costs Improved production routines may also result in quality improvements and scrap cost avoidance. Delivery time accuracy Another effect of improved production routines is better delivery time accuracy. The on-time delivery rate has been improved in most companies in our study, in some cases radically. An
33
ERP system seems to be able to make it possible for companies to reach 95% delivery time accuracy. It is difficult though to price a higher on-time delivery rate, but logically it should lead to better customer relations and increased sales. Reduced personnel Enhanced workforce productivity and more efficient capacity utilization both imply opportunities to rationalize personnel. The magnitude is dependent of how much of the improvements in production efficiency that is used to increase production and how much that is used to rationalize the existing production.
5.1.4. Sales Increased Sales Most companies in our cases have experienced increased sales due to the ERP system. The main reason is improved CRM, i.e. information of existing customer’s buying patters. This leads mainly to increased after-market sales but also to a higher frequency of returning customers. Moreover, a higher on-time delivery rate ought to develop customer satisfaction and bring more customers back to the company. Integrated sales departments Sales departments are, just as purchase departments, run locally and not integrated within the corporation. A rationalization of the sales organization has positive effects on distribution costs and most important personnel costs. The effect on CRM depends on the customer structure. If the customers mainly consist of small local companies, the customer relations will suffer from integration. If, however, customers are large multinational corporations that are shared by many local subsidiaries, integration would substantially improve customer profiles and information. Some companies also experience a better control of the sales organization, which previously had lived its own life with bad connection to the mother company. Reduced personnel A rationalization of the sales organization leads to opportunities to reduce personnel. Though, an ERP system requires a lot more effort on incoming data quality. A mistyping leads to consequences all across the organization. It is often the sales departments that are responsible for the typing data into the system, which increases the personnel need. It is therefore hard to determine the personnel effect in the sales organization, but if no rationalizations of the organizational structure are made, the sales departments will probably need to hire more personnel.
5.1.5. Administration Faster invoicing One major feature of ERP systems is that they eliminate the time delay between delivering the order and sending the invoice. The date of invoice is set to the same as the delivery date. In many companies with manual routines there is a time delay up to a week. The annual effect of an elimination of this delay is the value of the capital cost on the entire revenue for the time interval gained. For example, if a company earlier had a five-day delay, a capital cost of 10% and revenue of 10,000 MSEK, the effect is 10,000*5/250*10%, i.e. 20 MSEK annually. Faster and easier financial statements A direct effect of an integrated business system is that accounting figures from all subsidiaries are easily collected and summarized. The time needed for making financial statements, which
34
often is made every month, is dramatically shortened, in many cases from about 15 days to less than a week. Transparency All companies in our study have experienced an increased information supply and also improved information quality. The transparency across the organization is enhanced, creating clearness and making cross-references a lot easier. Availability of information and information quality is, according to survey studies, the most appreciated feature of ERP systems. Reduced personnel Most companies experience a reduction of personnel in administration. Rationalizations of about 10-20% seem to be normal. These are taken from accounting, due to less data migration from other systems, from invoicing, which now is an automatic routine, and from overhead administration such as stamps and paperwork matters.
5.1.6. IS/IT License and support costs The license and support costs for running the previous business systems within the organization are saved when buying a new ERP system. These are of course exchanged for new licenses and support deals for the new system, but the alternative costs for running the previous systems must nevertheless be remembered in the investment analysis. Reduced personnel Many companies expect to cut down on IT personnel when implementing a new ERP system. They believe that exchanging many different systems for one lessens the requirements of software maintenance. What they forget is that the new system is larger than all the other systems were together and what usually happens is that IT costs rise, not fall. According to surveys, this is the greatest disappointment regarding ERP system performance.
5.2. Costs The costs of an ERP project could be subdivided into the following:
In this chapter, the costs in the case studies are analyzed in order to find common features. The different projects are treated equally and size is not taken in consideration. Hence, all figures are presented as a percentage of the total cost and not as absolute numbers.
5.2.1. The Underestimation of Costs A common denominator in all case studies is that the final cost always is underestimated. The magnitude of the miscalculation varies, but the actual cost seems to end up about 150%-300% of what had been projected. This is not surprisingly at all. Everyone in the business is well aware of the situation, but it is nevertheless remarkable. How does one explain that the ERP
35
suppliers over and over again, most certainly deliberately, present serious price underestimates to the potential buyers, and how come that the buyers never learn their lesson? It is not the software that suddenly is three times more expensive. The price of the software is more or less set when the requirement specification is made and agreed upon. There may become smaller adjustments due to more user licenses or other uncertainties, but generally the price is fixed. It is during the implementation that costs run wild. This is where projects collapse and costs skyrocket. The implementation should however not be considered as one process but as smaller components that together make up an entity. The greatest misjudgments often occur in the following areas:
• Software adjustment costs: Companies are apparently not aware of that adjustments in the software often are the greatest cost driver in an ERP project, and the suppliers keep quiet. It is far cheaper to adjust the organization to the system than the other way around. If a company really needs to add tools to their system, if their core competence relies on specific routines not supported by the system, they must at least be aware of the adjustments cost and include them in the budget. Alternatively, choose a system that supports those routines.
• Another great cost driver often unknown to companies is the cost of data migration. Consultant agencies often recommend automatic data migration with the help of a computer program set up by their consultants, and companies often rely on their advisory. However, an easier method is to manually transfer all data from the old system to the new. This method simplifies the estimation of the total migration price as well as the establishment of a correct timeline. The manual method doesn’t apply to all projects, but companies should at least be aware that alternatives to expensive computer programs exist.
• Not to forget is the cost of user education. This is the most common cost driver that companies cut down on when they notice that implementation costs are reaching the stars. Instead, here is where companies should put more effort and free more funds. Education is often neglected, but to what use is a system that the employees don’t understand!
• Consultant travel and expenses: This is often regarded as something inevitable and is motivated by the high hourly rate for the consultants. This is true, but there is an option when selecting consultant agency in the first place. Choosing an agency with representatives close to all sites where the system is about to be implemented reduces these costs. Some ERP system suppliers, i.e. Intentia, provide their own consultants. If this implies higher consultant costs, companies must take that in consideration when evaluating the business proposals.
Often companies realize, in the middle of a project, that the hardware is too old and too slow. Hardware includes mainframe computers, servers, PCs, networks etc. Everything used to uphold and maintain the ERP system. Adequate hardware is crucial to get the system running properly. Remember that a chain isn’t stronger than its weakest link. It is therefore vital to carefully evaluate the potential need for new hardware in the beginning of the project, in order not to halt and delay the timetable later on, because of insufficient computer capacity. ERP suppliers usually underestimate the need for hardware in their business cases, maybe not to frighten potential customers with an extra cost. Companies should double check two times before excluding hardware upgrades in the budget.
36
5.2.2. The Typical Cost Structure of an ERP Project The figures in this chapter are comparisons of the cost structures from the case studies. See appendix 4 for the raw data from the cases. The selection is too small to assure statistical confidence, but clear patterns could nevertheless be identified. In addition, information gained from interviews and research reports have contributed to give us a more complete understanding of the cost structure of ERP projects: Actual cost/projected cost 150%-300%. Most common with 200% Software costs 20%-30% of the total costs. Most common with 25% Implementation costs 60-70% of the total costs. How the sub-costs are split up differs according to how many adjustments that have been made, but the typical separation is:
• Software adjustment cost: 30%-40% of total costs • Info migration cost: Approximately 10% of total costs • Education cost: Approximately 10% of total costs • Consultant travel, expenses and miscellaneous: Approximately 10% of total costs
Hardware costs 0-15% of total costs. This differs a lot. Some companies don’t need to upgrade at all and some have to spend 15% of the total project costs on hardware.
Project costs in different case studies
0%10%20%30%40%50%60%70%80%90%
100%
Com
pany
B
Com
pany
C
Com
pany
D
Com
pany
G
Com
pany
H
Hardware costSoftware costImplementation cost
Figure 5.2: The cost split-up
Running costs 5%-20% of total costs annually. The running costs are subdivided into license costs and support costs, with the typical relative sizes of 1:1. The variations depend on what deal the company makes with the supplier. Some suppliers prefer a lower initial costs and higher license and support fees, some the other way around.
37
Internal hours How much internal labor is needed for the project is of course dependent on the project size, but the relationship definitely isn’t as linear as one might believe. However, a reasonable approximation is that an ERP project of 30-50 MSEK should budget for about 10,000-20,000 internal labor hours.
5.3. Best Practice In this chapter the qualitative findings from all the cases will be summarized in order to give the reader a better picture. This will be accomplished by digesting the learnings in all cases and then presenting them as best practices. We have further more chosen to divide the ERP project into six different phases divided into two ages with the most common duration specified. Before going-live:
• Procure: Determine the specific company needs and evaluate a number of potential system suppliers. Most common duration: 3 to 18 months.
• Decide: Decide on the system that gives the best fit and economy. Most common duration: 0 to 2 months.
• Execute: Commence the training, fitting and adjustment season. Most common duration: 4 to 24 months.
After going-live:
• Stabilize: Secure and sustain the core ERP system’s functionality. Most common duration: 6 to 12 month.
• Synthesize: Build for the future by adding more capabilities, often not ERP applications, to the mix. Most common duration: 6 to 18 month.
• Synergize: Achieve value in use by thoroughly mastering those capabilities. Most common duration: 12 to 24 month.
These phases constitute a natural ERP timeline from our findings and experiences and all best practice can be split up amongst them in a trivial way. We have mainly focused on the first age since we consider it to be very important. The second age is in many ways dependant on the first in order to be fully realized. The most important phase in the second age is to stabilize. If that phase never is achieved, the other two will never become significant.
5.3.1. Procure This phase starts with the decision that the company at hand needs to acquire a new ERP system. It ends when all evaluation and try outs are completed and the main candidates are specified. In orders words when it is time to make the final decision. The wisdoms in this section are stated in descending order of importance.
1. Verify that the need for a new system exists and that there are enough resources and time to succeed with such a major project. Maybe the old system is sufficient for another year or maybe a smaller system would be enough. Here it is important to determine the alternative cost if not buying a new system. It is also important to
38
determine where the largest need for a new system lies, in order to understand what type of system that is called for.
2. Make sure the decision to buy an ERP system is in line with the current IT strategy. If there doesn’t exist an IT strategy, one should be formulated first, based on the corporate strategy. It is very important to consider the ERP system as a strategic tool and not another “photo copier”.
3. Make sure to carry out thorough preparations and state clear reasonable goals, by conduction an investment analysis.
4. The preparation work is extremely important in terms of the requirement specifications, employee allocation, project group forming and evaluation.
5. When choosing the personnel that will develop the requirement specification, it is important that they have the right capabilities and understand the organizational structure and the processes.
6. When setting up the requirements specification it is important to always put key operations first. Those are crucial to sustain and therefore it is important to emphasize those to the suppliers.
7. It is important when making all the preparation work to have a broad picture and look beyond the current situation. Ask the following questions:
• Are we about to make any larger acquisitions? • Is the corporate management working on a global strategy? • Are our requirements the same as our subsidiaries? • Which synergies can be made by using the same system in all divisions and
subsidiaries? • Is it sufficient with a common finance system or is there a need for total
integration? • Which part of the organization can benefit from a common platform?
8. A common mistake is to underestimate the time it takes to undertake a project of this magnitude.
9. It is important to use a mixture of employees during the procure phase. This makes it easier to gain approval once the decision is made throughout the organization since a broad range of people are involved.
10. Remember that a smaller less integrated system will be more forgiving on input data errors and also more flexible due to more manual operations.
5.3.2. Decide During this phase the final decision is taken on which ERP system to buy. There are several things to consider and we have decided to outline them starting with, in our view, the most relevant: .
1. The decision should be made undisputable by top management after evaluating the prepared business case and the offers. Otherwise there will be too much turbulence and take too much to time to reach a conclusion.
2. Discuss and decide on the price solution and risk taking already during this phase with the suppliers as well as the consultants. It is important to initially take control over the costs. The risk of sky rocketing costs should be mutually shared.
3. Make sure that all contracts are well defined and signed before starting the implementation. This way the cost allocation is already determined.
4. Make sure to choose supplier and consultants that are represented in all geographic areas that will be affected by the ERP project.
39
5. When deciding on consultant, make sure to measure their knowledge of the selected system.
6. Insist on a long warranty period that covers a certain time after going live since it is often then errors will be detected.
7. When taking the decision for a whole business group, remember to look at the current and potential synergies and if there are none, do not force on a global platform.
8. When taking a decision for a whole business group, be careful before signing any all-embracing contracts, since it might be more beneficial to negotiate at each subsidiary. The subsidiaries will loose their negotiating power when a comprehensive contract exists since the supplier already knows that he will be chosen.
5.3.3. Execute This phase is usually the most time consuming and where it is determine how successful the project will be. The procure phase is also crucial, but with a bad preparation and a successful implementation there can still be a success, but not the other way around. When digesting the cases there were several things that stood out. These will here be presented in descending order of importance:
1. Prepare to adapt the organization to fit the system and not the other way around for mainly two reasons. Firstly, it is expensive and time consuming to change the system. Secondly, by adapting the organization the system is used the proper way and maximum benefits can be gained. As mentioned before it is however very important to keep the key operations and sometimes the system has to be adapted to those.
2. It is very important that top management, during the implementation, is involved and sets up clear directions, in order to maintain homogeneity throughout the organization. If this isn’t achieved, the whole purpose of the project is down the drain.
3. Think twice before adapting the system. Many adjustments become unnecessary once the users become familiar with the system.
4. Make sure to allocate the right personnel to the project. Construct a project group, where the most important individual will be responsible for the operations and project manager. That person should be someone with a deep knowledge of the organization and great business capabilities. That task usually involves a lot of administrative work and it is therefore crucial to assign a project administrator.
5. Make sure to discuss ideas and solutions in-house before bringing it up with the consultants. This saves a lot of money.
6. A common mistake is to underestimate the data migration, in terms of both cost and time. To facilitate this procedure there are a couple of steps outlined in the figure below that should be considered.
Migration Guideline1. Clear all data that isn’t relevant anymore2. Sort the rest of the data in different categories
dependent on importance.3. Decide on which data that has to be migrated
immediately and which that can be migrated later. 4. Evaluate which method of migration that is most
favorable of the following two: 1. Manual migration by temporary programmers2. Migration through a computer program that is built by
consultants. The first method is usually easier when determining the total price and timeline!
Figure 5.3: Migration Guideline
40
7. Remember that the technical side isn’t always the most important. In the end it is the
end users job that should be facilitated. 8. Try to keep the timeline. Changing timeline usually takes the edge out of people and
there is a great risk of running over the new timeline as well. 9. Keep the size of the project group at a reasonable level. It is better to allocate a few
personnel full time than to have a larger number working part time. This also creates in-house experts.
10. Make sure to develop the in-house competence in order to become less “consultant” dependent. This can be solved by following point 8.
5.3.4. Stabilize, Synthesize and Synergize – After Going-Live Within these three phases we have put less emphasis but there are still some findings that should be mentioned. Another important thing is that these phases are caught within a loop. Once the last phase is finished, companies can always start the process all over again by further exploring new opportunities as the picture below shows.
The After Going-Live Loop
Stabilize
Synergize
Syntezise
Figure 5.4: The After going-live loop
Stabilize It is important to inform the organization that status quo will take some time to realize. There is usually teething trouble and this is where the company’s ability to manage change is put on trial. Usually there is a great deal of reluctance to change but if the project is well reinforced and accepted this period will run more smoothly. It is important to reach status quo as quickly as possible in order to become aware of the benefits that are accessible. Synthesize During this phase the organization will start exploring the new capabilities that are available. Since most users now are familiar with the new system and the new work procedures, ideas and suggestions will evolve. It is important to proceed with caution and not adopt all suggestions without further evaluation. Synergize It is now time to harvest the crop by making the investment pay off. If all the previous steps are carried out in a proper manner benefits should come automatically. This should also evolve as a natural part of the processes. During this phase some companies decide to cut the license contract, and instead modify and upgrade the system in-house by their own timeline. Once the changes have been made it all starts over with the stabilize phase.
41
6. ERP Cost and Benefit Model By using the findings in our analysis we have constructed a model for valuating an ERP investment. The model consists of one benefit part and one cost part and is made in order to get a fair picture of both sides of the investment. Before using the model there are some steps that are required to take into consideration.
1. Develop an IT strategy 2. Set up a requirements specification 3. Make up a list of potential suppliers and implementation consultants 4. Ask the suppliers and consultants to hand in proposals after viewing the requirements
specification. 5. Evaluate the proposals and decide on three to five suppliers
When these steps are finished, the capital investment appraisal must be conducted. The model presented below shows how our findings would lead to an investment decision.
ERP Benefit and Cost Model
1. Valuate the potential benefits by examining all cost drivers with regardson what the system might bring.
2. Valuate the alternative cost for keeping the present system/s running.
1. Evaluate the suppliers’ cost proposals.
2. Adjust the most potential proposals with your own calculations.
Benefits Costs
Benefits/Costs – 1 = ROI
Figure 6.1: ERP benefit and cost model
In order to be objective it is important to valuate the potential benefits before looking at the costs. Otherwise there is a risk for subconsciously adjusting the benefits in order to justify the investment costs.
42
7. Conclusions ERP acquirements have caused a lot of trouble historically, due to lack of knowledge and know-how about best practices. When companies are deciding to acquire a new ERP system there are several things they should be aware of. The pitfalls are plenty but also the possible benefits. Over the past years it has almost been a common practice not to expect any significant returns on such an investment. An ERP system has been considered as a necessary evil and very poor investment analyses are usually performed, despite that the investment often is of a significant size. With the increasing focus on cost cutting there should however be even more relevant to make correct investment analyses in order determine whether an ERP project really is profitable. An ERP system should be regarded as any other investment, with specific ERP demands on ROI and positive cash flow. Through our study we have gained insight in the ERP world and also been able to share eight different companies ERP experiences and thoughts. All together, this has lead to the following conclusions regarding benefits, costs and best practices.
Guideline for ERP projects
• Examine the cost reductions and efficiencies that come with an ERP system
• Determine the alternative cost for keeping the existing business system running
• Evaluate the supplier proposals.
• Adjust the cost according to company specific expectations
Determine Potential Benefits
EvaluateProjectCosts
Make anInvestement
Decision
ApplyBest
Practice
• Compare benefits and costs
• Determine ROI of the project
• Use best practise throughout the implementation process
Figure 7.1: Guideline for ERP projects
7.1. Benefits There are several benefits to gain from ERP systems. The problem is that these benefits are very company specific. Every company has their own weaknesses and misfits, areas where an ERP system could improve operations. However, after analyzing the case studies in this thesis, some strong patterns were detected. Even though every company had not benefited equally, the same areas and cost drivers, in which companies have seen improvements, returned over and over again. It is within these areas that the most important benefits to motivate an ERP investment can be found. The following are all the cost drivers we have identified where quantitative benefits can be made by implementing an ERP system:
• Shortened production cycle time - less capital tied up • Enhanced workforce productivity • More efficient capacity utilization • Delivery time accuracy • Personnel reductions • Less warranty and scrap costs
We emphasize however that there is a strong distinction between two types of ERP projects:
1. Projects where the company’s old IT environment consists of separate islands and the ERP system thereby would be the first fully integrating business system in the corporation.
2. Projects where an ERP system already exists in the company and the purchase of a new system is only an upgrade of the previous one.
In the first case, ERP system often brings lots of benefits and efficiencies and the investment analysis could be based on the discounted cash flows from those. In the second case, new benefits are hard to realize. The investment analysis must instead be based on alternative costs for keeping the old systems running.
44
The investment analysis consists in both cases of course of a combination of new benefits and alternative costs, but in the first case benefits are more prominent and in the second case alternative costs are of central importance.
7.2. Costs The common denominator when analyzing the costs is that there always is an underestimation of the final cost. Usually the actual cost ends up 150-300% of what has been projected. Thus, the π-factor exists in reality. The explanation for this underestimation lies in the different costs that constitutes the final cost and comes with the ERP project: The software cost, the hardware cost, the annual running cost, the implementation cost and the internal cost consisting of the time spent on the project by the employees. Out of these costs the first three are rather set from the beginning and usually don’t escalate during the project. The last two however, almost always get out of control, thus it is within these two companies can cut costs. The implementation cost represents the major part of these two. About 65-70% of the total cost can be derived from here. The implementation cost is made up of mainly four cost drivers, which are presented in descending order of quantity:
• Software adjustments cost: 30-40% of total cost
• Data migration cost: Approximately 10% of total costs
• Education cost: Approximately 10% of total costs
• Consultant travel, expenses and miscellaneous: Approximately 10% of total costs.
The internal cost is hard to set a price on, since in a lot of cases the employees have just been working even more instead of neglecting their usual duties. We have therefore only calculated the amount of time spent and it is almost never fully accounted for in the beginning of the ERP project.
7.3. Best Practice Another problem with ERP projects is that to gain benefits, companies must act correctly, not only during the implementation but also after going-live. Best practice has to be followed during all six ERP-phases we have used, divided into two different ages:
E d u c a t io n c o s t
M is c e lla n e o u s
M ig r a tio n c o s t
S o f tw a r e a d ju s t m e n t c o s t
T h e c o s t s tru c tu re o f E R P p ro je c ts
H a rd w a re c o s t
S o ftw a re c o s t
Im p le m e n ta t io n c o s t
45
PROCURE DECIDE EXECUTE
Before Going-Live
• Procure: Determine the specific company needs and evaluate a number of potential system suppliers.
• Decide: Decide on the system that gives the best fit and economy.
• Execute: Commence the training, fitting and adjustment season.
• Stabilize: Secure and sustain the core ERP system’s functionality.
• Synthesize: Build for the future by adding more capabilities, often not ERP applications, to the mix.
• Synergize: Achieve value in use by thoroughly mastering those capabilities.
STAB
ILIZ
E
SYNTESIZE
SYNERGIZE
After Going-Live
Figure 7.2: The six phases of ERP projects
Notice that the after going-live phases are in a continuous loop, starting over with the stabilize phase whenever the synergize phase is completed. These phases comes naturally when deciding to buy an ERP system and it is important to remember that the project is not over once going-live. Then only the first three phases are completed. We have focused on the first three phases where we have identified best practices and here are the most important.
• Remember to look at the ERP system as a strategic tool rather than a new “photo copier”.
• Verify that the need for a new system exists and that there are enough resources and time to succeed with such a major project. Maybe the old system is sufficient for another year or maybe a smaller system would be enough. Here it is important to determine the alternative cost if not buying a new system. It is also important to determine where the largest need for a new system lies, in order to understand what type of system that is called for.
• Prepare to adapt the organization to fit the system and not the other way around for mainly two reasons. First, it is expensive and time consuming to change the system. Second, by adapting the organization, the system is used the proper way and maximum benefits can be gained. It is however very important to keep the company’s key operations and sometimes the system has to be adapted to those.
• Make sure to carry out thorough preparations and state clear reasonable goals, by conducting a detailed investment analysis.
• It is very important that top management, during the implementation, is involved and sets up clear directions, in order to maintain homogeneity throughout the organization. If this isn’t achieved, the whole purpose of the project is down the drain.
46
8. References
8.1. Printed Sources
8.1.1. Literature Arbnor, Ingeman & Bjerke, Björn (1994) Företagsekonomisk metodlära. Studentlitteratur. Lund, Sweden. Dahlgren, Lars Erik &Lundgren Göran & Stigberg, Lars (1998) Gör IT lönsamt Second Edition. Ekerlids förlag. Stockholm. Sweden Iversen, Torben (1998) Styrkraft. PriceWaterhouseCoopers. Stockholm. Sweden Lester, Albert (2000) Project Planning and Control. Butterworth-Heinemann. Third Edition. Oxford. UK Meissner, Gerd (2000) SAP Inside the Secret Software Power. McGraw-Hill. New York. NY. USA Paulsson, Ulf (1999) Uppsatser och rapporter – med eller utan uppdragsgivare. Studentlitteratur. Lund, Sweden. Pheysey, Diana C. (1993) Organizational Cultures. Types and Transformations. Routeledge. London. UK
Porter, Michael E. (1998) Competitive Advantage: Creating and Sustaining Superior Performance
Wallace, Thomas F. (1990) MRPII: Making It Happen. The implementers guide to Success with Manufacturing Research Planning. Oliver Wight Publications, Inc. Second Edition. Essex junction, VT, US. Wallén, Göran (1993) Vetenskapsteori och forskningsmetodik. Studentlitteratur. Lund, Sweden.
8.1.3. Previous Research Studies Askenäs, Linda & Westelius, Alf (2000) Five roles of an information system: Asocial constructionist approach to analyzing the use of ERP system. Article. Department of Computer and Information Science, Linköping Institute of Technology, Linköping, Sweden. Deloitte Consulting (2000), ERP’s Second Wave. Research Report
47
Gäre, Klas (2003), Tre perspektiv på förväntningar och förändringar i samband med införande av informationssystem. Doctoral Thesis. Department of Computer and Information Science, Linköping Institute of Technology, Linköping, Sweden Hedström, Helene (1999) Utvärdering av erfarenheter vid implementation av affärssystem. Master Thesis. Department of Computer Science, University of Skövde, Skövde, Sweden. Selldin, Erik (2002) Enterprise and supply chain planning: A survey of Swedish manufacturing firms. Licentiate Thesis. Department of Production Economics, Linköping Institute of Technology, Linköping, Sweden.
8.1.4. Other Ahlström, Fredrik & Norbäck, Mikael & Servin, Pontus (2001), Inlåsningseffekter på den svenska aktiemarknaden. Bachelor Thesis. Department of Business Administration, School of Economics and Business, Lund, Sweden.
8.2. Electronic Sources
8.2.1. Website Articles Davenport, Thomas H. Does ERP Build a Better Business? www.cio.com/archive/021500/excerpt.html. CIO.com 2/5 2003 Davenport, Thomas H. Long live ERP. www.cio.com/archive/030100_davenport_content.html?printversion=yes. CIO.com 2/5-2003. Davenport, Tom, Living with ERP. www.cio.com/archive/120198/think.html. CIO.com 2/5-2003 Donovan, R. Michael, Why the Controversy over ROI from ERP? www.rmdonovan.com/pdf/perform.pdf. R. Michael Donovan & co., Inc. 2/5-2003 Fryer, Bronwyn, The ROI Challenge. From “CFO, The Magazine for Senior Financial Executives”, September 1999, www.findarticles.com/cf_0/m3870/9_15/55634384/print.jhtml. Find Articles 2/5-2003 Jeffrey, Bill & Morrison, Jim ERP, One Letter at a Time. www.cio.com/archive/090100/ea.html. CIO.com 5/5-2003 Kennedy, Siobhan, CEOs Turn Their Backs on ERP in Favor of On-Line, ROI Apps. From “Computergram International”, June 15 1999. www.findarticles.com/cf_0/m0CGN/3682/54887905/pmrint.jhtml. Find Articles 5/5-2003. Koch, Christopher, The ABC of ERP. www.cio.com/research/erp/edit/erpbasics.html. CIO.com. 2/5-2003. Palatto, John, Get the Most out of ERP: Shrewd preparations improves chances for timely ROI. From “Internet World”, February 2002. www.findarticles.com/cf_0/m0DXS/2_8/82650319/print.jhtml. Find Articles 5/5-2003.
48
Pender, Lee, Faster, Cheaper ERP. www.cio.com/archive/051501/faster.html. CIO.com 5/5-2003 Slater, Derek, An ERP Package for You… and You… and You… and even You. www.cio.com/archive/021599/erp.html. CIO.com 5/5-2003 Slater, Derek, The Hidden Costs of Enterprise Software. www.cio.com/archive/enterprise/011598_erp.html. CIO.com 6/5-2003
8.2.2. Other Website Material www.findarticles.com/cf_0/m4PRN/1999_May_18/54653141/print.jhtml. Find Articles. 2/5-2003
8.3. Oral Sources
8.3.1. Interviews Customer Service and Distribution. Company A. 11/6-2003 Economy Director. Company A. 11/6-2003 Head of Logistics. Company A. 26/5-2003 IT-manager. Company A. 26/5-2003 Group Controller. Company B. 17/6-2003 VP Finance/control. Company B. 17/6-2003 Project Manager. Company C. 5/6-2003 and 23/6-2003 Director of Finance and Administration. Company D. 24/6-2003 CIO. Company E. 28/5-2003 Head of Corporate IT. Company F. 10/6-2003 Finance Director. Company G. 12/6-2003 IT Manager. Company G. 30/7-2003 Production Director. Company G. 12/6-2003 Head Manager. Company H. 25/7-2003 Project Manager. Company H. 26/6-2003 Kalderén, Hans. Partner. Deloitte Consulting. 6/6-2003 Selldin, Erik. Doctoral Student. Linköping Institute of Technology. 7/5-2003.
49
Part ΙΙI – Case Studies Part III presents the case studies that the thesis is built upon. All the eight cases are fully presented in order of information quality and each case is digested differently.
Part ΙΙΙ
9-16. Case Studies
9-16. Case Studies
50
9. Company A The reasons for using Company A as a research object are several. The most important one is that they are one of the pioneers when it comes to using ERP systems. Already in 1984 Company A bought its first ERP system. They have therefore experienced the trade offs and changes that comes with an ERP system for almost two decades and will serve as a benchmark for our other cases. At Company A we initially met with the IT manager, the Head of Logistics and at the second interview we met the Head of Customer Service, and the Director of Economy. They have all been with the company since the 1970s.
9.1. Company Overview Company A belongs to a larger business group, which is operating in the security market. Company A has around 700 employees and revenue of 1 BSEK and holds a strong market position in Sweden, USA, Great Britain, Holland, Germany, the Baltic States and Asia. It’s a knowledge-based company, which constantly develops and pushes the evolution for private as well as corporate clients.
9.2. Company A’s Former System Before 1984 Company A used several different systems with no particular common base. There were different systems in different stages of the value chain. These systems were developed, upgraded and serviced by lots of external consultants. This meant a great deal of dependence on out-house professionals and lead to high costs. As Company A’s product base became more complex and the need to standardize the systems became more important, Company A began to look for an integrated business system. It was particularly the need to have better control within the company that pushed for a change.
9.3. Company A’s New System As Company A started to scan the market for business system, ERP providers had just begun to emerge. After 6 months of evaluations Company A decided to go with Intentia’s Movex. Movex is developed out of a production perspective, which was in line with Company A’s demand and structure. As the decision was taken Movex was bought in 1984. It was implemented by a module franchising strategy and the implementation took 12 months compared to the expected six months. Total costs were underestimated by 20% (6 MSEK compared to the expected 5 MSEK). The new system originally contained modules for order management, purchases, finance, accounting, sales and administration. Later on more modules were brought in. Since Company A was one of the largest firms to implement Movex in 1984, close collaboration with Intentia was developed. When implemented, a lot of standard solutions was accepted even where there existed a misfit. Until 1994 Company A constantly upgraded the system and had a license contract with Intentia. In 1994 they upgraded to Movex 6.5 and decided to cut the license agreement and use in-house development instead. The upgrade brought in modules for production planning,
51
invoicing and inventory. For the internal development they hired two full time employees that did all the programming and the direct cost for the upgrade was 4-5 MSEK. In 1999 they brought in a more advanced invoicing module and integrated it into the system. Today the system covers not only Company A, but also fellow subsidiaries. During the first couple of years the system was more used as a helping tool rather than a strategic tool because Company A didn’t explore the new possibilities. It was part of the plan not to make large adjustments but to slowly grow into the system. Another explanation for this was that they had several internal problems that took all their attention, thus little time left for investigating and planning how to best utilize the ERP system. In the beginning of the 1990s Company A was forced to make major changes due to severe business problems. As the new decade began, Company A had to make large rationalizations. This meant that 30% of all blue collars and 25% of all white collars were fired. These were measures that the system made feasible but also changes that had to be done in order to survive. These events also changed the organization and the way they worked, which made it easier for Company A to explore and integrate the ERP system further more.
9.4. Organizational Changes, Benefits and Costs When analyzing Company A it is important to understand its cost structure. The diagrams below show that the largest cost driver is within production. In that area wages constitutes the largest cost driver (43%), thus rationalizations is the most efficient way to save money.
Salary &Production
Material & Purchases
Wages
Rent,Prod Mgmt, Depr
Cost of Production
Sales
Full Costing Cost of Production Salary & Production
88%
2%
10%10%
20%
70%
10%
20%
70%
Direct CostsMiscellaneousAdministration
Figure 9.1: Company A’s cost structure
9.4.1. Organizational Changes The first changes came in 1984 after the system was implemented. These changes were only found within invoicing, purchases and accounting. Due to the system they could send invoices the same day as the order was shipped compared to sending the invoice three to four days after the actual delivery. The department could also be cut by six persons but still perform the same tasks. Purchases became more efficient since they now had a system which could give them indications on when and where to buy and which quantities, in order to get the best price. This meant that the purchasing department became more cost efficient due to better planning. When preparing financial statements days could be used instead of weeks.
52
As mentioned before it wasn’t until 1992 that major changes evolved from better use of the system as well as new machinery and major organizational changes. The latter meant rationalizations of 100 white collars and 300 blue collars. Along with the head cut Company A was divided into more independent business units to improve efficiency. With the upgrade in 1994, into Movex 6.5, came changes in production and inventories. With these new modules people could have broader areas of responsibility since information was more accessible.
9.4.2. Benefits It is hard to determine which benefits can be derived from Movex and which can be derived from other events and changes because of the time span. However, what management emphasized as direct benefits from the system where:
• Much more efficient invoicing. Instead of sending the invoice after a week it is sent on delivery day.
• Capital tied up in production and finished goods inventories was cut by 50% • Improved delivery date accuracy
These were the main benefits according to management but when further analyzing Company A we found even more benefits. These were in short:
• Fewer personnel through out the organization • Increases capacity utilization • More complex sales tools
In the benefit analysis these will be explained further.
9.4.3. Costs Company A had a direct cost of 6 MSEK 1984 and 5 MSEK in 1994. When looking at Company A, year 0 is set to 1994, because it was not until then they had all the modules to fulfill our definition of an ERP system. Therefore we have recalculated the cost from 1984 by taking inflation into account. The direct cost included the following things:
• Original software costs • Some software adjustment costs • Consultant costs • Migration costs • Education costs
When doing our analyze we feel that the costs incurred after 1994 are relevant since they occurred after a full ERP system was brought in. These costs only consisted of 2 full time employees that worked with upgrading the system on demand of the users. They had an approximate salary including social benefits of 0.5 MSEK each. Other than that there are no more incurred costs. This adds up to a total cost of 23.8 MSEK discounted to 1994.
9.5. Benefit Analysis When looking at the benefits due to the system it is important to understand that these benefits have emerged gradually. When identifying benefits we have taken into account both direct benefits derived from the new system as well as indirect benefits, due to changes within the company that the new system have made feasible. The reason for this is our belief that a new system cannot be regarded as a new “photo copier”, but should rather be looked at as a helping strategic tool.
53
9.5.1. Purchases Within purchases Company A has experienced an improvement due to better advanced planning. The improvement has given them better bargaining power, thus they have experienced lower purchase prices. When estimating the price decrease they said 2-3% on 230 MSEK in total purchases.
9.5.2. Inbound Inventories Company A does not use the ERP system for all inbound inventories. They have a special system for this part. Movex is only used for analyzing the numbers and for data check ups. Supply orders are still done manually since Company A considers that to be a crucial task better performed by human supervision.
9.5.3. Production Within the production Company A feels that they have experienced some benefits in all areas. They feel they can manage the flow of products more efficient in order to maintain a steady flow. Production cycle time The capital tied up in production and outbound inventory have been decreased by 50% from around 170 MSEK to 85 MSEK due to the new system. The proportions between the two could not be determined however. Workforce productivity Company A says that the workforce productivity has increased dramatically after the change of system but could unfortunately not give any specific numbers. Just looking at the change in workforce, they are now 300 blue collars less but have sustained the same revenue. Capacity utilization The Director of Economy said: “Without the system we could probably not determine our capacity utilization”. Therefore they do not have any numbers but estimated the improvement to about 30%. Today they have 15 MSEK in depreciation. Delivery time accuracy This is one of the areas where Company A has experienced the biggest change. Before the new system was used properly their delivery time accuracy was down to 20-30% where as now it’s up to 96%. This was necessary in order to stay competitive and has meant that customers are more loyal and that Company A do not loose out on orders because of failure to deliver in time. It is one of Company A’s core competencies not only to deliver on the same day as the order is received but also to have several deliveries per day. Personnel 300 workers have been rationalized within purchases, inventories and production. This was a necessity in order to survive but the system made this change smoother and more feasible. We feel it is impossible to determine how much of this benefit that comes from the system and have therefore not included this in our calculation. The amount is however substantial and should not be neglected.
54
9.5.4. Outbound Inventories During the last couple of years Company A has changed production to just-in-time, which has lead to decreasing inventory levels. The capital tied up has therefore decreased as mentioned earlier.
9.5.5. Sales By using the system Company A has created new routines, which in turn have increased sales. Particularly within one business unit which has revenue of 150 MSEK. They now have better control of lost and gained customers and are also able to receive data on profitability on each customer and order thanks to the increased transparency and the complex customer profiles they are able to build up. Due to the improved delivery time accuracy, sales and support personnel can spend more time on core activities instead of dealing with complaints and returns.
9.5.6. Administration As was mentioned earlier white collars were cut by 100 persons in the beginning of 1990s as a necessary development. This rationalization hit both sales and administration personnel. When looking at the cost savings from this action we feel that it is hard to determine what comes direct from the system and therefore we have not used this benefit in our calculation. It is however a substantial cost benefit and must be considered when looking at the big picture. Invoicing The system brought in a more efficient way for invoicing. It made it possible to set the date of invoice to the same day as the product was shipped compared to previously setting the date three to five days after the order was sent due to manual information flow. The system also made it possible to cut the personnel with 50% from 12 to 6. Overhead costs In 1999 a new module was brought in that made it possible to send order confirmations, invoices etc. electronically instead of by mail. This meant less paperwork as well as lower costs for stamps, paper and so forth. Company A said that they could use 0.5 personnel less for the same tasks.
9.6. Metrics of Potential Gains In table 5.1 below, the improvements identified in the benefit analysis are transformed into a more comprehensible language, money. For each element, annual gain is computed, wherefrom the total gain is derived by discounting for five years with a discount rate of 10%. Benefits are derived from 1994 even though they were realized from the start in 1984 and five years is the assumed project lifetime.
55
Cost driver Improvement Annual gain
the best year Total gain Explanation
Purchases Prices 2-3%
decrease in prices
4,6-6,9 MSEK 17,4-26,2 MSEK Total purchases of 230 MSEK
Production Production cycle time
Reduced by 50%
8,5 MSEK 32,2 MSEK Capital tied up in products in process will be reduced by 85 MSEK
Administration Invoicing Date of
invoice 3-5 days earlier.
1,2-2 MSEK 4,5-7,6 MSEK 12-20 MSEK less capital tied up in accounts receivables
Personnel 6 employees
less 2,4 MSEK 9,1 MSEK One employee
costs about 400000 SEK per year
Overhead 0,5 employee
less 0,2 MSEK 0,8 MSEK One employee
costs about 400000 SEK per year
Total 16,9-20 MSEK 64-75,9 MSEK
Table 9.1: Metrics for Company A’s ERP-project derived from the benefit analysis
9.7. Learnings Company A mentions that in house competence is very important when preparing, using and going thru this type of investments. They also mention that preparations are crucial with the right mixture of persons in the business case and when preparing the requirement specifications. Their solution to cut the relationship with the supplier, have been experienced to be successful.
9.8. Conclusion When looking at Company A’s case and our calculation it is evident that they have prospered greatly from the investment in an ERP system. The direct benefits are 64-75.9 MSEK compared to 23.8 MSEK in costs. These numbers are derived without taking the major rationalizations into account. These rationalizations meant annual savings in the range of 140 MSEK. Unfortunately they did not explore the possibilities from the beginning but instead
56
looked at is as a new tool. This lead to continuing problems and eventually considerable actions had to be taken. After these measures Company A began using the system as a strategic tool and adopted the organization to the new way of doing things and this lead to major improvements and benefits. The unique thing about Company A is that they have a sort of cross-functional solution, since the base for the system is Movex, but since 1994 they have developed it into an in house solution. Their reason for doing so was that the constant upgrades only dragged the company more behind since adjustments had to be made each time. This way they could choose when to make upgrades and change routines themselves. What also is important to keep in mind is that Company A went from several old school systems to a modern ERP system, when most companies goes from several modern systems to an ERP system. Eventually they will have to buy and implement a new system but with their experience and learnings, that should run rather frictionless.
57
10. Company B Company B was chosen as a research object since their reasons for buying a new ERP system goes in line a lot of other companies all over the world. The main reason was Y2K concerns because the former systems technology was old and hard to upgrade and rely on. At Company B we met with the VP Finance and the Group controller.
10.1. Company Overview Company B is a division within a larger business group. Annual sales are 1,200 MSEK and they have 1050 employees. The division works rather independent from the mother company which core business is security solution. Company B is dating back to 1764 when it was only manufacturing nails and latter on screws which today is within the Fastening unit. Today the division comprises three business units: Business unit 1 With years of experience, Business unit is synonymous with high quality lifting equipment. They hold a leading position on the world market for graded lifting components. Today Business unit 1 is the most international unit and has production in several countries. It comprises about 55% of the total revenue. Business unit 2 Business unit 2 develops and markets fastenings systems for the construction and industrial sectors. Business unit 2 is the leading supplier in Northern Europe of certain fastening equipment, with manufacturing in Sweden, Finland and Poland. 5000 different products are offered in both standardized, semi special and special formats. 60% of the market is in Sweden and Business unit 2 comprises 30% of the total revenue. Business unit 3 Business unit 3 develops, manufactures and markets crane blocks, sheaves and mega lift/custom engineered products. The products are generally used in conjunction with lifting cranes and other lifting devices, both onshore and offshore. 15% of the total revenue comes from this unit. This unit is however not included in the ERP project since there are hardly any synergies and since it operates totally independent and mostly in the US. During the years Company B has been the cash cow of its business group, which has developed into an internationally fast-growing security group with 106 companies located in 32 countries. The Group has sales to a further hundred markets via agents and distributors. Annual turnover amounts to some 7200 MSEK. The other subsidiaries products are mainly security products, including fire and burglar resistant safes, security products for banks and cash handling, electronic security systems, fire protection, entrance control and access control, alarm centers, and indoor and outdoor perimeter protection.
10.2. The Former System Before the new ERP system, Company B used several systems in different areas and different units. To integrate the financial sides AMAX was used on top. Technology was old and costly to operate and service with an annual cost of 2-3 MSEK. The systems had been in-house
58
modified and all maintenance contracts had been withdrawn. It was therefore costly and hard to upgrade them in order to ensure Y2K compatibility.
10.3. The New System When deciding on a new system Company, B set up a couple of criteria:
• They wanted a standardized system that could be integrated and work worldwide. This was an outspoken strategy.
• The system should provide space to grow in. • The supplier should be strong, especially on the financial side in order to ensure their
survival. • The consultant supply was important, as the system would be implemented all over
Europe. • Company B did not want to change as the new system was brought in. It was therefore
important that the new system was adoptable. Within the business areas where Company B operates, growth is achieved by acquisitions and that is also the only weapon to limit the competition. It is therefore important to have a system that easily can be integrated in new subsidiaries.
10.3.1. The Decision Process Company B set together an evaluation group that worked closely with a number of consultants. They defined a requirement specification that they cross checked with a number of different ERP suppliers to finally break it down to two: Intentia and SAP. The final decision was then taken after interviewing 30 end users within Company B that were able to try out the two different systems. The result was unanimous, almost everyone wanted SAP. The main reason why SAP R/3 was chosen was that it provided more space and fewer limitations than Intentia’s Movex. When looking at the financial sides of the deal a real calculation was not completely done, since the alternative cost was used as a motivating aspect. They calculated however to cut maintenance costs and to use 12 employees less once the system was installed. The decision process took 24 months to complete and the implementation took 12 months and was on time. They experience some trouble with the migration part and therefore they had to adjust the installation plan and be more focused in order to reach the timeline. Nevertheless, it took them one year to reach status quo after the implementation was done due to an “initial chock”. This chock can be explained by the implementation rush they had to go through in order to have everything up and running by Y2K.
10.3.2. Extension The new system was first rolled out in Sweden and then Norway and Finland. Rest of Europe will be integrated as time goes by. Company B uses almost all the modules we have defined to be included in an ERP system. Currently they have 260 users.
59
10.4. Organizational Changes, Benefits and Costs The cost structure differs a little bit between the Business unit 1 and Business unit 2. The picture below shows the cost of production for the two units. The same cost structures exist today but the resources are better used within the company and the fixed costs have been better materialized. As the picture shows the structures are rather alike and the biggest cost driver is personnel. When deciding to change to an ERP system Company B decided not to make any organizational changes but as the project proceeded they had to compromise on that standpoint.
10.4.1. Organizational Changes The biggest changes have been that Company B has changed towards more process-oriented operations in order to adapt to R/3. On top of that a warehouse in Norway has been shut down and instead they now have a central warehouse in Sweden. Around 50 persons within production have also been dismissed. They have also decentralized the IT functionality to each division.
10.4.2. Benefits As mentioned before Company B did not think the benefits would be that great. They regarded the investment as a necessary evil. When we looked at it through a thicker lens we found several benefits. These were in short:
• Better manpower productivity. • Much better transparency through out the entire organization. • Better follow up and predictions in the sales department. • More reliable IT system in terms of potential breakdowns.
10.4.3. Costs Company B’s total cost for the ERP project ended up with 30 MSEK for the Swedish company, compared to the projected cost of 16 MSEK. This cost was spread out on the following things:
On top of these costs come the licensing costs and the operations and maintenance costs. The biggest misjudgments when estimating the total cost were the migration cost, which ended up
Fixed Costs
Variable Costs
Material
30%
40%
30%
Business unit 2Business unit 1
Fixed Costs
Variable Costs
Material20%
30%
50%
60
a lot more expensive than anticipated and the adjustment costs, where only the printer managing system had an adjustment cost of 5 MSEK. Today the yearly licensing costs and operational costs are around 1.1 MSEK compared to the former systems that came with a cost of 2-3 MSEK per year. When discounting all these costs back to 1999 they add up to 34.2 MSEK. This should be compared to the alternative cost savings that would have been in between 7.6-11.4 MSEK and as will be shown, the new investment brought in benefits as well. In addition, when installing SAP in the Norwegian and the Finnish subsidiaries costs were only 1% of the original cost due to in-house competences and already paid fees and licenses. Internal cost 5 persons worked with the project fulltime for a year. On top of that 20-25 persons put aside 25-50% of their time to the project. This means around 22,000 man-hours, which is a significant amount.
10.5. Benefit Analysis When looking at the benefits due to the system it is important to understand that these benefits have emerged gradually and might continue to grow. In Company B’s case benefits did not appear until one year after R/3 was up and running due to severe teething troubles. As we did the analysis we have taken into account both direct benefits derived from the new system as well as indirect benefits, due to changes within the company that the new system have made feasible. The reason for this is our belief that a new system cannot be regarded as a new “photo copier”, but should rather be looked at as a new helping strategic tool.
10.5.1. Purchases Within purchases Company B have not experienced any major benefits. They feel that they have better control when it comes to allocating purchases. A reason for not experiencing any benefits in this area might be that they buy raw materials, which are not very price sensitive.
10.5.2. Inventories When it comes to ingoing inventories the turnover rate has increased by 20% for Business unit 2 and by 10% for business unit 1, but the capital tied up remains the same. As mentioned before one warehouse in Finland has been shut down which means a saving of 1 MSEK per year. Within Business unit 1 Company B sees potential for changing into one central warehouse but so far this has not been realized. Since SAP R/3 has been implemented they have changed their inventory/production strategy due to better production planning. They now have more capital tied up in the outgoing warehouse in order to better meet their customers demand.
10.5.3. Production This is where Company B has experienced the biggest benefits. They have decreased personnel but still maintained the same production flow and have better control through out the processes. They have introduced barcodes, which improves the quality of the information.
61
Work in progress Work in progress has not decreased but they now have a better flow of products. Manpower productivity Due to the system the productivity has increased by 10% and Company B was therefore able to dismiss 50 persons. According to them 75% of this dismissal can be credited to SAP R/3. Capacity utilization Company B feels that they now utilize their machinery 5-10% better since the system enables them to better plan the production flow.
10.5.4. Sales It is in this area Company B has the most users of SAP R/3. A lot of things have become automated and the system is an important part of the planning and prognosis. They have experienced a much more comprehensive customer picture and are able to measure and get statistics in a totally different way.
10.5.5. Administration Today administration is working at least 20% more efficient. This has meant that 2 persons have been dismissed. So far Company B has not explored all possibilities but they are much faster with financial statements since information has become much more available.
10.6. Metrics of Potential Gains In table 10.1 below, the improvements identified in the benefit analysis are transformed into pure money. For each element, annual gain is computed, wherefrom the total gain is derived by discounting for five years with a discount rate of 10%. When carrying out the calculations benefits have not been accounted for until one year after the implementation since it was not until then they reached status quo. These numbers are derived out of what we feel is relevant to the project and a conservative approach have been used.
Cost driver Improvement Annual gain
Total gain Explanation
Purchases One
warehouse shut down
1 MSEK 2,9 MSEK
Production Personnel 37 employees
less 14,8 MSEK 42,6 MSEK One employee costs
about 400000 SEK per year
Administration Personnel 2 employees
less 0,8 MSEK 2,3 MSEK One employee costs
about 400000 SEK per year
Total 16,6 MSEK 47,8 MSEK
Table10.1: Metrics for Company B’s ERP project derived from the benefit analysis
62
10.7. Learnings Company B mentioned that their approach for finding, deciding and buying a new system, worked out very well. By using a team of persons from different part within the organization for the evaluation process they gained approval through out the company. In between the team and the suppliers they used consultants, which also turned out well. Their top down approach during the implementation was also rather successful. With out that approach they would never have made the time limit, thus the main reason for buying a new system (Y2K) would have been a failure. They also changed their first approach to adopt the system to the organization to the contrary, which saved time and money. Company B experienced a common problem when allocating people to the project; should they put the most competent employees within the project or should they leave them outside. A major misjudgment was made for the data migration. In this area the cost became much higher than expected. This was because it took lots of consultant-hours to build up the migration systems. After several less successful attempts they decided to do the migration manually with temporary programmers. This way costs were much easier to anticipate. Company B also states, that if they would have had a chance to do it all again they would have started earlier in order to have a longer time limit.
10.8. Conclusion Company B is a typical ERP case but the difference is that the project has been a fairly profitable investment. They did the investment as a necessary evil but when examining the project more thorough benefits and positive changes are found. Benefits add up to 47.8 MSEK compared to 34.2 MSEK in costs due to significant lay-offs. On top of that is the alternative cost of 7.6-11.4 MSEK, which makes the investment look even better. These results have been accomplished with one year of “initial chock” before status quo was reached. Then the adaptations started to pay-off. What works even more in favor of the investment is that now when Company B has a lot of in-house knowledge and experience they are able to install SAP R/3 in their subsidiaries to a cost of 1% of the initial cost but still experience the same type of benefits. To conclude Company B is much better off since implementing SAP R/3, even though it came with a lot of hard work and tough changes.
63
11. Company C Company C is in the phase of choosing and buying an appropriate ERP system for their operations. Their preparing analysis is very thorough and extensive. This study is therefore of interest for the understanding of how, and on what grounds, the decision of obtaining a business system should be taken. The material is based on two interviews with the Project Manager of the ongoing ERP project.
11.1. Company Overview Company C group is a global manufacturing company with about 4,000 employees and revenue of 5-10 BSEK. The secrecy of the project restricts us from publishing more company specific information.
11.2. Company C Existing Business System Company C has 4000 employees, and 1800 of them are using some kind of computerized system in their work. Though, the existing system is a mess. It consists of a cluster of 16 independent systems functioning without any particular interaction, in different production units all over the world. Three ERP systems are used in several divisions and could be considered as base systems. These are Oracle, Mapics and Tolas/Maxcim, where the Tolas/Maxcim system has been adjusted internally to the extent that it could almost be called an own system. On top of the three base systems there are 13 smaller systems, of which two are internally produced. This situation has evolved partly from Company C strategy of growth by acquisitions, through which many alien systems have been introduced in the corporation. This is partly because the Company C group doesn’t have a coordinated IT-department and partly from the fact that the sub-divisions in Company C are relatively detached from one another and earlier there hasn’t been a business need for a common system for the whole company.
11.3. Changed Conditions The last years the situation has changed. The information flow between the different business areas has increased, and a common financial system for the entire business group, the first attempt to unite the corporate IT, was recently bought and implemented from Frango. This was an effect of the more incorporated organization, but it also increased the urge for cooperation and unanimity in other areas, such as order, purchase and invoicing. The implementation of the new Frango system raised many questions. Sub-divisions have to convert information manually from their local system to the new common finance unit. This is of course a great waste of time and people within the organization became aware of the need for an integrated business system, supporting all routines throughout the entire organization. With a new integrated ERP system, all data would be accessible to every division in the company at the same moment as it is inserted in a local production unit’s system.
64
Another reason is that two years ago, Company C started to integrate their purchases, and now they have come to a point where a supporting system is needed to gain all benefits and to complete the integration.
11.4. Defining the Need These and other factors have led Company C to the conclusion that a common ERP system is needed. Since November 2002, time and energy has been spent on mapping the IT-solutions within the company. The fact that this wasn’t known before tells us a lot about the current IT-situation in the company. In December 2002, when the staff had become more acquainted with the IT-environment, two questions were asked:
• Should Company C have one system for the entire company? • Is there a need for a major ERP system or would it be enough with a medium sized?
The answer to the first question is no, but the IT-environment must be consolidated in some way. Company C cannot go on using 16 different systems, but on the other hand the group isn’t integrated enough to motivate a single, major system for all business areas and divisions. The answer to the second question is also no. To implement a major ERP application would be overkill. To solve the existing problems, a medium sized system would do well. Nevertheless, 100 MSEK is budgeted for the ERP project within the forthcoming 10 years. Another important statement is that Company C is determined to adapt the company to the system and not the other way around.
11.5. System Evaluation To determine which ERP system is most suitable for Company C, the project group contacted various IT advisory firms: Forester, Gartner, Giga and the Swedish company DPU. Their task was to evaluate Company C requirements and match them with ERP providers. The model used in the evaluation process is constructed according to the following scheme:
1. Specification of basic conditions 2. Listing of four possible systems for further investigation 3. Sending of an inquiry of interest to the providers on the list 4. Comparison and sorting of responded inquiries 5. Presentations and demonstrations of the different systems for important persons within
Company C. 6. Invitation of tenders from the providers 7. Internal construction of a benefit analysis for the different systems 8. Comparison and system choice
At the moment Company C is at point 8. The first time we met the interviewee, they were at point 6, so it has been interesting to follow the final parts of the project. The rest of this case will be a description of the decision process, based on the model. Ultimately, an analysis of anticipated benefits will be presented. Point 1, 2, 3 and 4 In Mars 2003, Company C had determined a basic requirements list. Together with the IT advisory firms, four providers were distinguished from the rest. These were Oracle, Mapics,
65
IFS and Axapta. Company C then made a requirement specification and contacted these four ERP providers with an inquiry of interest. Point 5 and 6 From the beginning of April, these four systems have been examined and evaluated. Most important, two separate three days workshops were arranged, one in Europe and one in the US. Altogether 70 of Company C personnel attended. These were representatives of different departments in different subsidiaries and were divided into groups with respect to their areas of responsibility, i.e. production, distribution, sales etc. There was an anxiety that these workshops would result in dissonance and conflicts. What if there would be great differences of opinions? Fortunately, the misgivings were not realized. The participants in Europe and those in the US fairly agreed as well as the representatives of the different subsidiaries and departments. It was now up to the corporate governance to make the decision.
11.5.1. The Choice As said above, the choice is not yet made, but a lot indicates that Axapta from Microsoft will be the preferred system. The main reason is that Axapta operates in a Windows environment, while Oracle and Mapics operate in an Oracle and an IBM environment respectively. There is no internal competence in those areas within Company C and consultants would have to be employed and upgrades would have to be made, which would make the project a lot more expensive. Moreover, the Windows interface is recognized by almost everybody. This was emphasized by the workshop participants. It is well known that people show more confidence when working in a familiar environment. IFS, though, also offers a Windows environment and according to the Project Manager is the IFS software and applications superior to Axapta when performing most tasks. However, IFS’s financials are not in order and it is not certain that the company will exist in five years. Company C definitely doesn’t want to end up in a situation where they are stuck with software without support. The conclusion of this is that IFS is trapped in a vicious circle. If their financial situation had been better, Company C probably would have chosen their software, but as the situation is right now, the deal will most likely go to Axapta. When looking at the big picture the main benefits are the same for all systems. The difference lies on the cost side. It is not the price tag that differs though, the costs for software licenses and support services are about the same. It is the costs for upgrades and outsourcing that differs. The conclusion of this is that the choice of Axapta depends on that the Company C’ss present IT environment is more prepared for a Windows-based product, not that Axapta is a better system.
11.6. Planned Implementation The installation of the system will be conducted in two steps. First, as a pilot project, the system will be implemented in Sweden, Spain and China. This part will be finished by the end of 2003. Secondly, the system will be installed in North America. This implementation will be carried out in sequences by taking plant by plant, during the twelve month after the pilot project is finished.
66
11.7. Organizational Changes, Benefits and Costs All figures in this chapter are derived from the analysis of the Axapta application, while this is the most advantageous solution and the one emphasized by the top management. Besides, as mentioned earlier, the differences are not on the benefit side but on the cost side and originate from Company C’s unique situation and adjustment problems to some applications. Therefore, an analysis of all proposed systems is not of particular interest. Very important to mention is that all figures covers benefits and costs only from the implementation of Axapta in the largest division in North America and three other non-American plants. These make up about 70% of the largest division, i.e. about 50% of Company C. The ERP system will also be implemented in the rest of the company, but there are today neither figures for the anticipated cost reductions or the benefits. Both costs and benefits will be higher, that’s for sure, but to what extent is uncertain. It is projected that the additional costs and the additional benefits will be about the same. Therefore, this probably doesn’t affect whether the project is profitable or not. The final result would have been the same even if the entire implementation had been accounted for.
11.7.1. Organizational Changes Company C is in the middle of a Lean Production project, aiming to make the organization more process oriented. The installation of a new integrated business system could be seen as an extension of that project. It is therefore hard to distinguish which changes and benefits that should be assigned the Lean Production project and which should be credited the ERP system. This is a problem throughout this entire investment analysis but the effort is to be as just too both projects as possible. The major organizational changes that will be conducted due to the ERP system are:
• The IS/IT department will become centralized • The centralization of the purchase organization will be completed and replace the local
offices. • The finance and administration functions will become more integrated
Due to these changes, and to automation earned from the new ERP system, a reduction of personnel is expected in several departments. The table below specifies the projected dismisses: Department Number of dismisses Percent of staff
Accounts Payable 4 50% Customer Service 2 33% IT 5 18% Purchasing 2 14%
General Ledger and Credit and Collections 3 9% Table 11.1: Personnel reductions within Company C
11.7.2. Benefits The main benefits anticipated by the project group, are the following:
• Savings in purchase prices • Increased revenue from increased after-market sales due to improved CRM
67
• Personnel reductions in various areas For more detailed information see the benefit analysis in chapter 11.9.
11.7.3. Costs Initial costs The initial cost of the software and installation is 45 MSEK. Axapta takes on the risk of excess consultant requirement, and guarantees that the price is fixed. Initial costs are subdivided into the following categories:
In addition, 6,000-7,000 hours from internal personnel is projected. This is equivalent to about one year of four full time workers. Annual costs The total annual costs are about 4.1 MSEK and divided according to the following:
Total costs The total cost of the project with an estimated lifetime of five years and a capital cost of 10% becomes 60.5 MSEK. If the indirect cost of internal labor is included, the total costs become 62 MSEK.
11.8. Benefit analysis All figures are of course only expected savings, while the system not yet is in use. One should also remember that the benefit analysis only covers 50% of the total implementation.
11.8.1. Purchases Purchase prices By initiating EDI communications to the vendor database, manual communications will be eliminated and resources will be available for more time on vendor identification and negotiation. Furthermore will aggregated purchasing prop up vendor negotiations and result in lower purchase prices. This entry is most uncertain, and may turn out to be anything from 0% to 3%. To give it some consideration, a 0.5% lower prize benefit is accounted for. Personnel As a byproduct of freeing resources in the purchase department, administrative efficiencies will provide the opportunity to eliminate two mid-level positions. In the accounts payable department, a reduction of four employees will stem from switching to Evaluated Vendor Receipts (EVR), which will make the data entry function become unnecessary on all inventory receipts. Combined, six persons will be eliminated from the purchase department.
68
11.8.2. Inventories All inventory reductions are credited the Lean Production project, even though some of them most definitely hadn’t been possible without a supporting business system.
11.8.3. Production Most efficiency improvements within production are assigned the Lean Production project. There is one area though, that is credited the ERP system, and that is lower warranty costs and scrap avoidance. The reduction of scrap is supposed to be 3% out of 32 MSEK in warranty returns.
11.8.4. Sales Increased revenue Due to improved CRM, after-market sales are expected to increase. How much is uncertain and therefore a moderate estimate is an initial increase of the revenue from certain parts of after market sales by 0.5%, growing incrementally by 0.1 % per year, until stabilizing at 1% in year six. Customer service A reduction of two employees will be possible due to improved EDI integration.
11.8.5. Administration Invoicing Thanks to the automated routines, the ERP system will shorten the order-to-cash time with one week. Accounting Two persons will be dismissible because of the reduced reconciliation burden stemming from being on a single system in North America. Credit Originating partially from less reconciliation of multiple banks and invoice processing and partially from a more robust auto-cash program, one clerical position may be eliminated.
11.8.6. IS/IT Current software licenses The IS/IT costs taken in consideration here are the present license and support costs in Europe that will be affected by the implementation in North America. These are several smaller entries, some of them annual and some of them concentrated to a certain year. These costs will of course be exchanged for license costs for the new system and those costs are accounted for in chapter 7.8.3. Here only the present license costs are taken in concern. The sum of these small entries is 5.5 MSEK the first year and 3.5 MSEK in the future. Personnel Furthermore will the IT department be decreased by three persons in year two, one more in year three and finally another employee in year five.
69
11.9. Metrics of Potential Gains The figures in table 11.2 are the anticipated annual gains from the coming ERP system. The expected lifetime is assumed to be five years and the capital cost assumed to be 10%. Cost driver Improvement Annual gain
the best year Total gain Explanation
Purchases Lower purchase prices
A price reduction of 0,5 % is expected
5.6 MSEK 21.2 MSEK Total purchases is 1,120 MSEK
Personnel 6 employees will be
eliminated 2 MSEK 7.6 MSEK Company C figures of actual
salaries Production Scrap Avoidance 3% of scrap avoided 1 MSEK 3.8 MSEK Total warranty returns are 32
MSEK Sales Increased revenue
0,5 % the first year, increasing incrementally with 0,1% per year
7 MSEK 1.8 MSEK A part of after markets sales with annual revenue of 700 MSEK is accounted for.
Customer service A reduction of two
employees 0.8 MSEK 3 MSEK Company C figures of actual
by a week. 6.3 MSEK 23.7 MSEK 63 MSEK less capital tied up
in accounts receivables Accounting Two employees less 0.6 MSEK 2.3 MSEK Company C figures of actual
salaries Credit One employee less 0.4 MSEK 1.5 MSEK Company C figures of actual
salaries IS/IT Current license costs
15.1 MSEK Reduced by 5.5 MSEK the first year and by 3.5 MSEK the rest.
Personnel Integrated IT reduces
personnel by 5 2.9 MSEK 7 MSEK Company C figures of actual
salaries Total 24.5 MSEK 87 MSEK
Table 11.2: Metrics for Company C’s ERP project derived from the benefit analysis
70
11.10. Conclusions The primary figures indicate that Company C made a profitable decision by deciding to invest in an ERP system. Total benefits and alternative costs savings add up to 87 MSEK, while the total cost only will be 62 MSEK. The major entries are lower purchase prices and faster invoicing. This indicates that Company C at the moment doesn’t have solid financial control, and that the ERP system primarily will be used as an integrating instrument. The bad integration and company transparency was hinted earlier, when mentioning that Company C at the time of the ERP project start didn’t know the existing IT-situation within the company and therefore had to start the investment analysis by mapping the current IT-solutions. The project planning has been very well conducted though. The investment has not, as so often among other companies, been considered as a necessary evil but instead as an investment like any other, with demands on ROI. This is unique in our study and highly emphasized by us to be the right approach. Without an appropriate investment analysis and without a targeted goal of benefits and efficiencies, and also to end up in the money, the outcome is often rather disorganized and the costs intend to escalate. It is hard to tell what the future will bring and the outcome of this project is therefore uncertain, but our belief is that the project has good success potentials. The figures show that the possible profits are satisfying. Most important though, well-governed preparations indicate a well-organized project, and bad governance is often the major reason of ERP failure.
71
12. Company D Company D is an interesting research object since they chose to implement IFS as late as 2001. This gives a fresh picture of what has happened and what reasons the decision was based on. Another interesting aspect is that the system spans over five different subsidiaries with total revenue of 1,300 MSEK and 800 employees in four different Nordic countries. At Company D we met with the Director of Finance and Administration, who was head of the ERP control group.
12.1. Company Overview Company D is one of four legs in Company D’s business group. Company D business group is a multinational engineering technology group with the long-term ambition of positioning itself as number one or number two within its strategic sectors. Current revenue amounts to more than 7 BSEK. Within the group the subsidiaries work rather independent and the strength of the organization is the large network. The Company D business area comprises 24 operational subsidiaries, which are active in the Nordic and Baltic regions. Total revenue is around 2.5 BSEK and they have approximately 1,350 employees. The companies all have a local presence, with specialist technical competence, strong product ranges and proximity to the customer as the foremost strategies. The subsidiaries’ products and services encompass everything from components and systems to after-market service. Operations are based on a high level of skills and long experience within each respective specialist area. The company has grown substantially over the last couple of years, which is illustrated by the diagram below. The main reason for the revenue growth was a major acquisition in 2000 of five subsidiaries from a Danish competitor. It was also this event that raised the question for a new system.
12.2. The Acquisition In 2000, Company D acquired five subsidiaries from a Danish conglomerate. Together these five companies generated revenue of 1,200 MSEK and were located in Sweden, Denmark, Finland and Norway. These countries were also their main markets along with the Baltic region.
12.2.1. The Former System Within these companies there was an in-house developed ERP system that had been developed under the Danish company’s centralized IT strategy. The system was working well but because of the old technology it was extremely expensive to run and maintain (around 15
72
MSEK per year). That cost came with the acquisition and since Company D wasn’t keen on sustaining such a high ERP cost they decided to invest in a new system. This meant that time became an issue since the Danish company only had guaranteed to run the system until Feb, 2001. As a result, Company D had to find and implement a totally new ERP system before that date.
12.3. The New System As Company D began to look for a new system they set up a list of requirements. The most important was to find a standard solution with as little modification as possible. They also didn’t want to handle the maintenance or operations themselves. If possible the hardware should be leased as well or as the Director of Finance and Administration said: - “The goal was to make the companies as streamlined as possible in order to avoid all obstacles and to make them more similar”. It is important to understand the complexity of these five companies in order to grasp the problems Company D was facing. Of the five companies’ total revenue one third comes from in-house produced components, one third from retailing of purchased components and one third from systems built by own and purchased components. This puts a lot of demand on the system and its capacity to store old data.
12.3.1. The Decision Process A project group was formed, consisting of one person from each company to evaluate the market and then recommend three main candidates. These candidates then had to answer the specification of demands. Then a group consisting of all the CEOs from the subsidiaries and some personnel from the head quarter gathered and made up their minds. As it turned out, IFS was both the best fit and gave the best economy. IFS’s system was complex enough to handle the five companies’ differences and all modules were brought in. The decision was taken in August 2000 after three months of evaluation. The implementation took seven months compared to the estimated six and was carried out by a big bang. When looking at the financial sides of the investment, Company D felt that the alternative cost was significant enough to motivate that this new investment could be included in the acquisition of the five new subsidiaries. This decision made it easier for them to motivate the financial aspects of the ERP purchase.
12.3.2. Expectations Company D did not have any great expectations except that they wanted to end up with a lower cost than the old system incurred.
12.4. Organizational Changes, Benefits and Costs It is important to understand the cost structure of Company D to fully understand where cost
Material and Inbound Logistics
Depreciations
Direct Costs
Costs of Production
15-20%
55%
20-25%
73
savings can be done. The cost of production is outlined in the picture below. As the picture shows most costs are related to the purchase side and the machinery. Their overhead costs are extremely low with only five to ten persons working in the head quarters. Within the different companies the amount of articles varies substantially with a peak of 100,000 articles in the Finish subsidiary. The production consists on an average of five to six levels and depends on how standardized the order is. It is also within the standardized production areas that Company D is process oriented.
12.4.1. Organizational Changes Company D has made some changes within their Norwegian and Danish subsidiaries. These changes were partly due to the system and consist of: The logistics and purchase departments have been integrated into each business area instead of working independently as support activities. This has been feasible since with the new system less time had to be consumed for purchases and logistics and more time could be put into strategy and business activities.
12.4.2. Benefits When talking to the Director of Finance and Administration, he said that their expectations of improvements not were that extensive since the old system was working well. The major problem was that it came with such a huge cost. They did however expect to cut some personnel. When we did some further analyzing, we discovered other benefits. These were in short:
• Less capital tied up throughout the value chain • Less transportation costs • Better delivery time accuracy
In the benefit analysis these will be explained further.
12.4.3. Costs Company D’s total cost for the ERP project ended up with 30 MSEK compared to the projected cost of 15 MSEK. This cost was spread out on the following things:
• Original software costs and education costs: 10 MSEK • Software adjustment costs and consultant costs: 15 MSEK • Migration costs: 5 MSEK
On top of these costs are the annual costs, including the licensing cost and the operations and maintenance cost. The latter is however outsourced. The licensing cost is 2 MSEK per year and the combined second is 3.4 MSEK per year. When looking at these numbers it is relevant to know that there currently are 600 users. To understand the total amount we discounted all these costs back to 2001 and they then added up to a total of 50.5 MSEK. This should be compared to the alternative cost savings that added up to 56.9 MSEK. On top of that are the benefits that will be discussed in the next section. Internal cost Company D also had to use internal manpower for the project. They assigned one person to work fulltime and five persons to work halftime during the whole period of ten months. This
74
adds up to about 5,000-6,000 man-hours and on top of that comes all the indirect work, which consists of the time other employees within Company D have spent on the project.
12.5. Benefit Analysis Looking at the benefits due to the system it is important to understand that these benefits have emerged gradually and might continue to grow. When identifying benefits, we have taken into account both direct benefits derived from the new system, as well as indirect benefits due to changes within the company that the new system have made feasible. The reason for this is our belief that a new system cannot be regarded as a new “photo copier”, but should rather be looked at as a helping strategic tool.
12.5.1. Purchases Within purchases Company D has decreased personnel with 10%. This means two to three persons out of 25. This is an effect caused by a greater efficiency due to the system. They have however not experienced any lower purchase prices but as they do not have a centralized purchase department due to varying orders, this may be the explanation. This is the area where Company D feels they have made the most benefits.
12.5.2. Inbound and Outbound Inventories Inventory levels Company D has noticed a decrease in capital tied up with 10% in inventories due to a better inventory priority system. Transportation costs They have also improved their logistics and hereby lowered their transportation costs with 10% as well. Personnel Personnel have decreased by 10%, which means five persons. This is because new routines and more efficient ways of working have made it possible to decrease the staff. Due to improved routines in purchases and a more justifying picture through out the organization Company D has experienced less spoilage. Their order administration has become less efficient with the new system and as a result it has become more time consuming.
12.5.3. Production Within the production, Company D feels that not much have changed. The old system was working as well as the new one and improvements are hard to determine. Because their production is so varying it is hard to use the information as a strategic tool, which can be one of the reason they have not seen many improvements within production. They have however improved the service in areas dealing with standardized products because of the more extensive use of barcodes
12.5.4. Sales With the new system a CRM module was brought in. This helped improve sales in a number of areas. Customer follow-up was improved as well as delivery time accuracy. Though, statistics became worse due to a misfit in IFS Applications. The improved delivery time
75
accuracy is in part a result of the new system but is very dependant on Company D’s suppliers.
12.5.5. Administration This part was already working well with the old system and no new benefits have so far been recognized.
12.6. Metrics of Potential Gains In table 8.1 below, the improvements identified in the benefit analysis are transformed into pure money. For each element, annual gain is computed, wherefrom the total gain is derived by discounting for five years with a discount rate of 10%. These numbers are derived out of what we feel is relevant to the project and a conservative approach have been used. Cost driver Improvement Annual gain
the best year Total gain Explanation
Purchases
Personnel 2-3
employees less
0.8-1.2 MSEK 3-4.5 MSEK One employee costs about 400000 SEK per year
Inventories Inventory level 10% less
capital tied up 3.2 MSEK 12.1 MSEK Capital tied up in
ingoing and outgoing inventories is 320 MSEK
Transportation 10%
decrease 5-6 MSEK 19-22.7 MSEK Transportation
costs of 50-60 MSEK
Personnel 5 employees
less 2 MSEK 7.6 MSEK One employee
costs about 400000 SEK per year
Total 11-12.4 MSEK 41.7-46.9 MSEK
Table 12.1: Metrics for Company D’s ERP-project derived from the benefit analysis
12.7. Learnings Company D mentions that it is important to keep the timeframe. This was achieved by for every module having one responsible person from each subsidiary as well as having management gain approval for the whole project. The result was that the learning process experienced less friction.
76
A major misjudgment was made for the data migration. In this area the cost became 20 times higher than expected. This was due to a lot of consultant costs to build up migration systems instead of just using manual migration with temporary programmers. There should also have been a better determination on what information that was necessary to migrate. Another area in which Company D feels they could have saved time and money is the software adjustments. A lot of adjustments where made but never used. In most cases these adjustments would not have been necessary once people became used to the system and found other ways around the problem. Furthermore, a lot of costs evolve that fall in between the buyer and the supplier as the project goes on. If it is not specified who should take those costs you end up with many time-consuming discussions and frustration, which slows down the project.
12.8. Conclusion When taking a first look at Company D’s investment in IFS Applications it seems like it did not turn out that well. Total costs were 50.5 MSEK compared to benefits of 41.7-46.9 MSEK. But when including the alternative cost saving of 56.9 MSEK the investment becomes more attractive. It then has a return of approximately 100%, which would be a fair evaluation since the benefits would not have come up without the new system. As it turned out Company D made the right decision and also managed to pull it through within the projected time. They made two major mistakes, which became costly:
1. Too many adjustments in the system 2. A too optimistic estimate of the migration cost caused by inefficient migration
practices. These misjudgments made the project more expensive than expected and without the huge alternative cost they would have been the difference between a gain and a loss.
77
13. Company E Company E is an interesting case since they implemented an ERP system on a global basis, which was interfered with a large acquisition that almost doubled the revenue. This made them spend an enormous amount of money (15% of the total revenue) on a project that was seen as a necessary evil and when interviewing them, their opinion is that the project was fairly successful. Our task was to digest the limited amount of information we had received and determine whether or not this was the only way to go. At Company E we met with their CIO.
13.1. Company overview Company E was established as an independent company in the late nineties, through an acquisition and merger of two clinical divisions from two well-known Nordic companies. Company E has over the last years built up a strong corporate brand name in the professional health care sector. Their products are in short everything that is green or blue in the surgical room. At the time the company had about ten factories and a number of subcontractors, but in spite of a strong European market position, it was operating at low capacity and in a loss position. The business was organized in two divisions, Surgical Products and Wound Management Products. All sales and local marketing was carried out through some twenty sales companies in Europe and North America, the latter only offering the wound management assortment. In 2001, after a couple of years of reconstruction, consolidation and strategic development Company E took a major step with the acquisition of a new surgical products division. The acquisition almost doubled the size of the company since the new business had a yearly turnover of approximately 2,000 MSEK and 3,000 employees. Today Company E comprises two business areas – Surgical and Wound Care, two Sales Operation organizations – USA and Europe/Rest of the world – one central organization for Global Supply, including customer service and distribution and four staff functions:
• Finance • Quality and Regulatory Affairs • Human Resources • Corporate Communications
Total annual sales are at present about MSEK 5.000 and the company has approximately 4,000 employees.
13.1.1. Global Supply and IT Global Supply & IT is a central operative function with total responsibility for the company’s production planning, logistics, procurement and IT. Warehousing and transport are run through third-party arrangements in all markets. In Europe, the partner chosen was the German company, T.D. Logistics. In North America a similar arrangement was reached with UPS Logistics. UPS also assumes responsibility for customer service and administrative support. The IT department, within Global Supply, is responsible for the structure of the company’s information technology and for its operation and security and the development of IT strategy.
78
13.1.2. Capital Structure As mentioned earlier, Company E has around 3,300 workers involved in production. This means that their major cost consists of direct labor and materials. Looking at the financial statement from 2002, cost of goods sold compromises 61% of net sales. The distribution between direct labor and materials is unknown but a reasonable guess would be that the main cost comes from materials and manufacturing costs since most of the production is carried out in low wage countries. Sales, administration and R&D expenses comprised 33% of net sales. Out of this, sales and administration contributed respectively with 50% and 45%. Thus, it seems like there are some potential opportunities to save in those areas.
13.2. ERP System Background Company E began looking at a major ERP project when the division was sold of from the previous parent company. They previously used the parent company’s mainframe but they received a deadline of 4 more years, after which their IT solution would have to stand on its own feet. This meant that they had to begin from scratch, without any technical background to fall back on as well as no back up system if anything went wrong. Another issue was the red numbers Company E reported. With the new IT strategy these numbers were supposed to turn to black.
13.3. The New System As Company E realized that they had to commence a major ERP project they realized they were in need of a solid project leader. Therefore they recruited their present CIO from PricewaterhouseCoopers during the spring of 2001.
13.3.1. Expectations and Choice To begin with, Company E hired consultants from Accenture to help them develop a suitable IT strategy that would help them chose the right ERP supplier. The strategy mainly focused on the following issues:
• Integrate business units • Integrate geographically separated markets • Ambitions to lead the development • Restructure the organization • Simplify future acquisitions
Five main candidates were chosen and those were: Oracle, JD Edwards, Intentia, IFS and SAP. At the same time Company E was evaluating which partner to choose during the implementation and here the decision fell on Cap Gemini. An important aspect here was the partner’s financial position. By coincidence Company E’s previous parent company was also on its way to change ERP system and when they decided to go with SAP R/3, Company E decided to run a blue print with SAP. When that turned out well, they made their choice, primarily because they saw a chance to take a free ride through their previous parent company. The decision was taken by top management and the end users did not have a say during the selection process. This was intentional, since there were time constraints and since the project was on global basis everyone would never have been satisfied. They decided to go with all modules except
79
production planning since they had a global supply chain and the system would not be able to handle that. As implementation consultants Cap Gemini was chosen.
13.3.2. The Implementation A pilot was initiated during the summer of 2001 in Sweden and was successful. They then used a franchising strategy to role out the system market by market. Before the year was over Company E had implemented SAP R/3 in all of the Nordic countries. As the European market was on hand, a major event took place, the acquisition of the new surgical products division. This meant that Company E almost doubled the size of the company in terms of revenue, from 2,500 MSEK to 5,000 MSEK. Employees increased from 1,900 to 5,000 and 70 new markets were brought in. On top of that the new division had to be integrated within one year in terms of IT infrastructure, since that was the new division’s previous owner’s deadline. The outcome was that the implementation had to be faster than planned, which meant that more money and more consultants had to be used. During the fall of 2001, Company E had 120 consultants working full time together with the global IT department consisting of 60 employees. By working area by area they managed to make the deadline. Finally they had implemented SAP R/3 in 24 countries, to 1,200 end users, in 12 months at the enormous cost of 350 MSEK.
13.3.3. Problems From the beginning, Company E took a crucial decision and that was to change the company in order to fit the system. This meant that a lot of technical issues were overridden and instead there were issues within the organization that had to be solved. The business processes had to be changed and since there was a time shortage, lots of users did not immediately fully grasp the new way of working. Another problem that arose due to the acquisition was that the project changed from a European focus to a global. For example, this meant that once a month the production unit in Mexico cannot run SAP since the batches are running in Europe. There is also an issue with security back up files. The biggest problem is however the huge costs that comes with the system. This will be explained further later on.
13.4. Organizational Changes, Benefits and Costs The biggest changes have been within the IT departments. Today two-thirds of the IT-operations are run in-house and the rest is outsourced. Other than that, the CIO did not mention any more changes. It is, however, evident that the total number of employees has decreased significantly by just looking at the annual report. It is however hard to determine how much of that rationalization the ERP system have made feasible.
80
13.4.1. Benefits Because of lack of information and an unwillingness to further collaborate with us, benefits have been hard to quantify and therefore the usual benefit analysis won’t be derived. Instead a more qualitative benefit analysis will be presented below. The major benefits, according to the CIO, have been within administration. Due to the new system, transparency has increased, thus efficiency has improved. Order management and purchases have improved due to the increased information flow. Within production, benefits can be found in all areas but no numbers were given. This means less capital tied up and improved order-to-cash. When interviewing Company E they basically agreed that most areas had seen an improvement but were very careful when it came to numbers.
13.4.2. Costs Regarding costs, Company E has spent a significant amount of money on their new system. The initial cost was 350 MSEK and 100,000 man-hours compared to the stated expected cost of 300 MSEK. Out of this 22 MSEK were spent on flight tickets alone and the data migration had a total cost of 40 MSEK. The consultant cost was never defined but since they had 120 consultants for a longer period one can assume that a large quantity can be allotted to that area. The actual software cost probably just made up a small fraction of the initial cost. Today they have running costs of 50,000 SEK to 95,000 SEK per user. By taking an average, this adds up to approximately 87 MSEK per year. This cost will probably decrease the more users they are able to integrate. The total project cost becomes 670 MSEK.
13.5. Learnings Company E points out a couple of areas where they learned how to proceed and some areas where they made misjudgments. These are the following:
• Due to time limitations, the end-users lacked competency in understanding the business processes.
• It is important to negotiate the warranty period. It should carry on as long as possible, and at least for two annual financial statements, since it is not until you run the system live that problems will occur.
• When running global projects, it is important to have a global implementation partner with local consultants. This provides goodwill locally, decreases travel expenses and comes with less local conflicts since they know the terrain.
• It is important not to underestimate the hidden costs. It’s usually those costs that undermine the budget.
• Make sure to have top management support, otherwise you are likely not to finish in the money or on time.
81
13.6. Conclusions Company E was put in a unique position when they were sold off from their previous parent company in the late nineties. Their decision to start up an ERP project was correct but why did it take so long to get going? The project did not commence until the beginning of 2001 and then they had to rush just to finish it in time. This suggests poor planning and strategic intentions. Because of the major acquisition of a new surgical products division in 2001, Company E was forced to even further speed up the implementation. When looking at their project in the rearview mirror it is hard to understand how they can claim it to be successful. The main reasons for this criticism comes first from their unwillingness to give us more precise numbers on incurred benefits and secondly, when benchmarking their investment over net sales to comparables they are way out of the ballpark. It seems like their cost control did not exist and that becomes more evident when they admit that they did not make a capital investment appraisal, which would be more than reasonable when the investment comes at a cost of almost 15% of net sales and 100,000 man-hours were used on top of that.
82
14. Company F Company F is the representative of the chemical technology industry in this thesis. They are chosen as a research object because it is our belief that a broad spectrum of industries enriches the reliability of the study and increases the utility areas. Company F’s focus on chemical technology production makes them different from the other companies in the study and, as we shall see, the differences affect the conditions and the demands on the ERP system. The information is based on an interview with the Head of Corporate IT and chief of the ERP project.
14.1 Company Overview Company F is a well-established player in the chemical technology industry but in their present business group, they are newcomers. It wasn’t until the beginning of 2001 that Company F was included. The business group consists of five business areas, among which Company F is one. Company F has revenue of 2 BSEK, about one third of the business group’s total revenue. For a more detailed model of the different business areas and their ERP systems see figure 14.1.
Figure 14.1: Company F’s business group – organization scheme and ERP systems
14.1.1. Production Complexity Company F produces chemical substances and the production is most simple. Raw materials enter the factory through pipelines, where they are mixed and refined, and the final products are chemicals ready to be tapped into tankers. Thus, there is no inbound logistics at all since all raw materials go into production at the same time they enter the factory plant.
83
There is no use for production planning, since it is more profitable to just let the factory run at 100% and instead put effort in selling the finished products. The buyer structure is mainly large contract customers in Europe and some other temporary smaller customers in Europe and North America. If there is excess production, the products are simply price dumped and sold to temporary customers in Asia. There is always a demand; it is only a matter of price. This simplicity of the production leads to consequences for the demands on the ERP system, which will be discussed later on.
14.1.2. Capital Structure The capital structure is very heavy on raw materials. 70% of the total costs come from raw material, 10% come from transports and the rest are direct costs such as personnel and machinery. It is therefore hard for Company F to lower their costs since they are very dependant on the purchase price. The raw material prices are of course negotiable, but the situation would not be improved by a new ERP system. Price comparison isn’t applicable since it is always more profitable, for all parts, if the pipeline connection to the local raw material manufacturers is used. Transportations are not an in-house activity and there are no possibilities to make any profits in that section.
14.1.3. The ERP Systems Used by Company F’s business group Company F uses Oracle, but the rest of the Company F’s business group use mainly Invensus/Prism. This is a result of that Company F wasn’t incorporated until the beginning of 2001. Since the research object of this study is the Company F subsidiary, this case study will focus on the Oracle system, but first we’re going to look at the previous system in Company F.
14.2. The Previous System Before Oracle, a system called Daim was used. It was an old administration system descending from the beginning of the eighties. The system mainly comprised order book, inventories management and basic accounting. There were obvious weaknesses in purchases, production, finance and administration. On top of these things, Daim wasn’t Y2K secure.
14.3. The New System
14.3.1. Expectations and Choice In 1996, the top management officially stated the need for a new business system. The primary goals were to:
• Cut the financial statement time by half • Streamline the order department by direct invoicing and other improvements.
Surprisingly, there were no expectations to cut personnel. The extra time gained from the efficiency was used to give employees more personal responsibility.
• Increased transparency making cross-references a lot easier In the beginning of 1997, after 12 months of preparation studies, Company F decided to buy a system called BPCS/SSA. The former parent company though, rejected the proposition and
84
decided to buy Oracle instead. The motivation was to make Oracle the common ERP system in the business group. All modules in Oracle were included, from purchases to invoicing through the entire production line, and all finance and administration applications. This was a major overkill, which will be explained later on.
14.3.2. The Implementation Before the initiation of the project, another preparation study was conducted. It took about four months and commenced in May 1997. In September the actual project started and in November 1998 the system implementation was almost complete. Since Company F exercised a Slam-dunk strategy, only the most important modules were executed initially. The rest were phased in gradually. Not until October 1999, dangerously close to the new millennium, the entire system was integrated.
14.3.3. Problems There were many technical issues in the beginning. Especially the accounting system generated problems. This was Company F’s own fault, since they insisted of making it extremely complex, not listening to Oracle’s objections. The complexity has, besides draining funds, made the accounting system less user friendly. Another issue that initially wasn’t regarded as a problem but definitely showed up to be, is that the ERP system showed up to be oversized. A lot of the modules installed have never been used, such as the entire production planning application and also to some extent the inventories module. This implies that a lot of the money thrown in the project was invested in vain. Company F bought, on order from the former parent company’s management, an all integrated ERP system, but uses it as a financial and administration aid. A great waste of time and money.
14.4. Organizational Changes, Benefits and Costs
14.4.1. Organizational Changes There have been some efficiency improvements in the sales organization. Before, all contacts between the factory and the customers were managed by the sales department. Today, the sales department only arranges the contacts and closes the deals. Finance and administration issues are handled by the factory without any intervention of any third party as figure 14.2 shows.
Production facility
Sales office
BuyerInvoice Invoice
Order Order
Product
Before ERP
Production facility
Sales office
Buyer
Product
Contact
Invoice
Order
After ERP
Figure 14.2: Organizational changes in Company F
85
Generally, most organizational changes have occurred due to the new ERP system, but without intentional corporate governance. The intention was to not change the organization, but since the implementation generated such big problems, Company F became forced to make some changes.
14.4.2. Benefits Because of a shortage of project information and numbers from Company F, the usual benefit analysis won’t be performed. All benefit will instead be presented in this section, albeit often without numeric figures. The major benefits from the ERP system are:
• Reduced time order-to-cash, because of better control. • The financial statement time has been cut by two thirds, from 15 days to 5 days. • Better control over the sales organization. • Three sales assistants have been made redundant. • Lots of manual routines have become automatic. • More personal responsibility among employees, especially in administration.
14.4.3. Costs The cost of the ERP implementation is unfortunately unknown because the ERP project was divided into several smaller projects and there are today no compiled figures. Another reason to the deficiency of information is the acquisition of Company F in 1999. IT-costs have risen, that is a fact, but to what extent is uncertain because some activities that previously weren’t posted as IT-costs are today allocated to the IT-department.
14.5. Learnings Some major mistakes have definitely been made during this implementation. Apart from the fact that the system was over-dimensioned the following issues have been identified:
• Double-check with the parent company for guidelines and demands. Why spend almost a year in preparations and decision planning, when the decision is taken over the heads of the project group anyway? Ensure what the new corporate IT strategy will be, and understand the intentions with the project.
• Do not tailor-make the ERP system to a great extent. It is very expensive and besides, it doesn’t always make the system more effective or easier to work with.
• Do not lay all attention on the technical parts and the implementation. Remember that it is the end users who will use the system in their daily work. As a matter of fact, it is their work that is supposed to be made easier and more effective.
• Company F claimed they suffered from weak management commitment. It is very important that a project of such dignity has strong management support in order to finish on time or in the money.
• The interviewee, the Head of Corporate IT, is being very honest and admits that her position as head of the project was too much responsibility for her at the time. It was her first experience as a project leader and such an important project should have a more seasoned management.
86
14.6. Conclusions Company F was indeed forced to change the business system, but the system of choice didn’t match their actual needs. They bought a system constructed for a company with challenging production and inventory planning problems, which is not Company F’s situation. The decision was a result of being forced into an IT-environment by their former parent company, the same parent company that later decided to sell Company F during the implementation. Moreover, Company F tried to tailor-make the system too much, not only making it costly but also making it complex to work with. They put too much focus on the technical parts and neglected the systems end users. In combination with an unengaged management and an inexperienced project leader, the venture became an entertainment park for enthusiastic IT consultants and programmers in too big suits. Benefits have of course been recognized, but those would also have been realized with a smaller system. The main conclusion would be that if your organization isn’t very complex, it is better to keep the system simple and focus on more important issues, i.e. personnel education and organizational improvements.
87
15. Company G Company G is chosen as a research object due to that the company has recently, for the Swedish, Finnish, Norwegian and the Baltic States markets, bought and implemented an integrated ERP system from SAP. The information is principally derived from interviews with the Production Director and the Finance Director, but some information originates from a telephone interview with the IT Manager.
15.1. Company Overview Company G’s business group consists of two business areas. The business group’s total revenue is 11 BSEK, and the company employs 6,500 people. Company G focuses on metal gear production for a broad range of application areas, such as cars, trucks, ships and trains and construction equipment. The other division is working the same industries but supplies other products. Their relative sizes, and their customer groups are illustrated in figure 15.1 below:
Figure 15.1: Company G’s customer groups and their relative sizes
Most of Company G’s production plants are situated in Europe, but production also occurs in the US and in Asia. The sales markets are also distributed in similar proportions. See figure 15.2.
Figure 15.2: Company G’s markets and their relative sizes
The research object in this study, Company G’s sites in Sweden, Finland, Norway and the Baltic States, has revenue of 2,500 MSEK and 1,400 employees. In 1999, SAP R/3 was bought and implemented.
88
15.2. Company G’s Previous Business System Company G’s previous business system was not one, but many small internally developed, non-integrated units. The systems were in need of supervision by staff, which made them slow and time consuming. However, and this is important to remember, a smaller system is more forgiving with human errors. Wrong data is detected earlier and not forwarded down the production line. The systems were also very individual oriented. Every production unit was considered as a single element, responsible for its own profitability. Effectiveness was evaluated down to the level of every single machine. This visibility made it possible for all employees to know their place in the organization and to understand the concept and the importance of profitability. The Company G management was very proud of this understanding of basic corporate finance down to the lowest level and they even considered it to be one of Company G’s core competences. This was to become the greatest problem when the new system should be implemented.
15.2.1. An Urge for Something New In the late nineties Company G realized that something had to be done about their supporting software. The decentralized computer landscape, consisting of several independent islands, was becoming more and more out-of-date. Even more important, the new millennium was edging closer and Company G wasn’t prepared for the Y2K bugs. They decided to buy a completely new business system, a totally integrated ERP solution, to replace their legacy one. The new system’s main task was to improve or solve the following issues, listed in order of descending importance:
• The Y2K problems • Production line improvement • Customer and supplier relationships • Standardize computer systems • Integrate business units
15.2.2. The Decision Process A project group, consisting of managers and consultants, was formed. To the given goals stated above, the group added some objectives of more strategic matter. These were concerned with future system improvement, stability and reliability:
• The system had to be delivered by a big reliable business system supplier • A small system wasn’t sufficient, all modules should exist and should be included • Because of the scarcity of consultants due to the proximity to year 2000, it was
considered extremely important that the supplier could guarantee consultant support. Another important aspect was to keep hold of the current organization structure, i.e. the independent production units described earlier. That structure was, and still is one of Company G’s core competences, highly emphasized by the corporate governance. It was something that by all means could not be affected. In other areas the management was more flexible. They realized that in some areas gains could be made from changing the organization, even though the old structure should be more or less intact. One main statement was to not change the system to a high degree, because of the additional cost usually involved in such an operation. The consultants involved, PricewaterhouseCoopers, also strongly stressed that the company should be adjusted to the
89
system and not the other way around. Therefore, Company G experienced a conflict of interests. They wanted to keep their old organizational structure but still not change the system. This means that the system had to be flexible. Thus, flexibility became another important characteristic for the system to be chosen.
15.3. Company G’s New System
15.3.1. The Choice Three system suppliers were distinguished from the rest: SAP, Intentia and Baan. Of them the SAP R/3 system was considered outstanding. SAP met all the primary demands described earlier: strong company, development resources, all modules included and many skilled consultants available. Flexibility could be offered due to a broad range of functions within the system as the Production Director expresses it: “In the SAP R/3 application a certain operation could be made in 20 different ways, where the Intentia Movex system offered only five options. The probability that we could find suitable routines with SAP was a lot higher”.
15.3.2. Expectations The expectations, however, were still not particularly high, or as the Finance Director expressed it; “realistic”. The management had no expectations of any extensive changes or production improvements. The project did not have an anticipated positive cash flow, but was considered as a necessary evil. Something just had to be done before the millennium, and it was allowed to come with a cost.
15.3.3. The Implementation The implementation became a lot more costly than expected. The legendary factor π made its presence and in 1999, at the end of the project, the actual expenditures ended up about three times more than anticipated. Also, severe issues occurred during the first month after going live. All anticipated improvements had to be postponed by at least a year. It took about 12 month until Company G’s production was back at status quo. The main reason was the broad changes performed when tailor-making SAP R/3 to the complex organization structure. Company G decided to adapt the system, in order to keep their independent production units structure, which was considered as a core competence. Still, v G is confident that their decision in making these adjustments was correct. Actually, the Production Director proudly points out, the supplier SAP became so interested in Company G’s improvements, that they are now interested in taking part of the results for the future development of the R/3 software. With time though, Company G lightened their demands on an intact organizational structure and eventually adjusted the organization a lot more than they originally intended.
15.4. Organizational Changes, Benefits and Costs Company G’s production is categorized by a huge flow of materials and semi-finished products within a factory unit. 100,000 articles are available for sale. The main cost driver in production is material and inbound logistics, as shown in the production cost structure scheme to the right.
90
The company has not enabled process-oriented production, but uses separate cells and production units responsible for their part of the production. Still, the company is fairly hierarchic, controlled by the top management through strict levels of command. Nevertheless, the management seems interested in process-orientation, but feels unconfident in finding enough skilled personnel in the part of the country in which they are operating. Actually, a lot of organizational improvement opportunities have been identified due to SAP R/3, but only a few have yet been implemented.
15.4.1. Organizational Changes What has happened is that two plants, with a total of 110 employees, were shut down in the end of 2001. Of them, 40-50 employees were made superfluous as a direct effect of SAP R/3. Other Company G units have, without any recess in production, overtaken the production from these plants. Furthermore, personnel have been redirected within the corporation, mainly from the planning department to sales, where more people now are needed due to the increased importance of primary data quality. The IT staff has increased by four persons, i.e. 20%. Altogether, apart from the closed factory plants, the number of employees is about the same. What has been gained in the planning department has been lost to sales and IT.
15.4.2. Benefits The main benefits detected by the management are:
• Better balance control • Improved logistics
Though, when analysed further, many more cost reductions and quality improvements were identified. These will be presented in the benefit analysis in chapter 15.6. A summary of the main benefits gained follows below:
• Better productivity has led to reduction in personnel • Lower inventories and an expected decrease in production cycle time reduce capital
tied up in these areas. • Quicker invoicing reduces capital tied up in accounts receivables
15.4.3. Costs The total cost of the SAP R/3 implementation finished around 100MSEK. These were divided in the following categories:
• Original software costs: 30 MSEK • Software adjustment costs: 40 MSEK • End user education costs: 10 MSEK • Information migration costs: 10 MSEK • Consultant costs other than the entries above: 10 MSEK
Personnel
Material and Inbound Logistics
Depreciations
Other costs
Cost of Production
10%
15-20%
50%
20-25%
91
In addition, annual costs are about 3 MSEK. These are divided as follows:
• Software licences: 2 MSEK • Support fees: 1 MSEK
If discounted back to 1999, the annual costs amounts to about 11 MSEK. Together with the initial cost, the total cost is about 110 MSEK. Apart from the IT-costs, the management claims that administration costs have risen, especially in sales, because of the demand for more detailed primary data.
15.5. Benefit Analysis Doing the analysis we have taken into account both direct benefits derived from the new system as well as indirect benefits, due to changes within the company that the new system have made feasible. The reason for this is our belief that a new system cannot be regarded as a new tool, but should rather be looked at as a new helping strategic device.
15.5.1. Purchases No savings have occurred in the purchase area. This is because the main part of the purchases is bulk metal. The price is strictly determined by the London Raw Materials Exchange and moreover is the purchase prices negotiated on executive level by the parent company, with no opportunity for Company G Scandinavia and the Baltic States to interact.
15.5.2. Inbound Inventories Inventory level Due to better balance control, inbound inventories have dropped 10-15% to about 90 MSEK. In addition, another 100 MSEK is tied up in semi-finished product stock. Inventory takings Better balance control has reduced the time necessary for making inventories with 75-90%, from 30-40 labour days/year to four labour days a year.
15.5.3. Production Production cycle time So far the cycle time hasn’t been improved, but a decrease of about 50% is anticipated in the future. Today the production cycle time is about five to six weeks and about 100 MSEK is tied up in production. Workforce productivity The annual growth of productivity has increased from 5% to about 6-7%. Delivery time accuracy The on-time delivery rate has not yet risen to the anticipated levels. Today, the rate is 88%, which is about the same as before the ERP-system, but the rate is expected to rise to 95% when all processes are adjusted. The change from 88% to 95% doesn’t seem to be a big deal, but is an improvement by 60% of late deliveries. However, there have been severe problems. When the system was newly implemented, the on-time deliveries fell to as low as 65%.
92
Personnel Altogether, about 40-50 employees have been made redundant only because of the ERP-system. These are taken from all across the organization. The planning department, however, has been decreased with about 50% thanks to improved forecast instruments.
15.5.4. Outbound Inventories Market demands have made it impossible to reduce outbound inventories and it is not really necessary since Company G runs almost all production to order.
15.5.5. Sales In sales, another support system than SAP R/3 is utilized. Forecasting The SAP R/3 is however used as sales forecast instrument. As such, it is very appreciated and considered to have significantly improved the prognoses. The forecasts are now updated each month, and are more reliable due to closer customer contacts and profiles. Personnel The sales department has been increased since the implementation of SAP R/3. This is because the demand for more accurate and more detailed information has boosted. Wrong data has become more serious, because in an integrated system, information is not checked manually. What goes in the system in one end comes out the same in another. Therefore, primary data quality has become more important and because it is the sales department that enters most of the data, a larger team is now needed.
15.5.6. Administration Invoicing Due to SAP R/3, the date of invoice is now the same as the date of delivery. Earlier, the date of invoice was set to the date when the bill was sent. This was because the invoicing department didn’t know when the goods were delivered. As a mean, Company G today set the date of invoice two to three days earlier than before.
15.6. Metrics of Potential Gains In table 15.1 below, the improvements identified in the benefit analysis are transformed into a more comprehensible language, money. For each element, annual gain is computed, wherefrom the total gain is derived by discounting for five years with a discount rate of 10%. The first year though, no gain is accounted for since Company G had great implementation problems during the first twelve months after going live and didn’t realize any improvements until year two. The personnel reduction due to the two closed factory plants is accounted for from year three. Five years is the assumed project lifetime.
93
Cost driver Improvement Annual gain the best year
Total gain Explanation
Inbound inventories Inventory level Dropped by 20-30
MSEK 2-3 MSEK 5.8-8.6 MSEK The capital cost is 10% of
the tied up capital Inventory takings Dropped by 25-35
labour days 50,000-70,000 SEK
0.2 MSEK The approximate cost of a labour day is 2000 SEK
Production Production cycle time Reduced by 50% 5 MSEK 6.5 MSEK Capital tied up in products
in process will be reduced by 50 MSEK
Personnel 40-50 employees
less 16-20 MSEK 33-41 MSEK One employee costs about
400,000 SEK per year Administration Invoicing Date of invoice 2-3
days earlier. 2-3 MSEK 5.8-8.6 MSEK 20-30 MSEK less capital
tied up in accounts receivables
Total 25-31 MSEK 51-65 MSEK
Table 15.1: Metrics for Company G’s ERP project derived from the benefit analysis
15.7. Learnings When looked upon in retrospect, what was done well and what was not in the ERP-project? The management is fairly agreed, when the question is asked. Some details are definitely eligible to be proud of than other. Good things were that the project was strongly sanctioned by the top management. In addition the project group performed well and Company G believes that the decision process was properly structured. Also the implementation ran well. Though, even more education would have been necessary. On the dark side is the late realization that Company G indeed needed a new business system. The project should have started much earlier. Now the millennium bug situation stressed Company G and consultants and software suppliers were contacted with the worst timing possible. The advance planning by top management could definitely have been better. In addition to the late awakening, the parent company decided, a year after the implementation of SAP, that the group should run Movex from Intentia in the rest of the corporation. If this had been known in advance, Company G Scandinavia and the Baltic States would of course also have chosen Movex.
94
15.8. Conclusions The ERP project in Company G didn’t end up in the money. The costs were about 110 MSEK, while the benefits only 51-65 MSEK. Though, one must remember why the system was implemented. The ambition was not to run a profitable project, but to manage the millennium bug problem. That was the top priority and that became a success. The benefits gained could be seen as positive side effects to the main purpose. Moreover are more possible efficiencies identified but not yet completed. This may strengthen the project but probably not make it profitable. The big problem with the ERP implementation was Company G’s reluctance to change the organizational structure. The reason was that the structure was and is considered a core competence and is highly emphasized within the corporation. Because of this, the adjustments of the SAP system became very costly, but since the management still claims to be content with the solution, it probably was the best thing to do. A core competence is certainly worth more than the adjustment costs of an ERP system. The main setback was the management’s amateurish planning. First, the project was launched way too late, putting Company G in the greedy hands of the ERP vendors just before the millennium shift. Secondly, top management hasn’t been consequent in their decisions, choosing SAP for Company G Sweden, Finland, Norway and the Baltic States, then one year later they chose Intentia for the rest of the corporation. Altogether, the project was badly planned, but under the conditions the implementation ran fine. The project became too costly but the all goals have been fulfilled. Therefore we rate this project neither as a success nor as a failure, but something in between.
95
16. Company H Company H is selected as a case study for mainly two reasons. Firstly, Company H went from an older well-functioning ERP system to a new one. This is a contrast to most our cases, where an ERP system has been implemented for the first time. Secondly, Company H is a distribution company. Thus, they do not have any production of their own, as opposed to the other cases, but is still dependant on an ERP system to operate efficiently. At Company H we meet with the Head Officer of Company H and also a local Distribution Manager who also was Project Manager for the ERP project.
16.1. Company Overview Company H is the Nordic distributor within Company H’s parent company, which is a company with a complete range of market-leading brands in its product areas. Production takes place in 15 countries and the products are sold in more than 140 countries. Main markets are Northern Europe and the US. In year 2002 sales amounted to almost 15.000 MSEK distributed as the diagrams below shows.
Year 2002 sales by geography
35%
34%
18%
13%
Norhern Europe North AmericaRest of world Western Europe
Year 2002 sales by product area
24%
22%21%
12%
10%6% 5%
Cigars Other operationsSnuff MatchesChewing Tobacco Pipe TobaccoLighters
Figure 16.1: Company H’s parent company sales 2002 by region and product area
Company H is a separate company under the Northern Europe division and operates independently all over Sweden. The brands of Company H’s parent company only constitute a portion of all the brands distributed, which means that they have to operate as a totally independent company in order to follow anti-trust laws. Company H is a rather complex distribution company with over 13,000 customers. They have about 170 employees and net sales around 3 BSEK. As a whole they carry 350 different articles. The main competitive advantages lie in a lower cost structure than other distribution companies, due to unique solutions when it comes to order management and invoicing.
16.2. System Background In 1993 Company H installed Intentia’s Movex 6.0. As time went by they began to modify the system internally and stopped upgrading in line with Intentia’s recommendations. The reason
96
was that they had needs that Movex originally wasn’t able to provide and therefore they had to modify the system to specifically fit their operations. During the last couple of years the managers of Company H have discussed an eventual upgrade but since the old system was internally modified to such an extent they realized that an upgrade meant buying a whole new system. The old system was built on several “islands” which made it less integrated and information had to be sent between the different “islands” instead of just a constant flow of data. Another concern was that the system was rather dependant on key personnel since it had been internally modified to a great extent. The decision has not been stressed, since the old system still was working sufficiently, but a change would have to be made before the breakdown risk factor would become too big. Company H felt that they probably could keep the old system another two to three years.
16.2.1 Global Strategy In 2001 a global strategy was formed, for all divisions of Company H’s parent company, concerning a common ERP platform. Top management had an idea that whenever a new system was about to be acquired it should always be from the same supplier. Eventually the whole company would use the same platform, thus transparency would be total and acquisitions could easier be integrated. They also saw potential synergies by implementing the same type of system in all divisions. A project group was formed, in which both our interviewees were included, and together with Gartner group four potential suppliers were approached. These were JD Edwards, IBS, Intentia and SAP. In the end Intentia was chosen as global ERP supplier. Two major reasons were that some subsidiaries already used Intentia and that it was a Swedish company. The American subsidiary first choice was nonetheless JD Edwards. Once the decision was taken, negotiations commenced and a lot of contacts were established between the parent company and Intentia. This meant that all subsidiaries lost their negotiation power since prices to a great extent already were set. Company H’s parent company wanted to run a pilot and eyes were turned on Company H, since they had a new system in the pipeline. It was also a demand from Intentia before signing any contracts, that there existed a project to start off with. This is the point where most mistakes by Company H’s parent company began, namely the following:
• Company H was almost painted into a corner, and was almost forced to take on the pilot.
• Company H had other requirements than the company as a whole, since they worked with distribution as opposed to production. This meant that they did not have Intentia as first choice but instead they preferred IBS, since their solution better fit Company H operations.
• Company H were not in the need of changing system immediately, but could wait a couple of years.
• Company H was not a good choice as pilot since they are operating completely differently than the rest of the group.
• The central IT-group gave vague directions and didn’t provide enough support. Company H should also have tried harder to convince the mother company that they were not suitable as a pilot. The decision was however taken and the project began in 2002.
97
16.3. The Pilot Project As the decision was taken in 2001, discussions began with Intentia about which system should be bought. A specification of demands was put together and given to Intentia. At this stage Company H had little negotiating power due to the mother company’s eager to negotiate on a global base. Finally they agreed on becoming pilot for Intentia’s new system Movex 12.0. They also decided to bring in all modules except sales and production planning and on trying to adjust the company as much as possible to the system, in order not to modify Movex. In the end they still had to make 75 adjustments!
16.3.1. Problems Since Company H agreed to run the pilot for Movex 12.0 they received much better support and the adjustments they made that became standard in the final version, were not charged full price. Because of the pilot version there existed teething troubles, which resulted in 400 system errors. Another significant problem was the Intentia had misjudged the required hardware performance, which they underestimated by the factor four. Company H explanation was that Intentia does not understand all types of different operations, distribution included. Last but not least, the project was started before all underlying contracts were signed. This had an impact on the costs, which will be shown later.
16.3.2. The Implementation The implementation took 24 months compared to the planned 12. During this period Company H worked together with consultants from Intentia. Company H never assigned any personnel to work full time with the project. Instead people were told to assign a certain portion of their time to the project. The first move was that the consultants began study Company H in order to understand the processes. This did not work out very well and caused problems during the implementation. Another problem was that Movex was adjusted for a small number of larger customer and not for lots of smaller customer as in Company H’s case. The latter calls for a huge amount of information files since the order management becomes more multifaceted, thus files have to be cleared on regular basis in order not to run out of space. This was one of the major reasons why the project became so time consuming.
16.3.3. Expectations The only expectation Company H had was to cut personnel with three to five people within administration. Other than that they expected status quo. That was a big reason for not carrying out an investment analyze.
16.4. Organizational Changes, Benefits and Costs When analyzing Company H it is important to understand what their cost structure looks like. The biggest cost comes from goods sold while operating costs are about 200 MSEK. The bar chart below gives a more descriptive picture. This explains their cost advantages since operating costs to net sales only is 6.7%.
98
Cost of Goods Sold
Operating Costs
Full Costing Operating Costs
200 MSEK
Appr. 2600 MSEKTransportation
Costs
Personnel
Miscellaneous
CustomerBonuses
RentIT costs 10%
15%
15%
15%
15%
10%
Figure 16.2: The cost structure of Company H
16.4.1. Organizational Changes The changes within the organization have been few. Within administration, Company H have cut personnel with five people. Their tasks were solved by the new system. When running the old system they had three persons working full time as programmers. These persons are still with Company H helping out with support. Eventually these persons will be superfluous.
16.4.2. Benefits After undertaking two thorough interviews with Company H, benefits were still hard to find, why no metrics of potential gains will be derived. Instead numbers will be plugged into the benefit analysis directly. Both our contact persons also mentioned that major benefits were not accounted for.
16.4.3. Costs The total cost was 20 MSEK compared to the expected cost of 13 MSEK. This cost consisted of the following cost drivers:
• 10,500 consultant-hours at a cost of 1,300 SEK per hour, which comes to about 13.5 MSEK.
• Hardware for 3 MSEK, not including the new servers. • The actual software at a cost of 3.5 MSEK.
One should also mention that Intentia calculated the total cost to stay at 6-7 MSEK, which not surprisingly gives us the famous π-factor. In addition Company H have running costs of around 0.75 MSEK per year where software licenses cost 0.5 MSEK and support licenses cost 0.25 MSEK. The total cost, working with a five-year lifespan and discounting it back to 2003, comes to 22.9 MSEK. During the implementation Company H also used 20,000 man-hours internally, which is equivalent to 12.5 persons working full time for one year.
99
16.5. Benefit Analysis Although Company H has not experienced many benefits that can be transformed into pure money, they still feel that certain procedures and routines have improved with the change of system. These will now be described.
16.5.1. Purchases When talking to Company H, they mentioned that their purchases are done from a number of suppliers in different ways. They buy certain products direct and certain are bought in commission. However, the price situation is such, that the system could not help them decreasing the prices by having a better purchase module. On the positive side the interface has improved as well as the quality and control.
16.5.2. Inventories Since capital tied up in inventories isn’t a big concern, a new ERP system won’t make a significant difference. Because Company H has a rather high rate of inventory turnover (20 times per year) the major concern is to have high control and make sure to keep the wastage low. This is done by having inventory takings once a month. Orders are received through four different channels: 32% through EDI, 25% through telephone, 35 % through fax and the rest through e-commerce. The last channel is now integrated. In the previous system e-commerce wasn’t online, which called for manual controls.
16.5.3. Sales Since 95% of Company H sales are continuous orders and they hardly have any sale fluctuations they did not implement the sales module.
16.5.4. Administration Company H has within administration experienced the largest benefits. They have managed to rationalize five persons due to the system. These persons came at a cost of 0.5 MSEK per year. Invoicing is done within 15 seconds after the order is finished. They start about 2,000 invoices everyday, which calls for huge data capacity. It is also within this area that they gain their competitive advantage and therefore they are very dependant on functionality. They must have the system running in order to maintain their service level. Because of the enormous amounts of orders a system failure can be devastating. Total savings, when derived for four years and discounted back in time to 2003, are 9.5 MSEK.
16.5.5. IS/IT Company H still has teething troubles. However, they see potential in the future, since they now can use Intentia’s upgrades. In order for them to operate properly they are dependant on a working ERP system. The previous system did work sufficiently, but they often had to bring in experts to adjust certain things. Costs have however risen, due to licensing. In the near future they think they might have potential to rationalize the three persons working with support today. This would mean a saving of approximately 1.5 MSEK per year.
100
16.6. Learnings What stands out is that Company H specifically says that they did not do a single significant thing good except the cost follow-up. The Project Manager also mentions the project definition as well formulated. When it comes to things that could have been done better they mention most aspects. The most significant thing is that they never should have accepted to be forced to take on the pilot for Company H’s parent company. Once that mistake was done the following are the most important that were made:
• The project group was to big • It is important to keep in mind that the project leader will have a lot of administrative
work and less operational influence. • They should have assigned some personnel to work full time with the project • They should have discussed solution and ideas more internally, instead of
brainstorming with the consultants, which is much more costly. • Better definitions of areas of responsibility between Intentia and Company H, in order
to determine who pays for what. • Spent way to much time on mapping the processes. In the end it was the consultants
who made the adjustments anyway. On top of this come all the initial mistakes that were made before even beginning with the implementation. These were as mentioned before:
• Company H was almost painted into a corner, and was almost forced to take on the pilot.
• Company H had other requirements than the company as a whole, since they worked with distribution as opposed to production. This meant that they did not have Intentia as first choice but they preferred IBS since their solution better fit Company H’s operations.
• Company H were not in the need of changing system immediately, but could wait a couple of years.
• Company H was not a good choice as pilot since they are operating completely differently than the rest of the group.
• The central IT-group gave vague directions and didn’t provide enough support.
16.7. Conclusion It is rather evident that Company H’s ERP project was a failure. There were many decisions that never should have been made. The most obvious mistake was to accept the project from the beginning, and the lesson learned must be that when it comes to investments of this type, it is important that the decision is made by the organization itself and not is forced on like in Company H’s case. Since Company H’s project became such a failure it affected the global strategy. The outcome was that Company H’s parent company’s top management backed down from their strategy and changed it to a vision. This means that today Company H’s parent company’s subsidiaries can pretty much buy any ERP system as long as they can motivate that decision. When looking at the quantitative outcome the total costs were 22.9 MSEK compared to the benefits of 9.5 MSEK. In addition Company H has plans to rationalize three more persons,
101
which would give another 1.5 MSEK per year in savings. This still doesn’t take the project close to break even. We feel that Company H’s project was a failure but also believe that it is hard to make an ERP project profitable when there already is a previous ERP system installed. It is here important to look at the potential alternative cost savings, instead of pure benefits. The investment is called for when anticipated benefits together with alternative cost savings are greater than the total cost for a new system. In Company H’s case they should have waited with the ERP change a couple of years, and not letting in on Company H’s parent company’s top management’s persuasive approach. Then, they probably would have experienced a much better outcome.
102
Appendix 1 – The Questionnaire In the early stages of the research process, an interactive questionnaire was composed and e-mailed to 35 managers in different companies. These managers had been contacted in advance by telephone and had agreed complete the form. 20 mails were answered and 16 questionnaires were filled in. Our motive with the questionnaire was partly to gain an understanding for the companies’ specific ERP environments and also ERP market situation as a whole. The main reason, however, was to get an indication of how collaborative the managers seemed to be, to estimate our chances to carry out a case study on the companies. The result of this questionnaire is therefore of minor importance for our study and the questionnaire is thus presented in the appendix. The result of the questionnaire could however be of interest as a small survey of ERP implementations in major Swedish corporations. The selection unfortunately is too small to gain statistical confidence, but the survey still provides a fine overview of the ERP market situation. Questions and Answers In this section the questions and the answers will be presented. The disposition will be in the form of a figure or a graph presenting the question and the answers, sometimes followed by brief comments and conclusions. In some cases the respondents have given multiple answers. In those situations the value of their combined answers is 1, and if a company for example has given four answers to one question, each answer is valued to 0.25. Questions Concerning ERP Situation among the Respondents
Where are your company in the decision process for ERP systems?
02468
101214
An ERP system isinstalled in the company
We are currentlyimplementing an ERP
system
We are right nowplanning to buy an ERP
system
We have no thoughts ofbuying an ERP system
Figure A.1: The respondents’ current ERP situations As figure A.1 shows, almost all respondents have an ERP system installed. This is probably because companies with an existing ERP system were keener on answering the questionnaire.
103
Which of the following describes most accurately your current ERP solution?
0 2 4 6 8 10
An internally developed system with some additionalmodules
A system completely internally developed
An ERP package from a single ERP vendorcooperating with local systems
Best-of-breed solution
An ERP package from a single ERP vendor
Figure A.2: The respondents’ IT environments
50% of the respondents have a common ERP system throughout the entire company. None have internally developed system.
Which ERP vendor/s are you using or are planning to use?
01234567
SAP
Inte
ntia
IFS
Baan
JDEd
war
ds
Ora
cle
Mic
roso
ft
IBS
Anna
t
Figure A.3: Overview of the ERP vendors used by the respondents
SAP and Intentia are dominating the field. The same proportions can be seen among our case studies. Out of eight cases, three companies runs SAP and two runs Intentia. The time it took to go through the evaluation period, starting with the decision to buy an ERP system and ending when the evaluation of different systems was done, varied in between 3-24 months with an average of 8.5 months.
104
Questions Concerning the ERP Implementation
Which of the following implementaion strategies did you apply?
0 1 2 3 4 5 6
Franching strategy modules
Franching strategy markets
Slam Dunk
Big Bang
Figure A.4: The respondents’ implementation strategies Explanations to the strategies are found in chapter 1.6. There is no dominating strategy among the respondents, but Big Bang and Slam Dunk are the most common.
Was a formal investment analysis for the project made?
0 1 2 3 4 5 6
No, no formal investmentanalysis was made
Yes, multiple answers byrespondents
Yes, but other methodswere used
Yes, only a pay backanalysis
Yes, only an ROI analysis
Figure A.5: Was an investment analysis performed? Regarding this question, multiple answers by the respondents makes things a bit troublesome. In some cases companies have performed an ROI analysis and a pay back analysis, in some cases a ROI analysis and some other method. This implies that an ROI analysis was performed in 35% of the companies responding, a payback analysis in 28% of the companies responding and other methods were applied in 21% of the companies responding.
105
Noticeable is that more than a third of the respondents state that no investment analysis was made at all and only little more than a third have made an ROI analysis, which is superior to any other method.
Actual vs. expected implementation time and costs
0 0,5 1 1,5 2
Implementation time
Project cost
ExpectedActual
Figure A.6: How the actual implementation corresponds to what was expected
The project cost averaged 50% higher than expected and the implementation time exceeded deadline with almost 40% of the expected time. This implies that average implementation time was 13,5 months instead of a little less than ten months. Average project is irrelevant since implementation costs range from 1.5 to almost 350 MSEK. Important is only that the cost is 50% higher, plus the hidden costs associated with late system execution.
Has a follow-up report been made?
0 1 2 3 4 5 6 7 8
Yes
No
Figure A.7: Has a follow-up report been made?
About 50% of the responding companies have made a follow-up on the ERP project.
106
Expectations on the system compared to the actual outcome
How important was/is the following concepts when determining the need for your ERP system?
00.5
11.5
22.5
33.5
4
Stan
dard
izin
g th
e sy
stem
s
Inte
grat
ing
busi
ness
uni
ts
Impr
oved
line
of p
rodu
ctio
n
The
prev
ious
bus
ines
s sy
stem
was
/is o
bsol
ete
Impr
oved
cus
tom
er a
nd s
uppl
ier
rela
tions
A ne
ed to
com
ply
with
the
evol
utio
n
Inte
grat
ing
geog
raph
ical
lyse
pera
ted
mar
kets
Res
truct
ure
the
orga
niza
tion
To fa
cilit
ate
futu
re a
cqui
sitio
ns
A st
rive
to le
ad th
e ev
olut
ion
Y2K-
prob
lem
s
Figure A.8: The ranking the importance of the reasons for buying an ERP system
The alternatives were rated on a 1-4 scale where 1 was describes as “not at all important” and 4 was “very important”. The most important reason for buying an ERP system was to standardize the systems and to integrate the business units. Production improvement came only in third place while the reason of least importance was the Y2K-problem, which is quite surprisingly. The explanation is probably that Y2K troubles are rated either as “very important” or “not at all important”. In this survey, many companies chose “not at all important”, which has brought down the average score. .
107
How well has the outcome fulfilled your expectations in the following areas?
00.5
11.5
22.5
33.5
44.5
5
Incr
ease
dav
aila
bilit
y of
info
rmat
ion
Inte
grat
edfu
nctio
ns/p
roce
sses
Impr
oved
fina
ncia
lm
anag
emen
t
Inve
ntor
ies
redu
ctio
n
Impr
oved
sup
plie
rre
latio
ns
Red
uced
per
sonn
elco
sts
Red
uced
IT c
osts
Figure A.9: Outcome vs. expectations in different areas
The alternatives were rated on a 1-5 scale where 1 was describes as “not at all” and 5 was “exceptional”. When looking at the outcome vs. the expectations it is pleasing to see that the information availability as well as the quality of information has increased. This is well in line with the cases in the thesis but hard to put a price on since it is intangible. Another finding that fits well with the survey is that IT costs are expected to decrease but that usually isn’t the case. When comparing our results to the Deloitte study there are some similarities. The most evident is the non-realized IT cost reduction. This is a finding in our cases as well. Another similarity is the improved information availability, which is realized in both studies. However, since the studies are performed in two different manners it is difficult to make a full comparison.
108
Appendix 2 – Interview Protocol The interview will be based on a four step approach.
1. Build a system model of the business system. a. Which parts are included in your business system and in what way are they
connected? b. When was the system purchased? c. Which supplier/s? d. What does the system illustratively look like? e. Was the investment’s NPV positive? f. On which bases was the investment decision built on? (Goals/strategies)
2. What does the companies cost structure look like? a. What did the cost structure look like before the system acquirement? b. What does it look like now and how has it changed? c. Identify the cost drivers within each business unit and each section of the value
chain?
3. Identify areas in which the company feels they have made savings and efficiency benefits looking from a value chain perspective.
a. How has the organization changed? b. Within which areas has the company experienced differences? c. Is the outcome better or worse than the expectations? d. How much time elapsed before changes could be distinguished? e. Within which areas have the largest misjudgments been made?
4. Analysis of every separate section. Quantitative analyze of the qualitative by identifying and valuating the specific areas from question two, where savings and efficiencies have occurred.
5. Evaluation of the project and learnings.
a. What did you do well? b. What could have been done better? c. Which where the solid mistakes made?