28
Taking Part 2014/15: MUSIC
1
Taking Part 2014/15:
MUSIC
2
This report provides an overview of the engagement in music by adults living in England. Data is taken from the Taking Part Survey 2014/15 and makes comparisons with earlier years. All statistically significant differences are noted in the text and on the charts:
- a statistically significant difference is a difference which is probably true and not due to chance - a non statistically significant difference is probably not a true difference and is likely to be due to chance
* on the charts indicates a statistically significant difference between 2014/15 and the earliest survey year shown More information about the Taking Part Survey can be found in Appendix A. A Technical Note on the survey is in Appendix B.
3
Contents
Key findings........................................................................................................................................................ 4
Music ................................................................................................................................................................ 5
Engagement in music ........................................................................................................................................... 6
Engagement in music by gender .......................................................................................................................................... 7
Engagement in music by age group ..................................................................................................................................... 9
Engagement in music by disability .................................................................................................................................... 10
Engagement in music by ethnic group .............................................................................................................................. 11
Engagement in music by socio-economic group ............................................................................................................. 12
Engagement in music by urban/rural ............................................................................................................................... 13
Engagement in music by region ......................................................................................................................................... 14
Music attendance ............................................................................................................................................... 15
Opera or operetta .................................................................................................................................................................. 16
Classical music ....................................................................................................................................................................... 17
Jazz ........................................................................................................................................................................................... 18
Other live music ..................................................................................................................................................................... 19
Participation in Music ......................................................................................................................................... 20
Sang to an audience or rehearsed for a performance ................................................................................................... 21
Played a musical instrument to an audience or rehearsed .......................................................................................... 22
Played a musical for own pleasure .................................................................................................................................... 23
Written music ........................................................................................................................................................................ 24
Appendix A - About the Taking Part survey ............................................................................................................. 25
Appendix B - Technical note ................................................................................................................................ 26
4
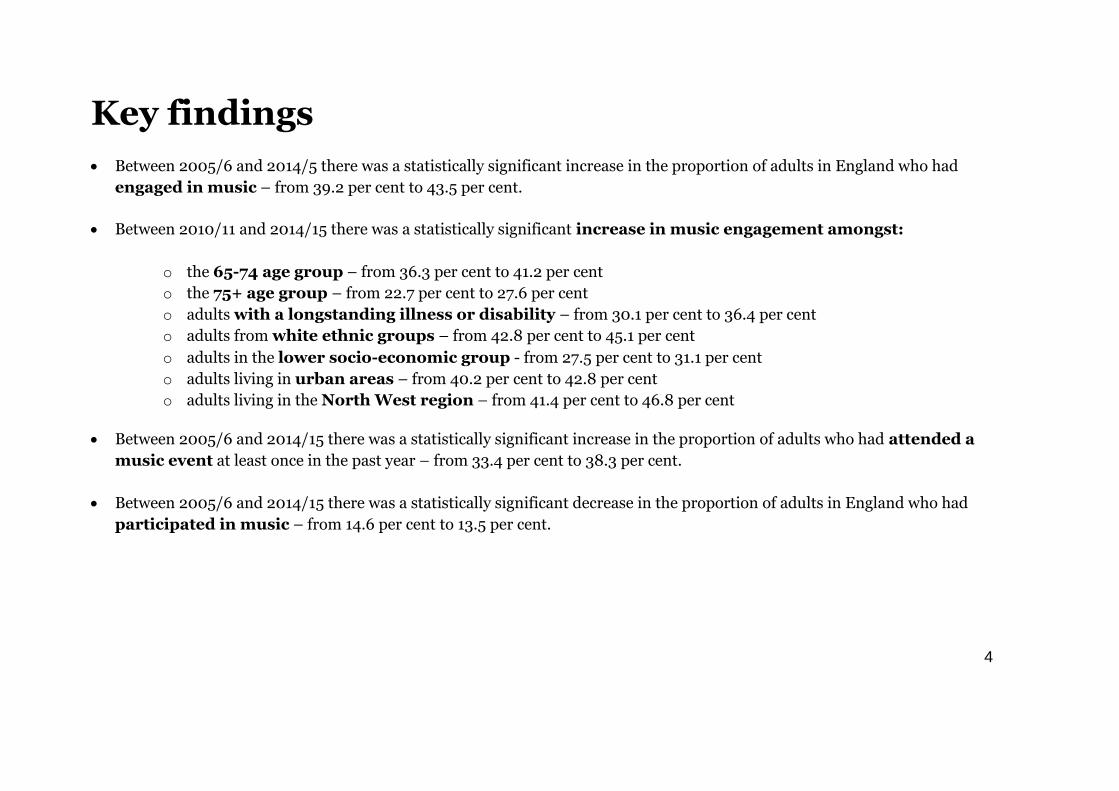
Key findings
Between 2005/6 and 2014/5 there was a statistically significant increase in the proportion of adults in England who had
engaged in music – from 39.2 per cent to 43.5 per cent.
Between 2010/11 and 2014/15 there was a statistically significant increase in music engagement amongst:
o the 65-74 age group – from 36.3 per cent to 41.2 per cent
o the 75+ age group – from 22.7 per cent to 27.6 per cent
o adults with a longstanding illness or disability – from 30.1 per cent to 36.4 per cent
o adults from white ethnic groups – from 42.8 per cent to 45.1 per cent
o adults in the lower socio-economic group - from 27.5 per cent to 31.1 per cent
o adults living in urban areas – from 40.2 per cent to 42.8 per cent
o adults living in the North West region – from 41.4 per cent to 46.8 per cent
Between 2005/6 and 2014/15 there was a statistically significant increase in the proportion of adults who had attended a
music event at least once in the past year – from 33.4 per cent to 38.3 per cent.
Between 2005/6 and 2014/15 there was a statistically significant decrease in the proportion of adults in England who had
participated in music – from 14.6 per cent to 13.5 per cent.
5
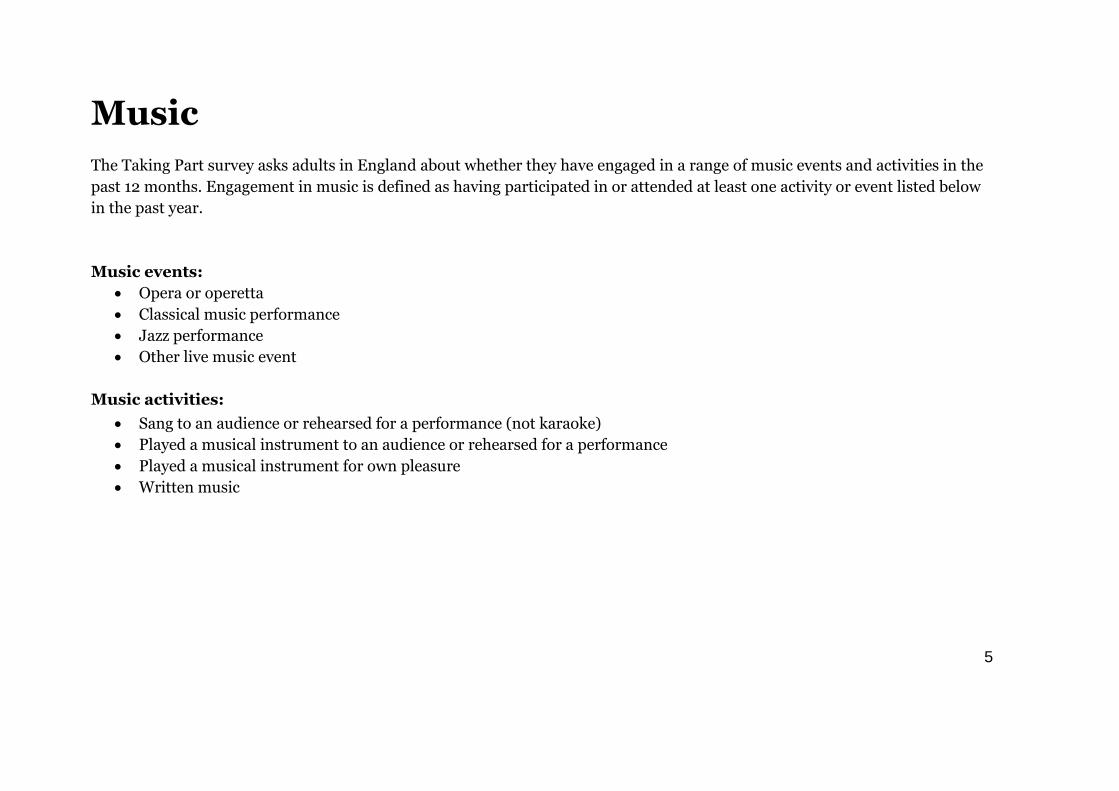
Music
The Taking Part survey asks adults in England about whether they have engaged in a range of music events and activities in the
past 12 months. Engagement in music is defined as having participated in or attended at least one activity or event listed below
in the past year.
Music events:
Opera or operetta
Classical music performance
Jazz performance
Other live music event
Music activities:
Sang to an audience or rehearsed for a performance (not karaoke)
Played a musical instrument to an audience or rehearsed for a performance
Played a musical instrument for own pleasure
Written music
6
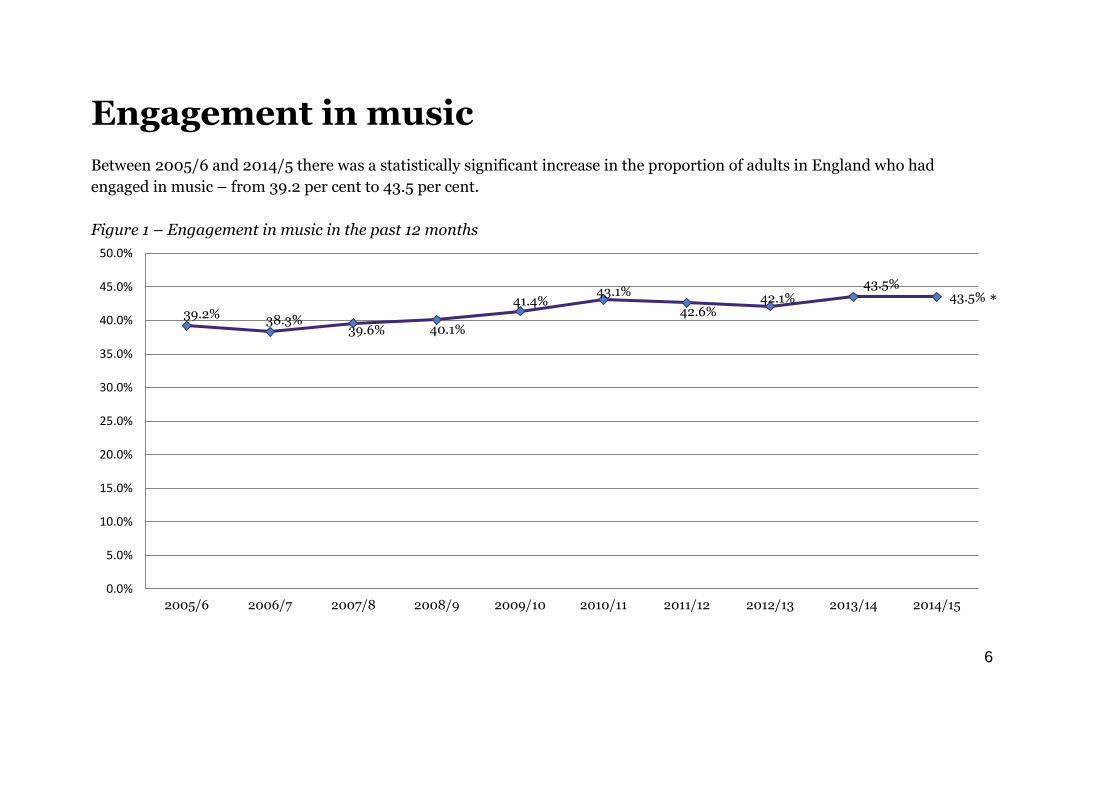
Engagement in music
Between 2005/6 and 2014/5 there was a statistically significant increase in the proportion of adults in England who had
engaged in music – from 39.2 per cent to 43.5 per cent.
Figure 1 – Engagement in music in the past 12 months
39.2% 38.3%39.6% 40.1%
41.4%43.1%
42.6%42.1%
43.5%43.5%
0.0%
5.0%
10.0%
15.0%
20.0%
25.0%
30.0%
35.0%
40.0%
45.0%
50.0%
2005/6 2006/7 2007/8 2008/9 2009/10 2010/11 2011/12 2012/13 2013/14 2014/15
*
7
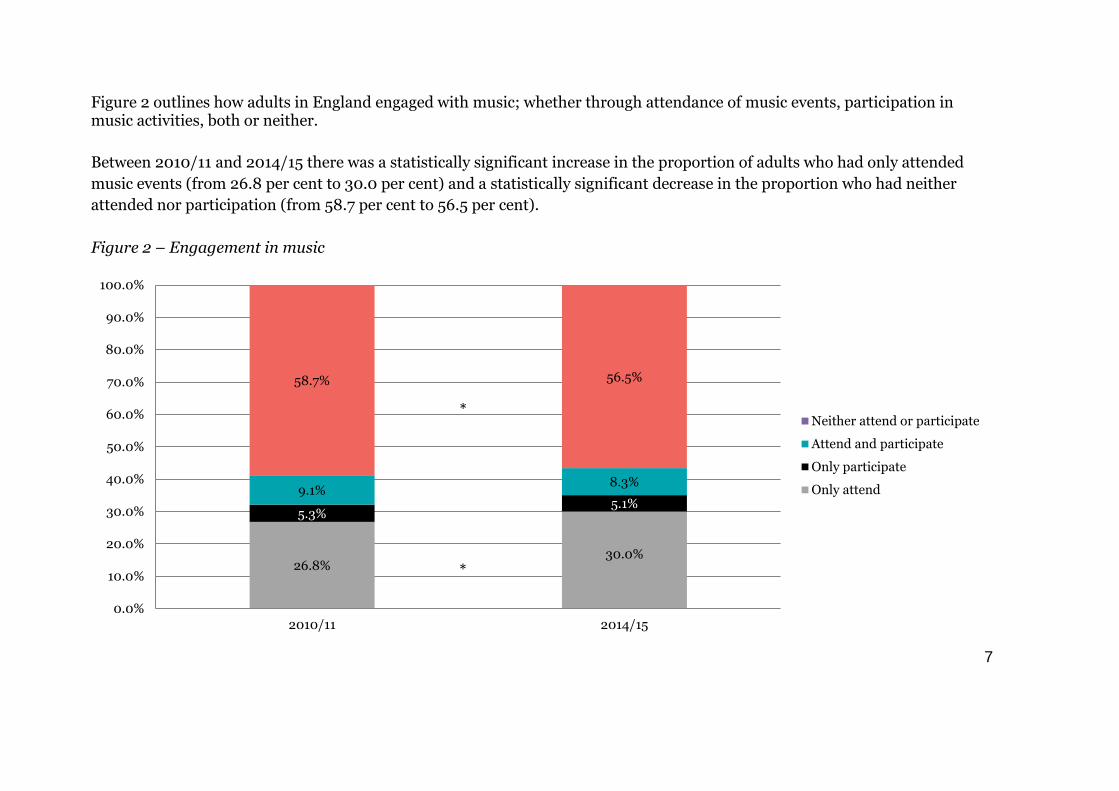
Figure 2 outlines how adults in England engaged with music; whether through attendance of music events, participation in music activities, both or neither.
Between 2010/11 and 2014/15 there was a statistically significant increase in the proportion of adults who had only attended
music events (from 26.8 per cent to 30.0 per cent) and a statistically significant decrease in the proportion who had neither
attended nor participation (from 58.7 per cent to 56.5 per cent).
Figure 2 – Engagement in music
26.8%30.0%
5.3%5.1%
9.1%8.3%
58.7% 56.5%
0.0%
10.0%
20.0%
30.0%
40.0%
50.0%
60.0%
70.0%
80.0%
90.0%
100.0%
2010/11 2014/15
Neither attend or participate
Attend and participate
Only participate
Only attend
*
*
8
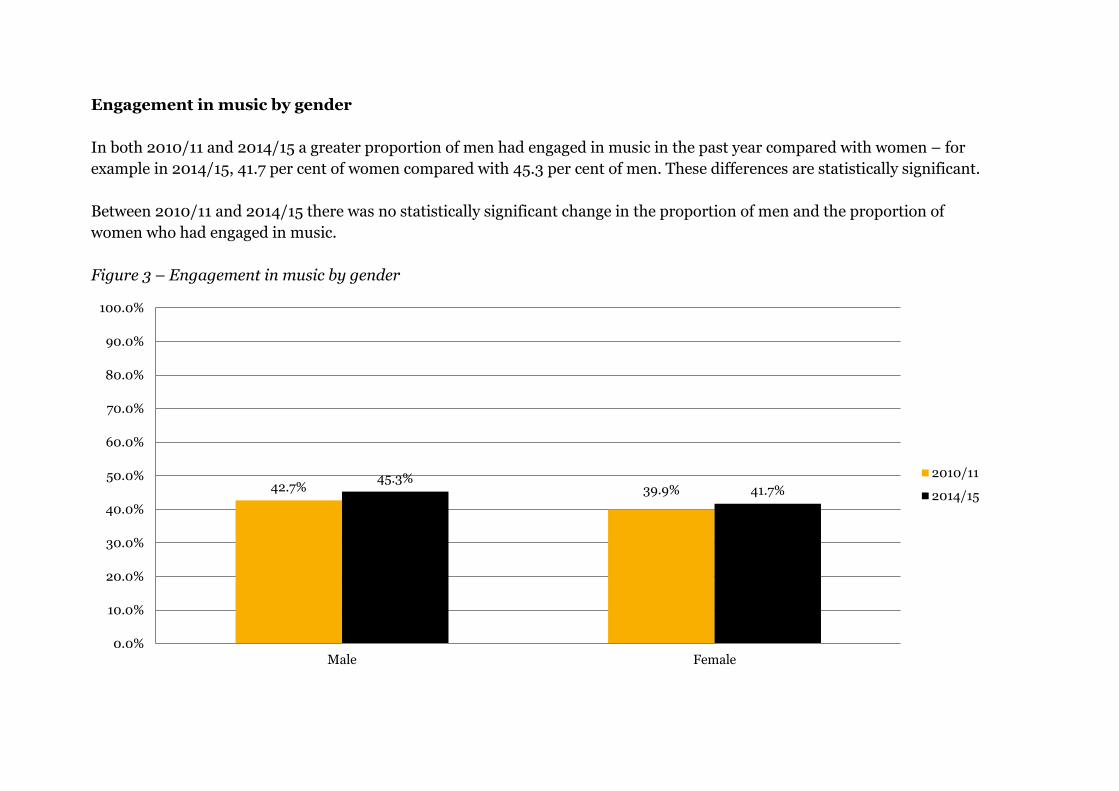
Engagement in music by gender
In both 2010/11 and 2014/15 a greater proportion of men had engaged in music in the past year compared with women – for
example in 2014/15, 41.7 per cent of women compared with 45.3 per cent of men. These differences are statistically significant.
Between 2010/11 and 2014/15 there was no statistically significant change in the proportion of men and the proportion of
women who had engaged in music.
Figure 3 – Engagement in music by gender
42.7% 39.9%45.3%
41.7%
0.0%
10.0%
20.0%
30.0%
40.0%
50.0%
60.0%
70.0%
80.0%
90.0%
100.0%
Male Female
2010/11
2014/15
9
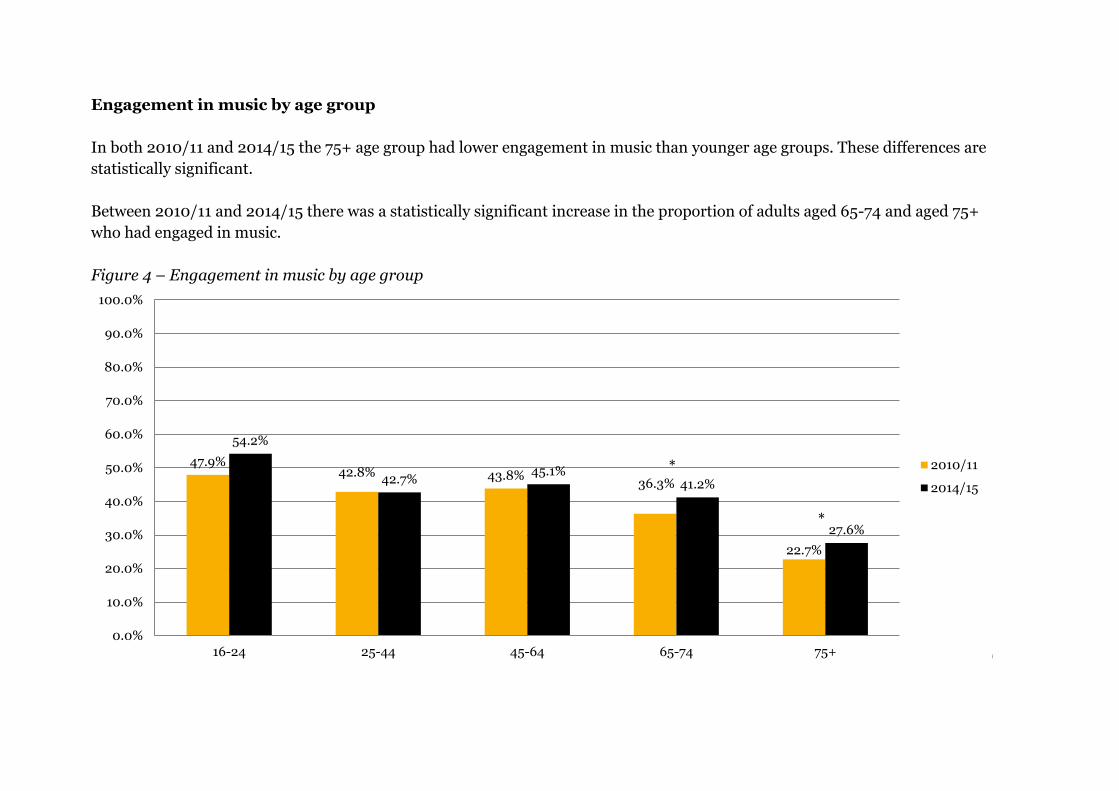
Engagement in music by age group
In both 2010/11 and 2014/15 the 75+ age group had lower engagement in music than younger age groups. These differences are
statistically significant.
Between 2010/11 and 2014/15 there was a statistically significant increase in the proportion of adults aged 65-74 and aged 75+
who had engaged in music.
Figure 4 – Engagement in music by age group
47.9%42.8% 43.8%
36.3%
22.7%
54.2%
42.7%45.1%
41.2%
27.6%
0.0%
10.0%
20.0%
30.0%
40.0%
50.0%
60.0%
70.0%
80.0%
90.0%
100.0%
16-24 25-44 45-64 65-74 75+
2010/11
2014/15
*
*
10
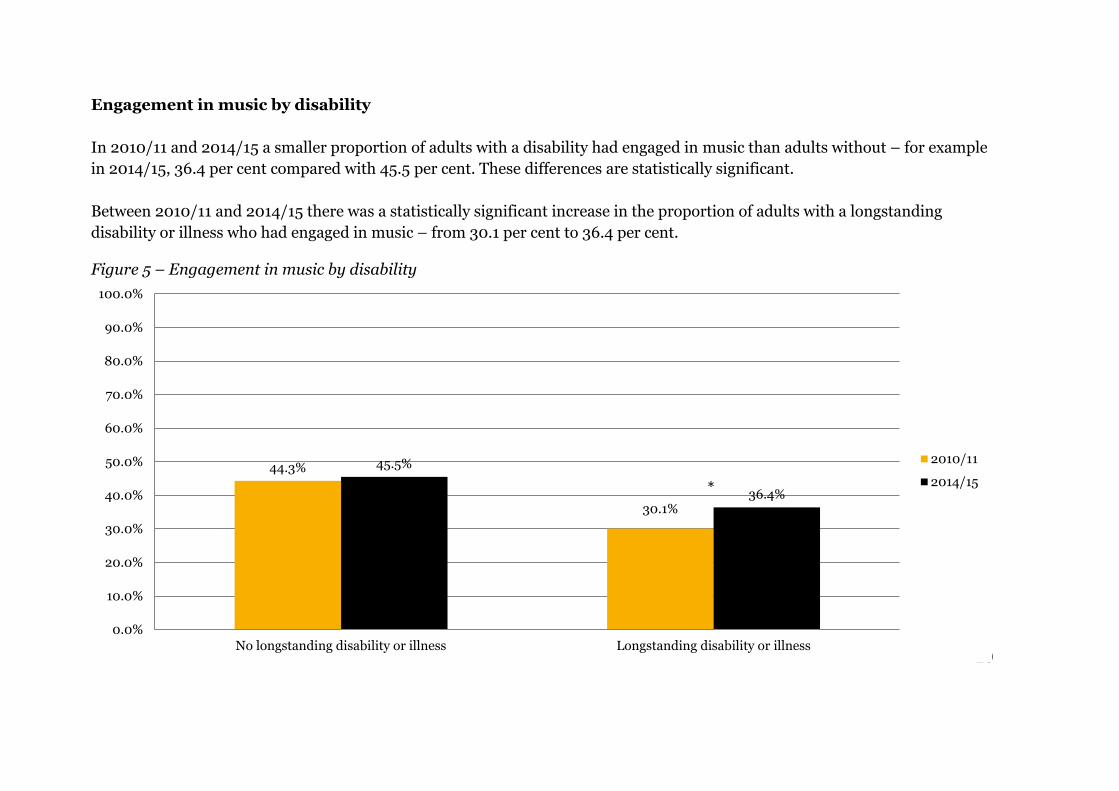
Engagement in music by disability
In 2010/11 and 2014/15 a smaller proportion of adults with a disability had engaged in music than adults without – for example
in 2014/15, 36.4 per cent compared with 45.5 per cent. These differences are statistically significant.
Between 2010/11 and 2014/15 there was a statistically significant increase in the proportion of adults with a longstanding
disability or illness who had engaged in music – from 30.1 per cent to 36.4 per cent. Figure 5 – Engagement in music by disability
*
44.3%
30.1%
45.5%
36.4%
0.0%
10.0%
20.0%
30.0%
40.0%
50.0%
60.0%
70.0%
80.0%
90.0%
100.0%
No longstanding disability or illness Longstanding disability or illness
2010/11
2014/15*
11
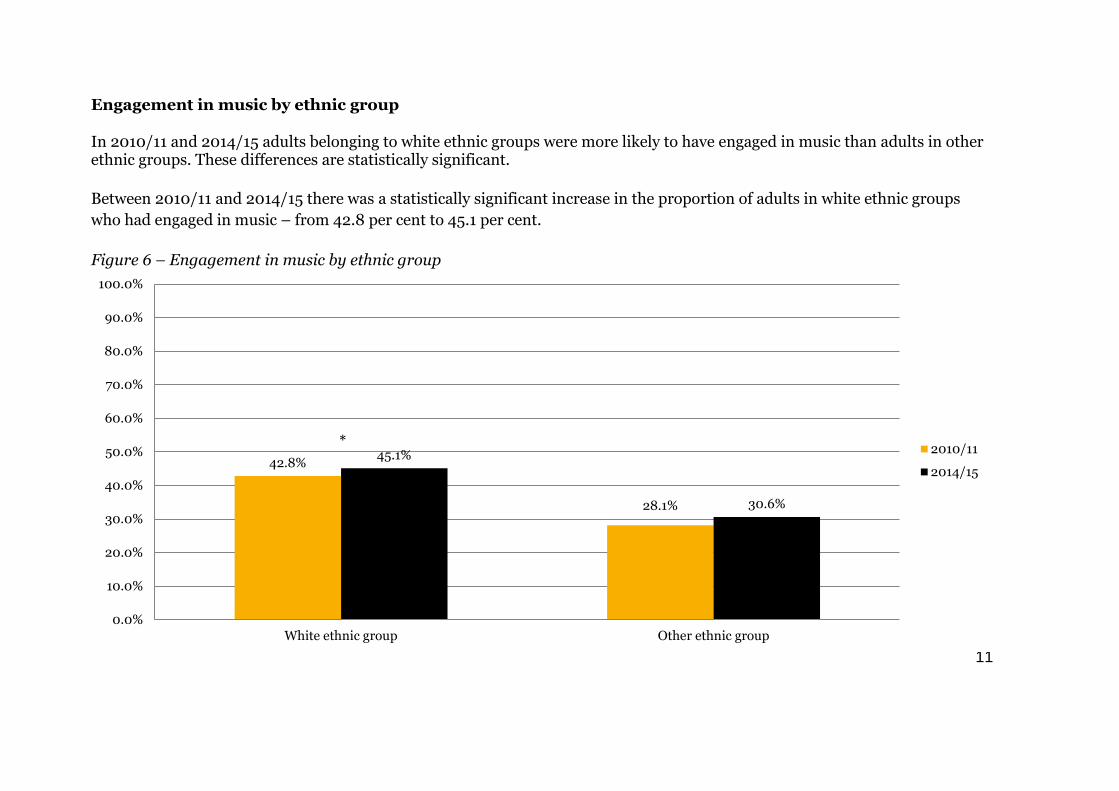
Engagement in music by ethnic group In 2010/11 and 2014/15 adults belonging to white ethnic groups were more likely to have engaged in music than adults in other ethnic groups. These differences are statistically significant.
Between 2010/11 and 2014/15 there was a statistically significant increase in the proportion of adults in white ethnic groups
who had engaged in music – from 42.8 per cent to 45.1 per cent.
Figure 6 – Engagement in music by ethnic group
42.8%
28.1%
45.1%
30.6%
0.0%
10.0%
20.0%
30.0%
40.0%
50.0%
60.0%
70.0%
80.0%
90.0%
100.0%
White ethnic group Other ethnic group
2010/11
2014/15
*
12
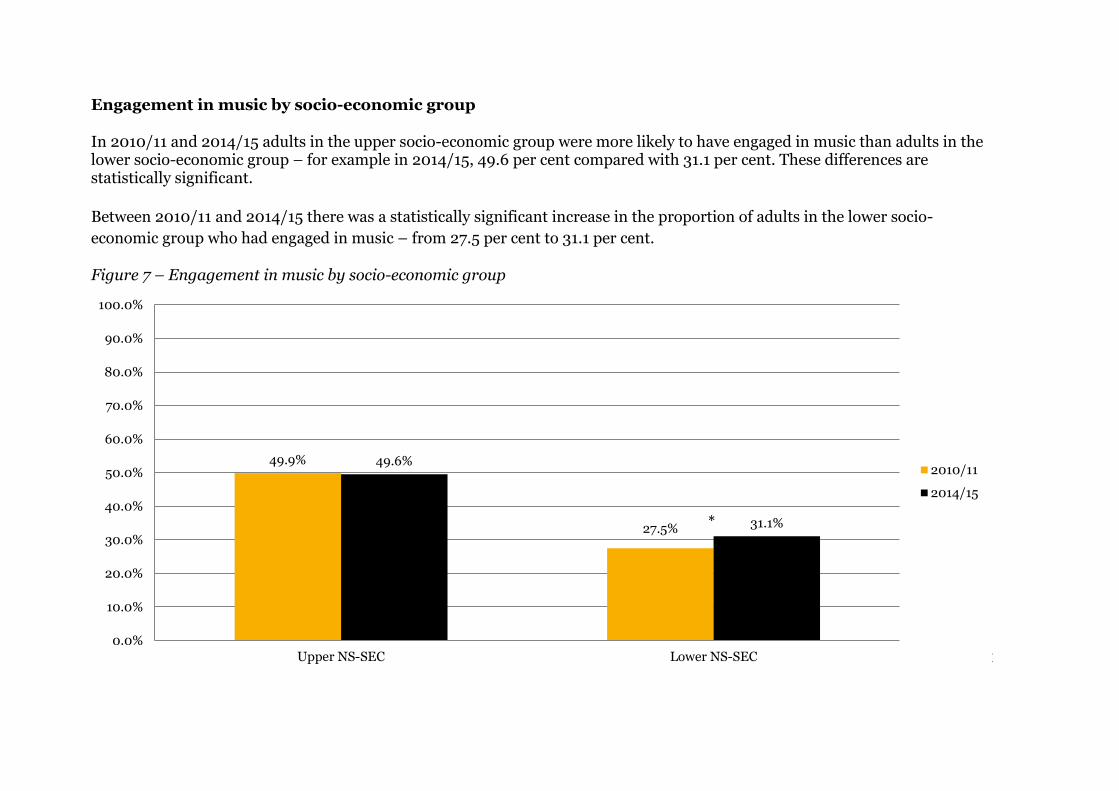
Engagement in music by socio-economic group In 2010/11 and 2014/15 adults in the upper socio-economic group were more likely to have engaged in music than adults in the lower socio-economic group – for example in 2014/15, 49.6 per cent compared with 31.1 per cent. These differences are statistically significant.
Between 2010/11 and 2014/15 there was a statistically significant increase in the proportion of adults in the lower socio-
economic group who had engaged in music – from 27.5 per cent to 31.1 per cent. Figure 7 – Engagement in music by socio-economic group
*
49.9%
27.5%
49.6%
31.1%
0.0%
10.0%
20.0%
30.0%
40.0%
50.0%
60.0%
70.0%
80.0%
90.0%
100.0%
Upper NS-SEC Lower NS-SEC
2010/11
2014/15
*
13
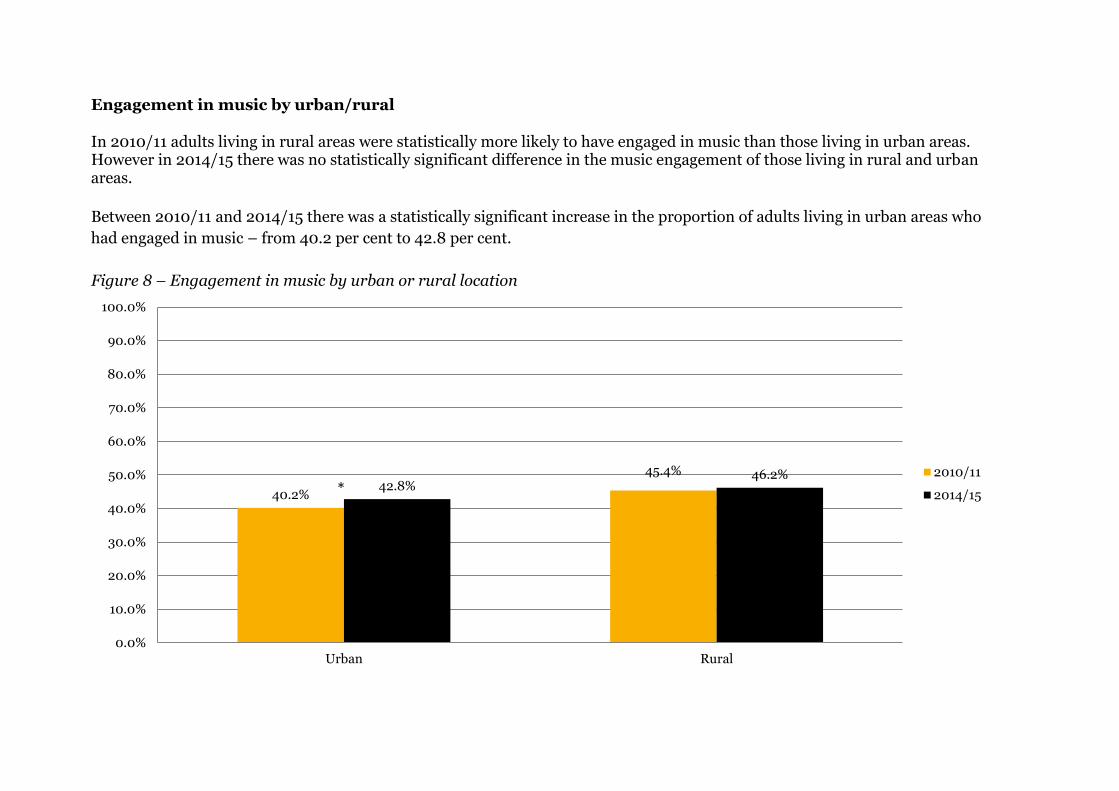
Engagement in music by urban/rural In 2010/11 adults living in rural areas were statistically more likely to have engaged in music than those living in urban areas. However in 2014/15 there was no statistically significant difference in the music engagement of those living in rural and urban areas.
Between 2010/11 and 2014/15 there was a statistically significant increase in the proportion of adults living in urban areas who
had engaged in music – from 40.2 per cent to 42.8 per cent.
Figure 8 – Engagement in music by urban or rural location
40.2%
45.4%42.8%
46.2%
0.0%
10.0%
20.0%
30.0%
40.0%
50.0%
60.0%
70.0%
80.0%
90.0%
100.0%
Urban Rural
2010/11
2014/15*
14
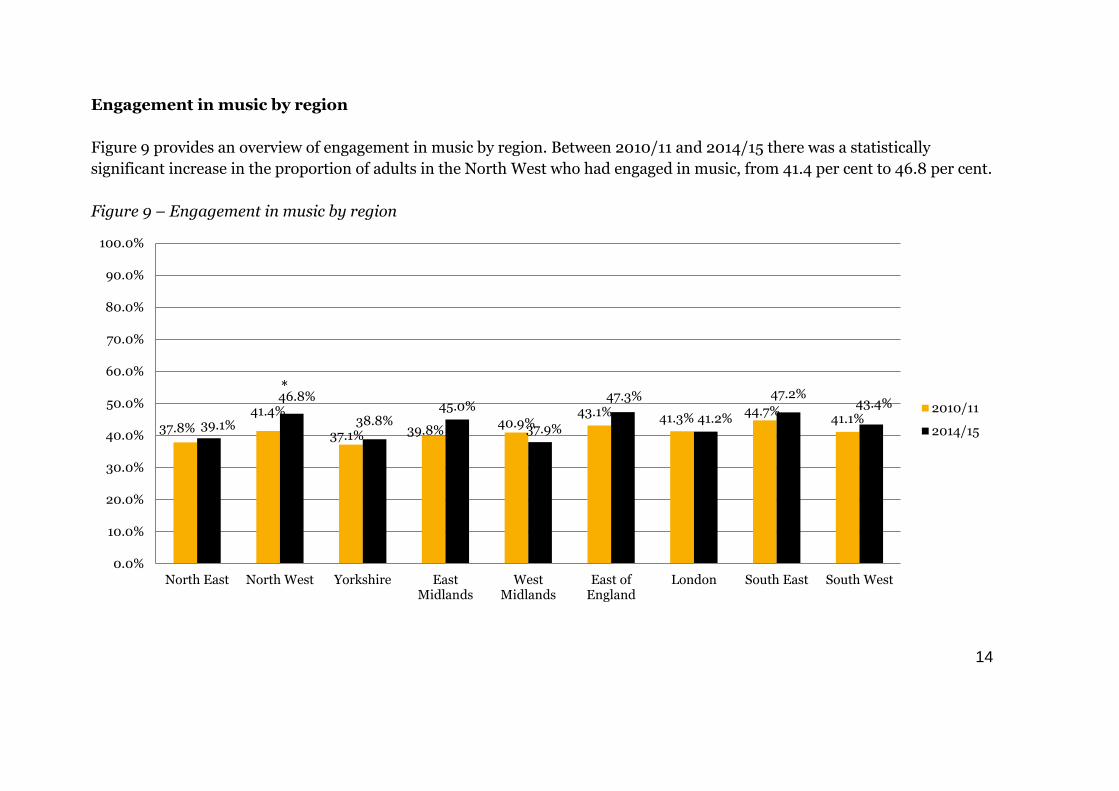
Engagement in music by region
Figure 9 provides an overview of engagement in music by region. Between 2010/11 and 2014/15 there was a statistically
significant increase in the proportion of adults in the North West who had engaged in music, from 41.4 per cent to 46.8 per cent.
Figure 9 – Engagement in music by region
*
37.8%
41.4%
37.1% 39.8%40.9%
43.1% 41.3%44.7%
41.1%39.1%
46.8%
38.8%45.0%
37.9%
47.3%
41.2%
47.2%43.4%
0.0%
10.0%
20.0%
30.0%
40.0%
50.0%
60.0%
70.0%
80.0%
90.0%
100.0%
North East North West Yorkshire EastMidlands
WestMidlands
East ofEngland
London South East South West
2010/11
2014/15
*
15
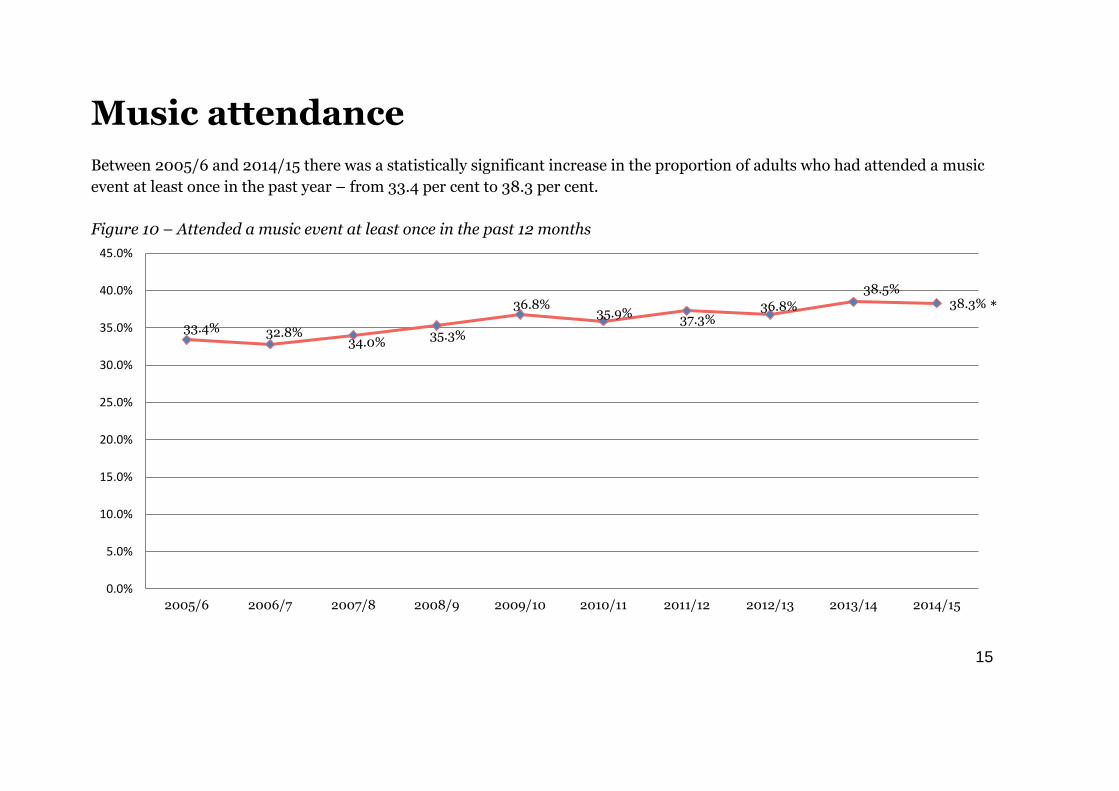
Music attendance
Between 2005/6 and 2014/15 there was a statistically significant increase in the proportion of adults who had attended a music
event at least once in the past year – from 33.4 per cent to 38.3 per cent.
Figure 10 – Attended a music event at least once in the past 12 months
33.4% 32.8%34.0%
35.3%
36.8%35.9% 37.3%
36.8%
38.5%38.3%
0.0%
5.0%
10.0%
15.0%
20.0%
25.0%
30.0%
35.0%
40.0%
45.0%
2005/6 2006/7 2007/8 2008/9 2009/10 2010/11 2011/12 2012/13 2013/14 2014/15
*
16
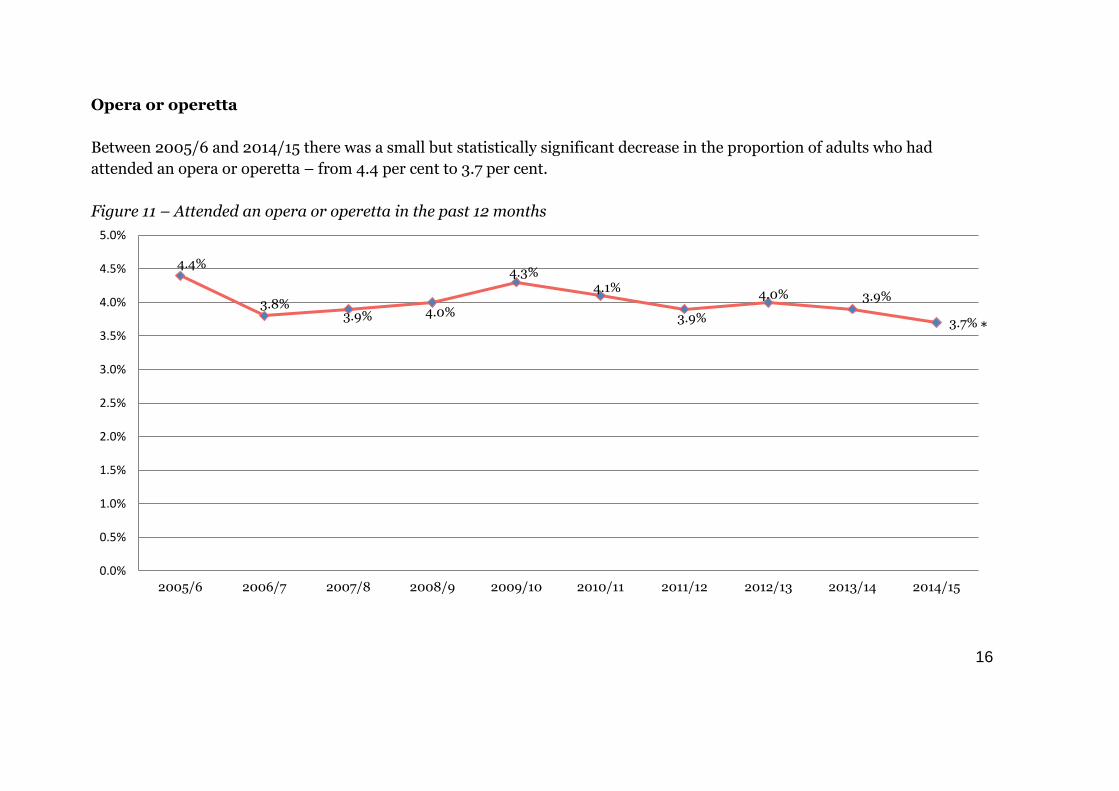
Opera or operetta
Between 2005/6 and 2014/15 there was a small but statistically significant decrease in the proportion of adults who had
attended an opera or operetta – from 4.4 per cent to 3.7 per cent.
Figure 11 – Attended an opera or operetta in the past 12 months
4.4%
3.8%3.9% 4.0%
4.3%4.1%
3.9%
4.0% 3.9%
3.7%
0.0%
0.5%
1.0%
1.5%
2.0%
2.5%
3.0%
3.5%
4.0%
4.5%
5.0%
2005/6 2006/7 2007/8 2008/9 2009/10 2010/11 2011/12 2012/13 2013/14 2014/15
*
17
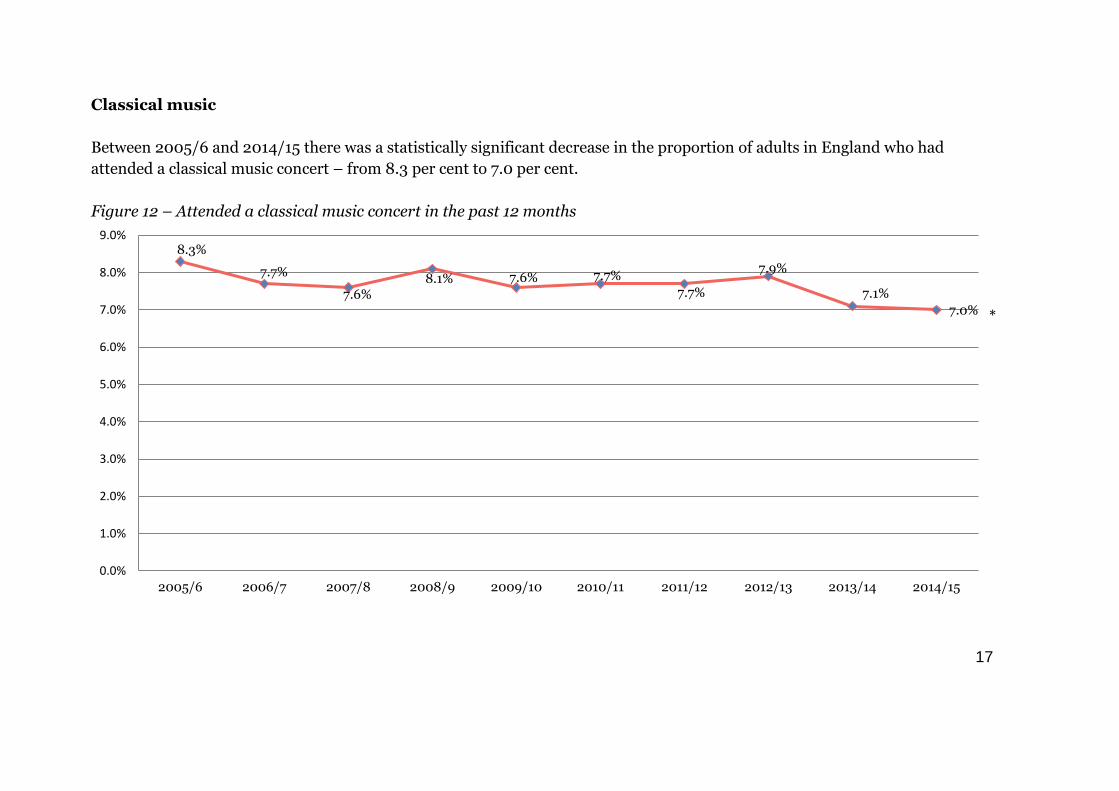
Classical music
Between 2005/6 and 2014/15 there was a statistically significant decrease in the proportion of adults in England who had
attended a classical music concert – from 8.3 per cent to 7.0 per cent.
Figure 12 – Attended a classical music concert in the past 12 months
8.3%
7.7%
7.6%8.1% 7.6% 7.7%
7.7%
7.9%
7.1%
7.0%
0.0%
1.0%
2.0%
3.0%
4.0%
5.0%
6.0%
7.0%
8.0%
9.0%
2005/6 2006/7 2007/8 2008/9 2009/10 2010/11 2011/12 2012/13 2013/14 2014/15
*
18
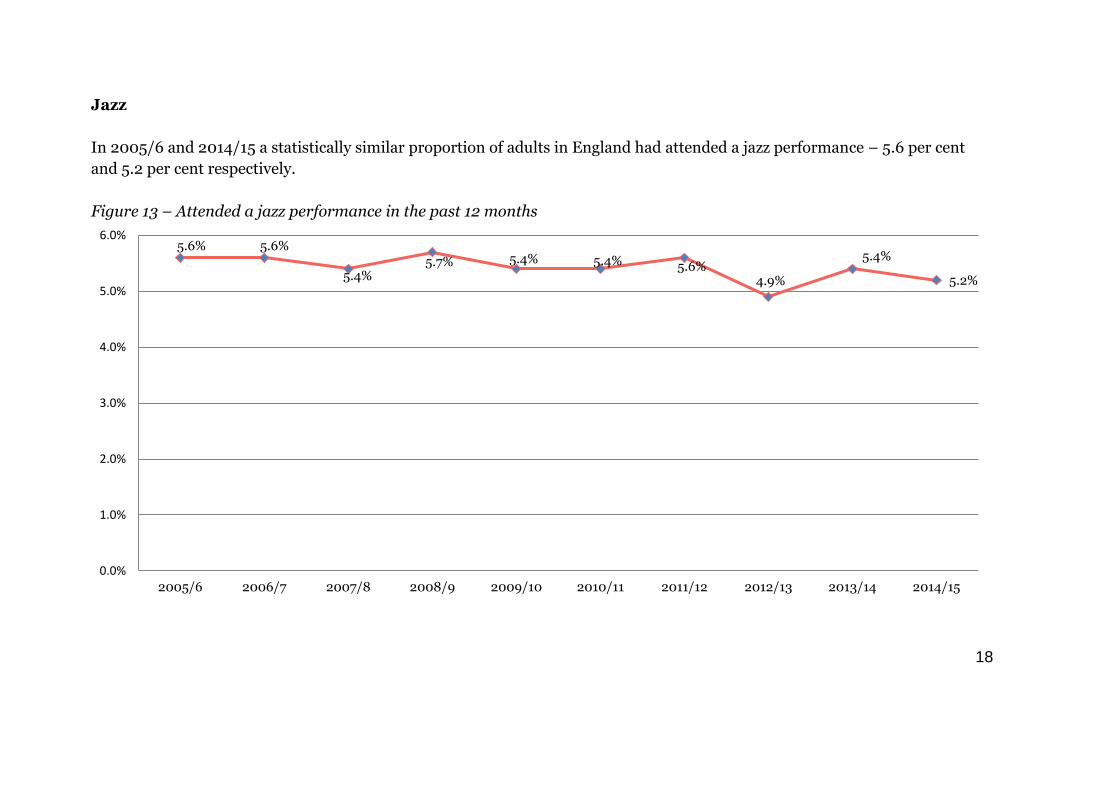
Jazz
In 2005/6 and 2014/15 a statistically similar proportion of adults in England had attended a jazz performance – 5.6 per cent
and 5.2 per cent respectively.
Figure 13 – Attended a jazz performance in the past 12 months
5.6% 5.6%
5.4%5.7% 5.4% 5.4% 5.6%
4.9%
5.4%
5.2%
0.0%
1.0%
2.0%
3.0%
4.0%
5.0%
6.0%
2005/6 2006/7 2007/8 2008/9 2009/10 2010/11 2011/12 2012/13 2013/14 2014/15
19
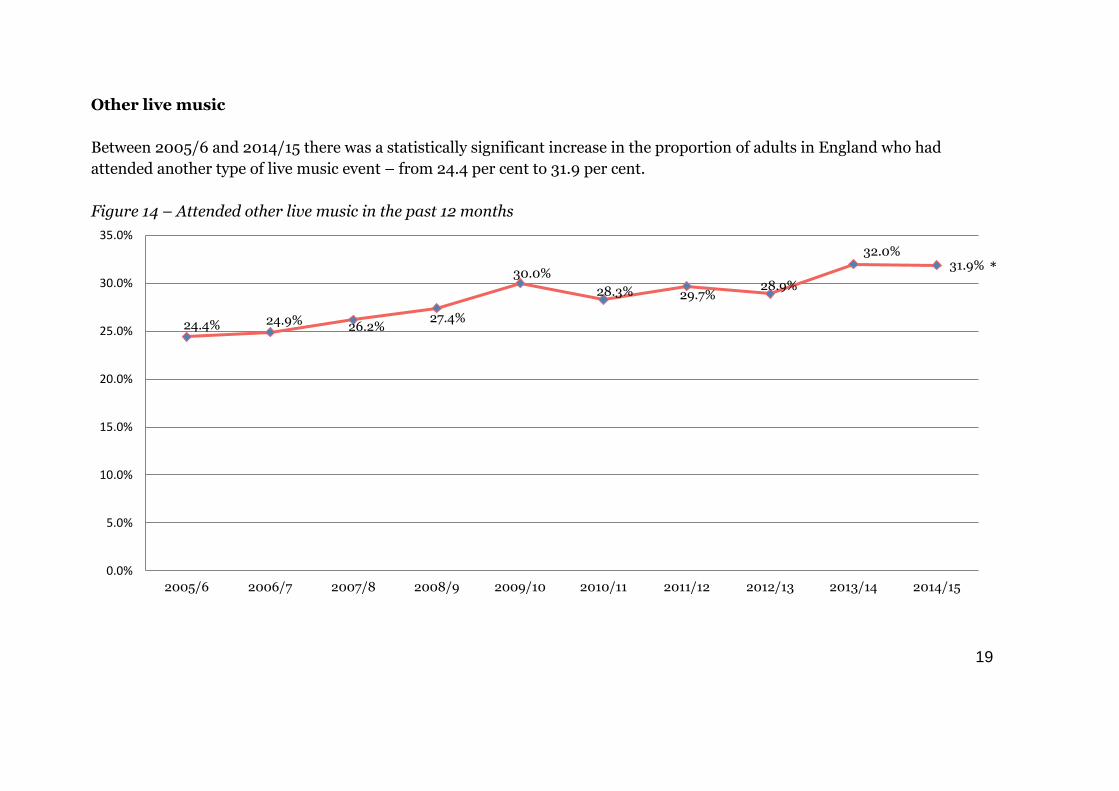
Other live music
Between 2005/6 and 2014/15 there was a statistically significant increase in the proportion of adults in England who had
attended another type of live music event – from 24.4 per cent to 31.9 per cent.
Figure 14 – Attended other live music in the past 12 months
24.4% 24.9% 26.2%27.4%
30.0%
28.3% 29.7%28.9%
32.0%31.9%
0.0%
5.0%
10.0%
15.0%
20.0%
25.0%
30.0%
35.0%
2005/6 2006/7 2007/8 2008/9 2009/10 2010/11 2011/12 2012/13 2013/14 2014/15
*
20
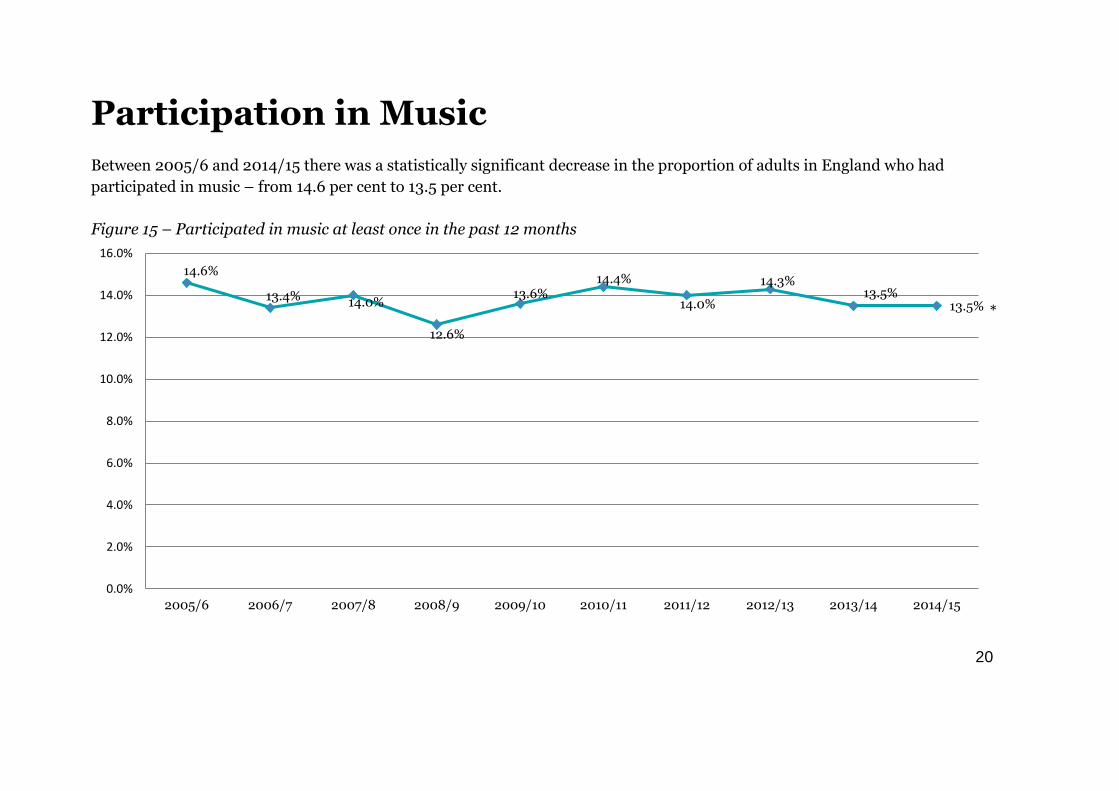
Participation in Music
Between 2005/6 and 2014/15 there was a statistically significant decrease in the proportion of adults in England who had
participated in music – from 14.6 per cent to 13.5 per cent.
Figure 15 – Participated in music at least once in the past 12 months
14.6%
13.4% 14.0%
12.6%
13.6%14.4%
14.0%
14.3%13.5%
13.5%
0.0%
2.0%
4.0%
6.0%
8.0%
10.0%
12.0%
14.0%
16.0%
2005/6 2006/7 2007/8 2008/9 2009/10 2010/11 2011/12 2012/13 2013/14 2014/15
*
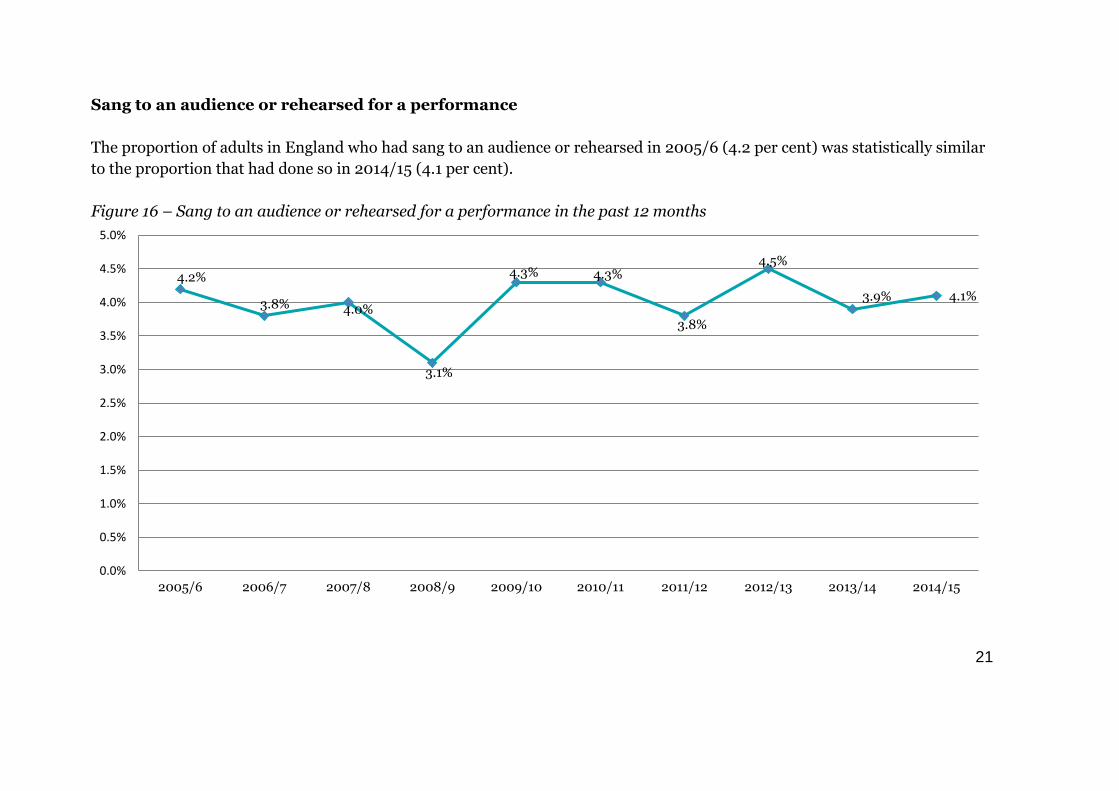
21
Sang to an audience or rehearsed for a performance
The proportion of adults in England who had sang to an audience or rehearsed in 2005/6 (4.2 per cent) was statistically similar
to the proportion that had done so in 2014/15 (4.1 per cent).
Figure 16 – Sang to an audience or rehearsed for a performance in the past 12 months
4.2%
3.8% 4.0%
3.1%
4.3% 4.3%
3.8%
4.5%
3.9% 4.1%
0.0%
0.5%
1.0%
1.5%
2.0%
2.5%
3.0%
3.5%
4.0%
4.5%
5.0%
2005/6 2006/7 2007/8 2008/9 2009/10 2010/11 2011/12 2012/13 2013/14 2014/15
22
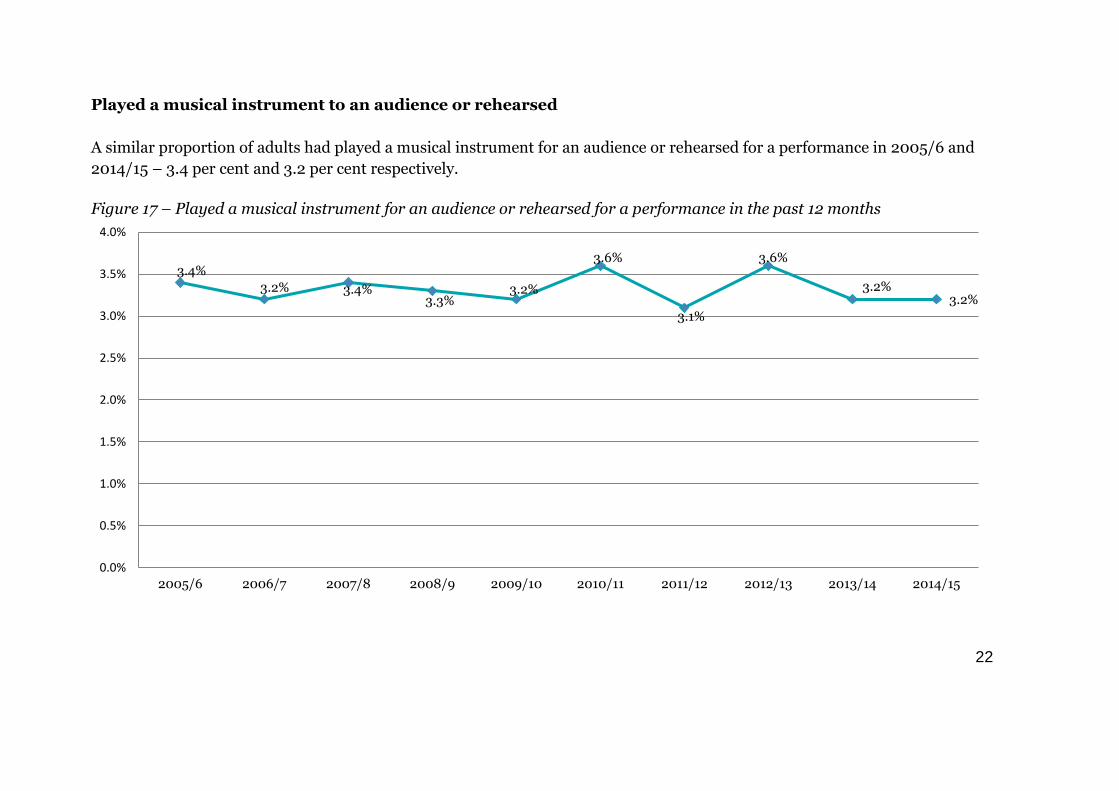
Played a musical instrument to an audience or rehearsed
A similar proportion of adults had played a musical instrument for an audience or rehearsed for a performance in 2005/6 and
2014/15 – 3.4 per cent and 3.2 per cent respectively.
Figure 17 – Played a musical instrument for an audience or rehearsed for a performance in the past 12 months
3.4%
3.2% 3.4%3.3%
3.2%
3.6%
3.1%
3.6%
3.2%3.2%
0.0%
0.5%
1.0%
1.5%
2.0%
2.5%
3.0%
3.5%
4.0%
2005/6 2006/7 2007/8 2008/9 2009/10 2010/11 2011/12 2012/13 2013/14 2014/15
23
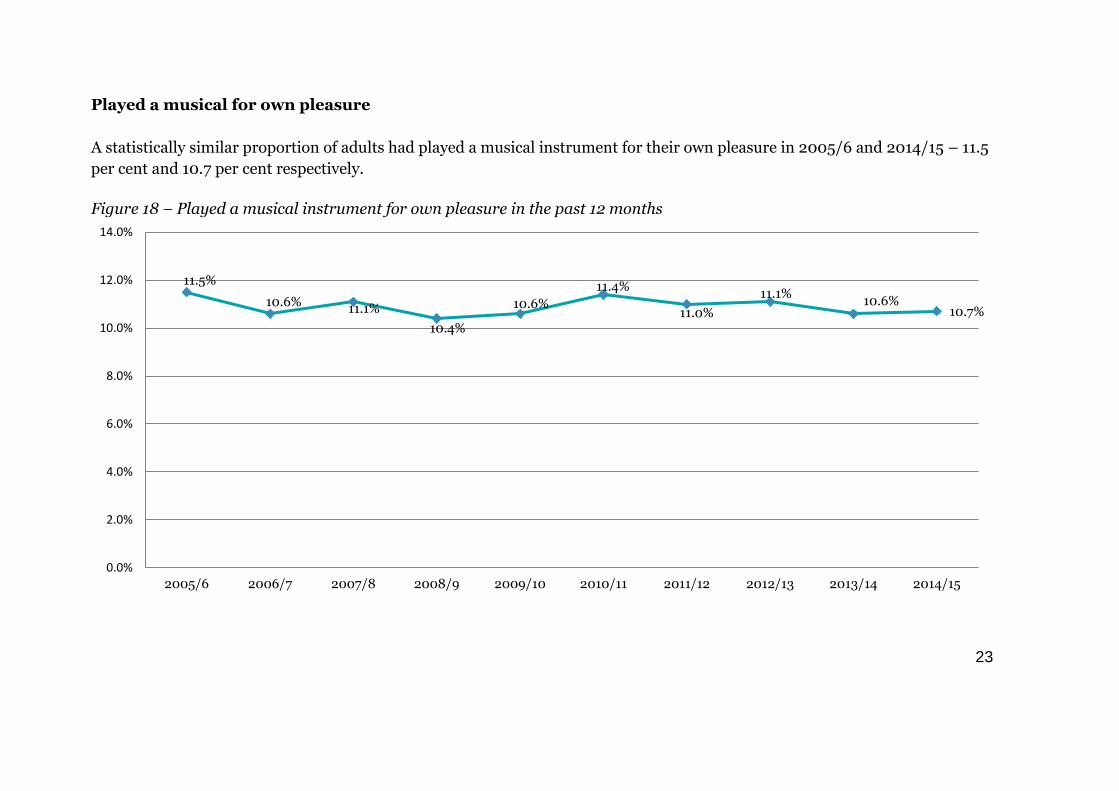
Played a musical for own pleasure
A statistically similar proportion of adults had played a musical instrument for their own pleasure in 2005/6 and 2014/15 – 11.5
per cent and 10.7 per cent respectively.
Figure 18 – Played a musical instrument for own pleasure in the past 12 months
11.5%
10.6%11.1%
10.4%
10.6%
11.4%
11.0%
11.1%10.6%
10.7%
0.0%
2.0%
4.0%
6.0%
8.0%
10.0%
12.0%
14.0%
2005/6 2006/7 2007/8 2008/9 2009/10 2010/11 2011/12 2012/13 2013/14 2014/15
24
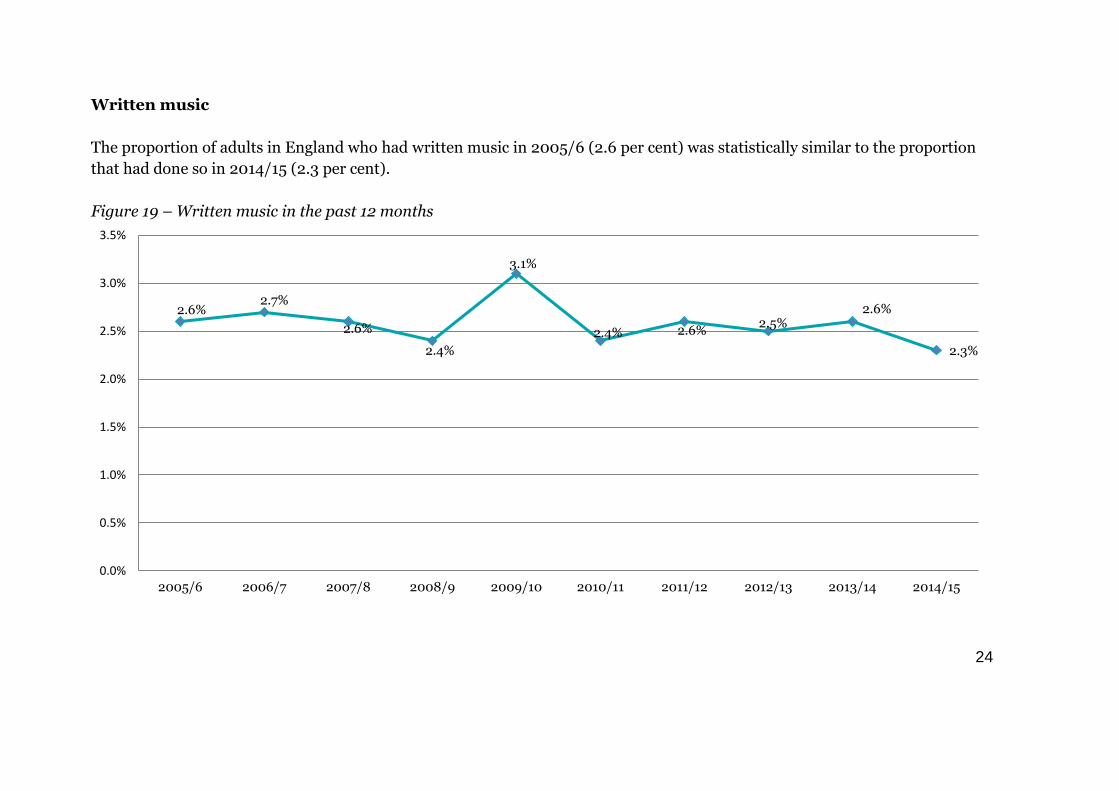
Written music
The proportion of adults in England who had written music in 2005/6 (2.6 per cent) was statistically similar to the proportion
that had done so in 2014/15 (2.3 per cent).
Figure 19 – Written music in the past 12 months
2.6%2.7%
2.6%
2.4%
3.1%
2.4% 2.6%2.5%
2.6%
2.3%
0.0%
0.5%
1.0%
1.5%
2.0%
2.5%
3.0%
3.5%
2005/6 2006/7 2007/8 2008/9 2009/10 2010/11 2011/12 2012/13 2013/14 2014/15
25
Appendix A - About the Taking Part survey
Taking Part is a major, continuous survey of cultural and sport participation in England, commissioned by the Department for
Culture, Media and Sport in partnership with Arts Council England, Sport England and Historic England.
Every year it collects detailed information from adults (aged 16 and over) in England about their attendance at a wide variety of
arts events, museums, galleries, libraries and heritage sites, and about their participation in creative activities and sport in the
last 12 months. The survey has been conducted since July 2005 and since 2008 there has also been a child survey.
Findings from Taking Part, including national trends and some regional analysis, are released twice a year by the Department
for Culture, Media and Sport. An annual report summarises trends over the financial year. All these reports can be found at:
https://www.gov.uk/government/organisations/department-for-culture-media-sport/series/taking-part
In March 2016 DCMS published a strategy outlining proposed developments to the Taking Part survey over the next five years:
https://www.gov.uk/government/publications/taking-part-a-strategy-for-the-next-five-years
26
Appendix B - Technical note
Arts Engagement ‘Engagement’ in the arts is calculated by looking at attendance and/or participation in a range of arts events and activities. Adult ‘engagement’ is calculated by the proportion of adults who engage in the arts at least once in the past 12 months, whether it is through attending arts events, participating in arts activities, or through a mixture of both. This includes any of the following activities or events:
Activities Events Dance – ballet or other dance (for fitness and not for fitness) Visual art exhibition (e.g. paintings, photography or sculpture) Singing – live performance or rehearsal/practice (not karaoke) Craft exhibition (not crafts market) Musical instrument – live performance, rehearsal/practice or played for own pleasure
Event which included video or digital art
Written music Event connected with books or writing Theatre – live performance or rehearsal/practice (e.g. play or drama)
Street arts (art in everyday surroundings like parks, streets or shopping centre)
Opera/musical theatre – live performance or rehearsal/practice Public art display or installation (an art work such as sculpture that is outdoors or in a public place)
Carnival (e.g. as a musician, dancer or costume maker) Circus (not animals) Street arts (art in everyday surroundings like parks, streets, shopping centre)
Carnival
Circus skills (not animals) – learnt or practised Culturally specific festival (e.g. Mela, Baisakhi, Navratri) Visual art – (e.g. painting, drawing, printmaking or sculpture) Theatre (e.g. play, drama, pantomime) Photography – (as an artistic activity, not family or holiday ‘snaps’)
Opera/musical theatre
Film or video – making as an artistic activity (not family or holidays)
Live music performance (e.g. classical, jazz or other live music event but not karaoke)
27
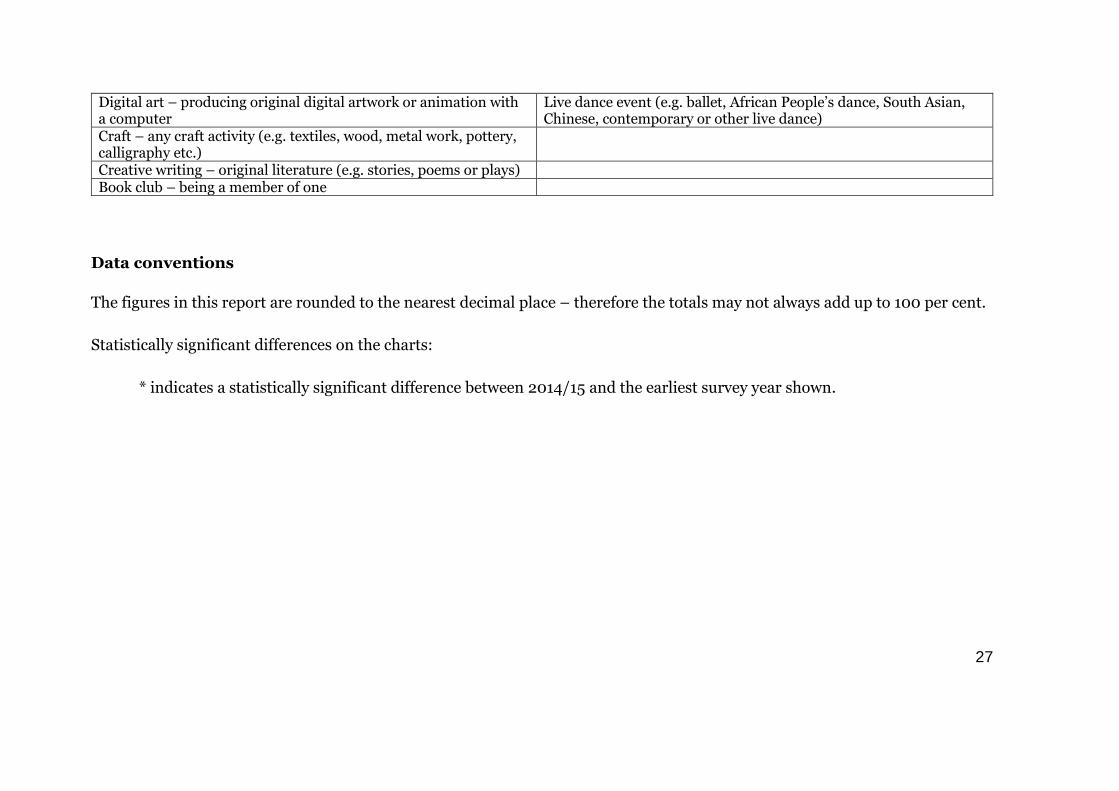
Digital art – producing original digital artwork or animation with a computer
Live dance event (e.g. ballet, African People’s dance, South Asian, Chinese, contemporary or other live dance)
Craft – any craft activity (e.g. textiles, wood, metal work, pottery, calligraphy etc.)
Creative writing – original literature (e.g. stories, poems or plays) Book club – being a member of one
Data conventions
The figures in this report are rounded to the nearest decimal place – therefore the totals may not always add up to 100 per cent.
Statistically significant differences on the charts:
* indicates a statistically significant difference between 2014/15 and the earliest survey year shown.
28
Statistical significance
Significance testing has been used to identify where differences are statistically significant at the 95 per cent level and not due to
chance. Only where the differences are significant are they noted in the text and on the charts. A significant increase or decrease
at the 95 per cent level means that there is less than a 5 per cent (1 in 20) chance that the difference observed within the
sampled respondents is not representative of the population as a whole.
Weighting The data are weighted to ensure the representativeness of the Taking Part sample. Weighting is based on mid-2009 population estimates from the Office for National Statistics.


