Taking stock of clean energy policy and private sector investment Robert Gross and Becky Mawhood Centre for Energy Policy and Technology Imperial College London Imperial College Energy Futures Lab
Transcript
Taking stock of clean energy policy and private sector investment
Robert Gross and Becky MawhoodCentre for Energy Policy and Technology
Imperial College London
Imperial College Energy Futures Lab
Outline
• Context – the decarbonisation challenge and growth in green energy
• The policy map• The investment challenges• What’s policy been doing and what does policy
need to do?• Conclusions
The scale of the climate challenge
IEA, 2010 “Energy Technology Perspectives: Scenarios & Strategies to 2050”
Increasing demand from developing countries
Source: IEA WEO 2012 Presentation to Press
Investment flows
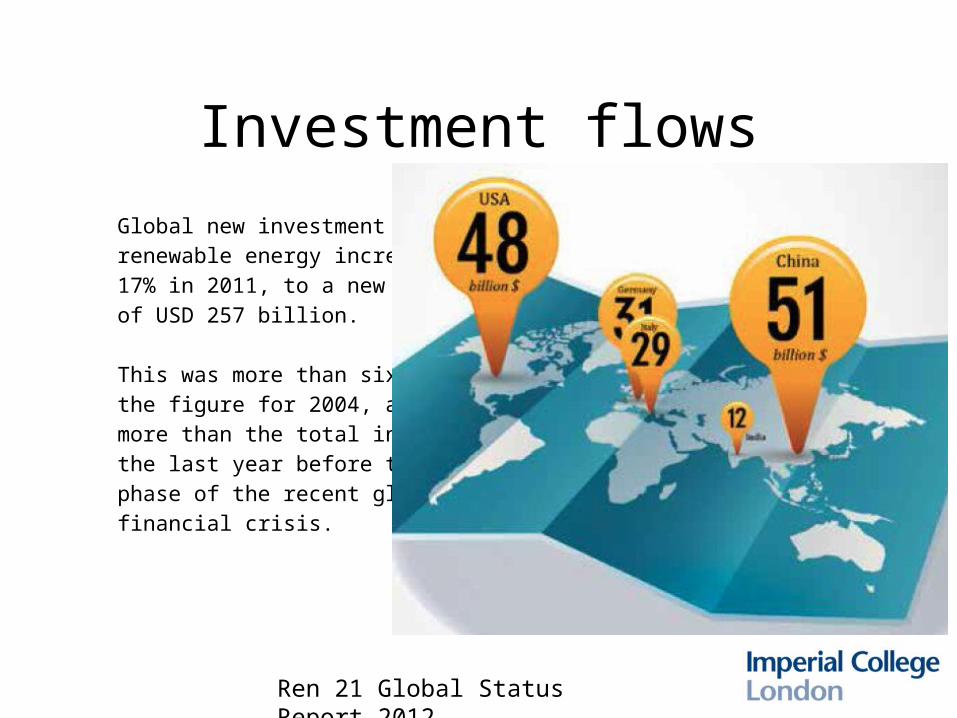
Ren 21 Global Status Report 2012
Global new investment in renewable energy increased17% in 2011, to a new recordof USD 257 billion.
This was more than six timesthe figure for 2004, and 94%more than the total in 2007,the last year before the acutephase of the recent globalfinancial crisis.
A growing fraction of investment
Proportion of investment in developing countries
Source: Frankfurt School-UNEP Centre/BNEF (2013). Global Trends in Renewable Energy Investment 2013.
Increasing policy
interest
• 138 countries have targets
• 127 countries have support policies
• Two-thirds of these are emerging economies
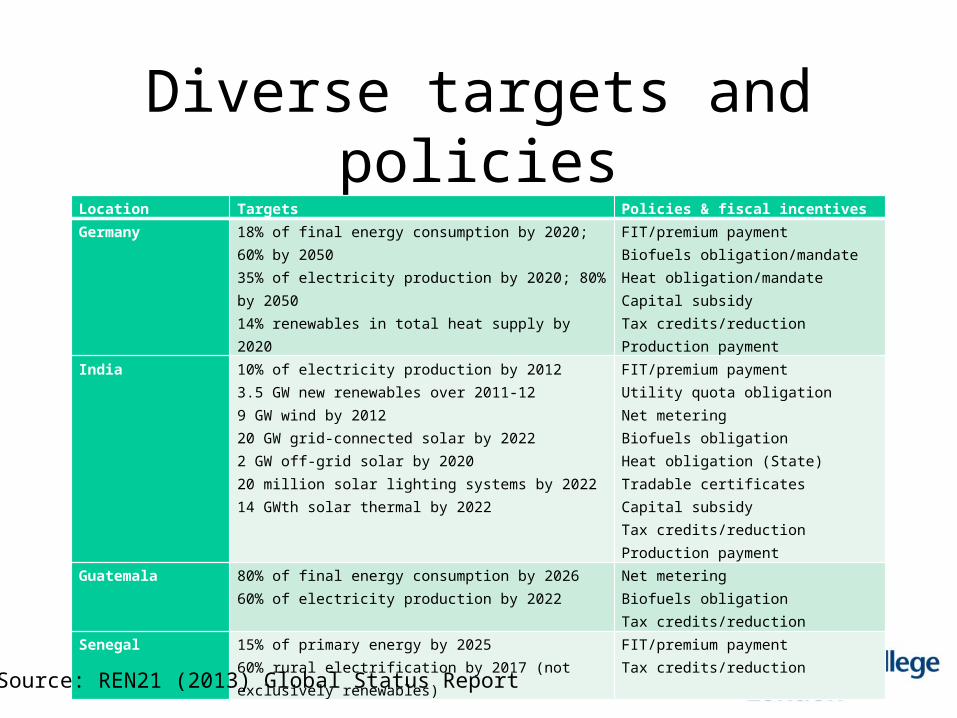
Source: REN21(2013) Global Status Report
Diverse targets and policiesLocation Targets Policies & fiscal incentivesGermany 18% of final energy consumption by 2020; 60% by 2050
35% of electricity production by 2020; 80% by 205014% renewables in total heat supply by 2020
India 10% of electricity production by 20123.5 GW new renewables over 2011-129 GW wind by 201220 GW grid-connected solar by 20222 GW off-grid solar by 202020 million solar lighting systems by 202214 GWth solar thermal by 2022
What do we need?– £75b required for new gen capacity *
– £30b alone for offshore wind ?**
– Current big 6 spend around £5b/year
– Dash for gas was about £11b total
– Total market value of all existing UK generation plant is c. £50b***
– Huge plans for economic infrastructure at UK, EU and global level
– UK policy/investment environment attractive vs peers?•EMR WP, Chapter 2 ** DECC Roadmap (at current prices) *** SSE, An Energy White Paper
Africa’s is scale too – but also source
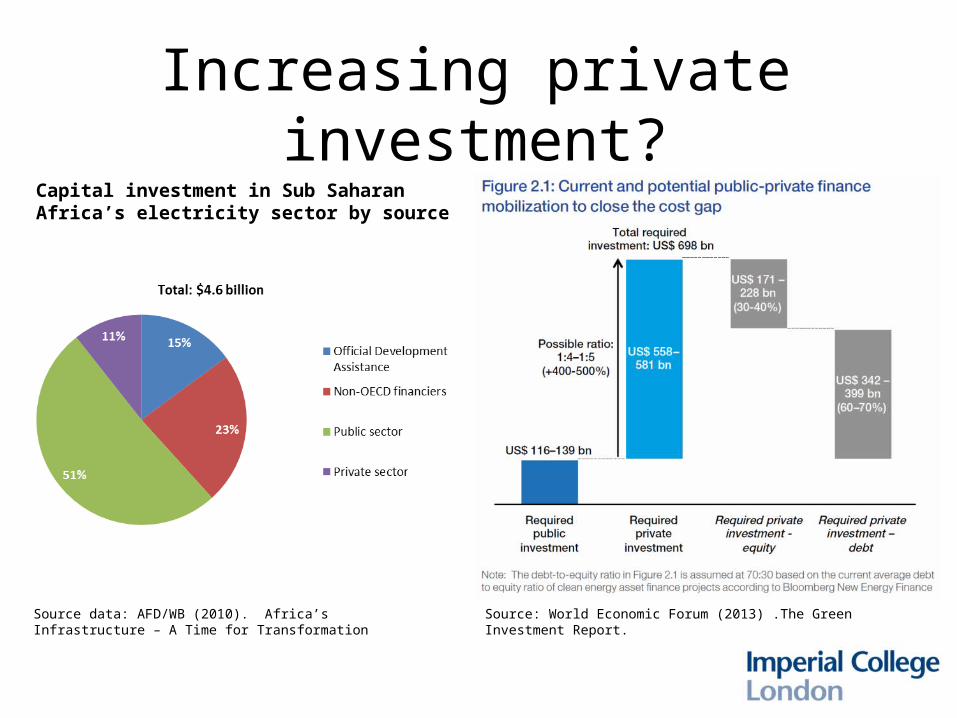
Source data: AFD/WB (2010). Africa’s Infrastructure – A Time for Transformation
Capital investment in Sub Saharan Africa’s electricity sector by source
Increasing private investment?
Source: World Economic Forum (2013) .The Green Investment Report.Source data: AFD/WB (2010). Africa’s Infrastructure – A Time for Transformation
Capital investment in Sub Saharan Africa’s electricity sector by source
Looking ahead – what’s policy trying to achieve?
1. Buy down costs
IEA 2000, Learning curves report
Mott Macdonald and the CCC 2011
Average module price reduction over time (left) versus annual PV cell/module production (right)O'Rourke et al., 2009 in FITT Research Report. Deutsche Bank. May 2008. 2009.
PV – policies and buy down….
EPIA and EU PV Technology Platform, Solar Europe Industry Initiative (SEII). Summary implementation plan 2010-1012, in EPIA Draft Report, April 2010. 2010.
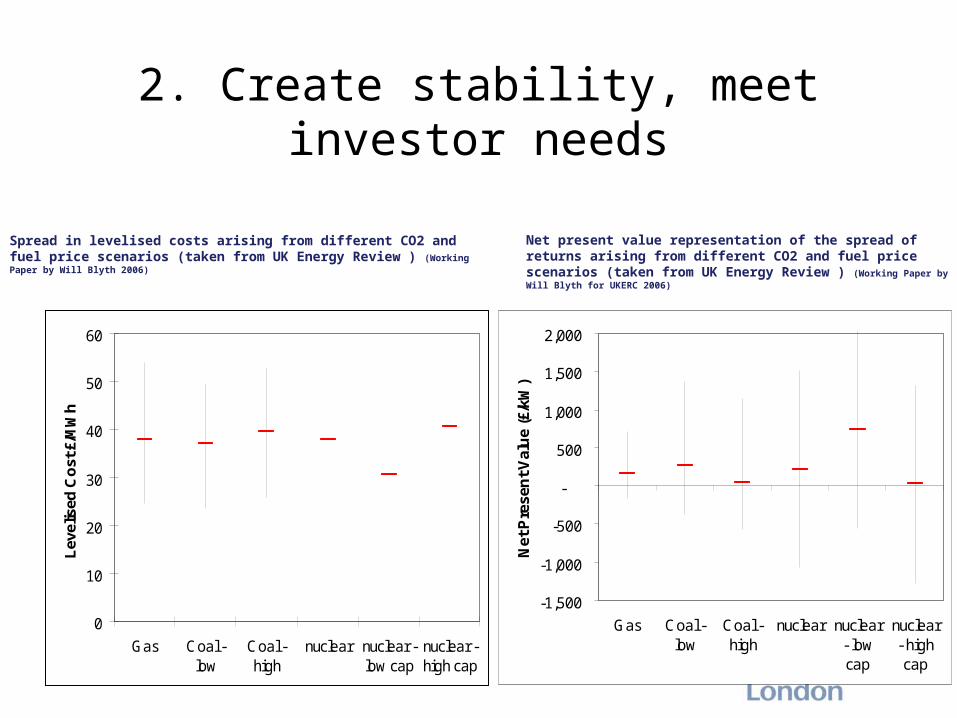
2. Create stability, meet investor needs
-1,500
-1,000
-500
-
500
1,000
1,500
2,000
Gas Coal -low
Coal -high
nuclear nuclear- lowcap
nuclear- highcap
Net
Pre
sen
t Val
ue
(£/k
W)
0
10
20
30
40
50
60
Gas Coal -low
Coal -high
nuclear nuclear -low cap
nuclear -high cap
Lev
elis
ed C
ost
£/M
Wh
Spread in levelised costs arising from different CO2 and fuel price scenarios (taken from UK Energy Review ) (Working Paper by Will Blyth 2006)
Net present value representation of the spread of returns arising from different CO2 and fuel price scenarios (taken from UK Energy Review ) (Working Paper by Will Blyth for UKERC 2006)
Policies like the UK CfD FiTs transfer risk
But also 3. suit the context….
• Institutional and political feasibility are key– E.g. Senegal ASER
• conceptually strong, popular with donors, good leverage but… slow progress, turbulent management, ‘blocking’ by Senelec, etc…
• Need to avoid tail wags dog – liberalised approach to suit donor beliefs not beneficiary needs
• Affordability and believability also essential• Who does what, with what?
• Incumbents/new entrants, large scale/small scale, new tech/old tech, government/companies, community/profit….
Conclusions/thoughts
• Green growth is already a reality • Policy more contested, trade offs now central• Continuation is not a given, FF renaissance…? • Policy essential, we know (broadly) what works• What works is context specific – IF is key• Decades of experience
– opportunity to learn from what works– Avoid pointless policy ‘innovation’ = ground hog day?