Taking Your 401(k) Plan to the Next Level: Cutting Edge Strategies for Increasing Savings and Improving Outcomes Lori Lucas, CFA Executive Vice President DC Practice Leader Callan Associates [email protected]Stacy L. Schaus, CFP® Executive Vice President DC Practice Leader PIMCO
• In February 2013, the Department of Labor issued “Target Date Retirement Funds - Tips for ERISA Plan Fiduciaries.”
• General guidance geared “to assist plan fiduciaries in selecting and monitoring TDFs and other investment options in 401(k) and similar participant-directed individual account plans.” – Establish a process for comparing and selecting TDFs.
– Establish a process for the periodic review of selected TDFs.
– Understand the fund’s investments – the allocation in different asset classes (stocks, bonds, cash), individual investments, and how these will change over time.
– Review the fund’s fees and investment expenses.
– Inquire about whether a custom or non-proprietary target date fund would be a better fit for your plan.
– Develop effective employee communications.
– Take advantage of available sources of information to evaluate the TDF and recommendations you received regarding the TDF selection
– Document the process.
Source: Callan 2013 DC Trends Survey
Current State of Target Date Fund
Selection by Plan Sponsors
A Better Way to Evaluate Target Date
Funds: Retirement Income Adequacy
• To understand the potential outcomes of target date funds, Callan uses Monte
Carlo simulation and projects the retirement income replacement potential for
target date fund glide paths (asset allocations) over various time periods.
• The following assumptions are used in Callan’s Monte Carlo simulations:
– 1,000 scenarios
– Starting salary of participant: $25,000 at age 25
– Annual salary growth rate: 3.5%
– Aggregate annual contribution rate (plan sponsor and participant): 12%
– Life-only annuity: A static 5.5% interest rate and a 2.75% cost of living
adjustment (COLA).
• Callan compares the glide paths to the average or consensus target date glide
path.
• Callan also examines the potential risk of each glide path.
Getting to the Bottom Line: Income
Replacement Potential
Glidepath A Glidepath B Glidepath C Callan Consensus
10th Percentile 133.1 96.4 64.5 101.0
25th Percentile 93.9 73.5 54.6 77.1
Median 63.5 56.1 44.9 57.5
75th Percentile 43.9 42.4 37.1 43.2
90th Percentile 32.5 33.5 31.4 33.1
95th Percentile 27.2 29.4 28.7 28.6
99th Percentile 20.4 24.1 24.5 23.2
• Primary risk to participant is failure to achieve a desired income replacement level
0%
20%
40%
60%
80%
100%
120%
140%
Age 65
Source: Callan TDVantage. Assumes retirement at age 65 and a target income replacement ratio of 65% and excludes Social Security.
48 37 9 40 Target 65%
Annuitized Income Replacement Ratio (%)
An Alternative View of Risk
0%
2%
4%
6%
8%
10%
12%
14%
16%
Later Savings (age 50-65)
Glidepath A Glidepath B Glidepath C Callan Consensus
1st Percentile 16.5 13.1 9.7 13.2
5th Percentile 14.9 11.9 8.4 12.1
10th Percentile 13.8 11.2 7.7 11.3
25th Percentile 12.5 10.2 6.9 10.2
Median 10.9 9.0 6.0 9.1
75th Percentile 9.7 7.9 5.2 8.0
90th Percentile 8.4 6.9 4.5 7.0
Source: Callan TDVantage
Dollar Weighted Risk (%)
Zeroing in On Target Date
Fund Risk
0%
5%
10%
15%
20%
25%
30%
Age 55
Source: Callan TDVantage
Glidepath A Glidepath B Glidepath C Callan Consensus
75th Percentile -0.58 0.64 1.85 0.25
90th Percentile -7.82 -5.29 -1.15 -5.47
95th Percentile -13.09 -9.33 -3.07 -9.75
99th Percentile -20.63 -15.52 -7.25 -15.87
-25%
5%
0%
-5%
-10%
-15%
-20%
“Worst-Case” Single Year Return (%)
Risks in Retirement • Target Date Fund Longevity Risk
Source: Callan TDVantage
Spending Longevity for Spending Rule @65%
Age
% P
rob
ab
lity
of
Sp
en
din
gU
nti
l V
ari
ou
s A
ge
s
0% 0%
10% 10%
20% 20%
30% 30%
40% 40%
50% 50%
60% 60%
70% 70%
80% 80%
90% 90%
75 80 85 90 95 100 105
T Rowe
Fidelity Actv
PIMCO
CAI ALL Consensus
Spending Longevity Risk (65% Income Replacement)`
Glidepath B
Glidepath C
CAI Consensus
Glidepath A
A More Complete Risk • Return Picture
Source: Callan TDVantage
6% 7% 8% 9% 10% 11% 12% 13%0%
10%
20%
30%
40%
50%
Fidelity Actv
CAI ALL Consensus
PIMCO
T Rowe
$ Wtd. Risk Total Pre-Retirement (age 25-65)
% P
rob
ab
ilit
y o
f S
pe
nd
ing
un
til
ag
e 9
5
Glidepath A
Glidepath B
Glidepath C
Callan Consensus
4% 5% 6% 7% 8% 9% 10%0%
10%
20%
30%
40%
50%
T Rowe
Fidelity Actv
PIMCO
CAI ALL Consensus
$ Wtd. Risk Total Retirement (age 65+)
Av
ail
ab
ilty
of
Sp
en
din
g u
nti
l a
ge
95
Glidepath A
Glidepath B
Glidepath C
Callan Consensus
Spending Longevity Risk (65% Income Replacement)
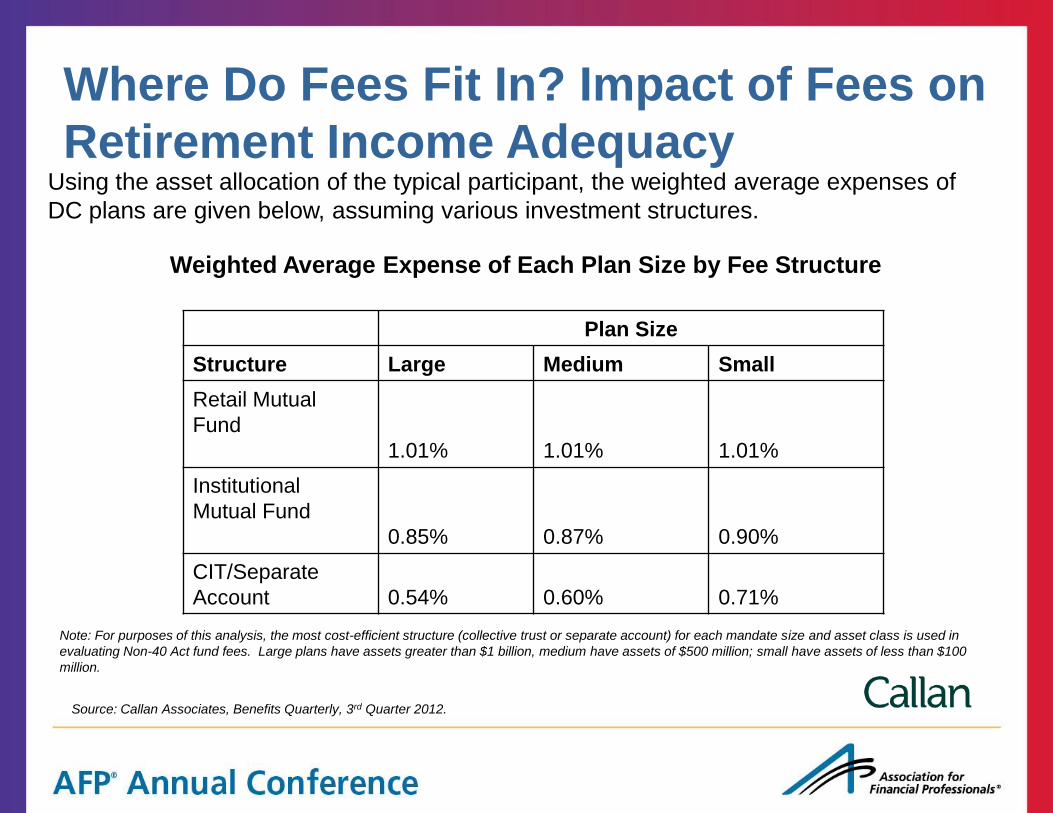
Where Do Fees Fit In? Impact of Fees on
Retirement Income Adequacy Using the asset allocation of the typical participant, the weighted average expenses of
DC plans are given below, assuming various investment structures.
Weighted Average Expense of Each Plan Size by Fee Structure
Note: For purposes of this analysis, the most cost-efficient structure (collective trust or separate account) for each mandate size and asset class is used in
evaluating Non-40 Act fund fees. Large plans have assets greater than $1 billion, medium have assets of $500 million; small have assets of less than $100
Solutions A wide array of possible answers to the question: how do we help
participants manage income in retirement?
• Tools and projections
• Managed payout funds and managed accounts
• Rollover solutions:
– Annuities as a form of distribution
– Fixed annuity platforms
• Stand alone in-plan annuities:
– Deferred Fixed Annuities
– Guaranteed Minimum Withdrawal Products
• Annuities as a component of Target Date Funds
• Longevity insurance
Meeting All of the Requirements
is Difficult • No Silver Bullet: There are Always Trade-Offs
Flexibility Guarantee
Onus on Employee Fiduciary Liability
Retirement Income Decision Tree
No Guarantee Guarantee
Deferred
Fixed
Annuity
GMWB Distribution
Annuity
Managed
Account
Retirement
Income
Projection
Retirement
Income
Projection
Managed
Payout
Fund
Guarantee No Guarantee
Rollover
Annuity
Platform
In Plan Out of Plan
Retirement Income Solutions:
Where is the Focus • Most plan
sponsors (74%) do not offer retirement income solutions within the DC plan.
• However, prevalence of in-plan guaranteed income-for-life solutions increased to 6.5% in 2012 from 1.3% in 2011.
*Multiple responses were allowed.
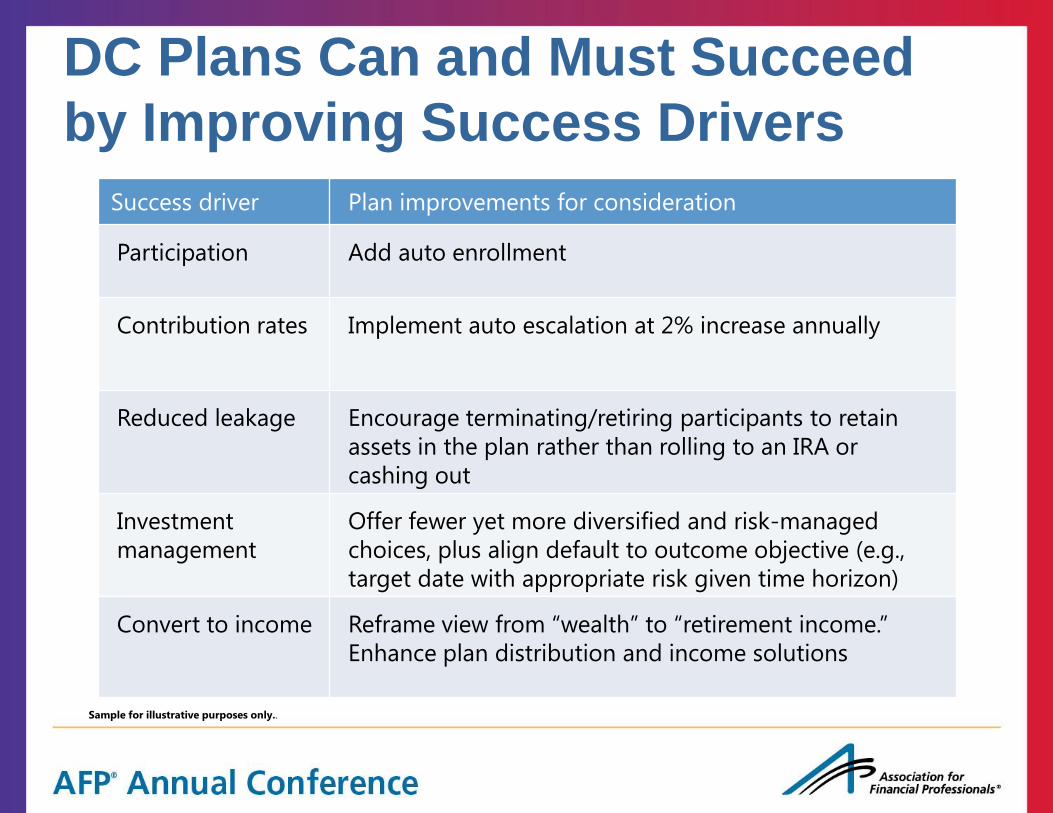
Success driver Plan improvements for consideration
Participation Add auto enrollment
Contribution rates Implement auto escalation at 2% increase annually
Reduced leakage Encourage terminating/retiring participants to retain
assets in the plan rather than rolling to an IRA or
cashing out
Investment
management
Offer fewer yet more diversified and risk-managed
choices, plus align default to outcome objective (e.g.,
target date with appropriate risk given time horizon)
Convert to income Reframe view from “wealth” to “retirement income.”
Enhance plan distribution and income solutions
DC Plans Can and Must Succeed
by Improving Success Drivers
Sample for illustrative purposes only..
Sample for illustrative purposes only. Not indicative of the past or future performance of any PIMCO product.
The income replacement target illustrates an example of the percent of their income that most plan participants will need to replace at retirement.
We define success as building and preserving purchasing power to meet retirement income needs for the majority of the people regardless of the economic environment
INCOME REPLACEMENT TARGET
RealRetirement_phil_13b
OUTCOME-FOCUSED
MARKET AVERAGE
100% 0% 50% 25% 75% 125%
PIMCO’s philosophy: Create investments that
enable people to retire successfully
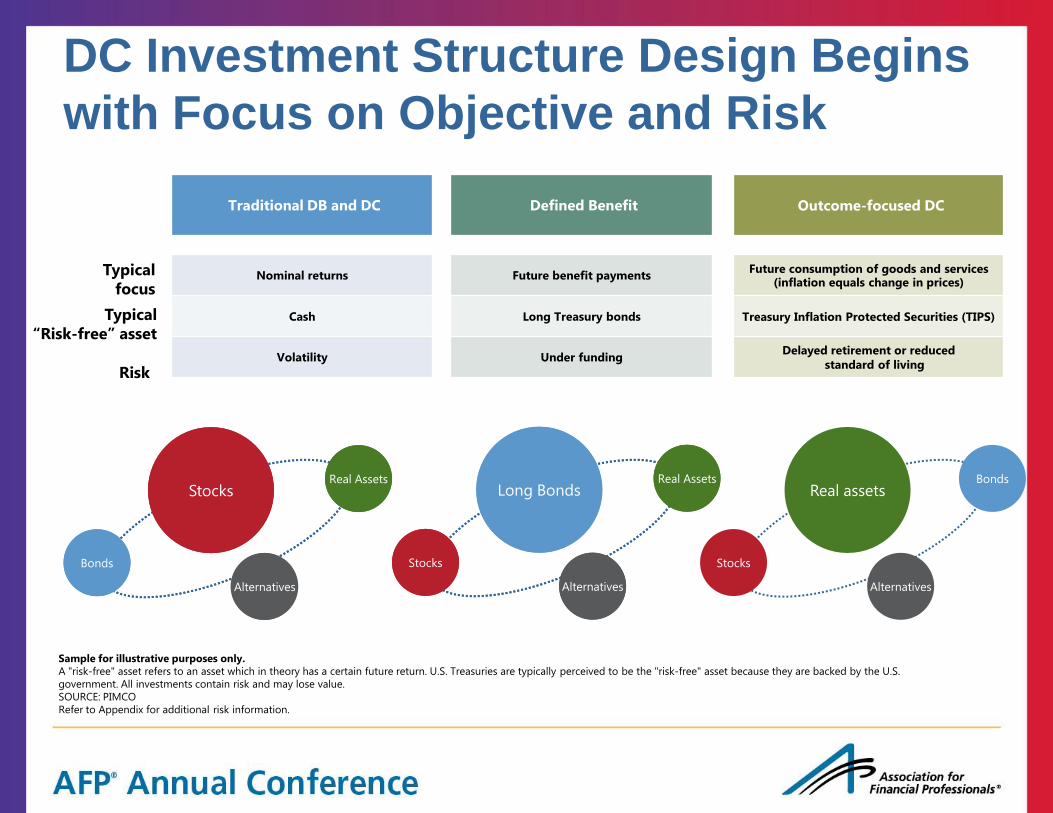
Sample for illustrative purposes only.
A "risk-free" asset refers to an asset which in theory has a certain future return. U.S. Treasuries are typically perceived to be the "risk-free" asset because they are backed by the U.S.
government. All investments contain risk and may lose value.
SOURCE: PIMCO
Refer to Appendix for additional risk information.
Traditional DB and DC
Nominal returns
Cash
Volatility
Typical
focus
Typical
“Risk-free” asset
Bonds
Real Assets
Alternatives
Stocks
Stocks
Bonds
Alternatives
Real assets
Stocks
Real Assets
Alternatives
Long Bonds
Defined Benefit
Future benefit payments
Long Treasury bonds
Under funding
Outcome-focused DC
Future consumption of goods and services (inflation equals change in prices)
Treasury Inflation Protected Securities (TIPS)
Delayed retirement or reduced
standard of living
Bonds
Real Assets
Alternatives
Stocks
Stocks
Real Assets
Alternatives
Long Bonds
DC Investment Structure Design Begins
with Focus on Objective and Risk
Risk
Tier I: “Do it for me”
Investment default should seek probability of success
Asset allocation strategy may be target date, target risk or
managed account
Approach should help build and preserve purchasing power as
well as manage volatility and market shocks risks
Tier II: “Do it myself”
Core investment line up should also seek to increase probability
of success
Range of investment choices should focus on diversification and
risk mitigation for changing economic times
Investment menu influences selection “naïve diversification (1/n)”
providing “unintentional advice”
Refer to Appendix for additional investment strategy and risk information.
Participants should strive to
succeed regardless of approach
As of 30 June 2013
SOURCE: PIMCO, MarketGlide
Hypothetical example for illustrative purposes only
* Outcome-Focused glide path is represented by the PIMCO Glide Path.
Tail risk hedge assumption: S&P 500 put options with 1-year maturity, 25% S&P 500 Index implied volatility, risk free rate of zero. Implied volatility surface is available since April 2005. For
data before 2005, a threshold factor augmented vector auto-regression model was used to interpolate the implied volatility surface based on market factors including realized volatility, daily
stock return and lagged values of the model's interpolated volatilities.
1 Maximum Loss is defined as the average expected loss at either 99% or 95% confidence level for a yearly time horizon. Shown as positive percentage. The sample of risk factors is from
January 1970 through the present date.
2 Value-at-Risk (VaR) is an estimate of the minimum expected loss at a desired level of significance.
Sector allocation data for all glide paths illustrated has been obtained and licensed through MarketGlide. Index proxies for each sector have been assigned by PIMCO. For glide path sector
allocation, index proxy and risk factor detail please reference the following pages.
Refer to Appendix for additional performance and fee, hypothetical example, investment strategy, portfolio analysis, risk, and VaR information.
Set the risk budget on the maximum potential loss a participant may incur in any given year and still likely meet their retirement income goal
0%
5%
10%
15%
20%
25%
30%
35%
40%
40 30 20 10 0
Years to retirement
VaR (99%)1
Market average glide path
Outcome-focused glide path*
Outcome-focused Glide Path with tail risk hedging*
0%
5%
10%
15%
20%
25%
30%
35%
40%
40 30 20 10 0
Years to retirement
VaR (95%)1
Market average glide path
Outcome-focused glide path*
Outcome-focused Glide Path with tail risk hedging*
* Outcome-Focused glide path is represented by the PIMCO Glide Path. 1 U.S. Large Cap: S&P 500 Index; U.S. Small Cap: Russell 2000 Index; Non-U.S. Equities: MSCI EAFE Total Return, Net Div Index; EM Equity: MSCI EM Index; Real Estate: Dow Jones U.S. Select REIT
TR Index; Commodities: Dow Jones UBS Commodity TR Index; High Yield: BofA Merrill Lynch U.S. High Yield, BB-B Rated, Constrained Index; Emerging Market Bonds: JPMorgan Government
Bond Index - Emerging Markets Global Diversified (Unhedged); Global Bonds: JPMorgan GBI Global Index (USD Hedged); Fixed Income: Barclays U.S. Aggregate Index; TIPS: Barclays U.S. TIPS
Index; Long Treasuries: Barclays Long-Term Treasury Index; Long TIPS: Barclays U.S. TIPS: 10 Year+ Index; Cash: BofA Merrill Lynch 3-Month Treasury Bill Index.
Refer to Appendix for additional asset allocation, chart, glide path, index, investment strategy and risk information.
OUTCOME –FOCUSED
DIFFERENTIATION
More risk diversified blend of
return-seeking assets
Commitment to inflation-
protection throughout
Potentially lower risk (i.e., loss
potential) especially near
retirement
MARKET AVERAGE GLIDE PATH
Heavy allocation to equities
Small allocation to inflation-
protection assets
Relatively high exposure to risk
assets (i.e., loss potential) near
retirement
0%
20%
40%
60%
80%
100%
40 35 30 25 20 15 10 5 0
Allo
cati
on
(%
)
Years to retirement
Market average glide pathCash
U.S. fixed income
Long treasuries
Global bonds
Emerging market bonds
High yield
TIPS
Long TIPS
Commodities
Real estate
U.S. large cap equities
U.S. small cap equities
Non-U.S. developed equities
Emerging market equities
0%
20%
40%
60%
80%
100%
40 35 30 25 20 15 10 5 0
Allo
cati
on
(%
)
Years to retirement
Outcome-focused Glide PathCash
U.S. fixed income
Long treasuries
Global bonds
Emerging market bonds
High yield
TIPS
Long TIPS
Commodities
Real estate
U.S. large cap equities
U.S. small cap equities
Non-U.S. developed equities
Emerging market equities
*
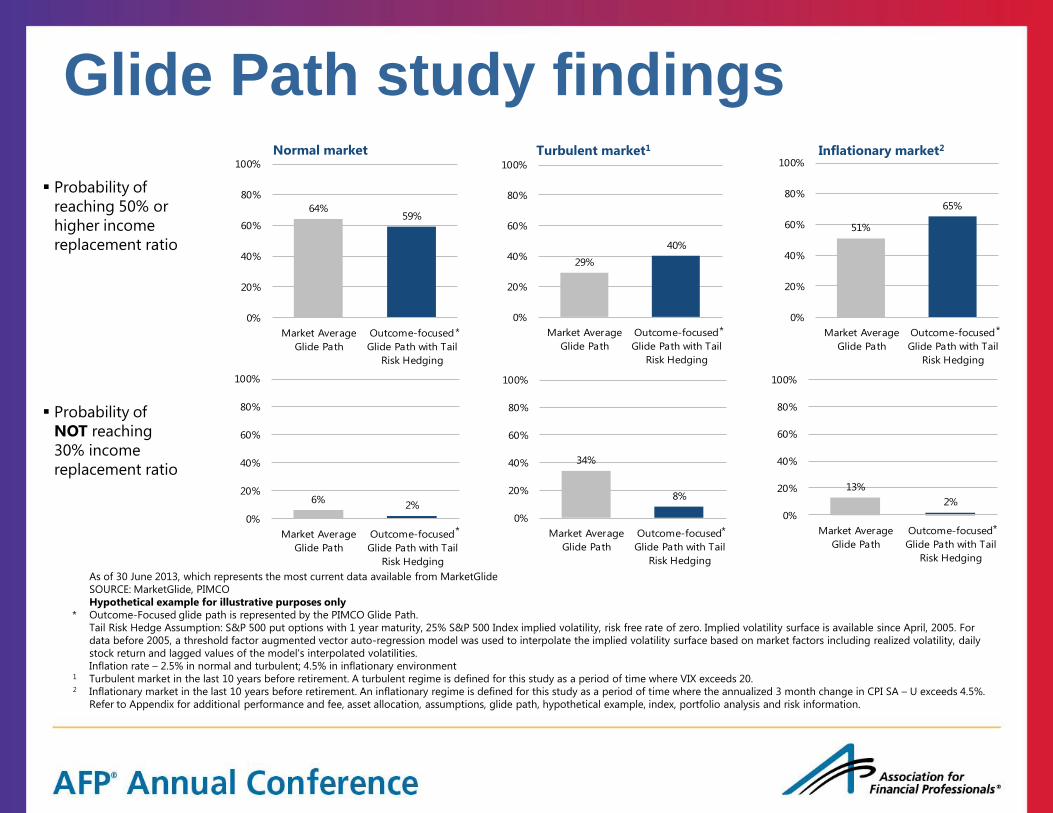
Normal market Inflationary market2 Turbulent market1
As of 30 June 2013, which represents the most current data available from MarketGlide
SOURCE: MarketGlide, PIMCO
Hypothetical example for illustrative purposes only
* Outcome-Focused glide path is represented by the PIMCO Glide Path.
Tail Risk Hedge Assumption: S&P 500 put options with 1 year maturity, 25% S&P 500 Index implied volatility, risk free rate of zero. Implied volatility surface is available since April, 2005. For
data before 2005, a threshold factor augmented vector auto-regression model was used to interpolate the implied volatility surface based on market factors including realized volatility, daily
stock return and lagged values of the model's interpolated volatilities.
Inflation rate – 2.5% in normal and turbulent; 4.5% in inflationary environment 1 Turbulent market in the last 10 years before retirement. A turbulent regime is defined for this study as a period of time where VIX exceeds 20. 2 Inflationary market in the last 10 years before retirement. An inflationary regime is defined for this study as a period of time where the annualized 3 month change in CPI SA – U exceeds 4.5%.
Refer to Appendix for additional performance and fee, asset allocation, assumptions, glide path, hypothetical example, index, portfolio analysis and risk information.
Probability of
reaching 50% or
higher income
replacement ratio
Probability of
NOT reaching
30% income
replacement ratio
64%59%
0%
20%
40%
60%
80%
100%
Market Average
Glide Path
Outcome-focused
Glide Path with Tail
Risk Hedging
29%
40%
0%
20%
40%
60%
80%
100%
Market Average
Glide Path
Outcome-focused
Glide Path with Tail
Risk Hedging
51%
65%
0%
20%
40%
60%
80%
100%
Market Average
Glide Path
Outcome-focused
Glide Path with Tail
Risk Hedging
6%2%
0%
20%
40%
60%
80%
100%
Market Average
Glide Path
Outcome-focused
Glide Path with Tail
Risk Hedging
34%
8%
0%
20%
40%
60%
80%
100%
Market Average
Glide Path
Outcome-focused
Glide Path with Tail
Risk Hedging
13%
2%
0%
20%
40%
60%
80%
100%
Market Average
Glide Path
Outcome-focused
Glide Path with Tail
Risk Hedging
* * *
* * *
Glide Path study findings
Retirement success may carry participants further in retirement: An
income longevity scenario analysis of Outcome-focused* vs. market
average glide path
A higher likelihood of more years of income in various economic environments may be achieved by: – Improved return/risk management during working years
– Improved return/risk management post-retirement
Outcome-focused glide path with tail risk hedging may offer a higher likelihood of more years of income in all three economic environments
Assuming retirement at 65, income should be expected to last until what age
Market average Income Sleeve Outcome –focused* Income Sleeve with Tail Risk Hedging
As of 30 June 2013
Source: PIMCO, MarketGlide
Hypothetical example for illustrative purposes only.
* Outcome-Focused glide path is represented by the PIMCO Glide Path.
Tail Risk Hedge Assumption: S&P 500 put options with 1 year maturity, 25% S&P 500 Index implied volatility, risk free rate of zero. Implied volatility surface is available since April, 2005. For
data before 2005, a threshold factor augmented vector auto-regression model was used to interpolate the implied volatility surface based on market factors including realized volatility, daily
stock return and lagged values of the model's interpolated volatilities.
** Based on percent confidence interval of a distribution scenario analysis in the post-retirement decumulation phase.
1 Turbulent market in the first 10 year after retirement. A turbulent regime is defined for this study as a period of time where VIX exceeds 20. Please refer to appendix for more information. 2 Inflationary market in the first 10 years after retirement. An inflationary regime is defined for this study as a period of time where the annualized 3 month change in CPI SA – U exceeds 4.5%.
Refer to Appendix for additional performance and fee, assumptions, glide path, hypothetical example, index, portfolio analysis, and risk information.
80
78
80
79
75
77
Normal market
Turbulent market ¹
Inflationary market ²
Age
99% confidence level*
82
80
82
81
76
79
Normal market
Turbulent market ¹
Inflationary market ²
Age
95% confidence level*
pg 26 pg 26
Tier II: “Do it myself”
Core investment line up should also seek to increase probability
of success
Range of investment choices should focus on diversification and
risk mitigation for changing economic times
Investment menu influences selection “naïve diversification (1/n)”
providing “unintentional advice”
Refer to Appendix for additional investment strategy and risk information.
Tier I: “Do it for me”
Investment default should seek probability of success
Asset allocation strategy may be target date, target risk or
managed account
Approach should help build and preserve purchasing power as
well as manage volatility and market shocks risks
Refer to Appendix for additional investment strategy and risk information.
Participants should strive to
succeed regardless of approach
Refer to Appendix for additional risk information.
“1/n”
U.S. small
cap blend
U.S. small
cap growth
U.S. small
cap value
U.S. mid
cap blend
U.S. mid
cap growth
U.S. mid
cap value
U.S. large
cap blend
U.S. large
cap growth
U.S. large
cap value
Emerging
markets
Developed
non-U.S.
Capital preservation
Global fixed income
Inflation hedging
Global balanced
Diversifying
fixed income
DIVERSIFYING RISK EQUITY RISK
Participants should strive to
succeed regardless of approach
6 Equity
2 Fixed income
1 Capital preservation
1 Inflation hedging
1 Alternative
1 Global balanced
What is the optimal number of options
within these asset classes?
The vast majority of consultants suggest a two-tier plan design with target-date or target-risk (98%) and a core line up mixing active and passive funds (94%).
36%
47%
83%
94%
96%
96%
0% 20% 40% 60% 80% 100%
Alternatives
Global balanced
Inflation-hedging
Equities
Capital preservation
Fixed income
Which asset classes are included
within the optimal core menu?
n = 47 n = 47
As of 31 December 2012
SOURCE: 2013 PIMCO DC Consultant Survey
Broadly diversified core investment line
up supported
RISK PILLAR FOCUS
Equities Fixed income
Inflation-related Capital preservation-focused
Inflation hedging
Refer to Appendix for additional investment strategy and risk information.
Old
approach
New
approach
Global equity
Global fixed income
Stable value/MM/short term
STYLE BOX FOCUS
Emerging markets
Non-U.S. developed
Small U.S. growth
Small U.S. core
Small U.S. value
Mid U.S. growth
Mid U.S. value
Large U.S. growth
Large U.S. core
Large U.S. value
U.S. balanced
U.S. fixed income
Stable value/MM/short term ASSET CLASS FOCUS
Non-U.S.
Small-mid U.S.
Large U.S.
Diversifying fixed income
Core fixed income
Stable value/MM/short term
Inflation hedging
Global asset allocation
Global dividend
Income
Global balanced
Evolution of DC plan core
investment structure
Active management viewed as important in asset
allocation and nearly all major asset classes
How important is active management for
each asset class?
Given the typical DC investment core fund lineup today,
which of the below asset classes would add value to a
plan, either as a core fund or as an addition to an asset-
Very Important Important Somewhat Important n = 50
As of 31 December 2012
SOURCE: 2013 PIMCO DC Consultant Survey
DC questions to consider
• What is the specific retirement income objective for the
DC plans – for instance, to replace 30% of final pay?
• Can auto enrollment add to participants in the plans?
• Can the contribution rates be increased through auto programs or
otherwise?
• Are the target date strategies and core line up structured to meet
the plan retirement income objective?
• Is the risk level imbedded in the target date strategies and core
line up appropriate?
• Do you have the appropriate and sufficient asset classes in the
plan?
• Can you group core strategies together to reduce complexity and
volatility, yet retain or add to diversification within each option?
• Are the investment options appropriate/sufficient for retirees?
Tier I: Target date default
Tier 2: Core investment offerings
Custom target-date strategies:
Mix of core
Tail-risk hedging
Packaged target-date products:
Broad asset and risk diversification
Tactical asset allocation
Tail-risk hedging
Hybrid
Capital preservation
Stable value
Short-term
Money market
Global fixed income
Core bond
Global
Yield
Inflation hedging
TIPS, commodities, and real estate
Global multi-asset
Outcome oriented
Global asset allocation
Global multi-asset/risk managed
Outcome oriented
Global equity
U.S. large, mid, small
Non-U.S. developed, emerging markets
Global dividend
How do we deliver
additional
fixed income
diversification?
How do we add
inflation hedging to
our plan?
Is our plan’s
investment default
appropriate?
Should we introduce
low volatility-
focused equity
strategies?
Is our capital
preservation strategy
optimal?
Retirement Income
At-retirement target date
Conservative and diversified fixed
income
Stable value
Income and dividend
Out-of-plan deferred annuities
How can we structure
income focused
strategies for retirees?
SOURCE: 2013 PIMCO DC Consultant Survey
Would a global asset
allocation strategy
add value?
DC Plan Design Discussion: Broader asset and risk diversification, yet fewer choices
Conclusions
• DC plans can be successful if they are outcomes focused.
• Managing investment risk is a critical ingredient in getting
people to a secure retirement.
• Retirement income replacement is a useful framework for
target date fund evaluation and selection.
• Not just returns, but contribution levels and fees matter
when it comes to retirement income adequacy.
• There is no silver bullet in managing income in retirement.
PIMCO Appendix RISK FACTOR DEFINITIONS
Duration (“interest rate” risk factor)
Duration measures a bond’s sensitivity to a parallel shock of the par yield curve. PIMCO’s systems use a scenario-based duration calculation. Our algorithm first prices the security, and
then shocks the interest rate to calculate the bond’s duration.
Our systems generate several additional versions of interest rate duration, including proprietary duration measures such as:
– Bull Duration: Bond sensitivity to a fall in interest rates,
– Bear Duration: Bond sensitivity to a rise in interest rates,
– Forward secular duration: Bond sensitivity to a forward-looking yield curve shift scenario specified by PIMCO’s Investment Committee.
Curve duration (“slope” risk factor)
Interest rate duration assumes a parallel shift in the yield curve. But parallel shifts rarely occur because monetary policy acts mostly on the short end of the curve, while inflationary
expectations are expressed in the longer end of the curve. Therefore, the yield curve typically steepens or flattens as interest rates move.
Our systems define curve duration as the price sensitivity of a bond to a steepening of the yield curve. Every day, each bond is priced using our proprietary pricing models and then
shocked to calculate its curve duration. Our algorithm uses the 10-year bond as anchor point and measures steepening as the change in the 2-to-10 year yield spread.
Corporate or credit spread duration (“credit” risk factor)
Credit spread duration measures the sensitivity of the bond’s price to changes in the spread of a reference single A-rated security. Our process to calculate credit spread duration follows
two steps:
1. First, the algorithm calculates the sensitivity of the bond price to its own spread. This process occurs overnight and leverages our proprietary pricing models.
2. Second, the algorithm translates this own-security spread duration into a duration related to the reference single A-rated security. This mapping relies on a proprietary model that
takes into account the OAS of the bond under consideration and the OAS of the reference bond.
Equity (“world and equity industry" risk factor)
World equity is a sensitivity of the portfolio to changes in the global equity markets.
Equity industry includes exposure to 34 equity industries.
Credit spread duration measures the sensitivity of the bond’s price to changes in the spread of a reference single A-rated security. Our process to calculate credit spread duration follows
two steps:
1. First, the algorithm calculates the sensitivity of the bond price to its own spread. This process occurs overnight and leverages our proprietary pricing models.
2. Second, the algorithm translates this own-security spread duration into a duration related to the reference single A-rated security. This mapping relies on a proprietary model that
takes into account the OAS of the bond under consideration and the OAS of the reference bond.
High yield (“high yield" risk factor)
High yield spread duration measures the sensitivity of the bond’s price to changes in the spread of a reference single A-rated security. Our process to calculate high yield spread duration
follows two steps:
1. First, the algorithm calculates the sensitivity of the bond price to its own spread. This process occurs overnight and leverages our proprietary pricing models.
2. Second, the algorithm translates this own-security spread duration into a duration related to the reference single A-rated security. This mapping relies on a proprietary model that
takes into account the OAS of the bond under consideration and the OAS of the reference bond.
Our process to calculate these spreads follows several steps:
1. We build yield curve simulation paths based on a swap curve.
2. We then generate cash flows and discount those cash flows with a spread (OAS) to get a par value equal to the market price.
3. Finally, we shock the OAS to get different prices. The spread durations are calculated based on those prices.
The result is a measure of the sensitivity of the bond’s price to changes in the corresponding spread. For example, for every 1 basis point of mortgage spread tightening, a portfolio with
mortgage spread duration of 1 year will rise in price by 1 basis point.
!mk_DC_Discussion_Short_App
PIMCO Appendix PERFORMANCE AND FEE
Past performance is not a guarantee or a reliable indicator of future results. Certain performance figures do not reflect the deduction of investment advisory fees (described in Part II of
PIMCO's Form ADV) in the case of both separate investment accounts and mutual funds; but they do reflect commissions, other expenses (except custody), and reinvestment of earnings. Such
fees that a client may incur in the management of their investment advisory account may reduce the client's return. For example, over a five-year period, annual advisory fees of 0.425% would
reduce compounding at 10% annually from 61.05% before fees to 57.96% after fees. The “net of fees” performance figures reflect the deduction of actual investment advisory fees but do not
reflect the deduction of custodial fees. All periods longer than one year are annualized. Separate account clients may elect to include PIMCO sector funds in their portfolio; sector funds may be
subject to additional terms and fees. For a copy of net of fees performance, unless included otherwise, please contact your PIMCO representative.
ASSUMPTIONS
Return assumptions are for illustrative purposes only and are not a prediction or projection of return. Return assumptions are an estimate of what investments may earn on average over the
long term. No fees or expenses were included in the illustration. Return assumptions have certain inherent limitations, and unlike an actual performance record, do not reflect actual trading,
liquidity constraints, fees, and/or other costs. In addition, references to future results should not be construed as an estimate or promise of results that a client portfolio may achieve. Actual
returns may be higher or lower than those shown and may vary substantially over shorter time periods.
ASSET ALLOCATION
U.S. Large Cap: S&P 500 Index;
U.S. Small Cap: Russell 2000 Index;
Non-U.S. Equities: MSCI EAFE Index;
EM Equity: MSCI EM Index;
Real Estate: Dow Jones U.S. Select REIT TR Index;
Commodities: Dow Jones UBS Commodity TR Index;
Global Bonds: JPMorgan GBI Global FX Index (Unhedged )
High Yield: Barclays U.S. High Yield index;
EM Bonds: JPMorgan Government Bond Index –
Emerging Markets Global Diversified (Unhedged);
Fixed Income: Barclays U.S. Aggregate Index;
TIPS: Barclays U.S. TIPS Index;
Long Treasuries: Barclays Long-Term Treasury Index;
Long TIPS: Barclays U.S. TIPS: 10 Year+ Index;
Cash: BofA Merrill Lynch 3-Month Treasury Bill Index.
Performance results for certain charts and graphs may be limited by date ranges specified on those charts and graphs; different time periods may produce different results.
GLIDE PATH
The glide path is intended to illustrate how allocations among asset classes change as a target-date approaches. The target asset allocation is based on a target date, which assumes a normal
retirement age of 65, and time horizons based on current longevity of persons reaching retirement in average health. The glide path is designed to reduce risk as the target retirement date
nears, but may also provide investors diversification across a variety of asset classes, with an emphasis on asset classes that may protect against inflation over time. The target allocations used
in this presentation are for illustrative purposes only. They are based on quantitative and qualitative data relating to long-term market trends, risk metrics, correlation of asset types and
actuarial assumptions of life expectancy and retirement.
The PIMCO glide path implements an optimal asset allocation mix that moves from higher risk to lower risk over time and is designed to manage the risk of an individual’s savings as they
approach retirement. The glide path acts as a “benchmark portfolio,” reflecting an allocation that is optimal with respect to our long-run, real return assumptions for each asset class (referred to
above as “capital market assumptions”). The PIMCO glide path optimization takes into account the compounding of returns over the given investment horizon, unlike standard mean-variance
analysis. PIMCO’s approach to developing a glide path incorporates liability-driven modeling in a “real return” framework, using a broad opportunity set of asset classes seeking to deliver
meaningful improvements over traditional approaches. This approach may increase the median return and narrow the range of expected future outcomes when compared to the typical
glidepath (see chart below), while hedging the risk of future inflation and reducing the risk of a shortfall in future sustainable spending power. More income is likely to distribute near the
median.
HYPOTHETICAL EXAMPLE
No representation is being made that any account, product, or strategy will or is likely to achieve profits, losses, or results similar to those shown. Hypothetical or simulated performance results
have several inherent limitations. Unlike an actual performance record, simulated results do not represent actual performance and are generally prepared with the benefit of hindsight. There
are frequently sharp differences between simulated performance results and the actual results subsequently achieved by any particular account, product, or strategy. In addition, since trades
have not actually been executed, simulated results cannot account for the impact of certain market risks such as lack of liquidity. There are numerous other factors related to the markets in
general or the implementation of any specific investment strategy, which cannot be fully accounted for in the preparation of simulated results and all of which can adversely affect actual results.
PIMCO’s methodology uses a Block Bootstrapping Model to run a portfolio through multiple hypothetical trials to generate a full distribution. Bootstrapping is similar to Monte Carlo
simulation, but instead of sampling from a theoretical distribution, it samples from an empirical distribution using historical factor returns. “Block” bootstrapping uses contiguous blocks of data,
which captures serial correlation effects in factor performance, such as momentum and reversal. Bootstrapping captures non-normality in factor returns.
Stress Testing is a simulation technique used on a portfolio to determine its reactions to different hypothetical situations. PIMCO employs methodologies which may include market or other
assumptions, subjective judgments and valuation models. Such assumptions, judgments and models may reflect PIMCO's current thinking and may be changed or modified in response to
PIMCO's perception of market conditions, or otherwise.
INVESTMENT STRATEGY
There is no guarantee that these investment strategies will work under all market conditions and each investor should evaluate their ability to invest for a long-term especially during periods of
downturn in the market. No representation is being made that any account, product, or strategy will or is likely to achieve profits, losses, or results similar to those shown.
PORTFOLIO ANALYSIS
The portfolio analysis is based on the Market Average and PIMCO glide paths. No representation is being made that the structure of the average portfolio or any account will remain the same
or that similar returns will be achieved. Results shown may not be attained and should not be construed as the only possibilities that exist. Different weightings in the asset allocation illustration
will produce different results. Actual results will vary and are subject to change with market conditions. There is no guarantee that results will be achieved. No fees or expenses were included in
the estimated results and distribution. The scenarios assume a set of assumptions that may, individually or collectively, not develop over time. The analysis reflected in this information is based
upon data at time of analysis. Forecast, estimates, and certain information contained herein are based upon proprietary research and should not be considered as investment advice or a
recommendation of any particular security, strategy or investment product.
!mk_DC_Discussion_Short_App
PIMCO Appendix PIMCO routinely reviews, modifies, and adds risk factors to its proprietary models. Due to the dynamic nature of factors affecting markets, there is no guarantee that simulations will capture all
relevant risk factors or that the implementation of any resulting solutions will protect against loss. All investments contain risk and may lose value. Simulated risk analysis contains inherent
limitations and is generally prepared with the benefit of hindsight. Realized losses may be larger than predicted by a given model due to additional factors that cannot be accurately forecasted
or incorporated into a model based on historical or assumed data.
RISK
Investing in the bond market is subject to certain risks including market, interest-rate, issuer, credit, and inflation risk. Investing in foreign denominated and/or domiciled securities may
involve heightened risk due to currency fluctuations, and economic and political risks, which may be enhanced in emerging markets. Inflation-linked bonds (ILBs) issued by a government are
fixed-income securities whose principal value is periodically adjusted according to the rate of inflation; ILBs decline in value when real interest rates rise. Treasury Inflation-Protected
Securities (TIPS) are ILBs issued by the U.S. Government. Commodities contain heightened risk including market, political, regulatory, and natural conditions, and may not be suitable for all
investors. Equities may decline in value due to both real and perceived general market, economic, and industry conditions. REITs are subject to risk, such as poor performance by the manager,
adverse changes to tax laws or failure to qualify for tax-free pass-through of income. Mortgage and asset-backed securities may be sensitive to changes in interest rates, subject to early
repayment risk, and while generally backed by a government, government-agency or private guarantor there is no assurance that the guarantor will meet its obligations. High-yield, lower-
rated, securities involve greater risk than higher-rated securities; portfolios that invest in them may be subject to greater levels of credit and liquidity risk than portfolios that do not. Tail risk
hedging may involve entering into financial derivatives that are expected to increase in value during the occurrence of tail events. Investing in a tail event instrument could lose all or a portion
of its value even in a period of severe market stress. A tail event is unpredictable; therefore, investments in instruments tied to the occurrence of a tail event are speculative. Derivatives and
commodity-linked derivatives may involve certain costs and risks such as liquidity, interest rate, market, credit, management and the risk that a position could not be closed when most
advantageous. Commodity-linked derivative instruments may involve additional costs and risks such as changes in commodity index volatility or factors affecting a particular industry or
commodity, such as drought, floods, weather, livestock disease, embargoes, tariffs and international economic, political and regulatory developments. Investing in derivatives could lose more
than the amount invested. Stable value wrap contracts are subject to credit and management risk. Investors should consult their investment professional prior to making an investment decision.
VAR
Value at Risk (VAR) estimates the risk of loss of an investment or portfolio over a given time period under normal market conditions in terms of a specific percentile threshold of loss (i.e., for a
given threshold of X%, under the specific modeling assumptions used, the portfolio will incur a loss in excess of the VAR X percent of the time. Different VAR calculation methodologies may be
used. VAR models can help understand what future return or loss profiles might be. However, the effectiveness of a VAR calculation is in fact constrained by its limited assumptions (for
example, assumptions may involve, among other things, probability distributions, historical return modeling, factor selection, risk factor correlation, simulation methodologies). It is important
that investors understand the nature of these limitations when relying upon VAR analyses.
Stress testing involves asset or portfolio modeling techniques that attempt to simulate possible performance outcomes using historical data and/or hypothetical performance modeling events.
These methodologies can include among other things, use of historical data modeling, various factor or market change assumptions, different valuation models and subjective judgments.
PIMCO has historically used factor based stress analyses that estimate portfolio return sensitivity to various risk factors. Essentially, portfolios are decomposed into different risk factors and
shocks are applied to those factors to estimate portfolio responses.
Because of limitations of these modeling techniques, we make no representation that use of these models will actually reflect future results, or that any investment actually will achieve results
similar to those shown. Hypothetical or simulated performance modeling techniques have inherent limitations. These techniques do not predict future actual performance and are limited by
assumptions that future market events will behave similarly to historical time periods or theoretical models. Future events very often occur to causal relationships not anticipated by such
models, and it should be expected that sharp differences will often occur between the results of these models and actual investment results.
!mk_DC_Discussion_Short_App
PIMCO Appendix This material contains the current opinions of the manager and such opinions are subject to change without notice. This material has been distributed for informational purposes only and
should not be considered as investment advice or a recommendation of any particular security, strategy or investment product. Information contained herein has been obtained from sources
believed to be reliable, but not guaranteed. No part of this material may be reproduced in any form, or referred to in any other publication, without express written permission. PIMCO and
YOUR GLOBAL INVESTMENT AUTHORITY are trademarks or registered trademarks of Allianz Asset Management of America L.P. and Pacific Investment Management Company LLC, respectively,
Barclays Long-Term Treasury consists of U.S. Treasury issues with maturities of 10 or more years. Prior to 1 November 2008, this index was published by Lehman Brothers.
The Barclays U.S. Aggregate Index represents securities that are SEC-registered, taxable, and dollar denominated. The index covers the U.S. investment grade fixed rate bond market, with index
components for government and corporate securities, mortgage pass-through securities, and asset-backed securities. These major sectors are subdivided into more specific indices that are
calculated and reported on a regular basis.
The Barclays U.S. TIPS Index is an unmanaged market index comprised of all U.S. Treasury Inflation Protected Securities rated investment grade (Baa3 or better), have at least one year to final
maturity, and at least $250 million par amount outstanding. Performance data for this index prior to October 1997 represents returns of the Lehman Inflation Notes Index.
Barclays U.S. TIPS: 1–10 Year is an unmanaged index market comprised of U.S. Treasury Inflation Protected securities having a maturity of at least 1 year and less than 10 years. Prior to 1
November 2008, this index was published by Lehman Brothers.
The Citigroup 3-Month Treasury Bill Index is an unmanaged index representing monthly return equivalents of yield averages of the last 3-month Treasury Bill issues.
The Consumer Price Index (CPI) is an unmanaged index representing the rate of inflation of the U.S. consumer prices as determined by the U.S. Department of Labor Statistics. There can be no
guarantee that the CPI or other indexes will reflect the exact level of inflation at any given time.
The Dow Jones Industrial Average (DJIA) is a price-weighted average of 30 actively traded “blue chip” stocks, primarily industrials, but including financials and other service-oriented companies
as well. The components, which change from time to time, represent between 15% and 20% of the market value of NYSE stocks.
Gorton and Rouwenhorst constructed a hypothetical equally-weighted performance index of commodity futures. Data was from the Commodities Research Bureau using daily prices for
individual futures contracts since 1959. The data was appended from the London Metals Exchange.
The Dow Jones UBS Commodity Total Return Index is an unmanaged index composed of futures contracts on 19 physical commodities. The index is designed to be a highly liquid and
diversified benchmark for commodities as an asset class. Prior to 7 May 2009, this index was known as the Dow Jones AIG Commodity Total Return Index.
The Dow Jones U.S. Select Real Estate Investment Trust (REIT) Total Return Index, a subset of the Dow Jones U.S. Select Real Estate Securities Total Return Index, is an unmanaged index
comprised of U.S. publicly traded Real Estate Investment Trusts. This index was formerly known as the Dow Jones Wilshire REIT Index.
The Morgan Stanley Capital International Emerging Markets Index is an unmanaged index that measures equity market performance in the global emerging markets. As of May 2005, the
Emerging Markets Index (float-adjusted market capitalization index) consisted of indices in 26 emerging countries: Argentina, Brazil, Chile, China, Colombia, Czech Republic, Egypt, Hungary,
India, Indonesia, Israel, Jordan, Korea, Malaysia, Mexico, Morocco, Pakistan, Peru, Philippines, Poland, Russia, South Africa, Taiwan, Thailand, Turkey, and Venezuela.
The MSCI EAFE (Morgan Stanley Capital International Europe, Australasia, Far East Index) is an unmanaged index of over 900 companies, and is a generally accepted benchmark for major
overseas markets. Index weightings represent the relative capitalizations of the major overseas markets included in the index on a U.S. dollar adjusted basis.
!mk_DC_Discussion_Short_App
PIMCO Appendix The MSCI World Index is a free float-adjusted market capitalization weighted index that is designed to measure the equity market performance of developed markets. The MSCI World Index
consists of the following 24 developed market country indices: Australia, Austria, Belgium, Canada, Denmark, Finland, France, Germany, Greece, Hong Kong, Ireland, Israel, Italy, Japan,
Netherlands, New Zealand, Norway, Portugal, Singapore, Spain, Sweden, Switzerland, the United Kingdom, and the United States.
The Russell 2000 Index is an unmanaged index generally representative of the 2,000 smallest companies in the Russell 3000 Index, which represents approximately 10% of the total market
capitalization of the Russell 3000 Index.
The S&P 500 Index is an unmanaged market index generally considered representative of the stock market as a whole. The index focuses on the Large-Cap segment of the U.S. equities market.
VIX, the ticker symbol for the Chicago Board Options Exchange (CBOE) Volatility Index, shows the market's expectation of 30-day volatility. It is constructed using the implied volatilities of a
wide range of S&P 500 index options. This volatility is meant to be forward looking and is calculated from both calls and puts. The VIX is a widely used measure of market risk and is often
referred to as the "investor fear gauge.”
It is not possible to invest directly in an unmanaged index.