23
TAL MOMITORING SEMlANNUAL REPORT
TAL MOMITORING
SEMlANNUAL REPORT

Abstract
1 . Swmary . . . . . . . . . . . . . . . . . . . . . . . . . . . . . . 1
A . Enviromnta1Radioac"cvity Data . . . . . . . . . . . . . . . 5
. . . . . . . . . . . . . . . . . I1 . Environmental l4onitor2q Program 8 . . . . . . . . . . . . . . . . . . . . . A . GeneralDescription 8
. . . . . . . . . . . . B . Sampling and Sample Preparation Methods 9 . . . . . . . . . . . . . . C . Gourking and Calibration Procedures 17
. . . . . . . . . . . . . . . . . . . . . . I . Soil Radioactivity Data 5 . . . . . . . . . . . . . . . . . . . II* Vegetation Radioactivity Data 5
. . . . . . . . . . . . . . . I11 . NDFL Process Flater Radioactivity Data 6 . Bel l Creek and Rocketdyne PFL Reservoir Radioactivity Data . . . . . 6
V . Cha.tsworth Reservoir Water Radioactivity Data . . . . . . . . . . . 7 . . . . . . . . . . . . . . . . . . . . V I . Airborne Radioactivity Data 7
. . . . . . . . . . . . . . . . . . . . . . V I I . Sample Station Locations ll i.
. . . . . . . . . . . . . . . . . . . . . . III . Mjnimm Detection Limits 17
. . . . . . . . . . . . . . . . . 1 - Atodes InternationalBeadquallters 2
2 - Atomics International P$uclear Development Field . . . . . . . . . . . . . . . . . . . . . . . . . . . . . . Laboratory 3
3 . e m and Nuclear Development Field . . . . . . . . . . . . . . . . . . . . . . . . Laboratory Emirons 4 4 , alley. &oma. a d
oas r e . . . . . . . . . . . e . . . . . . 10
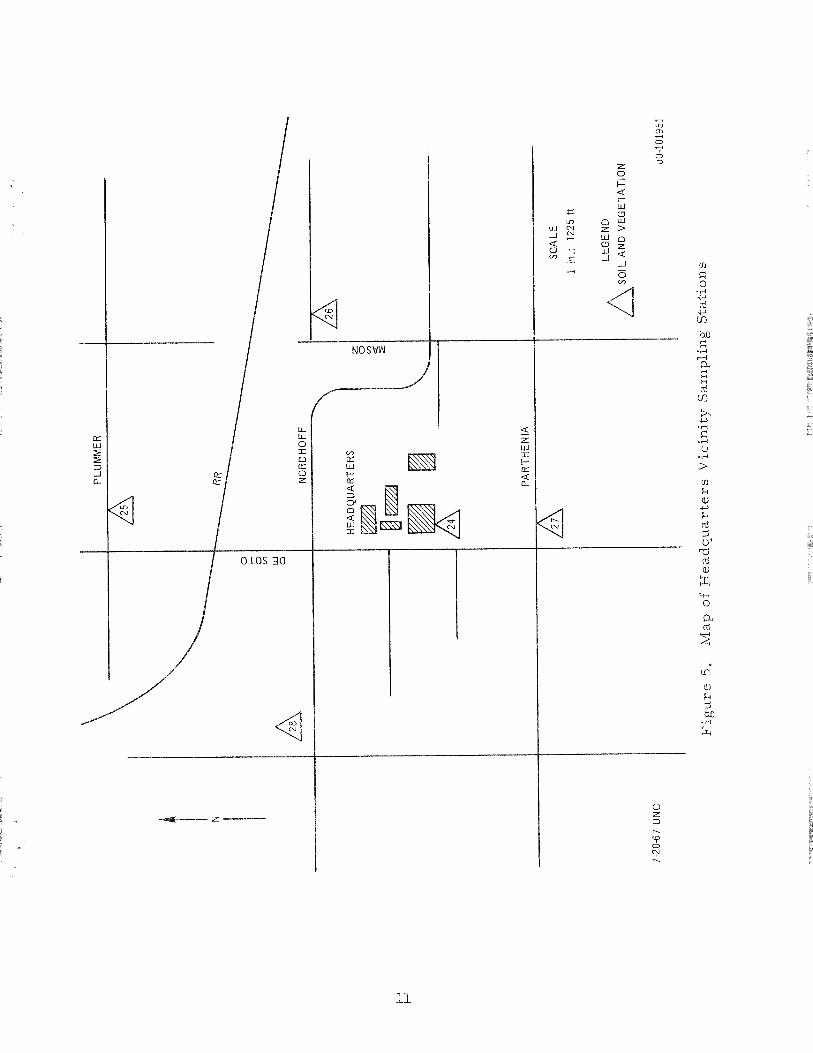
. . . . . . . . . . . 5 n i t y Sampling Stations 11
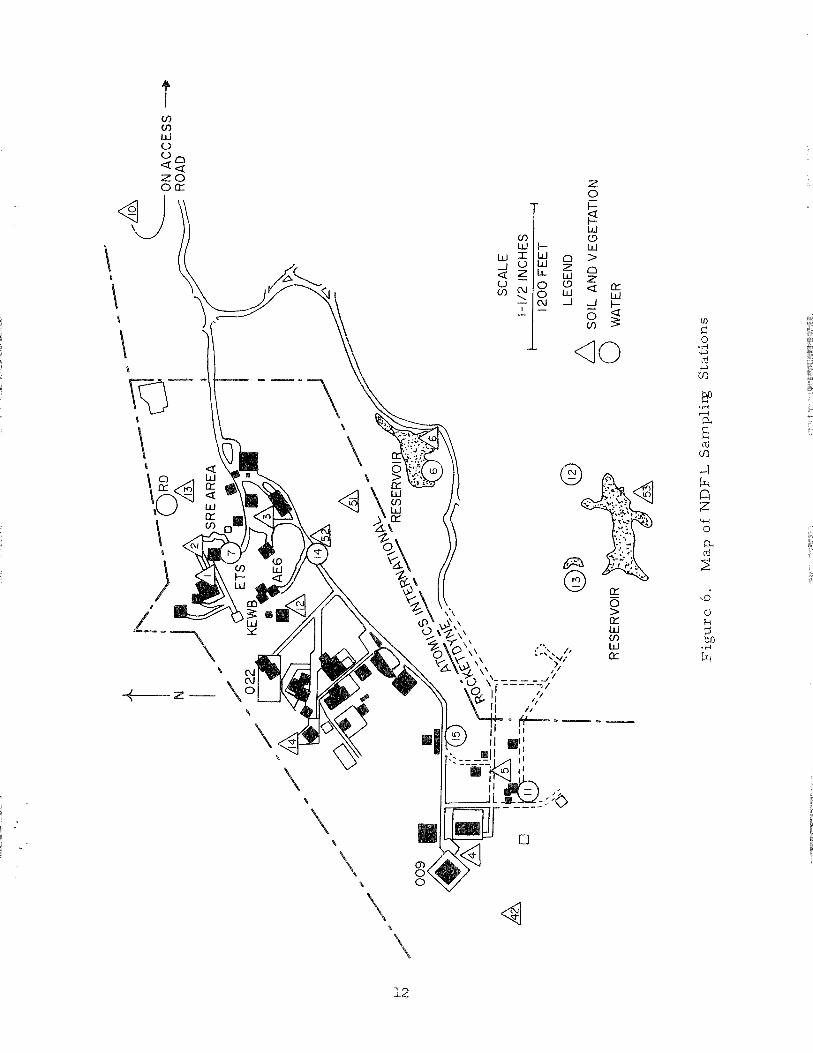
. . . . . . . . . . . . . . . . . . . 6. ions E
. . . . . . . . . . . 7 0 ir S q 1 b . g Stations 13 8. Long-Lived Airborne Radioactivity. f? [ead~ar i ;e rs and . . . . . . 18
9 S q l e Self-Absorption Correction aph . . . . . . . . . . o . e e 20

ABSTRACT
Enviromental monitoring a t Atomics In te rna t iona l
i s performed by the Operational Safety Unit of
the Health, Safety, and Radiation Services Department.
Soi l , vegetation, water, and a i r a re rou t ine ly
sampled up t o a dis tance of 10 miles from Atomics
In te rna t iona l property, The environmental radio-
a c t i v i t y reported here in i s a t t r i bu t ed t o na tu r a l
causes and t o nuclear weapons t e s t i ng , r a t he r
than t o Atomics In te rna t iona l operations.

I. SUMMARY
Atomic s International, A Division of North American Rockwell Corporation,
has been engaged i n atomic energy research and development since 1946, The
Company designs, develops, and constructs nuclear reactors fo r central s ta t ion
and compact power plants and f o r medical, industrial , and sc i en t i f i c applications,
The Company occupies modern f a c i l i t i e s in Canoga Park, California,
approximately 23 miles northwest of downtown Los fhgeles ( ~ i g m e 1). The
290-acre Nuclear Development Field Laboratory ( ~ i g z - e 21, equipped with
extensive f a c i l i t i e s for the support of advanced nuclear studies, i s located
i n the Sirxi H i l l s of Ventura County approximately 29 miles northwest of
downtown Los Angeles . The location of the above s i t e s i n re la t ion t o nearby
communities i s shown i n Figure 3 .,
The basic concept of radiological hazards control a t Atomics Inter-
national requires adequate containment of radioactive materials, md, t k r o ~ ~ $
r ig id operational controls, minimizes effluent releases and external radiation
levels. The environmental monitoring program provides a measure of the
effectiveness of the Company% radiological safety procedures and of engineering
safeguards incorporated in to f a c i l i t y designs,
Environmental smp1iz-g s tat ions located within the boundaries of A-toreics
International % s i t e s are referred t o as "on-sitethsi;a"cons. The remining
stations, located within a 10-mile radius of the s i t e s , are referred t o as
"off-site " stat ions, The on-site environs of Atomics International 2 Head-
quarters and Nuclear Development Field Laboratory (EDFL) f a c i l i t i e s are
sampled monthly t o determine the concentration of radioact ivi ty i n typical
surface so i l , vegetation, and water samples, The off-s i te environs are also
sampled monbhly; however, since January, 1966, analysis of of f -s i te s o i l and
vegetation samples has been performed only quarterly-, Also, continuous on-site
environmental akr sampling provides information concerning long-lived airborne
part iculate radioactivity. This report swnmarizes environmental monitoring
r e su l t s fo r the f i r s t s ix months of l969*


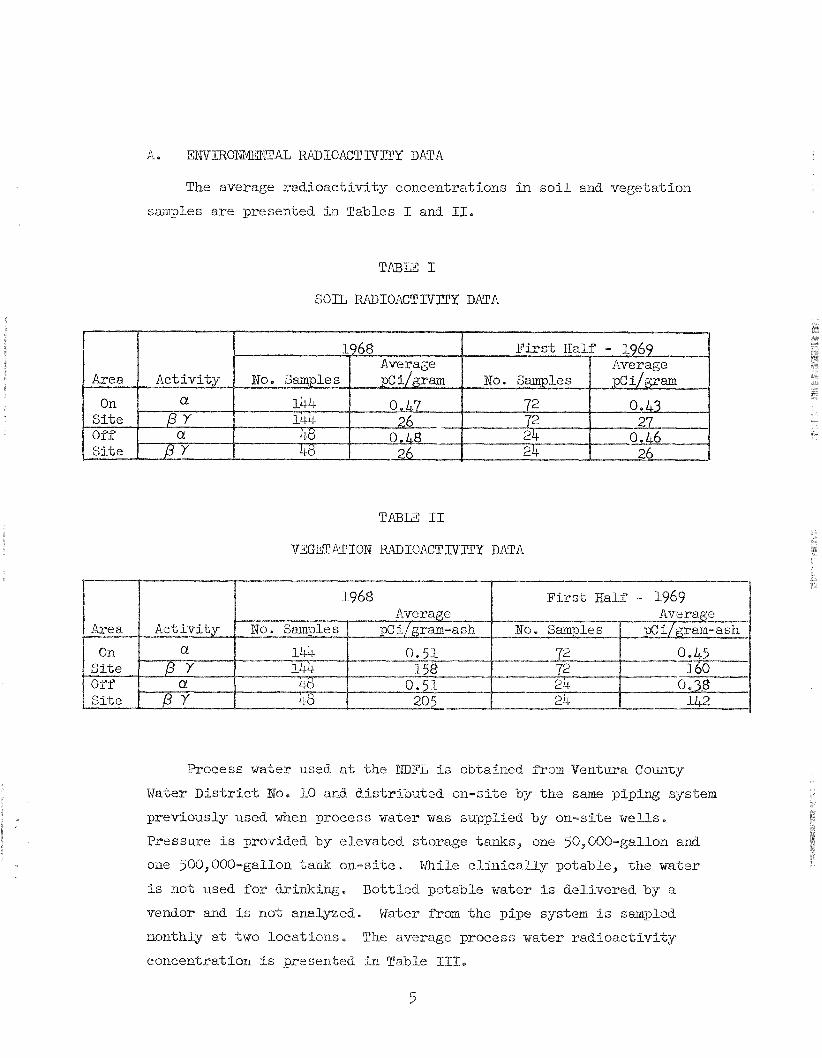
The average radioact ivi ty concentrations i n s o i l and vegetation
smples are presented in Tables I and 11.
S O I L RADIOACTIVZTY DNIA
VEGETATIOU ECADIOliCT IVITY DATA
Process water used a t the PIDFL i s obtained . f rom
'EJater Di s t r i c t ibuted on-site by the same piping system.
previously use en process water was supplied by on-site wells,
Pressure i s provided by elevated storage tanks, one 50,000-gallon and
one 500,000-gallon tank on-site , WhiLe c l in ica l ly potable, the water
i s not used fo r i Bottled potable water i s delivere
vendor and is not a m Vater fram the pipe syste
a t two l o c a t i he average process water radioact ivi t
concentration i s pres

N13FL PROCESS W'LCER RADIOACTIVITY DATA
Surface discharged waters from LDFL fac i l ik i e s drain into holding
reservoirs on Rocketdyne PFL property. laen T u l l , the main reservoir
i s drained in to Bel l Creek, a t r ibutary of the Los lculgeles River in the
San Fernando Valley, Los Angeles County. Pursuant t o the requirements
of Los Angeles Regional Water Quality Control Board Resolution 66-49 of September 21, 1966, an environmental sampling s ta t ion has been
established in Bel l Creek Canyon approximately 3.4 miles downstream
from the south Nouctli American Rockwell Corporation boundary. Samples,
obtained and analyzed monthly, include stream bed mud, vegetation, and
water. Average radioact ivi ty concentrations i n Rocketdyne reservoir
and Bel l Greek saaples are presented i n Table FI.

Soil , vegetation, and water are sampled mon-thl;)r a t the ChatswolPth
Reservoir, which i s owned and operated by the Los Angeles City Departaent
of Water and Power. Soi l and vegetation radioact ivi ty data for the
reservoir are averaged in to the of f -s i te data presesited i n Tables I and.
11. Norrmall;)r, one water sample i s obtained from the lake surface and
another obtained from the reservoir water supply in l e t located on the
north side of the lake. The average radioact ivi ty concentration i n
reservoir surface and supply water is presented i n Table V.
CIWSWORTE RESERVOIR W.!UTCR RADIOACT IVTC'Y DAlrA
Enviromen-tal a i r sampling fo r long-lived parbiculate radioact ivi ty
i s performed continuously a t both the Headquarters and NDFL s i t e s , Air
i s drawn thsough a f i l t e r which i s analyzed, seer a 72.-hour decay period,
f o r long-lived radioactivity, The average concentration of long-lived
beta-gamma radioact ivi ty i s presented in Table VI.

e Tables a r e presented a s a r a
i s i s necessary en one o r more of
t a i n s an la detect able" unt of radioact iv i ty . In
these instances, e lowest value assumes
ontain no radioact ivi ty ; the highest
contain rad ioac t iv i ty
t specified i n Table
s t h a t f o r t he f i r s t six months of 1969 s o i l radio-
a c t i v i t y concentrations did not cha e s i gn i f i c an t l y over t h e 1968
e. Table I1 sho i l e on-site vegetation rad ioac t iv i ty
t change s ign i f ican t ly , o f f - s i t e vegetation rad ioac t iv i ty
decreased, Table I11 shows t h a t ND rocess water beta-gamma radio-
a c t i v i t y decreas shows increases i n Bell Creek
mud and vegetation rad ioac t iv i ty and no s i n i f i c an t change i n Bel l
Creek water radioact iv i ty . Reservoir s t a t i ons 6 and 12 water
r ad ioac t i v i t y decreased, Table shows a s l i g h t increase i n Chatsworth
Reservoir surface water alpha rad ioac t iv i ty and a decrease i n beta-
a.mma rad ioac t iv i ty . Reservoir supply water alpha rad ioac t iv i ty
rad ioac t iv i ty increased s l i h t l y . Table
orne rad ioac t iv i ty over the 1968 average
rad ioac t iv i ty concentrations discussed
Tables a r e not a t t r i bu t ed t o Atomics
e r it i s f e l t t o ave been produced

area, southwest oC SKE, ~iLLere many nuclear i n s t a l l a t i ons are current ly
i n operation, The Downey area survey was terminated when the Company
relocated t o Canoga Park. The prirnary purpose of the environmental
monitoring program i s t o survey e n v i r o i n t a l rad ioac t iv i ty adequate17
t o enswe t h a t Atornics Internat ional operations do not c o n t ~ i b u t e
s i ~ n i l ' i c a n t l y co znviroiurleiital r ad ioac t iv i ty ,
12 study of past data showed t h a t t h i s purpose could be
achieved with 3 l e s s exbensive environmental mnonitorin.g program than
t h a t which exis ted u n t i l July, 1964. ThcreSore, beginning with t h a t
month, t h e nwnber of sampling s t a t i ons was reduced considerably. In
addi t ion, s ince January, 1966, o l f - s i t e environmental survey samples
have been analyzed only quarterly; on-si te sanples continue t o "be
analyzed monthly, The locat ions of snmpling s t a t i ons ;Ire shown i n
Figures 14, 5, 6, and 7, and i n Table V I I .
33. SAMPLING AND SAMPLE PREPRRC\TION METHODS
SOIL
Surface s o i l types avai lable f o r sampling range from
decomposed gran i te t o c lay and loam, Samples a r e taken from the t op
1/2-inch layer of ground surface, The s o i l samples a re packaged and
sealed i n p l a s t i c containers and returned t o the laboratory f o r analysis .
Sample preparation consis ts of t rans fe r r ing the s o i l s t o 0
pyrex beakers and dxying ii? a rnufTle furnace a t approximately 500 C
f o r e ight hours. Arier cooling, be s o i l is sieved t o obtain uniform
p a r t i c l e s i z e , One-gram a l iquo ts of the sieved s o i l are weighed
t rans fe r red t o s t a in l e s s - s t ee l planchets, The s o i l i s wetted i-i1 the
planchet with a l e o 01, agi ta ted t o obtain uniro sample thickness,
re-dried, and counted.
Vegetation samples obtained i n t he f i e l d are of t he same
plant type wherever possible, generally sunflower o r wild tobacco
Leaves. These types maintain a more act ive g r
ry season than does nost na tura l vegetation indigenous t o t he l o c a l
e t a t ion leaves a re s t r ipped f r m p lan t s a sealed i n i c e
ons fo r t r ans f e r t o the Laboratory fo r analysis , Plant
root systems a re not no I l y analyzed.
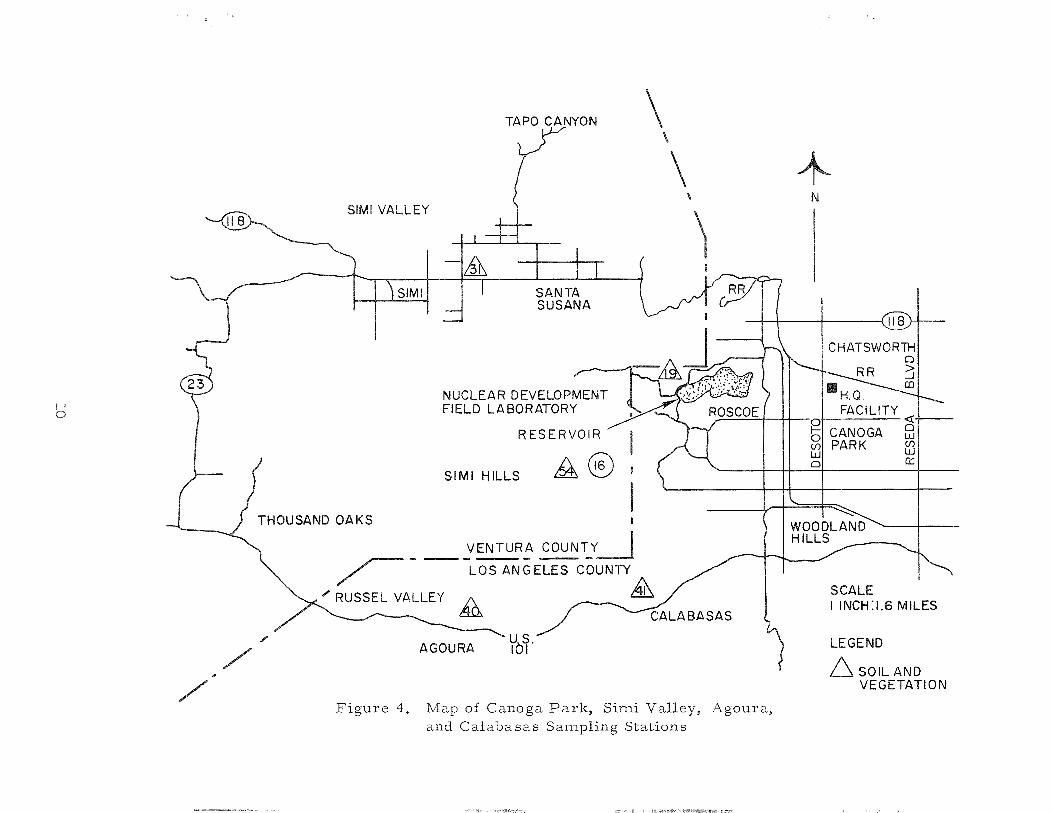
F i g u r e 4. Map of Canoga P a r k , S imi Valley, Agoura, and Calabasas Sampling Stations

CHATSWORTH LAKE M A N 0
SOIL AND VEGATATION
WATER
F i g u r e 7. Map of Chatsworth R e s e r v o i r Sampling Sta t ions

SAMPLE SI'ATIOH LWMIONS
LOC AT ION
SV-1
sv-2
sv-3 sv-4 sv- g SV-6 3V-10
:iv-12
sv-13
3'-14
SV-19
m-24 sv-2 5 SV-26
SV-27
m-28
SV-31
SV-40
sv-kl sv -1+2 s - 4 7
W-51
SV-52
sv-53 ST-54
IJ-6
w-7 16- 11
TI-12
SRE Reactor, NDFL
:;RE Perimeter Drainage Ditch, NDFL
Bldg. 064 Parking Lot, NDFL
Bldg. 020, NDFL
~ l d g . 363, NDFL
Rocketdyne Reservoir, PFL
Santa Susana Si te Access Road
ICGB Reactor, NDFL
30diLun Cleaning Pad, NDFL
Cany-on Below Bldg, 022, NDFL
Salita Susana Si"i;e Entrance, Woo:l.sey Canyon
A%omic s International Headquarters
DeUoto Ave. and Plumier S t .
Nor&hofS S t . and Mason Ave,
DeSoto fwe . and Parthenia St.
Canoga h e , and Nordkioff S t ,
Shi Valley, Los b e l e s Ave, a d Sycamore Road
Agoura
Calabasas
ITon-Radioactive Materials Disposal Area, NDFL
Chatsworth Reservoir,
~ l d g , 029, WDFL
Burro Fla t Drainage Control Pond, G. St. and 17th St ,, NDFL
Top of' Bel l Cany-on. Below Rocketdyne Delta Pond Spillway, PFL
Bel l Creek
Rocketdyne Reservoir, PFL
Boeess Water am Bldg. 003,
t c r F'rom Bldg, 363,
Rocketdyne Reservoir, PFL
STm I O N
w-1-5 w - 1-6 W-1:
iJ-D
W-RD
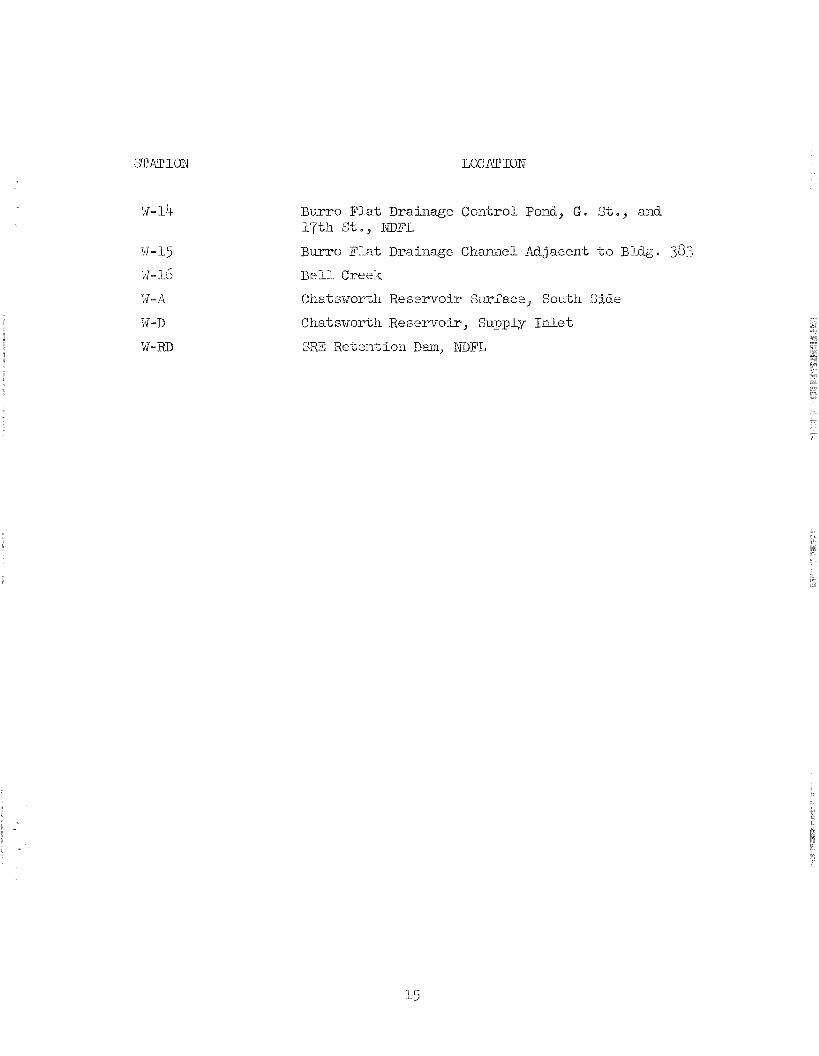
Burro F l a t Drainage Control Pond, G. S t . , and i 7 t h St . , EDPL
Burro F l a t Drainage Channel Adjacent t o Bl-dg. 383 B e l l Creek
Cha-tswortn Reservoh Surface, South Side
ChatsworLh Reservoir, Supply I n l e t
:Zi.E Rei;cni;ion D m , NDFL
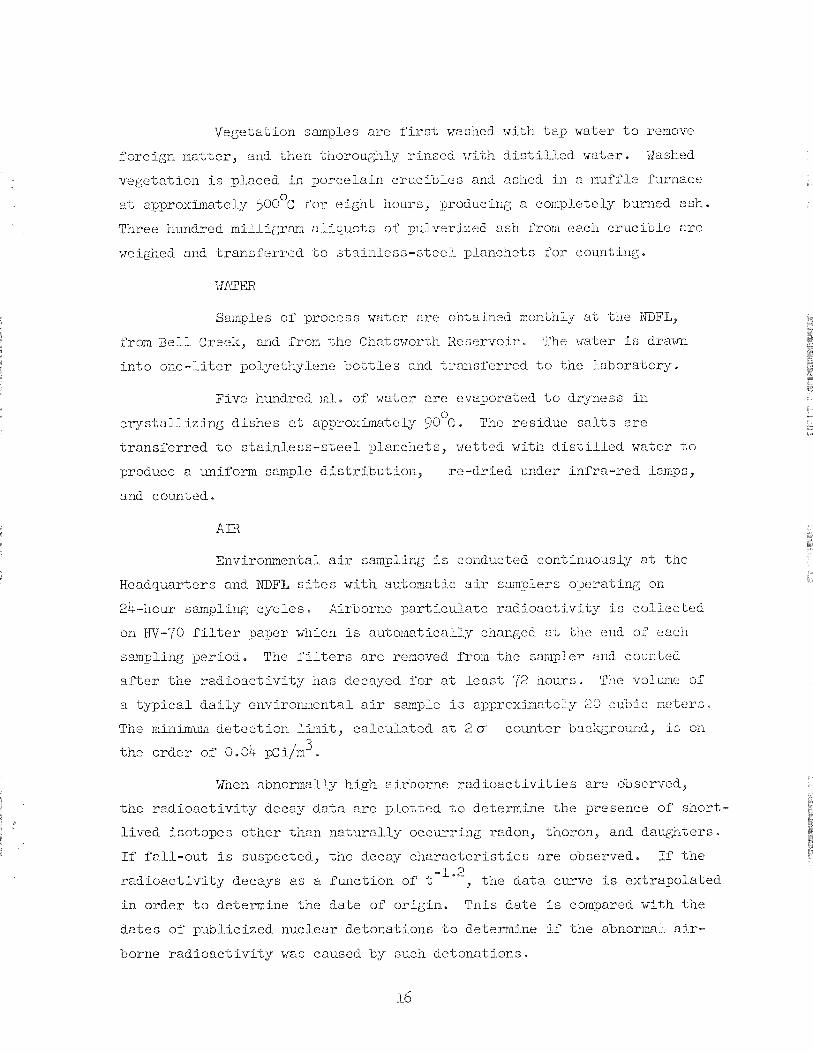
Vegetation samples a r e f i r s t washed with t a p water t o remove
i'oreign r~ia t ter , and then thoroughly r insed wiin d i s t i l l e d water. Washed
vegetat ion is placed i n porcelairl c rucibles and zshed i n a muffle furnace 0
a-c a~)proximateljr 500 C f o r e ight hours, producing a completely burned ash.
Tnree hundred m i l l i e r a n a l iquo ts of pulverized as11 fror,l eacii cruciule a r e
weighed and transi 'errcd L O s t a i i i l e ss - s tee l planchets f o r counting.
Samples of process water a re o ~ t a i n e d monirlu a t the IuQFL,
from Ee l1 Creek, and from the Chatsworih Reservoir. The water i s drawn
in to oae - l i t e r polyethyiene b o t t l e s and i ransf erred t o tne laboratory.
Five hundred i d . of water a r e evaporated t o dryness in 0
c ry s t a l l i z i ng dishes a t approximately 90 C . The residue s a l t s a r e
t r ans fe r red t o s t a i n l e s s - s t e e l planchets, wetted with d i s t i l l e d water t o
produce a uniform sample d i s t r i bu t i on , re-dried under infra-red lamps,
and counted.
A I R
Environmen-ml a i r sampling i s conducted continuously a t the
Iieadquarters and NDFL s i t e s witn automatic a i r samplers o p e r a ~ i r ~ on
24-hour smpli-ng cycles. Airborne particula-ce rad ioac t iv i ty i s coLlecied
on HY-70 f i l t e r paper which i s au~ornat ica l ly changed a; che end of ecci:
sampling period. The f i l t e r s a r e removed from the sampler and counted
a f t e r the r ad ioac t i v i t y has decayed f o r a t l e a s t 72 hours. Tile volume of
a t y p i c a l d a i l y environmental a i r s m p l e i s approxiriately 23 cu-bic meters.
Tne minimun de tec t ion l i m i t , ca lcula ted a t 2 cr counter bzickground, i c on 3 the order of 0. 0h. p2ijm .
Knen abnormally high airborne radioact i v i t i e s a r e observed,
the r ad ioac t i v i t y decay da ta a r e ploc-ced t o dc temine the presence of snort-
l ived isotopes other than na tu ra l ly occurring radon, thoron, and daughters.
If f a l l - ou t i s suspected, the decay cha rac i e r i s t i c s a re observed. If t he -1.2
rad ioac t iv i ty decays as a function of t , the da ta curve i s extrapolated
i n order t o deternine the date of or ig in . This da te i s compared with the
da tes of publicized nuclear detonations t o determine i f zhe abnormal a i r -
borne r ad ioac t i v i t y was caused by such detonations,

A graph of averaged long-i ivcd a i rborne radioaci ; ivi ty concen-
i r a t i o n s dei;ected a t zhe IEeadrluarters 2nd ILDFL i x i l i t i c s during bile f i r s t
h a l f of 1969 i s presented i n Figure 8. The graph shows t h e incidence of f i v e
major peaks of extended dura t ion during t h e r epor t ing period, with a gene ra l ly
increas ing t r end through t h e Spring months following a period of a i rborne
r a d i o a c t i v i t y suppression by heavy r a i n f a l l during January and February.
3nvironme1ltal s o i l , vecett? t ion , rir, zrid xmter samples a r c
counted f o r ~ . l ~ $ ~ t l 2i1d beta-gmma radioactivity in nu4Lonatic propor' i ional
coul?,ting sjrs terns. The sample-dc-iector coni ' iguraiion provides near ly n
2 T o r The d e i e c t o r has a t h i n windo~s 2nd i s c o n t i n u ~ l l y purged
with a 90,; argon, 1($ methane counting GLS. A pre - sc i c o ~ m t aode of
opera t ion i s used f o r a11 samples; iiowcvcr, ail overr id ing pre-se t ~ i r n e
i s a l s o used f o r alpna count in^ t o prevcni t h e urulzcessariiy long count in^
of s impics wimi exirernely lost a c t i v i t i e s . The 1ninim1m de tec t ion l i m i t s
mown i n Trible V I I I were cieterrnirled by using t y p i c a l values f o r pre-se t
comL, p re - se t t ime, system e f f i c i e n c i e s , btlckpo-md count m t e s
(qqrox i -na te ly 0.03 cpm m oEd l2 cpnl Y ), and sample s i z e ,

10.0
1 .o
- m
E 0 Q - z 0 I- a Cc t- Z W 0 Z 0 0
0.1
M.D.L.
0.01
RAINFALL RECORDED ON DAYS INDICATED BY DOT
@ 0 Q)O
JANUARY FEBRUARY SEPTEMBER NOVEMBER
FIGURE 8 LONG LI'JFU A I H B O R N E RADIOACTIVITY I-IEADOUARTERS A N D NDFL 1969 B

I n p rac t i ce , K l i s sieved and divided i n to al iquotc, increasing
each i n 1 0 0 - ~ n i l l i g r m iiicre~ncnts from I00 co 1200 milligrrmis . Tmse
a l iquo ts a r e placed i n s t a i n l e s s - s t e e l planchcts of tne zjrpe used f o r
s o i l and vegetat ion s~mple s and counted with the proportiol-inl count in&
system. The r a t i o of sample a c t i v i t y t o observed neT counting r a t e i'or
each a l iquo t i s plokbcd as e function of' a l iquot rrei~ilJi ( see Figure 9 ) .
The correct ion f ac to r ( r a t i o ) corresponding t o each s o i l o r vegetat ion
sample '~reight i s obtained from t h i s graph. The product of the cor-
r ec t ion f a c i o r and tile net sample counting r a t e y ie lds the sample
a c t i v i t y (dprn). This method has been proved usable by apl2lying it t o
variodsly s izcd : l iquots of uniformly mixed environmental samples and
observing t h a t tile r esu l t an t spec i f i c a c t i v i t i e s f a l l witnin the expected
s t a t i s t i c a l c o a i l i n ~ ; e r ro r .
C o u n i i n ~ system e l f i c ienc ies z re determilieit rout inely usill& h.0
Ra D + E + F ( v i ~ l l and without :311)~?3 ai)sorbers) and K . Pot3ssiurn-l:0,
ic the form of siand-rd r e a p n t p a d e KC1, i s used to si-imlate s o i l and
vegetation samples f o r purposes of' ca l ib ra t ion . It has a compomd
specif ic a c t i v i t y oi' approximateljr 330 dpm per gram K C 1 and a bc ta
energy of 1.33 14ev. I i s zdvantages a r e p r i t y , long h a l f - l i f c , c ry s t a l l i ne
form, sac?. low cos i . A s e e n i n ~ disadvantage i s i t s be ta energy ifhicn i s
sonewhat nigher tlian t ha t expected i n environniental sm>ic s ; hoircver,
thc e r r o r introduced by t h i s hi&cr energy has been detcnlin-d t o be
ins ign i f i can t .


